
Submitted:
29 November 2023
Posted:
30 November 2023
You are already at the latest version
Abstract
Green-space resources, in the context of urbanisation, cannot meet the actual needs of residents well, and the study of the balance of green-space resource allocation from the relationship between supply and demand is an urgent problem to be solved. This study quantitatively evaluates the green-space supply level from four dimensions by constructing a framework for assessment in the community life circle. It also evaluates the matching of green space supply and demand, resource distribution fairness, and distribution equilibrium under group differentiation through the supply–demand coupling matrix, Gini coefficient, and the Kruskal–Wallis H non-parametric rank-sum test, respectively. This study shows that (1) a significant spatial imbalance exists in green-space resource allocation in community life circles in different dimensions. (2) The comprehensive green-space supply level in the community life circle matched the total demand of residents to a low degree. (3) There was significant inequality in green-space resource allocation within the community life circle (the Gini coefficient of each evaluation perspective was > 0.4). Based on the study results, we were able to identify community life circles with spatial mismatches, different supply and demand, and other green-space resource allocation problems, which is of great significance to urban green-space research and planning practice under the "green justice" framework.
Keywords:
green space
; community life circle
; provision level
; resident demand
; assessment framework
; population model
1. Introduction
Urban green spaces are important leisure and open spaces for urban residents[1]; they provide a wide range of ecological services and play an important role in the sustainable development of cities and the improvement of human well-being[2,3]. Simultaneously, urban green spaces are an important public good, and their public nature displays urban humanistic care characteristics. It is widely recognised that exposure to green spaces improves the quality of life and public health of urban residents[4]. Resident visits to the blue and green spaces in the city shifted from optional to necessary activity during the pre-COVID-19 pandemic period[5,6]. During the pandemic, urban green spaces provided social interaction spaces for residents[7]. The value of green spaces is highlighted because an increasing number of people are concerned about the built environment within walking distance of their homes[8].
However, in the context of rapid global urban expansion and population growth, urban green spaces are underprovided or poorly distributed, leading to spatial inequalities between green-space spatial layout provision levels and the location of residents[8]. As a public service resource, the current supply conditions for urban green spaces are not aligned with actual daily needs of urban residents. If public services are not planned according to population needs, discriminatory allocation may occur[9]. Equity in public service resource allocation should align with resident needs and preferences[10]. The core fairness issue in urban green-space resource allocation is spatial green-space distribution. Therefore, focusing on the balance between supply and demand at the urban green-space level and scientifically evaluating and improving public service capacity in urban green spaces is of great social value in enhancing the well-being of residents[11].
Some studies have found that social group inequality between different classes and races is more obvious in smaller-scale green spaces[12]; therefore, our research needs to focus on smaller spatial scales. In recent years, with the introduction of the life circle concept[13,14], related studies have begun to discuss urban life quality on the life circle scale[15,16,17,18]. Compared with traditional settlement planning, which is characterised by population size and geographical scope, life circle planning focuses more on needs and subjective evaluations of residents instead of static spatial perspectives and data statistics[19]. Currently, relevant practical application research mainly focuses on the service relationship and function of urban integrated public service facilities in the life circle; however, research on green spaces in the life circle is still relatively limited.
Community-related research has always been a popular topic in urban research[20,21,22], and considering people-centred urbanisation in China, an increasing number of studies have begun to focus on community life circles[23]. The community life circle is the basic unit of the life circle system, and its scope represents a community in which residents are willing to spend time sitting, walking, playing, or interacting with their neighbours[24]. Early studies focused on public service facility spatial accessibility such as healthcare, education, and parks[25], and research on community green spaces is inadequate. Therefore, the study of green spaces accessible to residents at the community scale can more accurately assess the supply of green spaces and its match with residents' needs and help explore the efficient use of green spaces in built environments.
In light of the above background, this study begins from the concept of "people-oriented", takes the community life circle as the basic research unit, constructs a framework for assessing green-space provision levels under the perspectives of supply–demand matching and spatial justice, conducts an empirical study in the Gulou District, Nanjing City, argues for the practicability of this framework, and answers the following questions: (1) Is the green-space provision level in the community life circle balanced in terms of spatial allocation? (2) Does green-space resource allocation match the actual demands of residents? and (3) Is green-space resource allocation equitable in terms of population distribution?
2. Conceptual Framework
2.1. Framework for Assessing Green-Space Service Provision Levels in Community Life Circles
Previous research identify and divide the spatial social life circle scope based on administrative boundaries[26,27,28], fixed spatial and temporal distances[29,30,31], and GPS survey data[32,33]. To comprehensively consider the actual environment and residents' needs, this study adopted a division method based on the idea of accessibility to delineate community life circle scope. We defined the community life circle as the spatial area covered by a 15 min walking distance radius from a residential neighbourhood.
The term ‘performance’ first appeared in the management field, reflecting the achievements and results of people engaged in a certain activity. Urban green spaces have complex and comprehensive service effectiveness, and their service performance characterises green-space service capacity and effectiveness at a certain stage. In research perspective terms, scholars have mostly studied urban green-space service performance from the supply–demand balance and spatial justice perspectives. Lee et al. measured actual green-space accessibility through the spatial difference indicator between the green-space service scope supply and resident demands[34], and Liu et al. developed a multidimensional spatial assessment framework consisting of scale and indicator dimensional frameworks[35]. In research unit terms, some scholars have quantitatively analysed the balance between green-space service supply and demand using the residential community as a unit[36,37]. The evaluation method can be summarised in two dimensions: green-space functional operational and spatial structural performances. Functional operational performance is primarily achieved through scene and sampling information evaluation, and big data technology[38,39,40,41]. In spatial structural performance terms, the research is mainly based on accessibility indicators; for example, the Gaussian two-step search and move method is used to evaluate spatial configuration rationality of park green spaces from the accessibility perspective[42].
Scholars have conducted multidisciplinary research on green-space service performance but have not formed a more unified evaluation framework. Based on the evaluation framework and indicator selection in existing studies[43], this study considered the demand side and improved on the green-space evaluation system used in previous studies. This study attempted to construct a systematic assessment framework for the green-space supply level from the supply–demand matching perspective (Figure 1). We assessed urban green-space supply levels from four aspects: availability, accessibility, attractiveness, and visibility. On the demand side, we objectively simulated the demand for urban green-space services from the resident population distribution and socioeconomic status perspectives.
2.1.1. Supply-Side Indicator Selection
Previous studies have been conducted mainly from the perspective of quantity and distance on a two-dimensional plane, which can evaluate overall green-space construction levels within the region; however, the evaluation dimension is relatively single and lacks a certain degree of breadth. Therefore, we selected four types of indicators to evaluate the service level provided by green spaces for residents from various dimensions. In terms of the types of spaces providing services, accessibility and visibility are "all green space" evaluations within a certain range, while accessibility and attractiveness are "mainly green space" evaluations (including parks, green spaces, pocket parks, squares, and other places where people can gather and enjoy green spaces) that can be accessed within the scope of daily life..
In indicator measurement terms, we used NDVI for quantification of vegetation cover to describe green-space availability. Green-space accessibility is described by the cost of the path to the nearest green space for all residential neighbourhoods within the same community life circle; the accessibility and availability indicators do not represent urban green-space attractiveness to residents, however, the quality of green spaces also affects the interaction between residents and green spaces. We used quality to evaluate green-space attractiveness, it is generally believed that high-quality green spaces can meet residents' daily diversified behavioural needs, and that their quality is positively correlated with the attractiveness of parks to residents. With reference to factor selection for evaluating green-space quality in previous studies[44,45,46,47] and relevant normative documents, we adopted a "point system" to classify the evaluation indicators into three categories: scale, internal, and neighbourhood environmental elements for measurement (Supplementary Table S1). Visibility can be used to evaluate opportunities for residents to visually engage with green spaces from a human perspective. Streetscapes can capture the visual built environment perception at the human eye level and are now widely used in green visibility studies on urban streets[48,49,50]. In this study, we measured the ratio of green vegetation in images observed by the human eye by capturing streetscape images with the help of machine learning[51] to describe green-space visibility. The specific operational method is shown in Supplementary Figure S1.
Simultaneously, to assess urban green-space provision levels at a finer scale, and to accurately identify under-provisioned areas, we integrated indicator performance under each dimension to evaluate comprehensive green-space provision levels.
2.1.2. Population Demand Simulation
Population distribution represents the potential demand of residents for urban green spaces. The spatial match between population distribution and urban green layouts directly affects green-space service benefits. Many previous studies refer to the normative standards in the comprehensive residential area technical indicators, so that the number of users multiplied by the average number of people in a household leads to population data estimation on a fine scale. Some scholars have also expressed the resident population in the study area by dividing total residential building area by per capita area[52]. In this study, we modelled the level of demand using population distribution characteristics for a comparative supply and demand analysis.
As residential housing prices increase, superior green-space services are increasingly recognised as an environmental advantage of upmarket neighbourhoods over disadvantaged ones[53]. There is a strong correlation between the housing characteristics and socioeconomic levels of residents, and some scholars have used house prices to characterise socioeconomic status[52]. To investigate whether green spaces in community life circles were unevenly distributed among people of different socioeconomic statuses, we characterised population socioeconomic attributes using housing characteristics.
3.1.1. Analytical Supply and Demand Interaction Evaluation
Based on the constructed simulation model of the degree of residents' demand for green spaces, this study quantitatively evaluated the interaction between supply and demand from three perspectives: matching the degree of supply and demand, distribution fairness, and distribution equilibrium under group differentiation.
- Evaluating the match between supply and demand for green spaces in the life circle
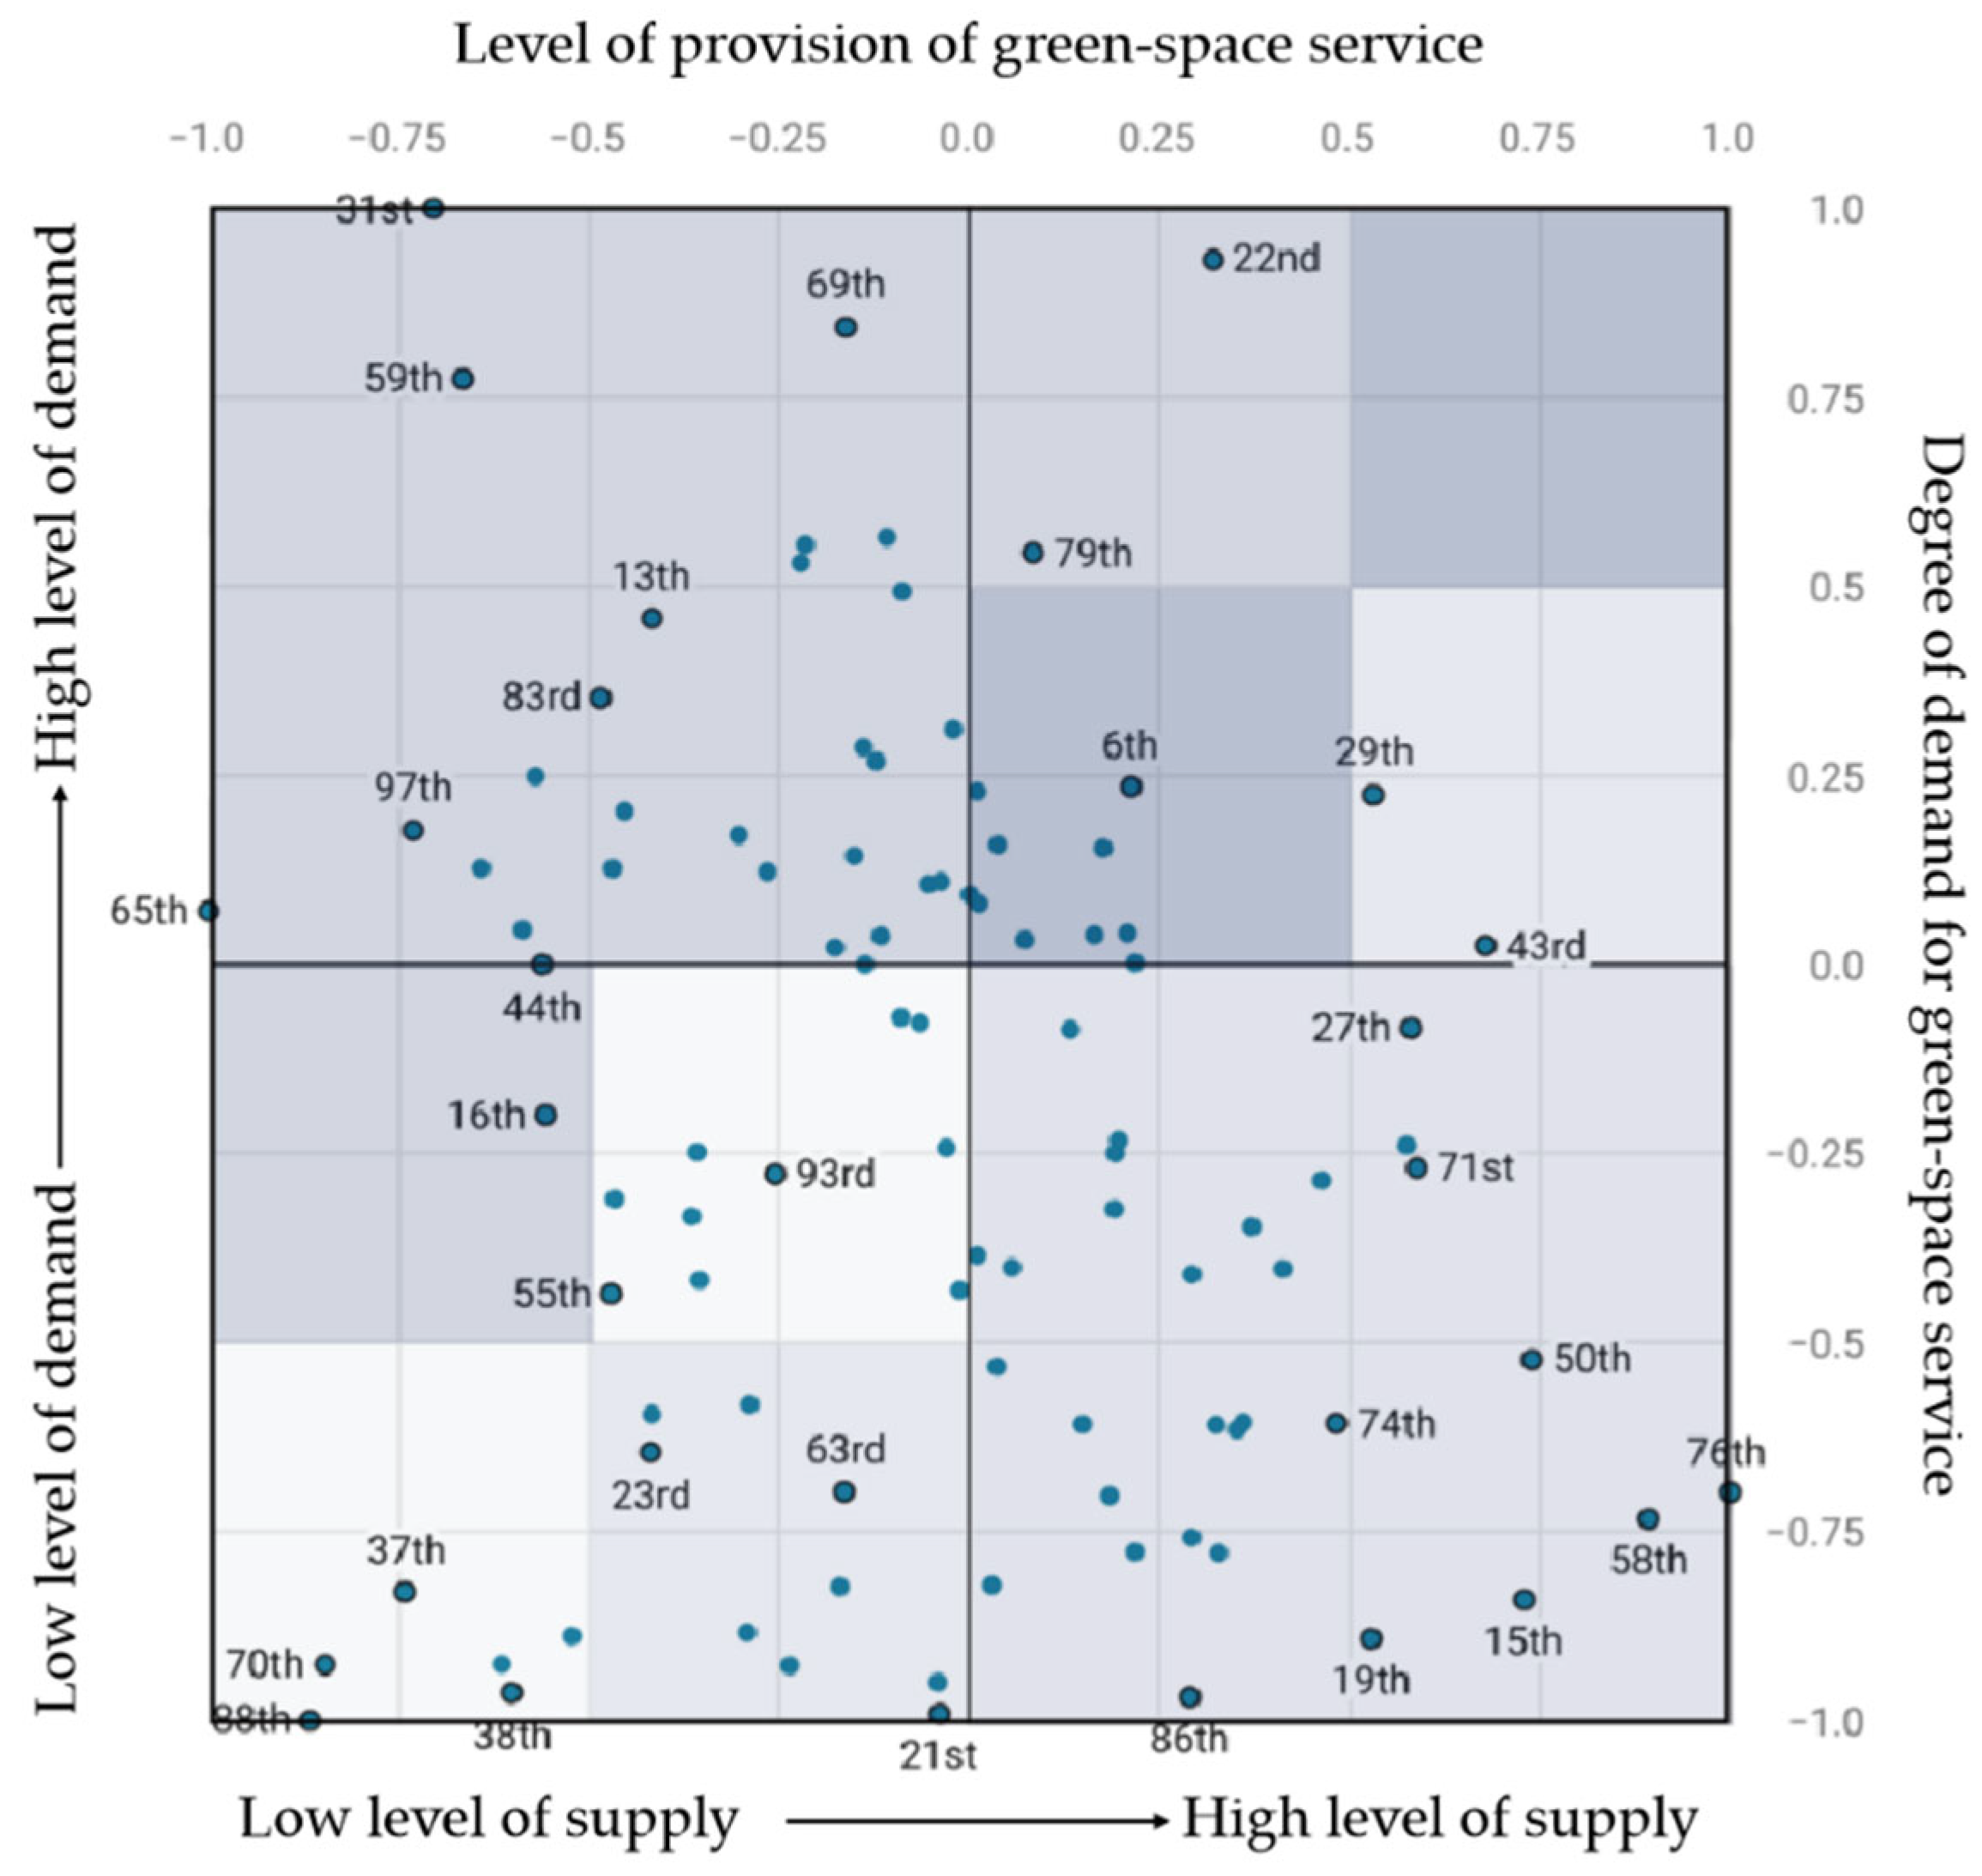
Owing to the large differences in the development of each area within the built-up city area, the distribution of social group needs has a certain degree of concentration and segregation, which leads to the possibility of spatial mismatches between the allocation of green-space resources and population needs. Based on standardised supply and demand indicator data, we constructed a coupling evaluation matrix of green-space resource supply and demand in the life circle (Figure 2). Four evaluation zones were formed based on the coupling situation: low-level coordination, service lagging, service advancement, and high-level coordination. This was used to identify the mismatched green-space supply and demand areas in the study area to avoid social inequality caused by the contradiction between resource supply and demand, which hinders sustainable city development.
- 2.
- Equity evaluation in green-space allocation
To investigate whether the match between green-space resource supply and the actual demand of residents based on population distribution within the study area is reasonable, and whether there is inequality in resource allocation, this study analysed the proportion of green-space resource distribution over the resident population by choosing the Gini coefficient as an indicator to study environmental green-space fairness (Figure 3).
- 3.
- Distributional equilibrium evaluation under group differentiation
Some scholars have pointed out that resident socioeconomic status is closely related to their access level to green-space services and that urban green-space resource distribution is not always fair and just[54]. To investigate whether there are differences in green-space provision levels for residents with different socioeconomic attributes in life circles, this study used the Kruskal–Wallis H non-parametric rank-sum test to compare the differences in green-space provision levels between different life circle group levels.
3. Methodology
3.1. Study Area
For this study, the Gulou District in Nanjing City was selected as the study area, comprising 13 streets and 120 neighbourhoods, with a total area of approximately 54.18 km2. According to the Seventh Population Census Bulletin published by the Nanjing Municipal Bureau of Statistics, as of 00:00 on 1 November 2020, the resident population of Gulou District was 940,387, accounting for 10.10% of the city's resident population. Gulou District is a high-density urban built-up area with complete infrastructure and a high population concentration, which is suitable for studying the interaction between residents' daily behavioural needs and urban green-space supply. The scope of this study included 13 streets within the Gulou District administrative area (Figure 4). The life circle delineated based on the walking distance of residents is not bounded by administrative districts; that is, residents near the Gulou District administrative boundary inevitably interact with green spaces in neighbouring urban areas in their daily activities, resulting in a boundary effect. Therefore, a buffer zone of 1000 m was delineated in this study, with the administrative boundary used as the boundary to conduct subsequent studies.
3.2. Data Source
This study includes three data sets. The green-space data were mainly obtained from the BigeMap map download platform, Nanjing green-space system planning document, and Baidu map API. The basic urban dataset used to delineate the community life circle was obtained from BigeMap, the data platform, Nanjing planning document, and Gaode map open platform. The data on the city's resident population and its socioeconomic attributes used to simulate green-space demand was obtained from the Nanjing Bureau of Statistics, Baidu Map API, and BeigeMap websites. The specific data are shown in Supplementary Table S2.
3.3. Data Processing
3.3.1. Community Life Circle Delineation
In this study, the 15 min walking range of residents was taken as the community life circle range by summarising the daily walking travel reach range. After integration and processing, 98 community life circles were obtained from the Gulou District, Nanjing (Figure 5). The community life circle division steps are as follows:
First, we obtained POI data, including name type, latitude and longitude coordinates, and specific addresses of 932 residential communities in Gulou District, Nanjing, based on the Baidu Map API interface. We imported them into the ArcGIS platform according to their geographic coordinates, and then integrated the adjacent residential communities according to a certain distance threshold. Then, the 213 residential sites obtained from the consolidation were used as the origin for delineating the community life circle, and the 15 min travelling time was used as the radius to delineate the 15 min resident group travelling range within the life circle using the prefabricated program. Finally, the boundaries were delineated according to the geographic coordinates of the 213 settlements, and a life circle range file of the surface element type was generated and imported into ArcGIS. Concurrently, we merged two or more community life circles that shared a large amount and overlapped by more than half and eliminated those that were too small in size.
3.3.2. Constructing a Refined Population Model
We calculated the refined population distribution to quantify the degree of green-space demand in each community life circle. The entire process was divided into three main steps: data preprocessing, extraction, and normalisation (Figure 6). First, the TIF raster information was extracted from the Baidu population heat map of Nanjing, street information corresponding to the raster points was obtained, and the information was stored in a point element file. Next, we established a conversion table between the TIF raster image channels and the fine population density (Supplementary Table S3), and the population density distribution point element shapefile within the life circle coverage was generated based on the geographic coordinates of the image raster points, streets to which the raster points belong, and the estimated value of the fine population density of the raster points. Finally, the total density and statistical population of the street were compared and normalised, and the population density data within the street were transformed into the actual population number of each raster point to obtain the estimated value of the refined population distribution.
3.3.3. Comprehensive Green-Space Service Provision Level Evaluation
A comprehensive green-space provision level evaluation requires the integration of the four evaluation indicators into the four dimensions to identify differences in spatial distribution. To improve the data comparability of each indicator, the z-score standardisation method, which can measure the degree of difference from the mean and standard deviation, was chosen to standardise the indicators, eliminating the scale influence of each indicator, thus weakening its interpretability. After the standardisation process, the mean value of each indicator was 0, and the standard deviation was 1. The average value of the four indicators was obtained as a comprehensive evaluation result according to the 1:1:1:1 weights, and the summary was mapped to the [-1,1] interval. The calculation formula is as follows:
In Equation (1), the item (1) indicator value was obtained after z-score standardisation, and indicator mean value and standard deviation, respectively. This calculation method is applicable to accessibility, attractiveness, and visibility indicator standardisation, which are positively correlated with green-space supply level, that is, the larger the evaluation result value, the higher is the supply level. As for the negatively correlated accessibility indicators in the distance dimension, the greater the distance from the path of the green space, the greater is the evaluation value, and the lower is the supply level; the sign of the z-score standardisation results needs to be reversed.
In Equation (2), the normalised value was mapped to the [-1,1] interval, and, representing the maximum and minimum values of each indicator, respectively, after normalisation and averaging according to the 1:1:1:1 weights. Finally, the integrated green-space supply capacity was described by the score with values between [-1,1]. In Equation (2), the normalised value was mapped to the [-1,1] interval, and, representing the maximum and minimum values of each indicator, respectively, after normalisation and averaging according to the 1:1:1:1 weights. Finally, the integrated green-space supply capacity was described by the score with values between [-1,1].
4. Results
4.1. Spatial Variability in Green-Space Provision Levels
The visualisation analysis results show that there is some variability in the spatial distribution of the green-space provision evaluation indicators (Figure 7). Overall, the accessibility and visibility indicators show rough consistency in spatial distribution, with high values clustered centripetally in the southeastern city centre. Low values mainly appeared in the northern and western fringes of the region, while the accessibility indicator showed a large number of high values in the northern region. The attractiveness indicator was mainly affected by green-space quality, and high values were mainly distributed axially along the Qinhuai River. Some life circles located in urban centres have high values for accessibility and visibility of green-space resource, but poor performance for attractiveness. However, some life circles in the northern fringe have high accessibility services, but all other indicators show low values.
The indicators were standardised and the comprehensive evaluation numerical results were classified into five levels using the natural discontinuity grading method (Table 1 and Table 2). In terms of the comprehensive evaluation value of the green-space provision levels, the score interval was [-1,1], the mean value was −0.011726195, the standard deviation was 0.400305457, and 36.73% of the life circles did not reach the mean value. In spatial distribution terms, the green-space provision levels in Gulou District are not uniform, which will also directly lead to inequitable access distribution to green-space resources for residents living in different areas.
4.2. Green-Space Provision Adaptability to Residents' Needs
According to the supply–demand coupling model, the 98 community life circles in Gulou District were classified into four categories according to the matching degree of supply and demand (Figure 7). The evaluation results show that there is an imbalance between the comprehensive green-space supply levels in Gulou District and the total demand by residents, and the degree of matching was low. There were 50 high-level coordinated and service-advanced community life circles, accounting for 51.02%. Furthermore, there were nine high-level coordinated community life circles, accounting for only 9.18% 14 low-level coordinated community life circles accounting for 14.29% and 31 service-lagging community life circles accounting for 31.63%.
Figure 8.
Visualization of four green-space provision level indicators in the life cycle.
4.3. Equity in Green-Space Resource Population Distribution
According to the Lorenz curve as well as the Gini coefficient results (Figure 9), it can be observed that there is obvious inequality in green-space resource allocation in the Gulou District, Nanjing life circle. From the Gini coefficient evaluation value, the Gini coefficient of each evaluation angle was between 0.4 and 0.6, and all of them were evaluated as having a large difference in resource distribution according to the economics field division. Among them, the Gini coefficient of the comprehensive green-space resource supply level was 0.50, which means that 60% of the resident population in Gulou District enjoys only 25% of the green-space resources.
Inequality in green-space attractiveness resource distribution was the most serious problem, with a 0.55 Gini coefficient, which means that > 50% of the resident population enjoys < 20% of the green-space attractiveness services when assessed from the attractiveness perspective. The green-space availability and accessibility Gini coefficients were 0.44 and 0.46, respectively, which are relatively low compared to those of other indicators; however, there is still an inequitable resource distribution, indicating that < 60% of the resident population enjoys < 30% of the green-space resources when analysed from the availability and accessibility perspectives. Analysis results show that most green-space resources were occupied by small populations, resource allocation was highly differentiated with serious polarisation, and green-space resource utilisation rate and fairness in the community life circle need to be improved.
4.4. Equilibrium in Green-Space Resource Distribution under Group Differentiation
We divided the 98 community life circles within the study area into five socioeconomic classes (Table 3) and compared green-space resource distribution among the life circle groups at different levels (Supplementary Table S4). From the analyses results, green-space provision indicator p-values within the community life circles at different levels, except for the accessibility indicator, were all < 0.05, indicating a significant difference. This means that, overall, as residents socioeconomic levels increased, the comprehensive green-space supply level owned in the community life circle also improved. However, lower values for attractiveness and visibility indicators were observed in the high-grade tiers. Moreover, anomalously higher accessibility values appeared in life circles with low-grade socioeconomic attributes.
5. Discussion
5.1. Sharing Based on a Guaranteed Amount of Green-Space Resources
The results of this study show that there is an imbalance in spatial green-space availability distribution in the life circles of Gulou District, Nanjing. As the central area of the old city was developed and built earlier, the neighbourhoods are old and have high building density, so there is relatively less green infrastructure in and around the residential area. In addition, green-space accessibility along rivers or railway lines is rated low, mainly because of the existence of a large amount of wasteland and bare land in the surrounding area, which has not yet been fully developed and constructed. To achieve fair green-space resource distribution in a life circle, it is necessary to minimise variability in provision levels between different community life circles and maximise green-space resources enjoyed per capita.
On the basis of ensuring the quantity, rational green-space spatial allocation patterns will also further affect accessible green space supply levels. Ngom et al. found that linear green space can play a role in balancing green-space resource variability distribution, which can help to improve equity[55]. We found that green spaces in established communities are often fragmented and lack mutual articulation. Therefore, we should pay attention to the overall effect of green spaces in our research to improve resource allocation openness and sharing. In terms of optimisation, we can adopt the slow-moving system represented by "greenways" and "blueways" to promote the formation of a "multi-centre, multi-level, networked" shared and participatory community green-space network system for life circles (Figure 10).
5.2. Enhancing Accessibility to Community Green Spaces
The results of this study show that accessibility green-space provision levels in established neighbourhoods is unsatisfactory, especially in older neighbourhoods where vacant green spaces are often used inefficiently. This may be due to the fact that there are walls, railways, rivers and waterways between various types of spaces with different ownerships that cannot be traversed by residents on foot, which makes it impossible to conveniently visit some green spaces despite their close proximity and requires a diversion.
Accessibility is an important factor affecting residents' access to green-space resources and services and is closely related to the frequency of residents' visits. Scholars have explored the threshold relationship between green-space accessibility and residents' demands, and most scholars believe that the green-space threshold is 300 m, that is, approximately 5 min walk, and that residents' willingness to visit green spaces will be greatly reduced if this threshold is exceeded[56]. A higher accessibility level can provide residents with opportunities for contact and interaction with nature and, simultaneously, create more social and health benefits by indirectly promoting physical activity among residents. Therefore, appropriate measures should be taken to improve green-space resource accessibility. For example, green-space accessibility and openness can be enhanced by improving community microtransportation and reducing green-space barriers to increase residents' opportunities to come into contact with nature and realise convenient sharing among various communities.
5.3. Promoting Equity in Green-Space Resource Provision from a Fitness Perspective
From green-space resource matching supply and demand evaluation, 31 community life circles with lagging green-space services were identified. These areas are better developed, with better public service facilities and greater population distribution, however, the supply of green space is insufficient, showing an imbalance between supply and demand. In the future planning and construction of urban green spaces and organic renewal practices, these evaluation results for the service-lagging community life circles will be the transformation focus of the area. The total number of low-level coordinated communities was 14, accounting for 14.29%. The development and construction of this area is slower than that of the city centre, and although the supply and demand levels show a high degree of matching, both are at a low level, and the green-space supply level lags behind and requires improvement.
Previous research on urban green-space resource allocation is usually based on the administrative area as the basic unit, although there are advantages in the implementation and convenience of urban green-space planning and construction practices, however, the spatial precision is low and it is not possible to carry out a fine spatial assessment, and most of the research ignores the demand side, which severs the interactive relationship between the "people" and the "city". Owing to the diversity of the location, type, function, and potential of each community life circle, different strategies should be adopted according to individual conditions when optimising their green-space layout in the future, so that green-space resources can be organically and elastically distributed in the region to achieve fairness.
5.4. Focusing on the Needs of Different Socio-Economic Groups
In a study of green-space resource distribution under group differentiation, we found that green-space resources appeared to have lower values for attractiveness and visibility indicators in the high-grade tier. One potential reason for this is the impact of educational resources on housing prices, with unusually high housing values occurring in community life circles around some primary schools, but not enjoying better green-space resources because of their location in the heart of the city and older infrastructure from earlier development and construction. In contrast, many low-grade life circles are located in the northern fringe of Gulou District. Although they have better natural ecological resources, they are still not fully developed and cannot provide residents with better space for rest and recreation, so they enjoy a higher accessible green-space supply level and a relatively lower attractiveness and visibility supply level.
Lower socioeconomic groups have poorer access levels to green spaces, and they often rely on green open spaces as a public urban resource because of the poor internal environment of their neighbourhoods and the lack of private green spaces. Therefore, lower socioeconomic groups and the areas in which they congregate are key targets and areas for future planning, construction and renewal, and priority should be given to intervening in such groups and the areas in which they congregate to avoid imbalanced and unjust social problems such as low-income group “marginalisation”.
5.5. Limitations and Future Studies
The green-space supply level assessment system constructed in this study from four dimensions systematically analysed the role of green spaces and their ecological service benefits and characterised the ability of the population to access green-space services. The system did not cover all services provided by green spaces. In future research, green-space ecosystem services can be evaluated and analysed in a more systematic and comprehensive way.
In this study, only two factors–population distribution and residential housing prices–were used to construct the demand model for residential services; however, residents' demands for green spaces are not uniform, and factors such as age, health status, and education level may also affect people's demands for green spaces. Future research should further explore and summarise the relevant influencing factors, select appropriate evaluation indicators to reflect the actual demand, and improve the demand model multidimensionality and authenticity.
Furthermore, there are some uncertainties in the measurement of the indicators in this study that have an impact on final evaluation accuracy. For example, in attractiveness measurement, a point system was used to cover a variety of indicators in a more comprehensive manner; however, the weight differences between indicators were not considered, and equal weights were used for summary statistics. Indicator factors such as eco-efficiency and safety can be added to future research.
Finally, it is worth noting that the interaction between green spaces and urban residents is a dynamic and complex system. Owing to data acquisition and technology limitations, only a static assessment of the current green-space supply level was conducted in this study, which lacks more accurate and complete dynamic big data. Future research can make use of network big data, such as social platform big data, and spatial and temporal behavioural data collection technology, such as mobile phone signalling, to conduct demand simulation in a more refined and precise manner and make corresponding predictions of future changes and trends to conduct spatial and temporal optimisation of green-space allocation.
6. Conclusions
As an important natural resource in the city, green spaces not only provide a wide range of ecosystem services for the city but also provide urban residents with opportunities to access nature. Existing studies have mostly assessed green-space resource allocation efficiency and fairness from the land-use spatial layout perspective, but did not pay sufficient attention to green spaces within the actual scope of residents' activities. In this study, we focused on the interaction between green-space resource supply levels and demand-side "people" from the "people-oriented" perspective and the supply and demand balance, and established the community life circle as the basic research unit of residents' daily behavioural activity to initiate the study. We assessed green-space supply levels by considering the community life circle as the basic research unit. We constructed an evaluation framework for green-space supply levels from four dimensions: availability, accessibility, attractiveness, and visibility. We studied objective demand level matching of the residents, which was evaluated and analysed from three perspectives: the match between supply and demand, resource distribution fairness, and resource distribution balance among the different groups.
The results show that green-space resource allocation in the Gulou District of Nanjing is spatially unevenly distributed, and green-space service supply levels are less compatible with residents demands. In addition, green-space resource distribution is inequitable in terms of population demand and group differentiation. By analysing the interaction between the actual demand of residents and the supply of green-space services, we were able to portray the problems in the green-space allocation pattern more precisely. Simultaneously, we propose corresponding planning and design optimisation strategies that are of great significance for balancing green-space resource distribution, maintaining spatial equity and justice, and creating a comfortable and liveable urban environment.
Author Contributions
H.X.: methodology, data curation, writing-original draft; R.Y.: conceptualization, data collection, figure production, data curation; T.X.: writing-review, methodology; B.Z.: funding acquisition, conceptualization; B.Q.: funding acquisition, supervision.
Funding
This work was supported by National Natural Science Foundation of China (NSFC) General Project (No. 31971721). A Project Funded by the Priority Academic Program Development of Jiangsu Higher Education Institution (PAPD). Priority Academic Program Development of Jiangsu Higher Educations Institutions (No. 164120230). Project of Innovation Programme for Postgraduate Research and Practice in Jiangsu Province (No. SJCX230352).
Data Availability Statement
The data presented in this study are available on request.
Acknowledgments
We thank the journal’s editors and reviewers for their valuable suggestions to improve the paper.
Conflicts of Interest
The authors declares that there are no known competing financial interests or personal relationship that could have appeared to influence the work reported in this paper.
References
- Wolf K, L. Ergonomics of the city: Green infrastructure and social benefits[D]. Washington DC: American Forests, 2003.
- Yha B, Tao L, Xx A, et al. Spatial patterns and inequity of urban green space supply in China[J]. Ecological Indicators, 2021(132):108275.
- Niemelä J, Saarela S R, Söderman T, et al. Using the ecosystem services approach for better planningand conservation of urban green spaces: a Finland case study[J]. Biodiversity and Conservation, 2010, 19: 3225-3243.
- Hartig T, Mitchell R, De Vries S, Frumkin H (2014) Nature and health. Annu Rev Public Health 35:207–228.
- Geary R S, Wheeler B, Lovell R, et al. A call to action: Improving urban green spaces to reduce health inequalities exacerbated by COVID-19[J]. Preventive medicine, 2021, 145: 106425.
- Derks J, Giessen L, Winkel G. COVID-19-induced visitor boom reveals the importance of forests as critical infrastructure[J]. Forest Policy and Economics, 2020, 118: 102253.
- Venter Z S, Barton D N, Gundersen V, et al. Urban nature in a time of crisis: recreational use of green space increases during the COVID-19 outbreak in Oslo, Norway[J]. Environmental research letters, 2020,15(10):104075. [CrossRef]
- Larson L R, Mullenbach L E, Browning M H E M, et al. Greenspace and park use associated with less emotional distress among college students in the United States during the COVID-19 pandemic[J]. Environmental research, 2022, 204: 112367.
- Castells-Quintana D, Royuela V. Are Increasing Urbanisation and Inequalities Symptoms of Growth?[J]. Applied Spatial Analysis and Policy, 2015,8(3):291-308.
- Mitchell, D. The Right to the City: Social Justice and the Fight for Public Space; Guilford Press: New York, NY, USA, 2003. [Google Scholar]
- Mikula, G.; Scherer, K.R.; Athenstaedt, U. The role of injustice in the elicitation of differential emotional reactions. Pers. Soc. Psychol. Bull. 1998, 24, 769–783. [Google Scholar] [CrossRef]
- Tan P Y, Samsudin R. Effects of spatial scale on assessment of spatial equity of urban park provision[J]. Landscape & Urban Planning, 2017,158:139-154.
- Yu, Y. From traditional residential area planning to neighborhood life circle planning. City Plan. Rev. 2019, 43, 17–22. [Google Scholar]
- Zuopeng, X.; Yanwei, C.; Yan, Z. Review on the Development of Planning Research and Planning Practice of Living Circles at Home and Abroad. Planners 2014, 30, 85–95. [Google Scholar]
- Tan P Y, Samsudin R. Effects of spatial scale on assessment of spatial equity of urban park provision[J]. Landscape & Urban Planning, 2017,158:139-154.
- Li, M. Planning of 15-minute community life circle based on residents’ behaviour demand characteristics. Urban Plan. Forum 2017, 1, 111–118. [Google Scholar]
- Wei, W.; Hong, M.Y.; Xie, B. Delineation of 15-min Life Circles and Spatial Optimisation Based on Supply-demand Match. Planners 2019, 4, 11–17. [Google Scholar]
- Chen, Q.H.; Xu, P.W. Preliminary discussion of evaluation methodology for the urban living environment quality. City Plan. Rev. 1987, 5, 52–58+29. [Google Scholar]
- Bian, S.W.; Xi, W.Q. Preliminary Discussion of planning of urban 15-min community life circle: A case study of Shanghai and Jinan. Urban Archit. 2018, 36, 27–30. [Google Scholar]
- Burton, C.G. A Validation of Metrics for Community Resilience to Natural Hazards and Disasters Using the Recovery from Hurricane Katrina as a Case Study. Ann. Assoc. Am. Geogr. 2015, 105, 67–86. [Google Scholar] [CrossRef]
- Gilmore, B.; Ndejjo, R.; Tchetchia, A.; de Claro, V.; Mago, E.; Diallo, A.A.; Lopes, C.; Bhattacharyya, S. Community Engagement for COVID-19 Prevention and Control: A Rapid Evidence Synthesis. BMJ Glob. Health 2020, 5, e003188. [Google Scholar] [CrossRef] [PubMed]
- Lee, T.H. Influence Analysis of Community Resident Support for Sustainable Tourism Development. Tour. Manag. 2013, 34, 37–46. [Google Scholar] [CrossRef]
- Zuo, J.; Meng, L.; Li, C.; Zhang, H.; Zeng, Y.; Dong, J. Construction of Community Life Circle Database Based on High-Resolution Remote Sensing Technology and Multi-Source Data Fusion. Eur. J. Remote Sens. 2021, 54, 222–237. [Google Scholar] [CrossRef]
- Wan, Z.; Chen, H. Construction and accessibility of public medical amenities from the perspective of life circle: A case study of Zhongyuan District, Zhengzhou city. Archit. Cult. 2022, 5, 75–76. [Google Scholar]
- Weng M, Ding N, Li J, et al. The 15-minute walkable neighborhoods: Measurement, social inequalities and implications for building healthy communities in urban China[J]. Journal of Transport & Health, 2019, 13: 259-273.
- Roux, A.V.D. Investigating Neighborhood and Area Effects on Health. Am. J. Public Health 2001, 91, 1783–1789. [Google Scholar] [CrossRef]
- Foth, N.; Manaugh, K.; El-Geneidy, A.M. Towards Equitable Transit: Examining Transit Accessibility and Social Need in Toronto, Canada, 1996–2006. J. Transp. Geogr. 2013, 29, 1–10. [Google Scholar] [CrossRef]
- Liu, T.; Chai, Y. Daily Life Circle Reconstruction: A Scheme for Sustainable Development in Urban China. Habitat Int. 2015, 50, 250–260. [Google Scholar] [CrossRef]
- Coombes, E.; Jones, A.P.; Hillsdon, M. The Relationship of Physical Activity and Overweight to Objectively Measured Green Space Accessibility and Use. Soc. Sci. Med. 2010, 70, 816–822. [Google Scholar] [CrossRef]
- Wan, J.; Zhao, Y.; Zhang, K.; Ma, C.; Sun, H.; Wang, Z.; Wu, H.; Li, M.; Zhang, L.; Tang, X.; et al. Healthy Community-Life Circle Planning Combining Objective Measurement and Subjective Evaluation: Theoretical and Empirical Research. Int. J. Environ. Res. Public Health 2022, 19, 5028. [Google Scholar] [CrossRef] [PubMed]
- Wu, H.; Wang, L.; Zhang, Z.; Gao, J. Analysis and Optimization of 15-Minute Community Life Circle Based on Supply and Demand Matching: A Case Study of Shanghai. PLoS ONE 2021, 16, e0256904. [Google Scholar] [CrossRef]
- Li, C.; Xia, W.; Chai, Y. Delineation of an Urban Community Life Circle Based on a Machine-Learning Estimation of Spatiotemporal Behavioral Demand. Chin. Geogr. Sci. 2021, 31, 27–40. [Google Scholar] [CrossRef]
- Tian, Y.; Kong, X.; Liu, Y. Combining Weighted Daily Life Circles and Land Suitability for Rural Settlement Reconstruction. Habitat Int. 2018, 76, 1–9. [Google Scholar] [CrossRef]
- Lee G, Hong I. Measuring spatial accessibility in the context of spatial disparity between demand and supply of urban park service[J]. Landscape and Urban Planning, 2013,119:85-90.
- Liu B, Tian Y, Guo M, et al. Evaluating the disparity between supply and demand of park green space using a multi-dimensional spatial equity evaluation framework[J]. Cities, 2022,121:103484.
- Zhang J, Yu Z, Cheng Y, et al. Evaluating the disparities in urban green space provision in communities with diverse built environments: The case of a rapidly urbanizing Chinese city[J]. Building and Environment, 2020,183:107170.
- Li X, Huang Y, Ma X. Evaluation of the accessible urban public green space at the community-scale with the consideration of temporal accessibility and quality[J]. Ecological Indicators, 2021,131:108231.
- Whyte W, H. The Social Life of Small Urban Spaces[J]. Conservation Foundation, 1980.
- Park K, Ewing R. The usability of unmanned aerial vehicles (UAVs) for measuring park-based physical activity[J]. Landscape and urban planning, 2017,167:157-164.
- B R A B A, A F J S. A portfolio of natural places: Using a participatory GIS tool to compare the appreciation and use of green spaces inside and outside urban areas by urban residents[J]. Landscape and Urban Planning, 2017,158:155-165.
- Yc A, Jz A, Wei W B, et al. Effects of urban parks on residents' expressed happiness before and during the COVID-19 pandemic[J]. Landscape and Urban Planning, 2021.
- Xing L, Liu Y, Wang B, et al. An environmental justice study on spatial access to parks for youth by using an improved 2SFCA method in Wuhan, China[J]. Cities, 2020,96:102405. [CrossRef]
- Jk A, Ah B, Ea A, et al. Environmental justice in the context of urban green space availability, accessibility, and attractiveness in postsocialist cities[J]. Cities, 2020,106.
- Hughey S M, Walsemann K M, Child S, et al. Using an environmental justice approach to examine the relationships between park availability and quality indicators, neighborhood disadvantage, and racial/ethnic composition[J]. Landscape and urban planning, 2016,148:159-169. [CrossRef]
- Southon G E, Jorgensen A, Dunnett N, et al. Perceived species-richness in urban green spaces: Cues, accuracy and well-being impacts[J]. Landscape and Urban Planning, 2018,172:1-10. [CrossRef]
- Van Cauwenberg J, Cerin E, Timperio A, et al. Park proximity, quality and recreational physical activity among mid-older aged adults: moderating effects of individual factors and area of residence[J]. International Journal of Behavioral Nutrition & Physical Activity, 2015,12(1):46.
- Zhang J, Cheng Y, Wei W, et al. Evaluating Spatial Disparity of Access to Public Parks in Gated and Open Communities with an Improved G2SFCA Model[J]. Sustainability, 2019,11(21):5910.
- Helbich M, Yao Y, Liu Y, et al. Using deep learning to examine street view green and blue spaces and their associations with geriatric depression in Bei**g, China[J]. Environment international, 2019, 126: 107-117.
- Ki D, Lee S. Analyzing the effects of Green View Index of neighborhood streets on walking time using Google Street View and deep learning[J]. Landscape and Urban Planning, 2020,205.
- Xia Y, Yabuki N, Fukuda T. Development of a system for assessing the quality of urban street-level greenery using street view images and deep learning[J]. Urban Forestry & Urban Greening, 2021,59(3):126995.
- Xia Y, Yabuki N, Fukuda T. Development of a system for assessing the quality of urban street-level greenery using street view images and deep learning[J]. Urban Forestry & Urban Greening, 2021,59(3):126995.
- Chen Y, Yue W, Rosa D L. Which communities have better accessibility to green space? An investigation into environmental inequality using big data[J]. Landscape and Urban Planning, 2020,204:103919.
- Kong F, Yin H, Nakagoshi N. Using GIS and Landscape Metrics in the Hedonic Price Modelling of the Amenity Value of Urban Green Space[J]. Landscape and Urban Planning, 2007,79(3-4):240-252.
- Wüstemann H, Kalisch D, Kolbe J. Access to urban green space and environmental inequalities in Germany[J]. Landscape and Urban Planning, 2017,164:124-131.
- Ngom R, Gosselin P, Blais C. Reduction of disparities in access to green spaces: Their geographic insertion and recreational functions matter[J]. Applied Geography, 2016,66:35-51.
- Nielsen T S, Hansen K B. Do green areas affect health? Results from a Danish survey on the use of green areas and health indicators[J]. Health & Place, 2007,13(4):839-850.
Figure 1.
Framework for evaluating green-space provision levels in a community life circle.
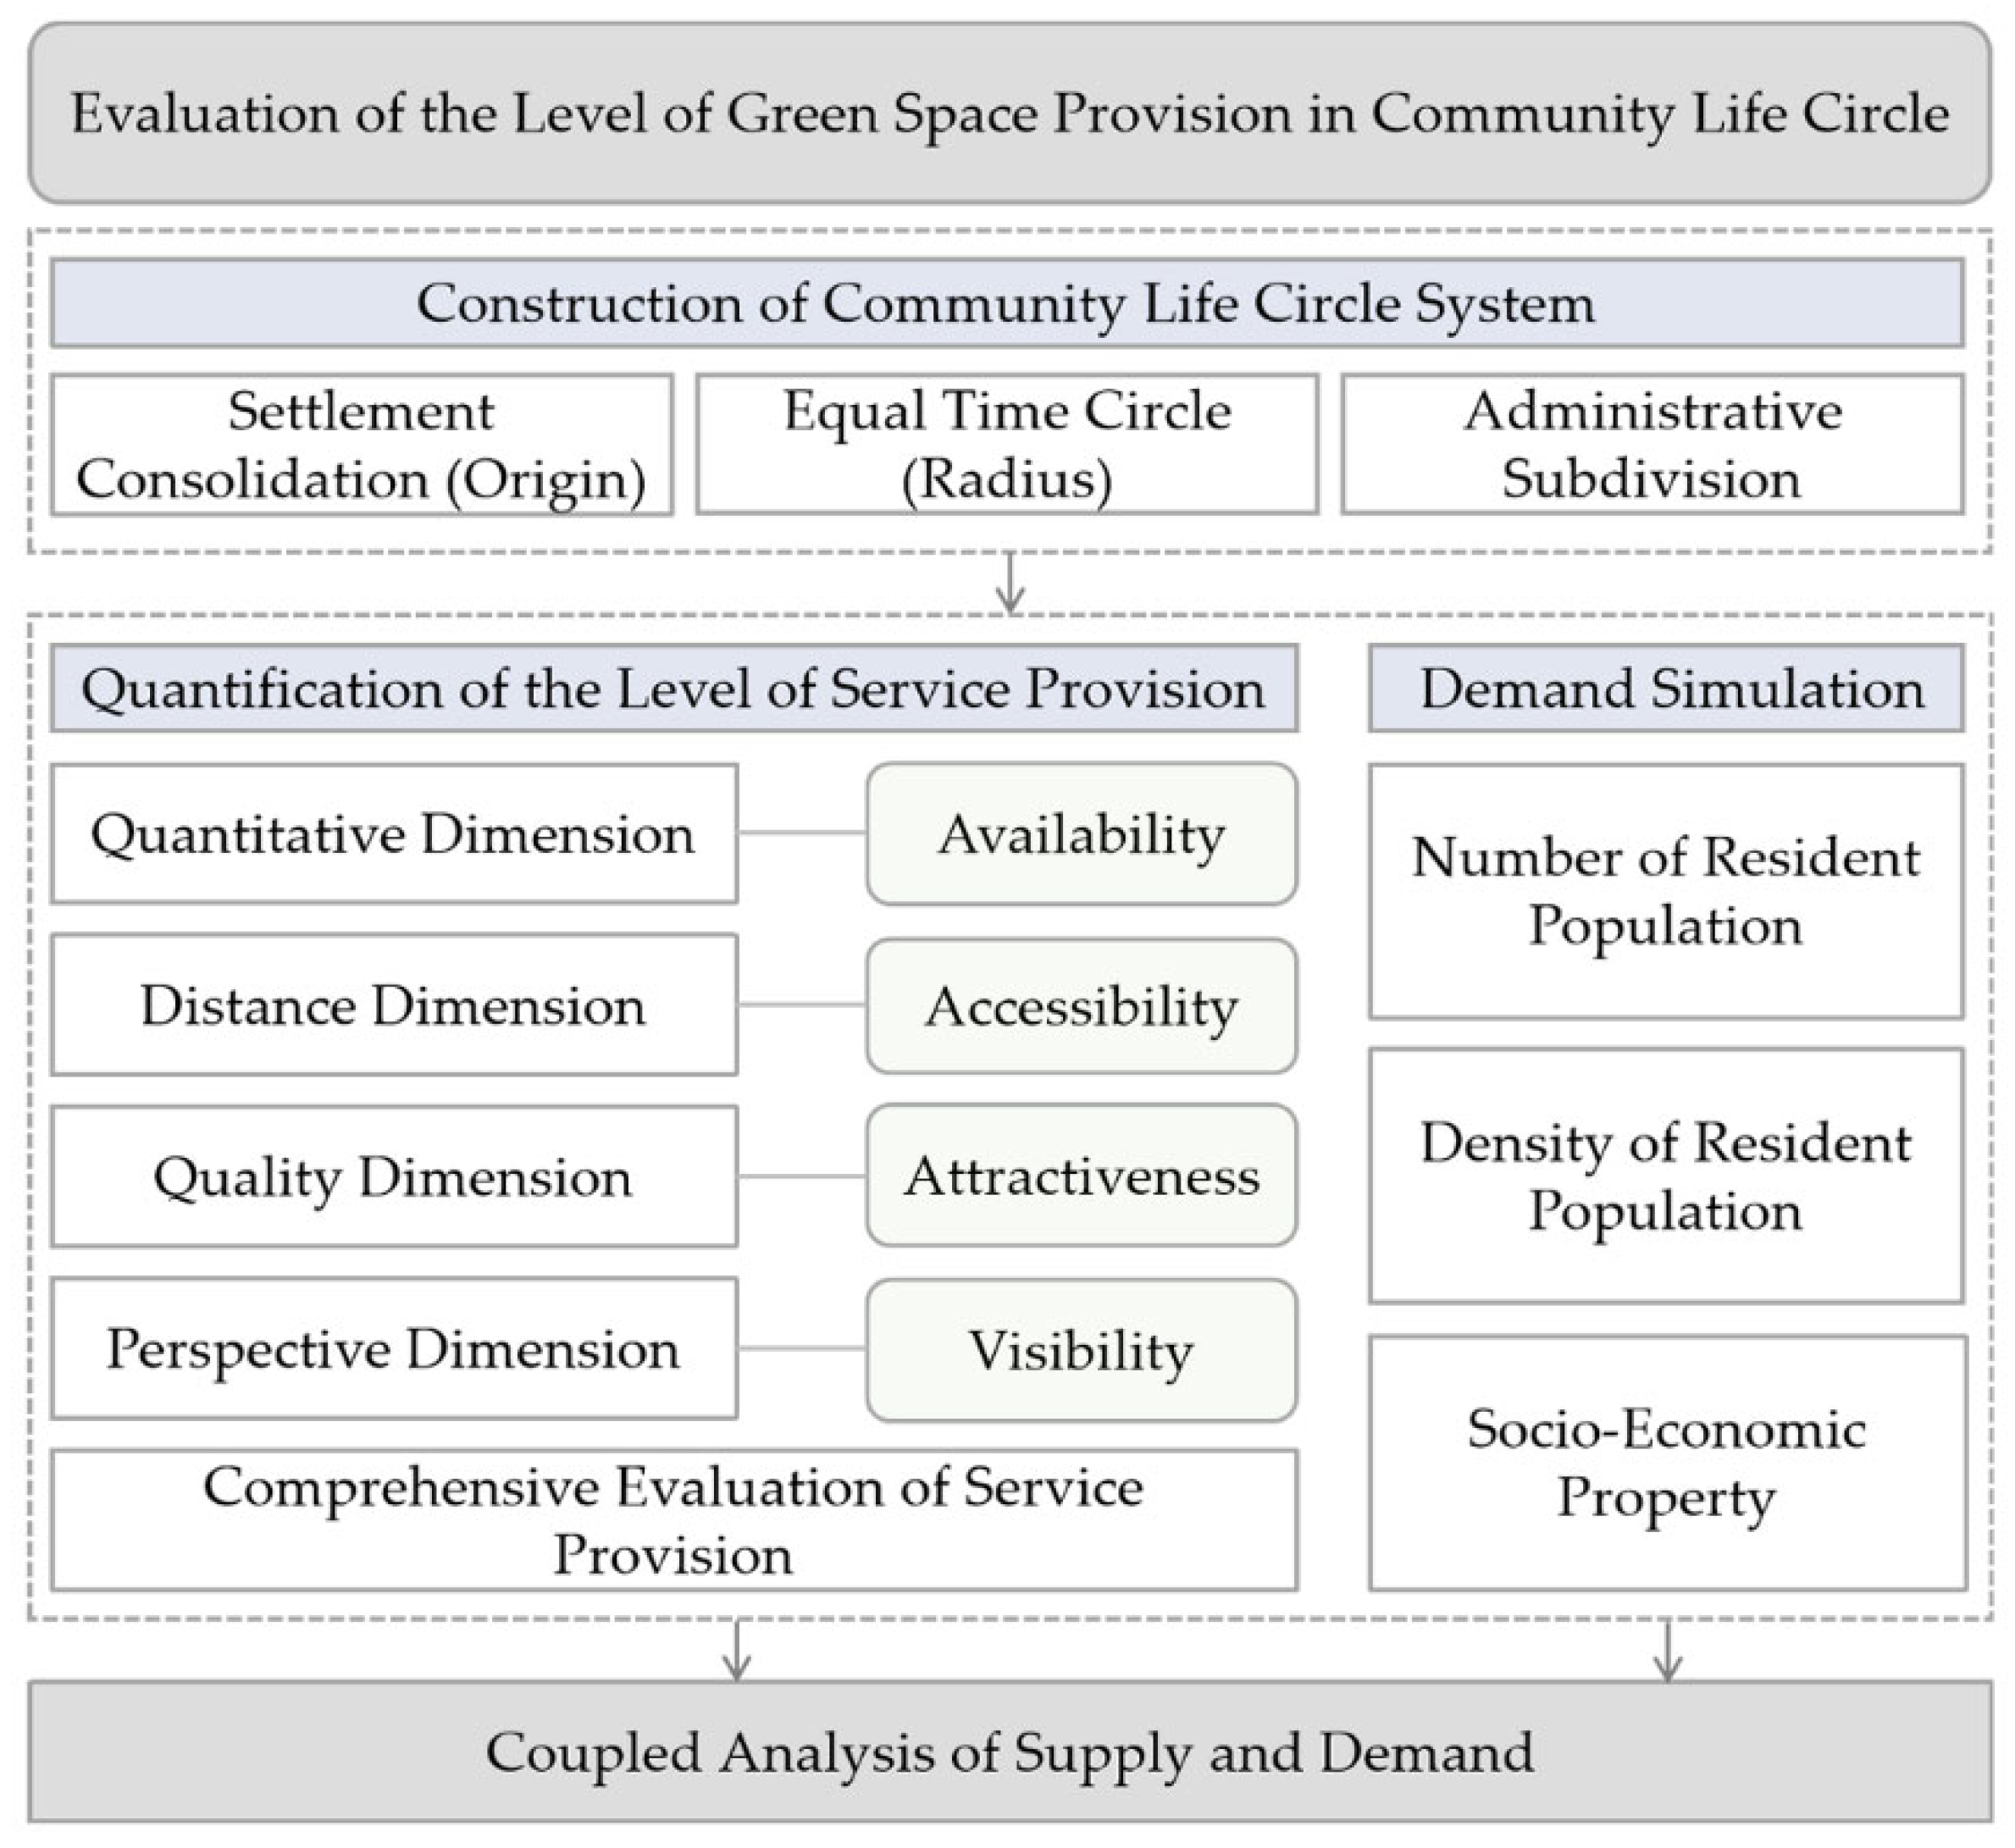
Figure 2.
Coupled supply and demand evaluation matrix. The horizontal and vertical axes indicate the level of supply and the degree of demand from lowest to highest, respectively.
Figure 2.
Coupled supply and demand evaluation matrix. The horizontal and vertical axes indicate the level of supply and the degree of demand from lowest to highest, respectively.
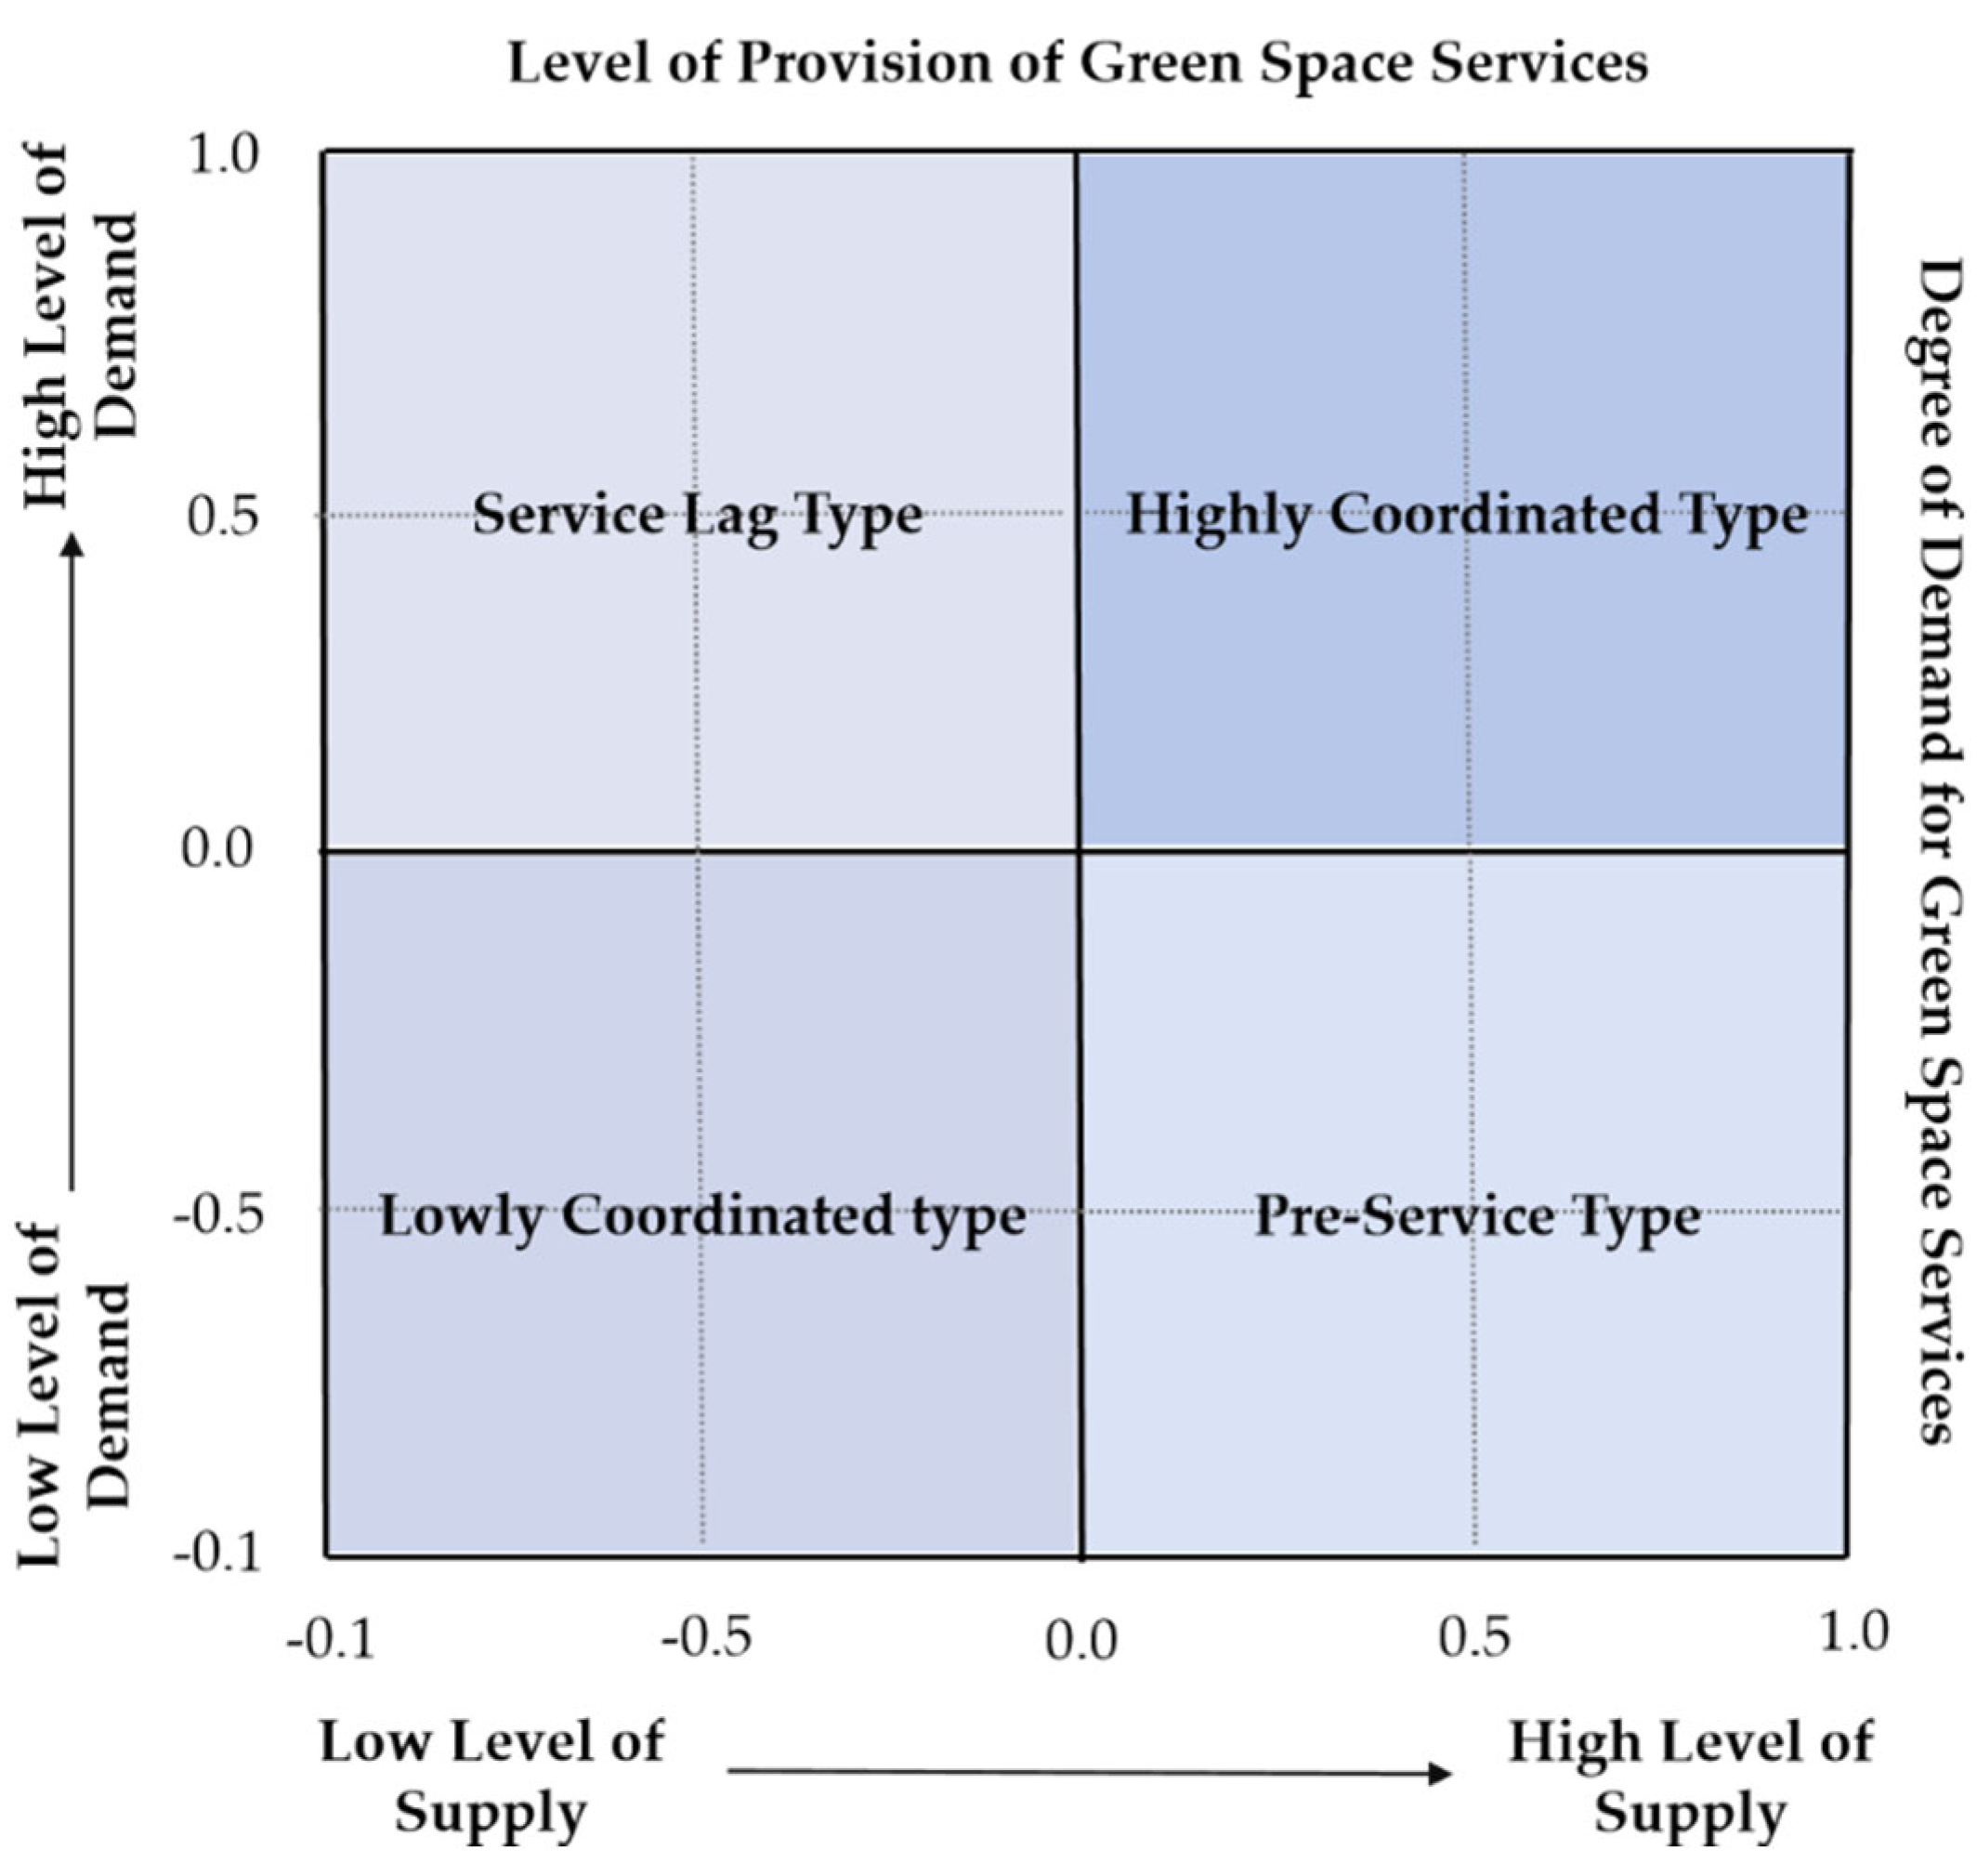
Figure 3.
The Lorentz curve principle. The horizontal and vertical axes are the cumulative percentages of population and resources, respectively, and the function line represents the absolute average resource distribution, with the degree of curvature of the actual distribution curve reflecting the degree of equity in the resource distribution.
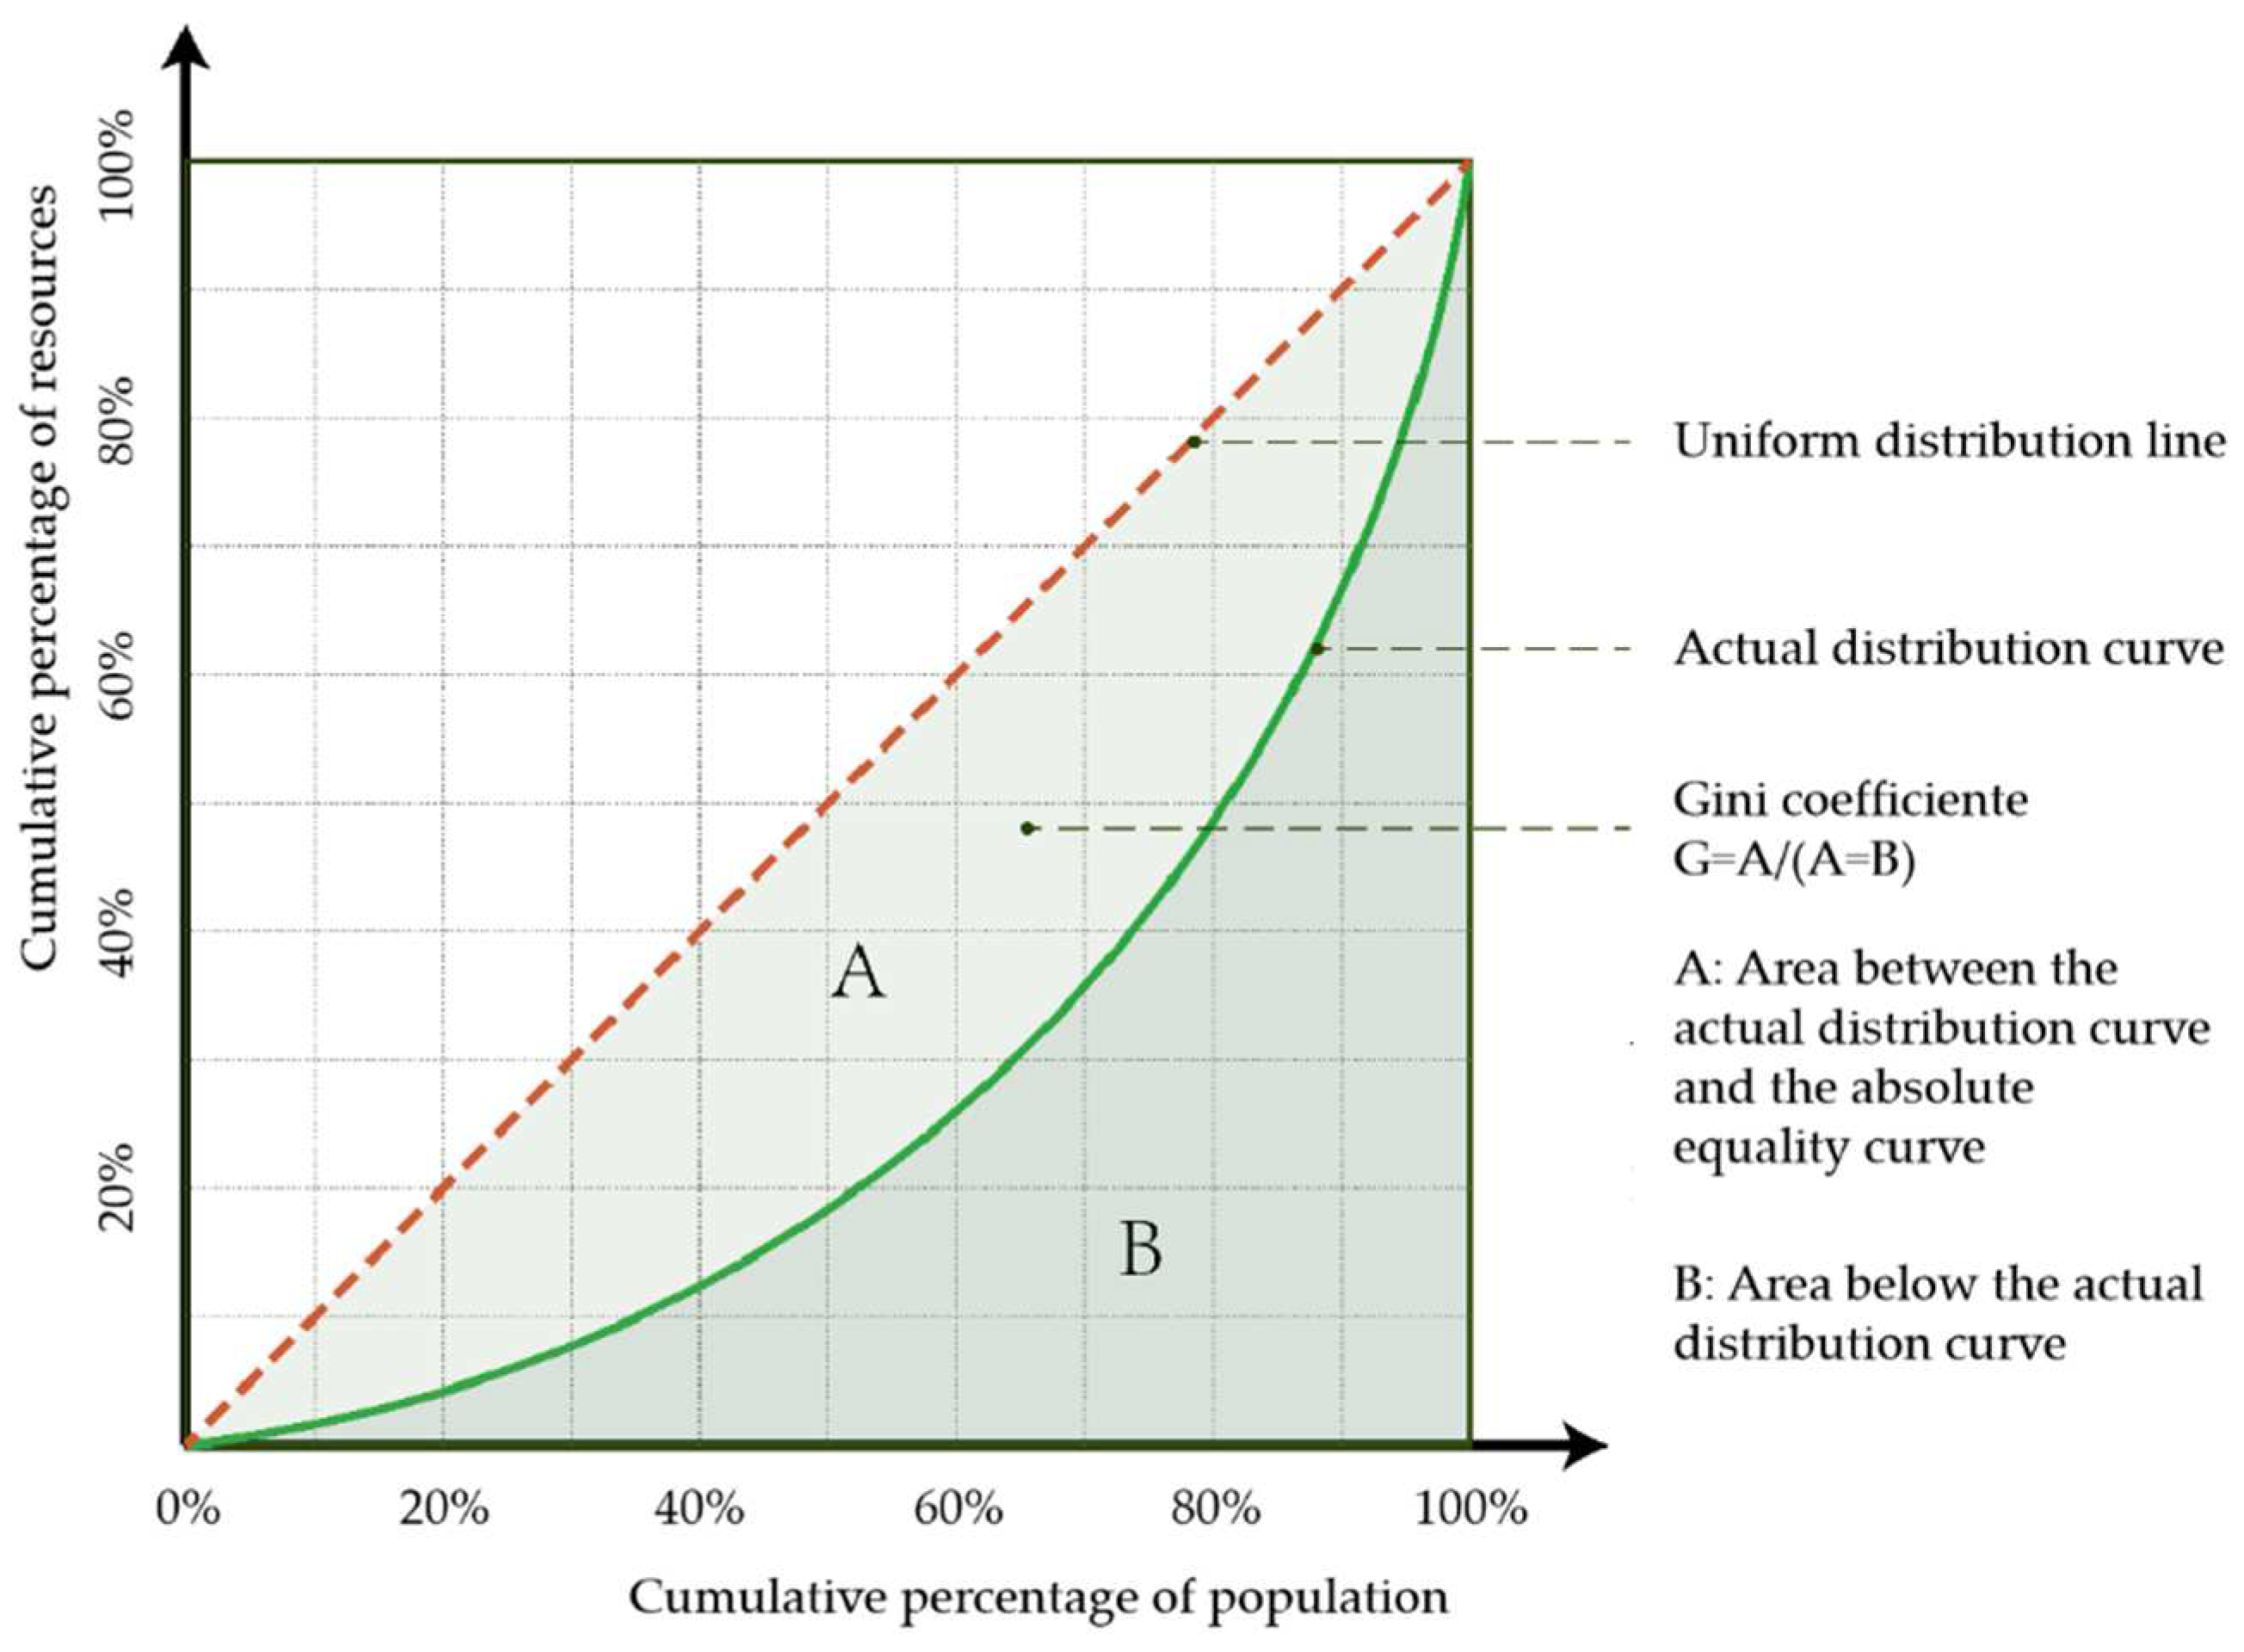
Figure 4.
Study area location.
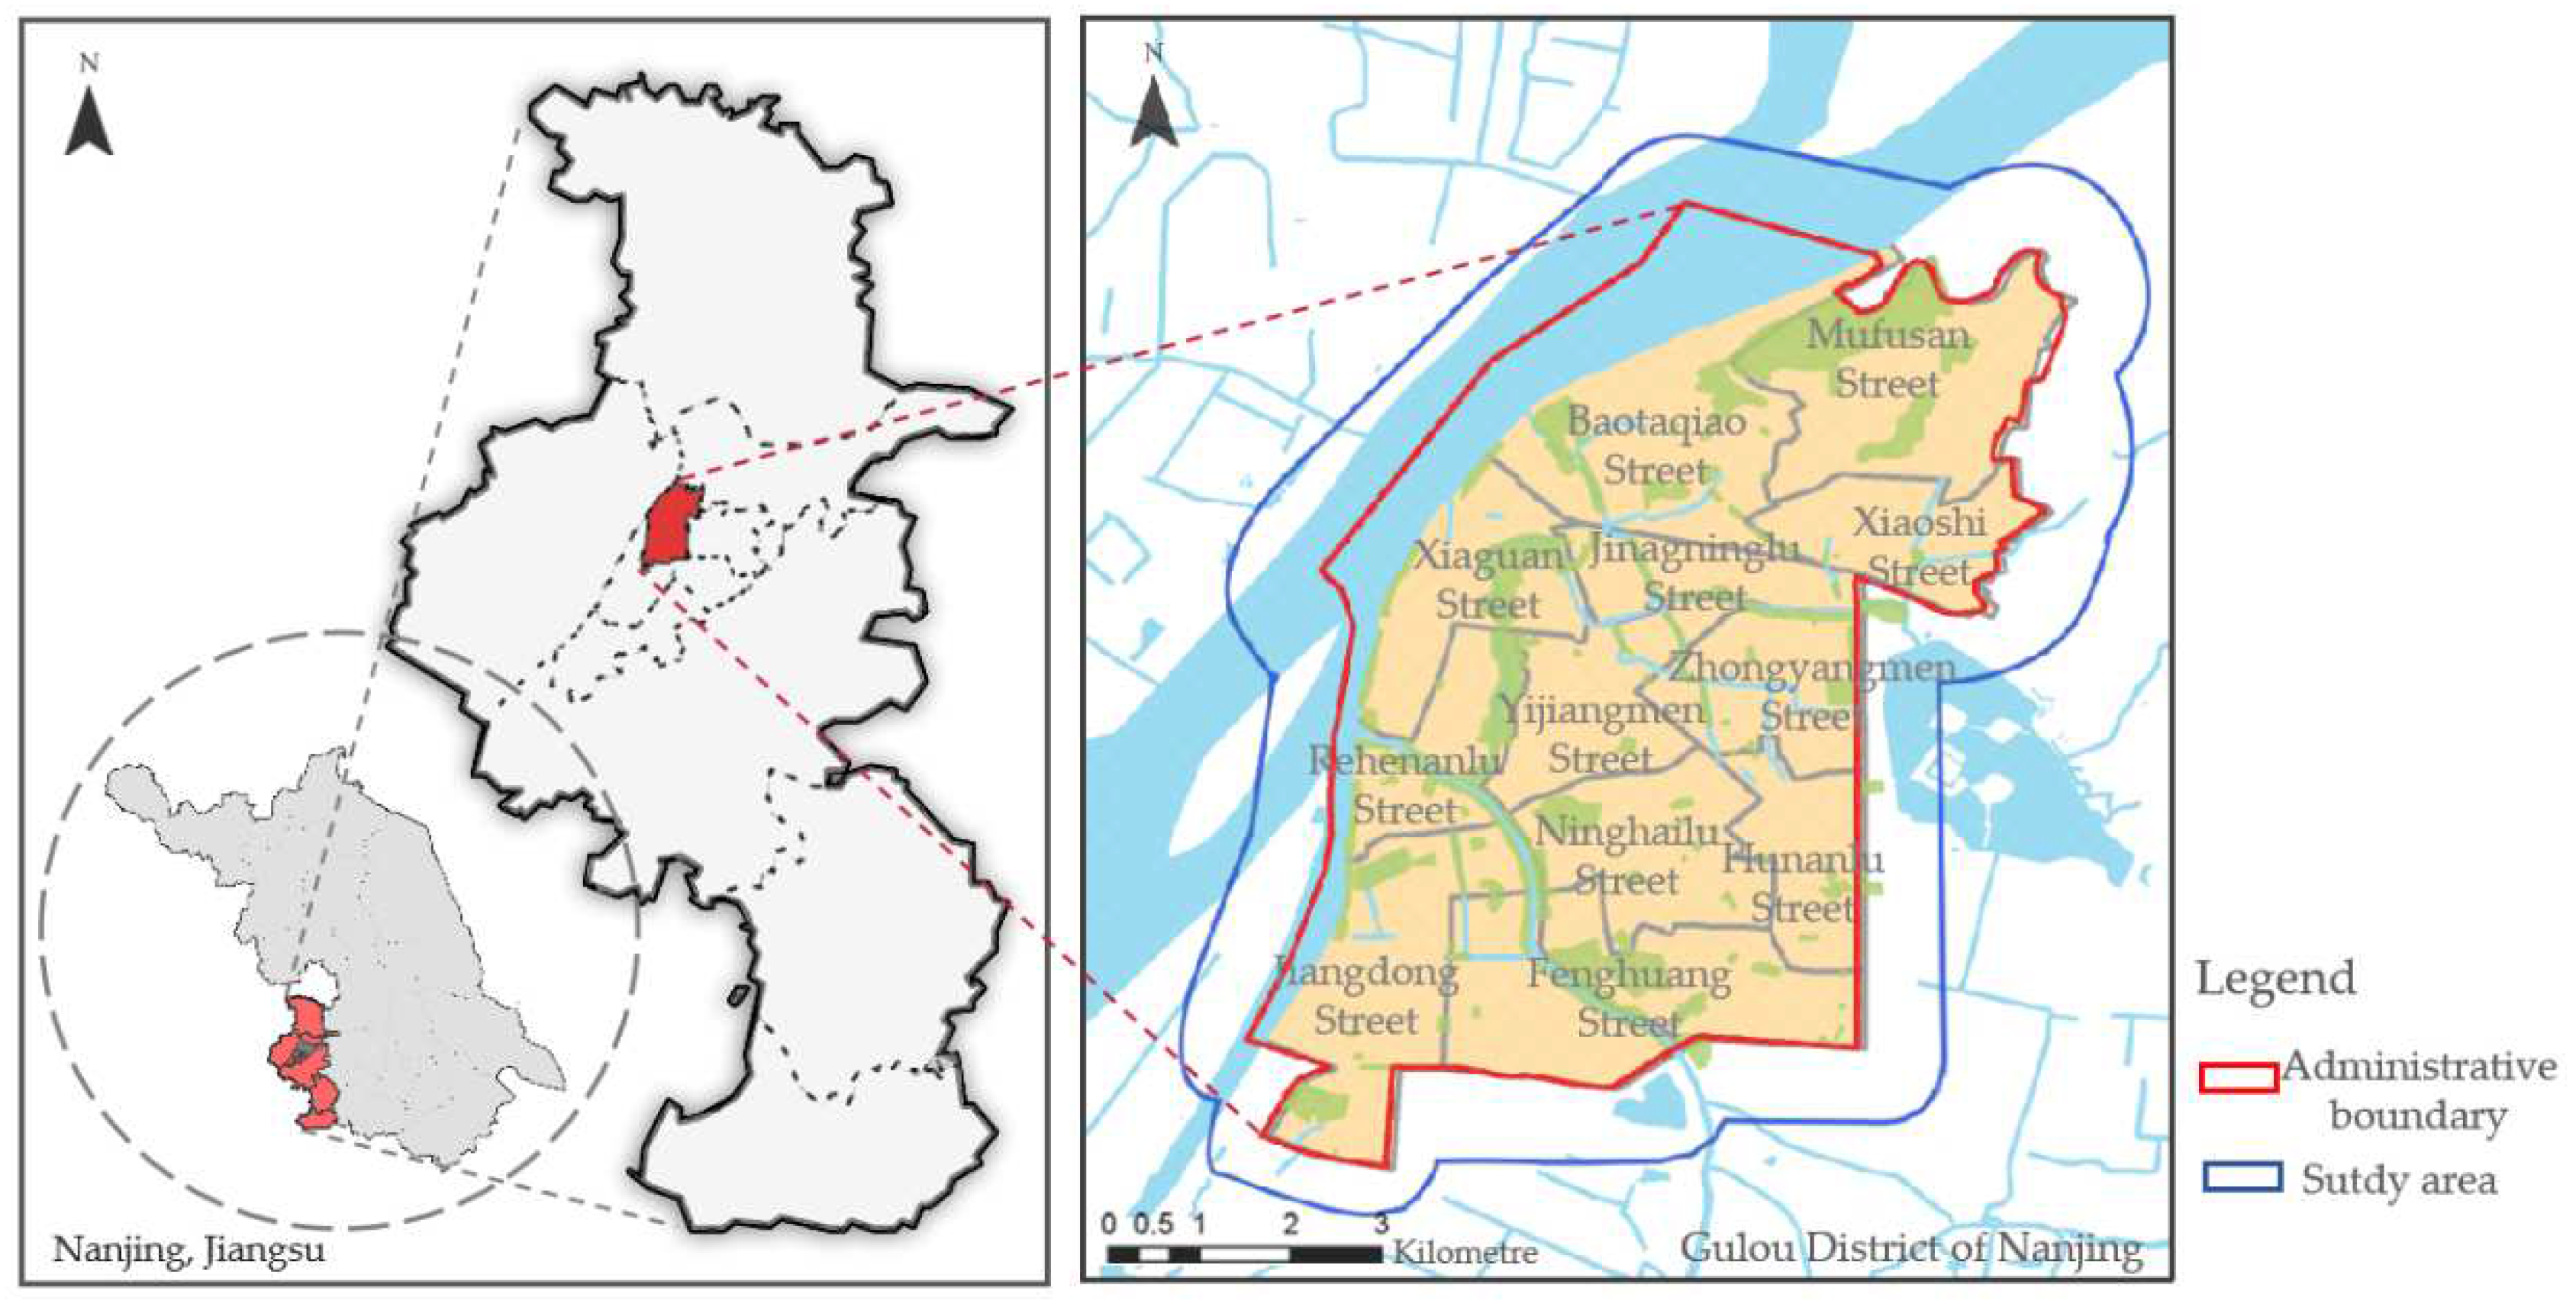
Figure 5.
Community life circle delineation results in Gulou District.
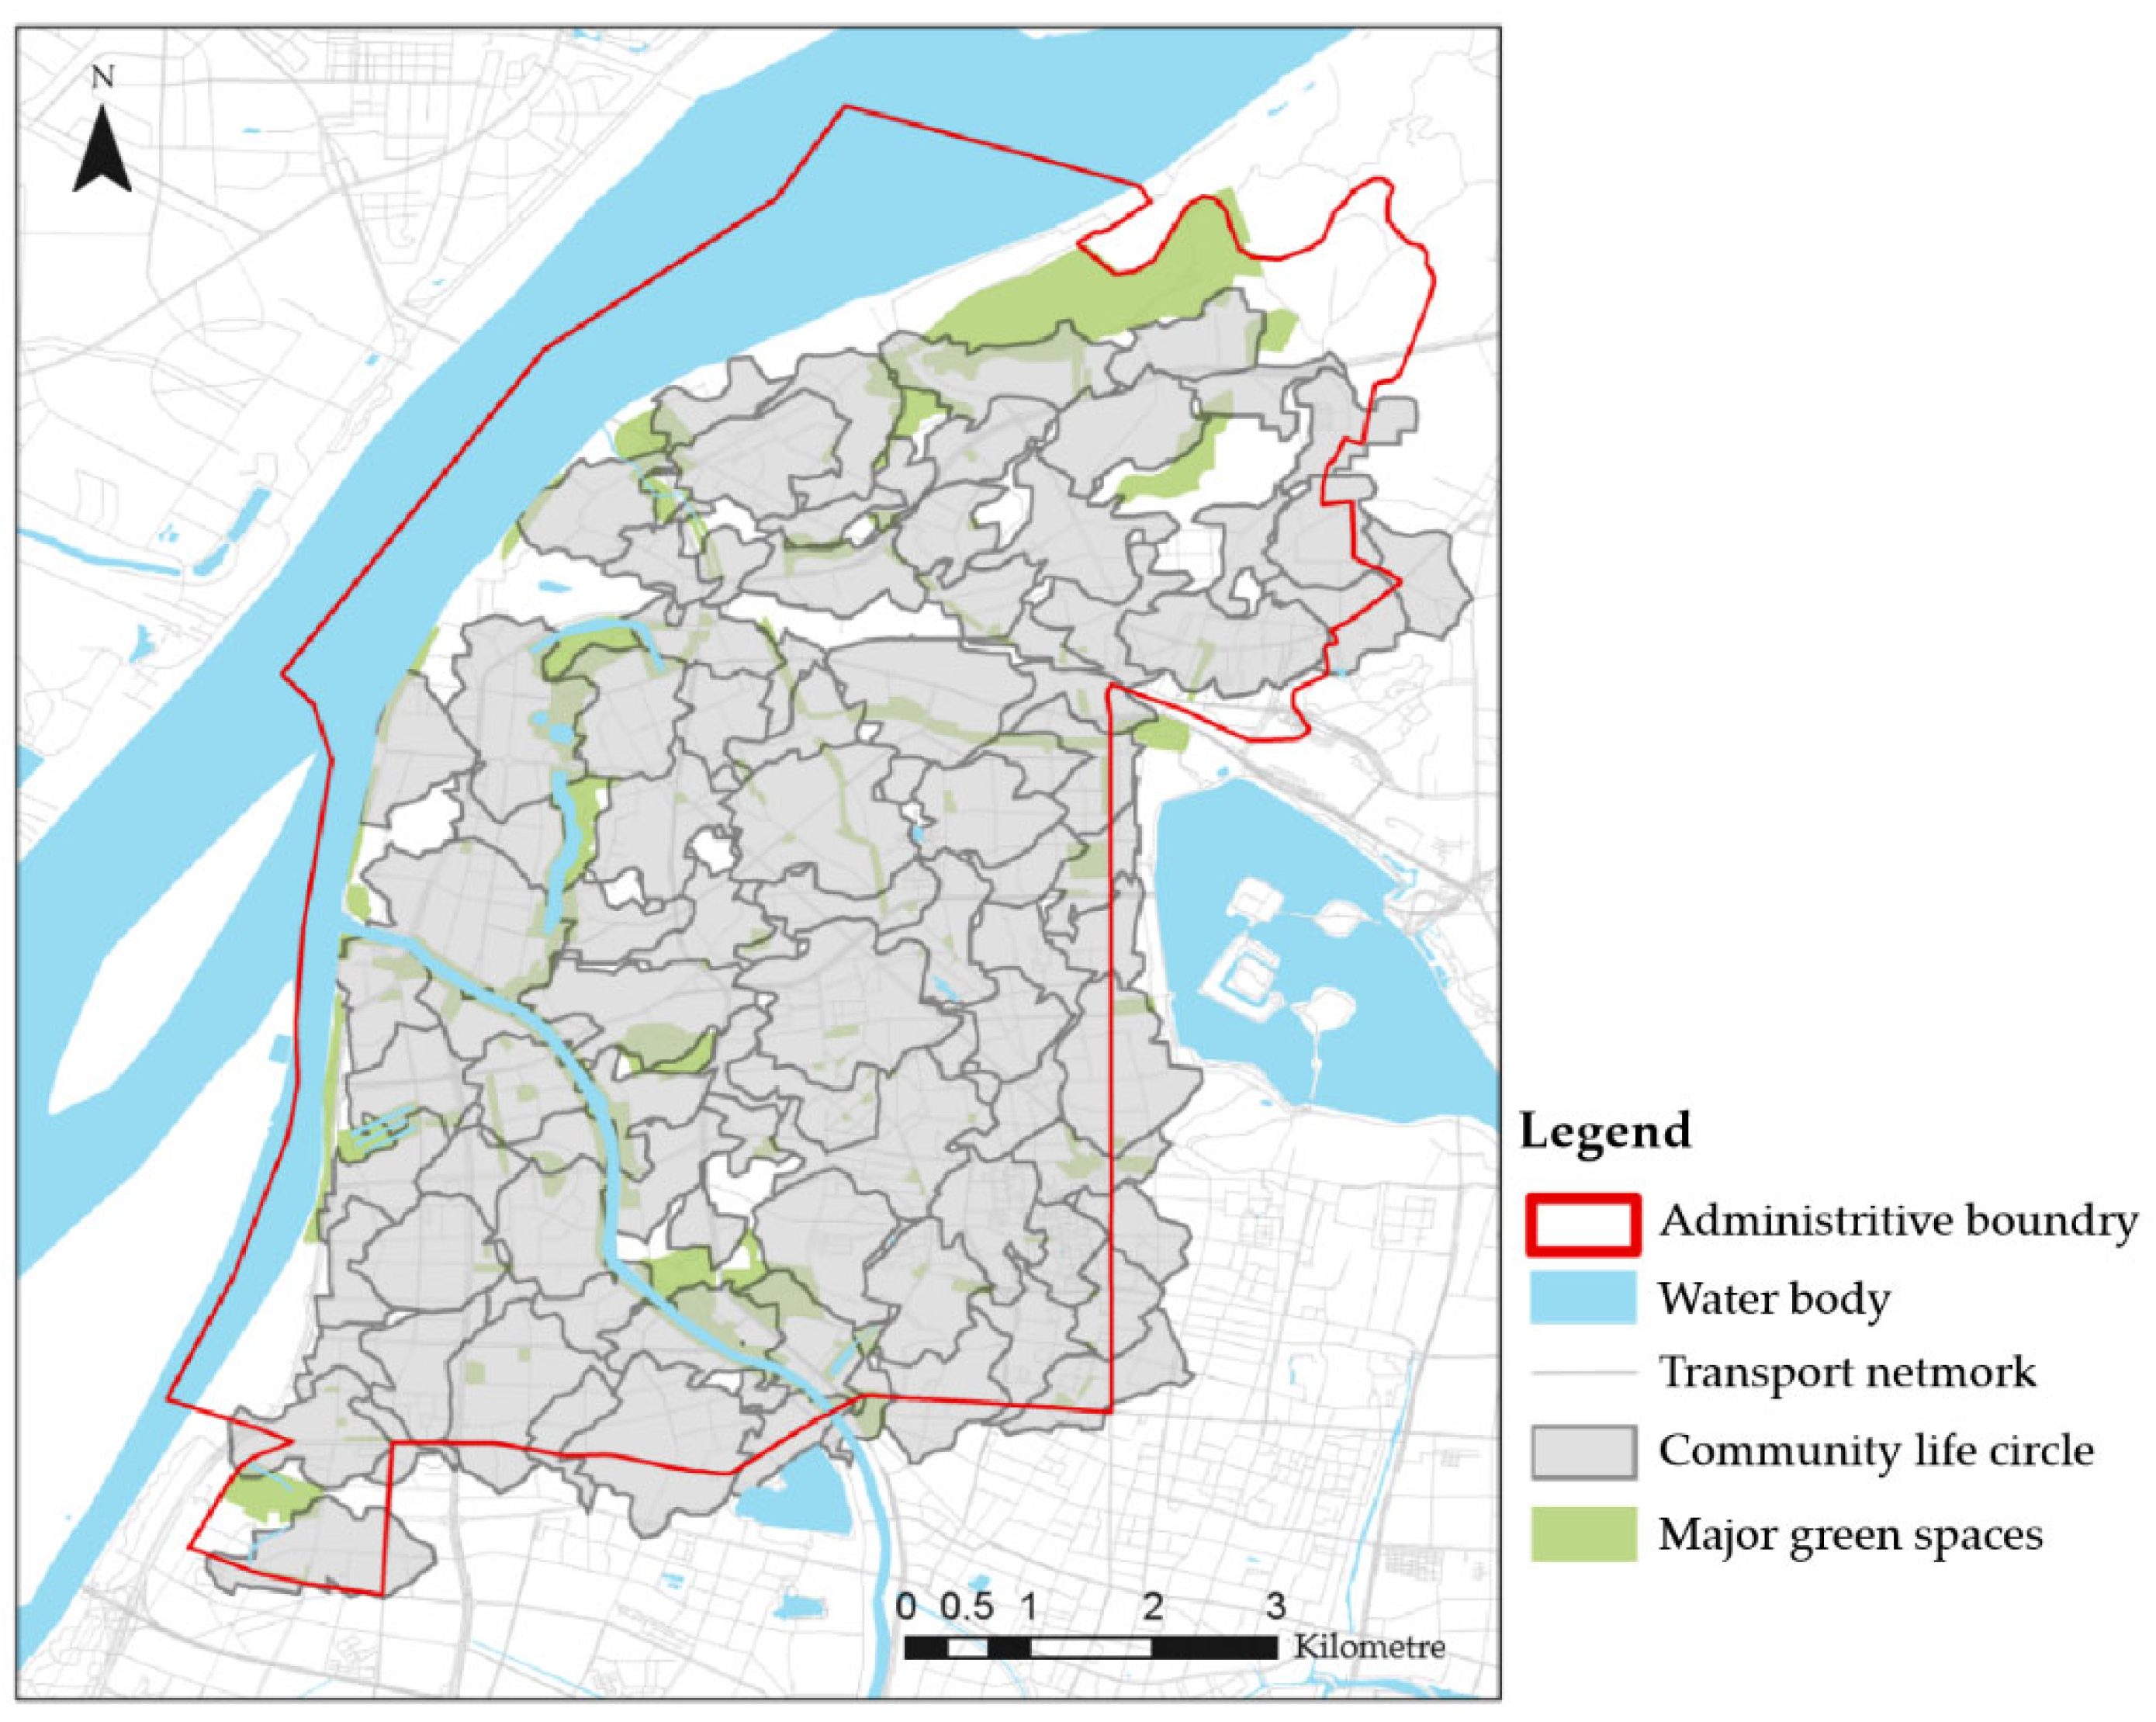
Figure 6.
Community life circle delineation results in Gulou District.
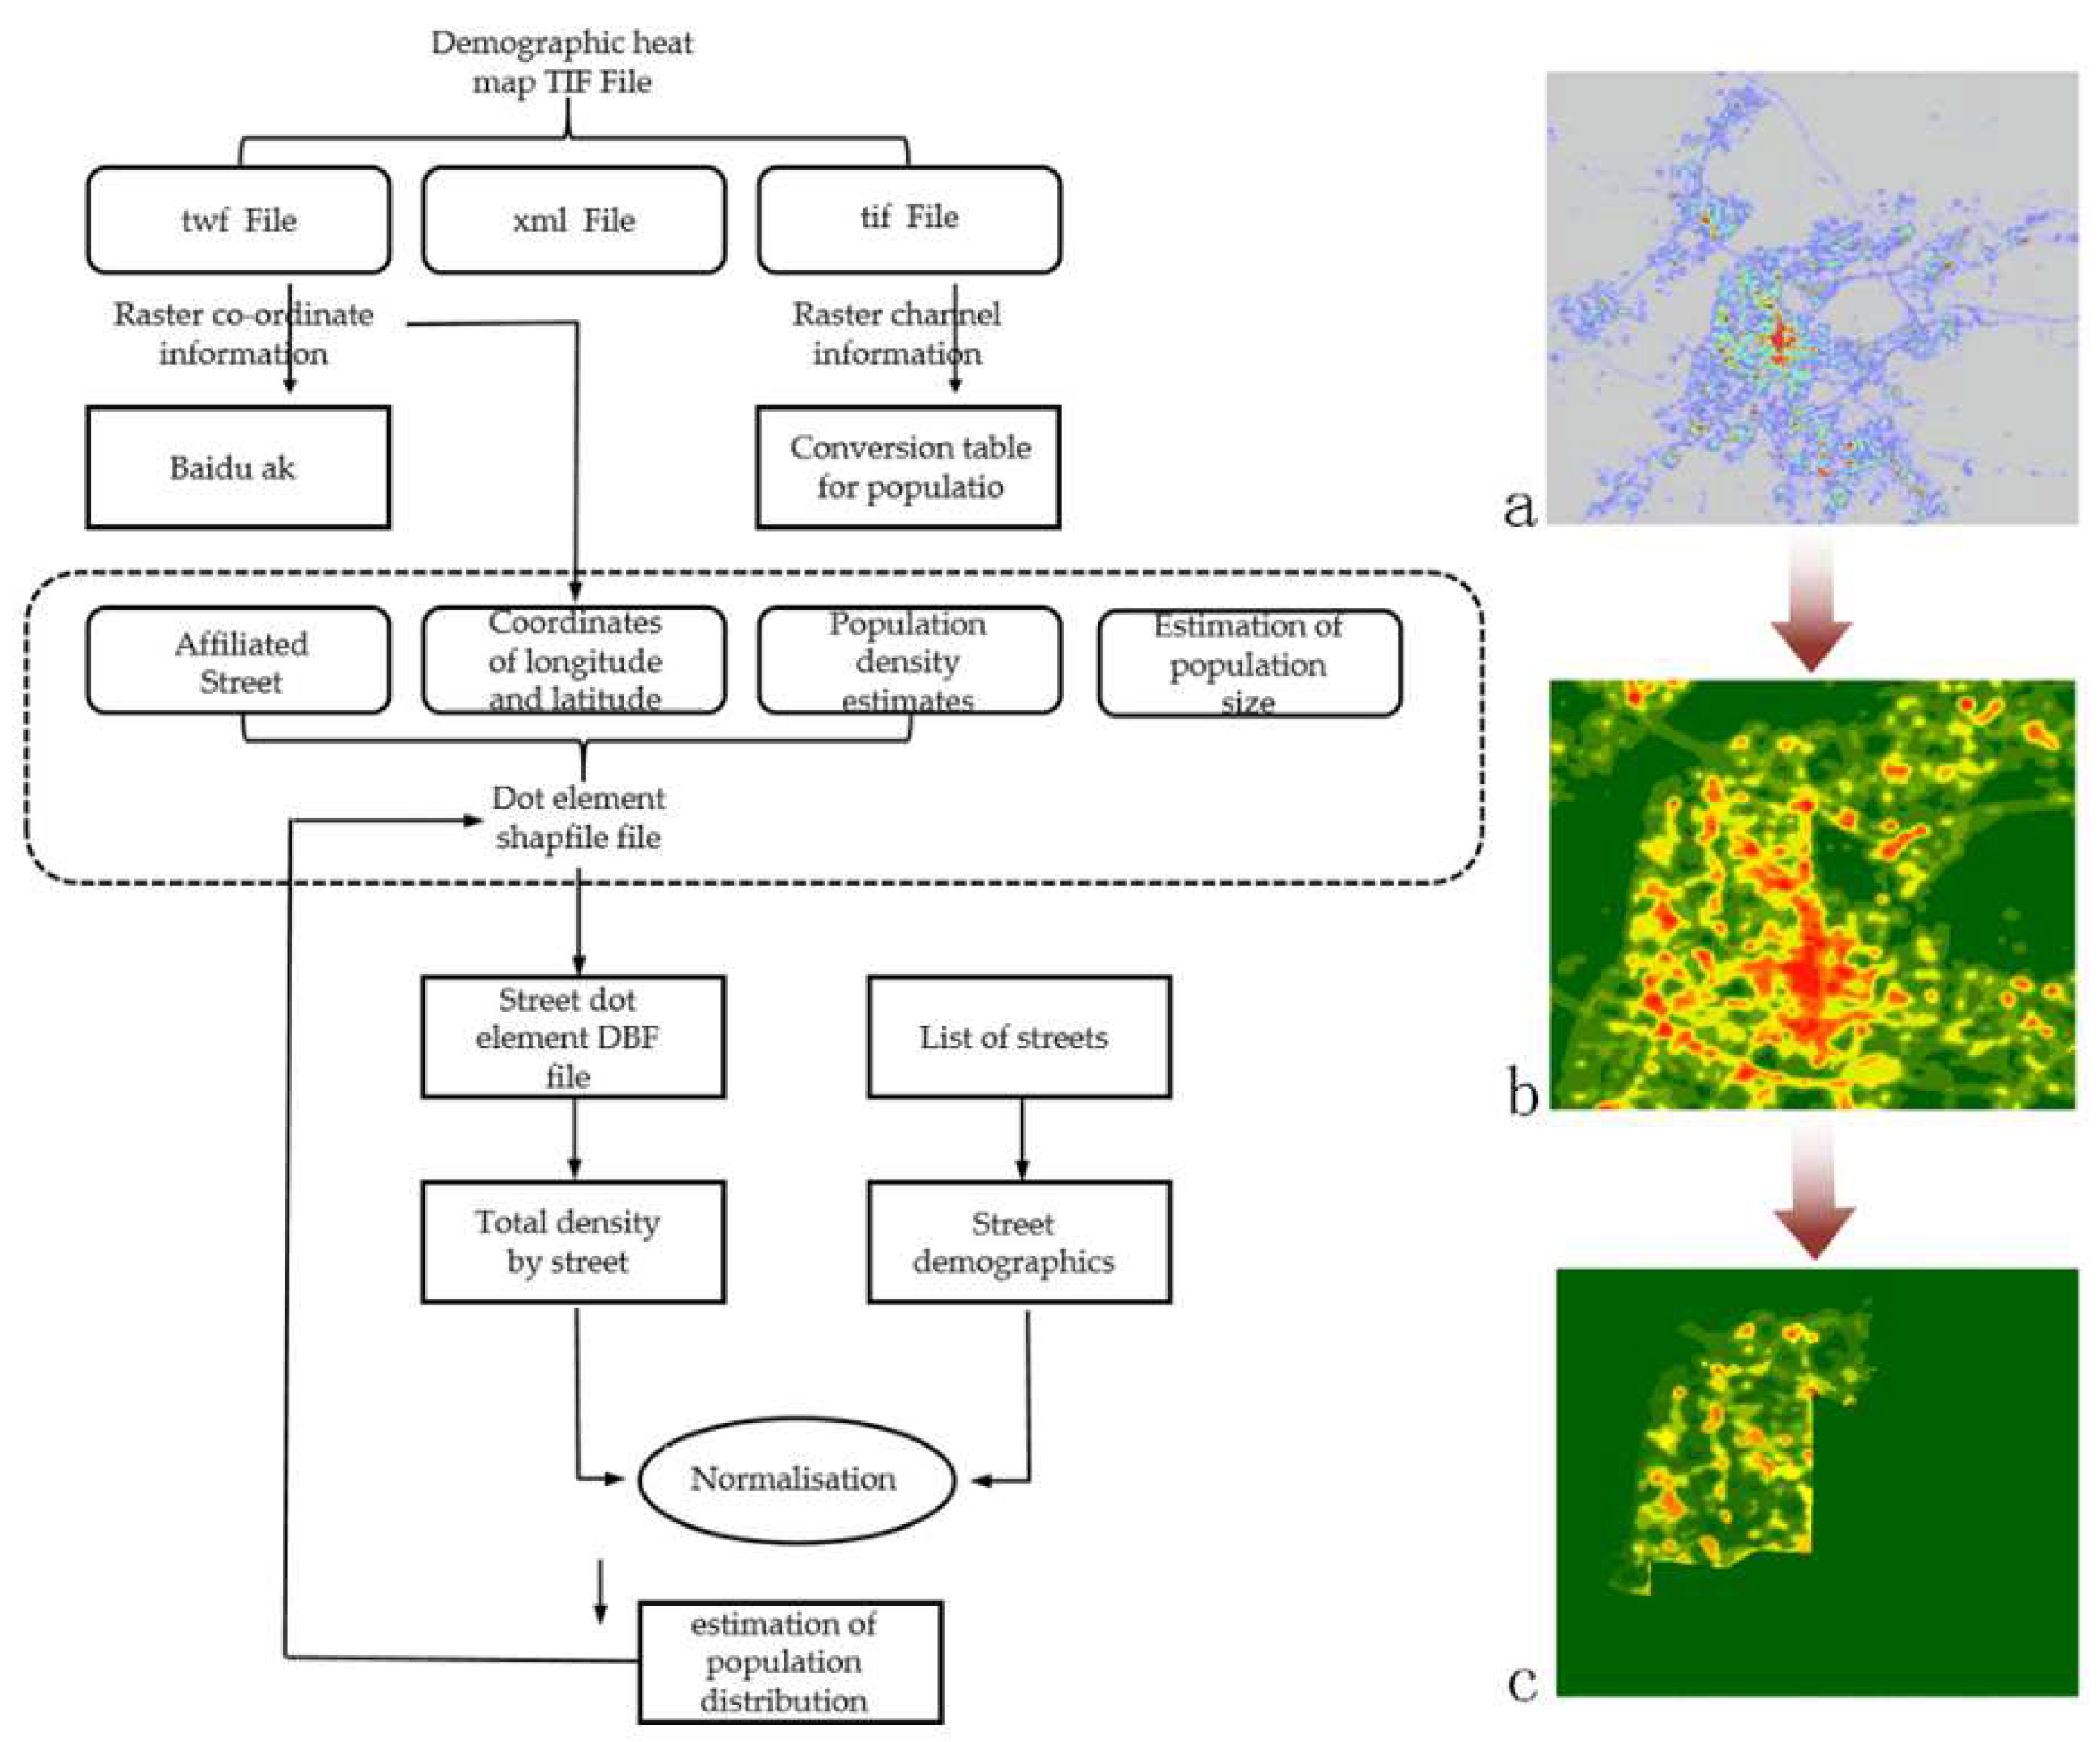
Figure 7.
Visualisation of four green-space provision level indicators in the life cycle.
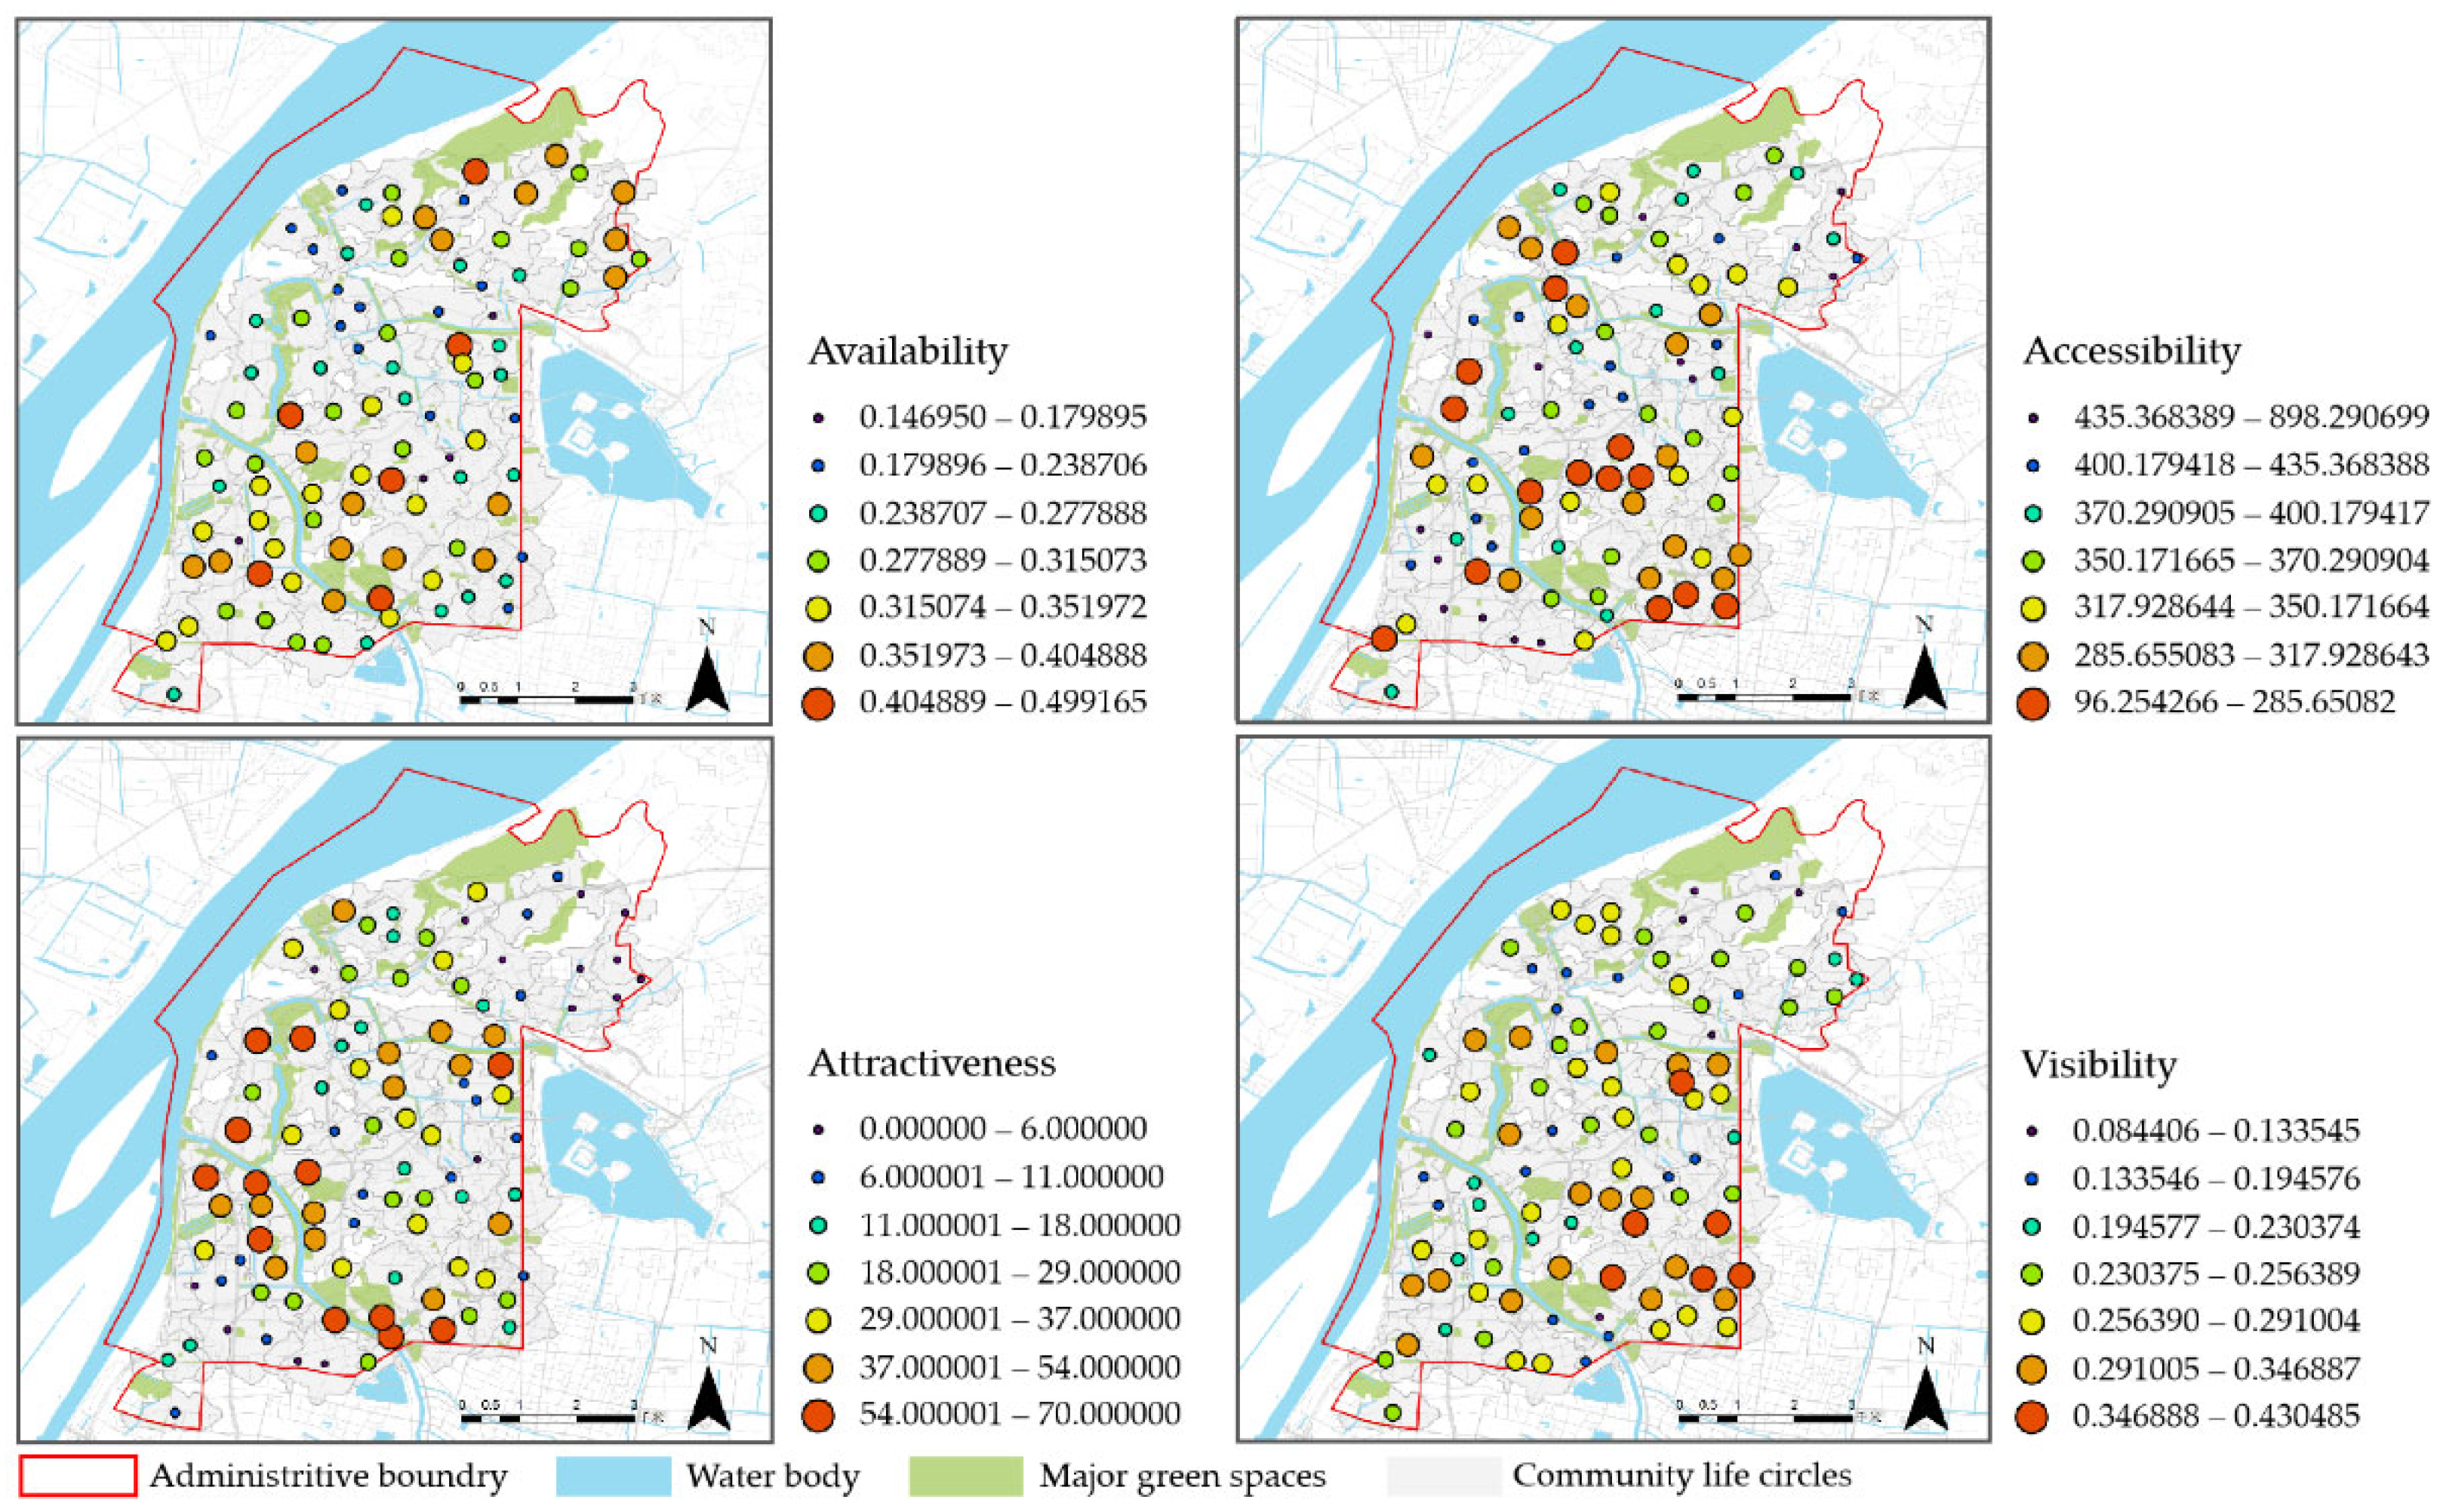
Figure 9.
Lorenz curve and Gini coefficient of green-space services in the life circle.
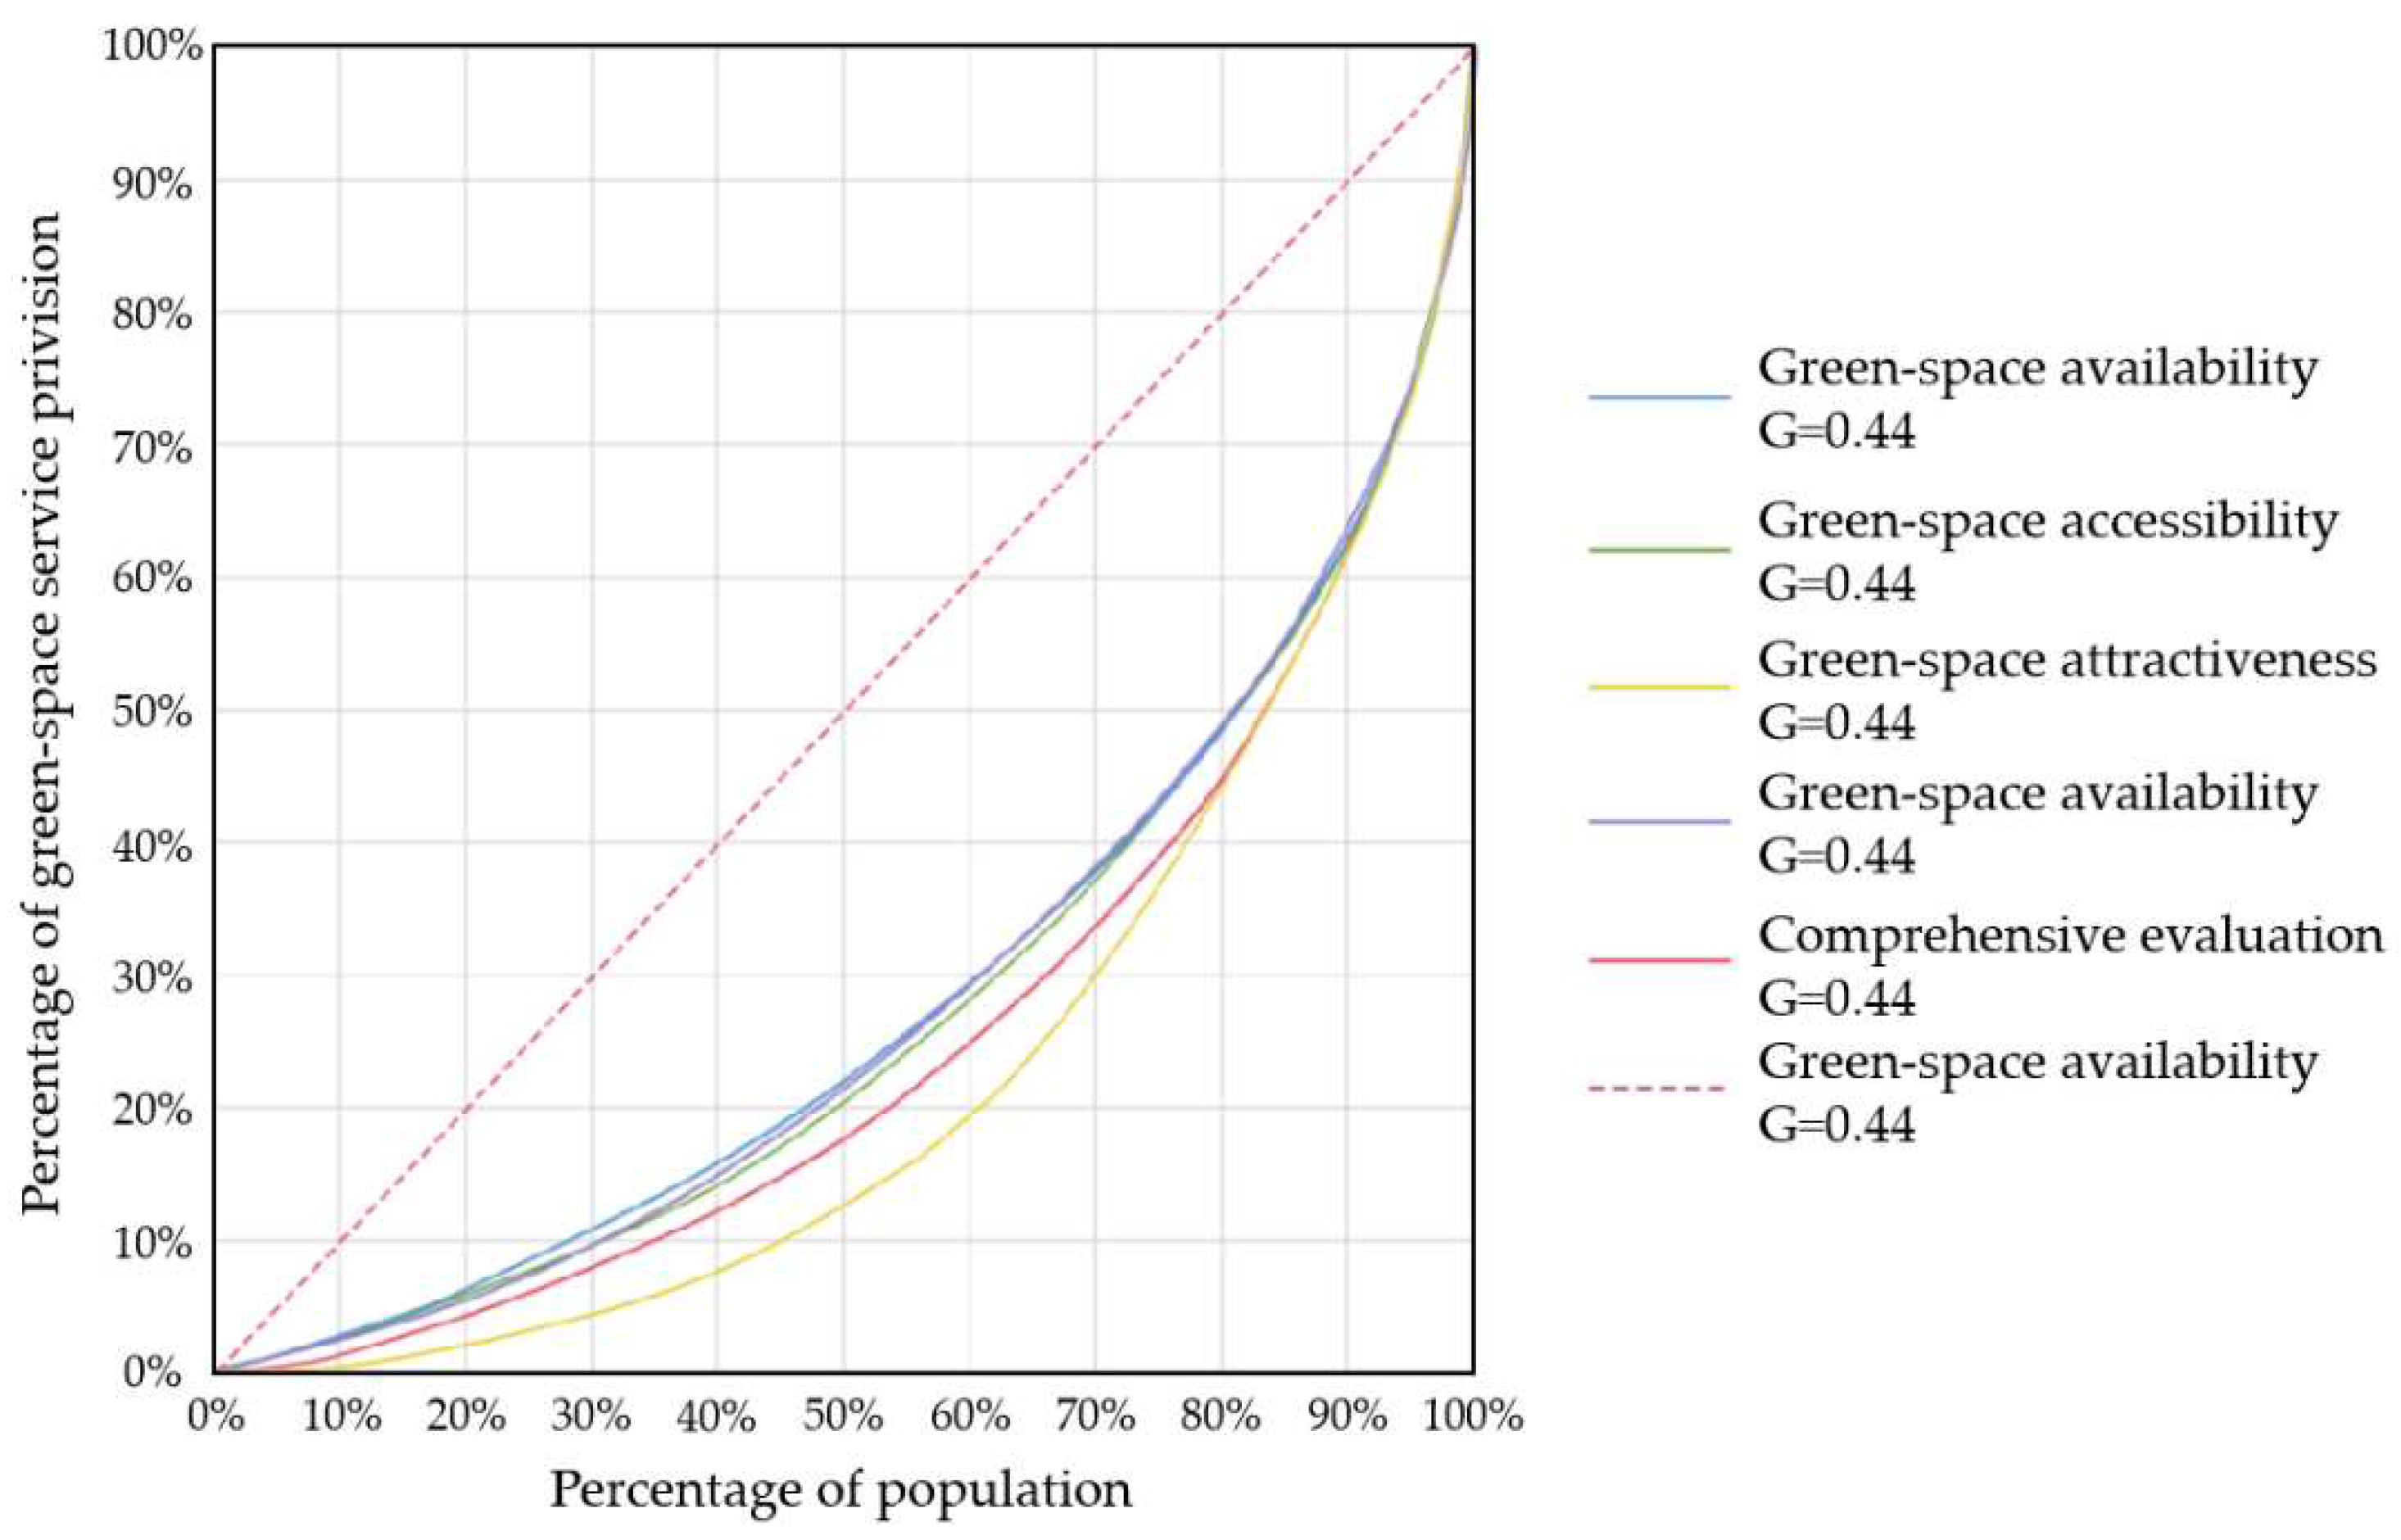
Figure 10.
Schematic diagram of community life circle green-space structural mode.
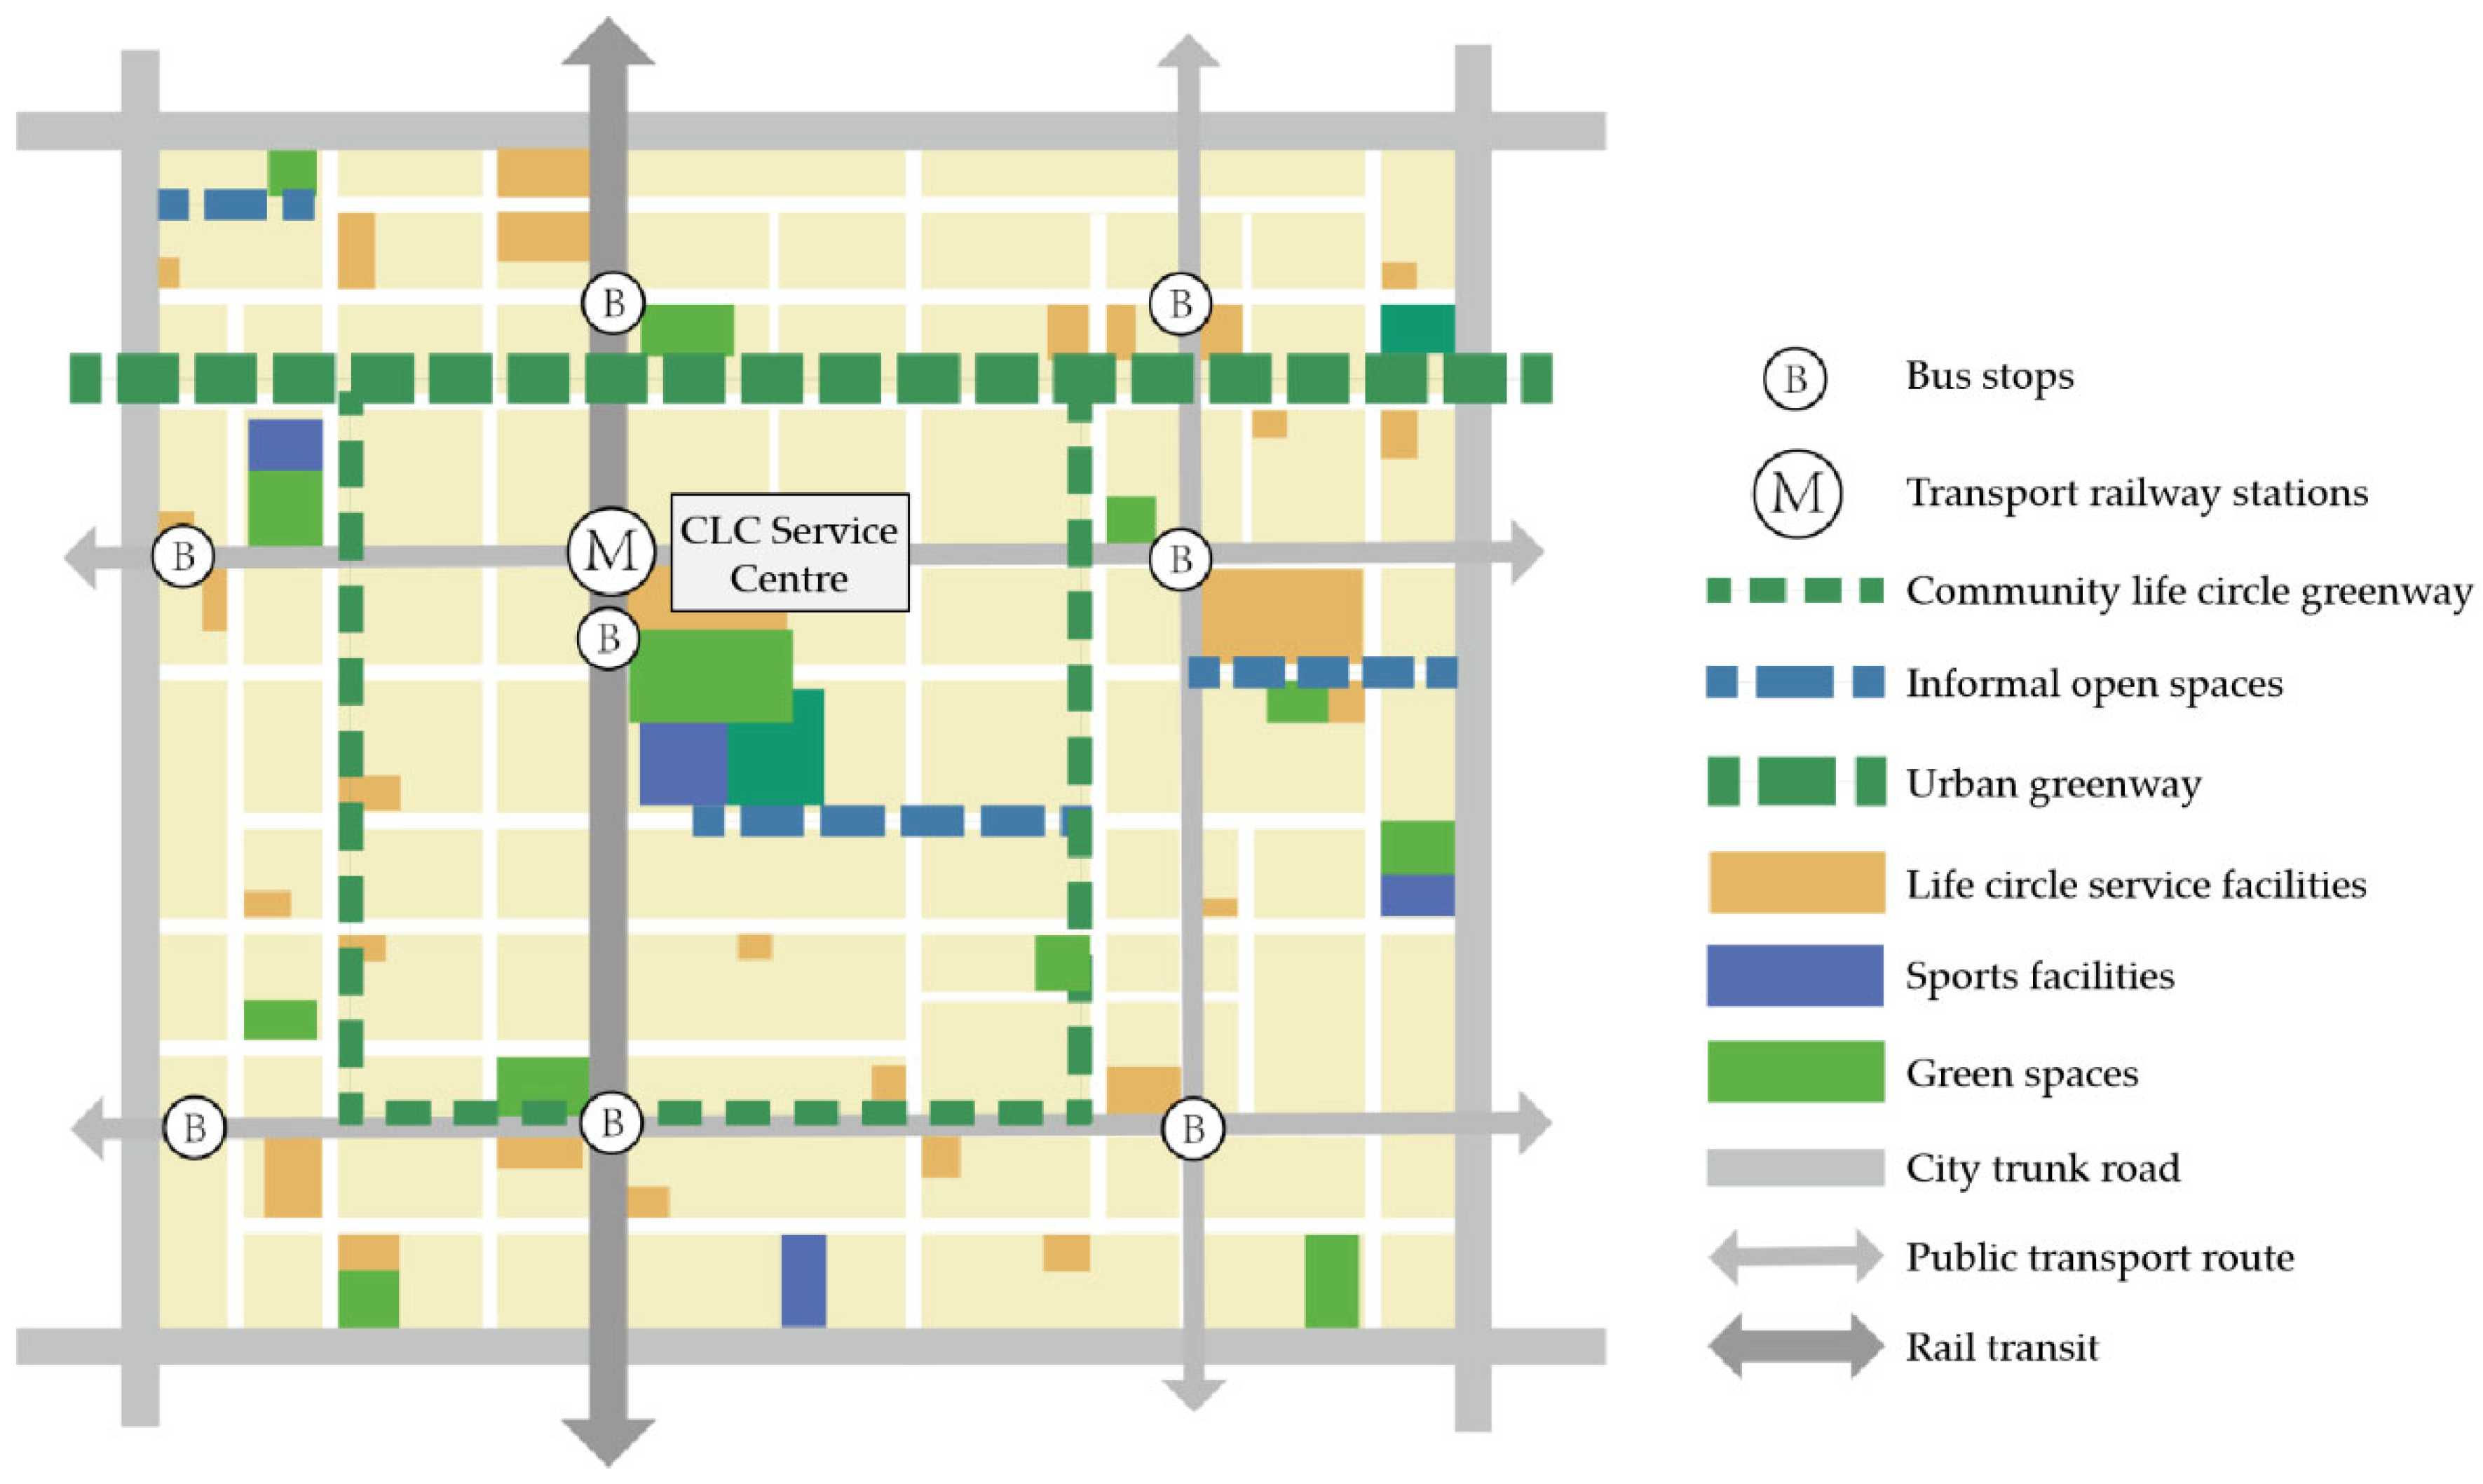

Table 1.
Indicator standardisation for green-space service supply.
| Evaluation indicators | Maximum value | Minimum value | Average value | SD |
|---|---|---|---|---|
| Availability | 2.870914196 | −2.252425872 | 0 | 1 |
| Accessibility | 2.690189554 | −5.251280794 | 0 | 1 |
| Attractiveness | 2.240912603 | −1.320871562 | 0 | 1 |
| Visibility | 2.240912603 | −2.656045737 | 0 | 1 |
| Overall assessment | 1 | −1 | −0.011726195 | 0.400305457 |
Table 2.
Community life circle green‐space service supply rating grading.
| Level | Comprehensive supply level score | Number of life circles | Percentage |
|---|---|---|---|
| Level 1 | −1.000000 to −0.493197 | 14 | 14.29% |
| Level 2 | −0.493196 to −0.165504 | 20 | 20.41% |
| Level 3 | −0.165503 to 0.121058 | 30 | 30.61% |
| Level 4 | 0.121059 to 0.435948 | 22 | 22.45% |
| Level 5 | 0.435949 to 1.000000 | 12 | 12.24% |
Table 3.
Classification of community life circle socioeconomic attributes.
| Level | Average housing price in residential areas | Number of cases | Percentage |
|---|---|---|---|
| Low grade | <32000 Yuan/square | 20 | 20.41% |
| Lower grade | 32000~38000 Yuan/square | 21 | 21.42% |
| Mid grade | 38000~46000 Yuan/square | 24 | 24.49% |
| Higher grade | 46000~52000 Yuan/square | 15 | 15.31% |
| High grade | >52000 Yuan/square | 18 | 20.57% |
Disclaimer/Publisher’s Note: The statements, opinions and data contained in all publications are solely those of the individual author(s) and contributor(s) and not of MDPI and/or the editor(s). MDPI and/or the editor(s) disclaim responsibility for any injury to people or property resulting from any ideas, methods, instructions or products referred to in the content. |
© 2023 by the authors. Licensee MDPI, Basel, Switzerland. This article is an open access article distributed under the terms and conditions of the Creative Commons Attribution (CC BY) license (http://creativecommons.org/licenses/by/4.0/).
Copyright: This open access article is published under a Creative Commons CC BY 4.0 license, which permit the free download, distribution, and reuse, provided that the author and preprint are cited in any reuse.


