
Submitted:
25 November 2023
Posted:
27 November 2023
You are already at the latest version
Abstract
The article explores Qualitative Comparative Analysis (QCA), an approach for establishing causal relationships between conditions and outcomes. QCA, applied in case studies and empirical analyses, facilitates generalizations for future research and addresses causal complexity by identifying various causal "recipes" leading to the same outcome. Three widely used QCA variants are Crisp-Set QCA (csQCA), Multi-value QCA (mvQCA), and Fuzzy-Set QCA (fsQCA), each with unique approaches. The article emphasizes the significance of bibliometric analysis in mapping a research field's intellectual structure, revealing key contributions and trends. In QCA, bibliometric analysis identifies leading researchers, affiliations, and influential countries. Results show QCA's widespread adoption across disciplines, with continuous growth in article production since 2013. The favored variant is fsQCA, followed by csQCA, and China notably contributes to QCA-related research. In conclusion, QCA proves a potent tool for discerning complex causal relationships in empirical studies, with its increasing interdisciplinary use indicating substantial potential for advancing scientific knowledge.
Keywords:
Qualitative Comparative Analysis (QCA)
; Bibliometric Analysis
; Crisp-SetQCA
; Fuzzy-SetQCA
; Multi-valueQCA
1. Introduction
In recent years, Qualitative Comparative Analysis (QCA), a method developed by Charles Ragin, has been widely adopted as an alternative approach to traditional correlation methods in seeking to establish causal relationships related to a particular outcome. QCA uses Boolean or fuzzy logic to analyze empirical data, allowing for the identification of specific combinations of causal conditions that lead to a particular result. This technique has been applied in case studies as well as broader analyses, aiming to generalize results and provide logical propositions to guide future research.
QCA is particularly effective in addressing challenges of complex causality, where different causal “recipes” can lead to the same outcome. In contrast to classical correlational techniques, QCA is based on set theory, making it ideal for examining explicit connections and exploring diverse combinations of causal conditions.
There are three frequently used variants of QCA: Crisp-Set QCA (csQCA), Multi-value QCA (mvQCA), and Fuzzy-Set QCA (fsQCA). Each of these variants presents distinct approaches to categorizing study conditions and offers solutions that need to be interpreted by the researcher.
In this context, bibliometric analysis plays a relevant role in mapping the complex intellectual structure of research in a specific domain. Through quantitative techniques, bibliometric analysis identifies the main contributions of authors, institutions, and countries relevant to the literature of the field under study. The evolution of bibliometric analysis has been driven by the exponential growth of academic research since the advent of the Internet, which facilitated communication among researchers from different parts of the world.
This study employs bibliometric methodology to analyze the scientific production related to Qualitative Comparative Analysis in journals indexed in the Web of Science. Using RStudio and the Bibliometrix package, we aim to explore the distribution and evolution of QCA variants over the period from 2013 to July 2023. Through this detailed analysis, we hope to contribute to a more comprehensive understanding of trends and advances in the application of QCA in academic research.
2. Literature Review
2.1. The method Qualitative Comparative Analysis
In recent years, the adoption of Qualitative Comparative Analysis (QCA), a method advocated by Charles Ragin (1987; 2000; 2008) that utilizes Boolean or fuzzy logic, has been growing, replacing traditional correlation methods to establish causal conditions related to a specific outcome (Ragin and Fiss 2008; Ragin 2000; 2008). In addition to its application in case studies, QCA currently focuses on analyzing empirical data to generalize the analysis, taking into account possible replication in subsequent studies and building logical propositions following both qualitative and quantitative study of the phenomenon under consideration (Brown and Boswell 1995; Ragin 2000; Rihoux and Ragin 2008; Woodside and Zhang 2012).
This method is effective and parsimoniously capable of addressing various challenges, particularly because it is an asymmetric data analysis technique that combines qualitative and quantitative approaches (Ragin 1987).
In contrast to classical correlational techniques, QCA is based on set theory and is, therefore, ideal for studying explicit connections. An especially useful feature of QCA is its ability to analyze complex causality, defined as a situation where an outcome may result from various different combinations of causal conditions, or different “causal recipes.” For example, a researcher may have good reason to suspect that there are multiple different recipes for the consolidation of third-wave democracies. By examining the fate of cases with different configurations of causally relevant conditions, it is possible, using QCA, to identify the decisive recipes and thus unravel causal complexity (Ragin 1987; 2000; 2008; Rihoux and Ragin 2008; Cotte and Martinez 2013; Cooper and Glaesser 2016; Selcuk and Cizel 2023; Glaesser 2023).
The main tool for analyzing causal complexity using QCA is the truth table (Ragin 1987; 2000; 2008), a tool that allows for structured and focused comparisons. Truth tables list the logically possible combinations of causal conditions and the associated empirical outcome for each configuration. In more complex analyses, the rows (representing combinations of causal conditions) can be quite numerous, as the number of causal combinations is an exponential function of the number of causal conditions (number of causal combinations = 2^k, where k is the number of causal conditions).
However, the use of truth tables to unravel causal complexity is described in detail elsewhere (Ragin 1987; 2000; 2008; De Meur and Rihoux 2002).
According to Ragin (2008), the key point is that the truth table elaborates and formalizes one of the main analytical strategies of comparative research—examining cases that share specific combinations of causal conditions to see if they yield the same outcome. In fact, the primary aim of truth table analysis is to identify explicit connections between combinations of causal conditions and outcomes. By listing the different logically possible combinations of conditions, it becomes possible to assess not only the sufficiency of a specific recipe but also the sufficiency of other logically possible combinations of conditions that can be constructed from these causal conditions.
Currently, QCA has three frequently used variants: Crisp-Set QCA (csQCA), Multi-value QCA (mvQCA), and Fuzzy-Set QCA (fsQCA) (Kiser 2001; Rihoux 2006; Ragin 2008; Schneider and Wagemann 2012; Lassala et al. 2014; Finn 2022). The difference between the various forms lies in how to score (i.e., categorize) the concepts of interest. Below, we will briefly outline these variants of the method.
2.2. The csQCA variant: An overview
CsQCA, as a method, is grounded in the binary logic of Boolean algebra. Each case is represented as a combination of causal conditions and an outcome. The fundamental concept is that cases can be designated through formal logical statements, wherein the independent variables (conditions) for each case, in combination, are seen as logically implying the dependent outcome variable for that case. These combinations can be contrasted with one another and then logically simplified through an upward process of pairwise comparison (Ragin, 1987; 2000).
The propensity of csQCA to uncover certain types of complex causal structures is an advantage only if there are strong theoretical reasons to believe that the phenomenon under study is driven by such causal structure. No method is superior on its own. On the contrary, its utility is determined by its suitability to the research problem at hand (Rihoux and Ragin 2008; Wagemann and Schneider, 2010; Cotte and Martinez 2013).
According to Ragin (1987), the first step in csQCA is to specify the significant causal conditions for the outcome variable. The next step is to construct a truth table with data for selected cases concerning the causal conditions and the outcome variable. Truth tables list the logically possible combinations of conditions and the associated outcome for each combination. Additionally, a truth table elaborates and formalizes the process of examining the cases.
Next, the analysis of the truth table itself enables certain types of analyses. This allows for a study of diversity, showing which configurations are common and which do not occur or occur very rarely. The second step, the analysis of causal sufficiency, which is referred to as the truth table solution (Ragin 1987), is a list of different combinations of causal factors that meet specific criteria of sufficiency for the occurrence of the outcome. This involves the relevance score of the outcome consistently being higher than the relevance score of the causal combination. The truth table algorithm takes into account both the degree of inconsistency and the notion that cases with strong relevance to the causal condition or causal combination provide the most relevant cases (Ragin 1987; 2000; 2008; Rihoux and Ragin 2008).
2.3. The fsQCA variant: An overview
Fuzzy sets are simultaneously qualitative and quantitative as they incorporate both types of distinctions in calibrating the degree of membership in the set. Therefore, fuzzy sets have many of the virtues of conventional interval and ratio scale variables, while at the same time allowing for a qualitative assessment (Ragin 2008; Rihoux and Ragin 2008).
A fuzzy set can be seen as a continuous variable that has been purposely calibrated to indicate the degree of membership in a well-defined and specified set. This calibration is only possible through the use of theoretical and substantive knowledge, essential for specifying three or more qualitative breakpoints. By using fuzzy sets to assess theoretical set relations, both the outcome and causal conditions can be represented in terms of membership scores. In calibration, all factors are transformed into fuzzy sets with a range of values from 0 to 1. This can be done directly or indirectly, based on data and underlying theory. In the direct form, three qualitative thresholds (or breakpoints) are chosen, while in the indirect form, factors are calibrated based on qualitative assessments. The thresholds define full membership, full non-membership, and intermediate membership, representing the degree to which a case belongs to a set (Ragin 2000; 2006; 2008; Rihoux and Ragin 2008; Fiss 2011; Woodside 2014; Jang et al. 2015).
Next, fsQCA produces a truth table with 2^k rows (k being the number of predictors, and each row representing every possible combination), which is ranked based on frequency (i.e., the number of observations for each combination) and consistency (i.e., “the degree to which cases match the set-theoretic relations expressed in a solution”). To obtain a minimum number of observations for evaluating the relationships, a frequency threshold is set. Additionally, the consistency threshold is set above the recommended cut-off of 0.85 (Ragin 2008). Combinations above the consistency threshold are those that fully explain the outcome, meaning for these combinations, the outcome variable is defined as 1, and for the rest, it is defined as 0. fsQCA offers three sets of solutions (complex, parsimonious, intermediate) that need to be interpreted by the researcher. The complex solution presents all combinations of conditions when logical operations are applied and are then simplified into parsimonious as well as intermediate solutions, as they are more straightforward to interpret (Ragin 2006; 2008; Fiss, 2011).
2.4. The mvQCA variant: An overview
This variant was introduced by Lasse Cronqvist, where the premise is essentially that crisp sets with more than two categories can be used (Cronqvist 2003; Cronqvist and Berg-Schlosser 2009; Glaesser 2022). Originally developed for use with small and medium-sized samples, however, mvQCA has been applied effectively to large samples as well (Cooper 2005; Glaesser and Cooper 2011; Ragin 2006; Ragin and Fiss 2017). As previously expressed, the main qualities of QCA are that it allows the researcher to analyze systematically complex connections between factors, enabling multiple pathways to the outcome, and investigating the effects of factor combinations. However, the mvQCA variant is applied when the phenomenon presents the possibility of being interpreted or configured into two or more categories, therefore neither csQCA nor fsQCA are suitable for such a situation. Moreover, its use is ideal when calibration, as recommended by fsQCA, is also not possible. In some studies, the decision to calibrate may affect the result, whereas the categories used in mvQCA have substantive meanings that are directly interpretable (Cronqvist 2003).
The main analytical steps of the mvQCA procedure are similar to the main steps of other QCA variants (Cronqvist 2003; Cronqvist and Berg-Schlosser 2009; Hossu et al. 2019). Firstly, the researcher must construct a data table where each case is assigned a value for the conditions and the outcome (Cronqvist 2003; Cronqvist and Berg-Schlosser 2009). The main difference between mvQCA and other QCA variants lies in the possibility of allowing conditions with multiple values. In mvQCA, each category is represented by a natural number (0, 1, 2, 3...) (Cronqvist 2003; Cronqvist and Berg-Schlosser 2009; Li et al. 2023). For example, a traffic light can be transformed into a multi-value condition by assigning the value 2 to cases where the traffic light was green, the value 1 if it was orange, and the value 0 if it was red. In contrast, csQCA only allows assigning a value of 1 or 0, indicating whether a condition is present or absent, respectively. On the other hand, fsQCA allows any possible value between 1 and 0. However, these values represent the degree to which a single category is present in a specific case, not whether a specific category of a condition is present (Ragin 2000; 2006; 2008; Rihoux and Ragin 2008).
2.5. The relevance of bibliometrics
Bibliometric analysis is a tool that has been used for several decades, understood as the application of statistical and mathematical methods to define processes of written communication and the nature and development of scientific disciplines using techniques of recounting and analyzing such communication (Pritchard 1969). According to Hawkins (1977), bibliometric analysis has been defined as the application and use of quantitative methodologies to an existing set of information. Bibliometric analyses seek to study the academic body of knowledge in a particular domain through the application of quantitative techniques (Hall 2011; Punjani et al. 2023). The purpose of bibliometric analysis is to identify the significant contributions of relevant authors to the body of literature related to the subject matter, both in terms of the quantity and quality of research articles in the area. These analyses also assess the key countries contributing to the topic, based on the number of articles produced by authors from each country, as well as the number of citations received. Furthermore, academic institutions and other entities playing a significant role in domain research are also examined through the application of bibliometric techniques (Benders et al. 2007; Herrera and Gomez 2008; Kronegger 2011; Franceschini and Maisano 2012; Yang and Jung 2014; Khaldi and Prado-Gascó 2021). Since the advent of the Internet, the field has experienced rapid growth, driven by the ease of communication among researchers from different parts of the world and faster access to contributions related to a specific field (Rejeb et al. 2022; Amini et al. 2022; Kwon 2022).
Bibliometric analysis plays a crucial role in meticulously mapping the complex intellectual structure of research in a particular domain. By conducting this in-depth mapping, it not only reveals key themes related to the vast knowledge accumulated in a specific field but also enables a comprehensive understanding of the connections and interactions among different areas of study (Franceschini and Maisano 2012; Yang and Jung 2014; Kumar et al., 2020; Punjani et al. 2023). Based on this detailed analysis, it is possible to discern promising directions for future investigations and innovative contributions to scientific knowledge. This data-driven, strategic approach empowers researchers and scholars to focus their efforts on areas of greater relevance and potential impact, thereby expanding the landscape of ever-evolving academic and scientific progress (Hall 2011; Kwon 2022; Punjani et al. 2023).
3. Materials and Methods
This study applies the bibliometric method to provide several advantages, such as a structural analysis of past literature over a period, identifying changes in disciplinary boundaries, and detecting the most prolific scholars and institutions (Biju et al. 2023; Jung et al. 2015). For data collection, the Web of Science, one of the most extensive databases of peer-reviewed literature indexing and abstracts, was used. Data collection in the Web of Science database took place between July 10th and July 12th, 2023. The data were searched in the advanced search box by selecting field tags (TS = Topic). The following search queries were involved in the Web of Science database:
- TS = (“Fuzzy-set qualitative comparative analysis” AND “fsQCA” OR “fsQCA”)
- TS = (“Crisp-set qualitative comparative analysis” AND “csQCA” OR “csQCA”)
- TS = (“Multi-value qualitative comparative analysis” AND “mvQCA” OR “mvQCA”)
- Refined by: [including only the years 2013, 2014, 2015, 2016, 2017, 2018, 2019, 2020, 2021, 2022, and 2023]
- Further refined by (including only) document types: (articles)
Following these criteria, a total of 1,555 documents were indexed in the Web of Science database from 2013 to July 2023. Among the 1,555 publications, Fuzzy-set qualitative comparative analysis or fsQCA contributed to 1,479 publications, Crisp-set qualitative comparative analysis or csQCA contributed to 60 publications, and Multi-value qualitative comparative analysis or mvQCA contributed to 16 publications, as shown in Table 1. The selected research data were downloaded in plain text file format. These data were analyzed using RStudio v.4.3.1 software and the Bibliometrix package (Aria and Cuccurullo 2017). Visual refinements were made to the tables and some graphs using Microsoft Excel.
4. Results and discussion
For the analysis of the information collected through the Web of Science database, we chose to employ the advanced and powerful functionalities of RStudio v.4.3.1, using the Bibliometrix package (Aria and Cuccurullo 2017), a specialized tool in bibliometrics. This choice is due to its robustness and ability to extract profound insights from bibliometric data, providing a detailed and comprehensive view of the scientific landscape under study.
Furthermore, to make the analysis process more accessible and efficient, we utilized the Biblioshiny interface, which offers a user-friendly and interactive experience. This interface makes exploring the results more intuitive, allowing for the visualization and interpretation of bibliometric data in a more dynamic and interactive manner (Aria and Cuccurullo 2017).
4.1. Overview
4.1.1. Annual Scientific Production
The Web of Science has recorded 1,555 articles produced using the QCA methodology between the years 2013 and July 2023. Figure 1 shows two peaks of production growth: the first starting in 2013 and declining abruptly by 2016. Subsequently, a second peak of growth is identified from 2017 to 2022. However, since the data was computed until July 2023, it is not possible to assert whether there was a regression in the evolution of the methodology’s usage. Nevertheless, by observing Table 2, it is evident that since 2017, the average number of articles published monthly has been increasing, particularly during the years 2020 to 2023, where significant increases in the monthly average of published articles are notable. This trend could possibly be associated with the Covid pandemic, which may have facilitated the increased usage of tools like QCA due to the limitations imposed in different global contexts.
4.1.2. Three-Field Plot
The Three-Field Plot is a graphical representation used in bibliometric analysis to visualize the relationships among three different dimensions of a bibliometric dataset. The two-dimensional graphical representation shown in Figure 2 employs symbols and colors to visualize the interactions and associations among the three dimensions. Each axis of the plot corresponds to a dimension (references—CR, authors—AU, and keywords—DE), and the symbols on the plot represent different intensities and relationships within each dimension. Along the first axis (CR), it can be observed that Charles Ragin, with his major bibliographic works, has a significant impact on authors with higher publication output, who mostly utilized the fsQCA variant in their respective studies. This fact is visibly evident when examining the third axis (DE), where references to fsQCA are highly intense and frequent.
4.1.3. Sources
Figure 3 and Figure 4 present two relevant pieces of information about the journals that disseminate QCA in different fields of knowledge. It is evident that there is extensive utilization of this methodology in the business research area, as both the quantity of publications and the high impact factor measured by the H-index demonstrate consistent usage of this method in the field of business research. However, in Figure 5, the graph generated by the Bradford’s Law methodology shows the sources of information grouped in a concentric zone, where this rectangle represents the cluster containing the major journals or most relevant sources.
Finally, by Bradford’s Law, as shown in Figure 5, it is possible to identify the most important and relevant sources in this field. For the purposes of selection and acquisition of scientific literature, it becomes a valuable tool as the journals included in the rectangle allow one to extract a relevant state-of-the-art.
4.1.4. Authors
Figure 6 displays the top 15 authors with the highest productivity considering the chosen time interval for the analysis. It is noticeable that within a universe of 1555 articles produced in this time span, there were researchers who managed to produce more than 1 article per year, applying QCA as their methodology. This fact may indicate that despite being relatively new, introduced by Ragin (1987) in the late 1980s, the methodology is widely used by various researchers.
Figure 7 presents Lotka’s Law, a principle used in bibliometrics that describes the distribution of author productivity in a specific field. This law was proposed by mathematician and librarian Alfred Lotka in 1926 and is frequently applied to analyze the scientific output of authors in various areas of knowledge (Lotka 1926; Corbet et al. 2019). In Figure 7, it is evident that few authors are highly productive and publish many works, while the majority of authors are less productive and publish fewer works. This allows us to infer that productive authors, in this time interval, are those with approximately 20 published works; however, QCA is already widely utilized by a diverse range of researchers.
4.1.5. Affiliations and Countries’ Scientific Production
Figure 8 displays the top 10 universities with the most researchers utilizing QCA. It can be observed that there is a predominance of European and Asian institutions, a fact corroborated in Figure 9, which shows the article production by country. In this latter figure, the gray color represents no production, while the stronger shades of blue represent higher productivity, with notable emphasis on article production from China. Within the time interval considered in this study, only this Asian economic powerhouse contributed to more than 1000 articles. Another relevant and visibly notable aspect in Figure 9 is related to the diffusion of the QCA methodology in various countries and across all continents. It can be observed that the methodology is minimally present in various parts of the world.
4.1.6. Most global and local cited papers and references
Figure 10 displays the top 10 most cited articles within the universe of 1555 articles published between the years 2013 to July 2023. The standout article is the work by Arch Woodside, published in 2013, where he questions the dominant logic in the area of business research, which predominantly employs multiple regression analysis (MRA) to analyze various themes such as testing theories in accounting, consumer research, finance, management, and marketing. In this work, he introduces fsQCA as an alternative tool for theory development and data analysis (Woodside 2013). This article has been cited 1085 times in relation to the 1555 published articles. This allows us to infer that, in the field of business research, Woodside’s article holds immense relevance and can be labeled as a seminal work for the subject matter.
Figure 11 displays the top 10 most cited references within the universe of 1555 articles. However, authors such as Ragin (1987; 2000; 2006; 2008) and Fiss (2007; 2011) emerge as the prominent figures. When combining the works of Charles Ragin, they appear in 1551 articles, and Peer Fiss’s works appear in 1227 articles. Ragin (1987; 2000; 2006; 2008) gains more notoriety, as his works are present in 99% of the published articles on QCA. Nevertheless, Fiss (2007; 2011) is not far behind in significance, as his works serve as references in 79% of the articles. Thus, to apply the methodology, it is essential to be acquainted with the works of these authors.
4.1.7. Word Bibliometry
Figure 12 displays the top 10 most frequent words in the articles. The words “performance” and “impact” appear prominently. In the word cloud presented in Figure 13, the most frequent words in the text are shown in a larger size, while less frequent words are displayed in a smaller size. The arrangement of words is random and presents an aesthetic aspect defined by the Bibliometrix software, making the visualization more appealing. However, in contrast to Figure 12, not only the top 10 most frequent words are shown, but also the main topics or themes addressed in the articles, with emphasis on the words “model,” “performance,” “impact,” “innovation,” “management,” “firm performance,” “business,” and “governance.”.
Figure 14 shows the TreeMap where data can be visualized hierarchically in the form of rectangles organized in a tree-like structure. This technique was chosen for its ability to efficiently and clearly represent large amounts of data. The size of the rectangle is proportional to the value of the metric being visualized. The rectangles are organized into columns, and each column represents a hierarchical level of the data. In the first column, it is possible to identify that the words “word,” “impact,” and “qualitative comparative analysis” are thematically highly relevant in the majority of the articles within the analyzed sample universe.
5. Conclusions
In conclusion, Qualitative Comparative Analysis (QCA) has emerged in recent years as a data analysis method that employs boolean or fuzzy logic to establish causal conditions related to a specific outcome. Replacing traditional correlation methods, QCA enables a complex causality analysis, identifying different causal “recipes” for the same outcome.
The truth tables approach is a fundamental tool in analyzing causal complexity using QCA. These tables list the logically possible combinations of causal conditions and the empirical outcomes associated with each configuration, allowing for a systematic and focused analysis.
QCA methodology has three frequently used variants: Crisp-Set QCA (csQCA), Multi-value QCA (mvQCA), and Fuzzy-Set QCA (fsQCA). Each variant has specific characteristics and is suitable for different research situations, depending on the type of data and the nature of causal conditions.
In this study, we employed a bibliometric analysis methodology based on the Web of Science database to investigate the scientific production related to the Qualitative Comparative Analysis (QCA) methodology from 2013 to July 2023. We chose to use the RStudio v.4.3.1 program with the Bibliometrix package to extract deep insights from bibliometric data, providing a detailed and comprehensive view of the scientific landscape under study.
The results revealed some significant trends in scientific production related to the use of QCA. Two growth peaks in production were observed, the first from 2013 to 2016, followed by a second growth peak from 2017 to 2022. The monthly average of published articles also showed a significant increase since 2017, possibly influenced by the Covid pandemic, which led to a higher utilization of tools like QCA in different global contexts.
The Three-Field Plot allowed us to visualize interactions between references, authors, and keywords, highlighting the influence of Charles Ragin and his work in research using the fsQCA variant. Additionally, Peer Fiss stood out along with Charles Ragin as main references in the field. Moreover, the analysis of sources revealed that the QCA methodology is widely used in business research, with significant scientific production in China, but other fields also stood out as users of the methodology.
Furthermore, the analysis of authors revealed that some researchers were able to produce more than one article per year using QCA, suggesting that the methodology is widely adopted by various researchers. The application of Lotka’s Law showed that few authors are highly productive and publish many works, while the majority is less productive.
Regarding keywords, the words “performance” and “impact” stood out, reflecting their relevance in research using QCA. The main themes addressed in the articles include modeling, performance, impact, innovation, management, organizational performance, business, and governance.
These findings provide valuable insights into the dissemination and use of QCA methodology in the scientific community. This study can serve as a foundation for researchers interested in further exploring the applications and trends of QCA in their respective fields of study. In summary, QCA has established itself as an effective and parsimonious approach to address the challenges of asymmetric data analysis, combining qualitative and quantitative approaches. Its application spans diverse areas of knowledge, contributing to the advancement of scientific knowledge and understanding of complex phenomena. With the continuous growth of scientific production related to QCA, it is expected that its impact and relevance in academic research will continue to increase in the coming years.
References
- Farsani, M.A.; Babaii, E.; Beikmohammadi, M.; Farsani, M.B. Mixed-methods research proficiency for applied linguists: a PLS-path modelling approach. Qual. Quant. 2022, 56, 3337–3362. [Google Scholar] [CrossRef]
- Aria, M.; Cuccurullo, C. bibliometrix: An R-tool for comprehensive science mapping analysis. J. Informetr. 2017, 11, 959–975. [Google Scholar] [CrossRef]
- Benders, J.; Nijholt, J.; Heusinkveld, S. Using Print Media Indicators in Management Fashion Research. Qual. Quant. 2007, 41, 815–829. [Google Scholar] [CrossRef]
- Biju, A.K.V.N.; Thomas, A.S.; Thasneem, J. Examining the research taxonomy of artificial intelligence, deep learning & machine learning in the financial sphere—a bibliometric analysis. Qual. Quant. 2023, 58, 849–878. [Google Scholar] [CrossRef]
- Brown, C.; Boswell, T. Strikebreaking or Solidarity in the Great Steel Strike of 1919: A Split Labor Market, Game-Theoretic, and QCA Analysis. Am. J. Sociol. 1995, 100, 1479–1519. [Google Scholar] [CrossRef]
- Corbet, S.; Dowling, M.; Gao, X.; Huang, S.; Lucey, B.; Vigne, S.A. An analysis of the intellectual structure of research on the financial economics of precious metals. Resour. Policy 2019, 63, 101416. [Google Scholar] [CrossRef]
- Poveda, A.C.; Martínez, C.I.P. Qualitative comparative analysis (QCA): an application for the industry. Qual. Quant. 2013, 47, 1315–1321. [Google Scholar] [CrossRef]
- Cooper, B. Applying Ragin's Crisp and Fuzzy Set QCA to Large Datasets: Social Class and Educational Achievement in the National Child Development Study. Sociol. Res. Online 2005, 10, 1–20. [Google Scholar] [CrossRef]
- Cooper, B.; Glaesser, J. Analysing necessity and sufficiency with Qualitative Comparative Analysis: how do results vary as case weights change? Qual. Quant. 2016, 50, 327–346. [Google Scholar] [CrossRef]
- Cronqvist, L. (2003): Presentation of TOSMANA. Paper presented at the COMPASSS Launching Conference, Louvain-La-Neuve and Leuven.
- Cronqvist, L., Berg-Schlosser, D. Multi-value QCA (mvQCA). In: Rihoux, B., Ragin, C.C. (eds.) Configurational comparative methods. Qualitative Comparative Analysis (QCA) and related techniques. pp. 69–86. Sage, Thousand Oaks, CA (2009).
- De Meur, Gisèle and Benoît Rihoux. L’Analyse Quali-Quantitative Comparée: Approche, Techniques et applications en sciences humaines. Louvain-la-Neuve: Bruylant-Academia (2002).
- Finn, V. A qualitative assessment of QCA: method stretching in large-N studies and temporality. Qual. Quant. 2022, 56, 3815–3830. [Google Scholar] [CrossRef]
- Fiss, P.C. A set-theoretic approach to organizational configurations. Acad. Manag. Rev. 2007, 32, 1180–1198. [Google Scholar] [CrossRef]
- Fiss, P.C. Building Better Causal Theories: A Fuzzy Set Approach to Typologies in Organization Research. Acad. Manag. J. 2011, 54, 393–420. [Google Scholar] [CrossRef]
- Kiser, E. Fuzzy-Set Social Science. By Charles C. Ragin. Chicago: University of Chicago Press. Am. J. Sociol. 2001, 106, 1486–1487. [Google Scholar] [CrossRef]
- Franceschini, F.; Maisano, D. Quality & Quantity journal: a bibliometric snapshot. Qual. Quant. 2012, 46, 573–580. [Google Scholar] [CrossRef]
- Glaesser, J.; Cooper, B. Selectivity and Flexibility in the German Secondary School System: A Configurational Analysis of Recent Data from the German Socio-Economic Panel. Eur. Sociol. Rev. 2011, 27, 570–585. [Google Scholar] [CrossRef]
- Glaesser, J. Relative educational poverty: conceptual and empirical issues. Qual. Quant. 2022, 56, 2803–2820. [Google Scholar] [CrossRef]
- Glaesser, J. Limited diversity and QCA solution types: assumptions and their consequences. Qual. Quant. 2023, 57, 3485–3497. [Google Scholar] [CrossRef]
- Hall, C.M. Publish and perish? Bibliometric analysis, journal ranking and the assessment of research quality in tourism. Tour. Manag. 2011, 32, 16–27. [Google Scholar] [CrossRef]
- Hawkins, D.T. Unconventional uses of on-line information retrieval systems: On-line bibliometric studies. J. Am. Soc. Inf. Sci. 1977, 28, 13–18. [Google Scholar] [CrossRef]
- Herrera, A.-N.; Gómez, J. Influence of equal or unequal comparison group sample sizes on the detection of differential item functioning using the Mantel–Haenszel and logistic regression techniques. Qual. Quant. 2008, 42, 739–755. [Google Scholar] [CrossRef]
- Hossu, C.A.; Iojă, I.C.; Pătroescu, M.; Dușa, A.; Hersperger, A.M. Dispute Resolution and Collaborative Decision-Making: What Accounts for Their Effectiveness? The Case of Romania. Sustainability 2019, 11, 7072. [Google Scholar] [CrossRef]
- Jang, W.; You, H.-W.; Han, S.H. Quantitative Decision Making Model for Carbon Reduction in Road Construction Projects Using Green Technologies. Sustainability 2015, 7, 11240–11259. [Google Scholar] [CrossRef]
- Jung, K.; Park, S.J.; Wu, W.-N.; Park, H.W. A webometric approach to policy analysis and management using exponential random graph models. Qual. Quant. 2015, 49, 581–598. [Google Scholar] [CrossRef]
- Khaldi, H.; Prado-Gascó, V. Bibliometric maps and co-word analysis of the literature on international cooperation on migration. Qual. Quant. 2021, 55, 1845–1869. [Google Scholar] [CrossRef]
- Kronegger, L.; Ferligoj, A.; Doreian, P. On the dynamics of national scientific systems. Qual. Quant. 2011, 45, 989–1015. [Google Scholar] [CrossRef]
- Kwon, O.-J. Tracing two faces of extended visibility: a bibliometric analysis of transparency discussions in social sciences. Qual. Quant. 2022, 56, 4711–4727. [Google Scholar] [CrossRef]
- Kumar, S.; Kamble, S.; Roy, M.H. Twenty-five years of Benchmarking: An International Journal (BIJ). Benchmarking: Int. J. 2020, 27, 760–780. [Google Scholar] [CrossRef]
- Lassala, C.; Apetrei, A.; Sapena, J. Sustainability Matter and Financial Performance of Companies. Sustainability 2017, 9, 1498. [Google Scholar] [CrossRef]
- Li, Z.; Gao, G.; Xiao, X.; Zuo, H. Factors and Formation Path of Cross-Border E-Commerce Logistics Mode Selection. Sustainability 2023, 15, 3685. [Google Scholar] [CrossRef]
- Lotka, A. A distribuição de frequência da produtividade científica (1926).
- Pritchard, A. Statistical bibliography or bibliometrics. J. Doc. 1969, 25, 348–349. [Google Scholar]
- Punjani, K.K.; Mahadevan, K.; Gunasekaran, A.; Kumar, V.V.R.; Joshi, S. Cloud computing in agriculture: a bibliometric and network visualization analysis. Qual. Quant. 2023, 57, 3849–3883. [Google Scholar] [CrossRef]
- Ragin, C.C. The comparative method. Moving beyond qualitative and quantitative strategies.–Berkeley, Los Angeles, CA; L.: Univ, (1987).
- Ragin, Charles. Fuzzy-set social science. Chicago: University Of Chicago Press (2000).
- Ragin, C.C. Set Relations in Social Research: Evaluating Their Consistency and Coverage. Politi- Anal. 2006, 14, 291–310. [Google Scholar] [CrossRef]
- Ragin, Charles. Redesigning Social Inquiry Fuzzy Sets and Beyond. Chicago: University Of Chicago Press, (2008).
- Ragin, Charles and Fiss, Peer. Net effects analysis versus configurational analysis: An empirical demonstration. Chicago: University Of Chicago Press, 2008. 234 p.
- Ragin, C.C.; Fiss, P.C. Intersectional inequality. Race, class, test scores, and poverty. University of Chicago Press, Chicago (2017).
- Rejeb, A.; Rejeb, K.; Simske, S.J.; Keogh, J.G. Blockchain technology in the smart city: a bibliometric review. Qual. Quant. 2022, 56, 2875–2906. [Google Scholar] [CrossRef]
- Rihoux, B.; Ragin, C. Configurational Comparative Methods: Qualitative Comparative Analysis (QCA) and Related Techniques; SAGE Publications: Thousand Oaks, CA, USA, 2008. [Google Scholar]
- Rihoux, B. Qualitative comparative analysis (QCA) and related systematic comparative methods recent advances and remaining challenges for social science research. Int. Sociol. 2006, 21, 679–706. [Google Scholar] [CrossRef]
- Selcuk, O.; Cizel, B. Using qualitative comparative analysis approach in tourism studies: a critical review. Qual. Quant. 2023, 58, 933–960. [Google Scholar] [CrossRef]
- Schneider, C.Q. and Wagemann, C. Set-Theoretic Methods for the Social Sciences: a Guide to Qualitative Comparative Analysis. Cambridge University Press, New York (2012 [2007]).
- Schneider, C.Q.; Wagemann, C. Qualitative Comparative Analysis (QCA) and Fuzzy-Sets: Agenda for a Research Approach and a Data Analysis Technique. Comp. Sociol. 2010, 9, 376–396. [Google Scholar] [CrossRef]
- Smilde, D. A Qualitative Comparative Analysis of Conversion to Venezuelan Evangelicalism: How Networks Matter. Am. J. Sociol. 2005, 111, 757–796. [Google Scholar] [CrossRef]
- Woodside, A.G.; Zhang, M. Identifying X-Consumers Using Causal Recipes: “Whales” and “Jumbo Shrimps” Casino Gamblers. J. Gambl. Stud. 2012, 28, 13–26. [Google Scholar] [CrossRef] [PubMed]
- Woodside, A.G. Moving beyond multiple regression analysis to algorithms: Calling for adoption of a paradigm shift from symmetric to asymmetric thinking in data analysis and crafting theory. J. Bus. Res. 2013, 66, 463–472. [Google Scholar] [CrossRef]
- Woodside, A.G. Embrace•perform•model: complexity theory, contrarian case analysis, and multiple realities. J. Bus. Res. 2014, 67, 2495–2503. [Google Scholar] [CrossRef]
- Yang, H.; Jung, W.-S. A strategic management approach for Korean public research institutes based on bibliometric investigation. Qual. Quant. 2015, 49, 1437–1464. [Google Scholar] [CrossRef]
Figure 1.
Article production by year, from 2013 to July 2023.
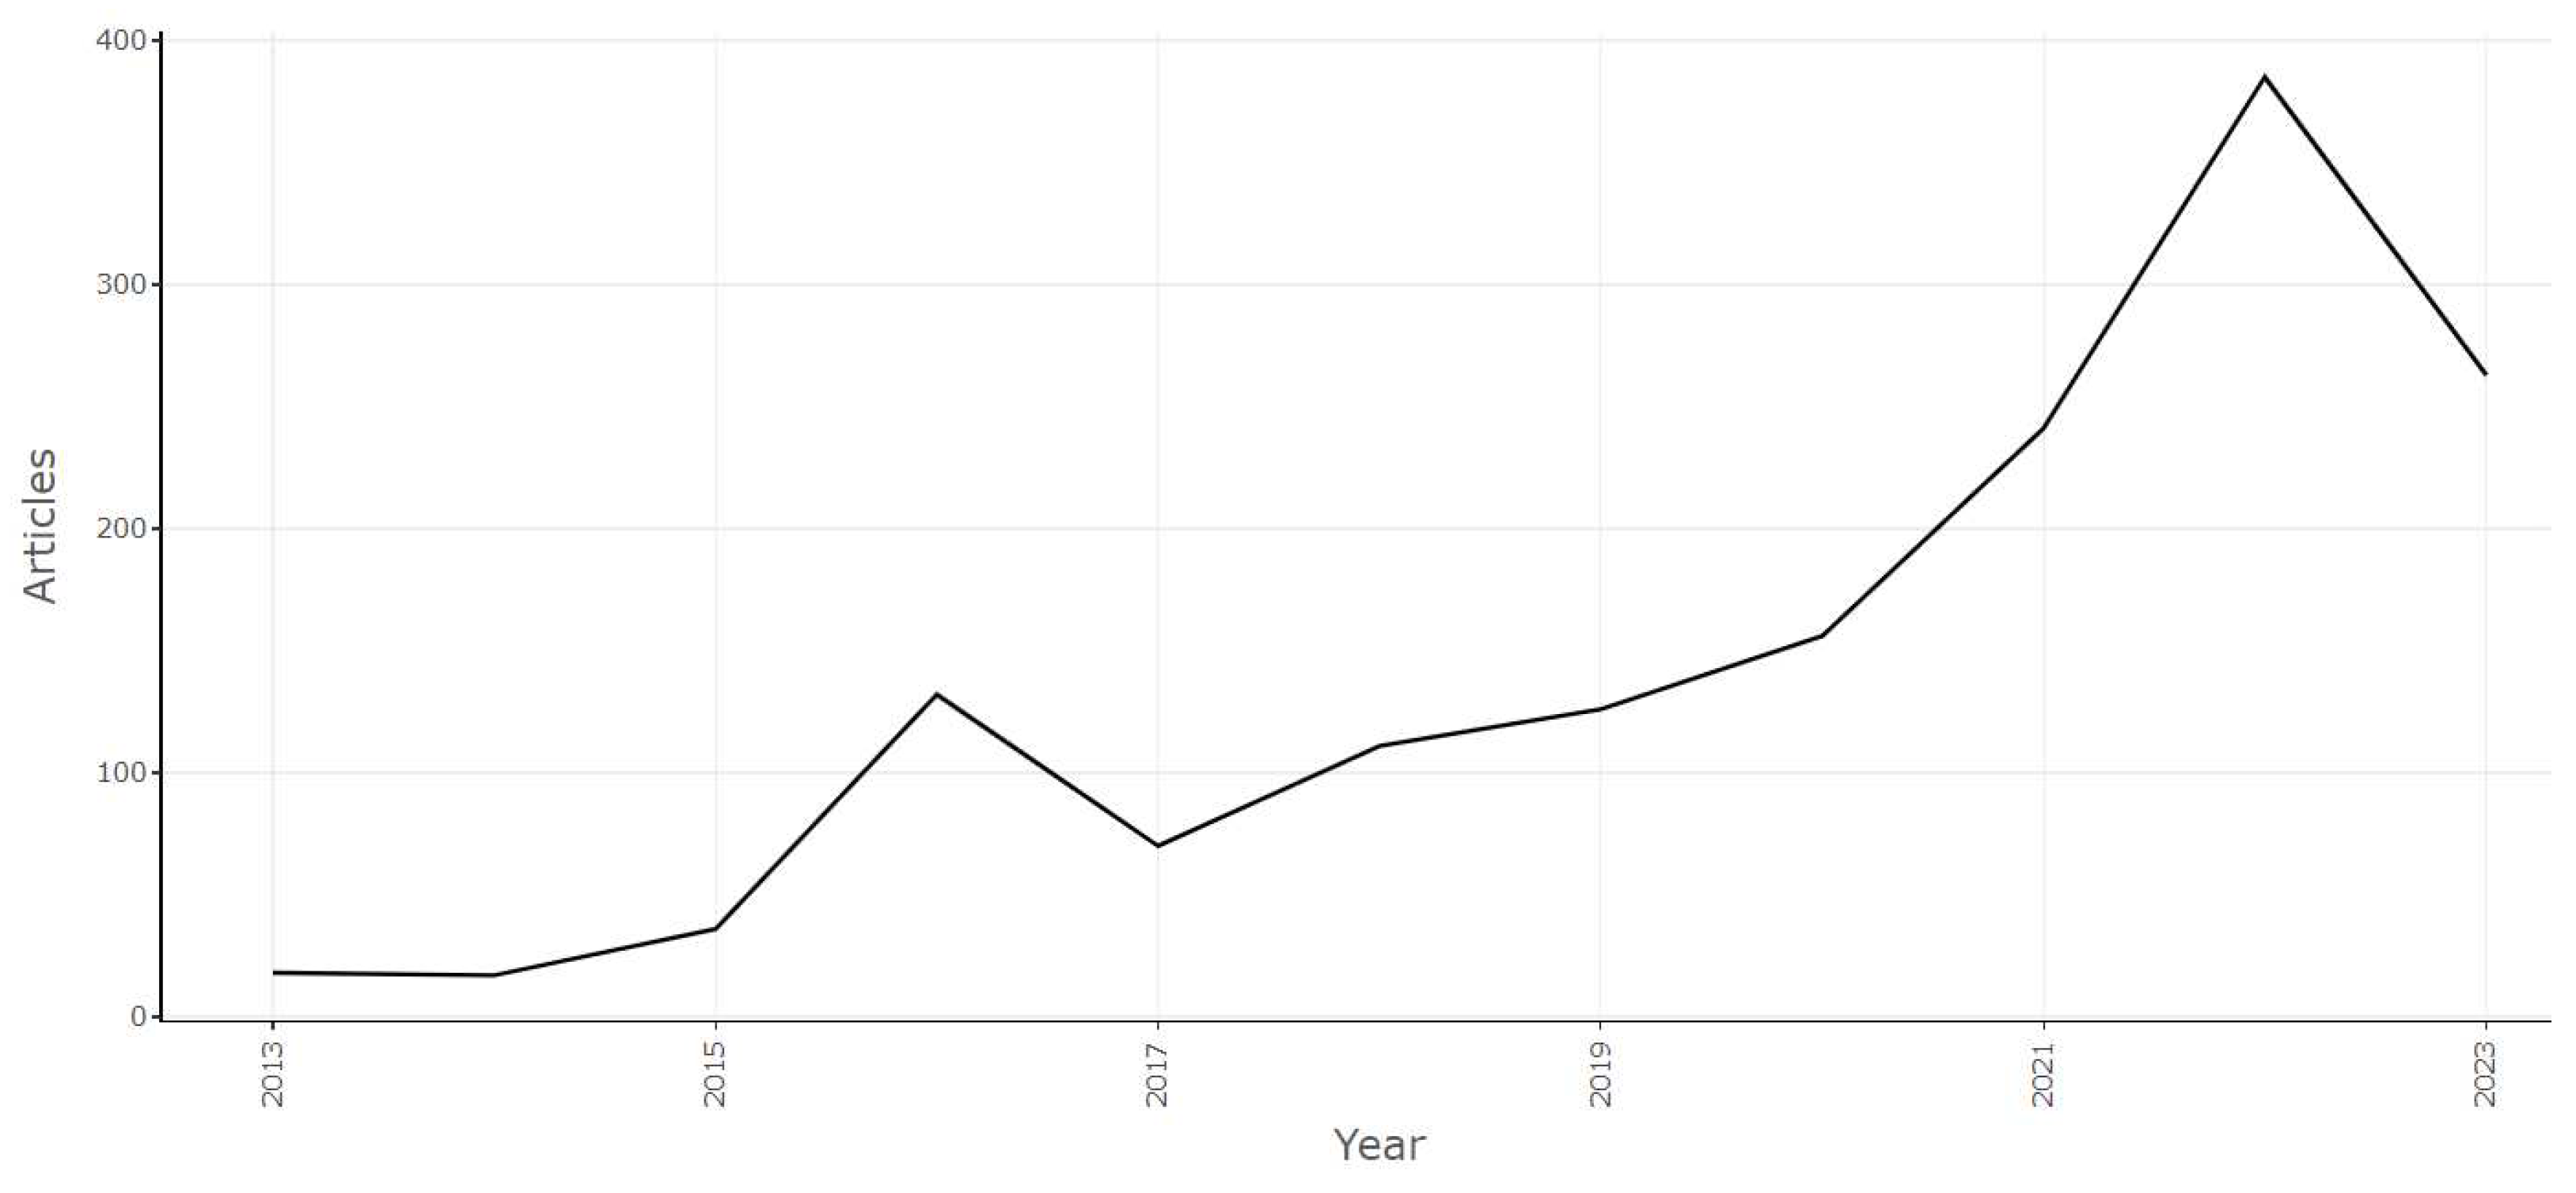
Figure 2.
Three-Field Plot.
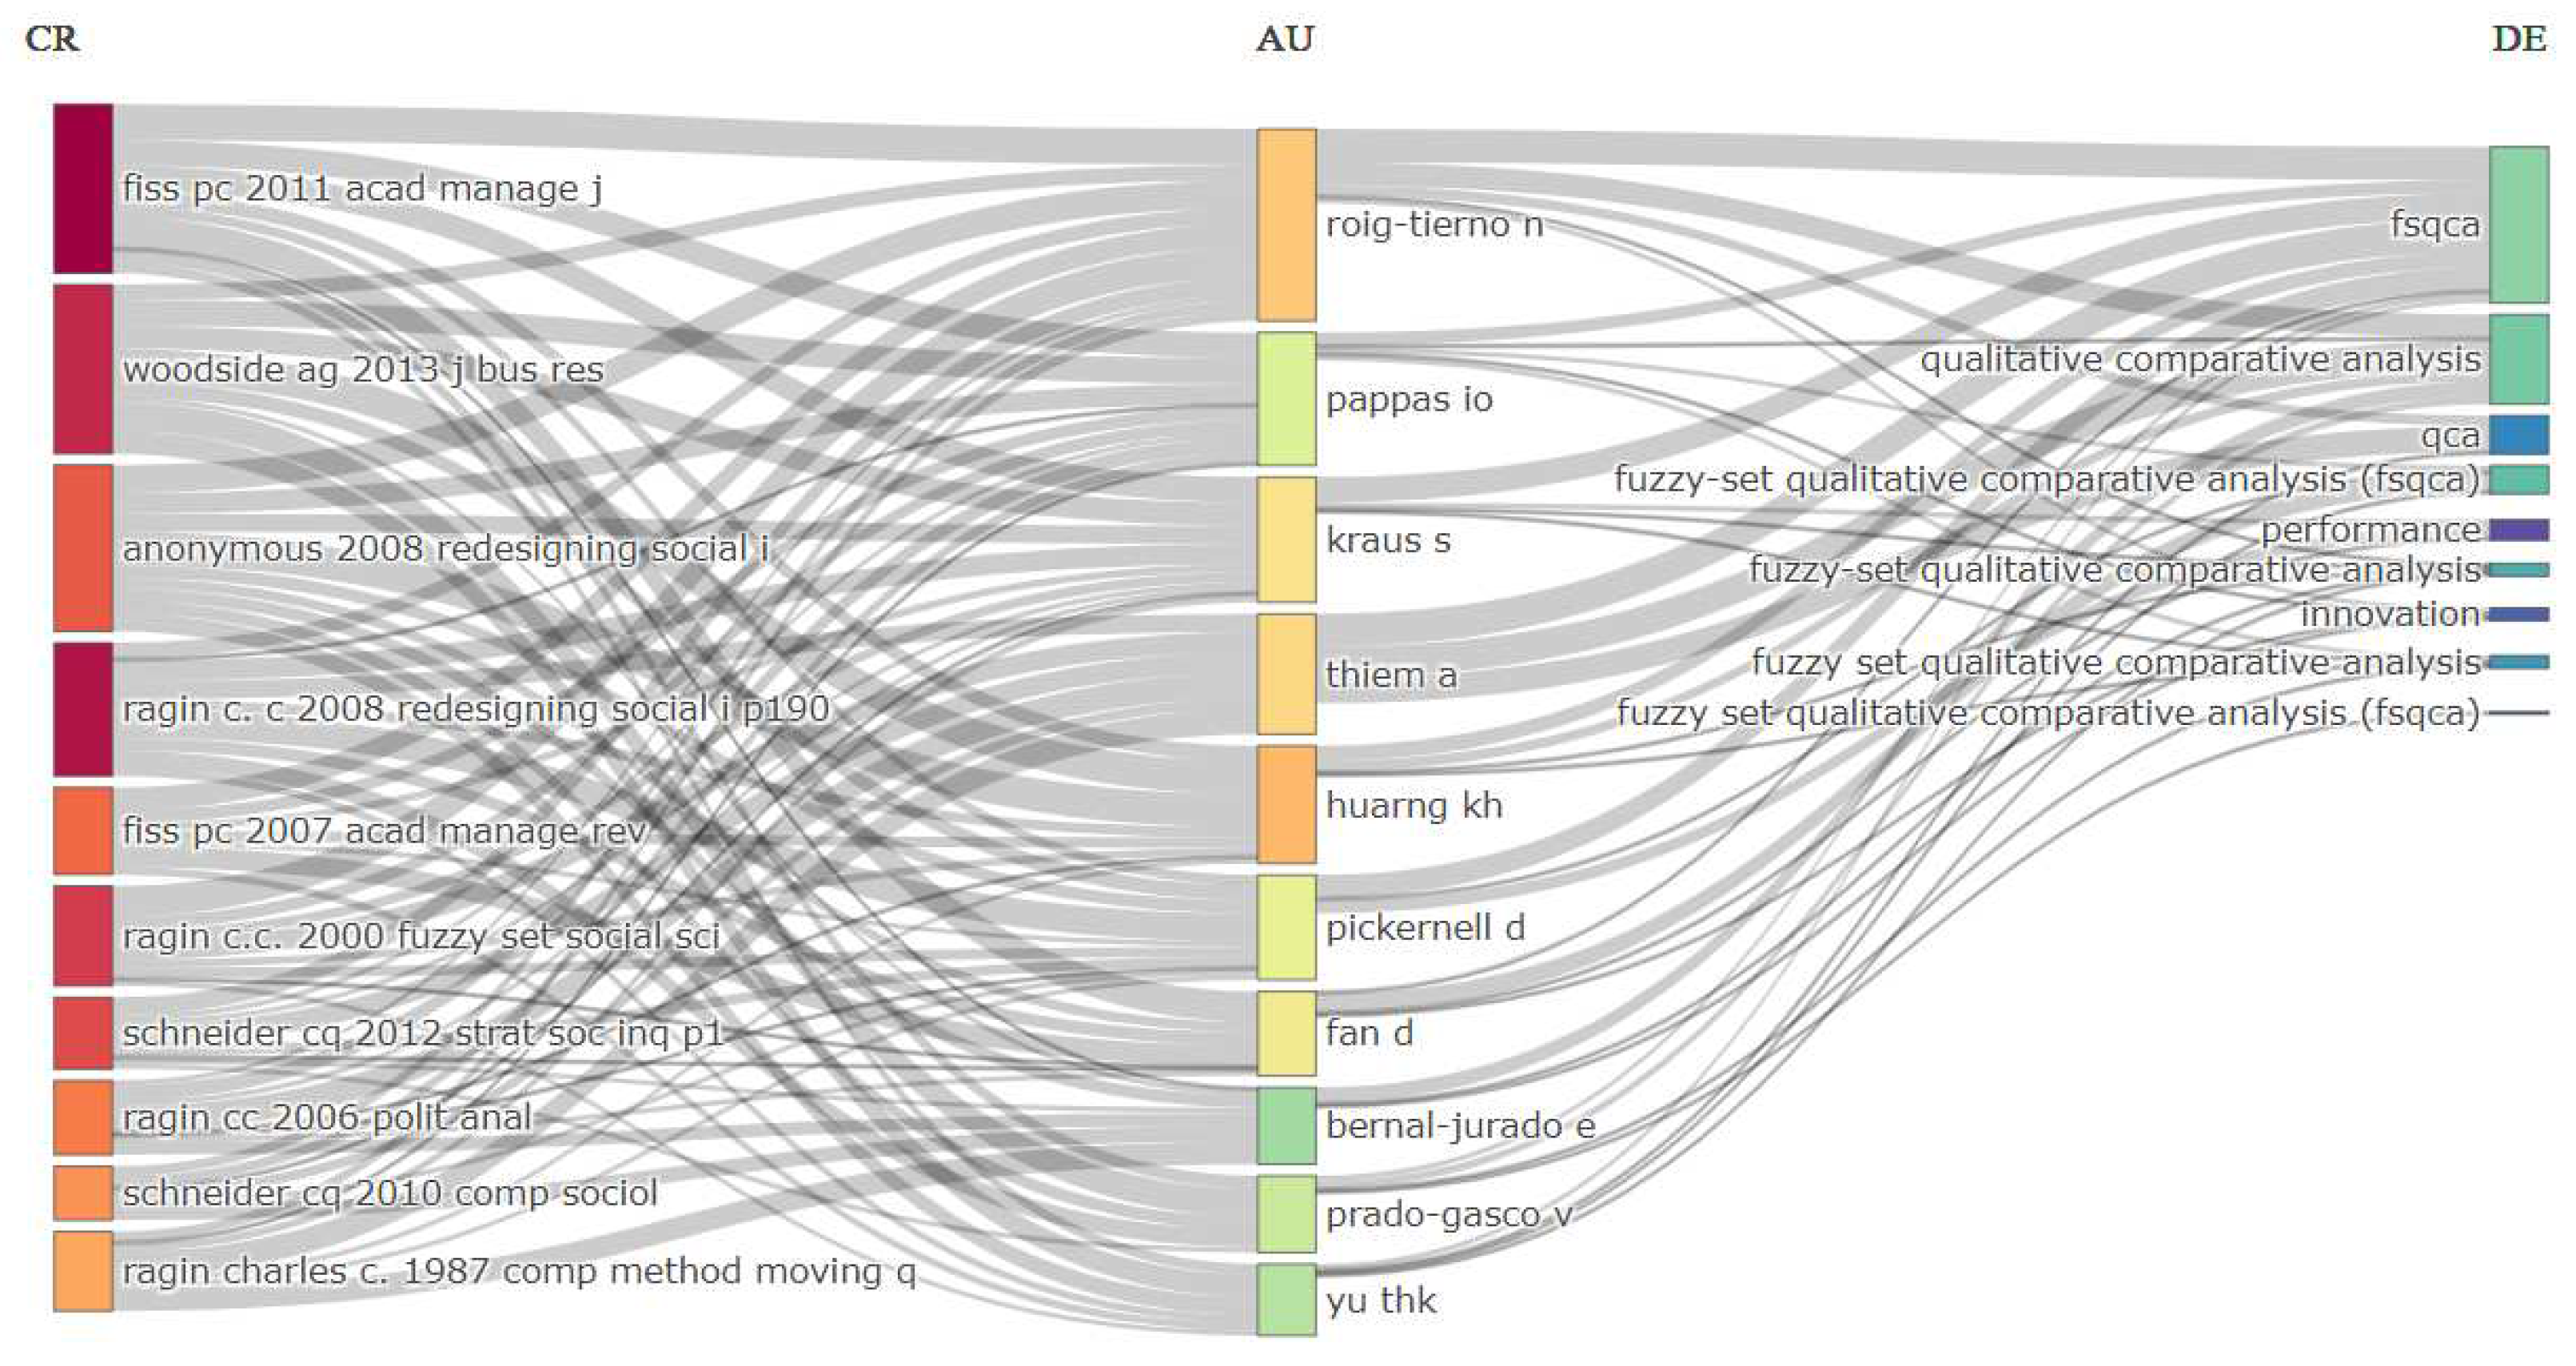
Figure 3.
Most Relevant Sources.
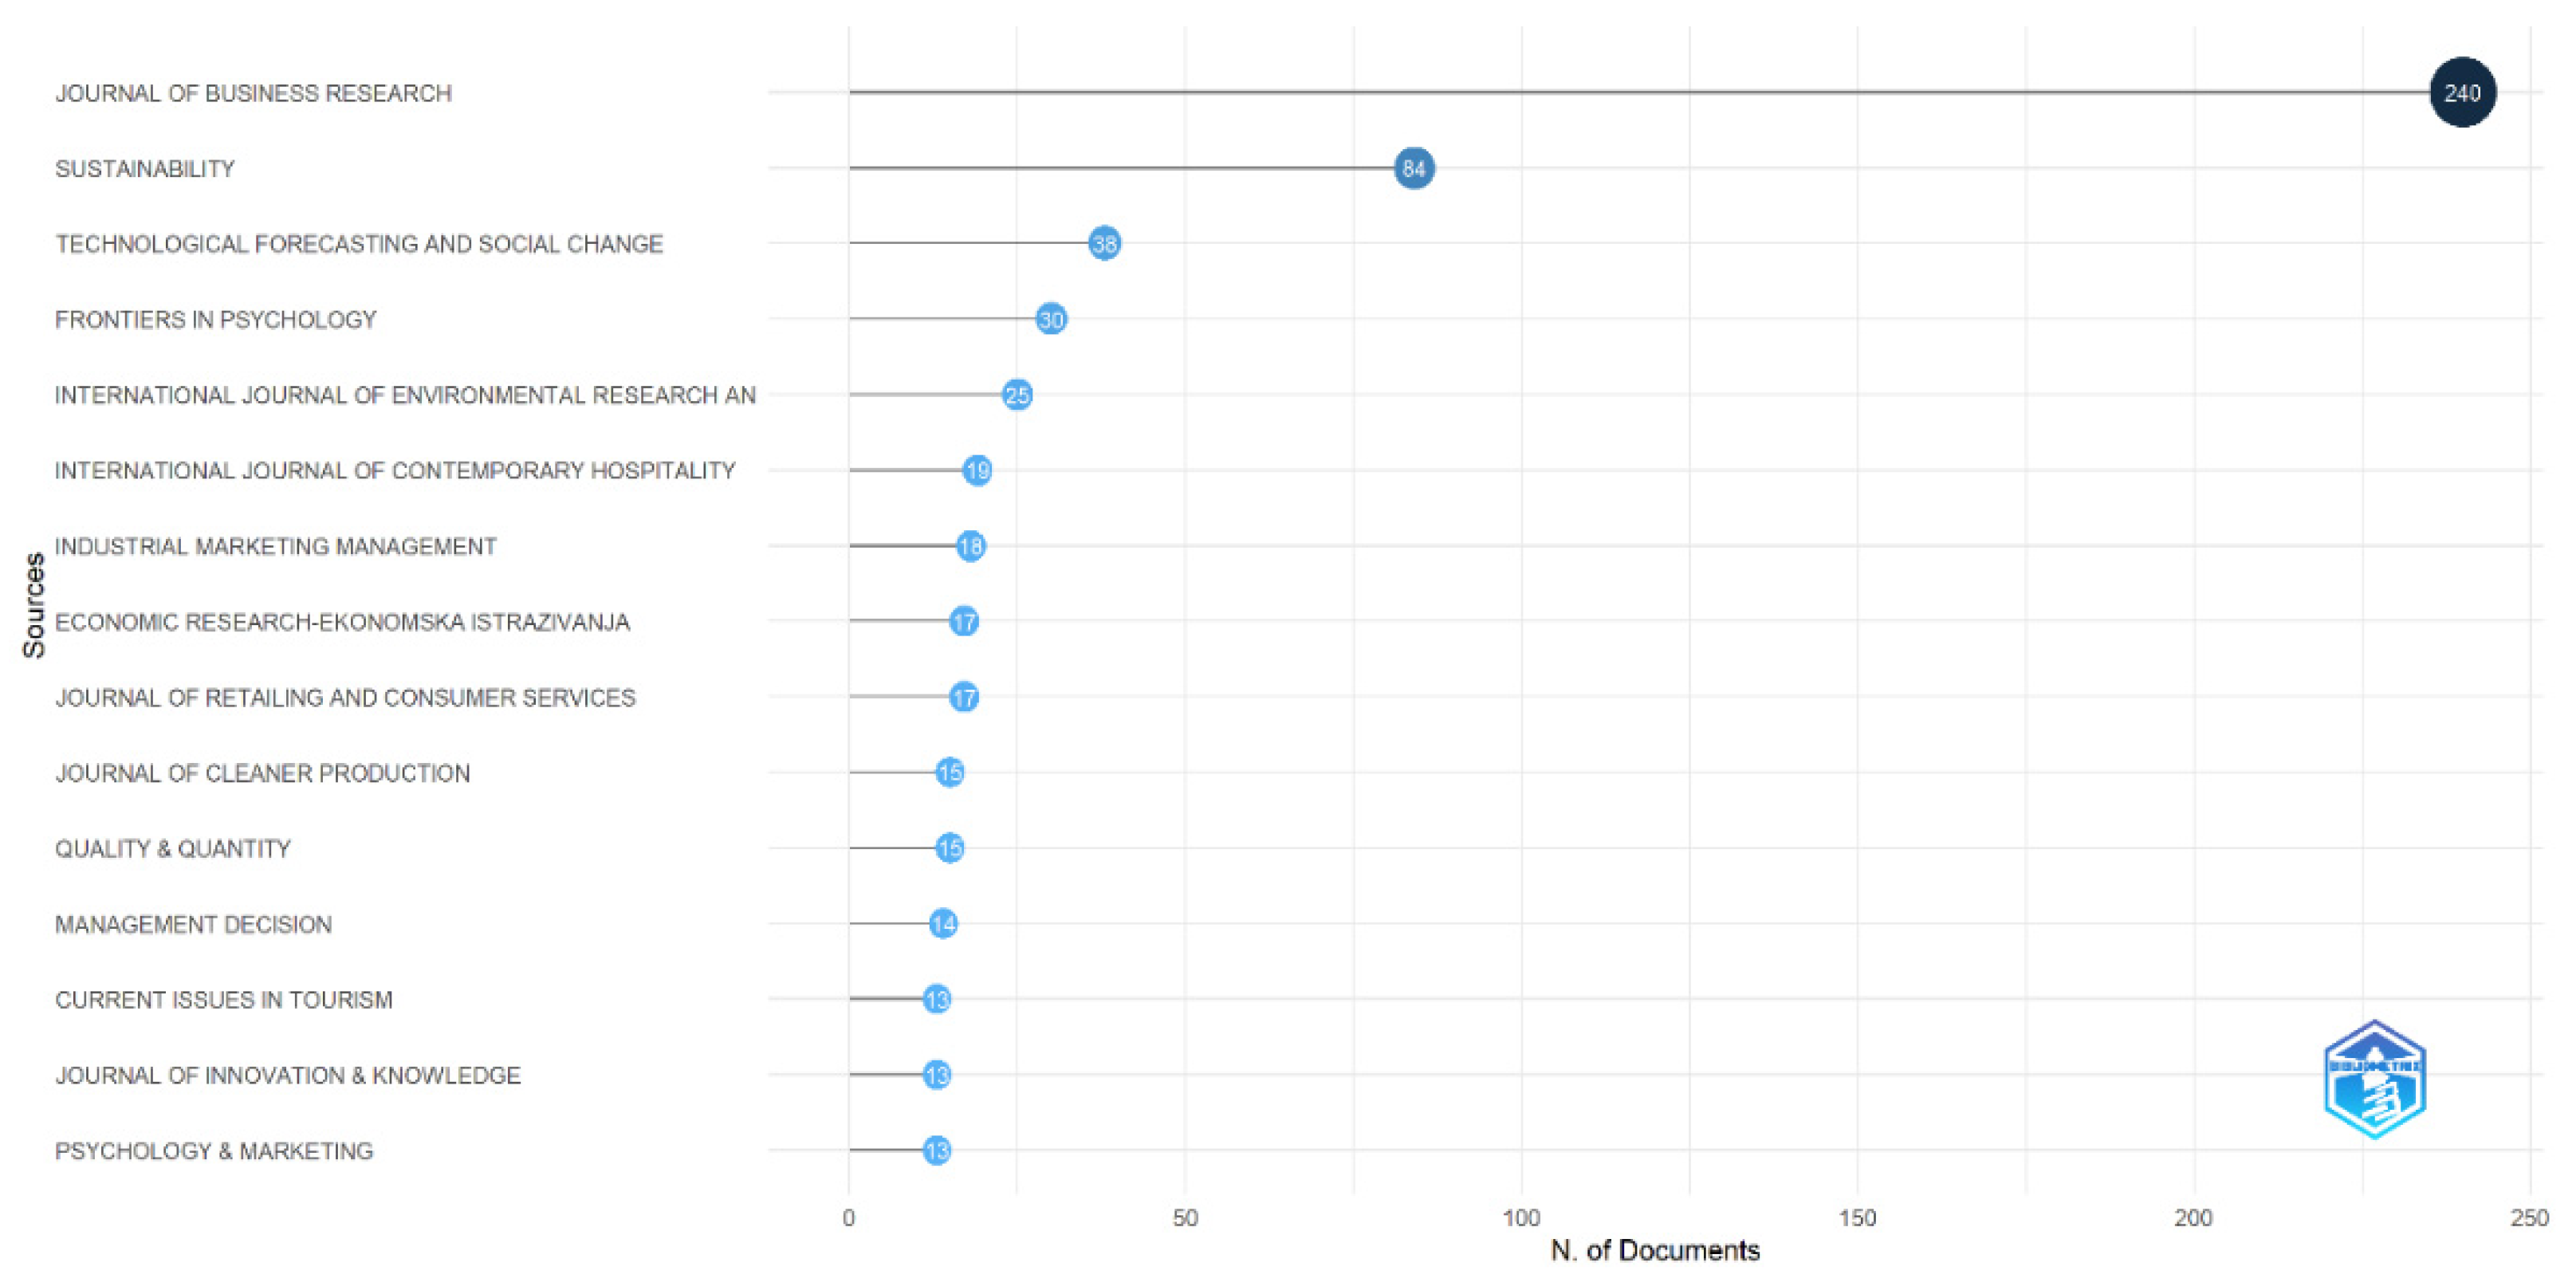
Figure 4.
Sources’ Local Impact.
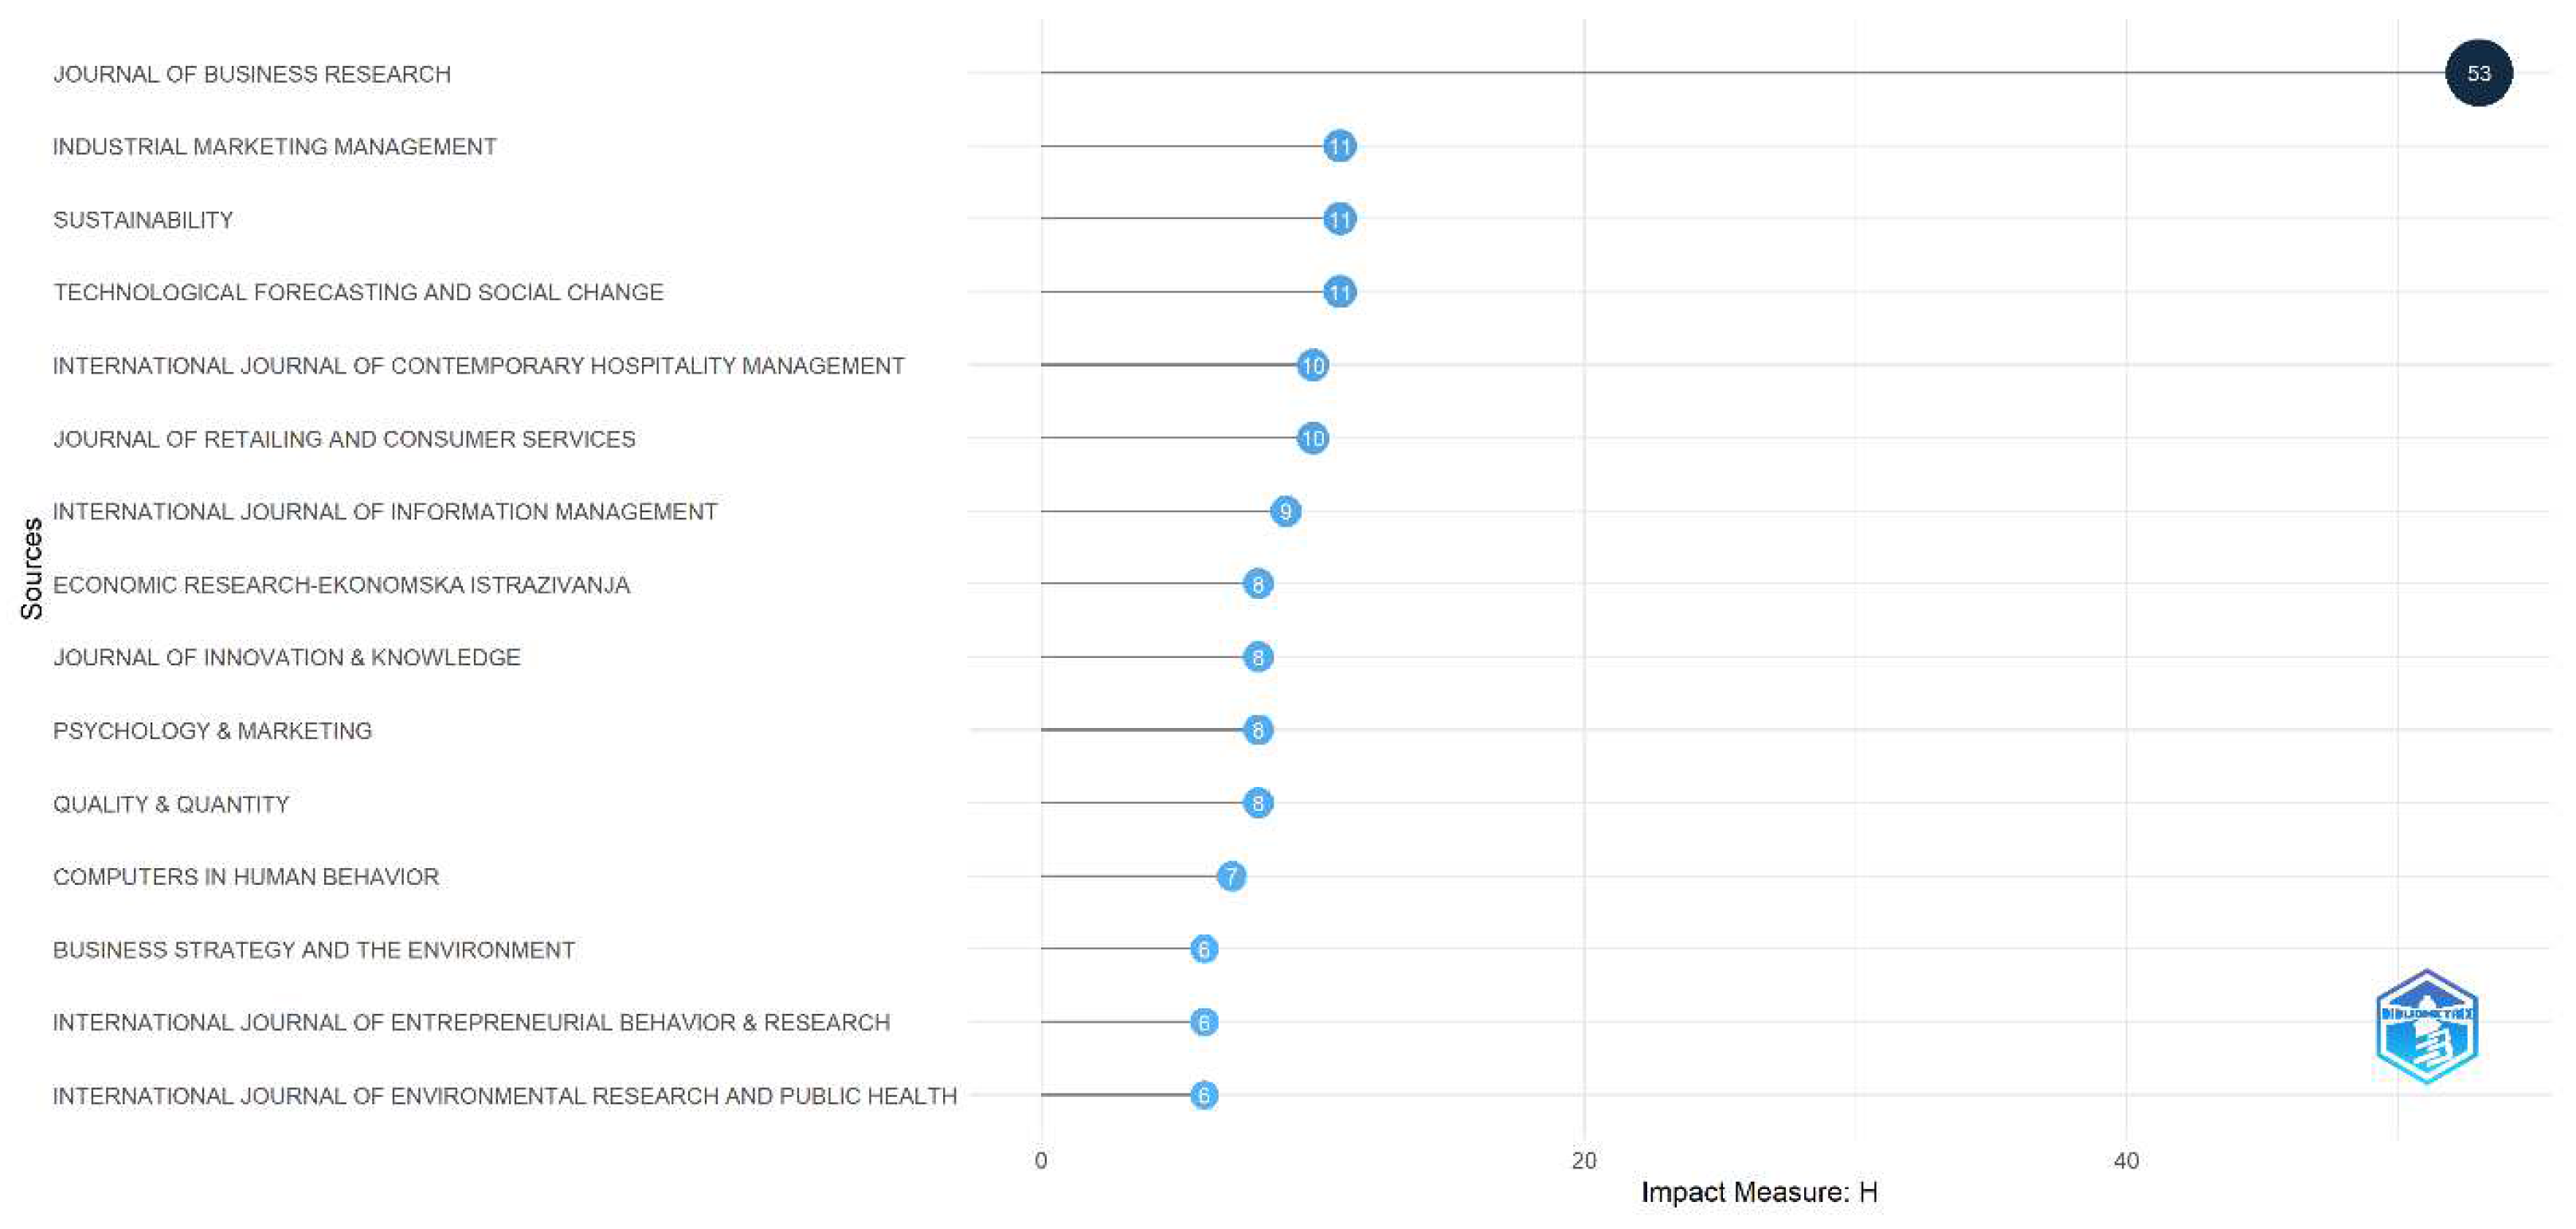
Figure 5.
Core Sources by Bradford’s Law.
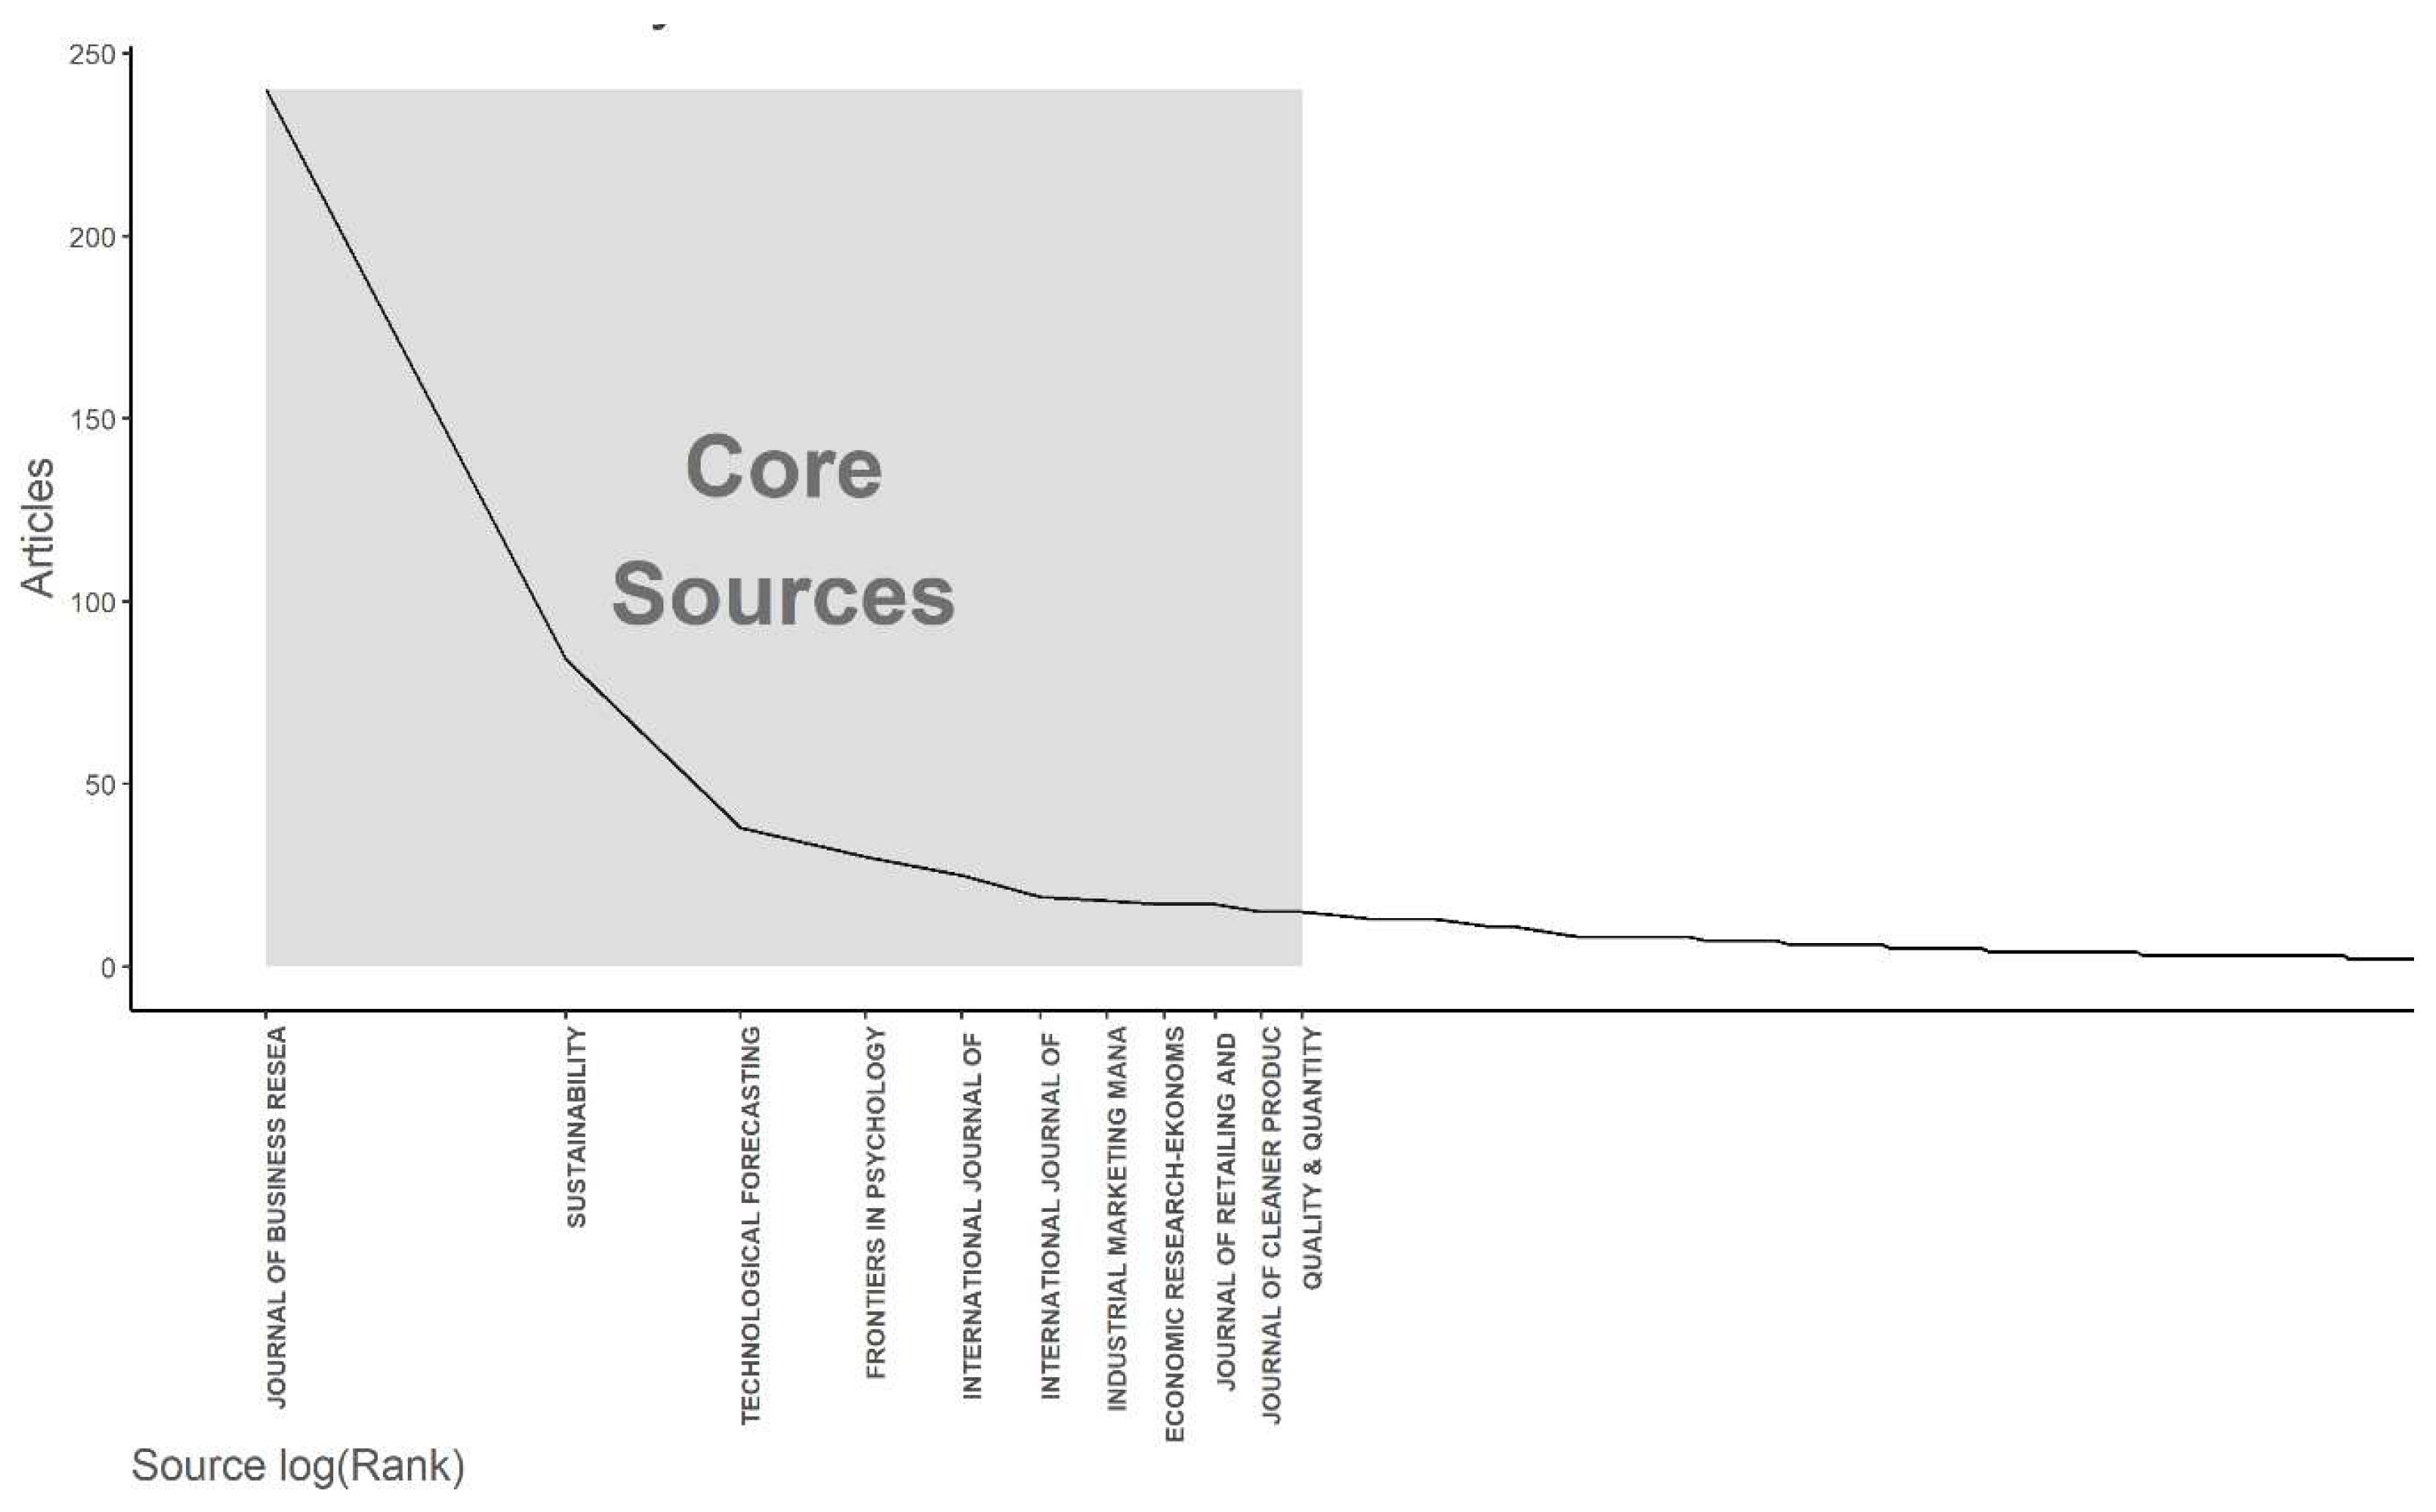
Figure 6.
Most Relevant Authors for the period 2013 to July 2023.
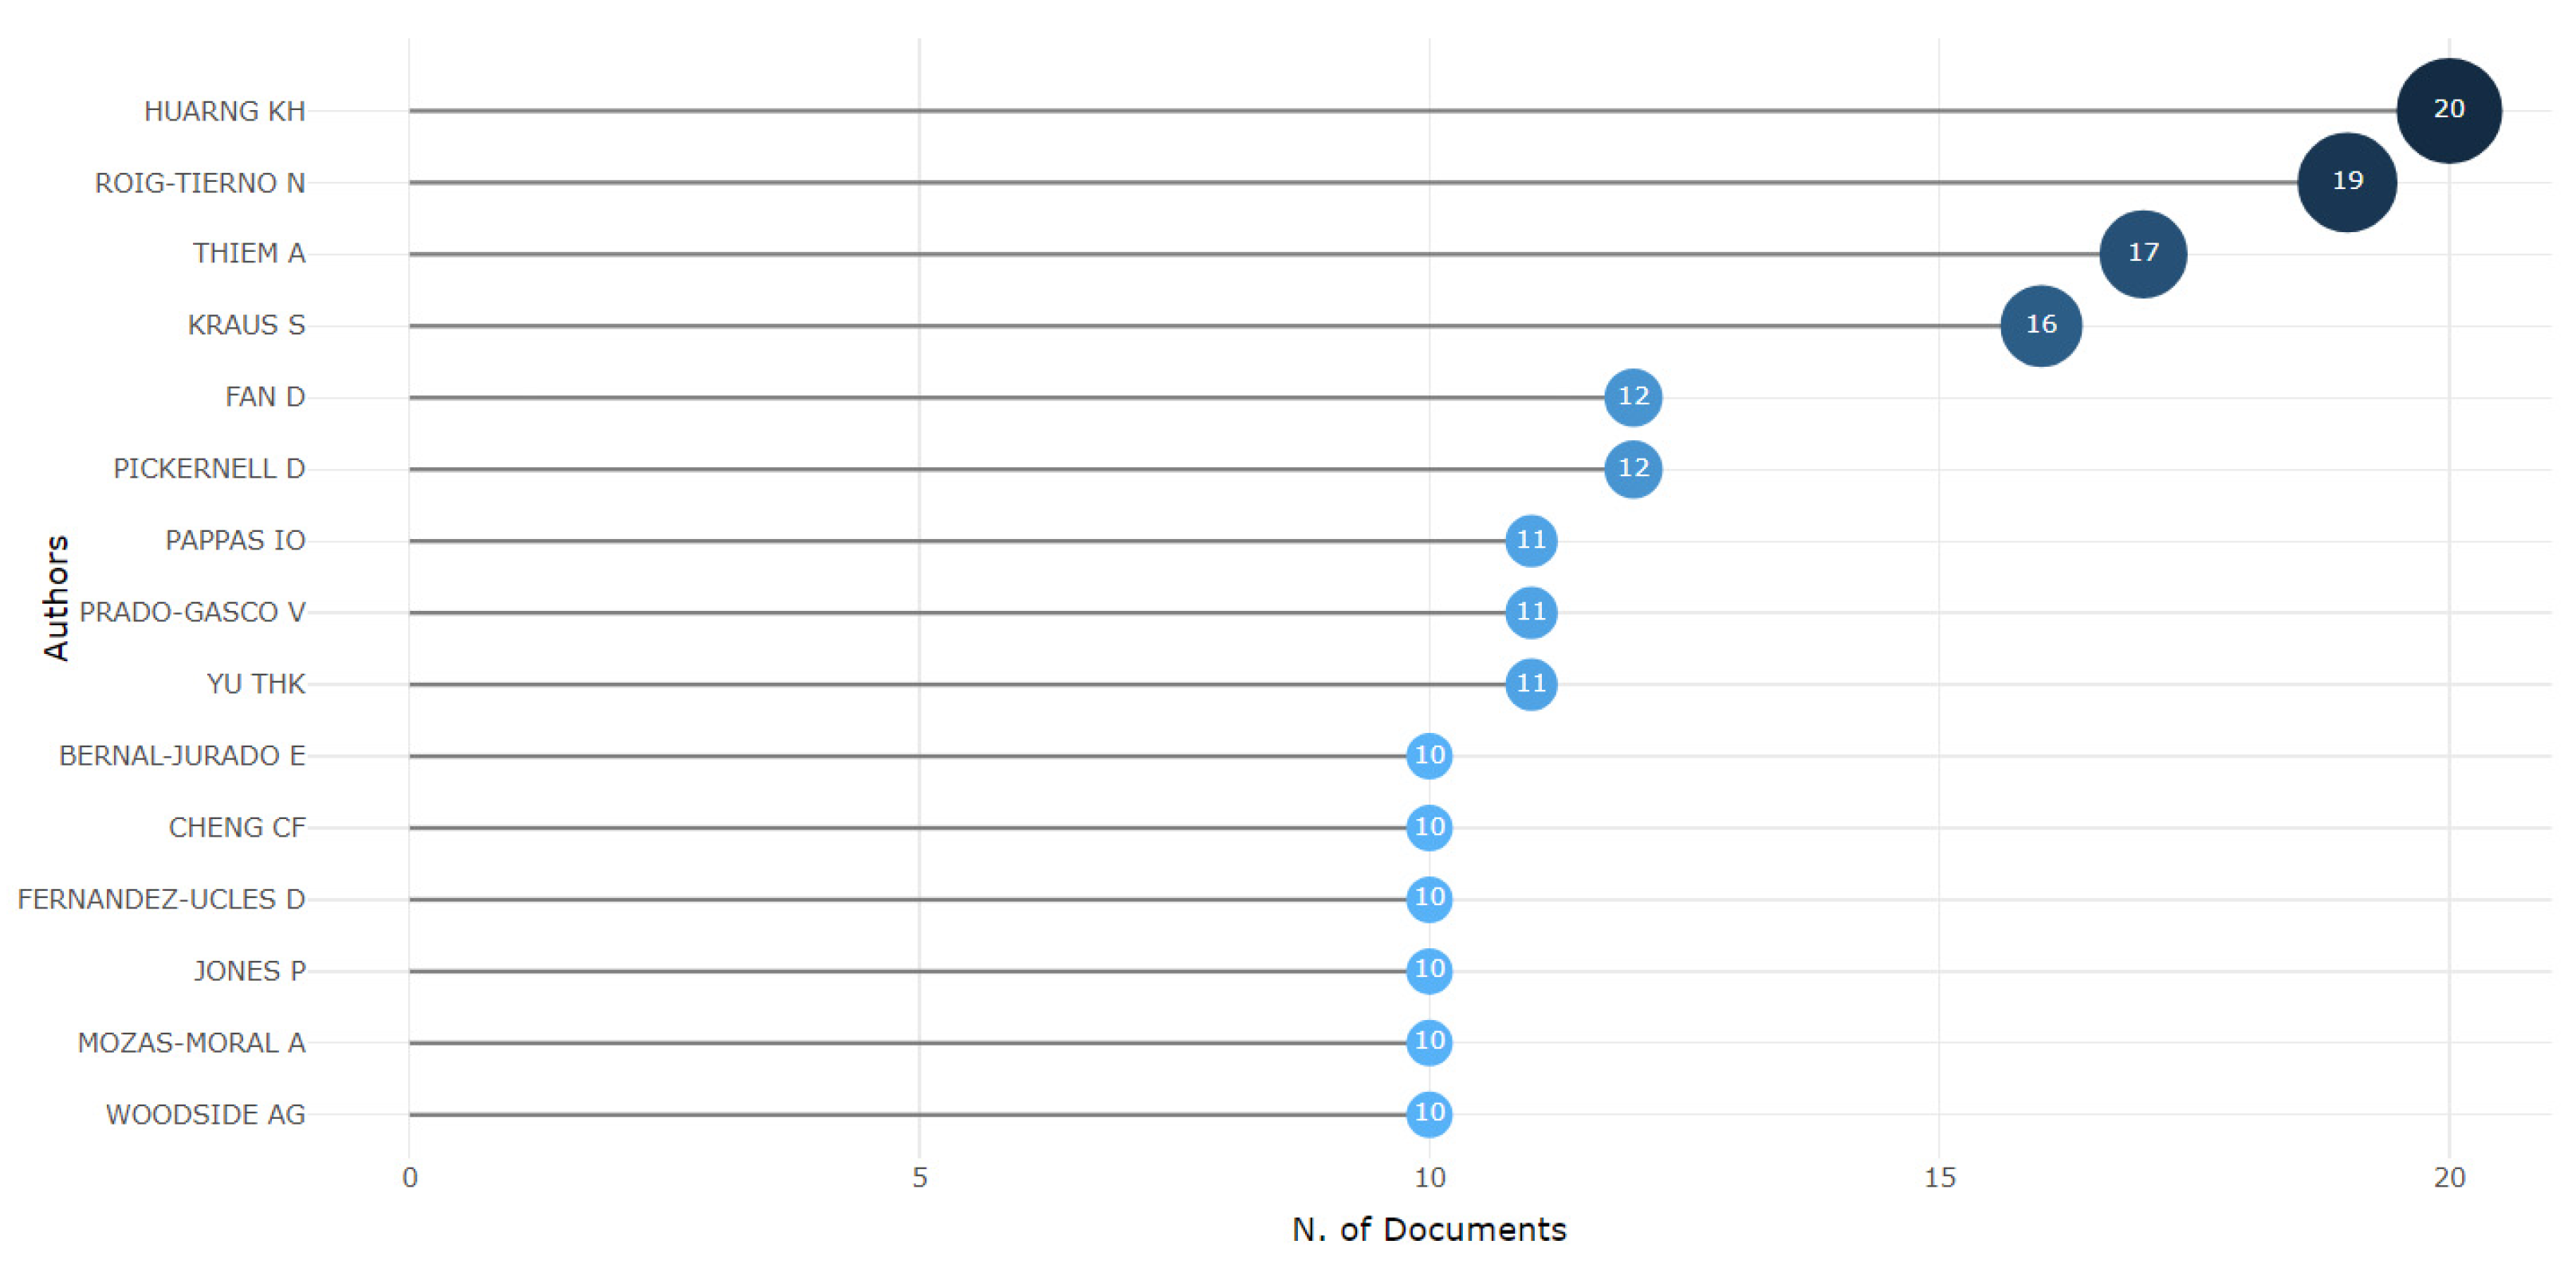
Figure 7.
Author Productivity through Lotka’s Law.
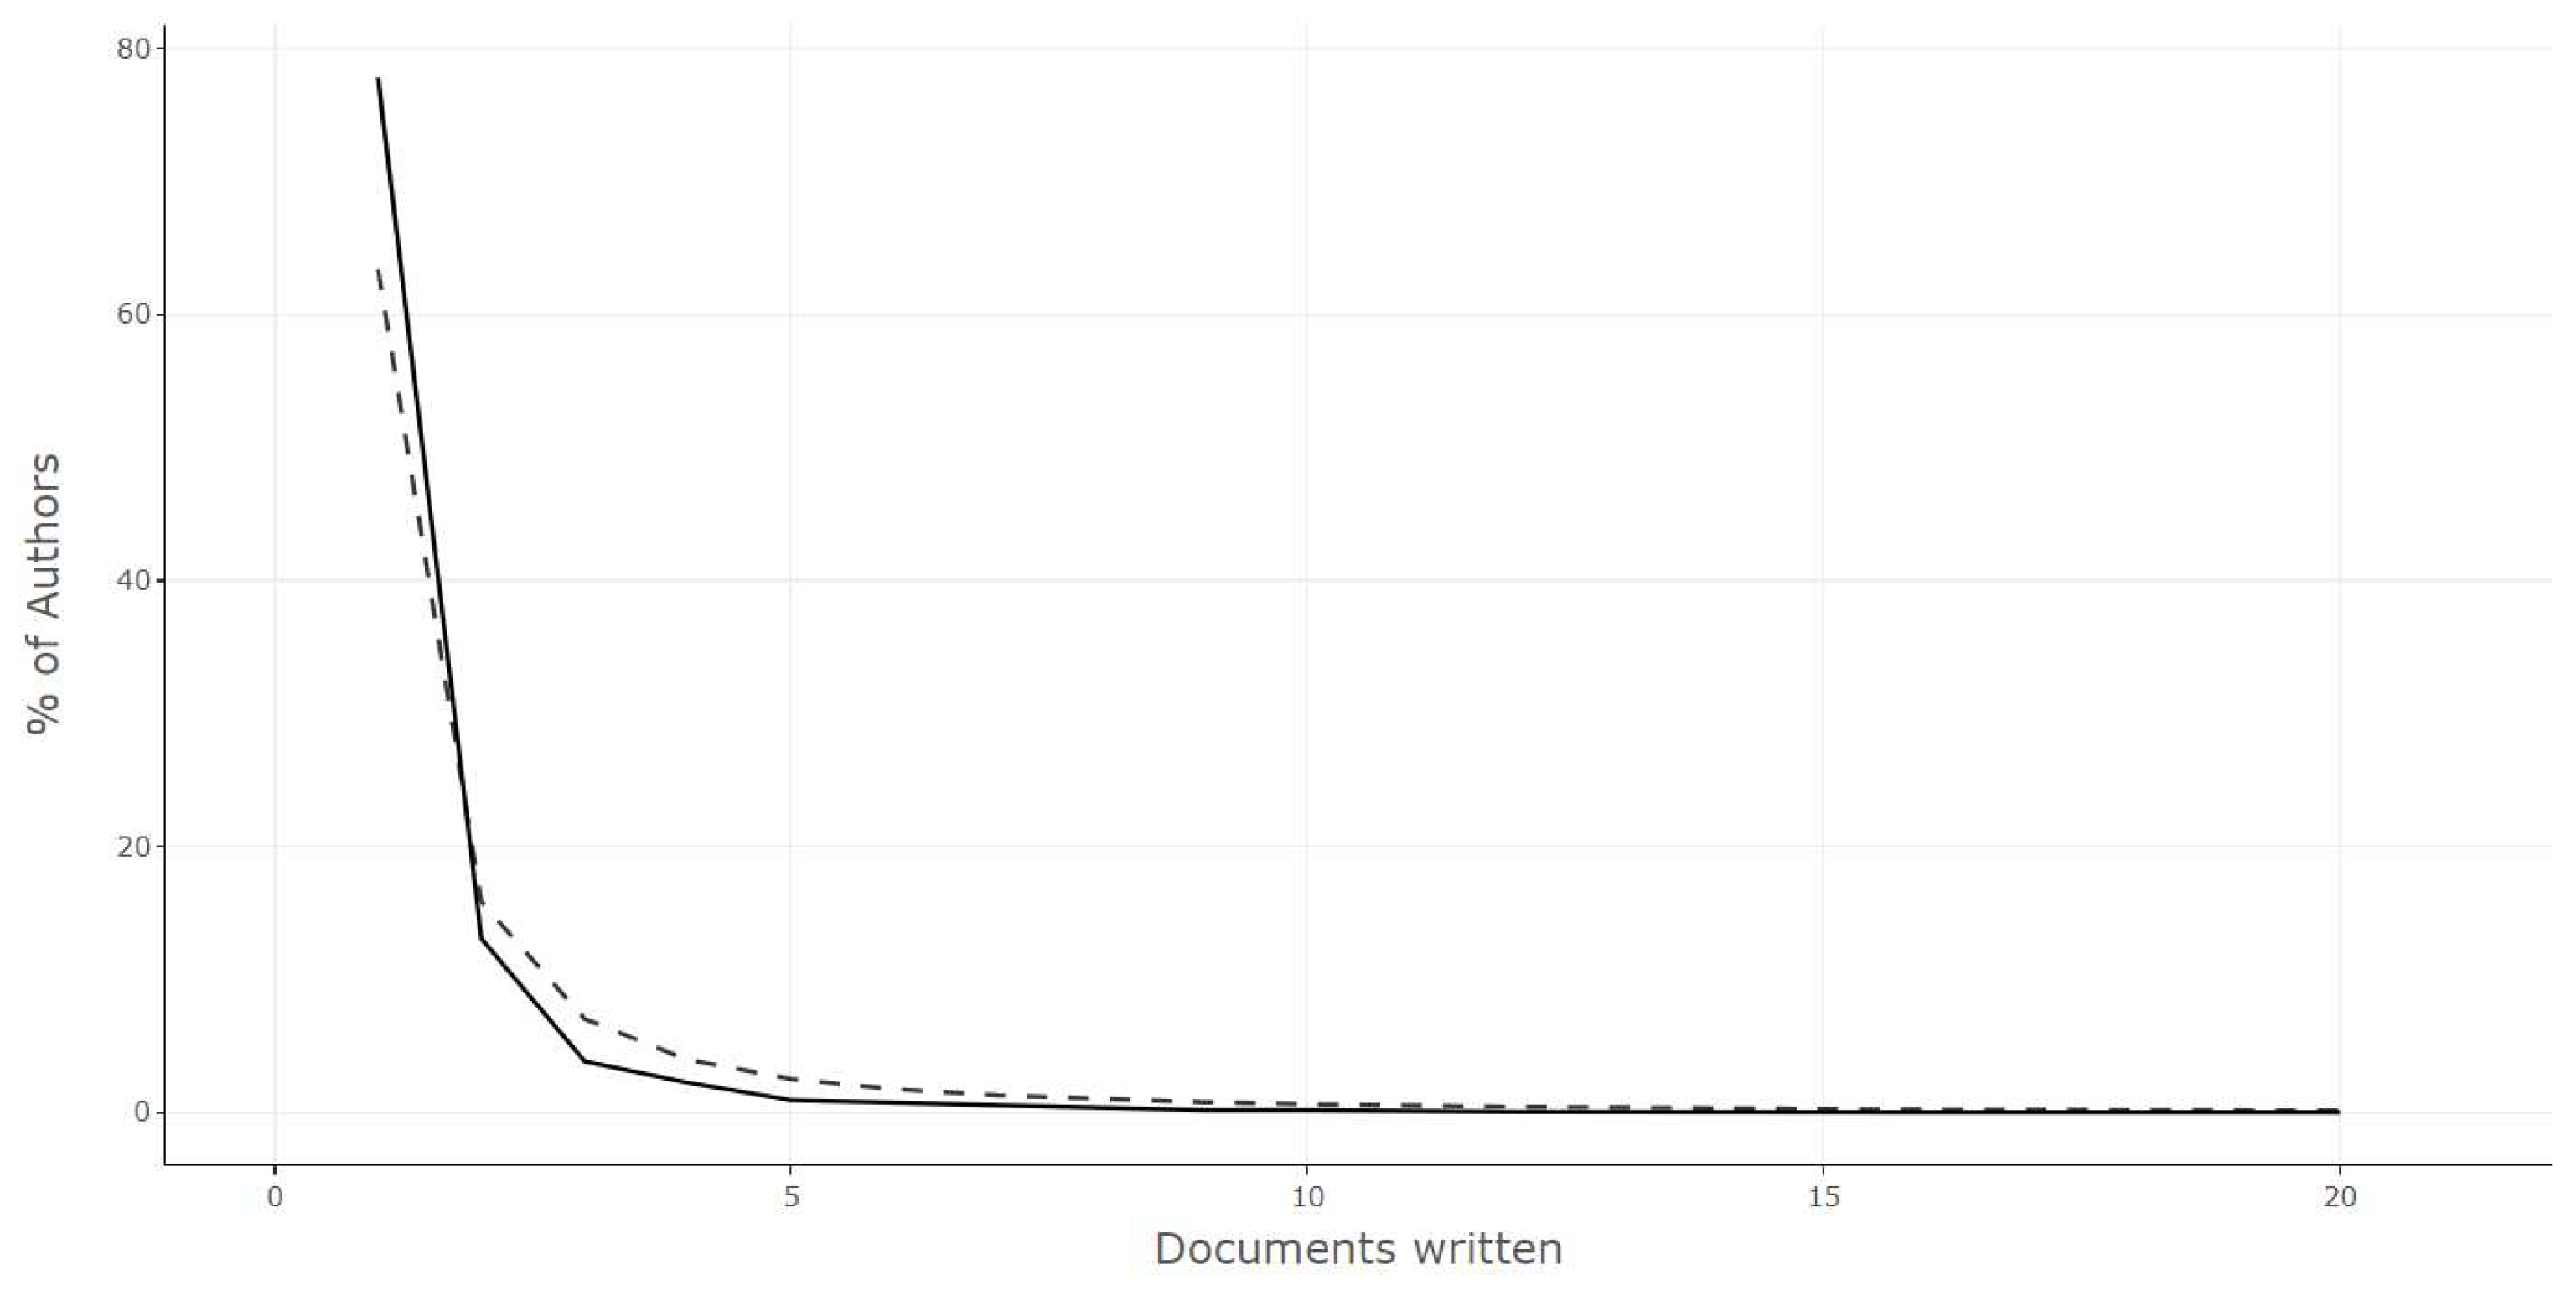
Figure 8.
Most Relevant Affiliations.
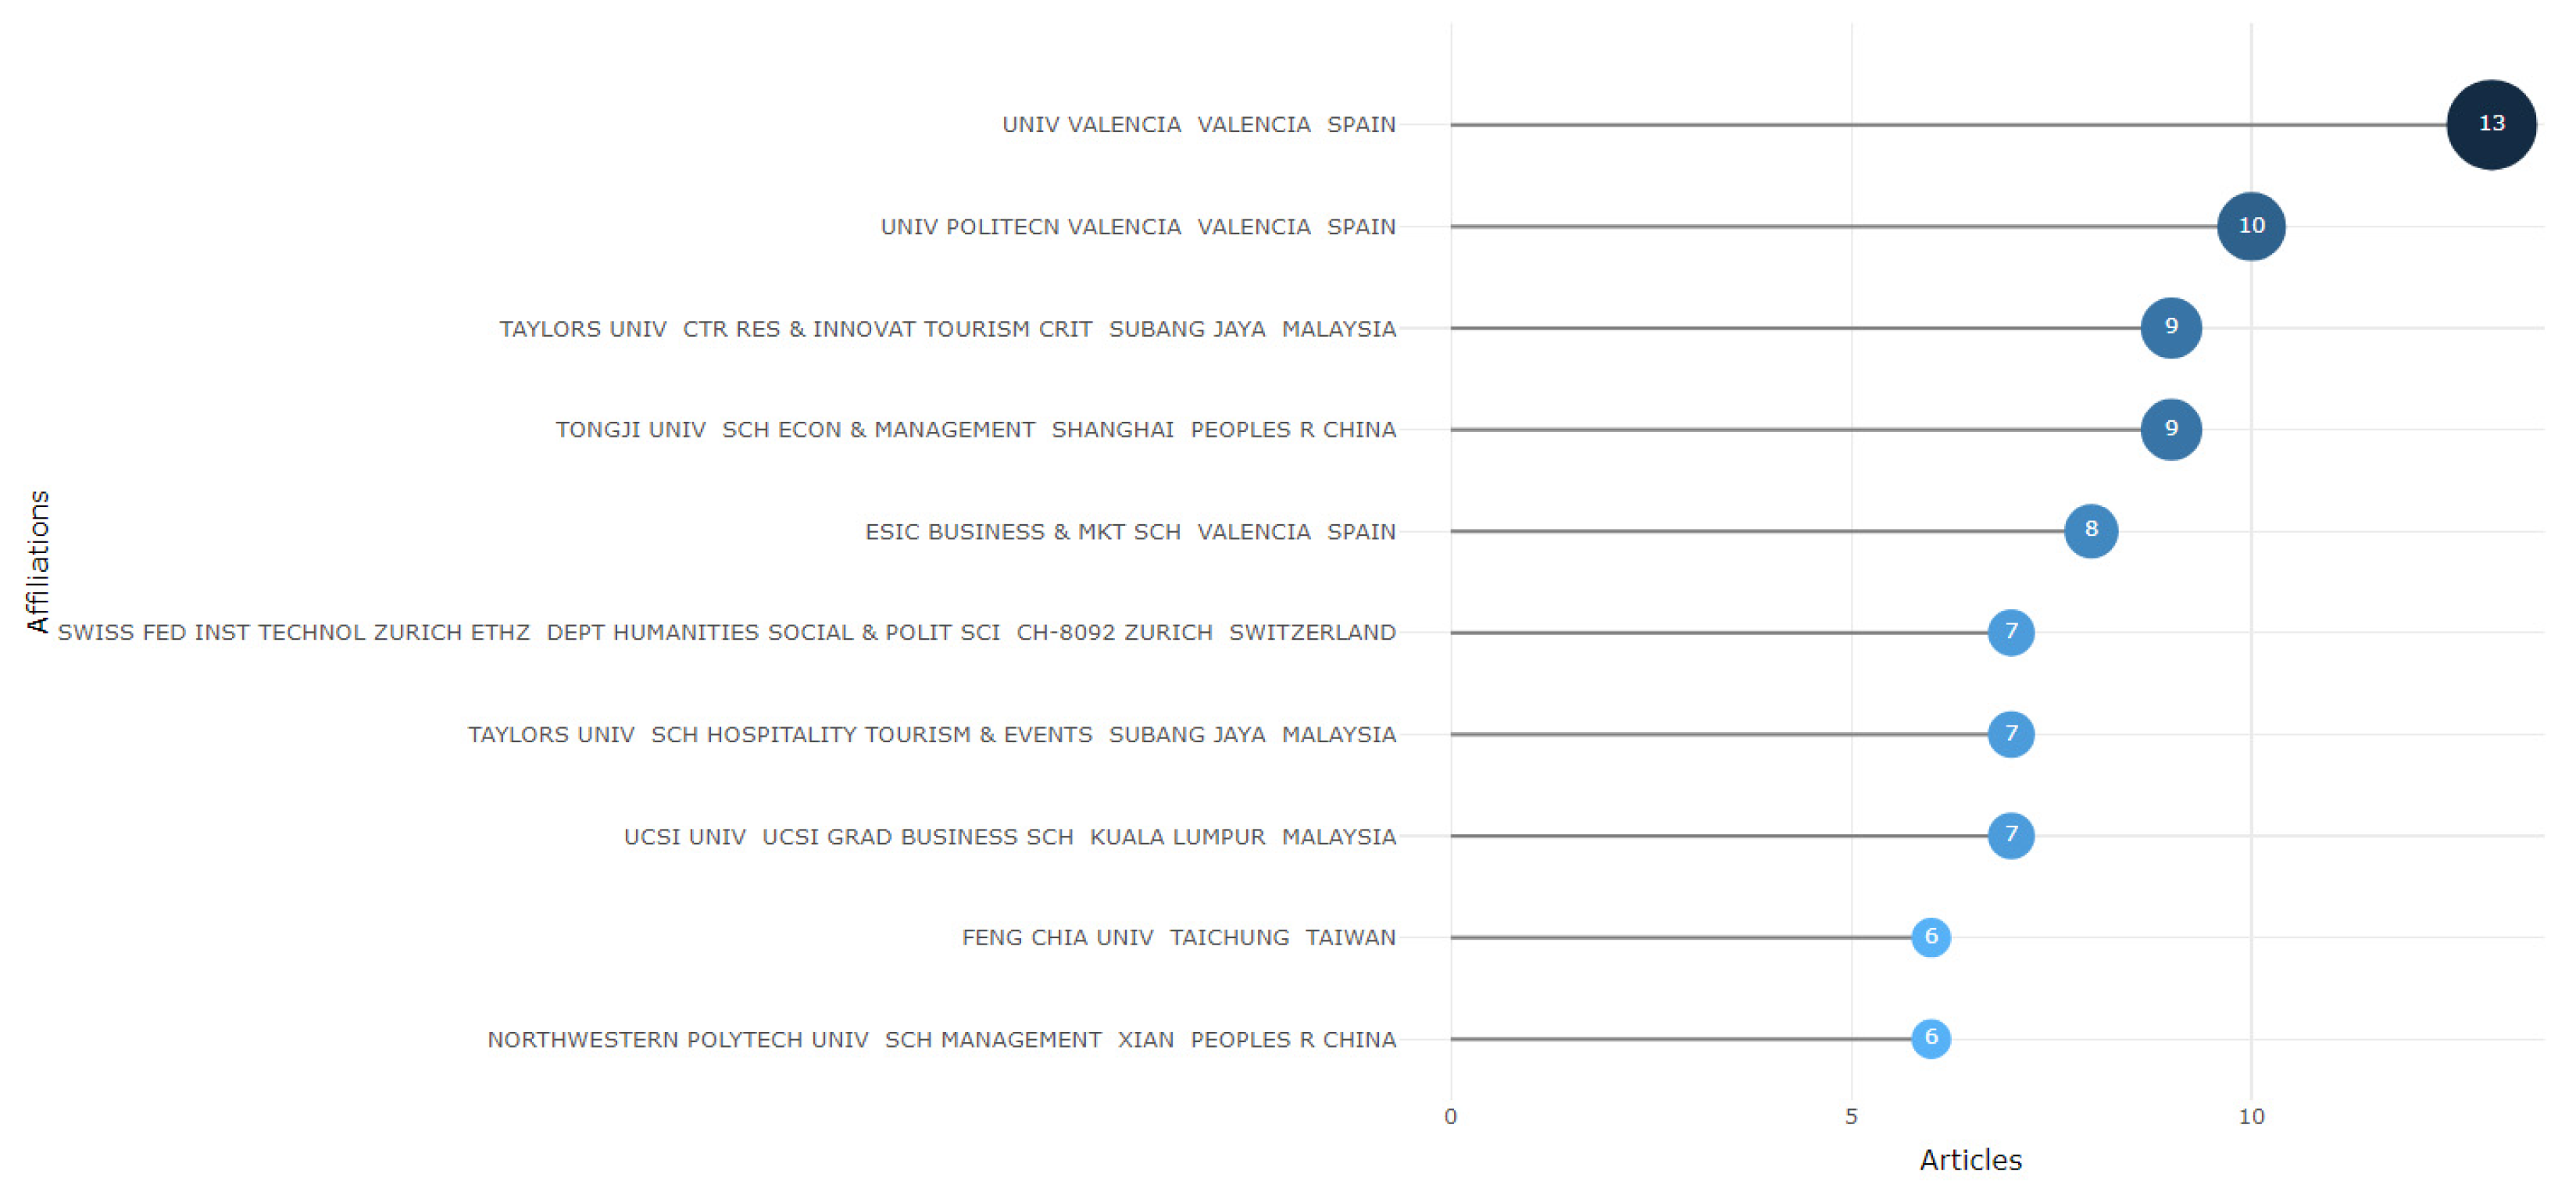
Figure 9.
Countries’ Scientific Production.
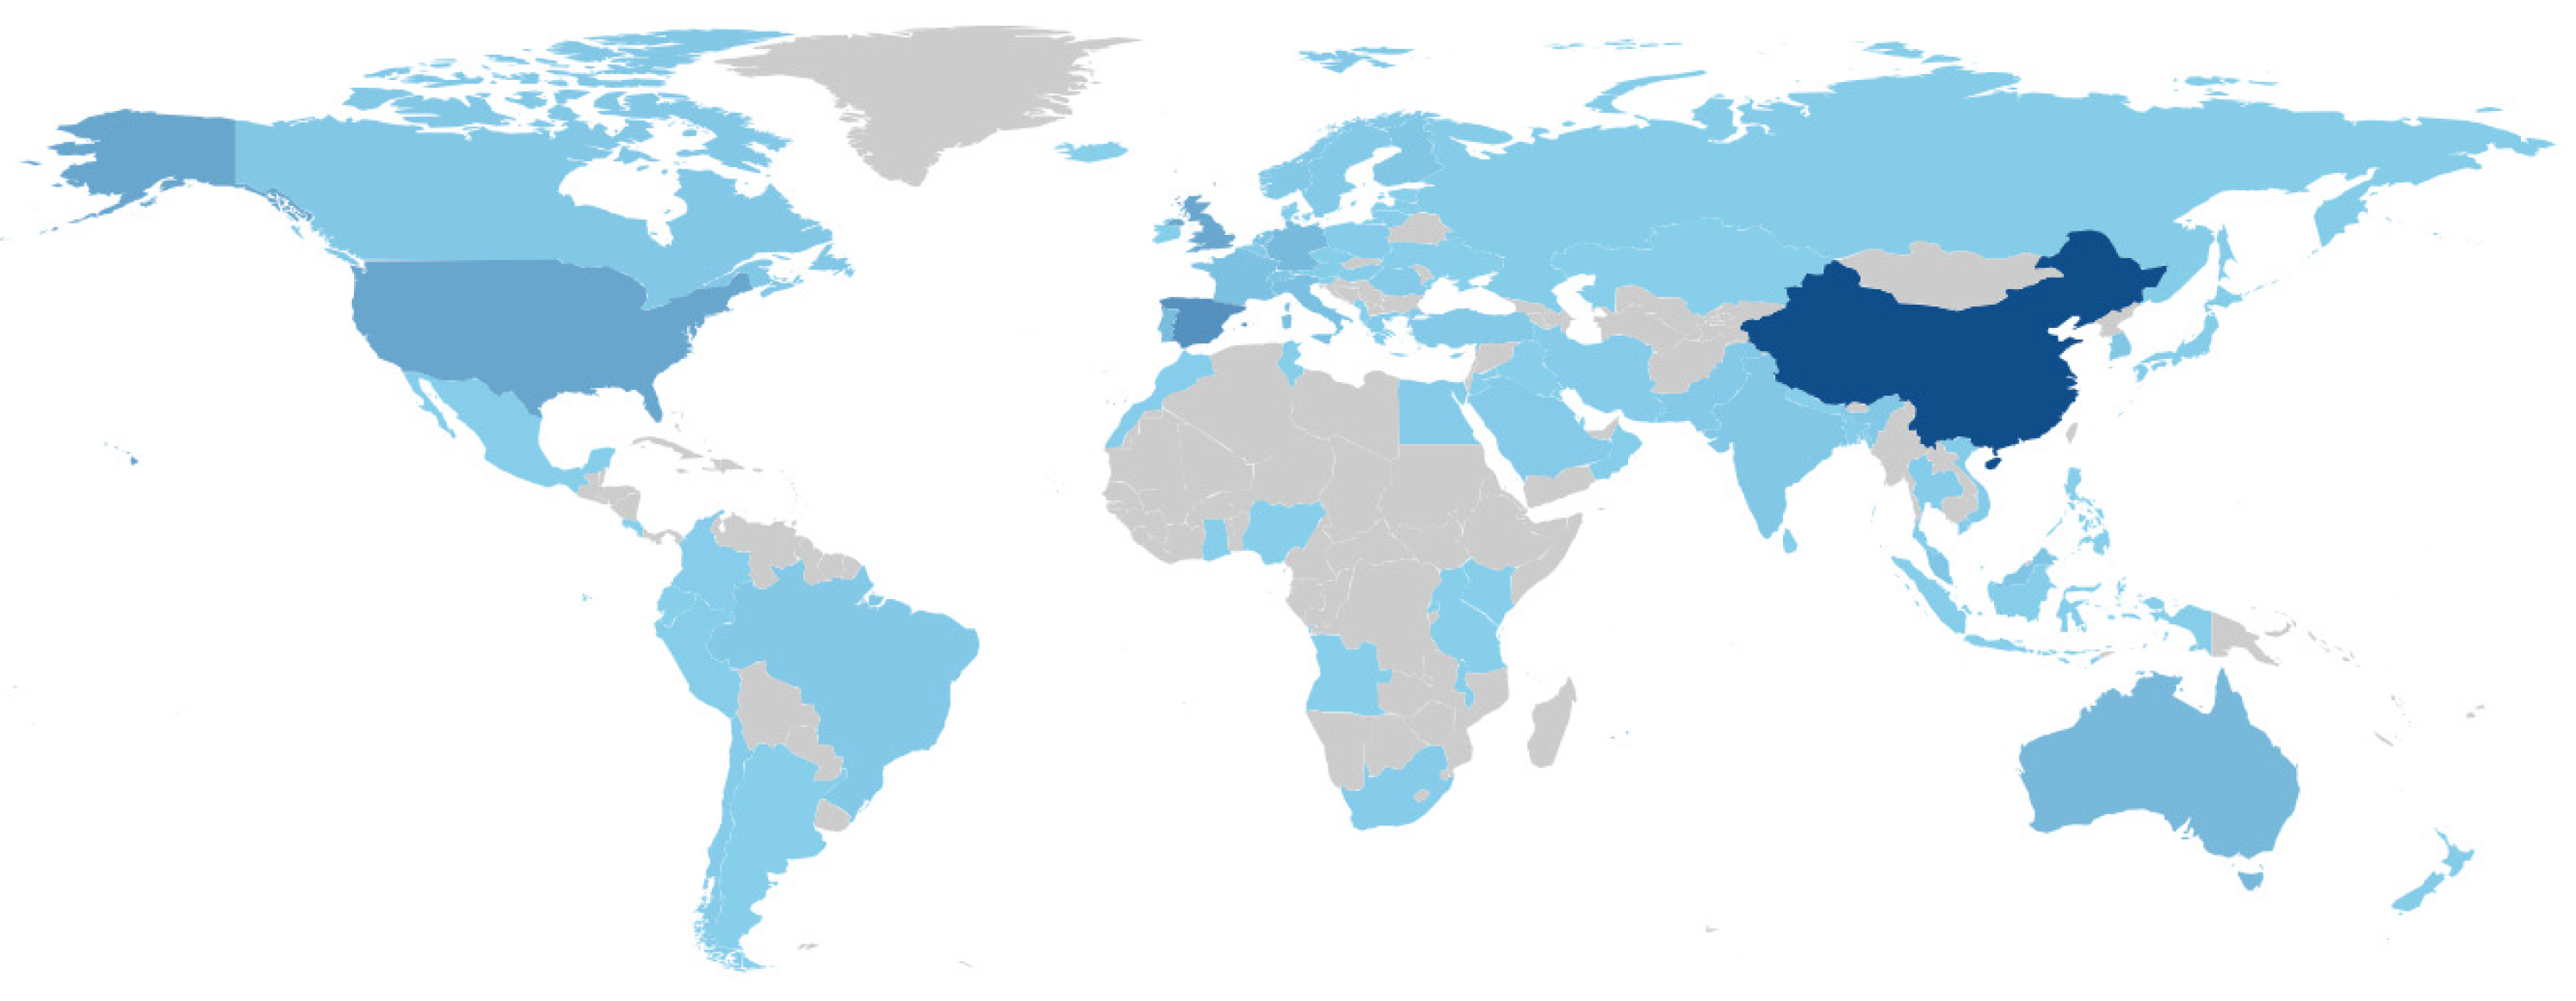
Figure 10.
Most global cited papers.
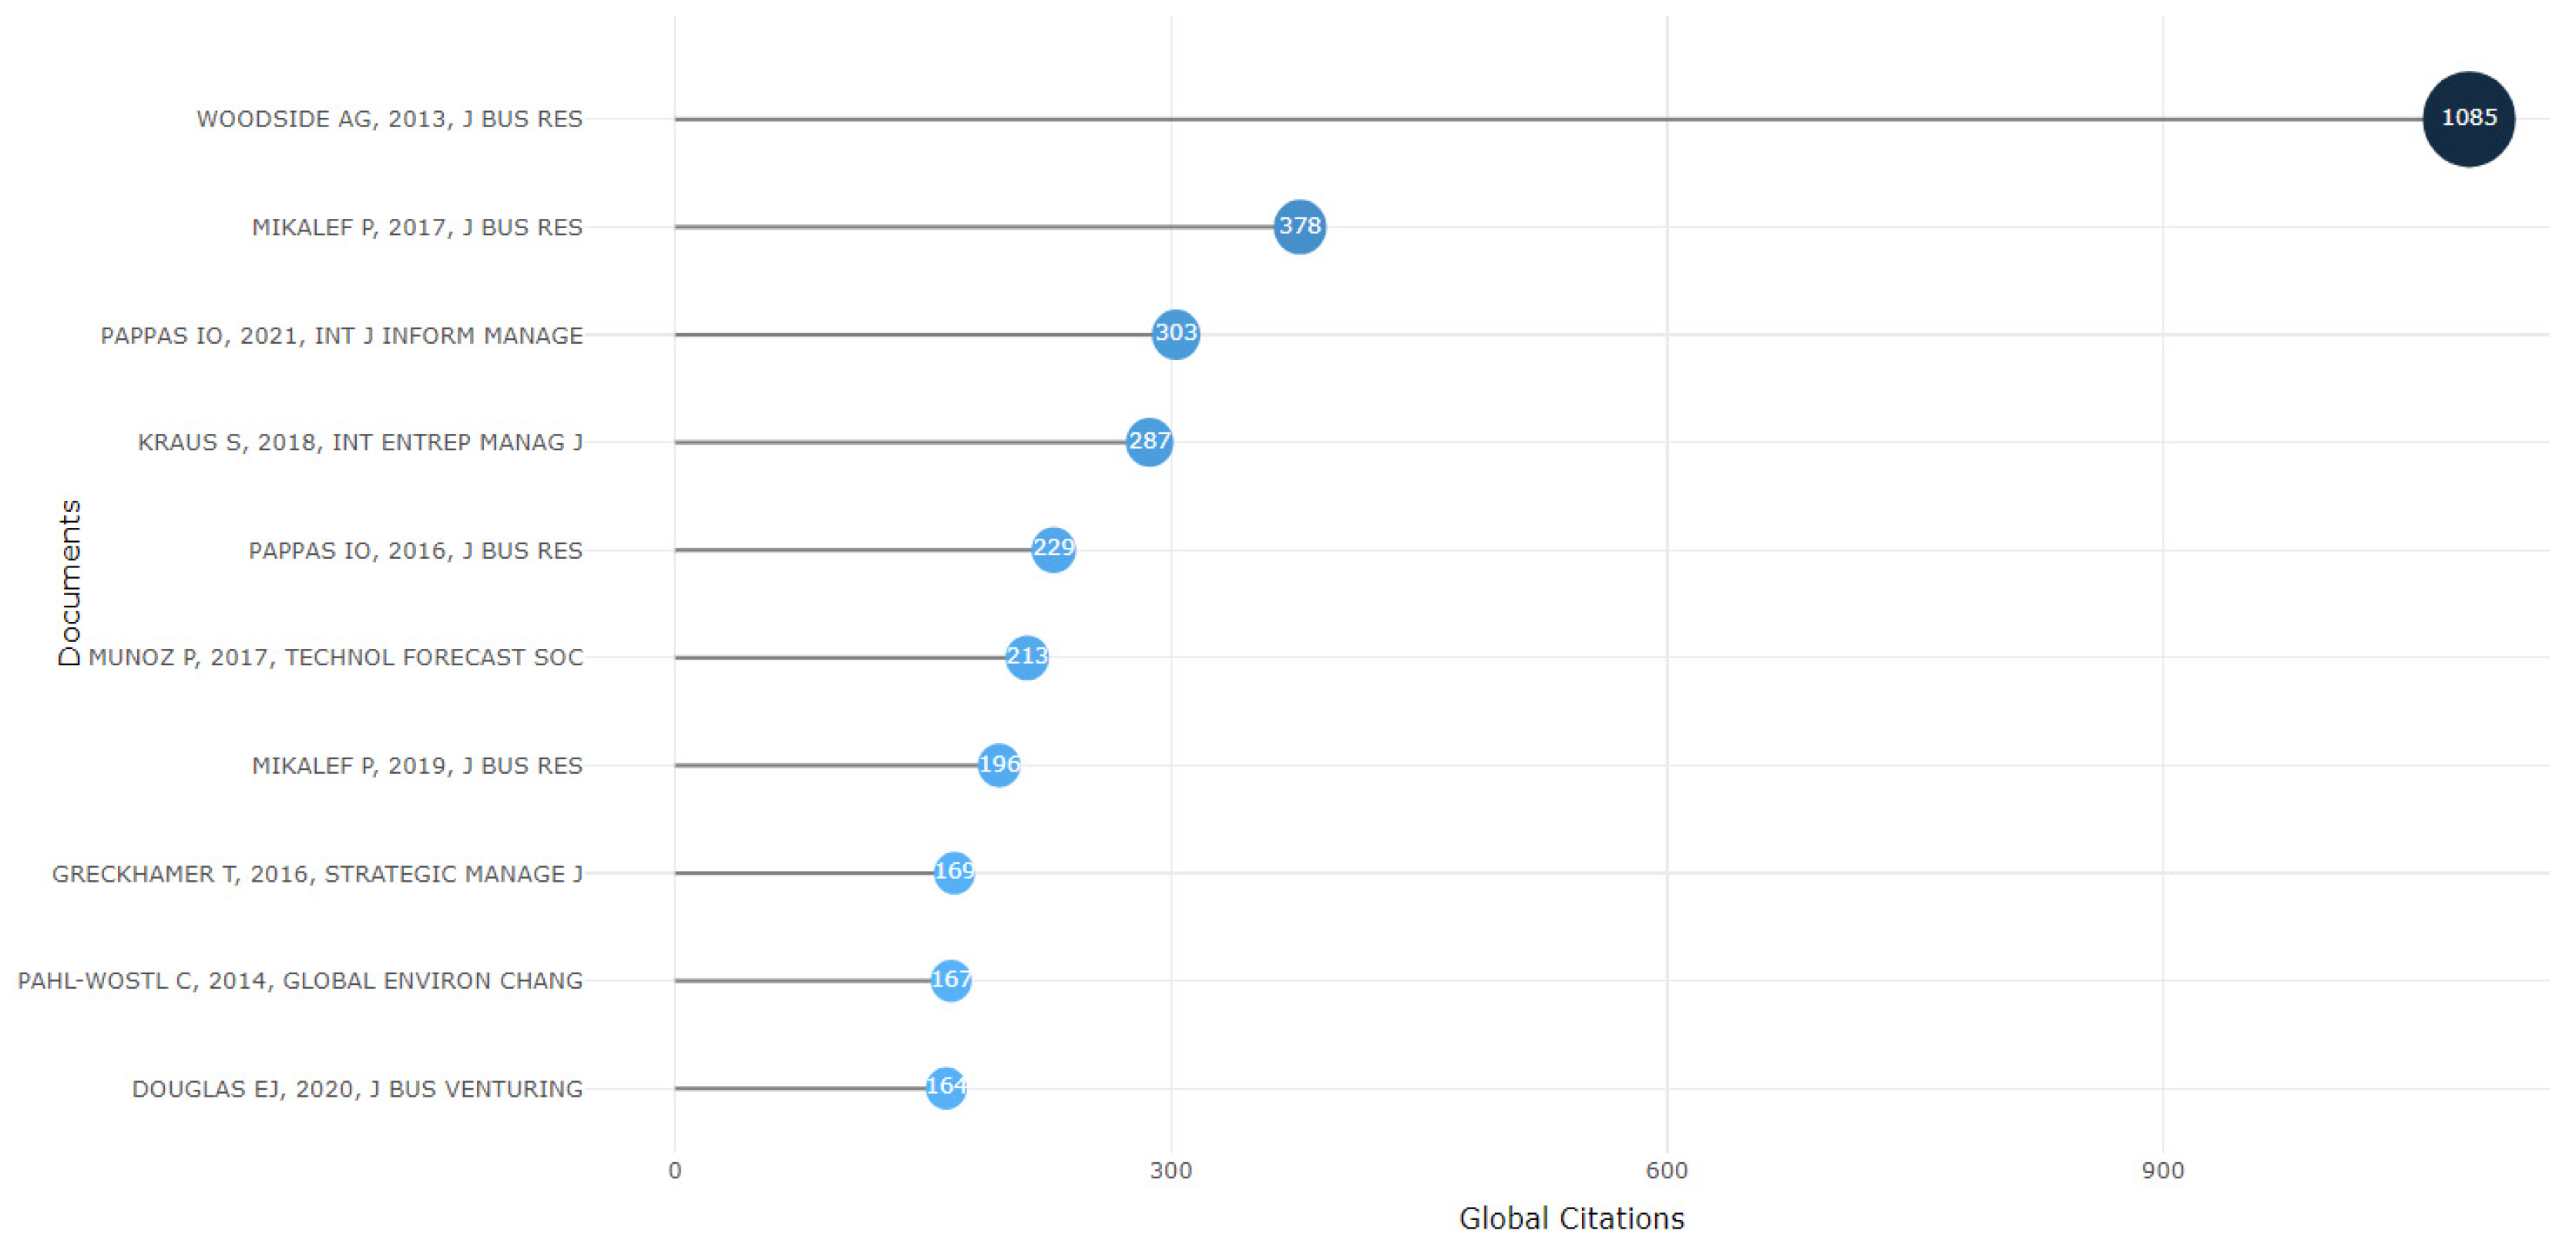
Figure 11.
Most local cited references.
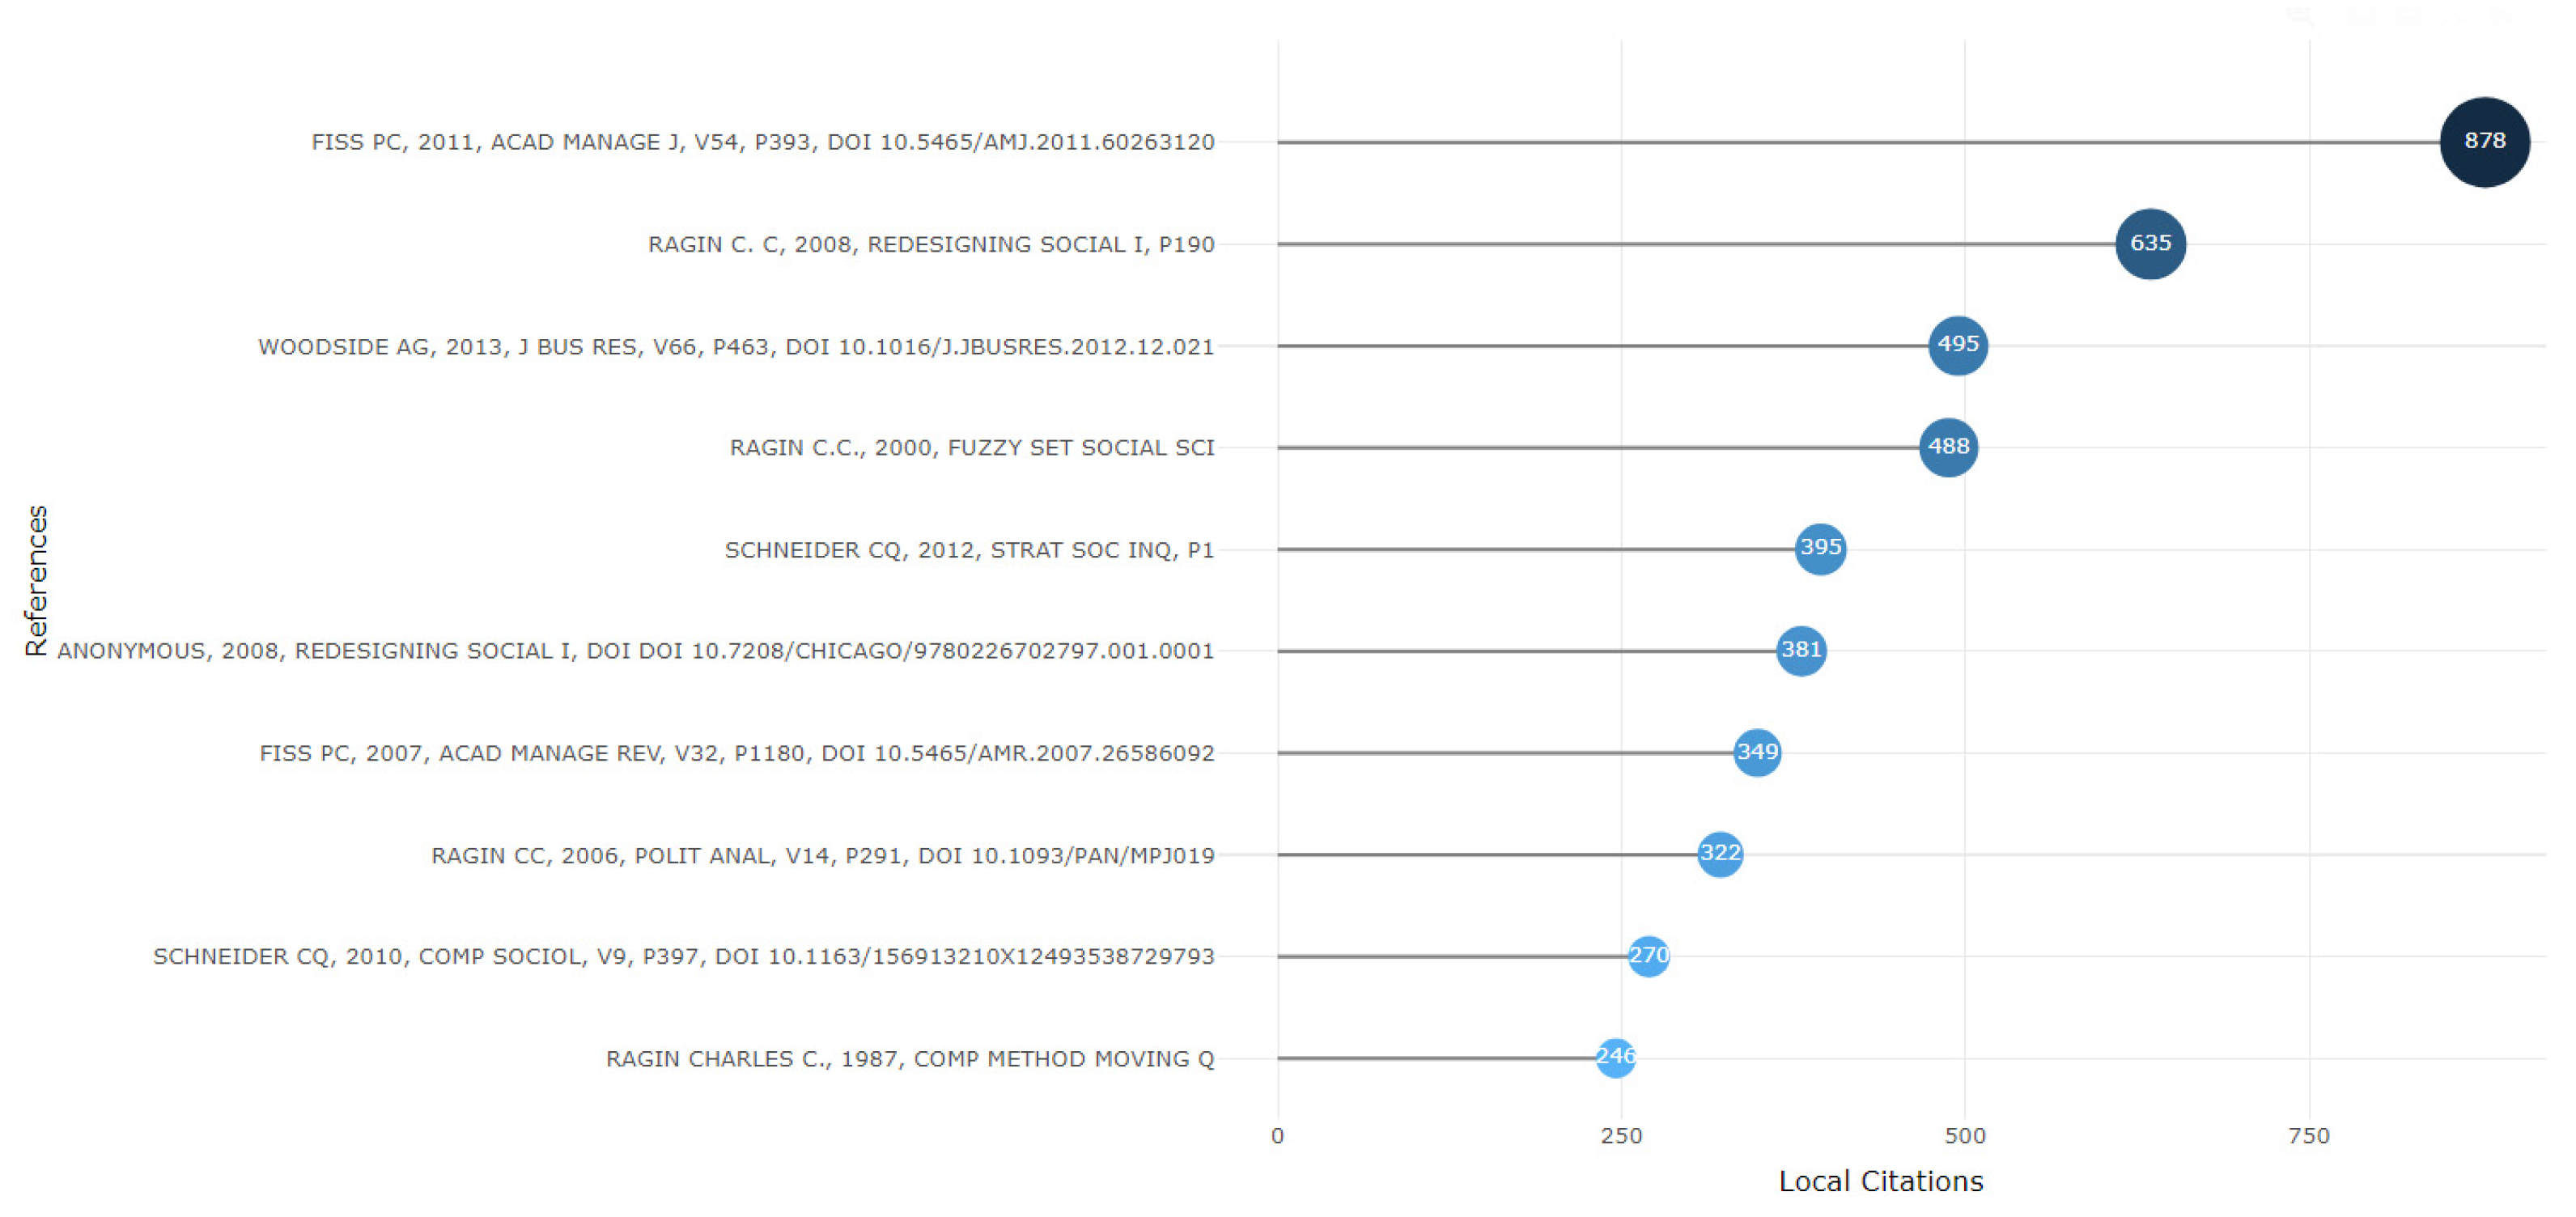
Figure 12.
Most frequent words.
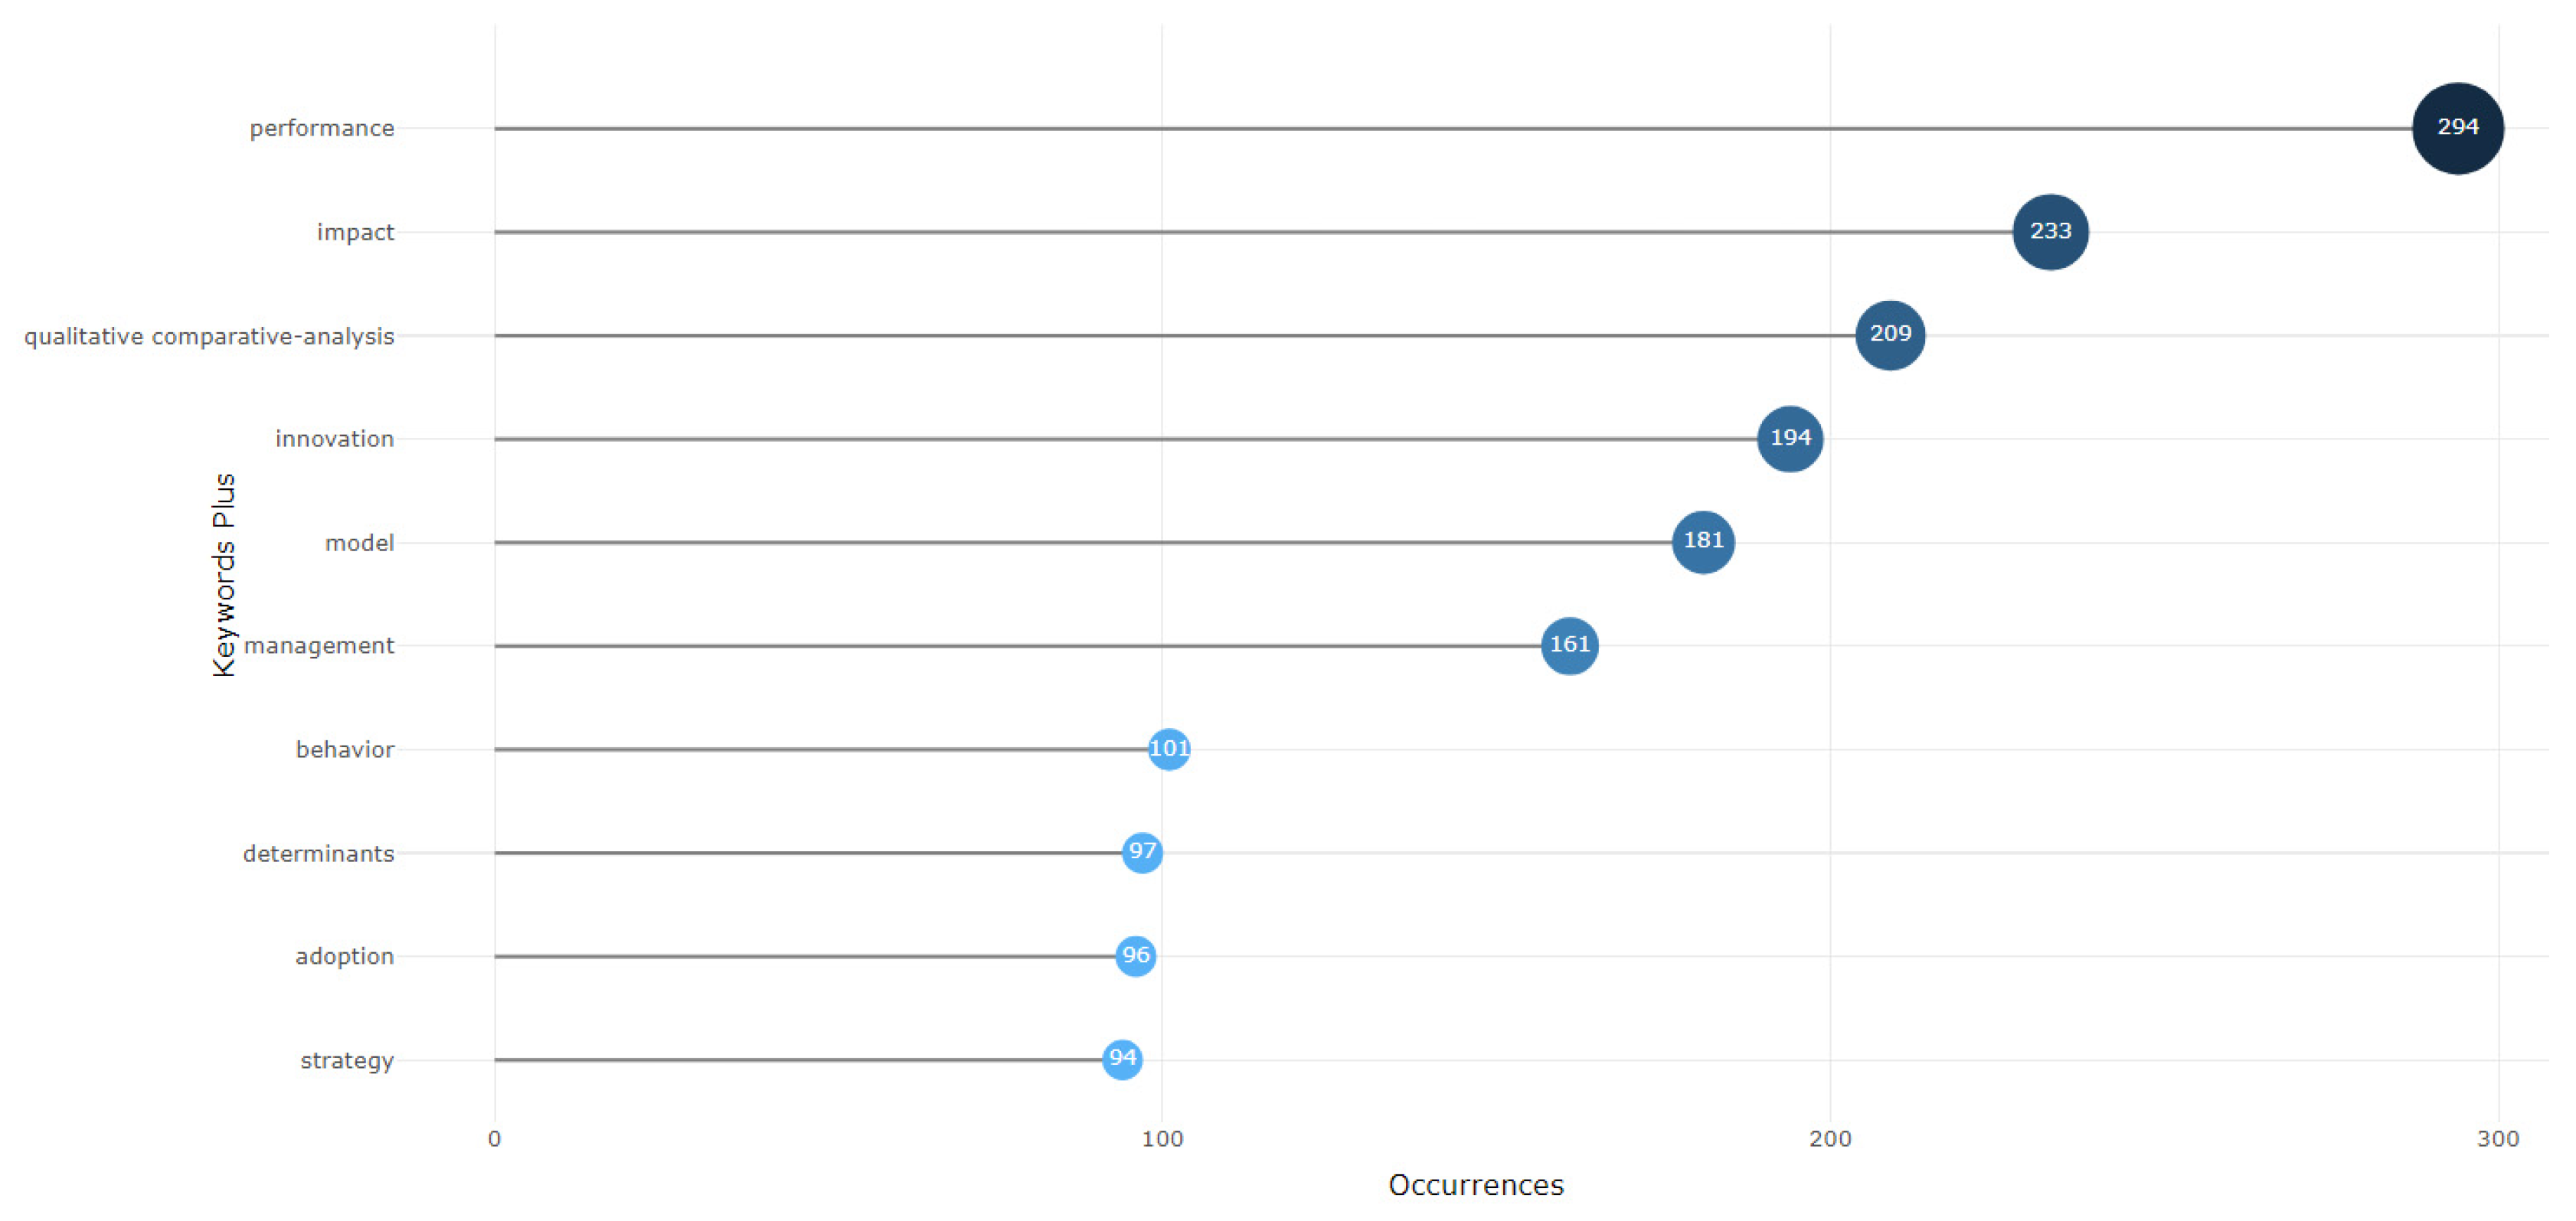
Figure 13.
WordCloud.
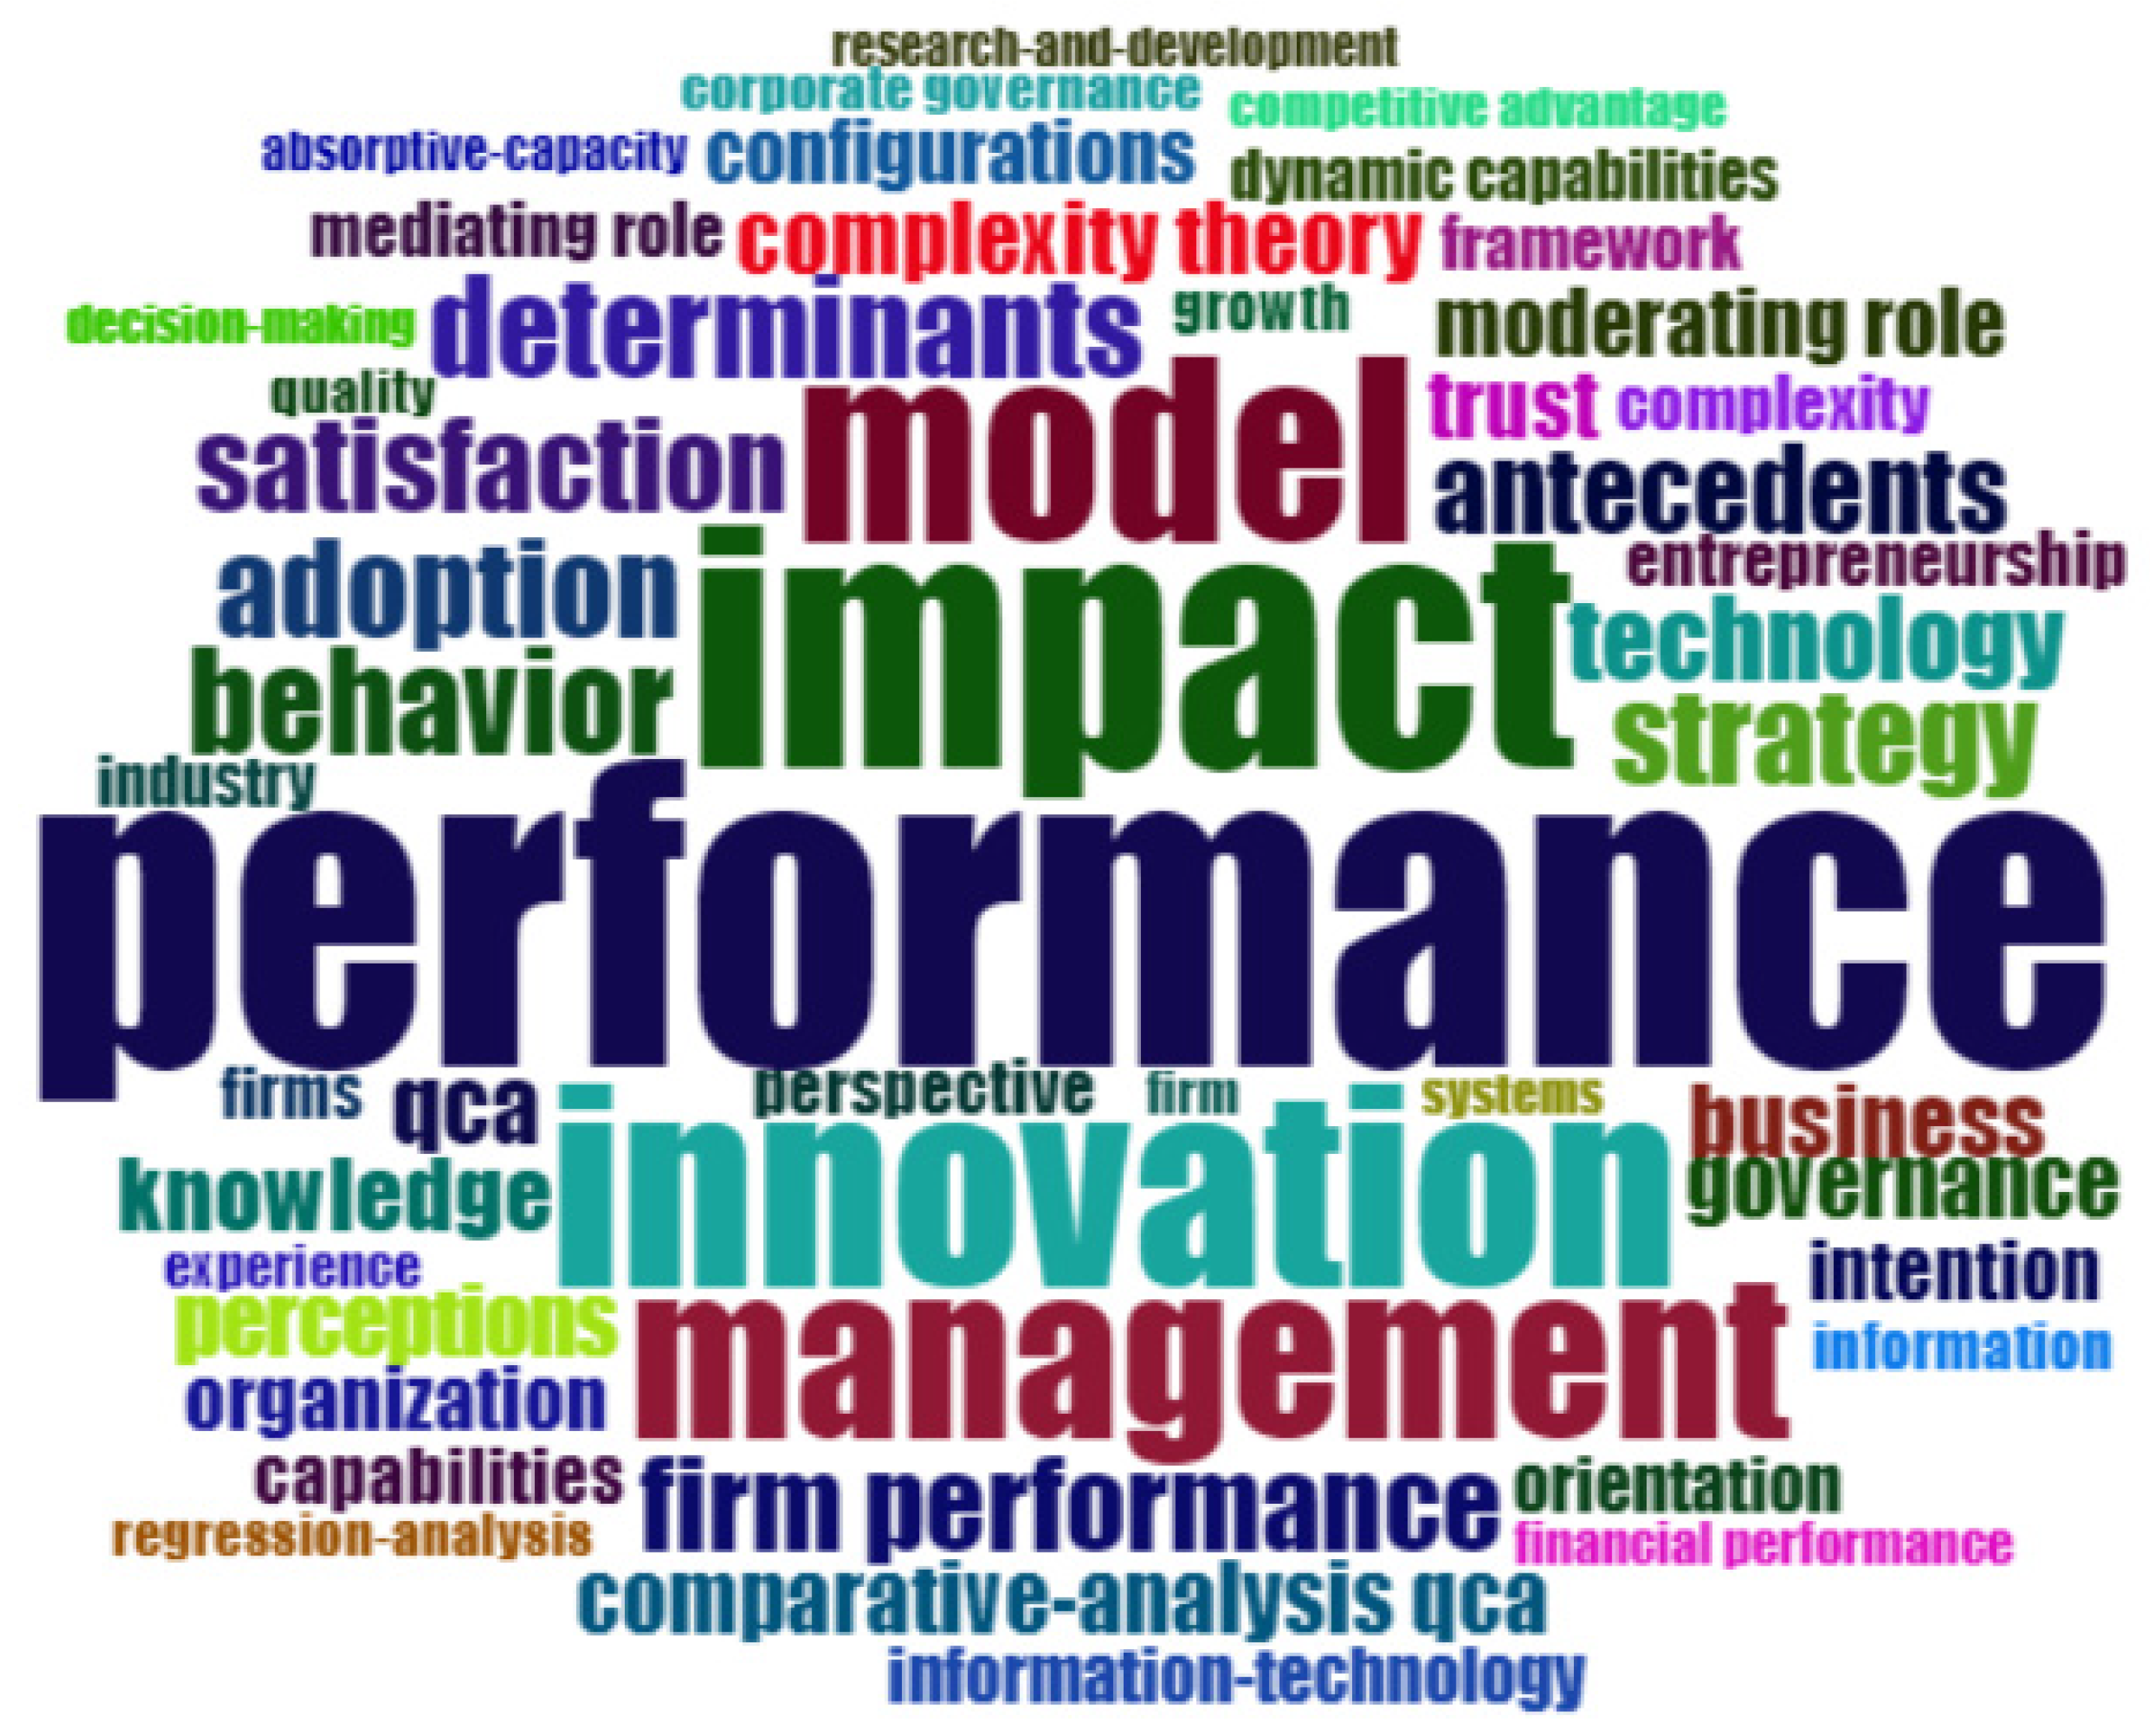
Figure 14.
TreeMap.
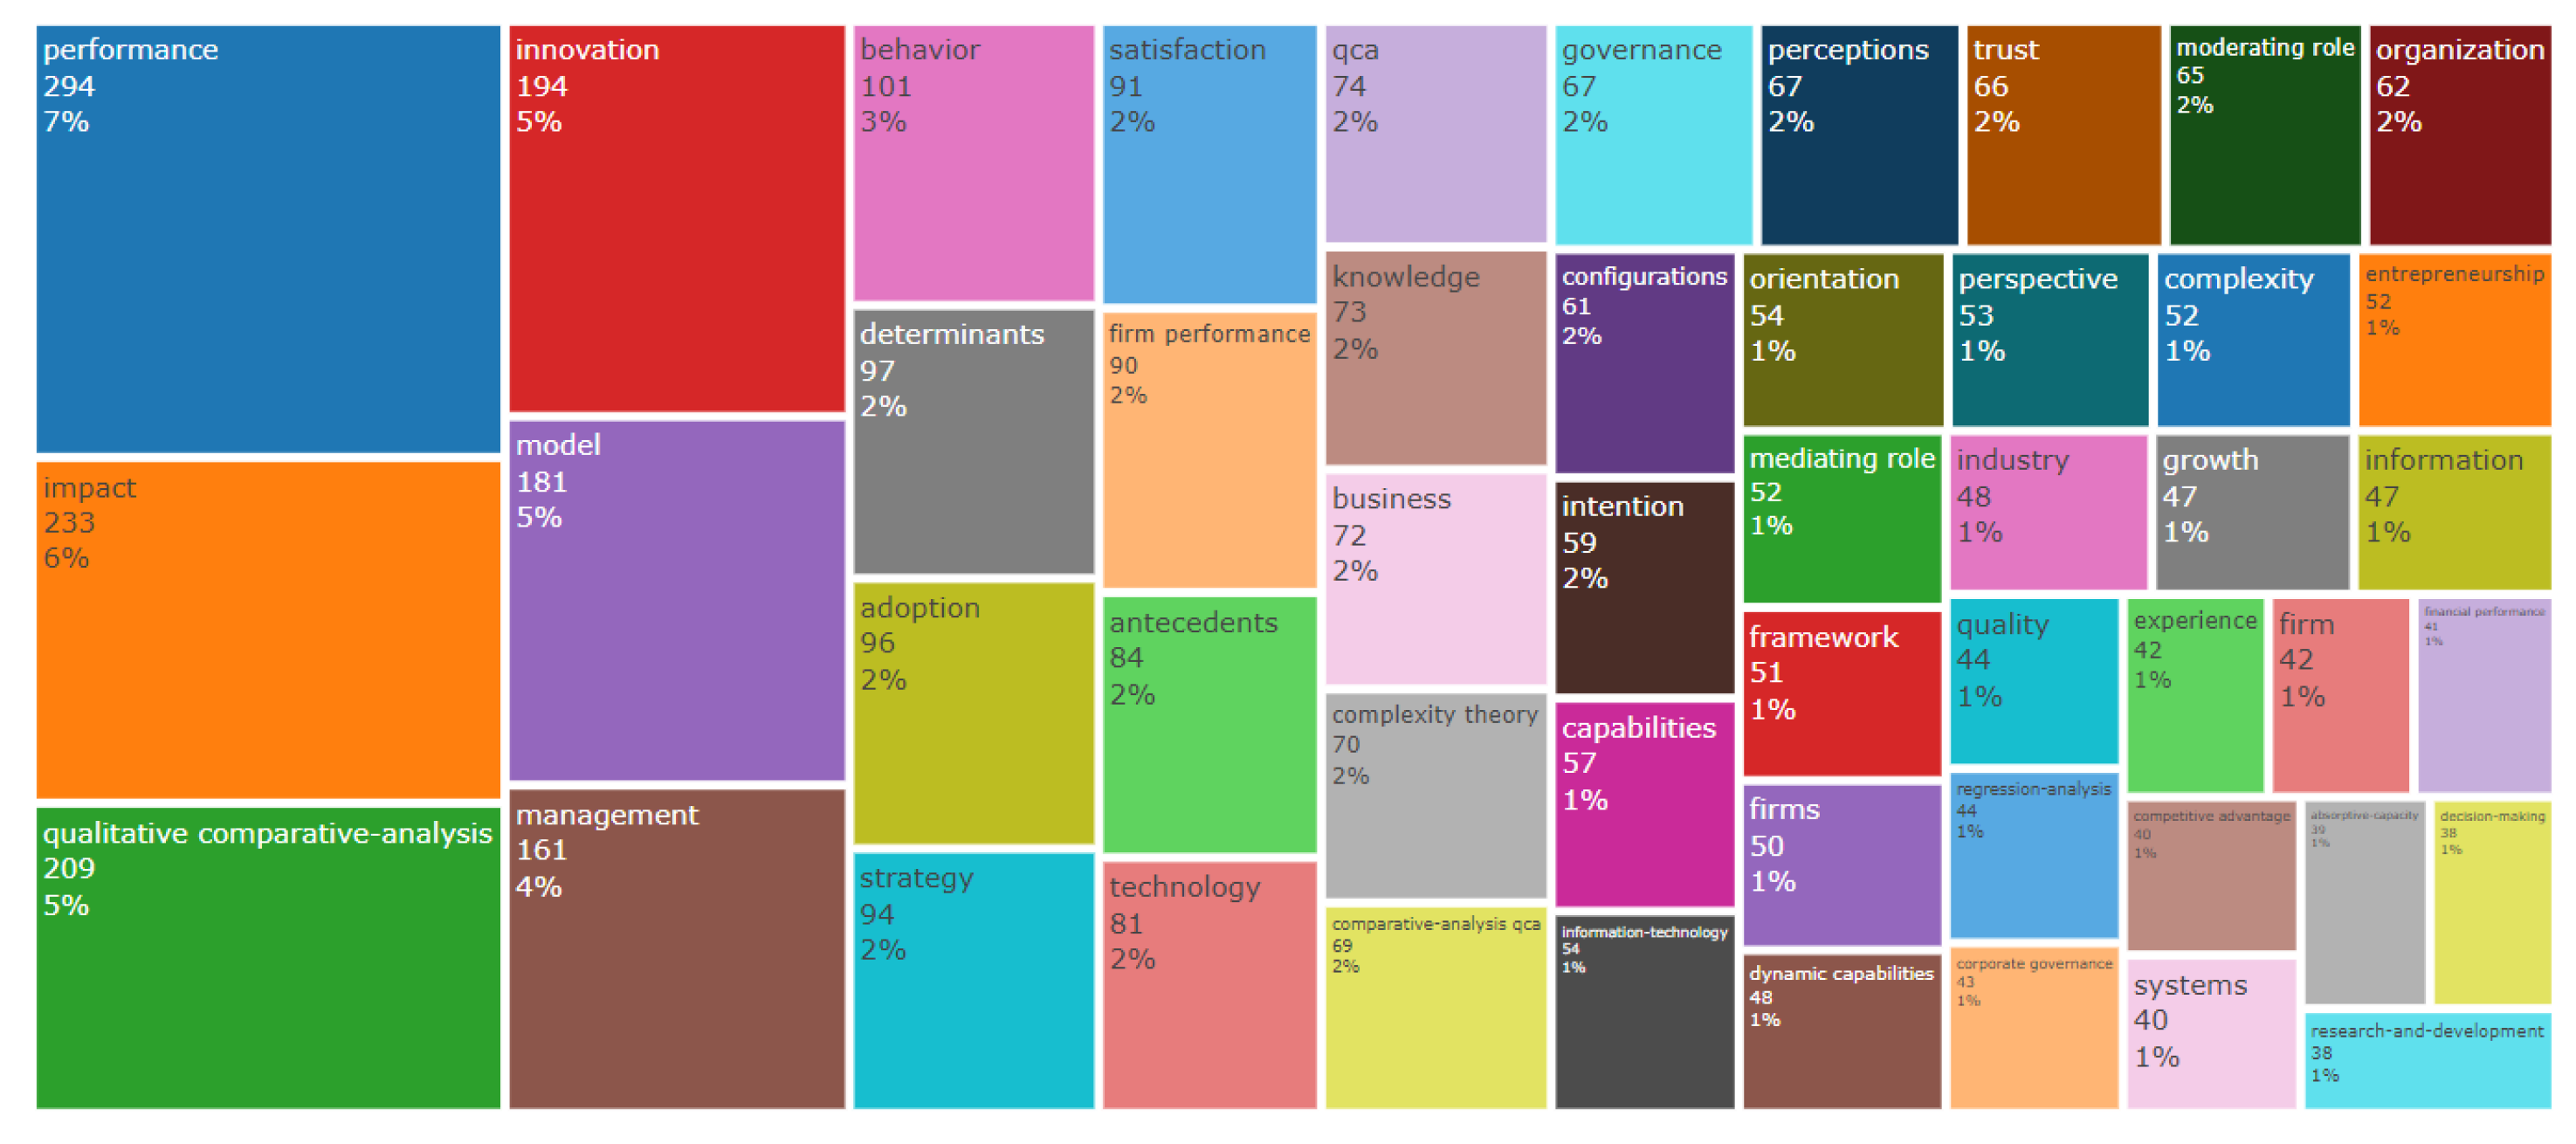

Table 1.
Raw distribution of QCA variants throughout the period from 2013 to July 2023.
| Variants of the QCA method | Absolute value | Percentage value (%) |
|---|---|---|
| fsQCA | 1479 | 95.11 |
| csQCA | 60 | 3.86 |
| mvQCA | 16 | 1.03 |
Table 2.
Raw distribution of published articles throughout the period from 2013 to July 2023.
| Year | Articles | Average per year (articles per month) |
|---|---|---|
| 2013 | 18 | 2 |
| 2014 | 17 | 1 |
| 2015 | 36 | 3 |
| 2016 | 132 | 11 |
| 2017 | 70 | 6 |
| 2018 | 111 | 9 |
| 2019 | 126 | 11 |
| 2020 | 156 | 13 |
| 2021 | 241 | 20 |
| 2022 | 385 | 32 |
| 2023 | 263 | 44 |
Disclaimer/Publisher’s Note: The statements, opinions and data contained in all publications are solely those of the individual author(s) and contributor(s) and not of MDPI and/or the editor(s). MDPI and/or the editor(s) disclaim responsibility for any injury to people or property resulting from any ideas, methods, instructions or products referred to in the content. |
© 2023 by the authors. Licensee MDPI, Basel, Switzerland. This article is an open access article distributed under the terms and conditions of the Creative Commons Attribution (CC BY) license (http://creativecommons.org/licenses/by/4.0/).
Copyright: This open access article is published under a Creative Commons CC BY 4.0 license, which permit the free download, distribution, and reuse, provided that the author and preprint are cited in any reuse.


