
Submitted:
26 November 2023
Posted:
27 November 2023
You are already at the latest version
Abstract
Many large-scale studies revealed that exogenous erythropoietin, erythropoie-sis-stimulating agents, have no renoprotective effects. We investigated the effects of en-dogenous erythropoietin on renal function in ischemic reperfusion injury (IRI) of kidney using prolyl hydroxylase domaine (PHD) inhibitor, Roxadustat (ROX). 4 hr hypoxia (7% O2) and 4 hr treatment by ROX prior to IRI did not improve renal function. In contrast, 24-72 hr pre-treatment by ROX largely improved the decline of renal function by IRI. Hy-poxia and 4 hr ROX increased interstitial cells-derived Epo production by 75 and 6-fold, respectively, before IRI and worked as exogenous Epo. 24-72 hr ROX treatment increased Epo production during IRI by 9-fold. Immunohistochemistry revealed that 24 hr ROX caused Epo production in proximal and distal tubules and worked as endogenous Epo. Our data show that 24-72 hr ROX-induced tubular endogenous Epo production results in renoprotection but peritubular exogenous Epo production by interstitial cells-derived in-duced by hypoxia and 4 hr ROX did not. Stimulation of tubular but not peritubular Epo production may link to renoprotection.
Keywords:
erythropoietin
; PHD inhibitor
; hypoxia
; deglycosylation
; proximal tubules
; distal tubules
; renal erythropoietin-producing interstitial cells
1. Introduction
Erythropoietin was found from urine of anemic patients [1,2]. Erythropoiesis-stimulating agents (ESAs) have largely changed the treatment of renal anemia [3,4,5,6]. Many large-scale studies have investigated the effects of ESAs for the progression of chronic renal failure and found that ESAs have no renoprotective effects [5,7,8,9]. Prolyl hydroxylase domain (PHD) inhibitors have been used for the treatment of renal anemia instead of ESAs due to the easiness of oral intake [6,10,11,12,13,14,15]. Produced Epo by ESAs works as exogenous Epo. In contrast, PHD inhibitors stimulate endogenous Epo production. PHD inhibitor inhibits PHD activity and increase HIF2α expression to increase endogenous Epo production [16,17,18]. Production of endogenous Epo has additional effects other than Epo itself. There would be many products other than Epo. Endogenous Epo is known to decrease IL-6 and MCP-1 production by macrophages [19]. The differences of the physiological effects between exogenous and endogenous Epo are not clear yet. Epo pretreatment has been used as a substitute to preconditioning to ischemia [20,21,22,23,24]. Some reports showed a significant improvement of IRI by Epo pretreatment due to the reduction of inflammation or oxidative stress but some did not. Inflammation is known to affect anemia [25]. Epo pretreatment examined the effects of exogenous Epo on renal function. We have invented the deglycosylation-coupled western blotting of Epo in blood, urine and tissue [26,27,28]. Our method improved the sensitivity and specificity of the detection of Epo especially in tissue. We also investigated tubular Epo production by immunohistochemistry (IHC) [26,29,30,31]. Our IHC helps to distinguish the site of Epo production and exogenous/endogenous Epo.
There are two sites of Epo production in the kidney: interstitial cells and nephron [26,29,30,31,32,33,34,35,36,37]. Epo production by the interstitial cells is not seen in control condition and is stimulated extremely only in severe hypoxia and anemia [16,38,39]. In contrast, Epo production by the nephron is observed in the control condition and is stimulated several fold by renin-angiotensin-aldosterone system (RAS) [40,41,42,43,44]. In our study, exogenous Epo means peritubular production of Epo by the interstitial cells. Epo is also produced as endogenous one by the nephron and acts as endogenous one. Thus exogenous Epo means peritubular one and endogenous Epo is tubular one in our study. We investigated the effects of endogenous Epo on renal function in IRI, a model of acute kidney injury (AKI).
2. Results
Serum creatinine levels pre- and post-IRI
IRI caused an increase of serum creatinine from 0.53 0.02 to 2.52 0.29 mg/dl. Severe hypoxia and 4 hr-ROX (R4) did not decrease serum creatinine level. In contrast, 24 hr-ROX (R24) and 72 hr-ROX (R72) significantly decreased creatinine levels (2.521.69, 1.400.26, 0.76**, and 0.97** by control, hypoxia, R4, R24 and R72, respectively, **p<0.01 by ANOVA and Scheffe’s multiple comparison, Figure 1).
Plasma Epo Concentration before and after IRI
Plasma Epo concentration was examined before and after IRI. High plasma Epo concentration was observed in hypoxia and R4 group (Figure 2). Only R4 group showed high plasma Epo concentration after IRI. This high plasma Epo concentration in R4 group was thought to be caused by the Epo production before IRI.
Western blot analysis of Epo production during IRI
To know the Epo production during IRI, western blot analysis was performed using the kidney after IRI. We first examined Epo detection both in the absence and presence of PNGase (Figure 3 and Figure 4). It is difficult to detect glycosylated Epo at 35-38 kDa (left lanes in Figure 3 and Figure 4). It is easy to detect deglycosykated Epo at 22 kDa (right lanes in Figure 3 and Figure 4). Deglycosylated Epo production was examined at pre- and post-IRI. Hypoxia caused high Epo production before IRI and R4 showed slight increase of Epo production (75 and 6 fold increase compared with control, Figure 5). Epo production by R4 group is lower than our previous report. Our previous reports examined at 6 hr after the injection of ROX. Therefore, maximum increase of Epo production was thought to be caused during the formation of IRI in R4 group. In contrast, Epo production after IRI was highest in R24 group (9 fold increase compared with control, Figure 5).
Epo mRNA expression before and after IRI
Epo mRNA expression was very high in hypoxia and R4 groups and very low in R24 and R72 groups before IRI (Figure 6). Epo mRNA after IRI was highest in R4 group and very low in hypoxia group. R24 and R72 groups showed slight increase of Epo mRNA expression.
Immunohistochemistry (IHC) of Epo production by the kidney
Since Epo production in the kidney was stimulated by R24, we examined the site of Epo production by IHC. R24 group showed the production of Epo by the proximal convoluted tubules and the distal tubules (brown staining in Figure 7). Proximal tubules showed higher production than distal tubules. Interstitial cells showed no production of Epo by R24.
Epo staining was not observed in control and ROX without IRI. Epo staining is detected in 24 hr-ROX but not in control after IRI (upper panel). Strong vesicular staining was detected only in the proximal tubules (middle panel), and weak staining was detected in the distal tubules (distal convoluted tubules and cortical collecting ducts) (lower panel) after IRI with 24 hr-ROX. PT, proximal tubule; DT, distal tubule.
Western blot analysis of autophagy and apoptosis
We examined the expression of LC3-II and p62 in the kidney to know whether autophagy is involved in the renoprotective effects of Epo. LC3-II and p62 expressions were not changed by hypoxia and ROX (Figure 8a). Next, BAX and Bcl-2 expressions in the kidney were examined to know the participation of apoptosis in the renoprotective effects of R24. Bcl-2 expression was lower in the kidney cortex than medulla. BAX and Bcl-2 expressions were not changed by hypoxia or ROX (Figure 8b).
Tubular protein and mRNA expressions in the kidney during IRI
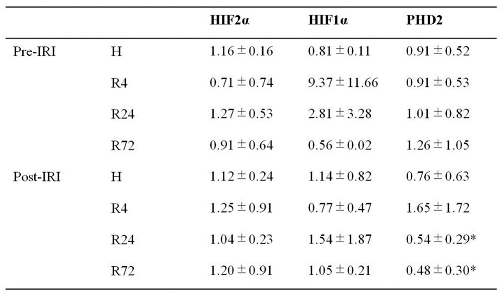
The expressions of HIF2α and HIF1α during IRI were not changed by hypoxia and ROX except the decline of PHD2 mRNA expression in R24-72 (Table 1). PEPCK (Pck-1) is mainly present in the proximal convoluted tubules. We examined PEPCK expression after IRI. R24-72 showed higher expression than hypoxia and R4 group (Figure 9). GR (NR3C1) is present in proximal convoluted tubules and early distal tubules. Rhcg is present in distal convoluted tubules and collecting ducts. mRNA expression of GR and Rhcg were increased in R24 group (Figure 10).
3. Discussion
Our present study showed that administration of ROX 24-72 hr prior to the induction of IRI protected the decline of renal function by stimulating the tubular endogenous Epo production. Stimulation of Epo production before IRI by 4 hr hypoxia and during IRI by R4 largely increased interstitial cells-derived Epo production and served as exogenous Epo but did not protect the decline of renal function. In our IRI model, hypoxia and R4 stimulated Epo production by the interstitial cells judging from high plasma Epo concentration. The Epo production by the nephron during IRI by R24-72 was small and did not increase plasma level. Our deglycosylated western blot and immunohistochemistry revealed Epo production during IRI.
Renoprotective effects of PHD inhibitors have been reported but the results are controversial [45,46,47,48,49]. Many mechanisms such as the reduction of inflammation, oxidative stress or apoptosis have been suggested. We have employed deglycosylation-coupled western blotting and immunohistochemistry for the detection of Epo protein in the kidney. We found that exogenous Epo has no reoprotective effects as previously revealed by many large scale studies [7,8]. The HIF2α and HIF1α during IRI was not changed by 4 groups except the decline of PHD2 mRNA expression in R24-72, suggesting that R24-72 caused endogenous Epo production by the some parts of proximal and distal tubules. IRI is known to induce the damages of proximal tubules. The increased expression of PEPCK and GR mRNA by R24-72 revealed the recovery of proximal tubules. The increase of Rhcg mRNA expression showed the recovery of collecting ducts. Therefore, R24-72 seemed to recover not only proximal but also distal tubular functions.
We investigated the mechanisms of renoprotection by Epo production. Autophagy and reduction of apoptosis can induce renoprotection [50,51]. However, western blot analysis of LC3-II and p62 expression was no changed by 24-72 hr ROX. The expression of BAX and Bcl-2 were also unchanged. These data suggest the lack of autophagy and apoptosis by ROX.
Epo receptor has some role for the effects of Epo on tubular function [51]. Epo receptor in the kidney exist in the inner medullary collecting ducts [52]. Inner medullar collecting ducts are the terminal site of the nephron and are important site for urine concentration. Therefore, renoprotective effect of tubules-produced Epo is thought to be caused not by the activation of Epo recepotor.
It is interesting that tubules are the site of Epo production in this IRI model. Renal Epo producing (REP) cells have been known to produce large amount of Epo, but small production of Epo by the nephron was enough to protect against renal failure by IRI. We and others have shown that RAS regulates Epo production by the collecting duct [29,31,38,40,41,42,43,44]. Taken together, endogenous Epo production by the tubules has thought to have important role for the maintenance of kidney function even though with lower capacity of Epo production. We have shown that aldosterone and angiotensin-II stimulate Epo production by the collecting ducts, especially by the intercalated cells [29,31]. The endogenous Epo production by the proximal tubules is larger than those by the distal tubules in this IRI model. This is probably IRI causes larger damages in the proximal tubules than distal ones, suggesting that proximal and distal tubules can produce Epo in response to local hypoxia. We have distinguished peritubular Epo production by REP cells from tubular endogenous Epo production. Our data clearly show that small productio of tubular endogenous Epo has renoprotective effect, while REP cell-derived large amount of peritubular Epo production has no effects on tubular function. Large-scale studies showed the lack of renoprotective effect by ESAs same as 4 hr-hypoxia and R4 [5,7,8,9]. Considering the renoprotection by Epo production, the methods to induce tubular Epo production would be useful. One of the key to find the useful tools for the renoprotection is the effect that RAS systems have some interaction with tubular Epo production [29,31,38,40,41,42,43,44].
In summary, 24-72 hr ROX caused renoprective effects by stimulating tubular endogenous Epo production but peritubular interstitial cells-derived exogenous Epo production induced by 4 hr-hypoxia and 4 hr-ROX did not repair tubular dysfunction. How to induce tubular endogenous Epo production might have a crucial role for renoprotection.
4. Materials and Methods
Materials and animals
Male Sprague Dawley rats (200-250g, Japan SLC, Hamamatsu, Japan) were used in our study. Rats were randomly assigned to two groups with the absence and presence of IRI: w/o IRI group; control and ROX group; w/ IRI group were divided to 5 groups, control, 4 hr-hypoxia, 4 hr-ROX, 24 hr-ROX and 72 hr-ROX groups. ROX (FG-4592; MedChemExpress, Monmouth Junction, NJ, USA) were dissolved in 5% glucose with 32.5 mmol/L NaOH. Rats in the ROX and ROX-IRI groups were pre-treated intraperitoneal injection of ROX (50 mg/kg body weight). Control and IRI groups were injected with same dose of 5% glucose with 32.5 mmol/L NaOH. Hypoxia group: rats were exposed to 7% O2 and 93% N2 for 4 hr. After 4, 24 or 72 hr pre-treatment by ROX or 4 hr hypoxia, all rats were anesthetized with 1.5% isoflurane in 30% O2 (a mixture of 100% O2 and air), and removed the left kidney. IRI and ROX-IRI groups: Right renal pedicle was clamped using non-traumatic vascular clips for 45 min, and then the clamps were released to allow reperfusion to the kidney. Control and ROX groups: rats underwent the same procedure, without clamping of the renal pedicles. After 24 hrs of I/R, all rats were anesthetized, and blood samples were collected from the abdominal aorta. Kidneys were fixed in 4% PFA, embedded in paraffin, and stored in liquid nitrogen. Our protocols were checked and approved by the Ethics Committee at Kitasato University Medical Center (H24-011, 2022-12) and Kitasato University School of Medicine (2022-140, 2023-077).
Hypoxia group is expected to increase plasma Epo concentration at the starting time of IRI operation and R4 group is expected to produce Epo during the procedure of IRI [26,30]. We have showed that ROX caused high plasma Epo levels 6 hr after the administration [30]. 24 hr- and 72 hr-ROX groups were expected to increase Epo production after the operation of IRI.
Serum creatinine and Plasma Epo concentration measurements
Blood samples were centrifuged at 3,000 g for 10 minutes. Supernatants were collected to measure serum creatinine levels using StatSensor (nova biomedical, USA). Plasma Epo concentrations were measured by CLEIA (SRL, Tokyo, Japan)
Western blot analysis
Deglycosylation-coupled western blot analysis was performed as described previously [26,31,32]. Protein was extracted from kidney or liver using CelLytic MT (C-3228; Sigma-Aldrich, Burlington, USA) plus protease inhibitor (05892970001, Roche, Basel, Switzerland ) and was used for western blotting. Samples were deglycosylated using N-glycosidase F (PNGase, 4450; Takara Bio). 1 μl of 10 % SDS was added to 10 μl of samples and boiled for 3 min. Then, 11 μl of 2x stabilizing buffer was added. After the addition of 1 μl of PBS (to measure glycosylated Epo) or PNGase (to measure deglycosylated Epo), samples were incubated in a water bath for 17-20 hrs at 37°C. After the incubation, samples were spun down and the supernatant was used for SDS-PAGE (10-20% gradient gel, 414893; Cosmo Bio, Tokyo, Japan). The 2x stabilizing buffer contained 125 mM Tris-HCl (pH 8.6), 48 mM EDTA, 4% Nonidet P-40 and 8% 2-mercaptoethanol. Recombinant rat Epo (rRatEpo, 592302; BioLegend, San Diego, USA) was used as a positive control both in glycosylated and deglycosylated ones. After SDS-PAGE, proteins were transferred to a PVDF membrane (Immobilon-P, IPVH00010; Merck Millipore, Burlington, USA) for 60-90 min at 120 mA. The membrane was blocked with 5% skim milk (Morinaga, Tokyo, Japan) for 60 min and incubated with the antibody against Epo (sc-5290, 1:500; Santa Cruz) for 60 min at room temperature. After washing, the membrane was incubated with a secondary antibody (goat anti-mouse IgG (H+L) (115-035-166, 1:5,000; Jackson ImmunoResearch Laboratories, West Grove, USA) for 60 min. Bands were visualized by the ECL Select Western Blotting Detection System (RPN2235; GE Healthcare Bio-Science AB, Uppsala, Sweden) and LAS 4000 (Fujifilm, Tokyo, Japan). After measuring Epo protein expression, the membrane was stripped (stripping solution, Wako, RR39LR, Tokyo, Japan) and reprobed with the antibody against β-actin (MBL, M177-3, Tokyo, Japan), GAPDH (Santa Cruz, sc-32233) or α-tubulin (Santa Cruz, sc-69969) for the normalization of the band. Western blotting of LC3-II (Cell Signaling, D3U4C), p62 (MBL, PM066), Bcl-2 (Santa Cruz, sc-23960), BAX (GeneTex, 127309) and PEPCK (Cayman, 10004943) was also performed same as Epo.
Real Time Quantitative RT-PCR
RNA was extracted from kidney and liver using Qiacube and the RNeasy Mini Kit (74106; Quiagen, Venlo, Netherlands) as described previously [26,31]. cDNA was synthesized using a Takara PrimeScript II 1st strand cDNA Synthesis Kit (6210; Takara Bio, Kusatsu, Japan). Real Time PCR was performed using probes form Applied Biosystems, Waltham, USA (β-actin Rn00667869_m1, Epo Rn00667869_m1, HIF2α Rn00576515_m1, HIF1α Rn01472831_m1, PHD2 Rn00710295_m1, GR Rn00561369_m1, and Rhcg Rn00788284_m1) and Premix Ex Taq (RP39LR; Takara Bio). mRNA expressions in control and IRI rats were compared by relative gene expression data using real-time quantitative PCR and the 2-ΔΔCT by Livak KJ, et al [52].
Immunohistochemistry
Kidney sections were immuno-stained as described previously. In brief, the sections were blocked with 5% normal goat serum and reacted with rabbit polyclonal anti-human Epo antibody (sc-7956, 1:10; Santa Cruz Biotechnology, Santa Cruz, CA, USA), followed by Histofine Simple Stain MAX-PO (414341F; Nichirei Bioscience, Tokyo, Japan). Sections were stained using DAB liquid system (BSB 0016; Bio SB, Santa Barbara, CA, USA) and counterstained with Mayer’s haematoxylin (30002; Muto Pure Chemicals, Tokyo, Japan).
Images were obtained using an optical microscope (Axio Imager M2; Carl Zeiss, Oberkochen, Germany) with a digital camera (AxioCam 506, Carl Zeiss). Captured images were analysed using an image analysing system (ZEN 2, Carl Zeiss).
Statistical analyses
Data are expressed as mean ± SEM. Statistical significance was performed using Excel Statics (BellCurve, Tokyo, Japan). Statistical significance was analyzed using ANOVA and multiple comparison of Scheffe. P<0.05 was considered statistically significant.
5. Conclusions
This section is not mandatory but can be added to the manuscript if the discussion is unusually long or complex.
6. Patents
This section is not mandatory but may be added if there are patents resulting from the work reported in this manuscript.
Author Contributions
YY: YI and HN designed the research; TF, TO, NK and HN performed deglycosylation, YY, TY, TU, and HN performed Western blot analysis; YY, TO and KK performed IHC; MN, YS, YN and HN performed statistical analyses; MM, JMS, NT and KK advised on the experimental design and data interpretation. YY, YI, JMS and HN wrote the manuscript.
Funding
This study was supported by a Grant-in Aid for Scientific Research from the Ministry of Education, Culture, Sports, Sciences and Technology of Japan (18K08247(YI) and 19K09226(TF)), the Science Research Promotion Fund from the Promotion, Kitasato University Medical Center: H25-003 (TF) and H24-011 (HN).
Institutional Review Board Statement
The study was conducted according to the guidelines of the Declaration of Helsinki, and approved by the Institutional Ethics Committee) of Kitasato University Medical Center: protocol code 2018032 (date of approval 2018.10.22) and 2019029 (date of approval 2021.1.16) and Kitasato University School of Medicine: protocol code 2019141(date of approval 2019.8.2).
Informed Consent Statement
Not applicable for studies not involving humans.
Data Availability Statement
The data presented in this study are openly available.
Conflicts of Interest
The authors declare no conflict of interest.
Sample Availability
Samples of the compounds are available from the authors.
References
- Miyake, T.; Kung, C.K.; Goldwasser, E. Purification of human erythropoietin. J Biol Chem 1977, 252, 5558–5564. [Google Scholar] [CrossRef] [PubMed]
- Jacobs, K.; Shoemaker, C.; Rudersdorf, R.; Neill, S.D.; Kaufman, R.J.; Mufson, A.; Seehra, J.; Jones, S.S.; Hewick, R.; Fritsch, E.F.; et al. Isolation and characterization of genomic and cDNA clones of human erythropoietin. Nature 1985, 313, 806–810. [Google Scholar] [CrossRef] [PubMed]
- Fishbane, S.; Schiller, B.; Locatelli, F.; Covic, A.C.; Provenzano, R.; Wiecek, A.; Levin, N.W.; Kaplan, M.; Macdougall, I.C.; Francisco, C.; et al. Peginesatide in patients with anemia undergoing hemodialysis. N Engl J Med 2013, 368, 307–319. [Google Scholar] [CrossRef] [PubMed]
- Jörg, D.J.; Fuertinger, D.H.; Kotanko, P. Mechanisms of hemoglobin cycling in anemia patients treated with erythropoiesis-stimulating agents. PLoS Comput Biol 2023, 19, e1010850. [Google Scholar] [CrossRef] [PubMed]
- Macdougall, I.C.; Provenzano, R.; Sharma, A.; Spinowitz, B.S.; Schmidt, R.J.; Pergola, P.E.; Zabaneh, R.I.; Tong-Starksen, S.; Mayo, M.R.; Tang, H.; et al. Peginesatide for anemia in patients with chronic kidney disease not receiving dialysis. N Engl J Med 2013, 368, 320–332. [Google Scholar] [CrossRef]
- Babitt, J.L.; Lin, H.Y. Mechanisms of anemia in CKD. J Am Soc Nephrol 2012, 23, 1631–1634. [Google Scholar] [CrossRef]
- Elliott, S.; Tomita, D.; Endre, Z. Erythropoiesis stimulating agents and reno-protection: a meta-analysis. BMC Nephrol 2017, 18, 14. [Google Scholar] [CrossRef] [PubMed]
- Pfeffer, M.A.; Burdmann, E.A.; Chen, C.Y.; Cooper, M.E.; de Zeeuw, D.; Eckardt, K.U.; Feyzi, J.M.; Ivanovich, P.; Kewalramani, R.; Levey, A.S.; et al. A trial of darbepoetin alfa in type 2 diabetes and chronic kidney disease. N Engl J Med 2009, 361, 2019–2032. [Google Scholar] [CrossRef]
- Solomon, S.D.; Uno, H.; Lewis, E.F.; Eckardt, K.U.; Lin, J.; Burdmann, E.A.; de Zeeuw, D.; Ivanovich, P.; Levey, A.S.; Parfrey, P.; et al. Erythropoietic response and outcomes in kidney disease and type 2 diabetes. N Engl J Med 2010, 363, 1146–1155. [Google Scholar] [CrossRef]
- Akizawa, T.; Iwasaki, M.; Otsuka, T.; Reusch, M.; Misumi, T. Roxadustat Treatment of Chronic Kidney Disease-Associated Anemia in Japanese Patients Not on Dialysis: A Phase 2, Randomized, Double-Blind, Placebo-Controlled Trial. Adv Ther 2019, 36, 1438–1454. [Google Scholar] [CrossRef]
- Besarab, A.; Provenzano, R.; Hertel, J.; Zabaneh, R.; Klaus, S.J.; Lee, T.; Leong, R.; Hemmerich, S.; Yu, K.H.; Neff, T.B. Randomized placebo-controlled dose-ranging and pharmacodynamics study of roxadustat (FG-4592) to treat anemia in nondialysis-dependent chronic kidney disease (NDD-CKD) patients. Nephrol Dial Transplant 2015, 30, 1665–1673. [Google Scholar] [CrossRef]
- Gupta, N.; Wish, J.B. Hypoxia-Inducible Factor Prolyl Hydroxylase Inhibitors: A Potential New Treatment for Anemia in Patients With CKD. Am J Kidney Dis 2017, 69, 815–826. [Google Scholar] [CrossRef]
- Ogawa, C.; Tsuchiya, K.; Maeda, K. Hypoxia-Inducible Factor Prolyl Hydroxylase Inhibitors and Iron Metabolism. Int J Mol Sci 2023, 24. [Google Scholar] [CrossRef] [PubMed]
- Mima, A. Hypoxia-inducible factor-prolyl hydroxylase inhibitors for renal anemia in chronic kidney disease: Advantages and disadvantages. Eur J Pharmacol 2021, 912, 174583. [Google Scholar] [CrossRef] [PubMed]
- Singh, A.K.; Carroll, K.; Perkovic, V.; Solomon, S.; Jha, V.; Johansen, K.L.; Lopes, R.D.; Macdougall, I.C.; Obrador, G.T.; Waikar, S.S.; et al. Daprodustat for the Treatment of Anemia in Patients Undergoing Dialysis. N Engl J Med 2021, 385, 2325–2335. [Google Scholar] [CrossRef] [PubMed]
- Haase, V.H. Regulation of erythropoiesis by hypoxia-inducible factors. Blood Rev 2013, 27, 41–53. [Google Scholar] [CrossRef]
- Rosenberger, C.; Mandriota, S.; Jürgensen, J.S.; Wiesener, M.S.; Hörstrup, J.H.; Frei, U.; Ratcliffe, P.J.; Maxwell, P.H.; Bachmann, S.; Eckardt, K.-U. Expression of Hypoxia-Inducible Factor-1α and -2α in Hypoxic and Ischemic Rat Kidneys. Journal of the American Society of Nephrology 2002, 13, 1721–1732. [Google Scholar] [CrossRef]
- Locatelli, F.; Del Vecchio, L. Hypoxia-Inducible Factor-Prolyl Hydroxyl Domain Inhibitors: From Theoretical Superiority to Clinical Noninferiority Compared with Current ESAs? J Am Soc Nephrol 2022, 33, 1966–1979. [Google Scholar] [CrossRef]
- Bin, S.; Cantarelli, C.; Horwitz, J.K.; Gentile, M.; Podestà, M.A.; La Manna, G.; Heeger, P.S.; Cravedi, P. Endogenous erythropoietin has immunoregulatory functions that limit the expression of autoimmune kidney disease in mice. Front Immunol 2023, 14, 1195662. [Google Scholar] [CrossRef]
- Murry, C.E.; Jennings, R.B.; Reimer, K.A. Preconditioning with ischemia: a delay of lethal cell injury in ischemic myocardium. Circulation 1986, 74, 1124–1136. [Google Scholar] [CrossRef]
- Liu, Q.S.; Cheng, Z.W.; Xiong, J.G.; Cheng, S.; He, X.F.; Li, X.C. Erythropoietin pretreatment exerts anti-inflammatory effects in hepatic ischemia/reperfusion-injured rats via suppression of the TLR2/NF-κB pathway. Transplant Proc 2015, 47, 283–289. [Google Scholar] [CrossRef]
- Zhang, J.; Zou, Y.R.; Zhong, X.; Deng, H.D.; Pu, L.; Peng, K.; Wang, L. Erythropoietin pretreatment ameliorates renal ischaemia-reperfusion injury by activating PI3K/Akt signalling. Nephrology (Carlton) 2015, 20, 266–272. [Google Scholar] [CrossRef]
- Elshiekh, M.; Kadkhodaee, M.; Seifi, B.; Ranjbaran, M.; Ahghari, P. Ameliorative Effect of Recombinant Human Erythropoietin and Ischemic Preconditioning on Renal Ischemia Reperfusion Injury in Rats. Nephrourol Mon 2015, 7, e31152. [Google Scholar] [CrossRef]
- Chou, Y.H.; Liao, F.L.; Chen, Y.T.; Yeh, P.Y.; Liu, C.H.; Shih, H.M.; Chang, F.C.; Chiang, W.C.; Chu, T.S.; Lin, S.L. Erythropoietin modulates macrophages but not post-ischemic acute kidney injury in mice. J Formos Med Assoc 2019, 118, 494–503. [Google Scholar] [CrossRef]
- Weiss, G.; Ganz, T.; Goodnough, L.T. Anemia of inflammation. Blood 2019, 133, 40–50. [Google Scholar] [CrossRef]
- Yasuoka, Y.; Fukuyama, T.; Izumi, Y.; Nakayama, Y.; Inoue, H.; Yanagita, K.; Oshima, T.; Yamazaki, T.; Uematsu, T.; Kobayashi, N.; et al. Erythropoietin production by the kidney and the liver in response to severe hypoxia evaluated by Western blotting with deglycosylation. Physiol Rep 2020, 8, e14485. [Google Scholar] [CrossRef]
- Yasuoka, Y.; Fukuyama, T.; Izumi, Y.; Yamashita, T.; Nakayama, Y.; Inoue, H.; Yanagita, K.; Oshima, T.; Yamazaki, T.; Uematsu, T.; et al. Differentiation of endogenous erythropoietin and exogenous ESAs by Western blotting. Heliyon 2020, 6, e05389. [Google Scholar] [CrossRef]
- Yasuoka, Y.; Izumi, Y.; Sands, J.M.; Kawahara, K.; Nonoguchi, H. Progress in the Detection of Erythropoietin in Blood, Urine, and Tissue. Molecules 2023, 28. [Google Scholar] [CrossRef]
- Yasuoka, Y.; Izumi, Y.; Fukuyama, T.; Inoue, H.; Oshima, T.; Yamazaki, T.; Uematsu, T.; Kobayashi, N.; Shimada, Y.; Nagaba, Y.; et al. Effects of Angiotensin II on Erythropoietin Production in the Kidney and Liver. Molecules 2021, 26. [Google Scholar] [CrossRef]
- Yasuoka, Y.; Izumi, Y.; Fukuyama, T.; Omiya, H.; Pham, T.D.; Inoue, H.; Oshima, T.; Yamazaki, T.; Uematsu, T.; Kobayashi, N.; et al. Effects of Roxadustat on Erythropoietin Production in the Rat Body. Molecules 2022, 27. [Google Scholar] [CrossRef]
- Yasuoka, Y.; Izumi, Y.; Nagai, T.; Fukuyama, T.; Nakayama, Y.; Inoue, H.; Horikawa, K.; Kimura, M.; Nanami, M.; Yanagita, K.; et al. Fludrocortisone stimulates erythropoietin production in the intercalated cells of the collecting ducts. 2018, 3121–3127. [Google Scholar] [CrossRef] [PubMed]
- Obara, N.; Suzuki, N.; Kim, K.; Nagasawa, T.; Imagawa, S.; Yamamoto, M. Repression via the GATA box is essential for tissue-specific erythropoietin gene expression. Blood 2008, 111, 5223–5232. [Google Scholar] [CrossRef] [PubMed]
- Sato, K.; Hirano, I.; Sekine, H.; Miyauchi, K.; Nakai, T.; Kato, K.; Ito, S.; Yamamoto, M.; Suzuki, N. An immortalized cell line derived from renal erythropoietin-producing (REP) cells demonstrates their potential to transform into myofibroblasts. Sci Rep 2019, 9, 11254. [Google Scholar] [CrossRef] [PubMed]
- Suzuki, N.; Yamamoto, M. Roles of renal erythropoietin-producing (REP) cells in the maintenance of systemic oxygen homeostasis. Pflugers Arch 2016, 468, 3–12. [Google Scholar] [CrossRef] [PubMed]
- Bapst, A.M.; Knöpfel, T.; Nolan, K.A.; Imeri, F.; Schuh, C.D.; Hall, A.M.; Guo, J.; Katschinski, D.M.; Wenger, R.H. Neurogenic and pericytic plasticity of conditionally immortalized cells derived from renal erythropoietin-producing cells. J Cell Physiol 2022, 237, 2420–2433. [Google Scholar] [CrossRef]
- Kobayashi, H.; Davidoff, O.; Pujari-Palmer, S.; Drevin, M.; Haase, V.H. EPO synthesis induced by HIF-PHD inhibition is dependent on myofibroblast transdifferentiation and colocalizes with non-injured nephron segments in murine kidney fibrosis. Acta Physiol (Oxf) 2022, 235, e13826. [Google Scholar] [CrossRef] [PubMed]
- Nagai, T.; Yasuoka, Y.; Izumi, Y.; Horikawa, K.; Kimura, M.; Nakayama, Y.; Uematsu, T.; Fukuyama, T.; Yamazaki, T.; Kohda, Y.; et al. Reevaluation of erythropoietin production by the nephron. Biochem Biophys Res Commun 2014, 449, 222–228. [Google Scholar] [CrossRef]
- Jelkmann, W. Regulation of erythropoietin production. J Physiol 2011, 589, 1251–1258. [Google Scholar] [CrossRef]
- Koury, M.J.; Haase, V.H. Anaemia in kidney disease: harnessing hypoxia responses for therapy. Nat Rev Nephrol 2015, 11, 394–410. [Google Scholar] [CrossRef]
- Kato, H.; Ishida, J.; Imagawa, S.; Saito, T.; Suzuki, N.; Matsuoka, T.; Sugaya, T.; Tanimoto, K.; Yokoo, T.; Ohneda, O.; et al. Enhanced erythropoiesis mediated by activation of the renin-angiotensin system via angiotensin II type 1a receptor. Faseb j 2005, 19, 2023–2025. [Google Scholar] [CrossRef]
- Kato, H.; Ishida, J.; Matsusaka, T.; Ishimaru, T.; Tanimoto, K.; Sugiyama, F.; Yagami, K.; Nangaku, M.; Fukamizu, A. Erythropoiesis and Blood Pressure Are Regulated via AT1 Receptor by Distinctive Pathways. PLoS One 2015, 10, e0129484. [Google Scholar] [CrossRef] [PubMed]
- Kim, Y.C.; Mungunsukh, O.; Day, R.M. Erythropoietin Regulation by Angiotensin II. Vitam Horm 2017, 105, 57–77. [Google Scholar] [CrossRef]
- Kim, Y.C.; Mungunsukh, O.; McCart, E.A.; Roehrich, P.J.; Yee, D.K.; Day, R.M. Mechanism of erythropoietin regulation by angiotensin II. Mol Pharmacol 2014, 85, 898–908. [Google Scholar] [CrossRef]
- Gossmann, J.; Burkhardt, R.; Harder, S.; Lenz, T.; Sedlmeyer, A.; Klinkhardt, U.; Geiger, H.; Scheuermann, E.H. Angiotensin II infusion increases plasma erythropoietin levels via an angiotensin II type 1 receptor-dependent pathway. Kidney Int 2001, 60, 83–86. [Google Scholar] [CrossRef] [PubMed]
- Ito, M.; Tanaka, T.; Ishii, T.; Wakashima, T.; Fukui, K.; Nangaku, M. Prolyl hydroxylase inhibition protects the kidneys from ischemia via upregulation of glycogen storage. Kidney Int 2020, 97, 687–701. [Google Scholar] [CrossRef] [PubMed]
- Joharapurkar, A.A.; Patel, V.J.; Kshirsagar, S.G.; Patel, M.S.; Savsani, H.H.; Jain, M.R. Prolyl hydroxylase inhibitor desidustat protects against acute and chronic kidney injury by reducing inflammatory cytokines and oxidative stress. Drug Dev Res 2021, 82, 852–860. [Google Scholar] [CrossRef]
- Bernhardt, W.M.; Câmpean, V.; Kany, S.; Jürgensen, J.S.; Weidemann, A.; Warnecke, C.; Arend, M.; Klaus, S.; Günzler, V.; Amann, K.; et al. Preconditional activation of hypoxia-inducible factors ameliorates ischemic acute renal failure. J Am Soc Nephrol 2006, 17, 1970–1978. [Google Scholar] [CrossRef]
- Kapitsinou, P.P.; Jaffe, J.; Michael, M.; Swan, C.E.; Duffy, K.J.; Erickson-Miller, C.L.; Haase, V.H. Preischemic targeting of HIF prolyl hydroxylation inhibits fibrosis associated with acute kidney injury. Am J Physiol Renal Physiol 2012, 302, F1172–1179. [Google Scholar] [CrossRef]
- Wang, Z.; Schley, G.; Türkoglu, G.; Burzlaff, N.; Amann, K.U.; Willam, C.; Eckardt, K.U.; Bernhardt, W.M. The protective effect of prolyl-hydroxylase inhibition against renal ischaemia requires application prior to ischaemia but is superior to EPO treatment. Nephrol Dial Transplant 2012, 27, 929–936. [Google Scholar] [CrossRef]
- Arcasoy, M.O. The non-haematopoietic biological effects of erythropoietin. Br J Haematol 2008, 141, 14–31. [Google Scholar] [CrossRef]
- Shi, M.; Flores, B.; Li, P.; Gillings, N.; McMillan, K.L.; Ye, J.; Huang, L.J.; Sidhu, S.S.; Zhong, Y.P.; Grompe, M.T.; et al. Effects of erythropoietin receptor activity on angiogenesis, tubular injury, and fibrosis in acute kidney injury: a "U-shaped" relationship. Am J Physiol Renal Physiol 2018, 314, F501–f516. [Google Scholar] [CrossRef] [PubMed]
- Lee, J.W.; Chou, C.L.; Knepper, M.A. Deep Sequencing in Microdissected Renal Tubules Identifies Nephron Segment-Specific Transcriptomes. J Am Soc Nephrol 2015, 26, 2669–2677. [Google Scholar] [CrossRef] [PubMed]
Figure 1.
Changes in renal function by IRI. Serum creatinine levels by IRI and Epo stimulation. IRI caused an increase of serum creatinine from 0.53 to 2.52 mg/dl. Hypoxia and R4 did not decrease serum creatinine levels. In contrast, R24 and R72 decreased serum creatinine levels to 0.76 and 0.97, respectively. *p<0.05, **p<0.01, ***p<0.001 by ANOVA and Scheffe’s multiple comparison. C, control; H, hypoxia; R, ROX.
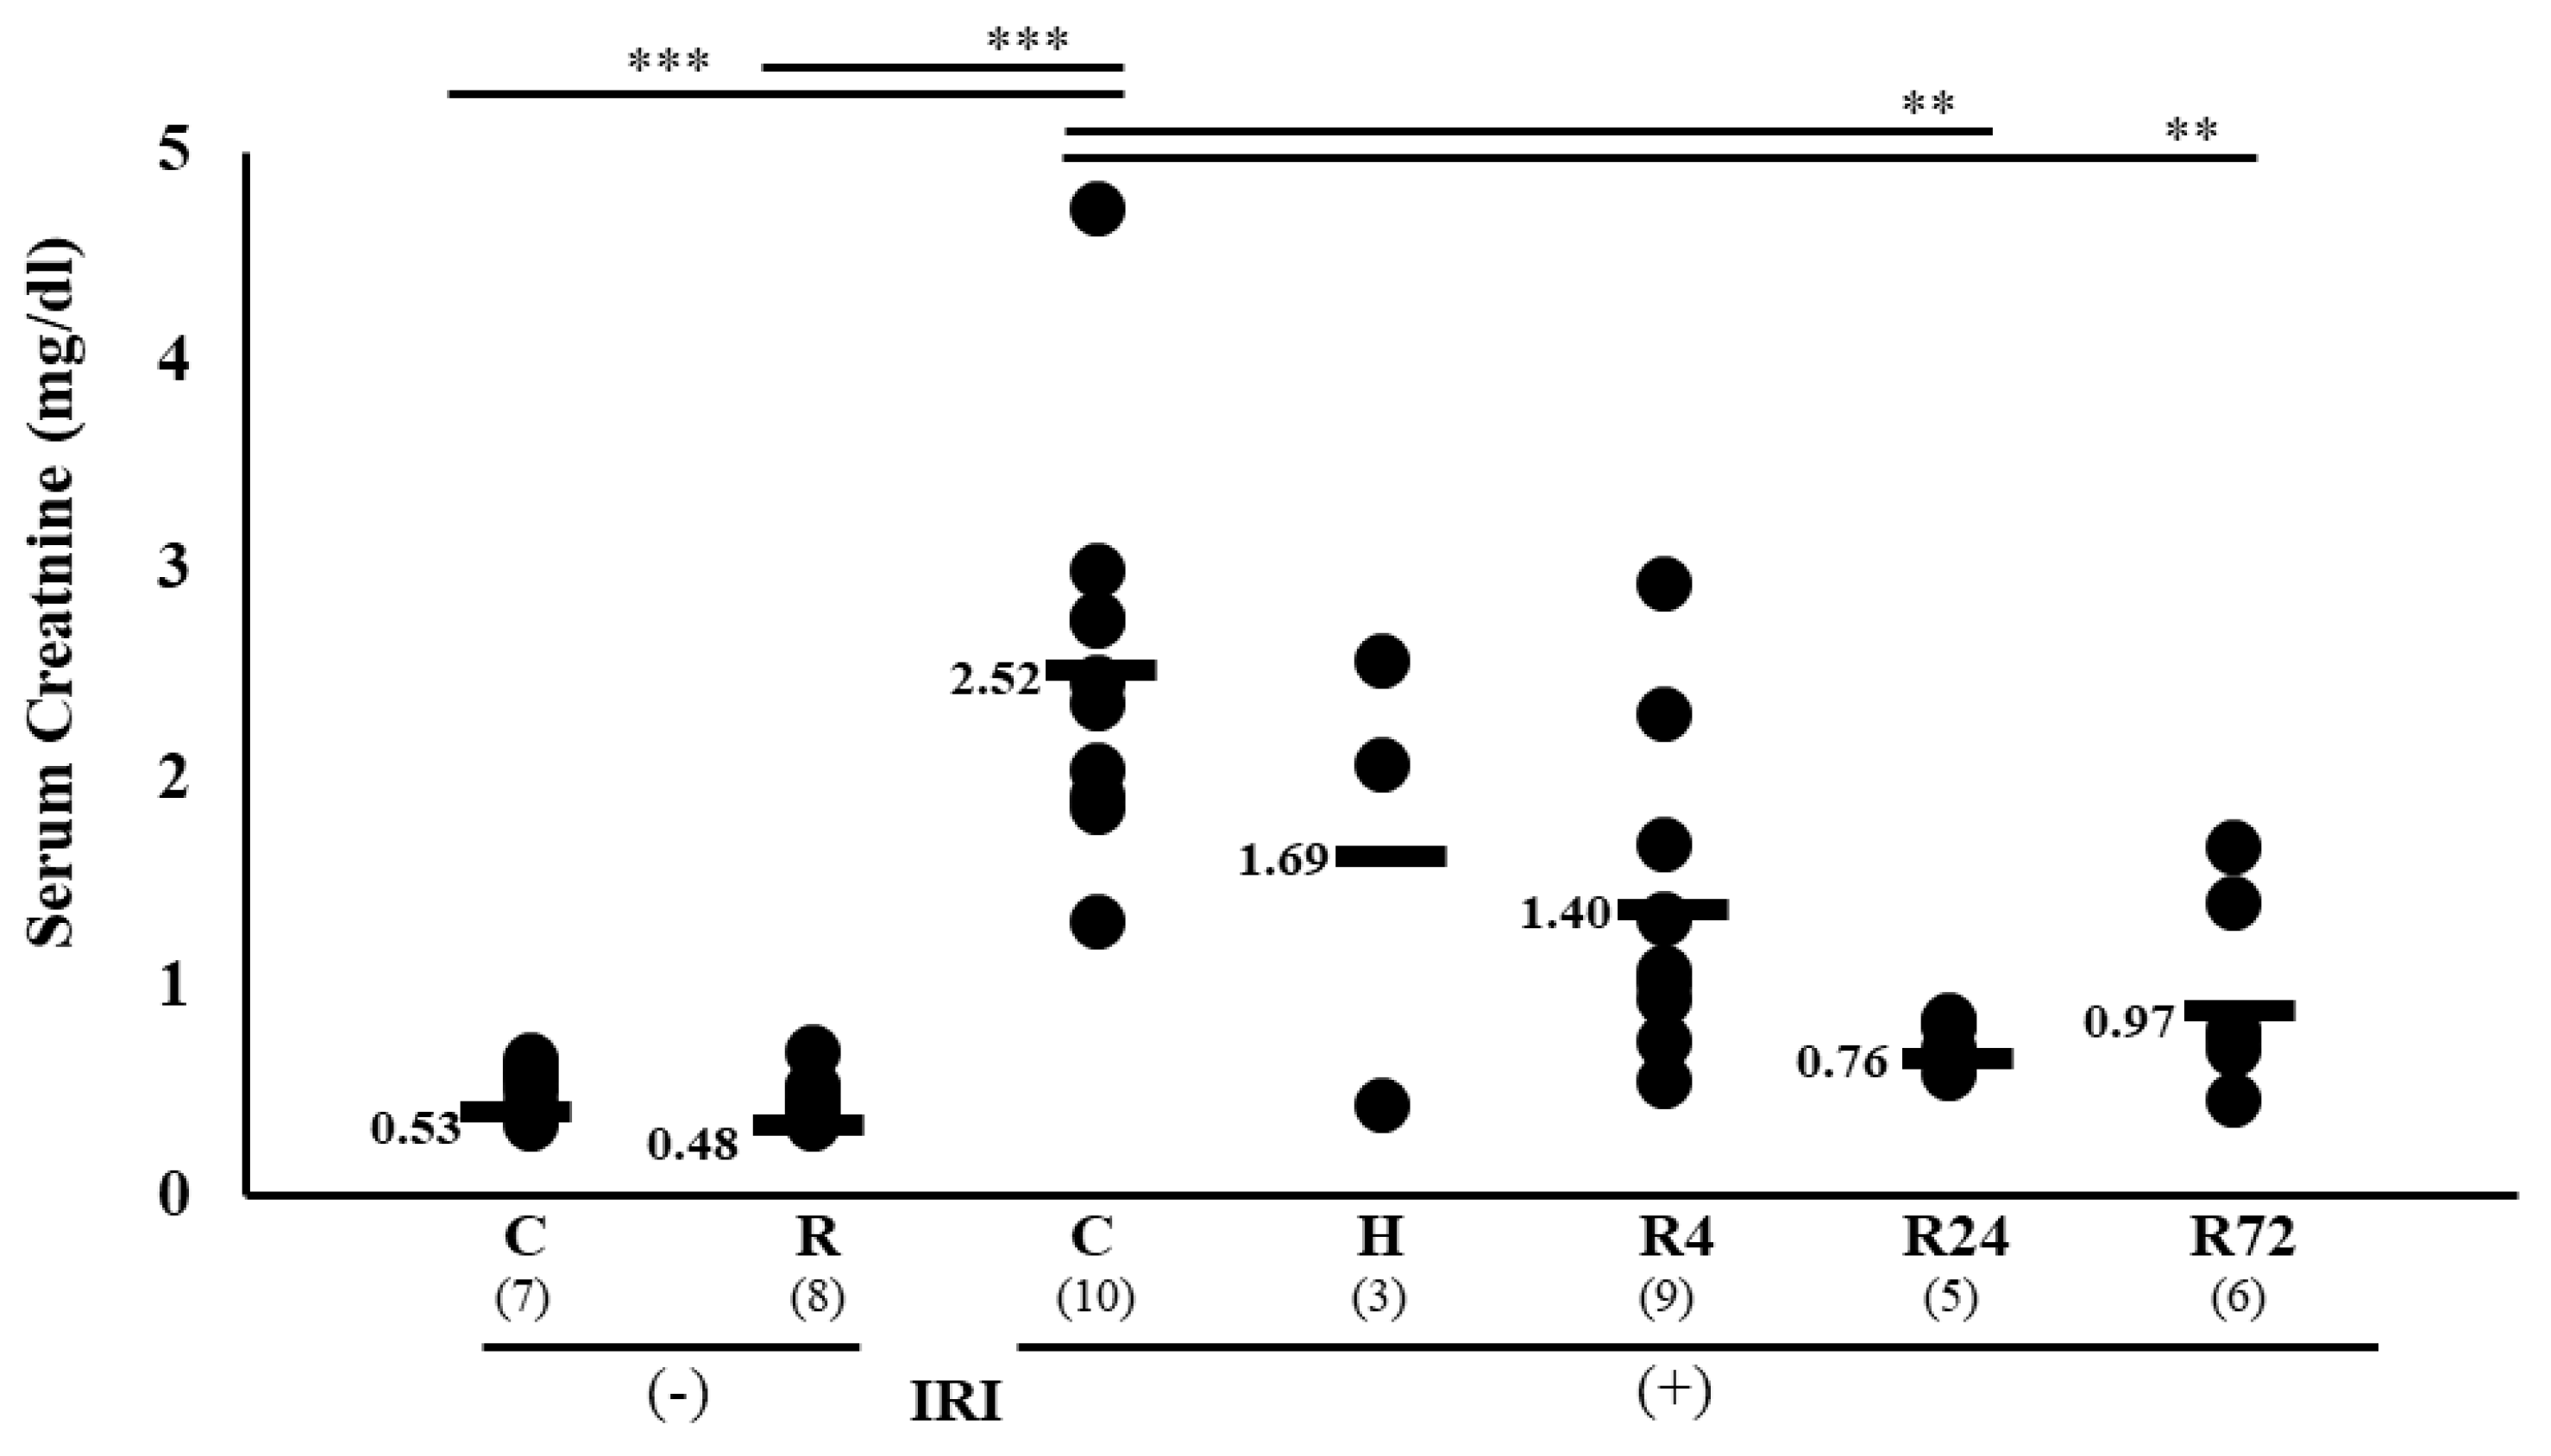
Figure 2.
Plasama Epo levels after IRI. Plasma levels of Epo in each group. Hypoxia caused a large increase in plasma Epo level. R4 caused a slight increase in plasma Epo level. After IRI, R4 caused an increase of plasma Epo level but hypoxia and R24-72 did not change the levels. *p<0.05, **p<0.01 by ANOVA and Scheffe’s multiple comparison. C, control; H, hypoxia; R, ROX.
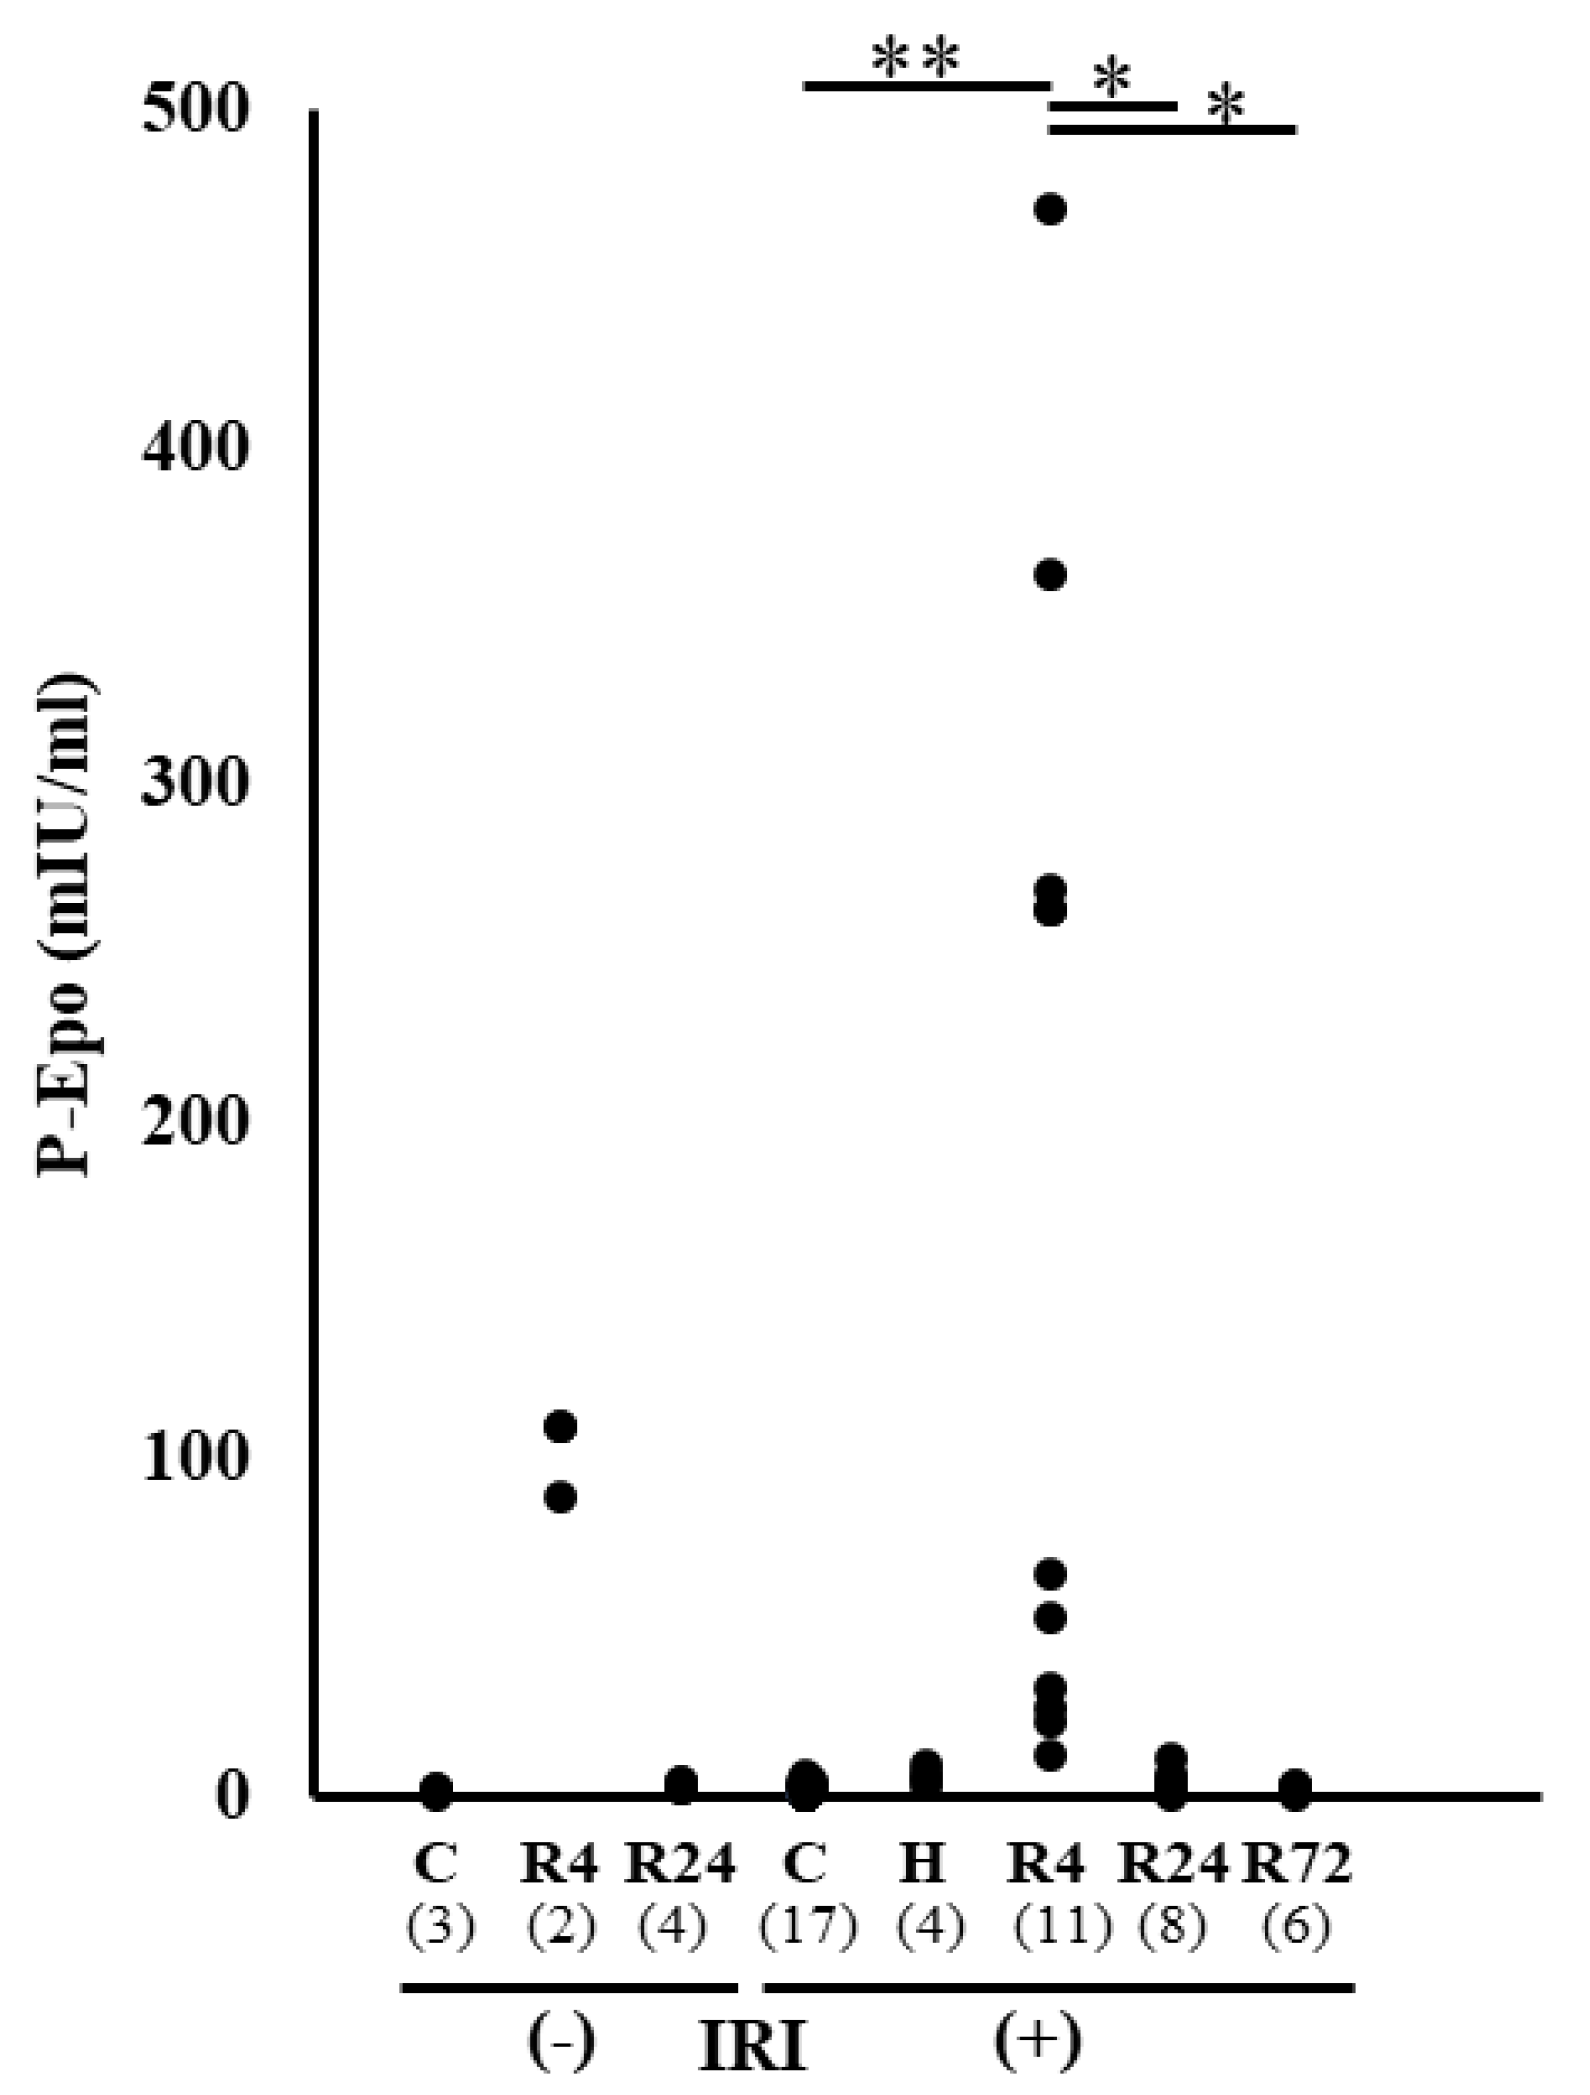
Figure 3.
Western blot analysis of Epo protein in the absence and presence of PNGase. Epo production by the kidney before IRI. Typical gels of pre- and post-IRI were shown. Highest production was observed by 4 hr-hypoxia. C, control; H, hypoxia; R, ROX.
Figure 3.
Western blot analysis of Epo protein in the absence and presence of PNGase. Epo production by the kidney before IRI. Typical gels of pre- and post-IRI were shown. Highest production was observed by 4 hr-hypoxia. C, control; H, hypoxia; R, ROX.
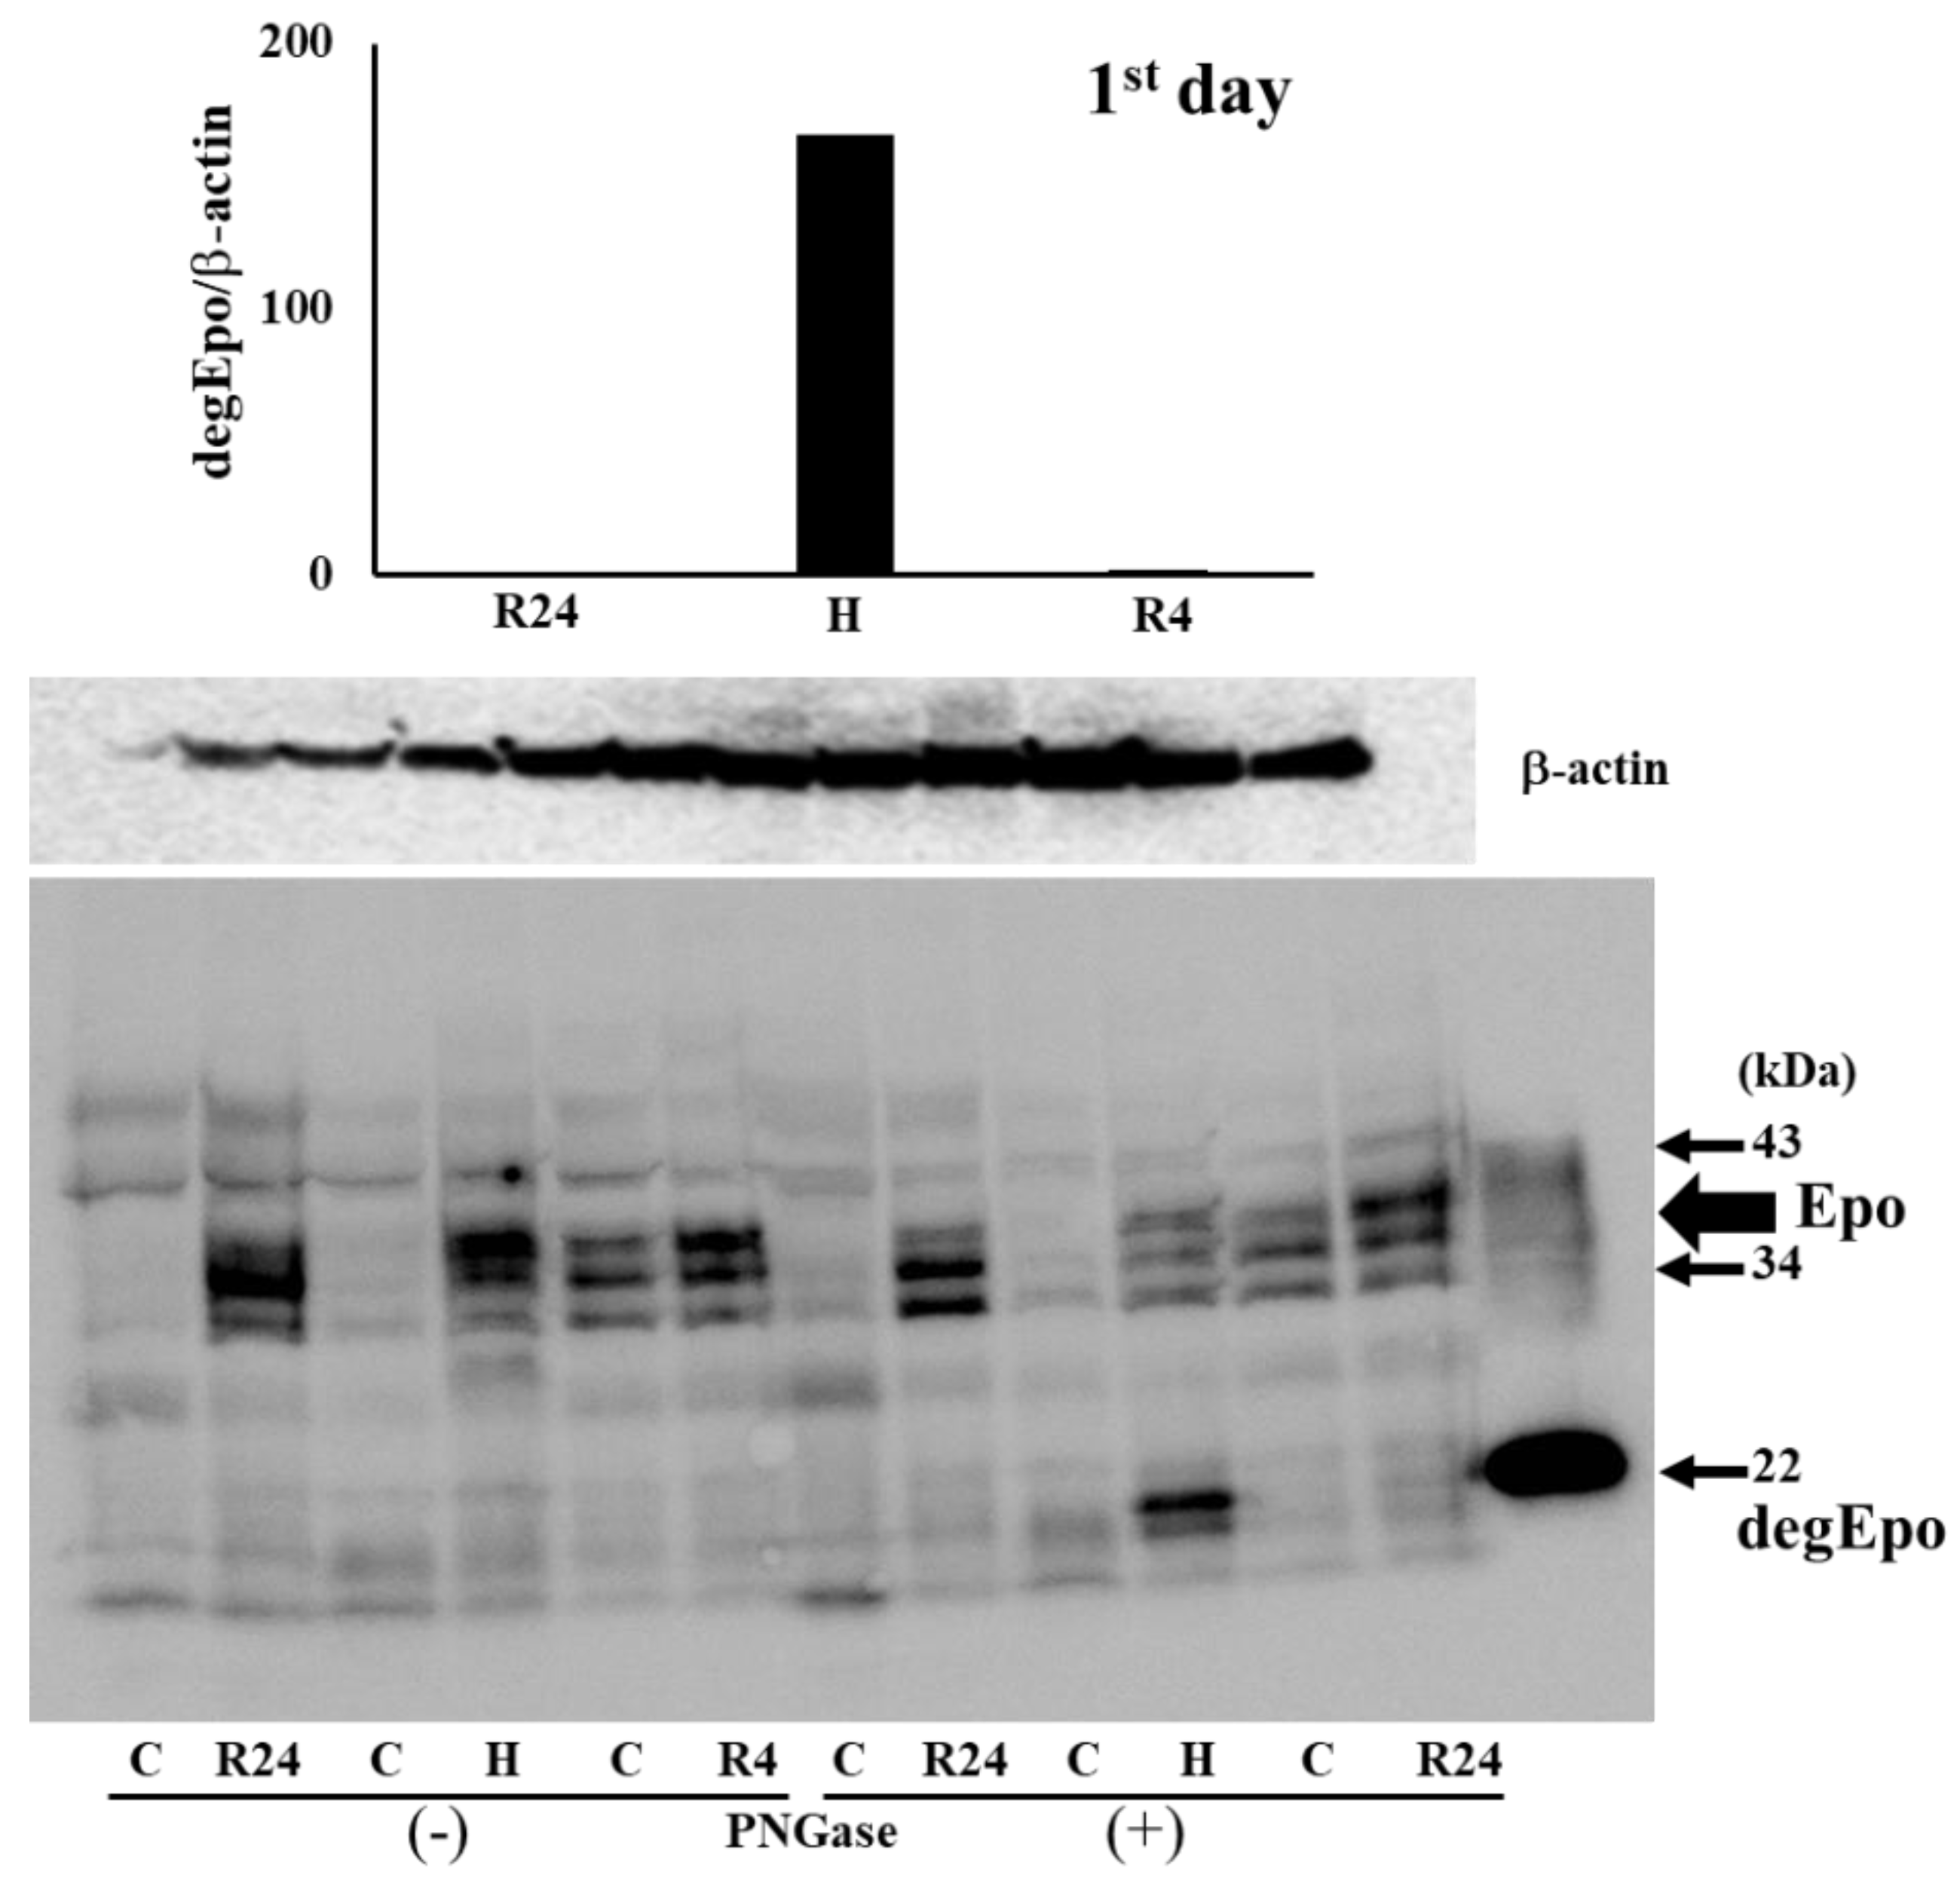
Figure 4.
Western blot analysis of Epo protein in the absence and presence of PNGase. Epo production by the kidney after IRI. Typical gels of pre- and post-IRI were shown. Highest production was observed by 24 hr-ROX. C, control; H, hypoxia; R, ROX.
Figure 4.
Western blot analysis of Epo protein in the absence and presence of PNGase. Epo production by the kidney after IRI. Typical gels of pre- and post-IRI were shown. Highest production was observed by 24 hr-ROX. C, control; H, hypoxia; R, ROX.
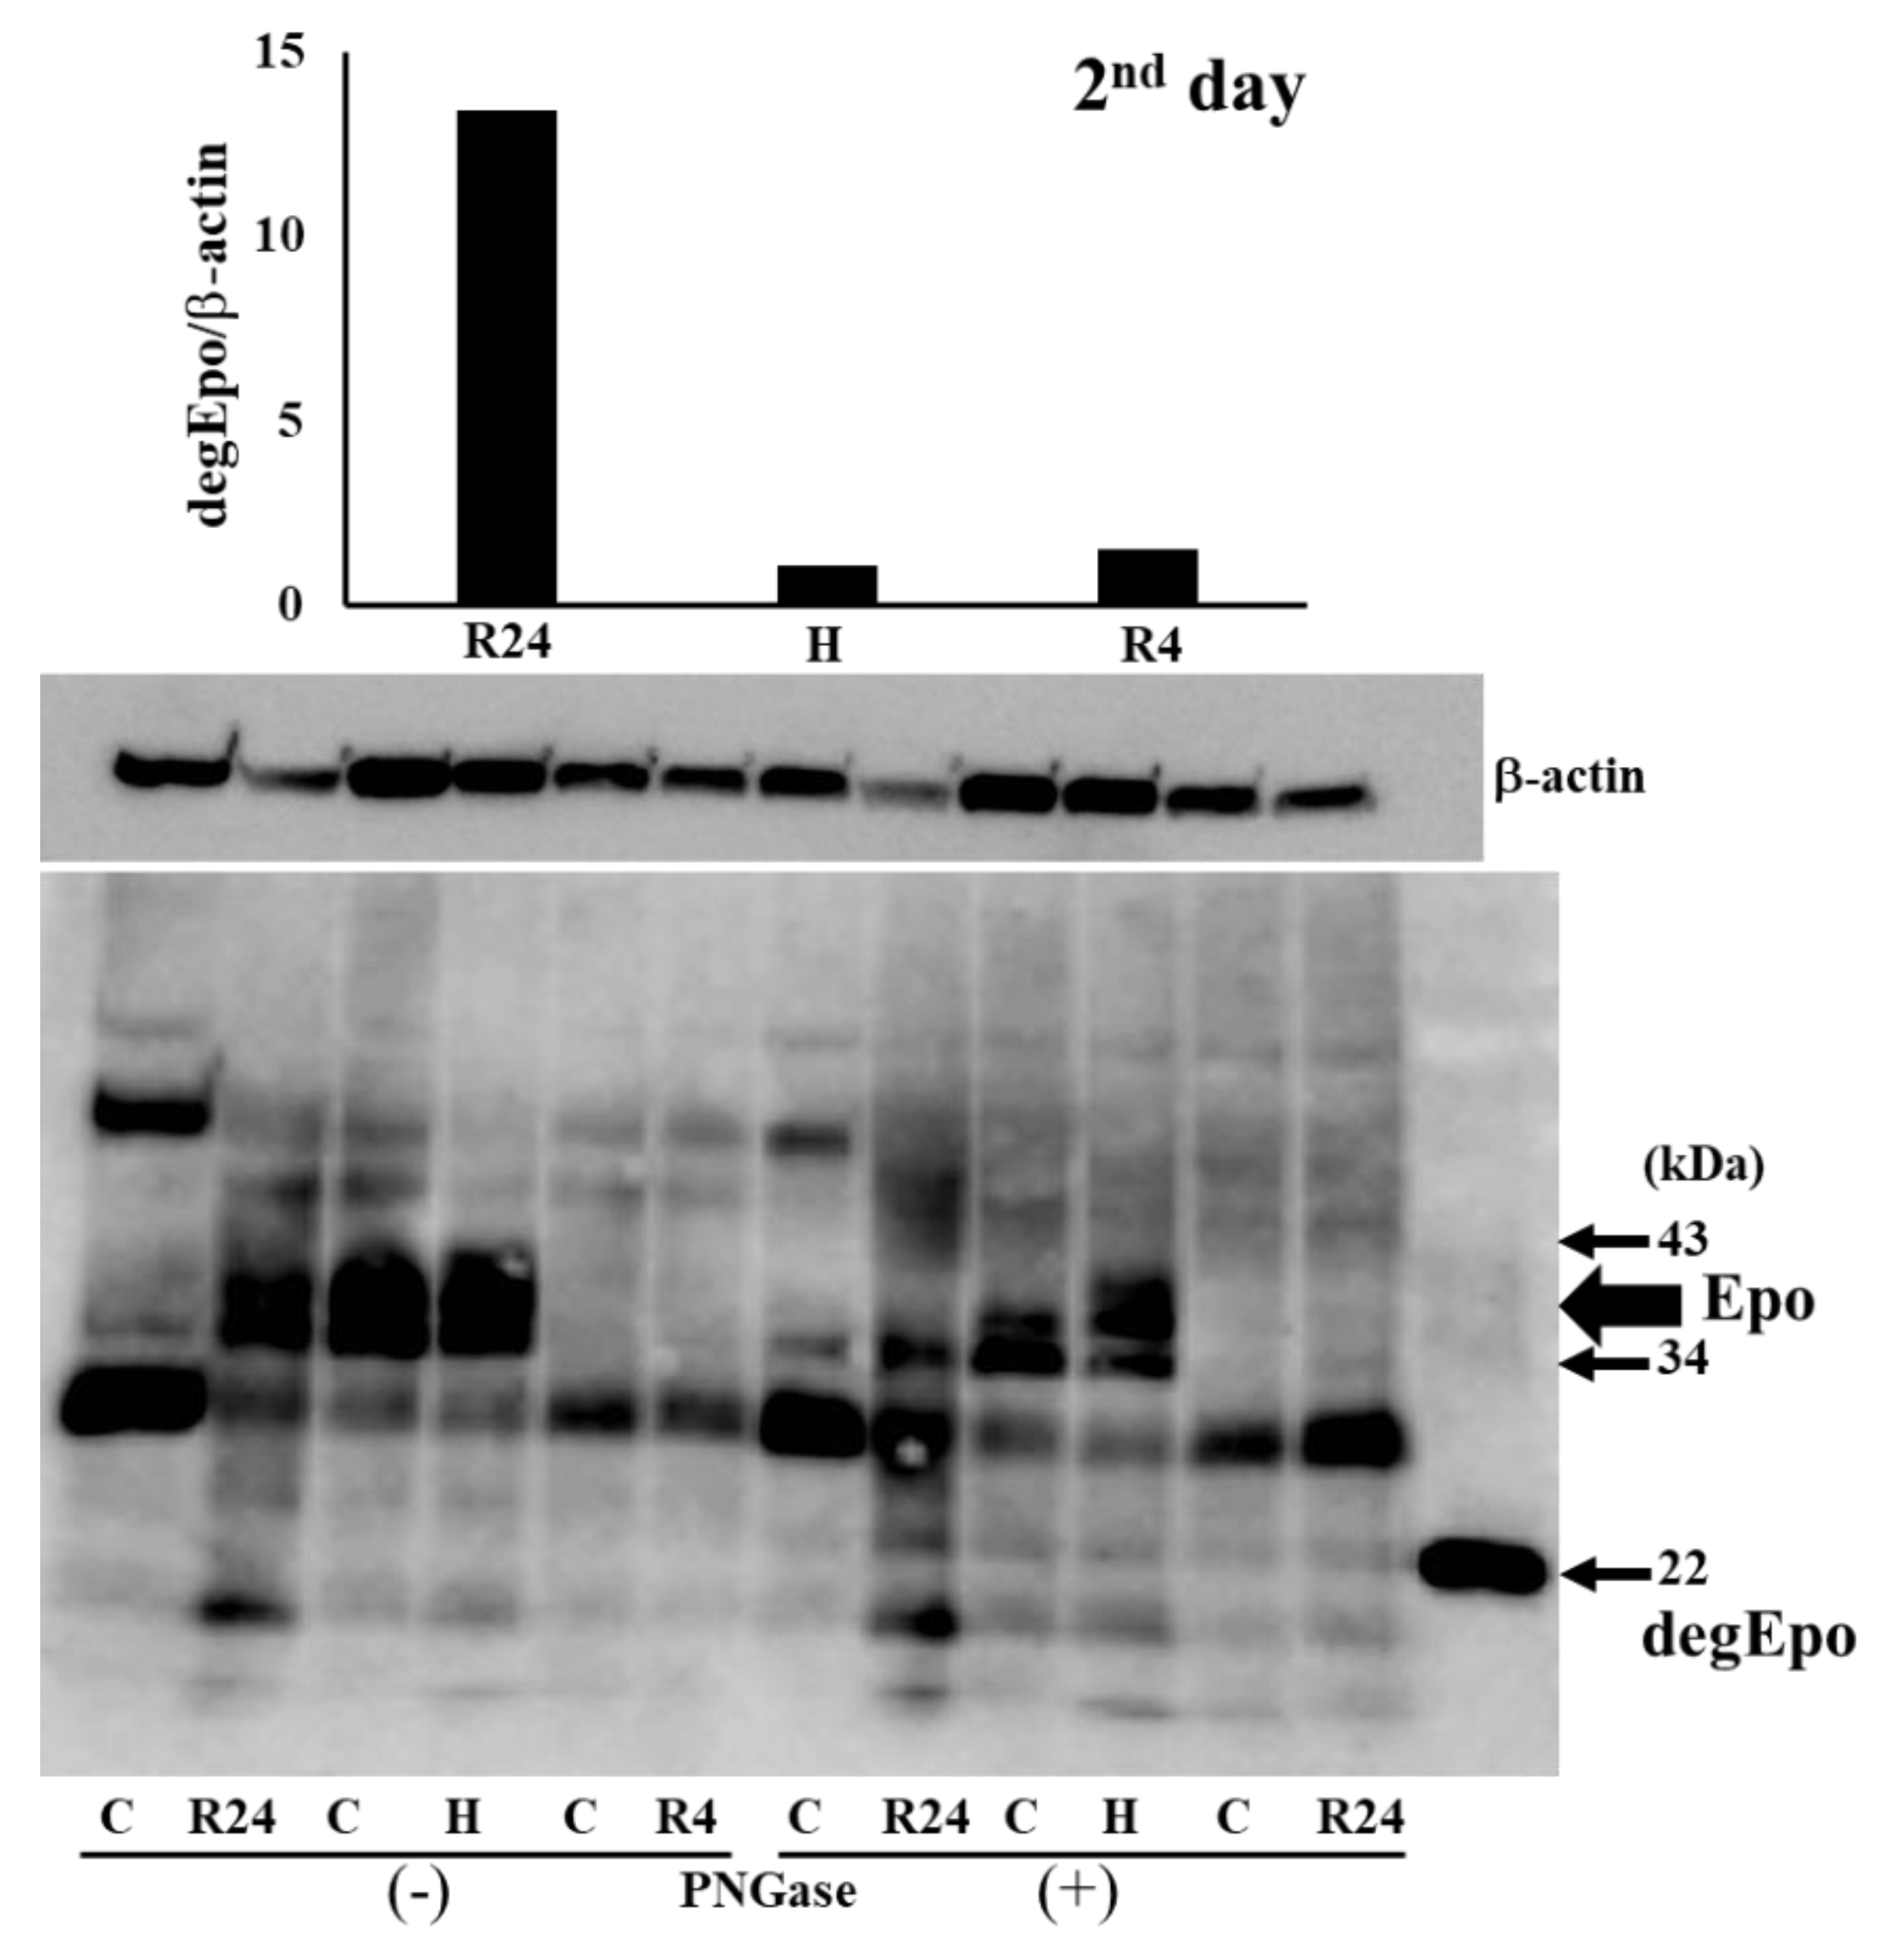
Figure 5.
Epo production by the kidney before and after IRI. Western blot analysis of Epo production by the renal cortex. Hypoxia induced a large amount of Epo production before IRI. After IRI, R24 caused a slight increase of Epo production. R4 did not induce Epo production after IRI, suggesting that high plasma Epo level is caused by Epo production before IRI. n=4-5. C, control; H, hypoxia; R, ROX.
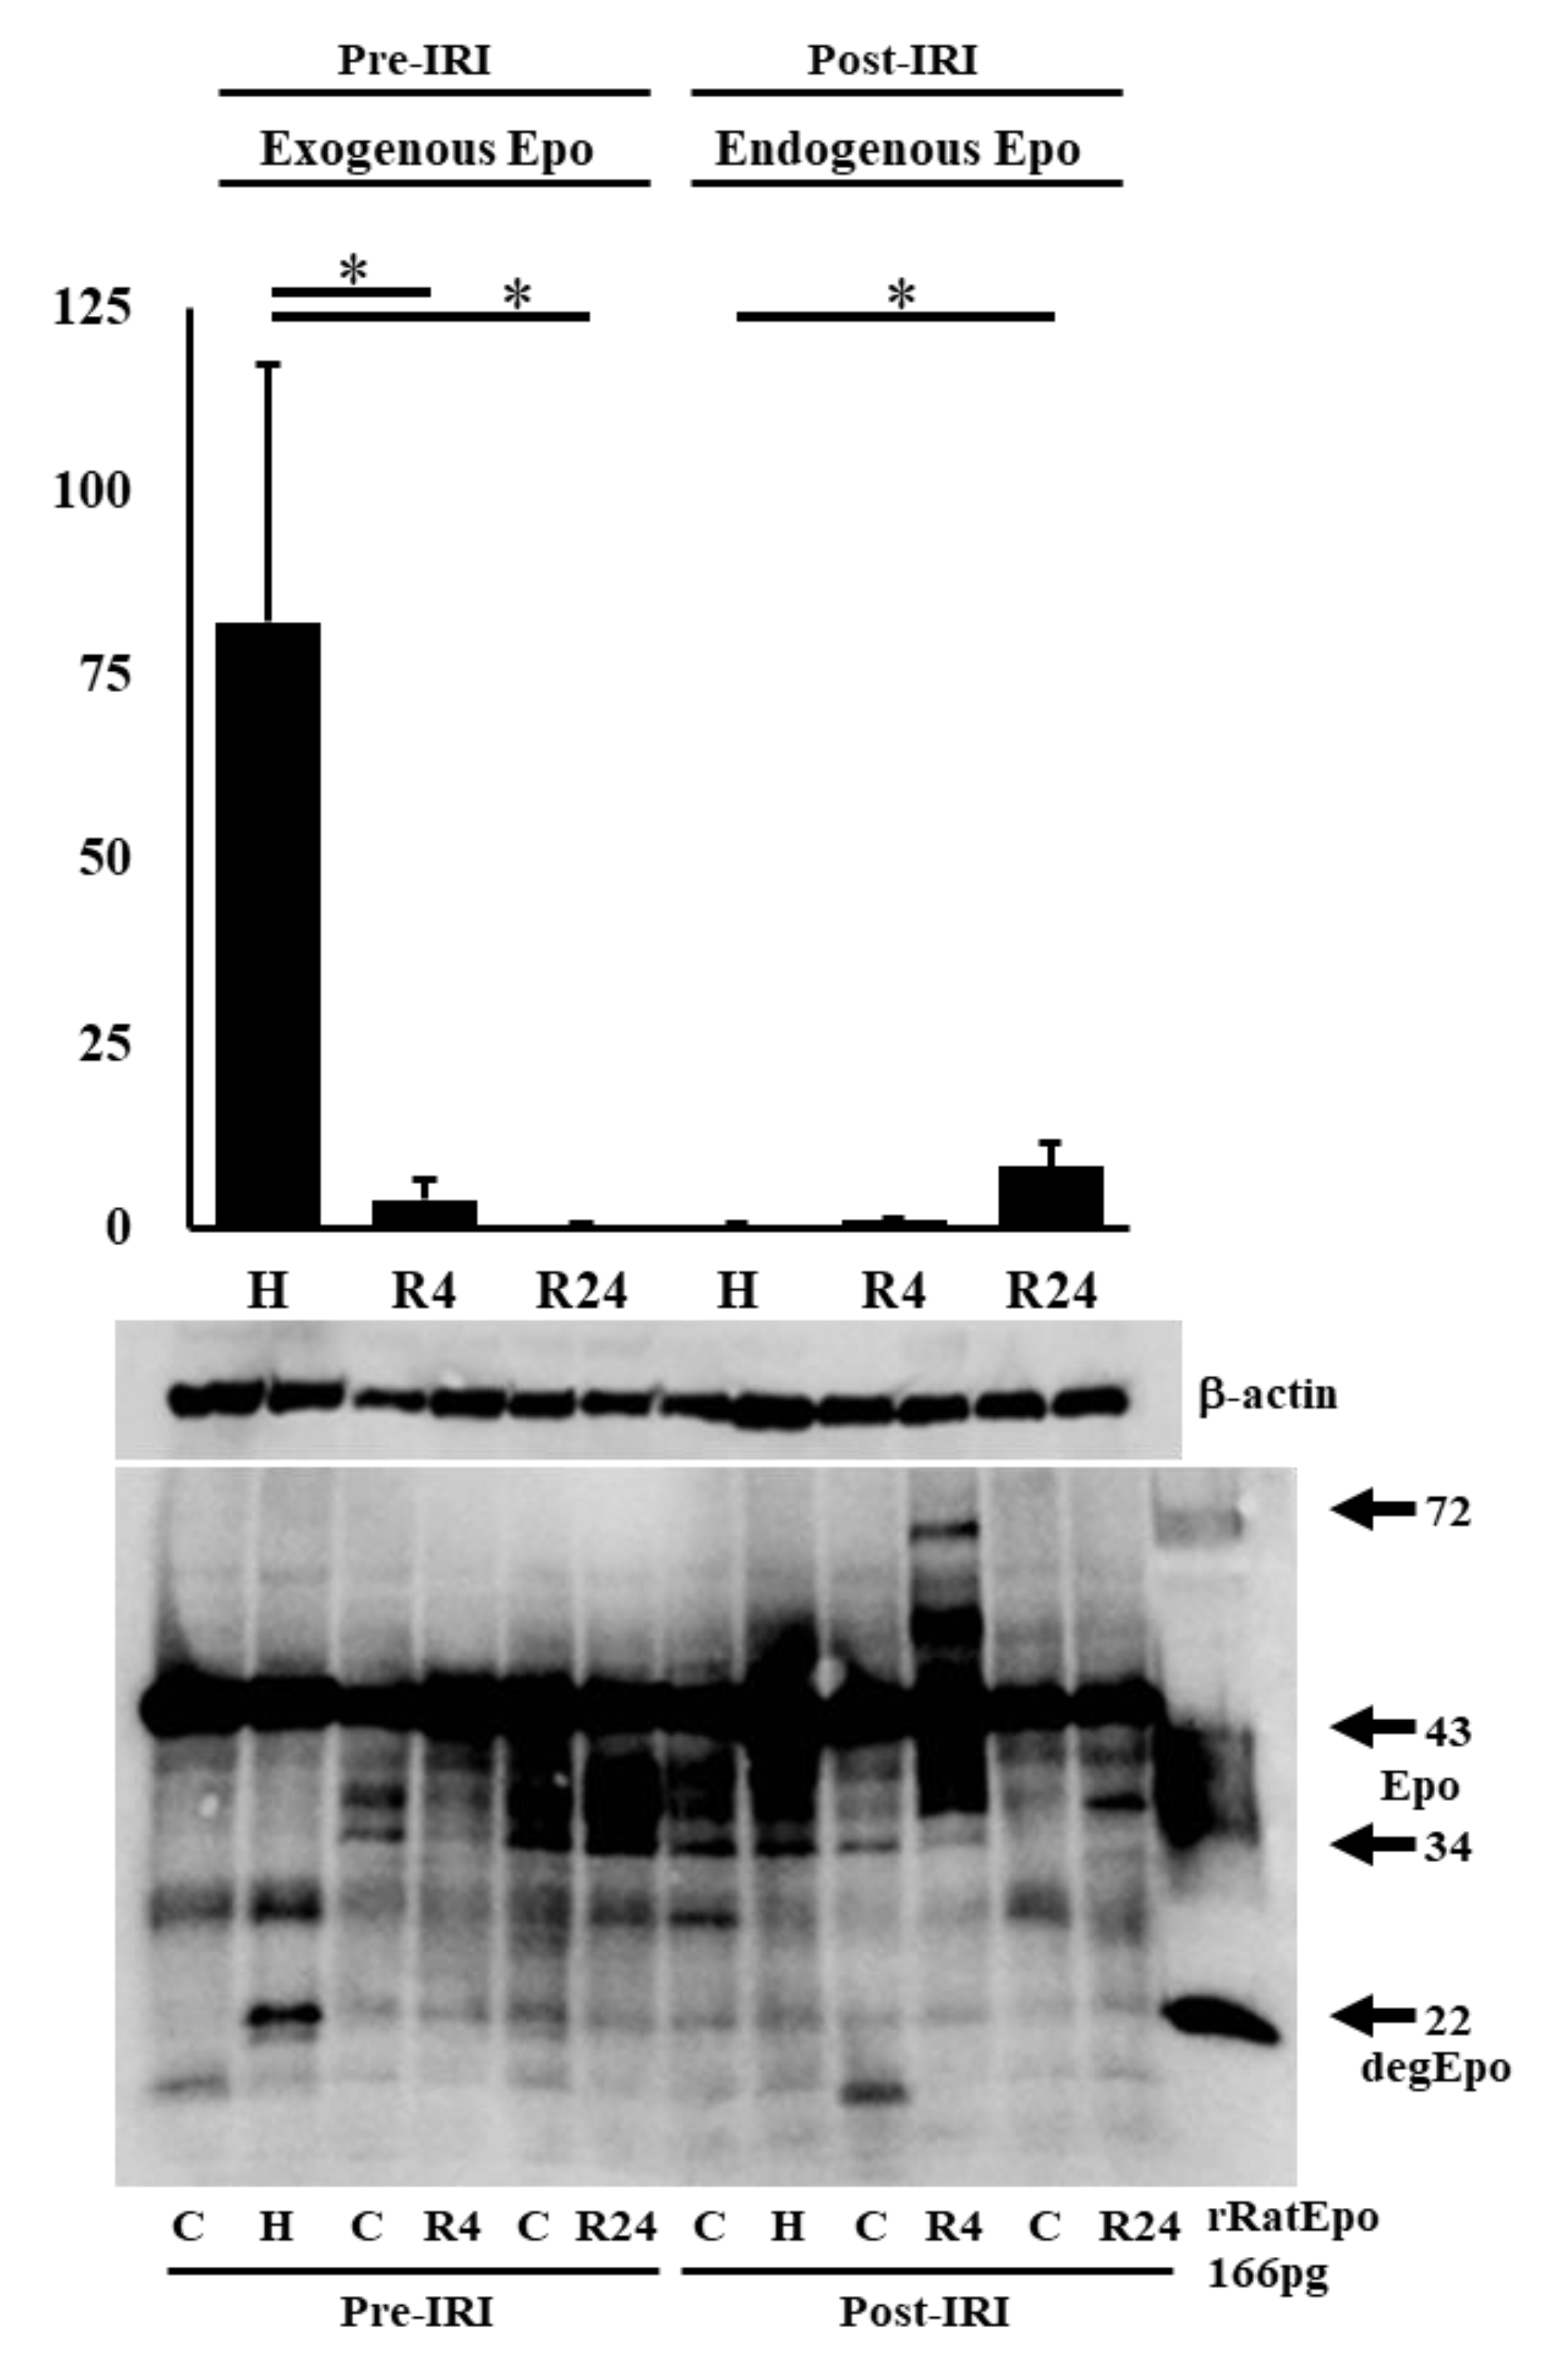
Figure 6.
Epo mRNA expression before and after IRI. a: Hypoxia and R4 induced large increase of Epo mRNA before IRI. b: A slight stimulation of Epo mRNA expression was observed by R4, R24 and R72 after IRI. n=3-7. H, hypoxia; R, ROX. *p<0.05 by ANOVA and Dunnett’s multiple comparison.
Figure 6.
Epo mRNA expression before and after IRI. a: Hypoxia and R4 induced large increase of Epo mRNA before IRI. b: A slight stimulation of Epo mRNA expression was observed by R4, R24 and R72 after IRI. n=3-7. H, hypoxia; R, ROX. *p<0.05 by ANOVA and Dunnett’s multiple comparison.
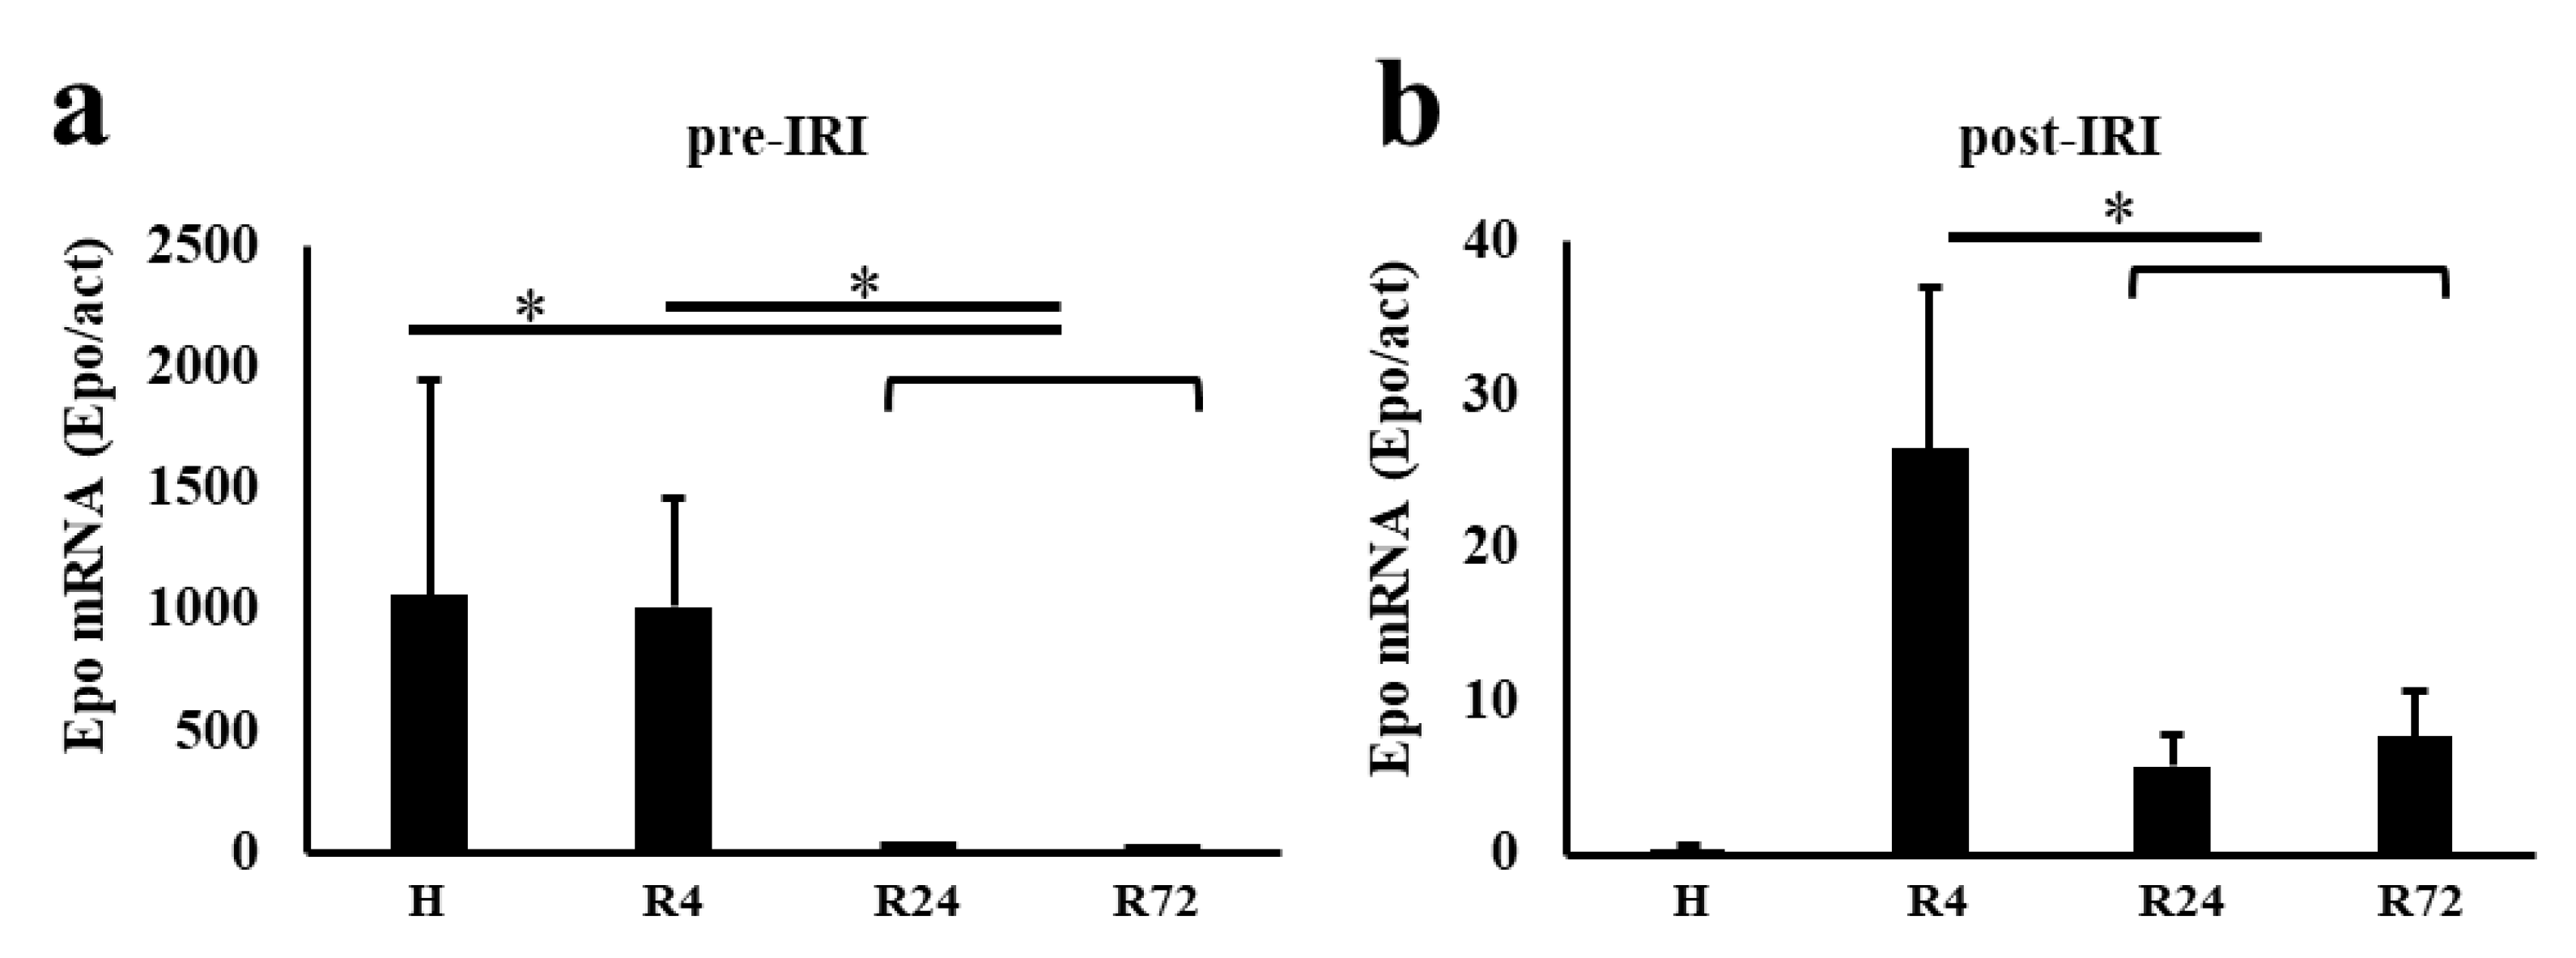
Figure 7.
Immunohistochemical study of Epo production sites by kidney in IRI.
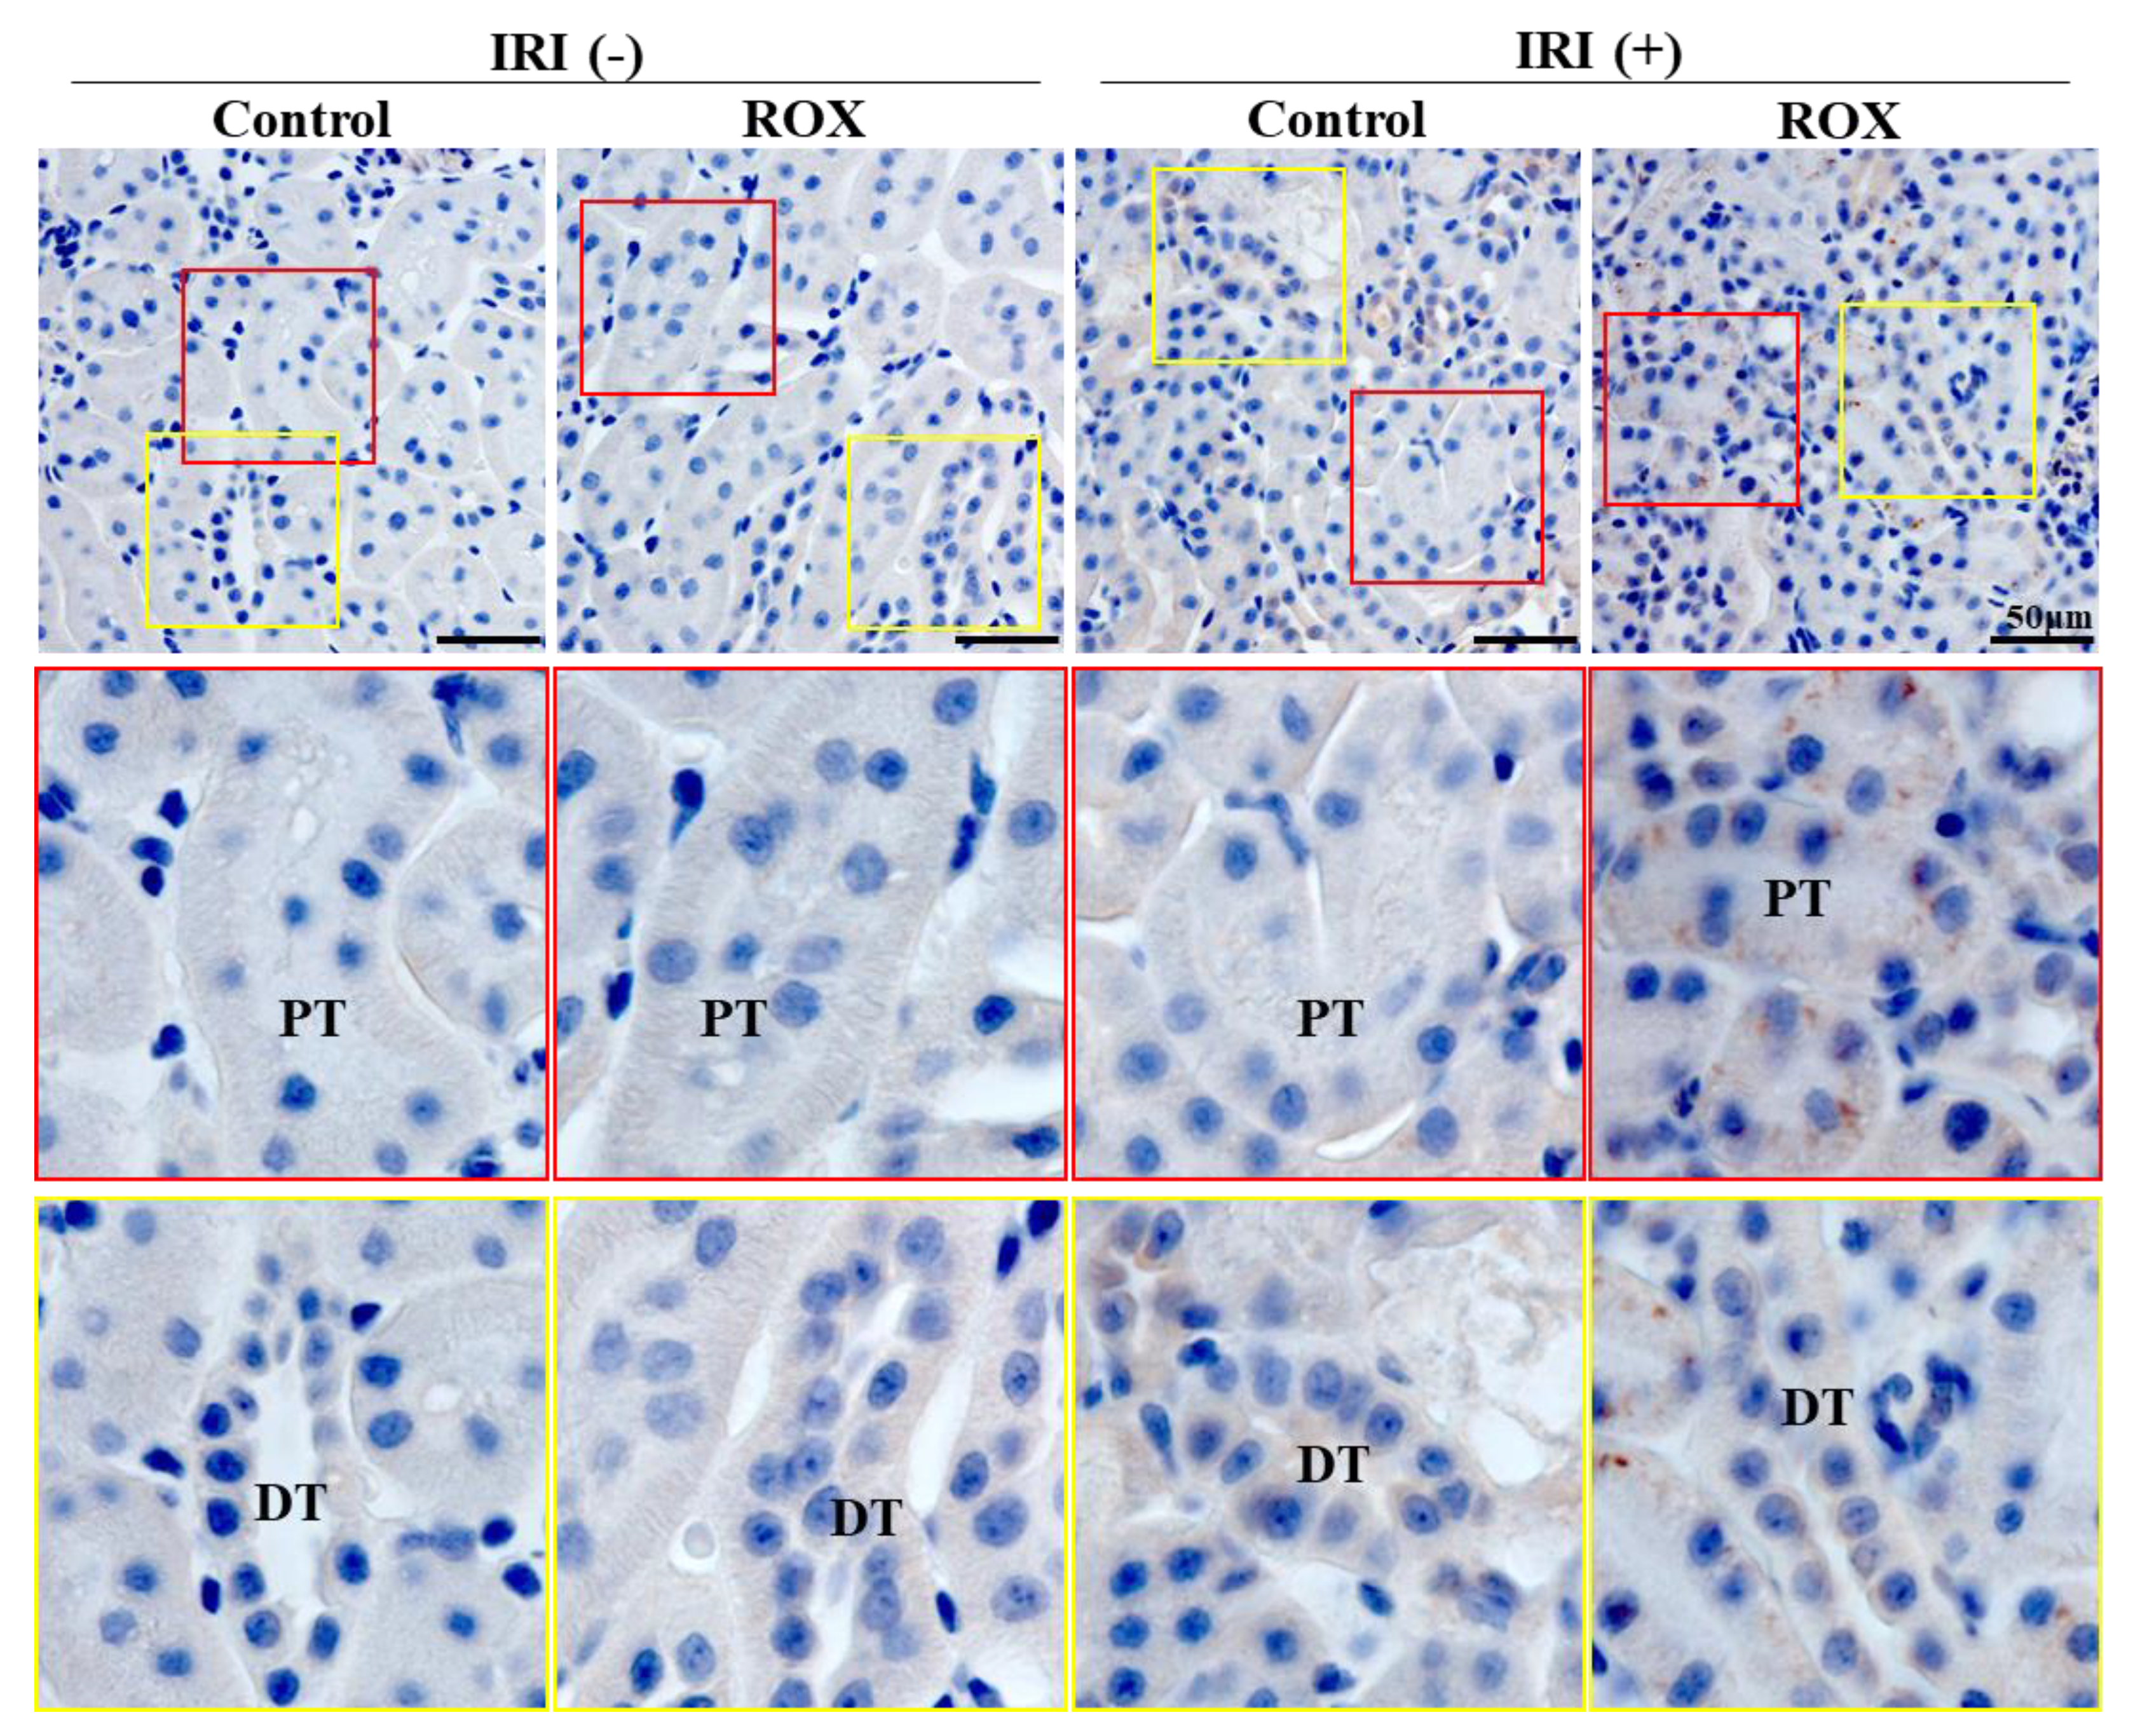
Figure 8a.
Effects of hypoxia and ROX on autophagy. Effects of hypoxia and ROX on autophagy was examined. LC3-II and p62 expression was no changed by hypoxia and ROX. n=4-17. C, control; H, hypoxia; R, ROX.
Figure 8a.
Effects of hypoxia and ROX on autophagy. Effects of hypoxia and ROX on autophagy was examined. LC3-II and p62 expression was no changed by hypoxia and ROX. n=4-17. C, control; H, hypoxia; R, ROX.
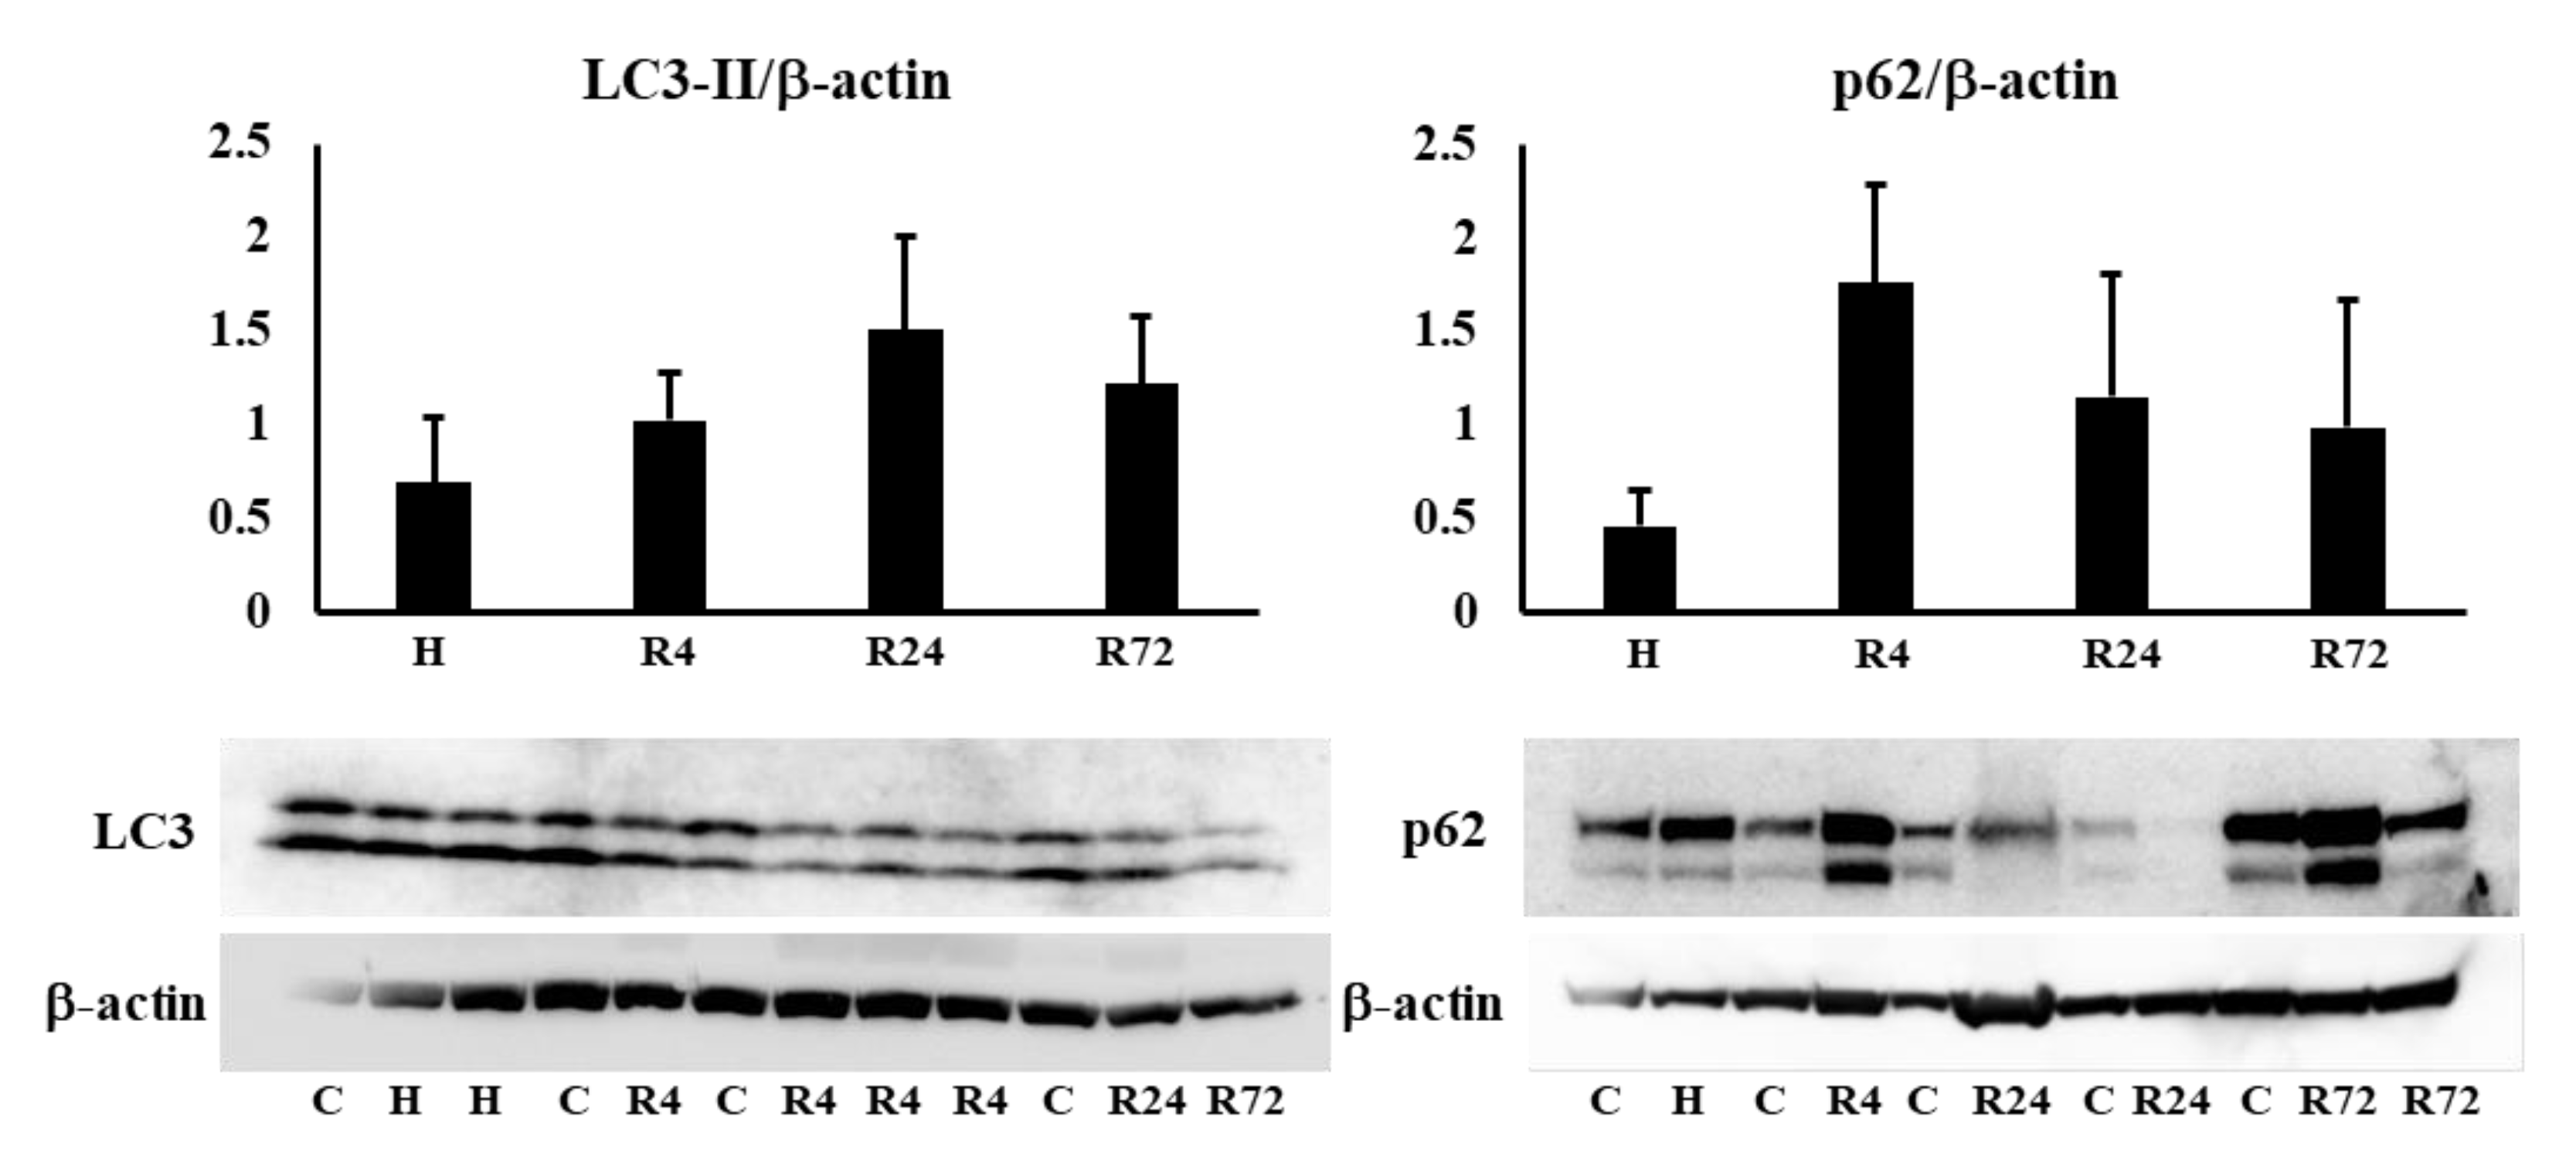
Figure 8b.
Effects of hypoxia and ROX on apoptosis. Effects of hypoxia and ROX on BAX and Bcl-2 expressions. Hypoxia and ROX did not change BAX and Bcl-2 expression in renal cortex and medulla. C, control; H, hypoxia; R, ROX.
Figure 8b.
Effects of hypoxia and ROX on apoptosis. Effects of hypoxia and ROX on BAX and Bcl-2 expressions. Hypoxia and ROX did not change BAX and Bcl-2 expression in renal cortex and medulla. C, control; H, hypoxia; R, ROX.
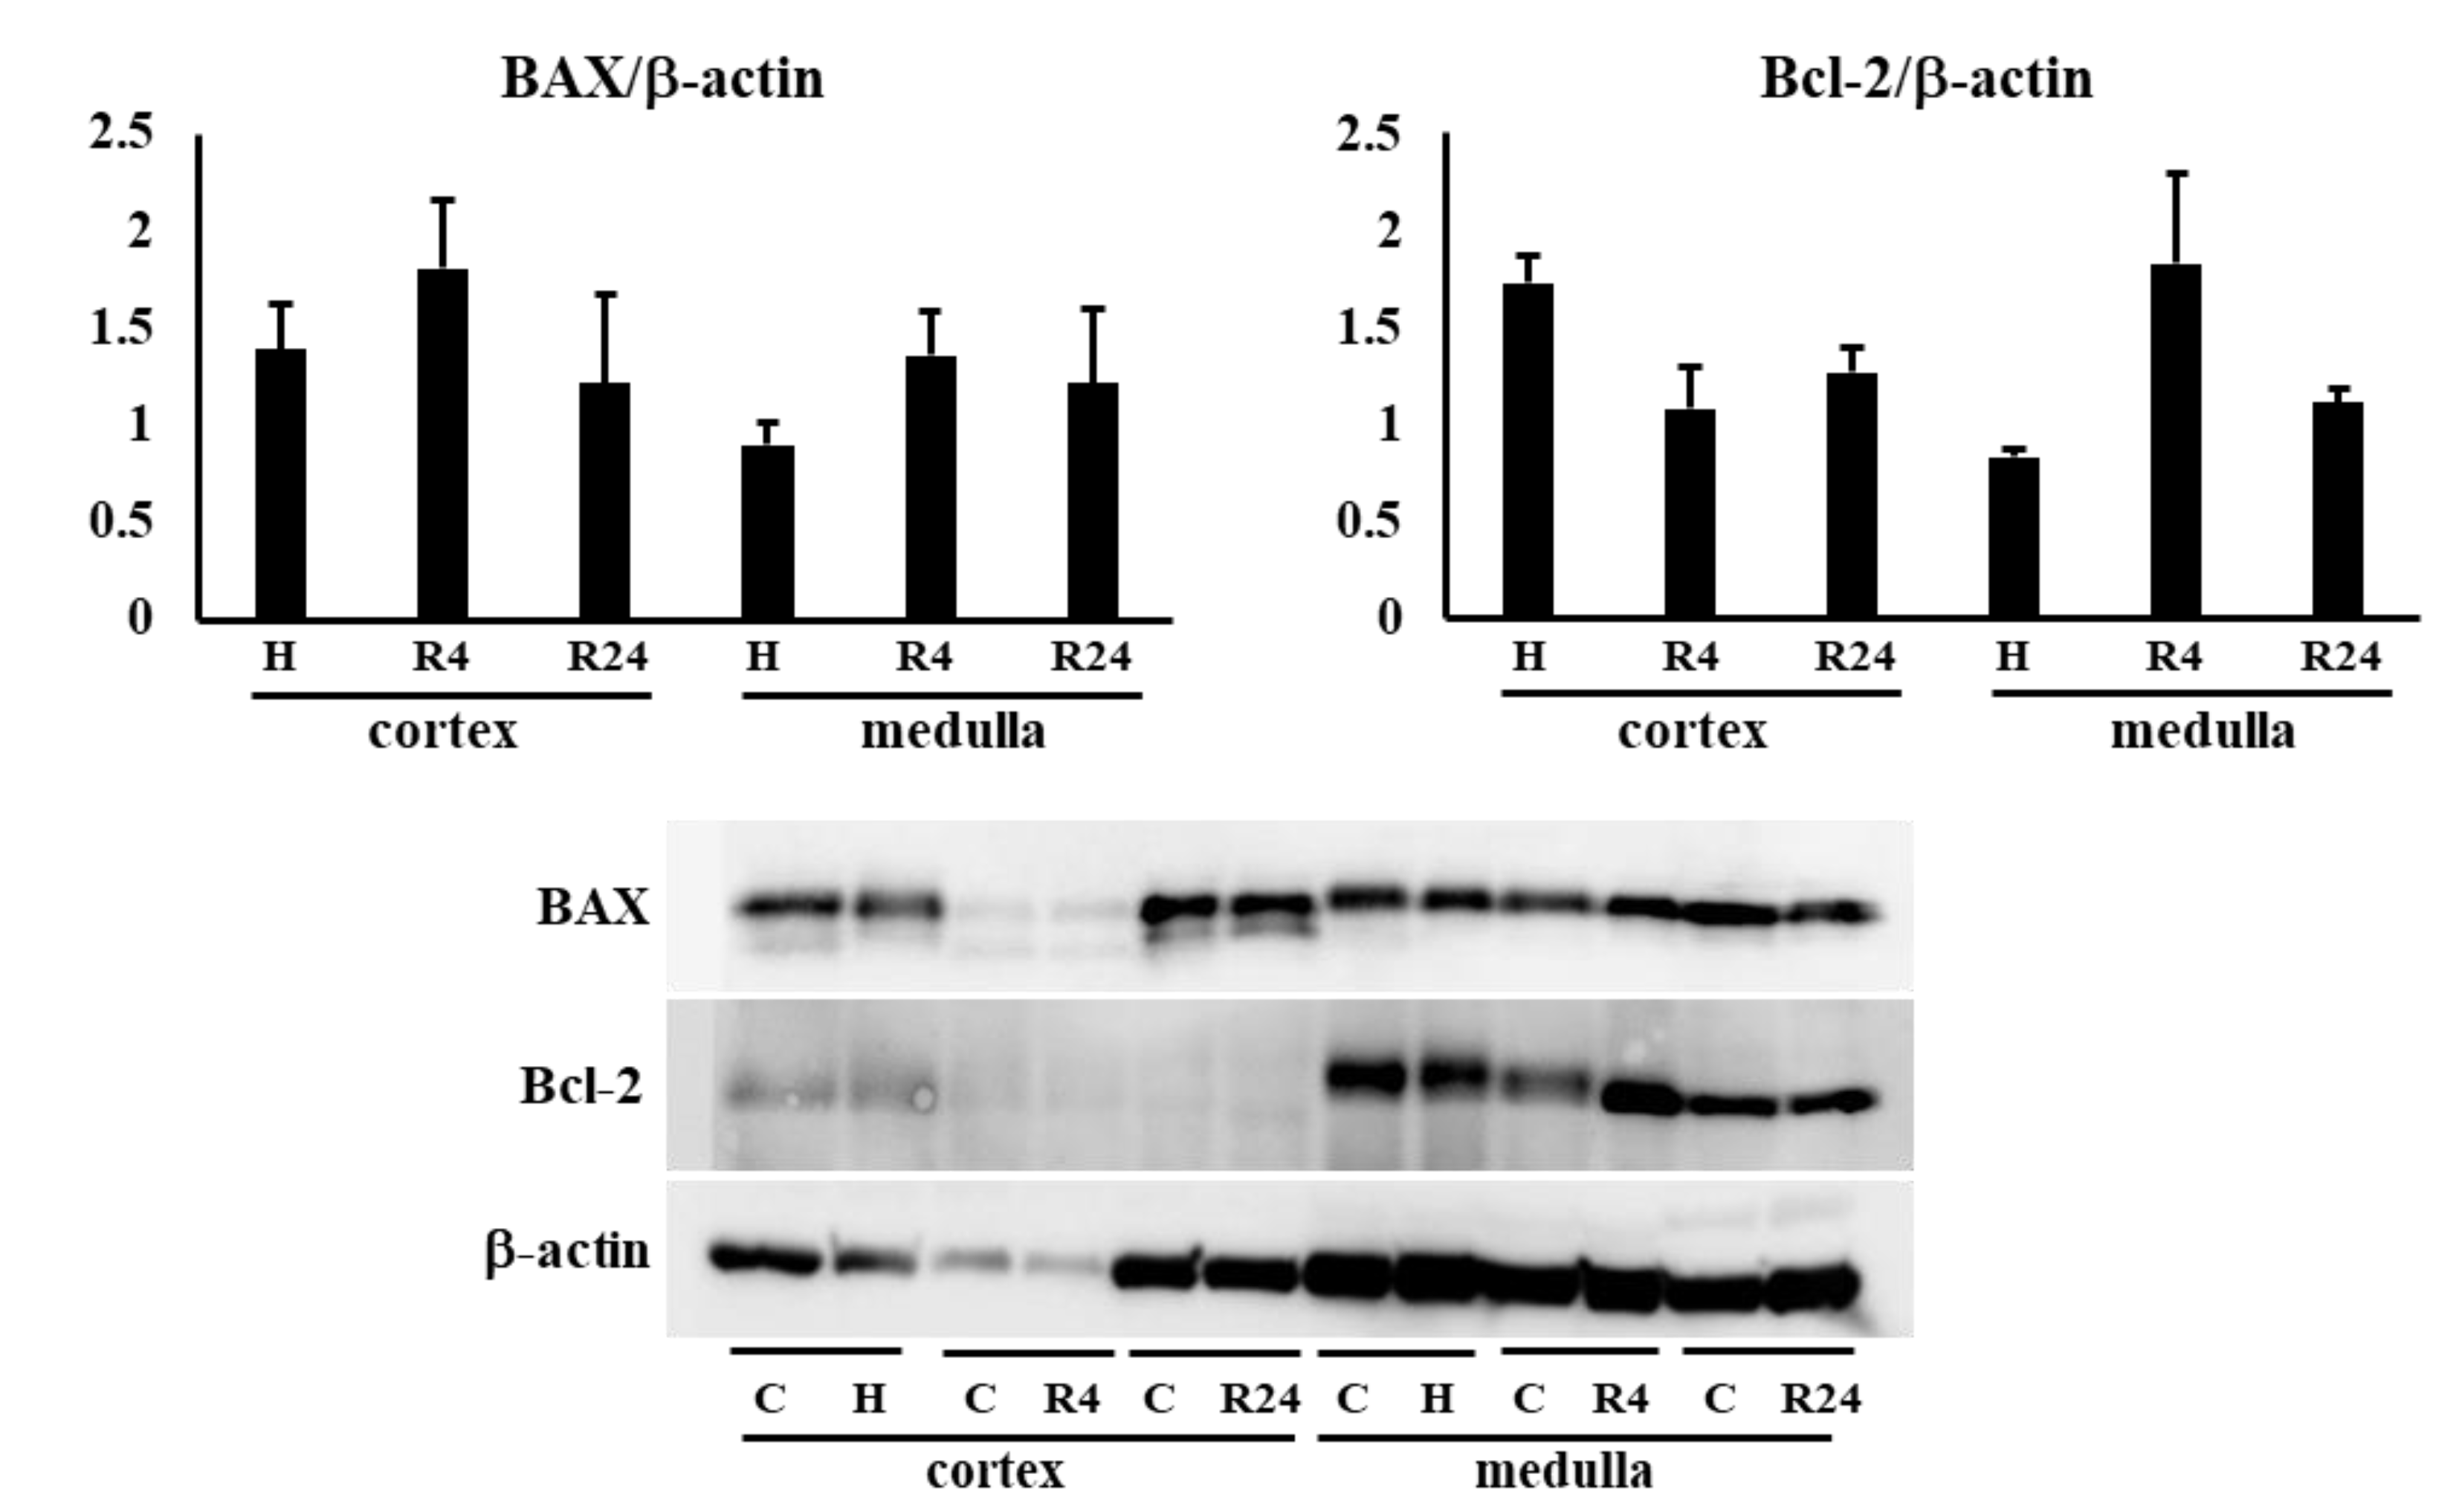
Figure 9.
Effects of hypoxia and ROX on nephron specific protein expression after IRI. PEPCK expression was increased by R24-72. *p<0.05 by ANOVA and Scheffe’s multiple comparison, n=3-4. C, control; H, hypoxia; R, ROX.
Figure 9.
Effects of hypoxia and ROX on nephron specific protein expression after IRI. PEPCK expression was increased by R24-72. *p<0.05 by ANOVA and Scheffe’s multiple comparison, n=3-4. C, control; H, hypoxia; R, ROX.
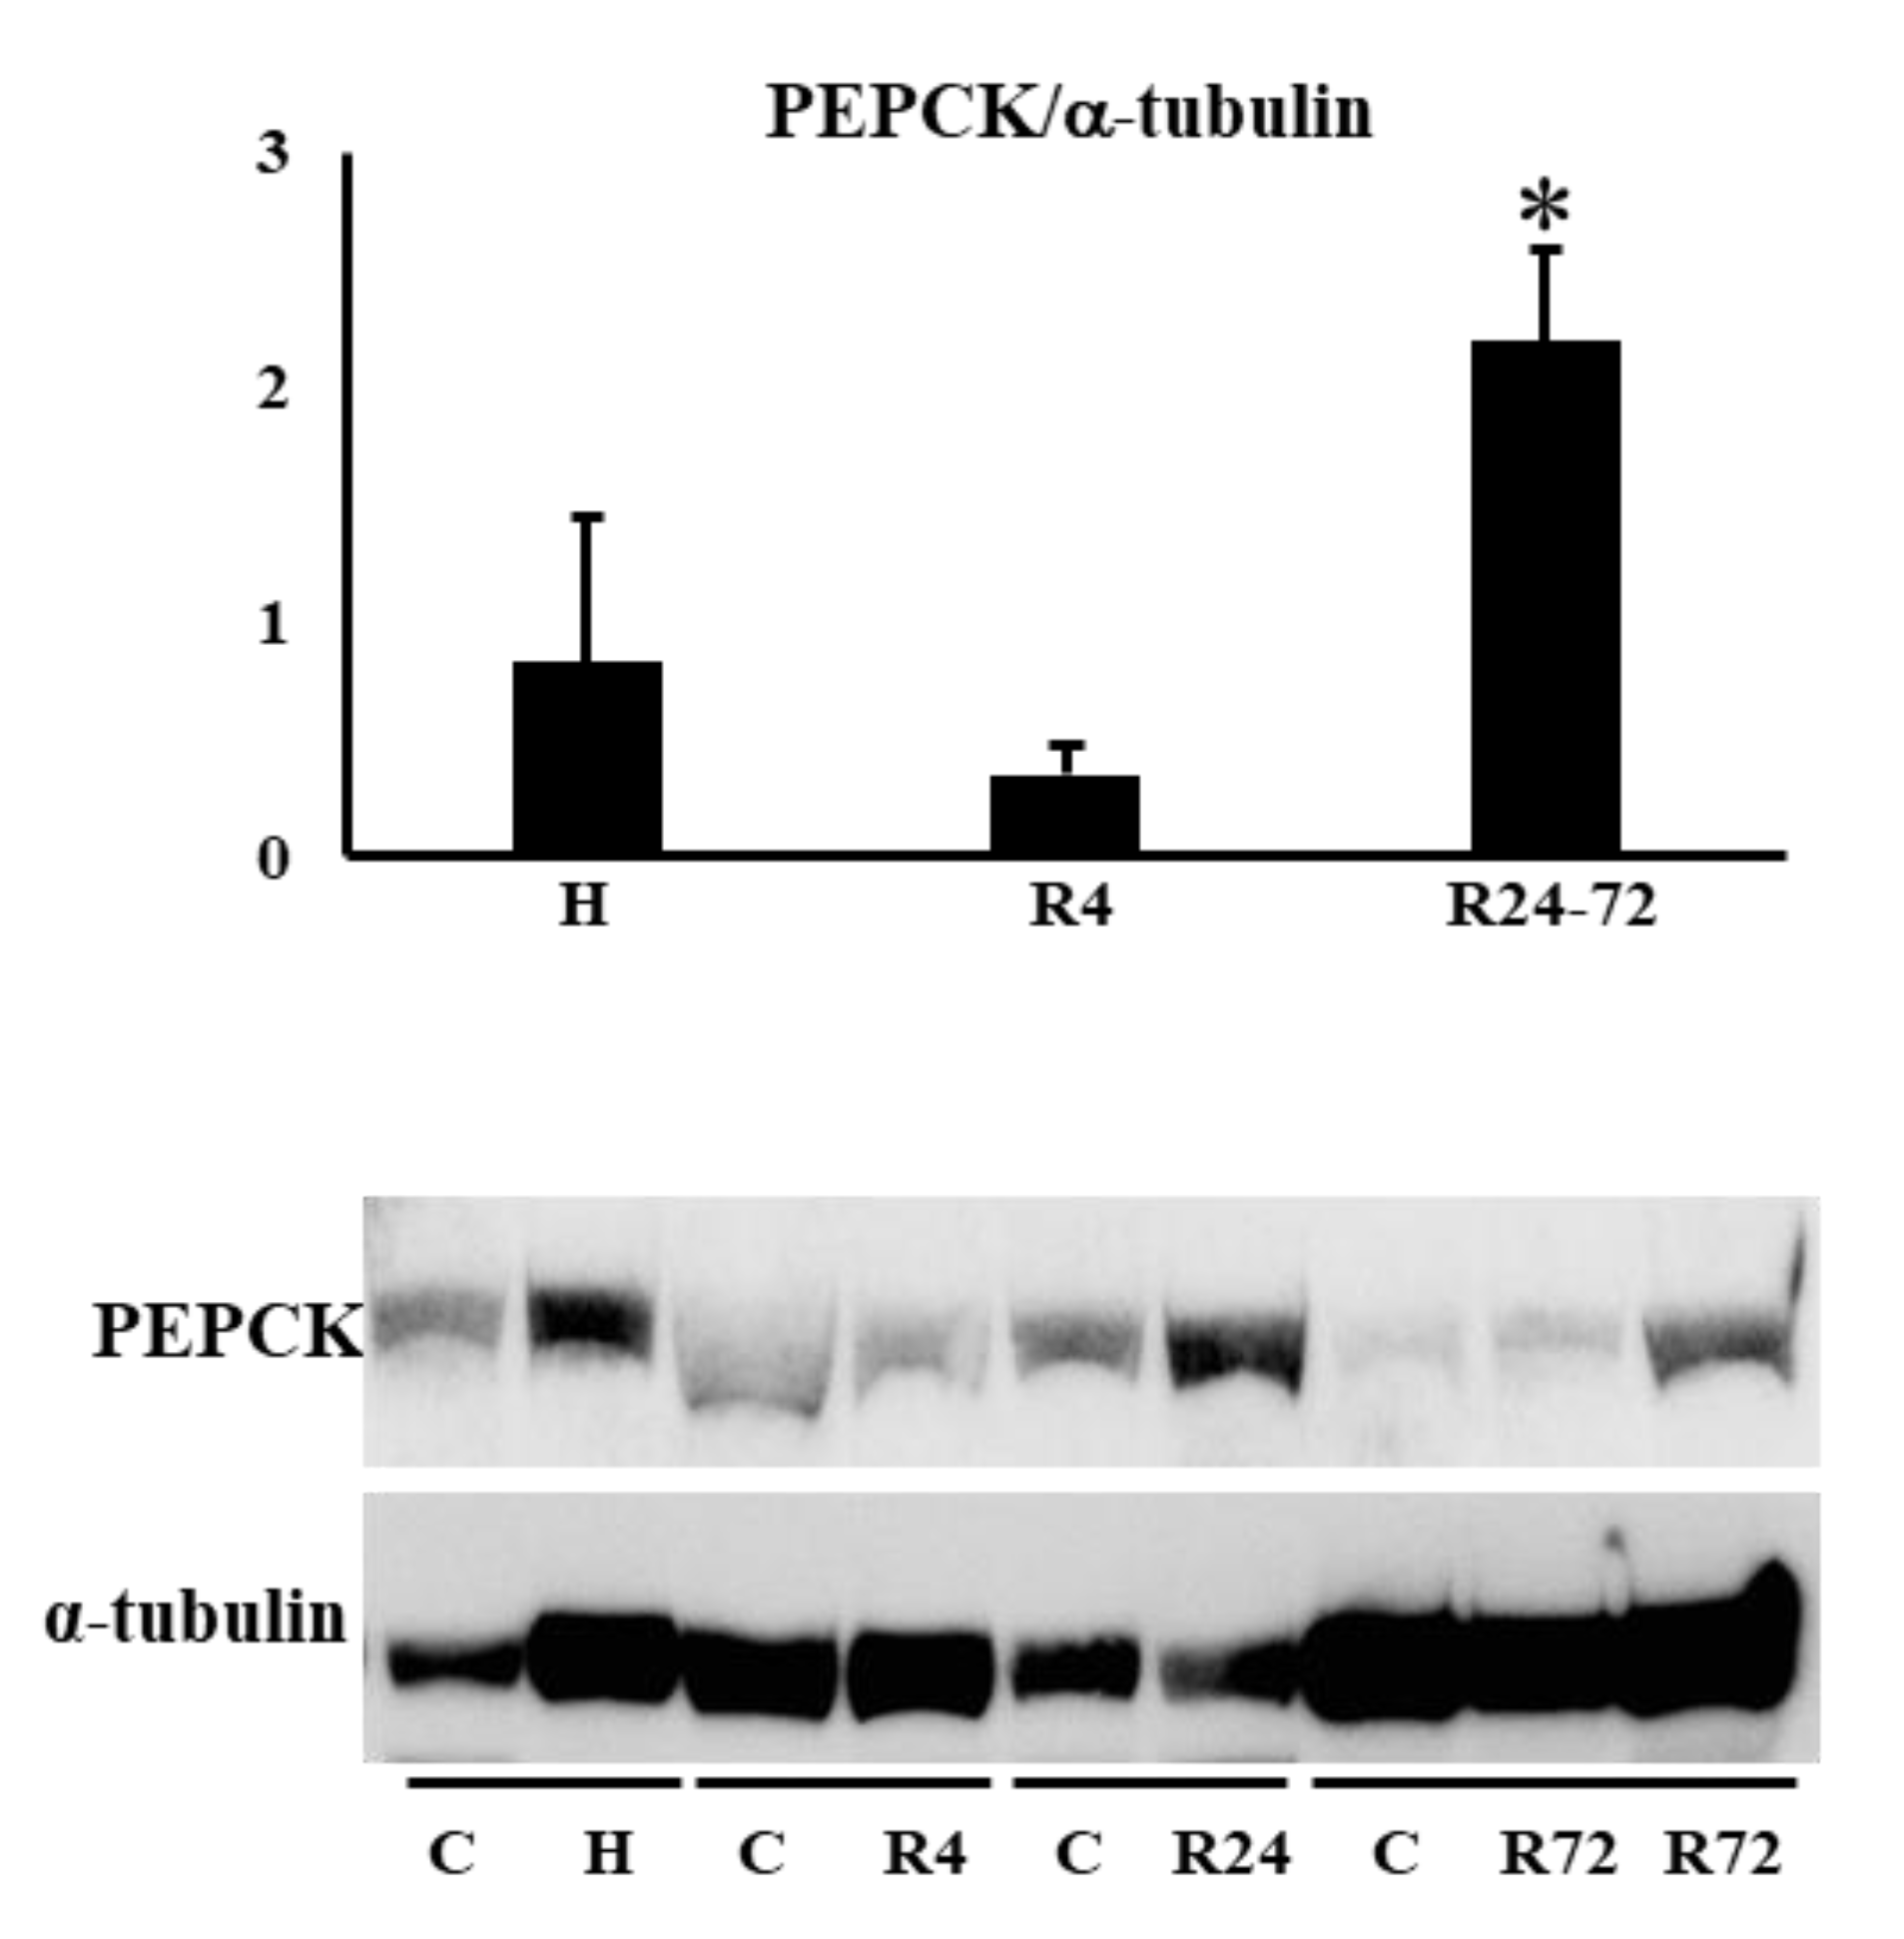
Figure 10.
Effects of hypoxia and ROX on nephron specific mRNA expressions after IRI. GR mRNA and Rhcg mRNA expression were increased in R24 after IRI. *p<0.05 by ANOVA and Scheffe’s multiple comparison. n=3-7. C, control; H, hypoxia; R, ROX.
Figure 10.
Effects of hypoxia and ROX on nephron specific mRNA expressions after IRI. GR mRNA and Rhcg mRNA expression were increased in R24 after IRI. *p<0.05 by ANOVA and Scheffe’s multiple comparison. n=3-7. C, control; H, hypoxia; R, ROX.
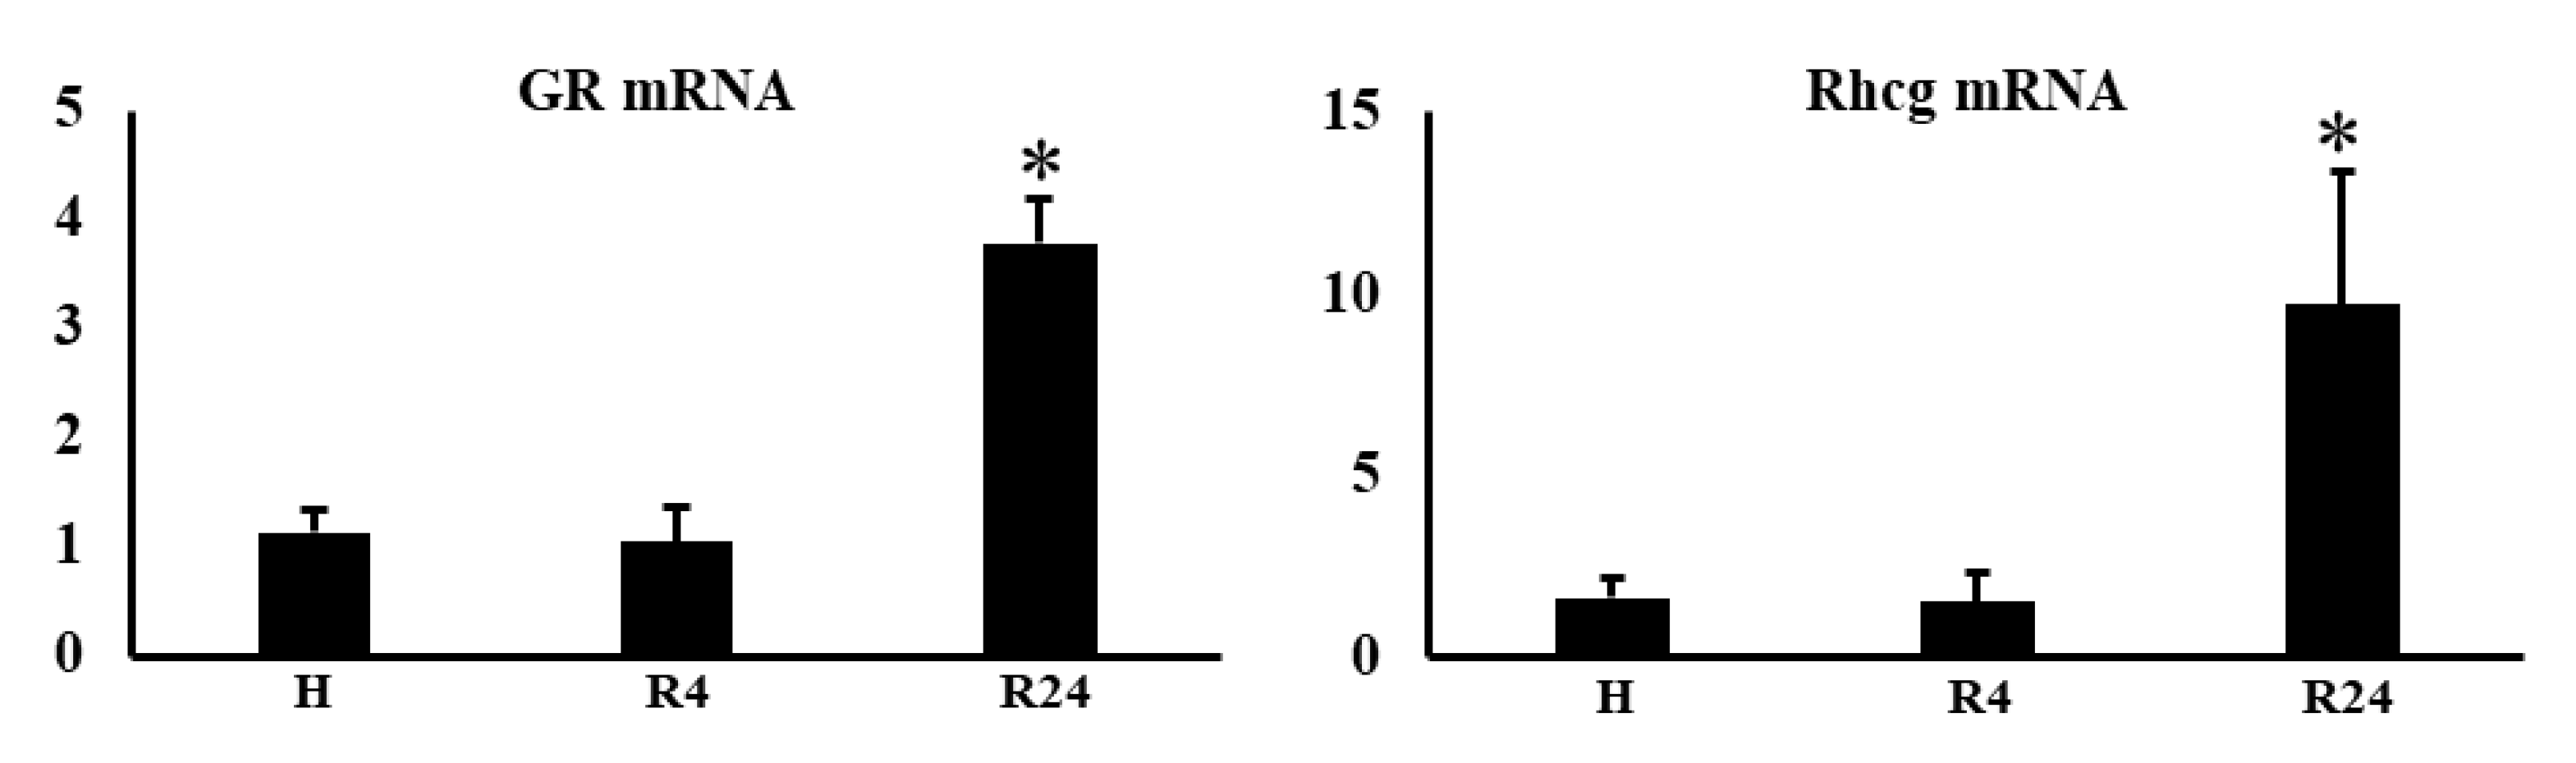

Table 1.
mRNA expression of HIF2a, HIF1a and PHD2 in renal cortex before and after IRI. mRNA expression of HIF2a, HIF1a and PHD2 was examined in renal cortex before and after IRI. The decrease of PHD2 mRNA expression was observed in R24 and R72 group after IRI. Data are expressed as mean ± SD. n=3-7. *p<0.05 by Student’s t-test.
 |
Disclaimer/Publisher’s Note: The statements, opinions and data contained in all publications are solely those of the individual author(s) and contributor(s) and not of MDPI and/or the editor(s). MDPI and/or the editor(s) disclaim responsibility for any injury to people or property resulting from any ideas, methods, instructions or products referred to in the content. |
© 2023 by the authors. Licensee MDPI, Basel, Switzerland. This article is an open access article distributed under the terms and conditions of the Creative Commons Attribution (CC BY) license (http://creativecommons.org/licenses/by/4.0/).
Copyright: This open access article is published under a Creative Commons CC BY 4.0 license, which permit the free download, distribution, and reuse, provided that the author and preprint are cited in any reuse.


