
Submitted:
18 November 2023
Posted:
20 November 2023
You are already at the latest version
Abstract
This paper analyzes low-Earth orbit (LEO) satellite downlinks when an airborne interference source moves parallel to the satellite trajectory by considering the relative angle differences be-tween the satellites and the interference sources. To make the experimental interference situations more like actual environments, the LEO trajectories are obtained from two-line element set (TLE) data. Airborne interference sources with various altitudes move parallel to the LEO trajectories, and the jamming to signal (J/S) ratio is calculated based on the relative angle differences between the ground station, the LEO satellite, and the interference source. In order to calculate the relative angle difference psi, the coordinates of the satellite and the interference source are converted from the World Geodetic System 1984 (WGS84) to the ground station-centered east-north-up (ENU) system. By applying the relative angle difference psi, we can obtain the sidelobe gain of the ground station antenna in the direction from which the interference comes. The results of the study confirm that, from a J/S ratio perspective, the distances between the ground station, LEO satellite, and airborne interference source are important, and in particular, the relative angle difference psi between the interference source and the satellite is more critical factor.
Keywords:
LEO satellite
; link budget
; antenna radiation patterns
; interference situation
; relative angle
; coordinate system conversion
; J/S ratio
1. Introduction
Low-Earth orbit (LEO) satellites have been widely used to perform various Earth observation missions, such as resource monitoring, weather surveillance, and military reconnaissance, while circling the Earth along a trajectory below 2,000 km in altitude [1,2]. To perform these missions effectively, the satellites often employ synthetic aperture radars to capture high-resolution images of the Earth’s surface, and the image data is then transmitted at high speed to ground stations using X-band downlinks. The data communication time between LEO satellites and ground stations is limited to a maximum of 10 minutes, though this varies slightly depending on the satellite trajectory. In order to predict whether or not image data can be received within such a short period of time, link budget analysis that considers various environmental factors is essential. Link budget analysis considering natural earth environment, such as atmospheric impact [3,4,5] and Doppler shift [6,7,8], has been previously conducted. In addition, studies on link budget in interference environments where ground station antennas are exposed to intentional electromagnetic (EM) interference sources, have also been investigated [9,10,11]. Although some research has been conducted in various interference situations, there is a lack of studies analyzing real LEO satellite trajectories and airborne interference sources. Additionally, more in-depth research is required to accurately derive link budgets by considering the sidelobe gain of the ground station antenna based on the relative angle difference between the LEO satellite and the airborne interference source.
In this paper, we analyze LEO satellite downlinks under interference situations when airborne interference sources move parallel to the satellite trajectory by considering the relative angle differences between the satellites and the interference sources. To make interference situations more like actual environments, we use two-line element set (TLE) data of LEO satellite trajectory information including geodetic coordinates provided by the Joint Space Operations Center at Vandenberg Air Force Base. Airborne interference sources with various altitudes (3 km, 6 km, 9 km, and 12 km) move parallel to the trajectories of the LEO satellites, and the jamming to signal (J/S) ratio is calculated based on the relative angle differences between the ground station, satellite, and interference source. In order to express the positions of these three elements, the World Geodetic System 1984 (WGS84) coordinates are converted to the ground station-centered east-north-up (ENU) system [12,13]. Based on the ENU coordinates, the relative angle difference between the satellite and the interference source is calculated, and the sidelobe gain of the ground station antenna to the direction where interference electromagnetic (EM) waves are incoming. The radiation pattern of the ground station antenna is obtained using geometrical optics (GO) and physical optics (PO) [14], and the sidelobe gain is then obtained and applied to the J/S ratio calculation. We investigate the link budget under interference situations in which airborne interference sources move at a minimum distance of 100 km (Path 1), 200 km (Path 2), and 300 km (Path 3) from the ground station. For each path, the elevation angle and slant distance between interference source and ground station are calculated during data communication time according to altitudes of the airborne interference source. In all scenarios, the data communication time between the LEO satellite and the ground station is assumed to be approximately 600 seconds. We examine the J/S ratio results according to satellite trajectories with maximum elevation angles of 86.8° (Trajectory 1), 62.7° (Trajectory 2), and 37.3° (Trajectory 3). The trends in relative angle difference and J/S ratio according to the paths and altitudes of the interference source are observed, and the results confirm that the J/S ratio increases as the relative angle difference decreases. These results show that although the distances between ground station, LEO satellite, and interference source are important from a J/S ratio perspective, the relative angle difference between interference source and satellite is an even more critical factor.
2. Scenario of Interference Source Moving along the Satellite Trajectory
2.1. LEO Satellite Downlink Scenario and J/S Ratio Calculation
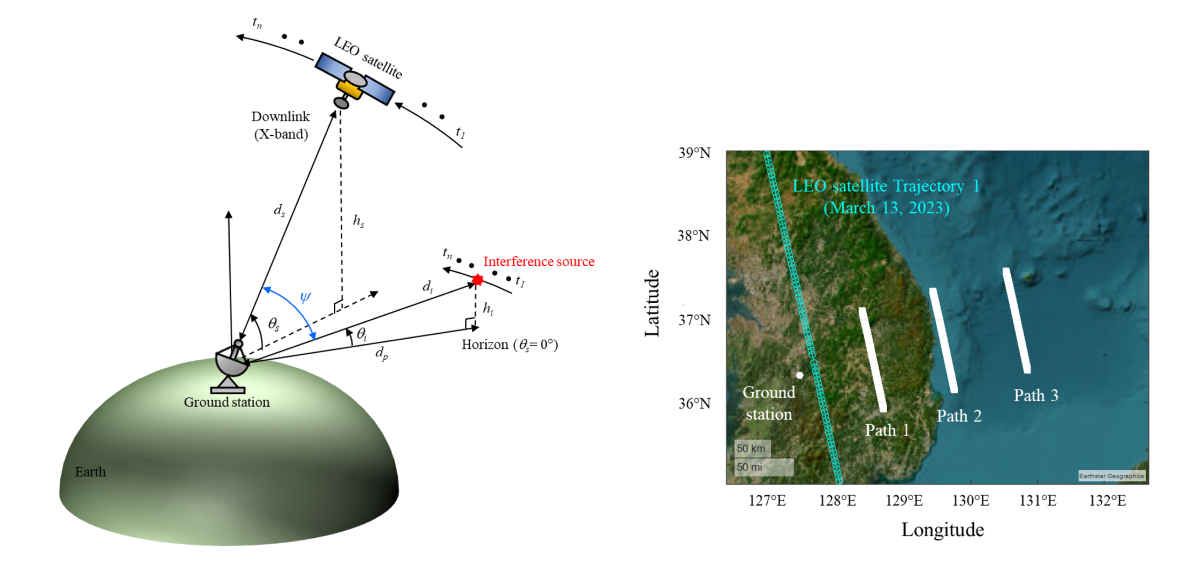
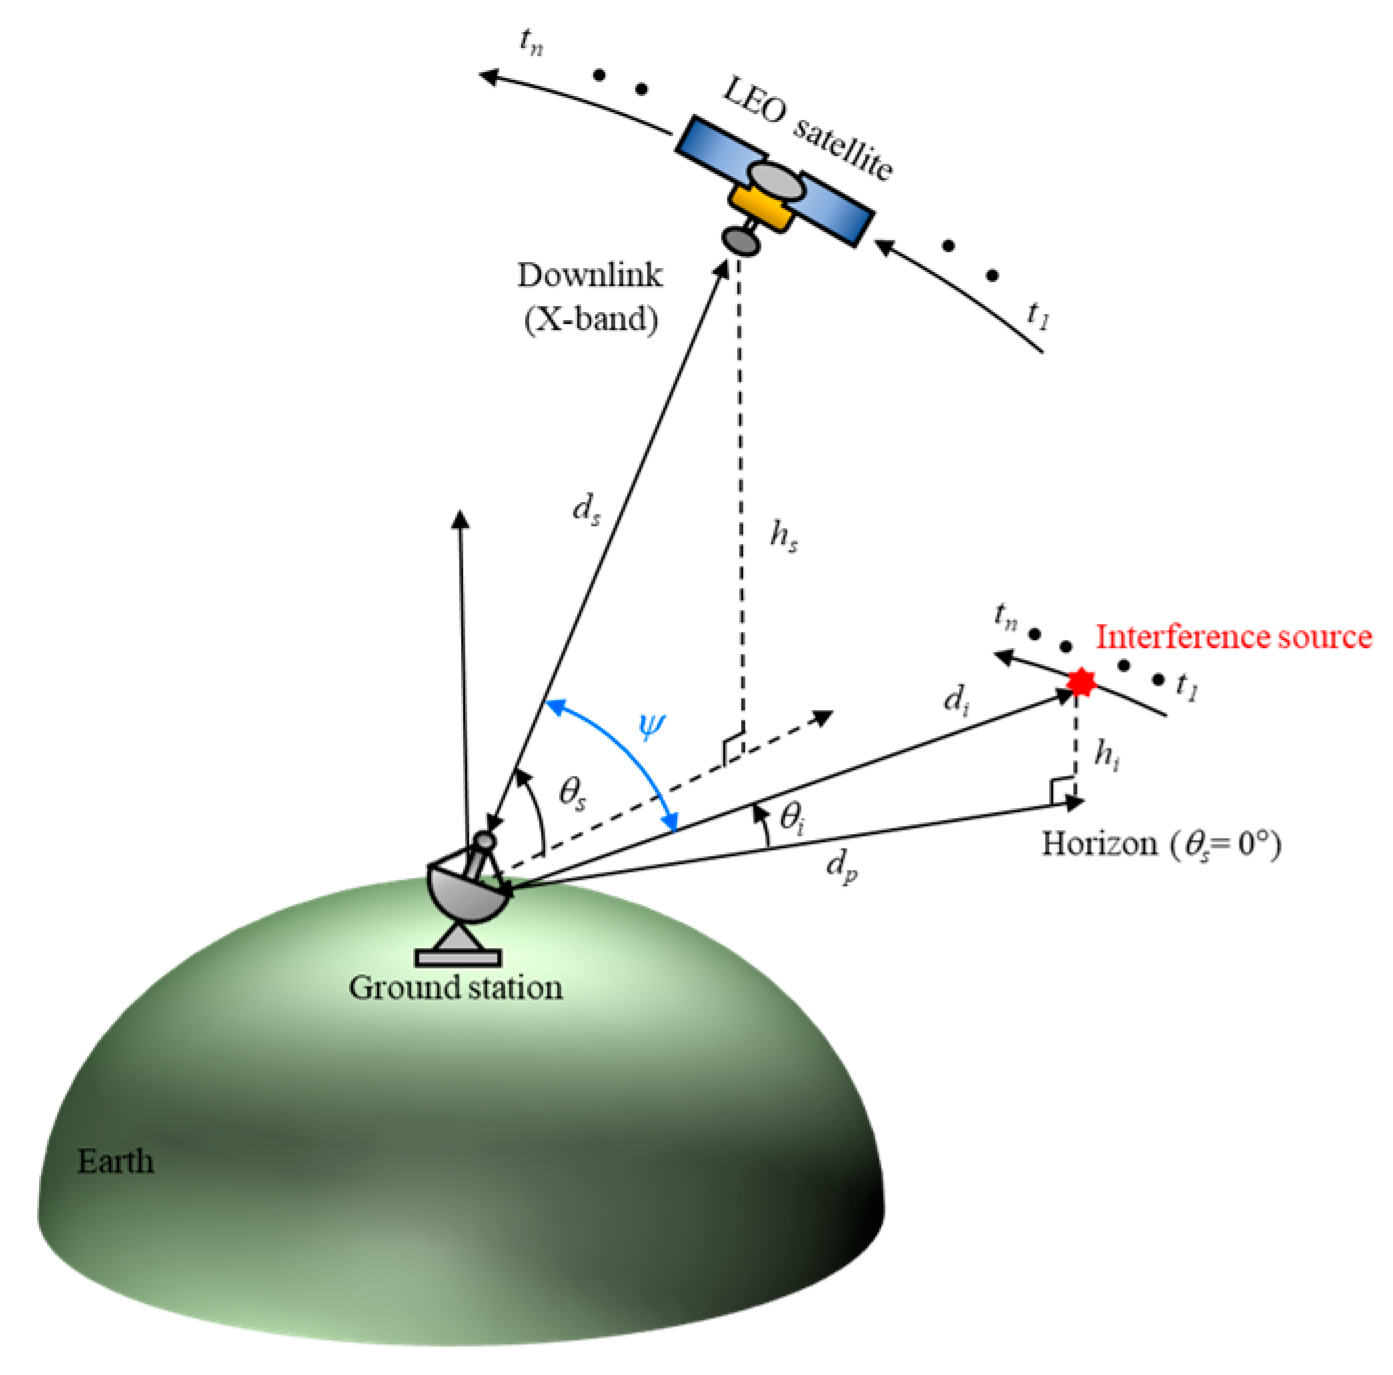
Figure 1 shows a conceptual figure of a LEO satellite downlink scenario in an interference situation where the ground station is exposed to strong EM waves incoming from an airborne source that moves along a path parallel to the LEO satellite trajectory. The LEO satellite moves along a trajectory with an altitude of hs and transmits image data to the ground station through an X-band downlink. When the ground station is assumed to be the center of the coordinates,  s is the elevation angle between the LEO satellite and the Earth’s surface, and ds is the slant distance from the ground station to the satellite. As the satellite transmits image data to the ground station, the airborne interference source moves parallel to the trajectory of the LEO satellite at a distance dp from the ground station. The elevation angle between the interference source and the Earth’s surface is i, and the slant distance to the interference source is di. The satellite transmits image data between t1 and tn to the ground station located at a specific latitude and longitude on the Earth’ surface. The ideal data communication time is about 600 seconds, during which the relative angle difference between the LEO satellite and the airborne interference source is . To analyze the link budget under these conditions, the J/S ratio can be calculated using Equation (1)
s is the elevation angle between the LEO satellite and the Earth’s surface, and ds is the slant distance from the ground station to the satellite. As the satellite transmits image data to the ground station, the airborne interference source moves parallel to the trajectory of the LEO satellite at a distance dp from the ground station. The elevation angle between the interference source and the Earth’s surface is i, and the slant distance to the interference source is di. The satellite transmits image data between t1 and tn to the ground station located at a specific latitude and longitude on the Earth’ surface. The ideal data communication time is about 600 seconds, during which the relative angle difference between the LEO satellite and the airborne interference source is . To analyze the link budget under these conditions, the J/S ratio can be calculated using Equation (1)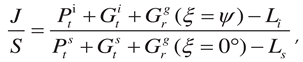
where S is the power received by the ground station, and is the transmit power from the LEO satellite. is the bore-sight gain of the data transmission antenna in the satellite.
(ξ) is the gain pattern of the ground station antenna according to the steering angle ξ, and (ξ = 0°) is the bore-sight gain of the ground station antenna. Here, it is assumed that the ground station antenna is tracking precisely in the direction of the satellite, and thus the gain of the ground station toward the satellite is always (ξ = 0°). Ls is the path loss between the LEO satellite and the ground station, calculated assuming free space. J is the power received at the ground station from the airborne interference source and is calculated in a similar way to S. is the transmission power from the airborne interference source, and is the bore-sight gain of the airborne interference source antenna. (ξ = ) is the sidelobe gain of the ground station antenna to the direction where the ground station is exposed to strong EM interference waves incoming. Li is the path loss from the airborne interference source to the ground station.
) is the sidelobe gain of the ground station antenna to the direction where the ground station is exposed to strong EM interference waves incoming. Li is the path loss from the airborne interference source to the ground station. Figure 1.
Conceptual figure of the LEO satellite downlink scenario under interference situations.
2.2. Derivation of Relative Angle Difference with Sidelobe Gain
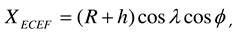
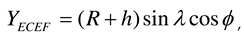
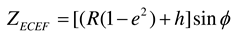
For the J/S ratio in equation (1), Ls can be obtained using the LEO satellite's TLE data. The TLE data consists of two lines of trajectory information, including epoch times, eccentricities, and inclination angles. Based on these data, location information such as latitude, longitude, and altitude is obtained to predict the trajectory. ds is calculated by applying the free-space Friis equation with the slant distance between satellite and ground station. J is then calculated from the path loss Li and the sidelobe gain of the ground station antenna toward the interference source, and thus the sidelobe gain is determined by the location of the interference source. To calculate the sidelobe gain toward the interference source, the relative angle difference is defined. is the angle between the LEO satellite and the airborne interference source when the ground station antenna is set as the origin of the coordinate system. Latitude, longitude, and altitude coordinates are generally referred to using WGS84. For example, the latitude g, longitude g, and altitude hg of the ground station according to WGS84 are indicated by the green square marker in Figure 2(a). To calculate the relative angle difference , the WGS84 coordinates of the LEO satellite, ground station, and airborne interference source are converted into ENU coordinates. The ENU system uses Cartesian coordinates relative to a specific Earth location as its origin. Here the location of the ground station is the origin for the ENU system. Converting coordinates from WGS84 to ENU requires two steps: conversion from WGS84 to Earth-centered Earth-fixed (ECEF) and then conversion from ECEF to ENU. To convert to the ECEF coordinate system, the Earth's radius R is calculated at latitude by Equation (3a), where a (= 6378.137 km for WGS84) is the ellipsoidal equatorial radius and e is the eccentricity of the ellipsoid (e2 = 0.00669437999 for WGS84). The ECEF system has the center of the Earth as the origin (0, 0, 0), which allows us to calculate XECEF, YECEF, and ZECEF from latitude , longitude , and altitude h using Equations (3b) to (3d):
is defined. is the angle between the LEO satellite and the airborne interference source when the ground station antenna is set as the origin of the coordinate system. Latitude, longitude, and altitude coordinates are generally referred to using WGS84. For example, the latitude g, longitude g, and altitude hg of the ground station according to WGS84 are indicated by the green square marker in Figure 2(a). To calculate the relative angle difference , the WGS84 coordinates of the LEO satellite, ground station, and airborne interference source are converted into ENU coordinates. The ENU system uses Cartesian coordinates relative to a specific Earth location as its origin. Here the location of the ground station is the origin for the ENU system. Converting coordinates from WGS84 to ENU requires two steps: conversion from WGS84 to Earth-centered Earth-fixed (ECEF) and then conversion from ECEF to ENU. To convert to the ECEF coordinate system, the Earth's radius R is calculated at latitude by Equation (3a), where a (= 6378.137 km for WGS84) is the ellipsoidal equatorial radius and e is the eccentricity of the ellipsoid (e2 = 0.00669437999 for WGS84). The ECEF system has the center of the Earth as the origin (0, 0, 0), which allows us to calculate XECEF, YECEF, and ZECEF from latitude , longitude , and altitude h using Equations (3b) to (3d): 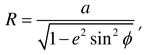
Now the locations of the ground station, LEO satellite, and airborne interference source are converted from WGS84 to ECEF, and the transformation matrices (4a) and (4b) can be used to obtain the ENU coordinates where the ground station is the origin. and are the position vectors of the satellite and interference source, respectively. The relative angle difference can be derived by calculating the dot product of the two vectors using equation (4c).
can be derived by calculating the dot product of the two vectors using equation (4c).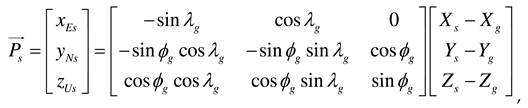
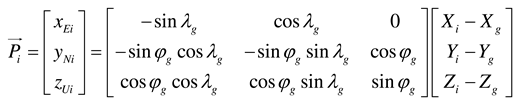
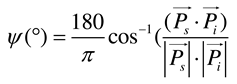
Figure 3 shows the radiation pattern of a ground station antenna with parabolic reflector and rectangular feed horn. The bore-sight gain of the antenna is 59 dBi at 8 GHz. The blue solid line indicates the radiation pattern obtained using GO and PO methods. The GO method is used to model the antenna focusing and reflection inside the reflector, and the PO method is used to calculate the scattering and refraction on the reflector surface by considering the current distribution on the surface. By combining these two methods, the ground station antenna radiation pattern can be calculated. The parabolic diameter of the ground station antenna is 11.3 m, and a feed horn antenna with rectangular aperture is employed. Since sidelobe gain exhibits large fluctuations according to angle, we apply a regression model to it in order to more easily observe the tendency of the J/S ratio. The regression model is based on the exponential Equation (5)
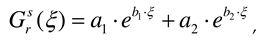
where a1 (=−31.5817), a2 (=36.7337), b1(=0.0046), and b2 (=−0.0682) are the coefficients that best fit to the point, shown as the red solid line. To determine the sidelobe gain, we apply the obtained from Equation (4c) to Equation (5). Detailed parameters for the downlink interference scenarios are given in Table 1.
obtained from Equation (4c) to Equation (5). Detailed parameters for the downlink interference scenarios are given in Table 1.3. Analysis of the LEO Satellite Downlinks in Interference Situations
Figure 4(a) shows the satellite trajectories obtained from the TLE data. The blue, red, and green solid lines with circle markers represent the trajectories of the LEO satellite for March 13 (Trajectory 1), March 16 (Trajectory 2), and March 21 (Trajectory 3), 2023, respectively. The ground station is located at latitude 36.33° and longitude 127.26°. The time at which communication between this ground station and the LEO satellite begins is defined as t1, and when communication ends is defined as tn. In general, the data communication time is less than 600 seconds, so t1 and tn are respectively defined as 0 and 600 seconds in this scenario. Figure 4(b) shows the slant distance ds and elevation angle qs between the ground station and the LEO satellite for each trajectory. The maximum elevation angles of Trajectory 1, Trajectory 2, and Trajectory 3 are 86.8°, 62.7°, and 37.3°, respectively, and the slant distances from the ground station to the satellite at the maximum elevation angle of each trajectory are 550.9 km, 618.6 km, and 908.1 km, respectively.
Figures 5(a) and 5(b) show the airborne interference source paths during data communication time on March 13, 2023. dp is the distance between the ground station and the interference source, and the minimum dp for paths 1, 2, and 3 is 100 km, 200 km, and 300 km, respectively, with the paths parallel to LEO satellite Trajectory 1. The paths of the interference source and satellite, and the ground station location, are illustrated on a WGS84 map. To observe the movement of the interference source from the perspective of the ground station, its elevation angle i and slant distance di are derived using ENU coordinates, with the ground station as the origin location. When the altitude of the interference source is fixed at 12 km, the maximum elevation angles are 6.7° (Path 1), 3.4° (Path 2), and 2.2° (Path 3). The minimum slant distances are 101.6 km (Path 1), 201.7 km (Path 2), and 301.9 km (Path 3).
i and slant distance di are derived using ENU coordinates, with the ground station as the origin location. When the altitude of the interference source is fixed at 12 km, the maximum elevation angles are 6.7° (Path 1), 3.4° (Path 2), and 2.2° (Path 3). The minimum slant distances are 101.6 km (Path 1), 201.7 km (Path 2), and 301.9 km (Path 3).
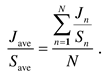
Figure 6 shows the relative angle difference and J/S ratio results obtained by varying the altitude of the airborne interference when the LEO satellite moves along Trajectory 1. In order to more easily observe the trends according to path and altitude during data communication time (n = 1, N = 600), the average and J/S ratio are obtained using Equations (6a) and (6b):
and J/S ratio results obtained by varying the altitude of the airborne interference when the LEO satellite moves along Trajectory 1. In order to more easily observe the trends according to path and altitude during data communication time (n = 1, N = 600), the average and J/S ratio are obtained using Equations (6a) and (6b):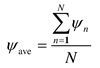
Figures 6(a) and 6(b) show and the J/S ratio when the altitudes of the interference source in Path 1 are 3 km, 6 km, 9 km, and 12 km. The ave values according to these altitudes are 73.2°, 72.2°, 71.2°, and 70.2°, respectively. The Jave/Save ratios for these altitudes are −22.3 dB, −22.1 dB, −21.9 dB, and −21.7 dB, respectively. Figures 6(c) and 6(d) present the and J/S ratio according to altitude when the interference source moves along Path 2. For each altitude, the ave values are 80.8°, 80.3°, 79.8°, and 79.3° , respectively. The Jave/Save ratios are –29.5 dB, –29.4 dB, –29.2 dB, and –29.1 dB, respectively. The and J/S ratio when the interference source moves along Path 3 are illustrated in Figures 6(e) and 6(f).
and the J/S ratio when the altitudes of the interference source in Path 1 are 3 km, 6 km, 9 km, and 12 km. The ave values according to these altitudes are 73.2°, 72.2°, 71.2°, and 70.2°, respectively. The Jave/Save ratios for these altitudes are −22.3 dB, −22.1 dB, −21.9 dB, and −21.7 dB, respectively. Figures 6(c) and 6(d) present the and J/S ratio according to altitude when the interference source moves along Path 2. For each altitude, the ave values are 80.8°, 80.3°, 79.8°, and 79.3° , respectively. The Jave/Save ratios are –29.5 dB, –29.4 dB, –29.2 dB, and –29.1 dB, respectively. The and J/S ratio when the interference source moves along Path 3 are illustrated in Figures 6(e) and 6(f).
Figure 7(a) shows the paths of the airborne interference source and LEO Trajectory 2 on a WGS84 map for March 16, 2023. The minimum dp for paths 1, 2, and 3 is 100 km, 200 km, and 300 km, respectively, and the paths are parallel to LEO satellite Trajectory 2. Figure 7(b) shows the elevation angle i and slant distance di for when the interference source moves along path 1, 2, and 3 at an altitude of 12 km. The maximum elevation angles are 6.7° (Path 1), 3.4° (Path 2), and 2.2° (Path 3). When the interference source is located at the maximum elevation, the slant distances are 101.2 km (Path 1), 201.5 km (Path 2), and 301.2 km (Path 3).
i and slant distance di for when the interference source moves along path 1, 2, and 3 at an altitude of 12 km. The maximum elevation angles are 6.7° (Path 1), 3.4° (Path 2), and 2.2° (Path 3). When the interference source is located at the maximum elevation, the slant distances are 101.2 km (Path 1), 201.5 km (Path 2), and 301.2 km (Path 3).Figures 8(a) and 8(b) show and the J/S ratio according to the different altitudes of the airborne interference source. When the source moves along Path 1 at altitudes of 3 km, 6 km, 9 km, and 12 km, the ave values are 59.4°, 58.4°, 57.3°, and 56.3°, respectively, and the Jave/Save ratios are −18.7 dB, −18.4 dB, −18.2 dB, and −17.9 dB, respectively. Figures 8(c) and 8(d) show the results of and J/S depending on altitude when the interference source moves along Path 2. The avevalues at these altitudes are 67.1°, 66.6°, 66°,and 65.5°, respectively. The Jave/Save ratios are –26 dB, –25.9 dB, –25.8 dB, and –29.1 dB, respectively. Figures 8(e) and 8(f) present the and J/S ratios when the interference source moves along Path 3. ave values are 70°, 69.7°, 69.3°, and 68.9°, and Jave/Save ratios are −30.3 dB, −30.2 dB, −30.1 dB, and −30.1 dB, respectively.
and the J/S ratio according to the different altitudes of the airborne interference source. When the source moves along Path 1 at altitudes of 3 km, 6 km, 9 km, and 12 km, the ave values are 59.4°, 58.4°, 57.3°, and 56.3°, respectively, and the Jave/Save ratios are −18.7 dB, −18.4 dB, −18.2 dB, and −17.9 dB, respectively. Figures 8(c) and 8(d) show the results of and J/S depending on altitude when the interference source moves along Path 2. The avevalues at these altitudes are 67.1°, 66.6°, 66°,and 65.5°, respectively. The Jave/Save ratios are –26 dB, –25.9 dB, –25.8 dB, and –29.1 dB, respectively. Figures 8(e) and 8(f) present the and J/S ratios when the interference source moves along Path 3. ave values are 70°, 69.7°, 69.3°, and 68.9°, and Jave/Save ratios are −30.3 dB, −30.2 dB, −30.1 dB, and −30.1 dB, respectively.
Figure 9(a) is for the case of Trajectory 3 (March 21, 2023). The maximum elevation angles for Paths 1, 2, and 3 are 6.7°, 3.4°, and 2.2°, respectively, and the slant distances are 101.6 km, 201.7 km, and 301.9 km, respectively.
Figures 10(a) and 10(b) show the and J/S ratios when the airborne interference source moves along Path 1. For altitudes of 3 km, 6 km, 9 km, and 12 km of the airborne interference source, the ave values are 40.7°, 39.6°, 38.5°, and 37.5°, respectively. The Jave/Save ratios are −12.2 dB, −11.9 dB, −11.5 dB, and −11.1 dB, respectively. Figures 10(c) and 10(d) present the and J/S ratios for Path 2. The ave values are 48.4°, 47.8°, 47.3°, and 46.8°, and the Jave/Save ratios are –20.1 dB, –19.9 dB, –19.7 dB, and –19.6 dB, respectively.
and J/S ratios when the airborne interference source moves along Path 1. For altitudes of 3 km, 6 km, 9 km, and 12 km of the airborne interference source, the ave values are 40.7°, 39.6°, 38.5°, and 37.5°, respectively. The Jave/Save ratios are −12.2 dB, −11.9 dB, −11.5 dB, and −11.1 dB, respectively. Figures 10(c) and 10(d) present the and J/S ratios for Path 2. The ave values are 48.4°, 47.8°, 47.3°, and 46.8°, and the Jave/Save ratios are –20.1 dB, –19.9 dB, –19.7 dB, and –19.6 dB, respectively. Figures 10(e) and 10(f) illustrate the and J/S ratios when the interference source moves along Path 3. The ave values are 51.3°, 69.7°, 69.3°, and 68.9°, with the Jave/Save ratios of –30.3 dB, –30.2 dB, –30.1 dB, and –30.1 dB, respectively.
and J/S ratios when the interference source moves along Path 3. The ave values are 51.3°, 69.7°, 69.3°, and 68.9°, with the Jave/Save ratios of –30.3 dB, –30.2 dB, –30.1 dB, and –30.1 dB, respectively. In Table 2, ave values and Jave/Save ratios are summarized. As can be seen from these results, for satellite Trajectory 1, the highest ave value (83.6°) is observed when the interference source moves on Path 3 at an altitude of 3 km. In this case, the Jave/Save ratio is also the lowest at −33.6 dB. When the satellite moves along Trajectory 3 with Path 1 (an altitude of 12 km), the lowest ave value (37.5°) and the highest Jave/Save ratio (−11.1 dB) are observed. For Trajectory 1 (with Path 1), the ave at an altitude of 12 km is about 3° lower than that at an altitude of 3 km. On the other hand, the Jave/Save ratio at 12 km is 0.6 dB higher than at 3 km. As altitude hi increases, ave decreases and the Jave/Save ratio increases slightly. These results show that the relative angle difference between LEO satellite and interference source is critical factor for J/S ratio.
ave values and Jave/Save ratios are summarized. As can be seen from these results, for satellite Trajectory 1, the highest ave value (83.6°) is observed when the interference source moves on Path 3 at an altitude of 3 km. In this case, the Jave/Save ratio is also the lowest at −33.6 dB. When the satellite moves along Trajectory 3 with Path 1 (an altitude of 12 km), the lowest ave value (37.5°) and the highest Jave/Save ratio (−11.1 dB) are observed. For Trajectory 1 (with Path 1), the ave at an altitude of 12 km is about 3° lower than that at an altitude of 3 km. On the other hand, the Jave/Save ratio at 12 km is 0.6 dB higher than at 3 km. As altitude hi increases, ave decreases and the Jave/Save ratio increases slightly. These results show that the relative angle difference between LEO satellite and interference source is critical factor for J/S ratio. 4. Conclusions
We analyzed LEO satellite downlinks under interference situations when airborne interference sources move parallel to the LEO satellite trajectory by considering relative angle differences between satellites and interference sources. To make interference situations more like actual environments, the LEO trajectories were obtained from TLE data. Airborne interference sources with various altitudes moved parallel to the satellite trajectories, and the J/S ratio was calculated according to the relative angle differences between the ground station, satellite, and interference source. In order to calculate the relative angle difference , the satellite and interference source coordinates were converted from the WGS84 to the ENU coordinate system. By applying the relative angle difference , we obtained the sidelobe gain of the ground station antenna in the direction from which the interference comes from the ground station antenna. Through comprehensive link budget analysis, the J/S ratio was found to be 22.5 dB higher in Trajectory 3, where the relative angle difference was small compared to the other trajectories. These results showed that although the distances between ground station, LEO satellite, and interference source were important from the J/S ratio perspective, the relative angle difference between interference source and satellite is the even more critical factor.
, the satellite and interference source coordinates were converted from the WGS84 to the ENU coordinate system. By applying the relative angle difference , we obtained the sidelobe gain of the ground station antenna in the direction from which the interference comes from the ground station antenna. Through comprehensive link budget analysis, the J/S ratio was found to be 22.5 dB higher in Trajectory 3, where the relative angle difference was small compared to the other trajectories. These results showed that although the distances between ground station, LEO satellite, and interference source were important from the J/S ratio perspective, the relative angle difference between interference source and satellite is the even more critical factor. Author Contributions
Conceptualization, H.C. and E.K.; methodology, E.K., J.K. and H.C.; soft– ware, E.K.; validation, E.K., J.K. and H.C.; formal analysis, E.K. and H.C.; investigation, E.K; resources, E.K. and H.C.; data curation, E.K. and H.C.; writing—original draft preparation, E.K.; writing—review and editing, E.K., J.K., Y.P. and H.C.; visualization, E.K. and H.C.; supervision, H.C.; project administration, Y.P.; funding acquisition, H.C. All authors have read and agreed to the published version of the manuscript.
Acknowledgments
This work was supported by the Agency for Defense Development. (UI210013YD).
Conflicts of Interest
The authors declare no conflict of interest.
References
- Kim, M. J.; Lim, S.; Shin, D. C. Analysis method for determining optimal synthetic aperture time using estimated range and doppler cone angle at the center of synthetic aperture length. J. Electromagn. Eng. Sci. 2023, 23, 3, 205−211. [CrossRef]
- Kang, Y. G.; Kim, C. K.; Park, S. O; Ocean image formation algorithm using altimeter data for next generation satellite SAR. J. Electromagn. Eng. Sci. 2022, 22, 85−94.
- Lewark, U. J.; Antes, J.; Walheim, J.; Timmermann, J.; Zwick, T.; Kallfass, I. Link budget analysis for future E-band gigabit satellite communication links (71–76 and 81–84 Ghz). CEAS Space J. 2013, 4, 41−46. [CrossRef]
- Cakaj, S.; Malarić, K. Rigorous analysis on performance of LEO satellite ground station in urban environment. Int. J. Satell. Commun. Netw. 2007, 25, 619−643. [CrossRef]
- Li, S. Y.; Liu, C. H. Modeling the effects of ionospheric scintillations on LEO satellite communications. Int. J. Satell. Commun. Netw. 2004, 8, 147−149. [CrossRef]
- Kilcoyne, D. K.; Rowe, S. A.; Headley, W. C.; Mortensen, D. J.; McGwier, R. W.; Leffke, Z. J.; Reinhart, R. C. Link adaptation for mitigating earth-to-space propagation effects on the NASA scan testbed. In Proceedings of the 2016 IEEE Aerospace Conference, Montana, USA, 1−9, March 2016.
- Barbarić, D.; Vuković, J.; Babic, D. Link budget analysis for a proposed Cubesat Earth observation mission. In Proceedings of the 2018 41st International Convention on Information and Communication Technology, 133−138, May 2018.
- Reiten, K.; Schlanbusch, R.; Kristiansen, R.; Vedal, F.; Nicklasson, P. J.; Berntsen, P. C. Link and doppler analysis for space-based AIS reception. In Proceedings of the 2007 3rd International Conference on Recent Advances in Space Technologies, Istanbul, Turkey, 556−561, June 2007.
- Xu, H.; Zhang, J.; Sun, Z.; Yang, H. Event-based wireless tracking control for a wheeled mobile robot against reactive jamming Attacks. IEEE Trans. Control Netw. Syst. 2023, Early Access. [CrossRef]
- Lineswala, P. L.; Shah, S. N.; Shah, R. Different categorization for jammer: The enemy of satellite navigation. In Proceedings of the 2017 2nd International Conference for Convergence in Technology (I2CT). Mumbai, India, 282−287, April 2017.
- Sathaye, H.; Noubir, G.; Ranganathan, A. On the implications of spoofing and jamming aviation datalink applications. In Proceedings of the 38th Annual Computer Security Applications Conference. Texas, USA, 548−560, December 2022.
- Senapati, M.; Anand, B., Barsaiyan, V.; Rajalakshmi, P. Geo-referencing system for locating objects globally in LiDAR point cloud. In Proceedings of the 2020 IEEE 6th World Forum on Internet of Things (WF-IoT). LA, USA, 1−5, June 2020.
- Wang, Y.; Huynh, G.; Williamson, C. Integration of Google Maps/Earth with microscale meteorology models and data visualization. Comput. Geosci. 2013, 61, 23−31. [CrossRef]
- Merabtine, N.; Boualleg, A.; Benslama, M. Analysis of radiation patterns and feed illumination of the reflector antenna using the physical and geometrical optics. Semicond. Phys. Quant. 2006, 9, 53−57.
Figure 2.
Schematic diagram of converting the coordinate systems for the ground station, LEO satellite, and interference source: (a) Conversion from WGS84 to the ECEF; (b) Transformation from ECEF to ENU.
Figure 2.
Schematic diagram of converting the coordinate systems for the ground station, LEO satellite, and interference source: (a) Conversion from WGS84 to the ECEF; (b) Transformation from ECEF to ENU.
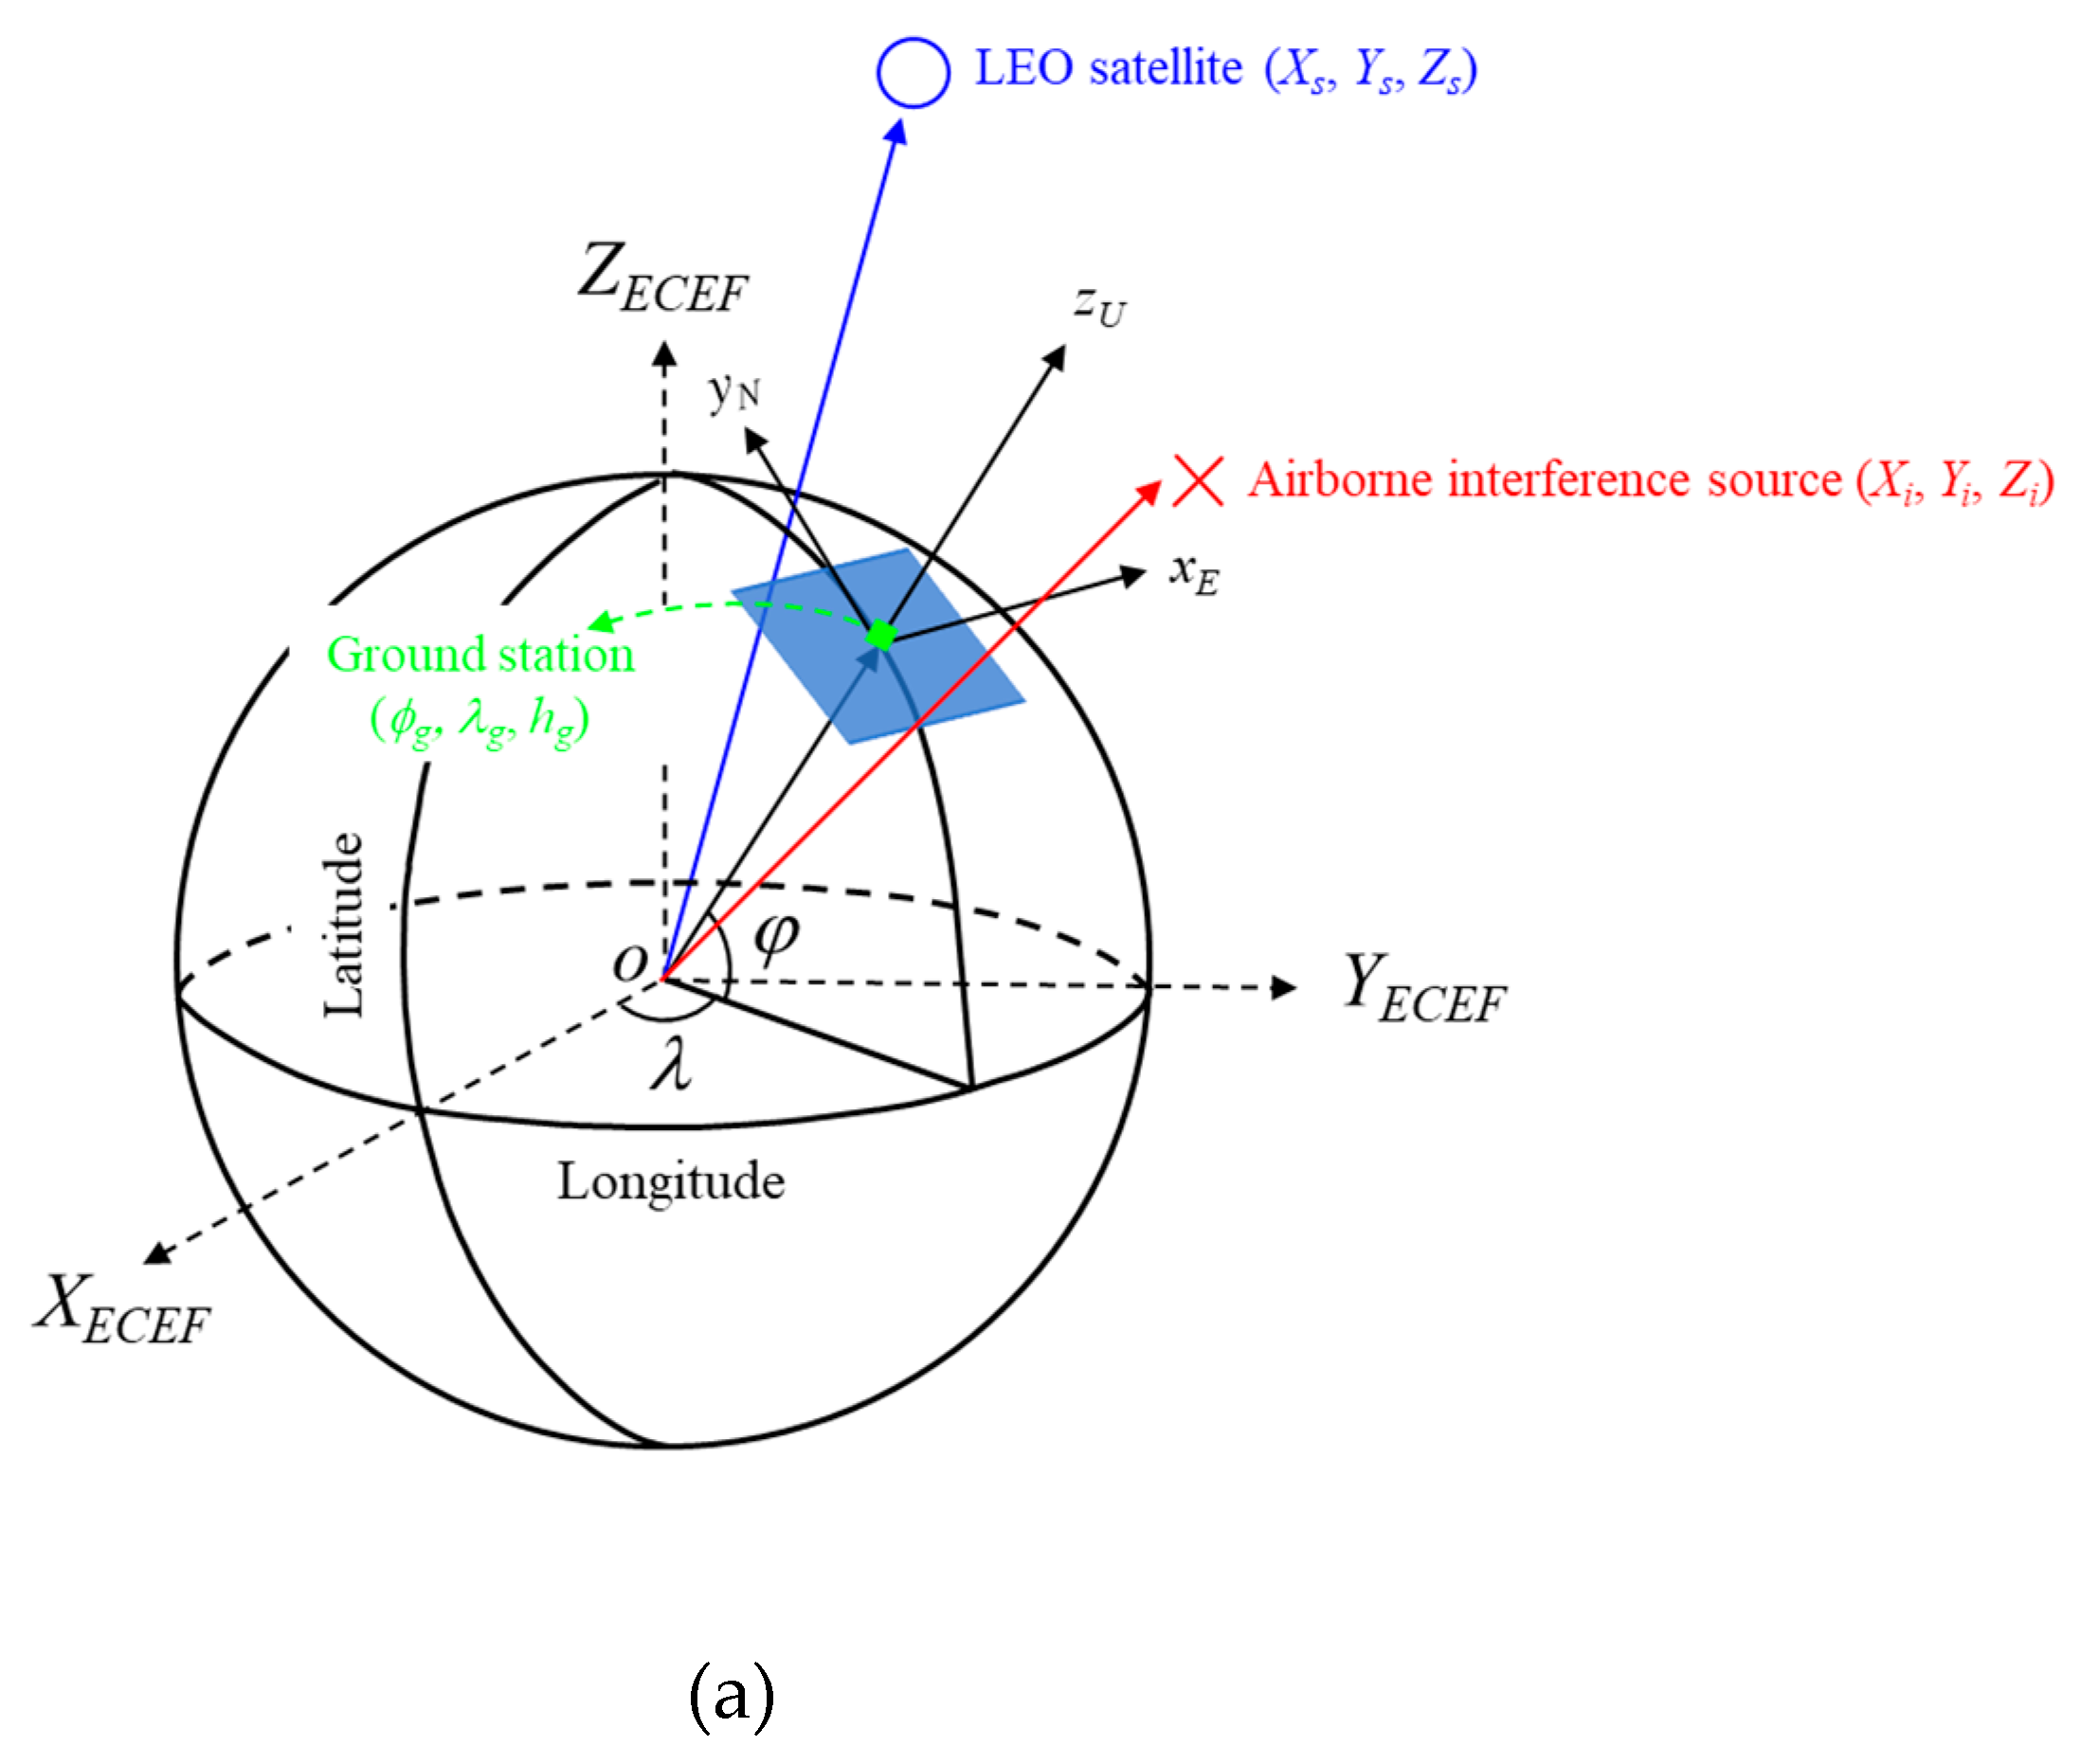
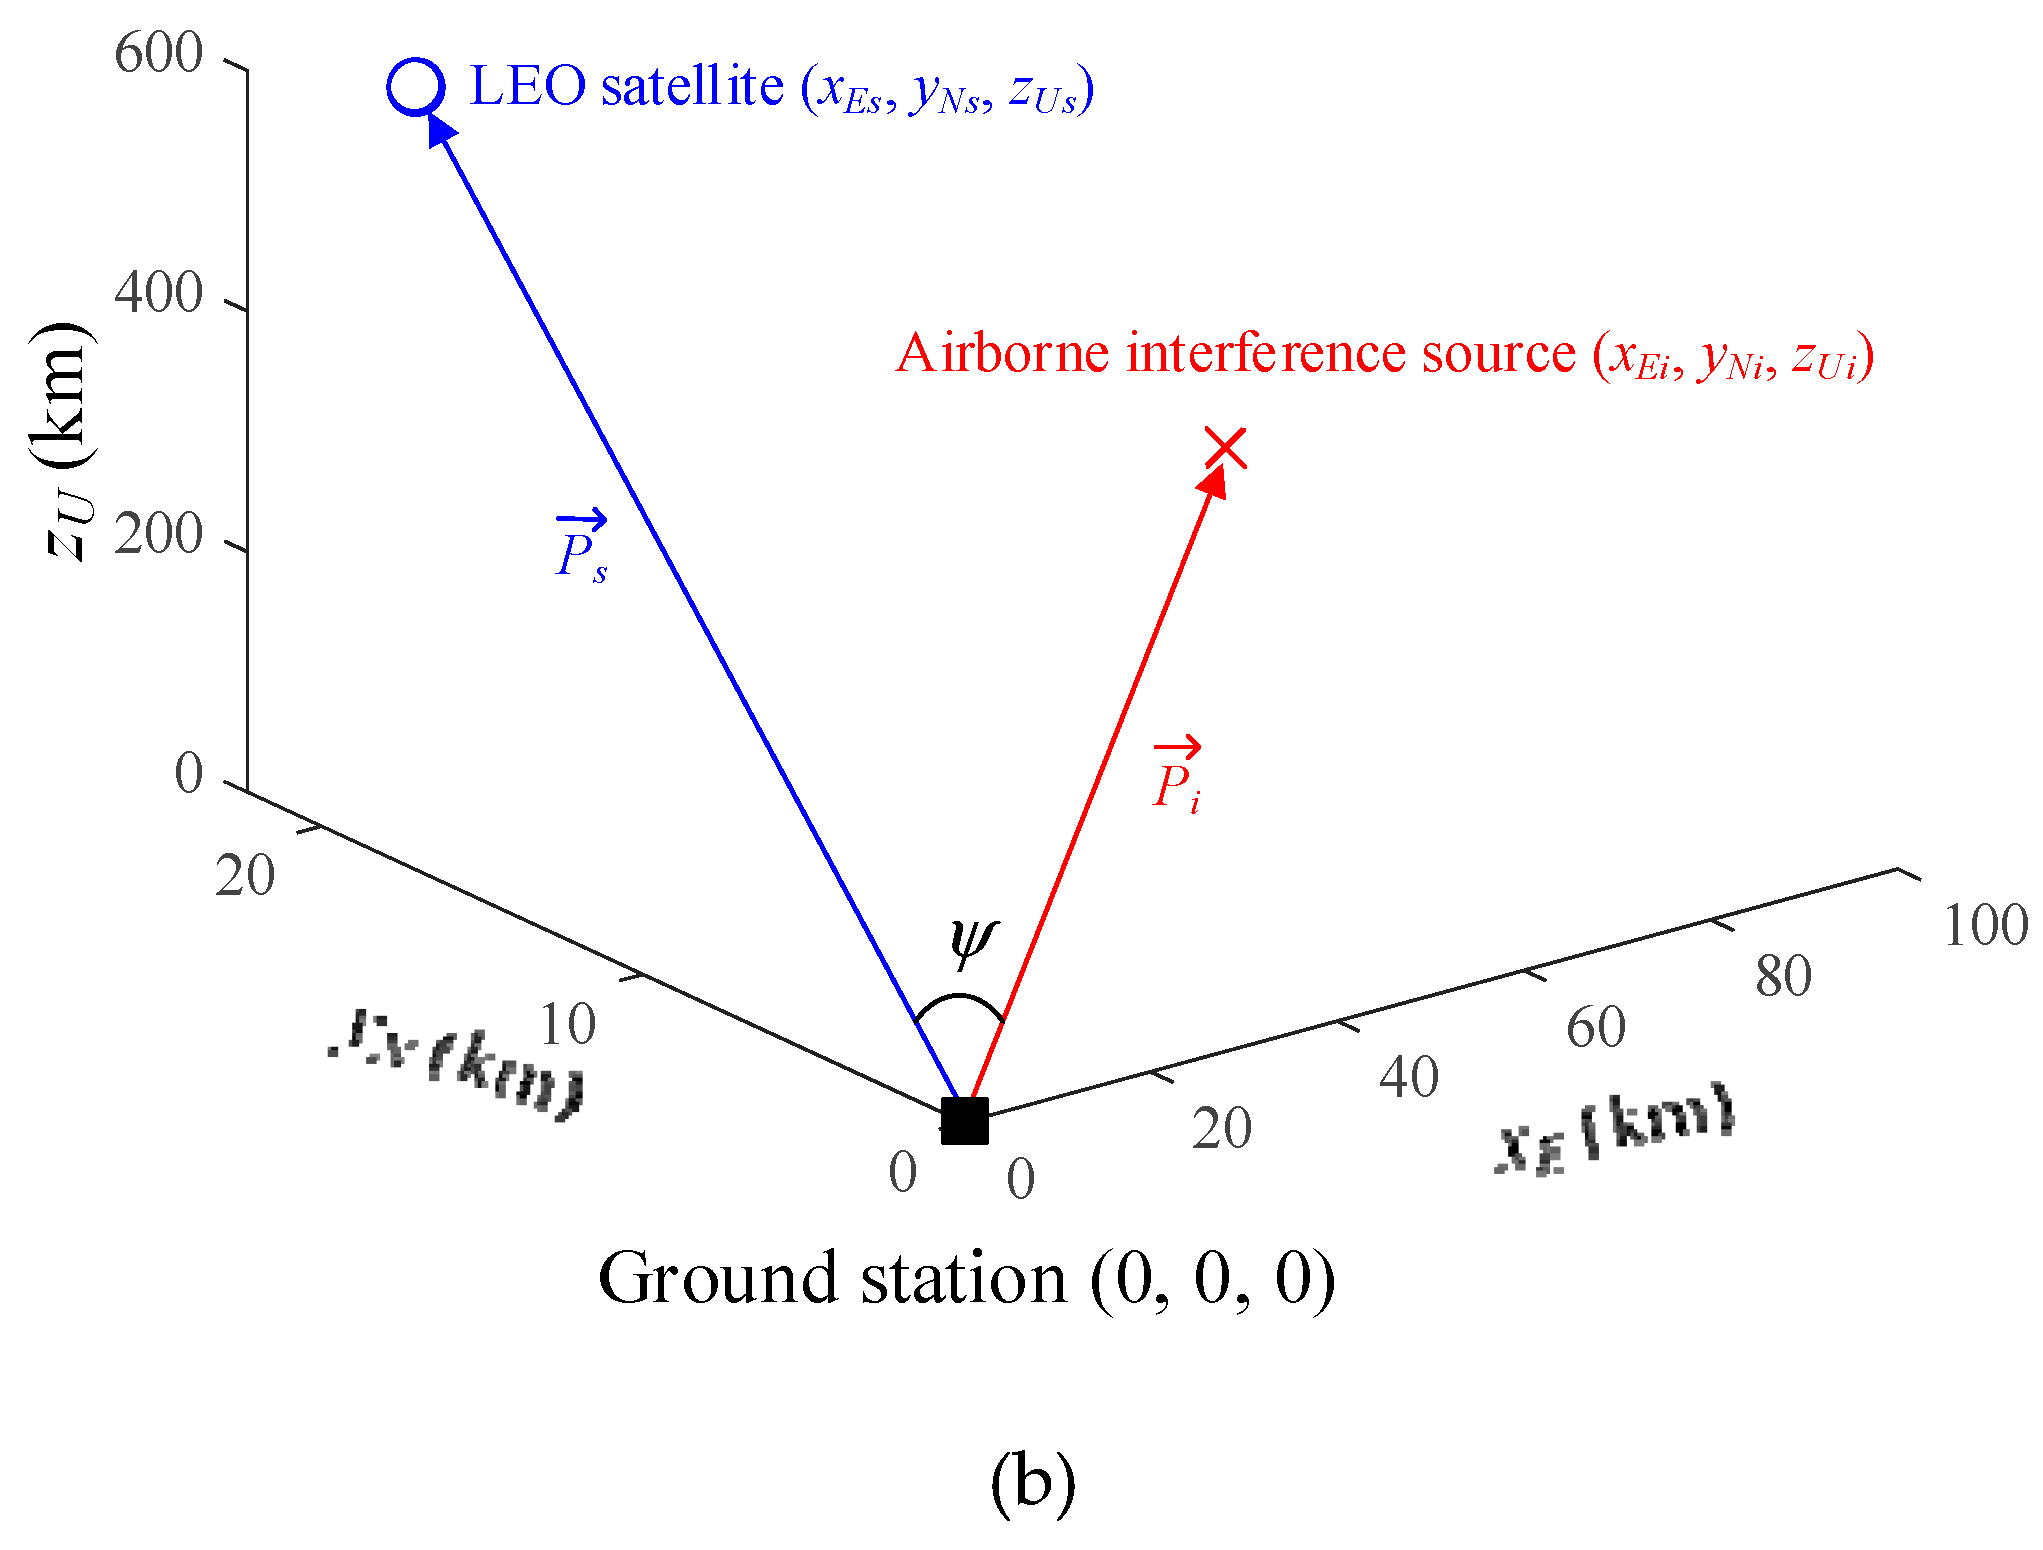
Figure 3.
Radiation pattern of the ground station antenna with regression model.
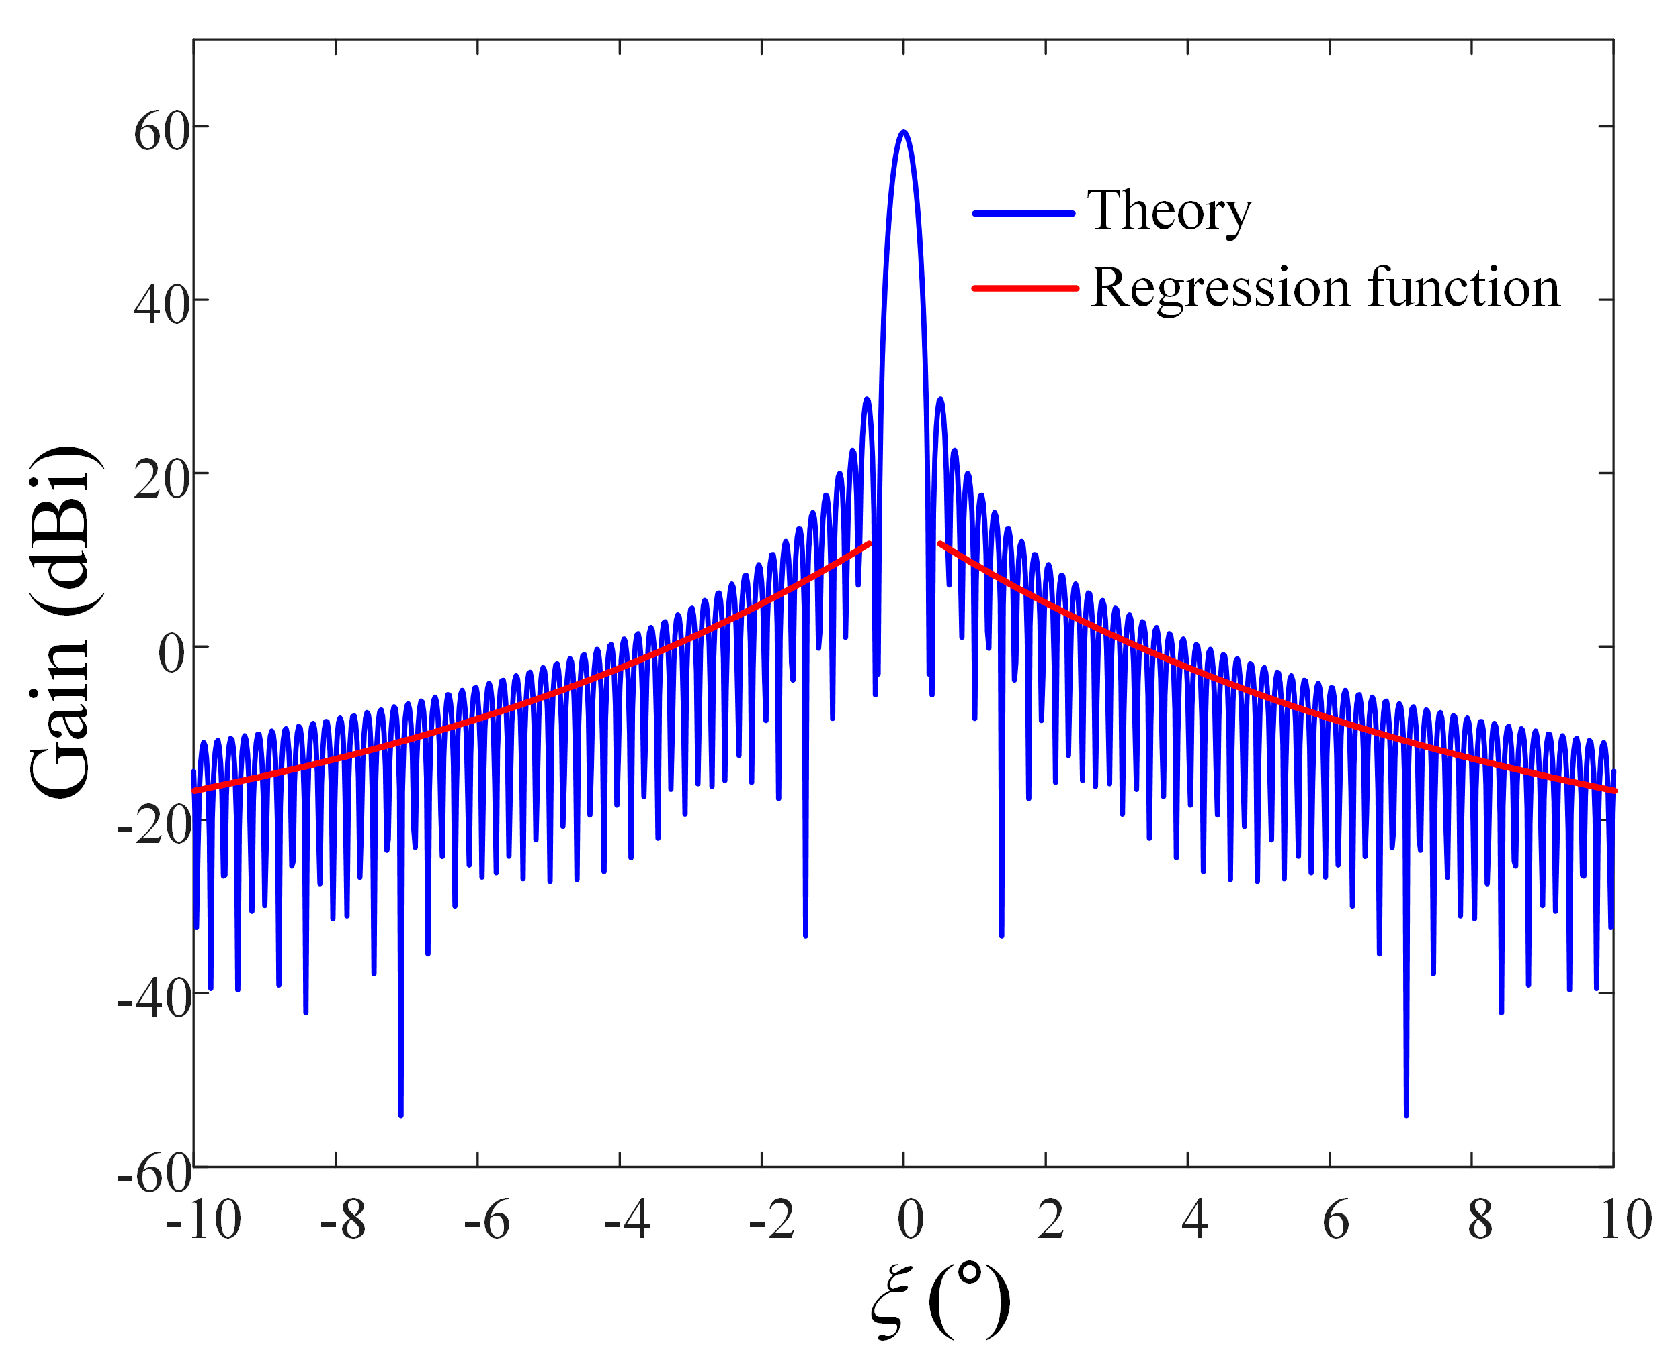
Figure 4.
Location information for LEO satellite trajectories during data communication time: (a) trajectories on a WGS84 map; (b) elevation angle s and slant distance ds for each trajectory using the ENU coordinate system.
s and slant distance ds for each trajectory using the ENU coordinate system.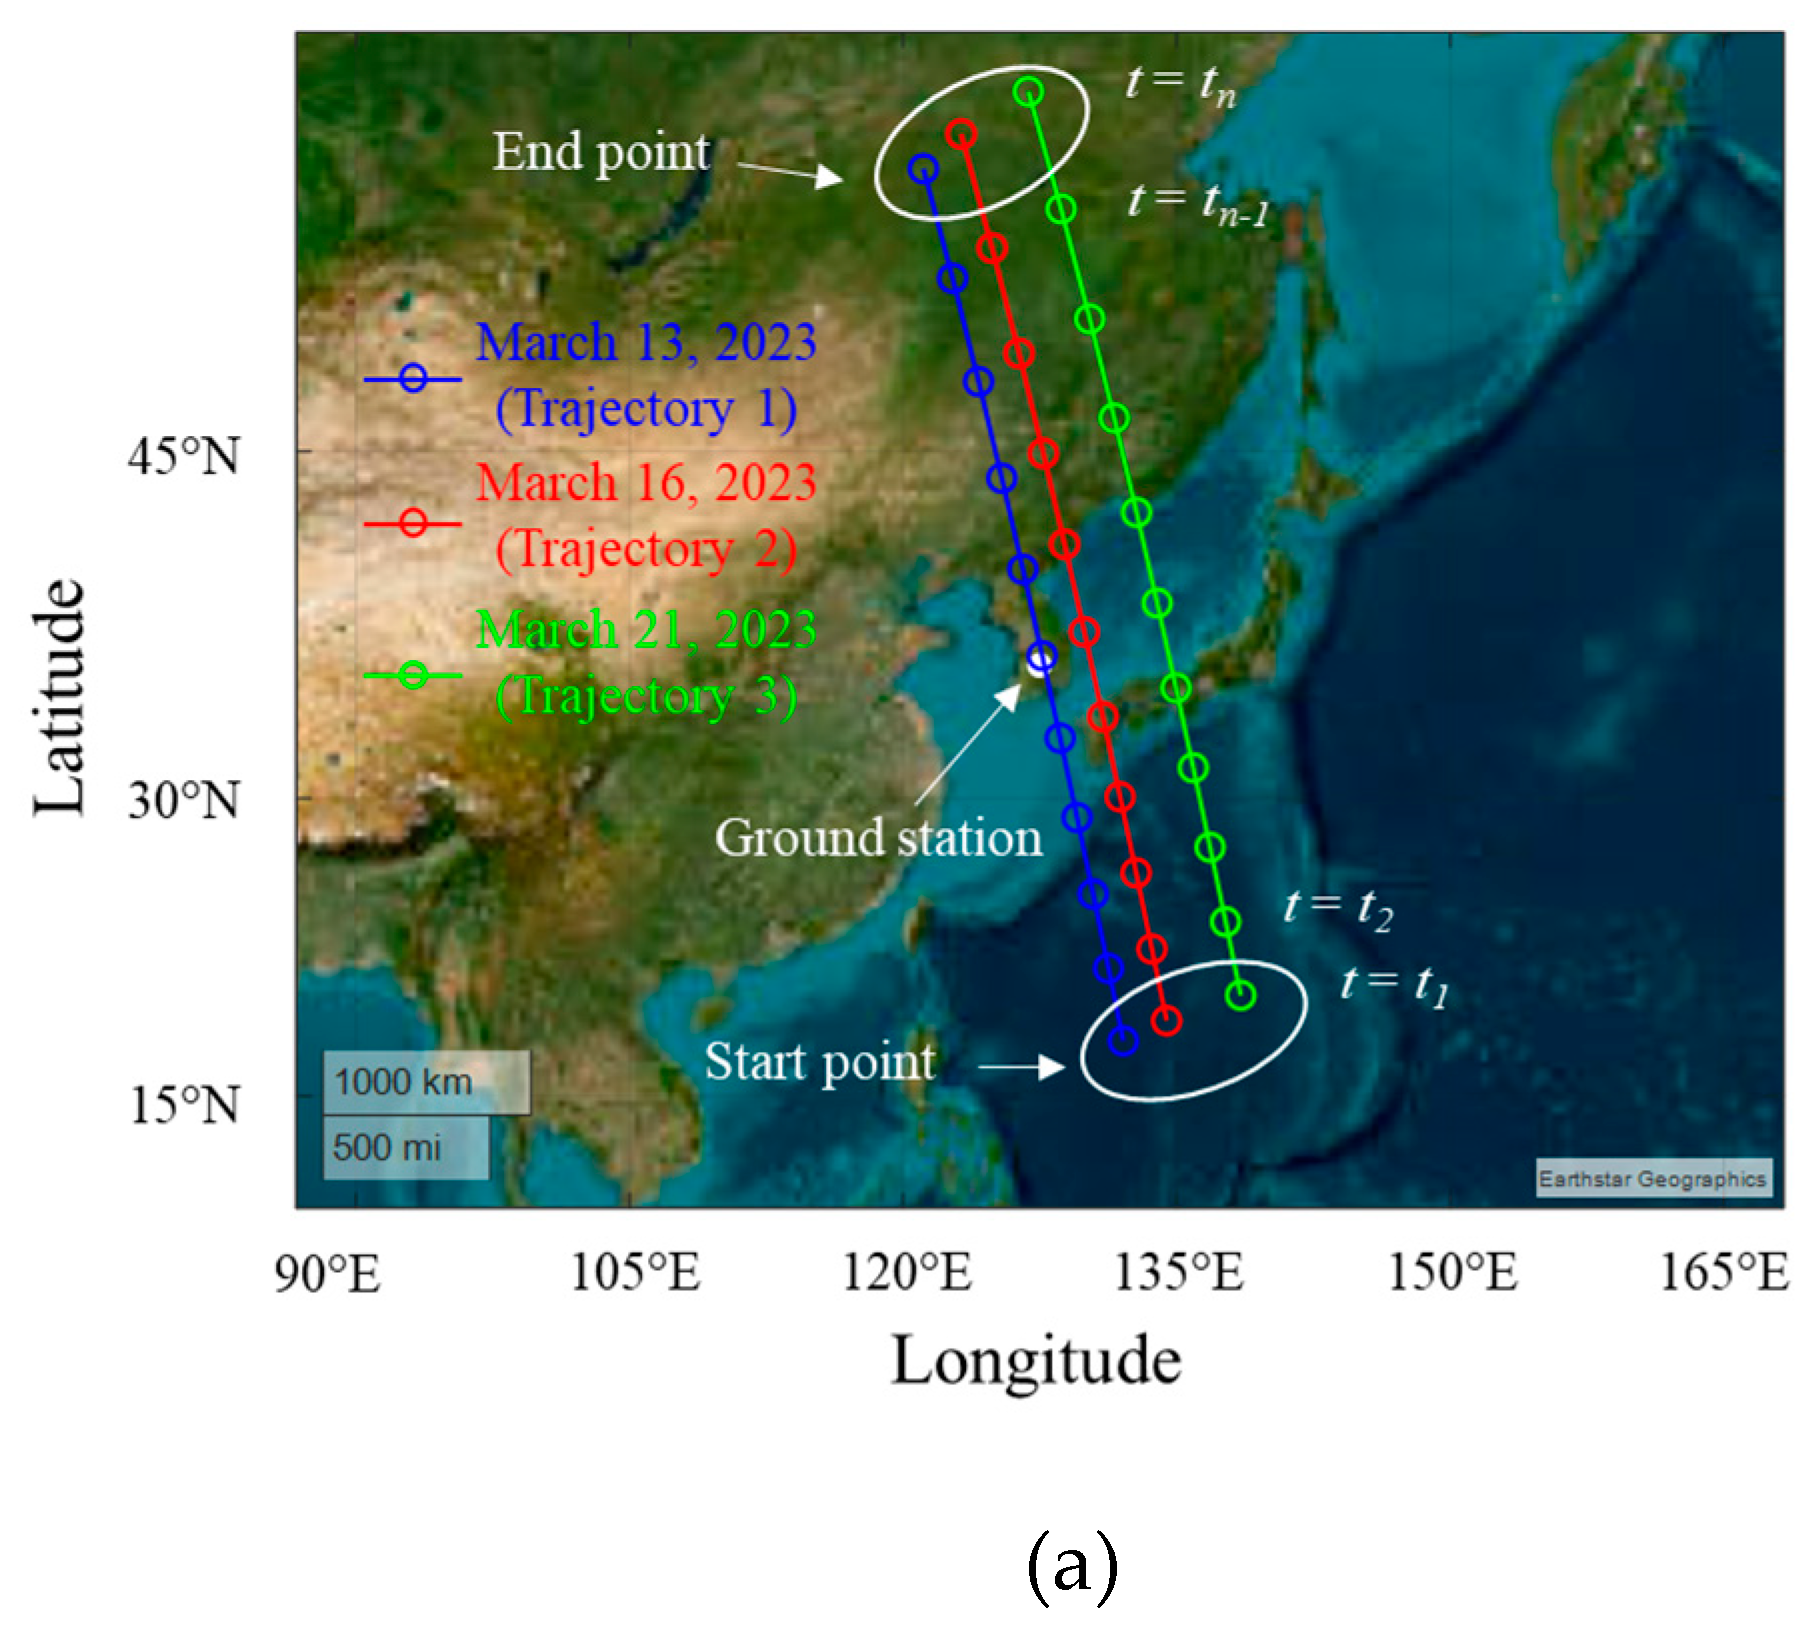
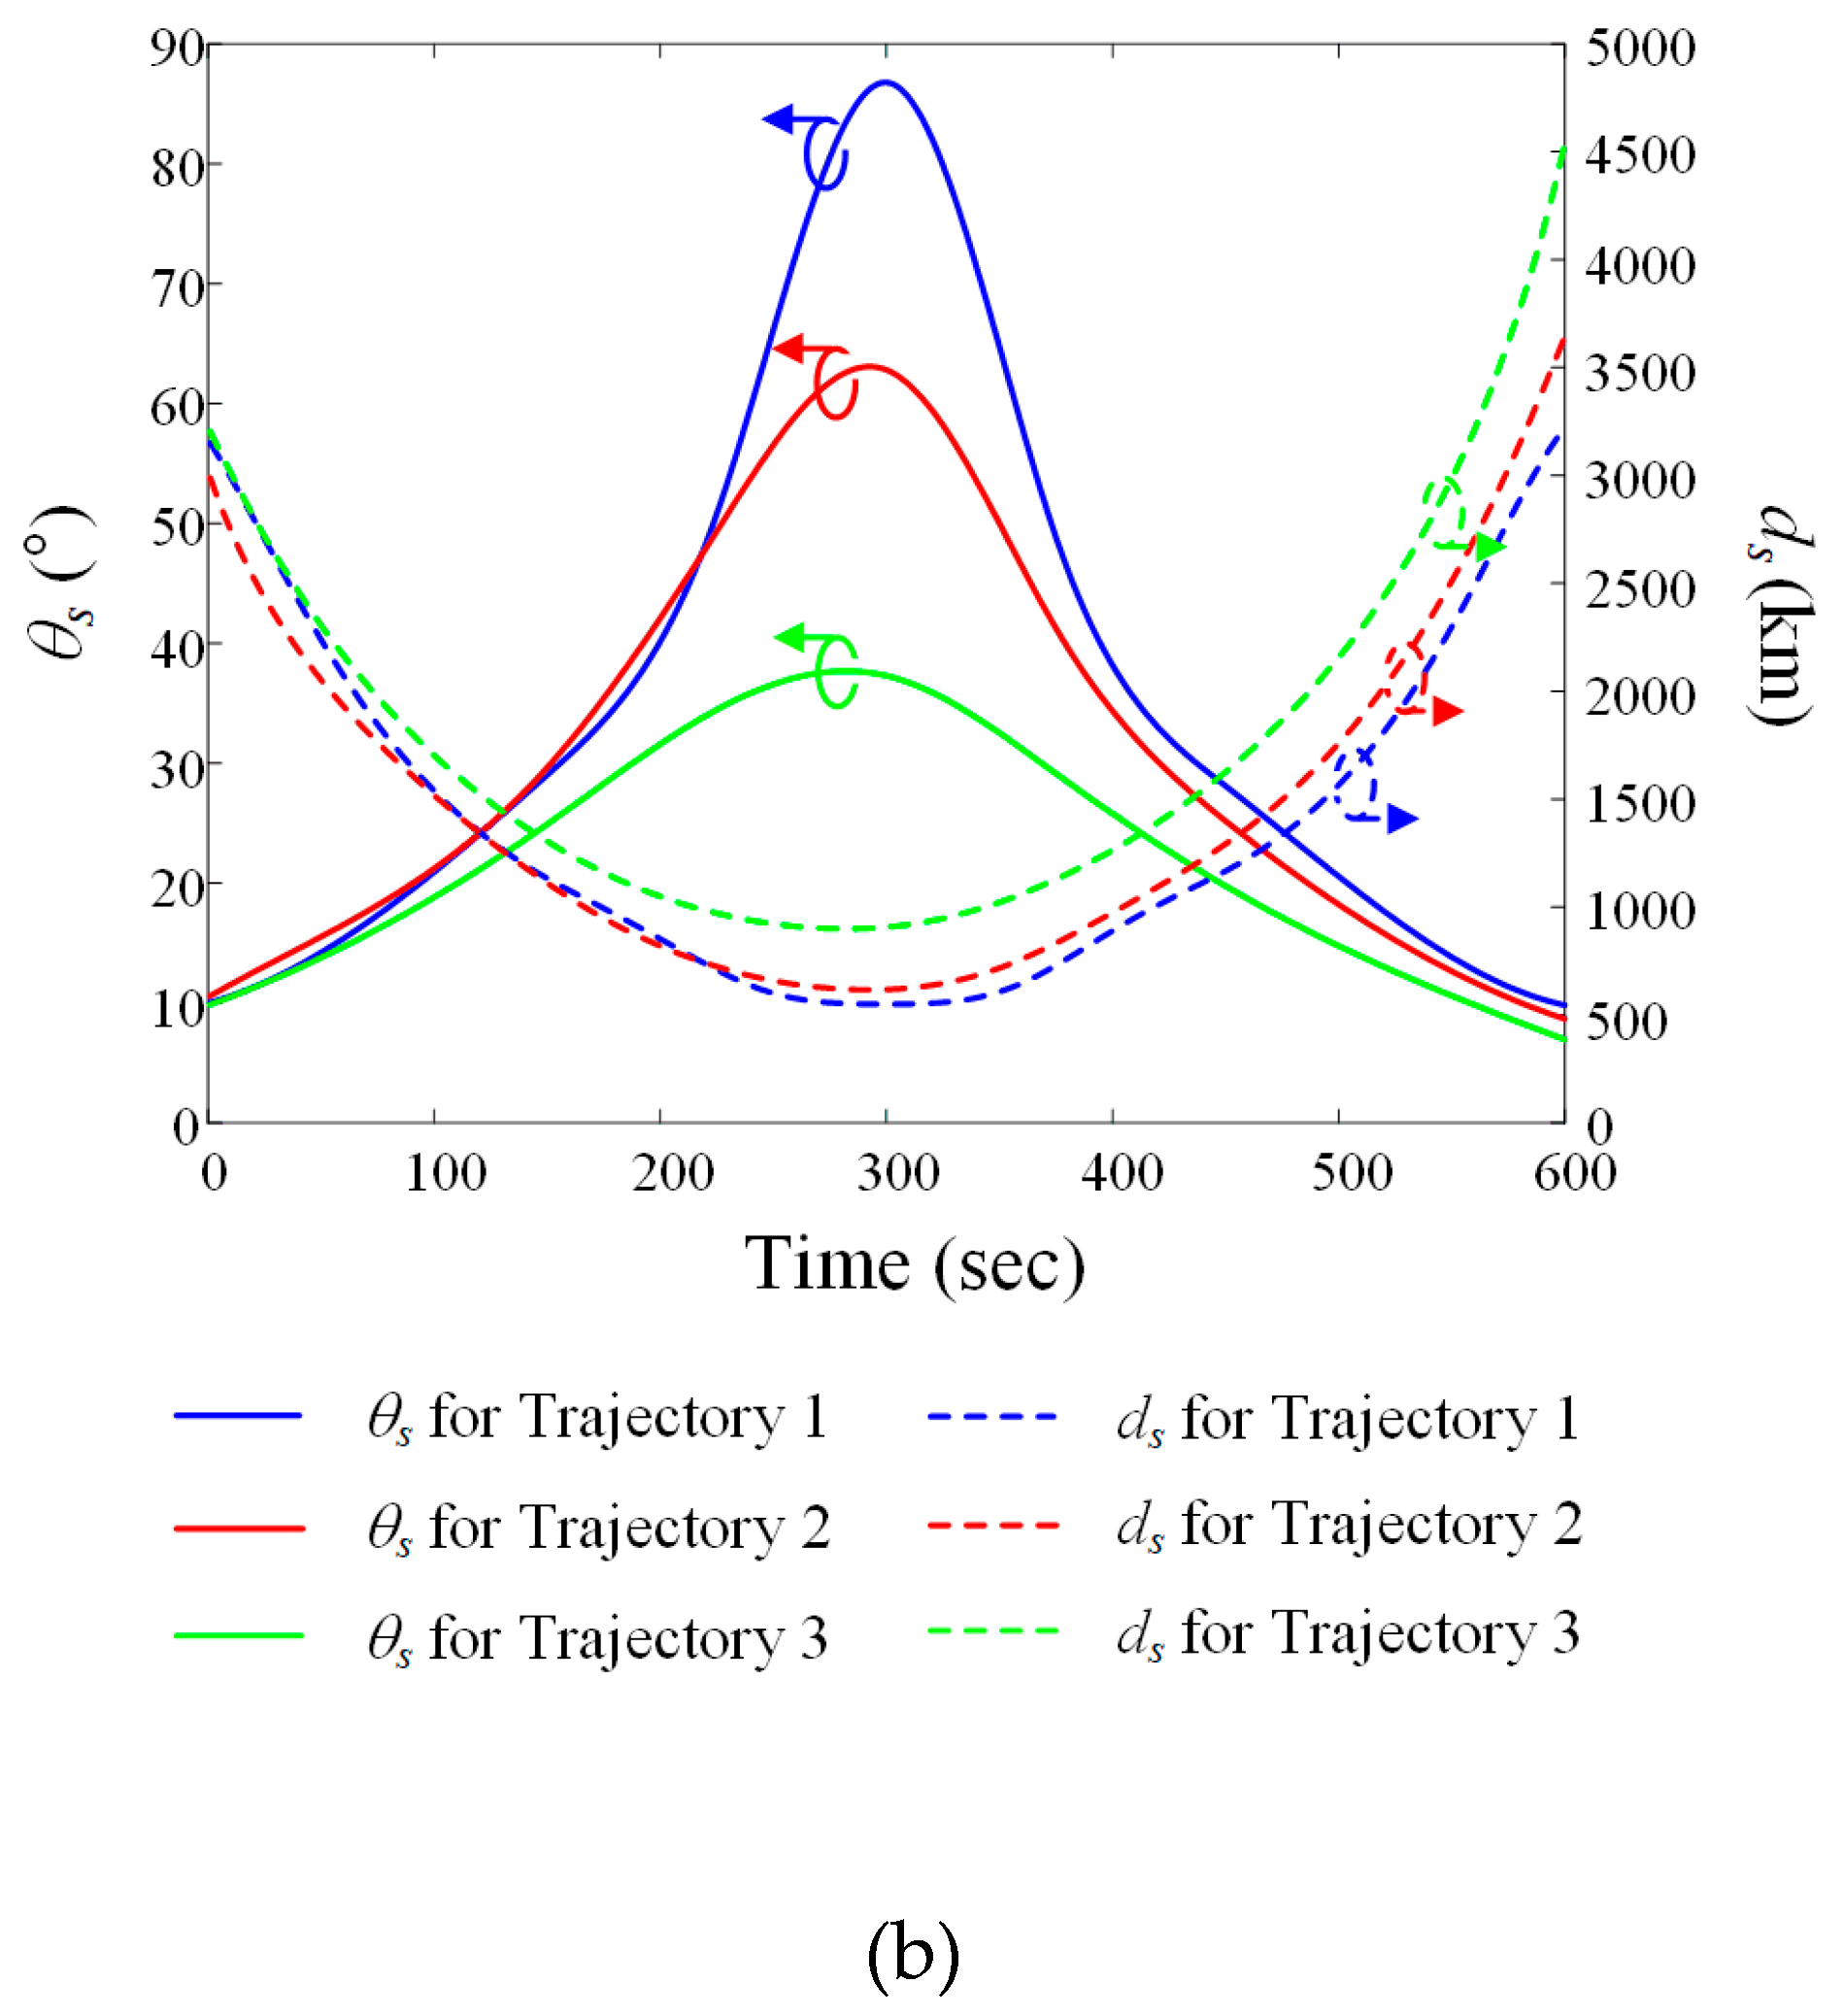
Figure 5.
Airborne interference source paths during data communication time when the LEO satellite moves along Trajectory 1: (a) paths on a WGS84 map; (b) elevation angle i and slant distance di for each path.
i and slant distance di for each path.
Figure 5.
Airborne interference source paths during data communication time when the LEO satellite moves along Trajectory 1: (a) paths on a WGS84 map; (b) elevation angle i and slant distance di for each path.
i and slant distance di for each path.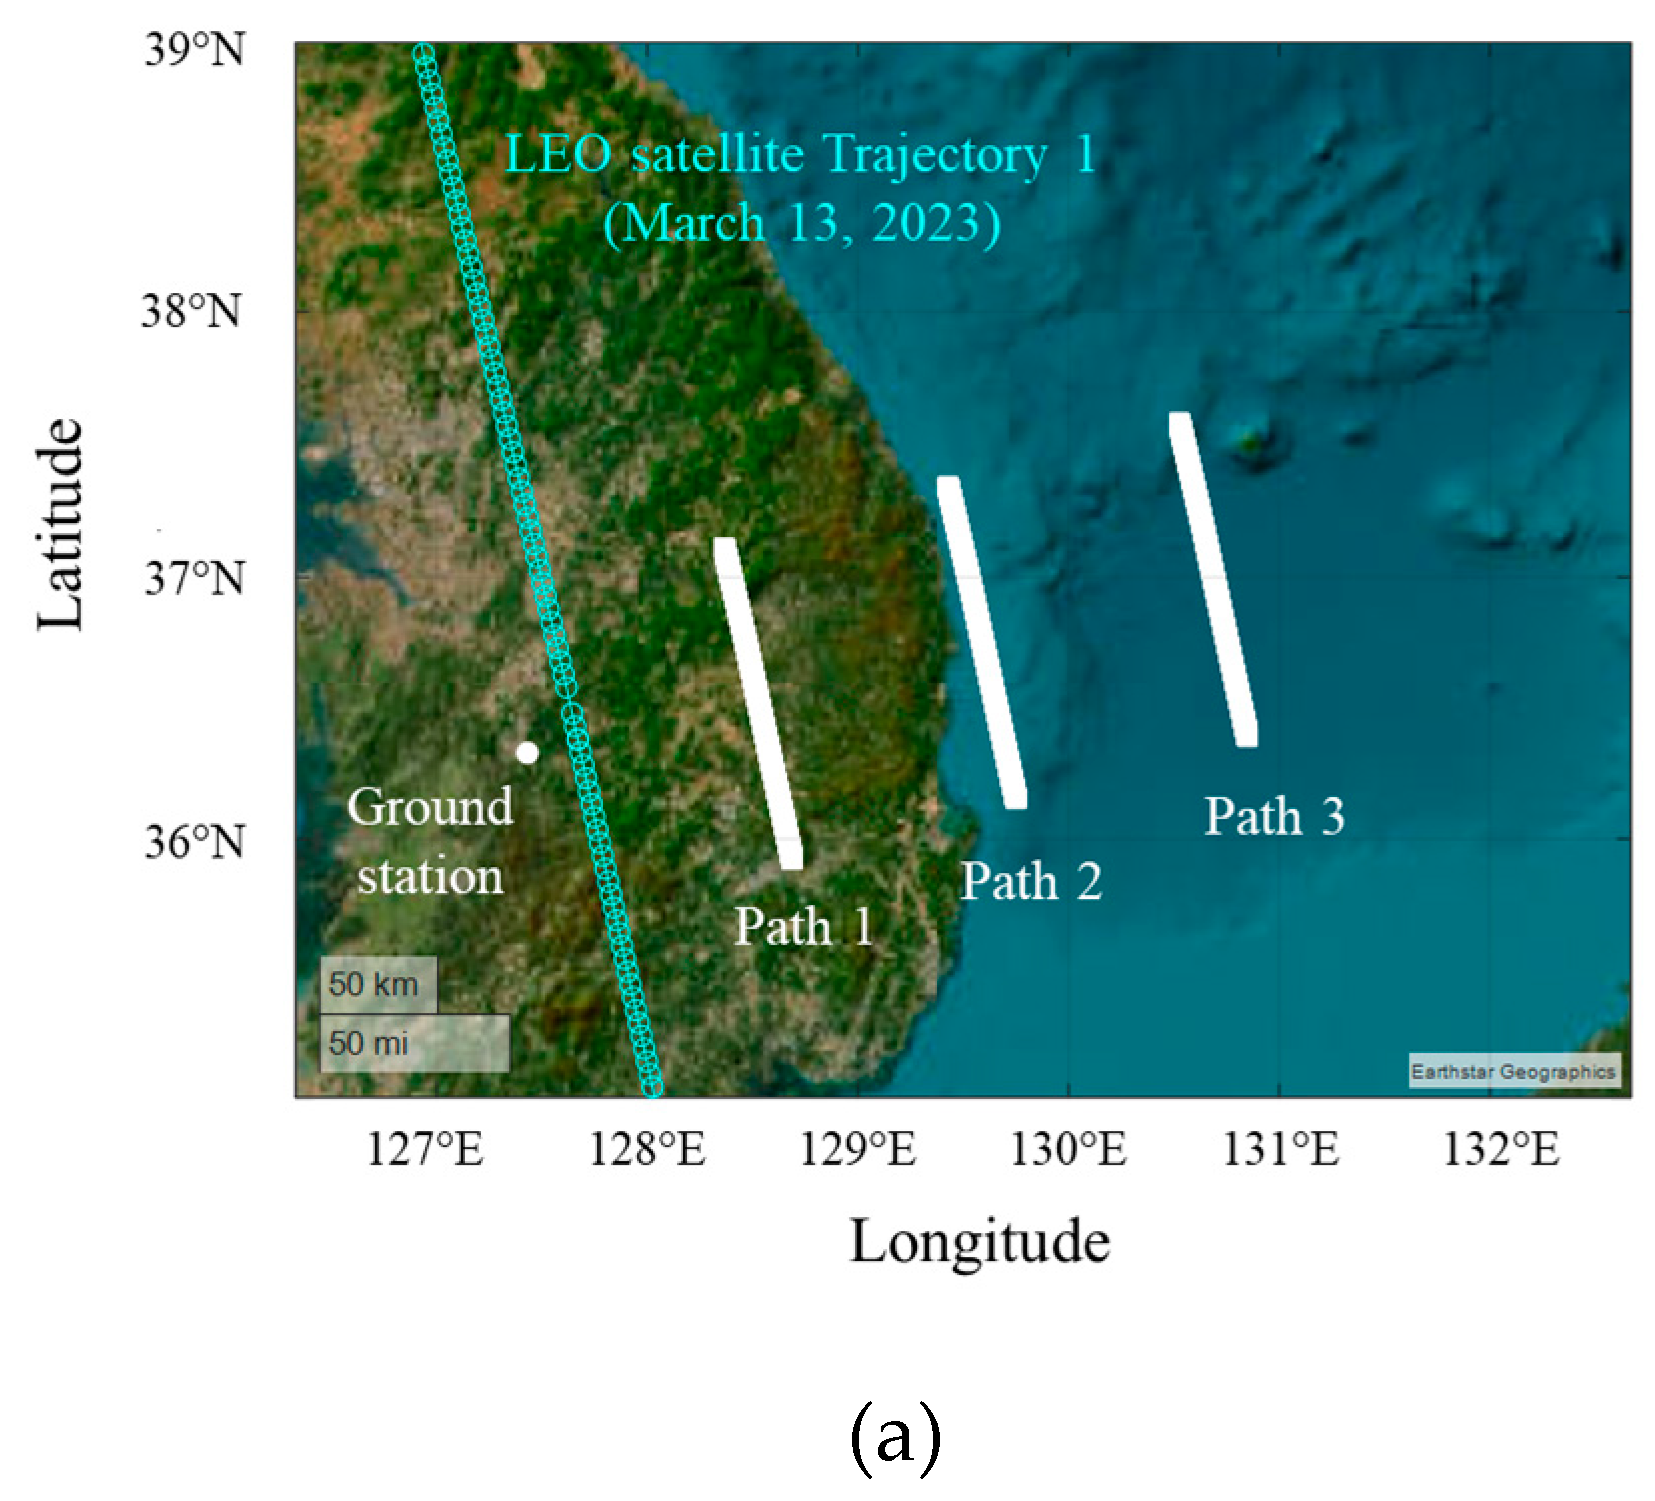
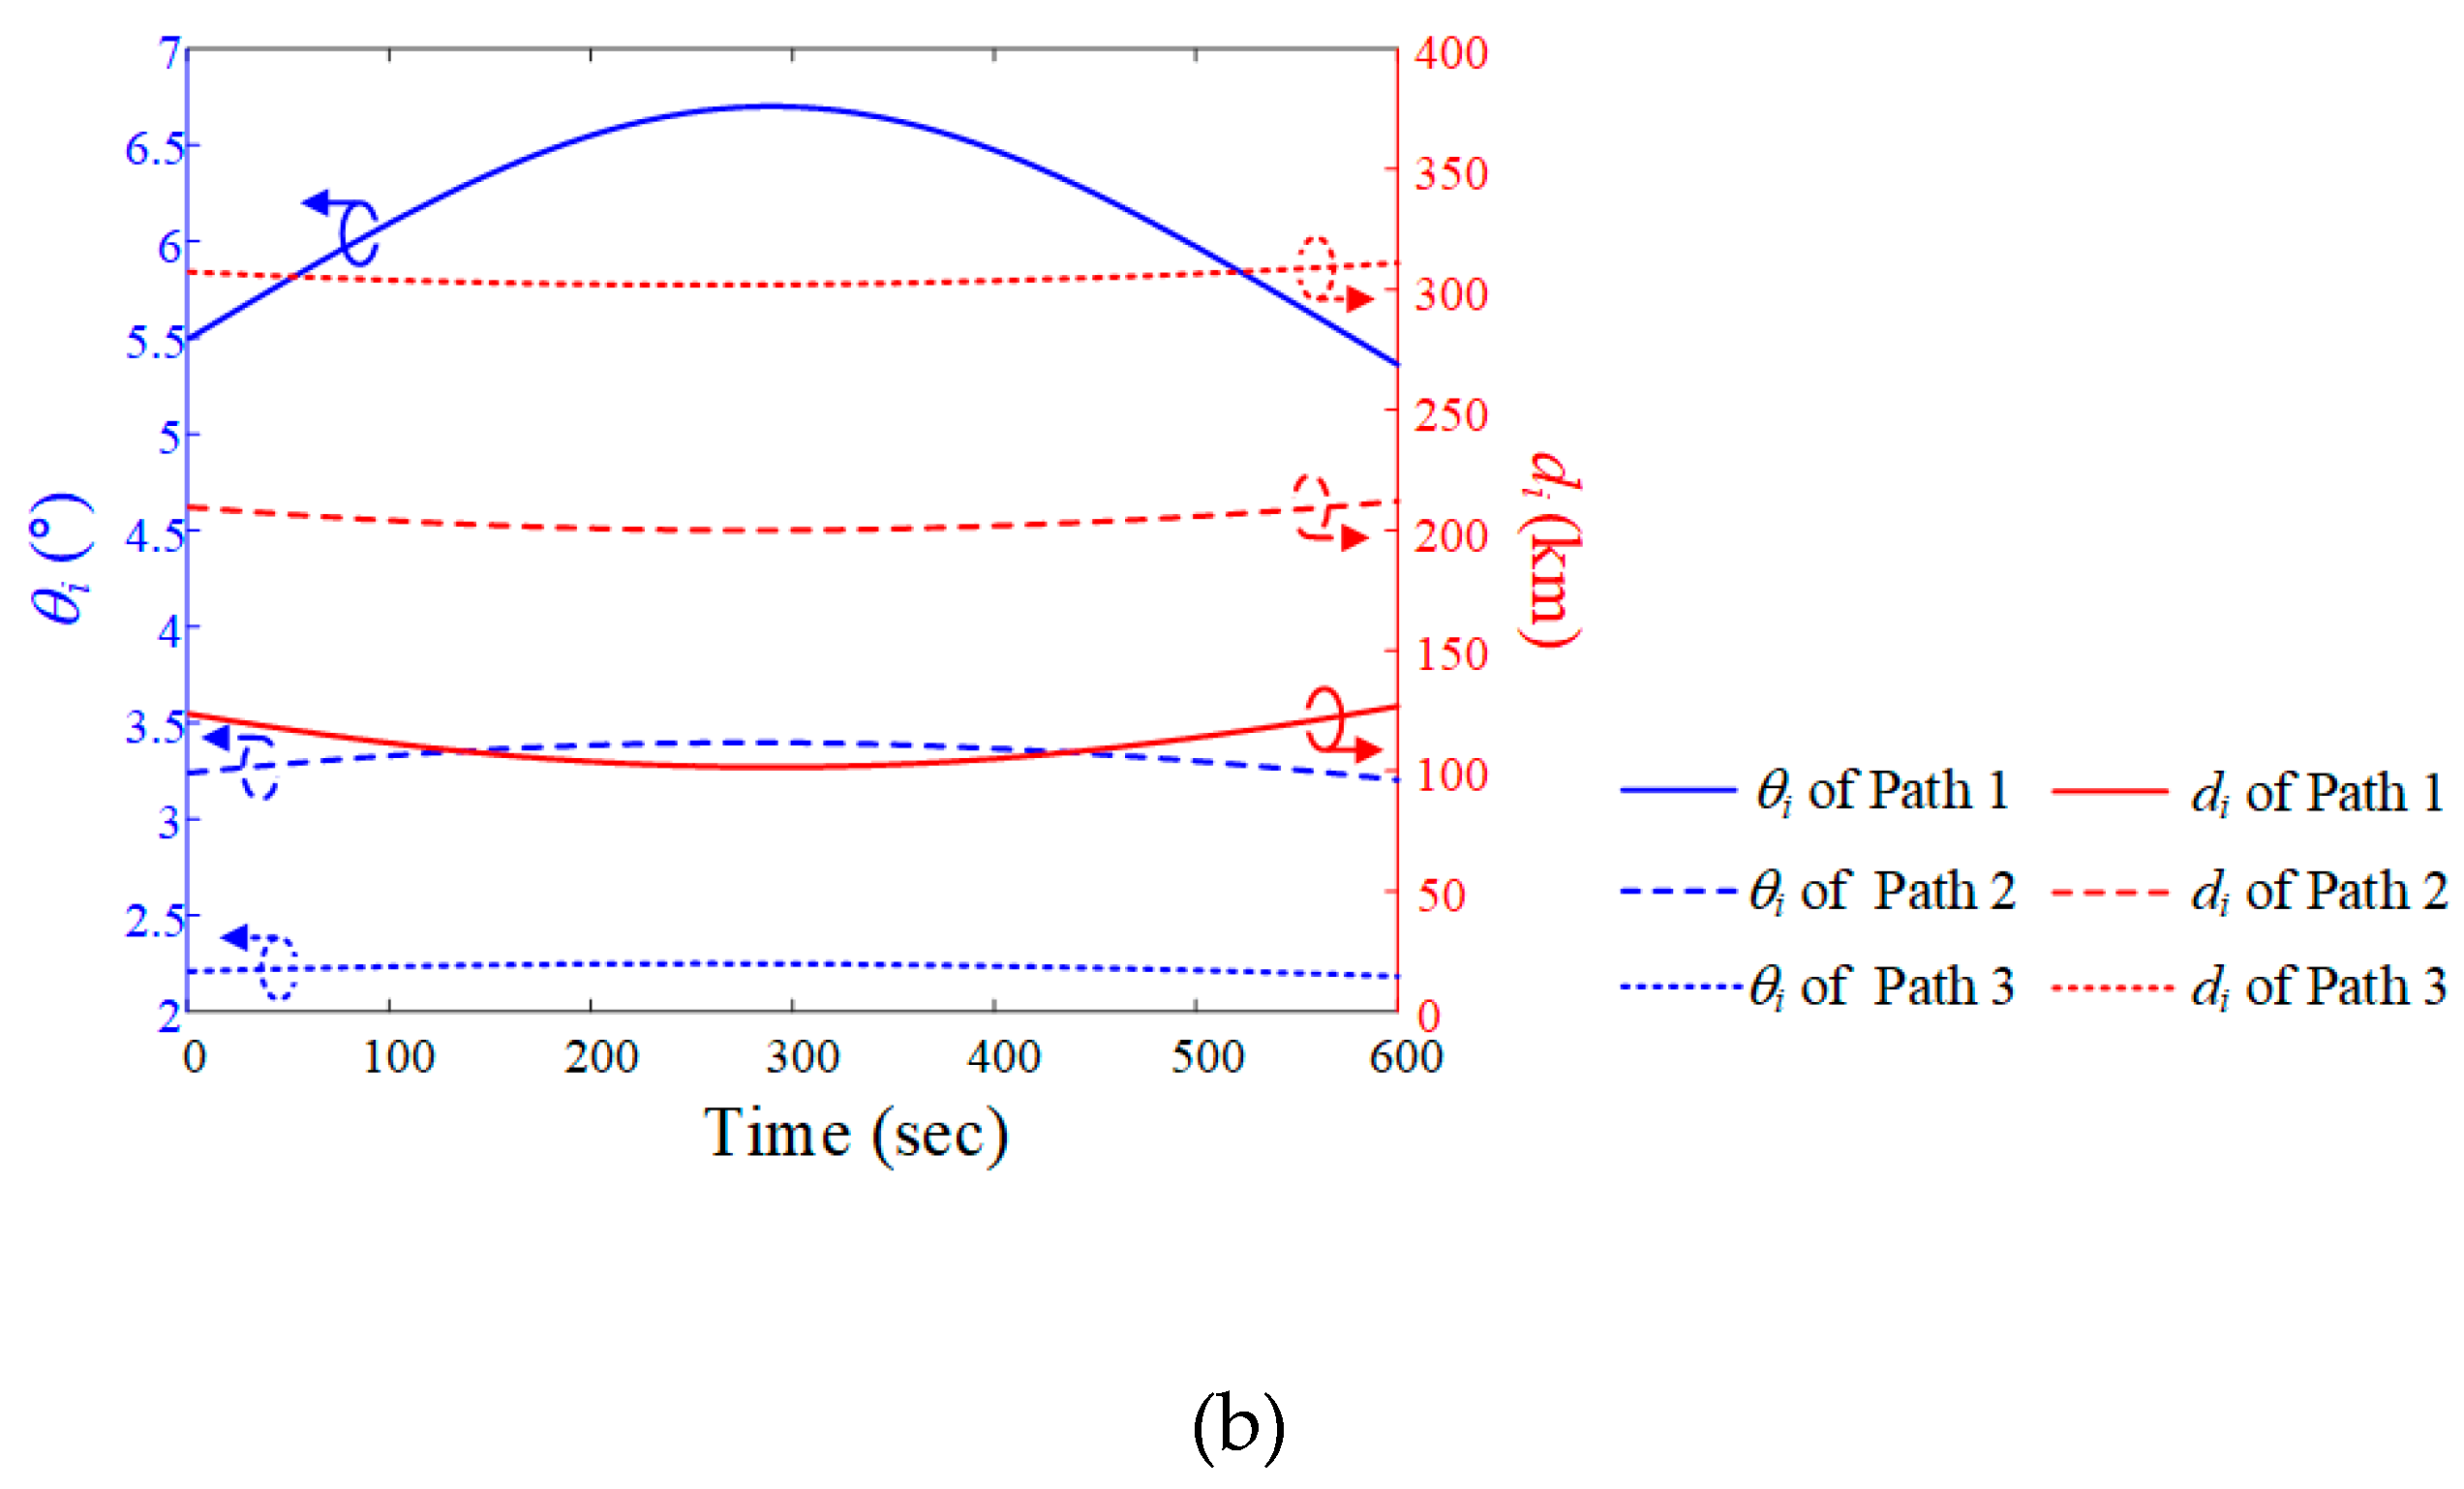
Figure 6.
Relative angle differences and J/S ratios of the airborne interference source at different altitudes when the LEO satellite moves along Trajectory 1: (a) for Path 1; (b) J/S ratio for Path 1; (c) for Path 2; (d) J/S ratio for Path 2; (e) for Path 3; (f) J/S ratio for Path 3.
and J/S ratios of the airborne interference source at different altitudes when the LEO satellite moves along Trajectory 1: (a) for Path 1; (b) J/S ratio for Path 1; (c) for Path 2; (d) J/S ratio for Path 2; (e) for Path 3; (f) J/S ratio for Path 3.
Figure 7.
Airborne interference source paths during data communication time when the LEO satellite moves along Trajectory 2: (a) paths on a WGS84 map; (b) elevation angle i and slant distance di for each path.
i and slant distance di for each path.
Figure 7.
Airborne interference source paths during data communication time when the LEO satellite moves along Trajectory 2: (a) paths on a WGS84 map; (b) elevation angle i and slant distance di for each path.
i and slant distance di for each path.
Figure 8.
Relative angle differences and J/S ratios of the airborne interference source at different altitudes when the LEO satellite moves along Trajectory 2: (a) for Path 1; (b) J/S ratio for Path 1; (c) for Path 2; (d) J/S ratio for Path 2; (e) for Path 3; (f) J/S ratio for Path 3.
and J/S ratios of the airborne interference source at different altitudes when the LEO satellite moves along Trajectory 2: (a) for Path 1; (b) J/S ratio for Path 1; (c) for Path 2; (d) J/S ratio for Path 2; (e) for Path 3; (f) J/S ratio for Path 3.
Figure 9.
Airborne interference source paths during data communication time when the LEO satellite moves along Trajectory 3: (a) paths on a WGS84 map; (b) elevation angle i and slant distance di for each path.
i and slant distance di for each path.
Figure 9.
Airborne interference source paths during data communication time when the LEO satellite moves along Trajectory 3: (a) paths on a WGS84 map; (b) elevation angle i and slant distance di for each path.
i and slant distance di for each path.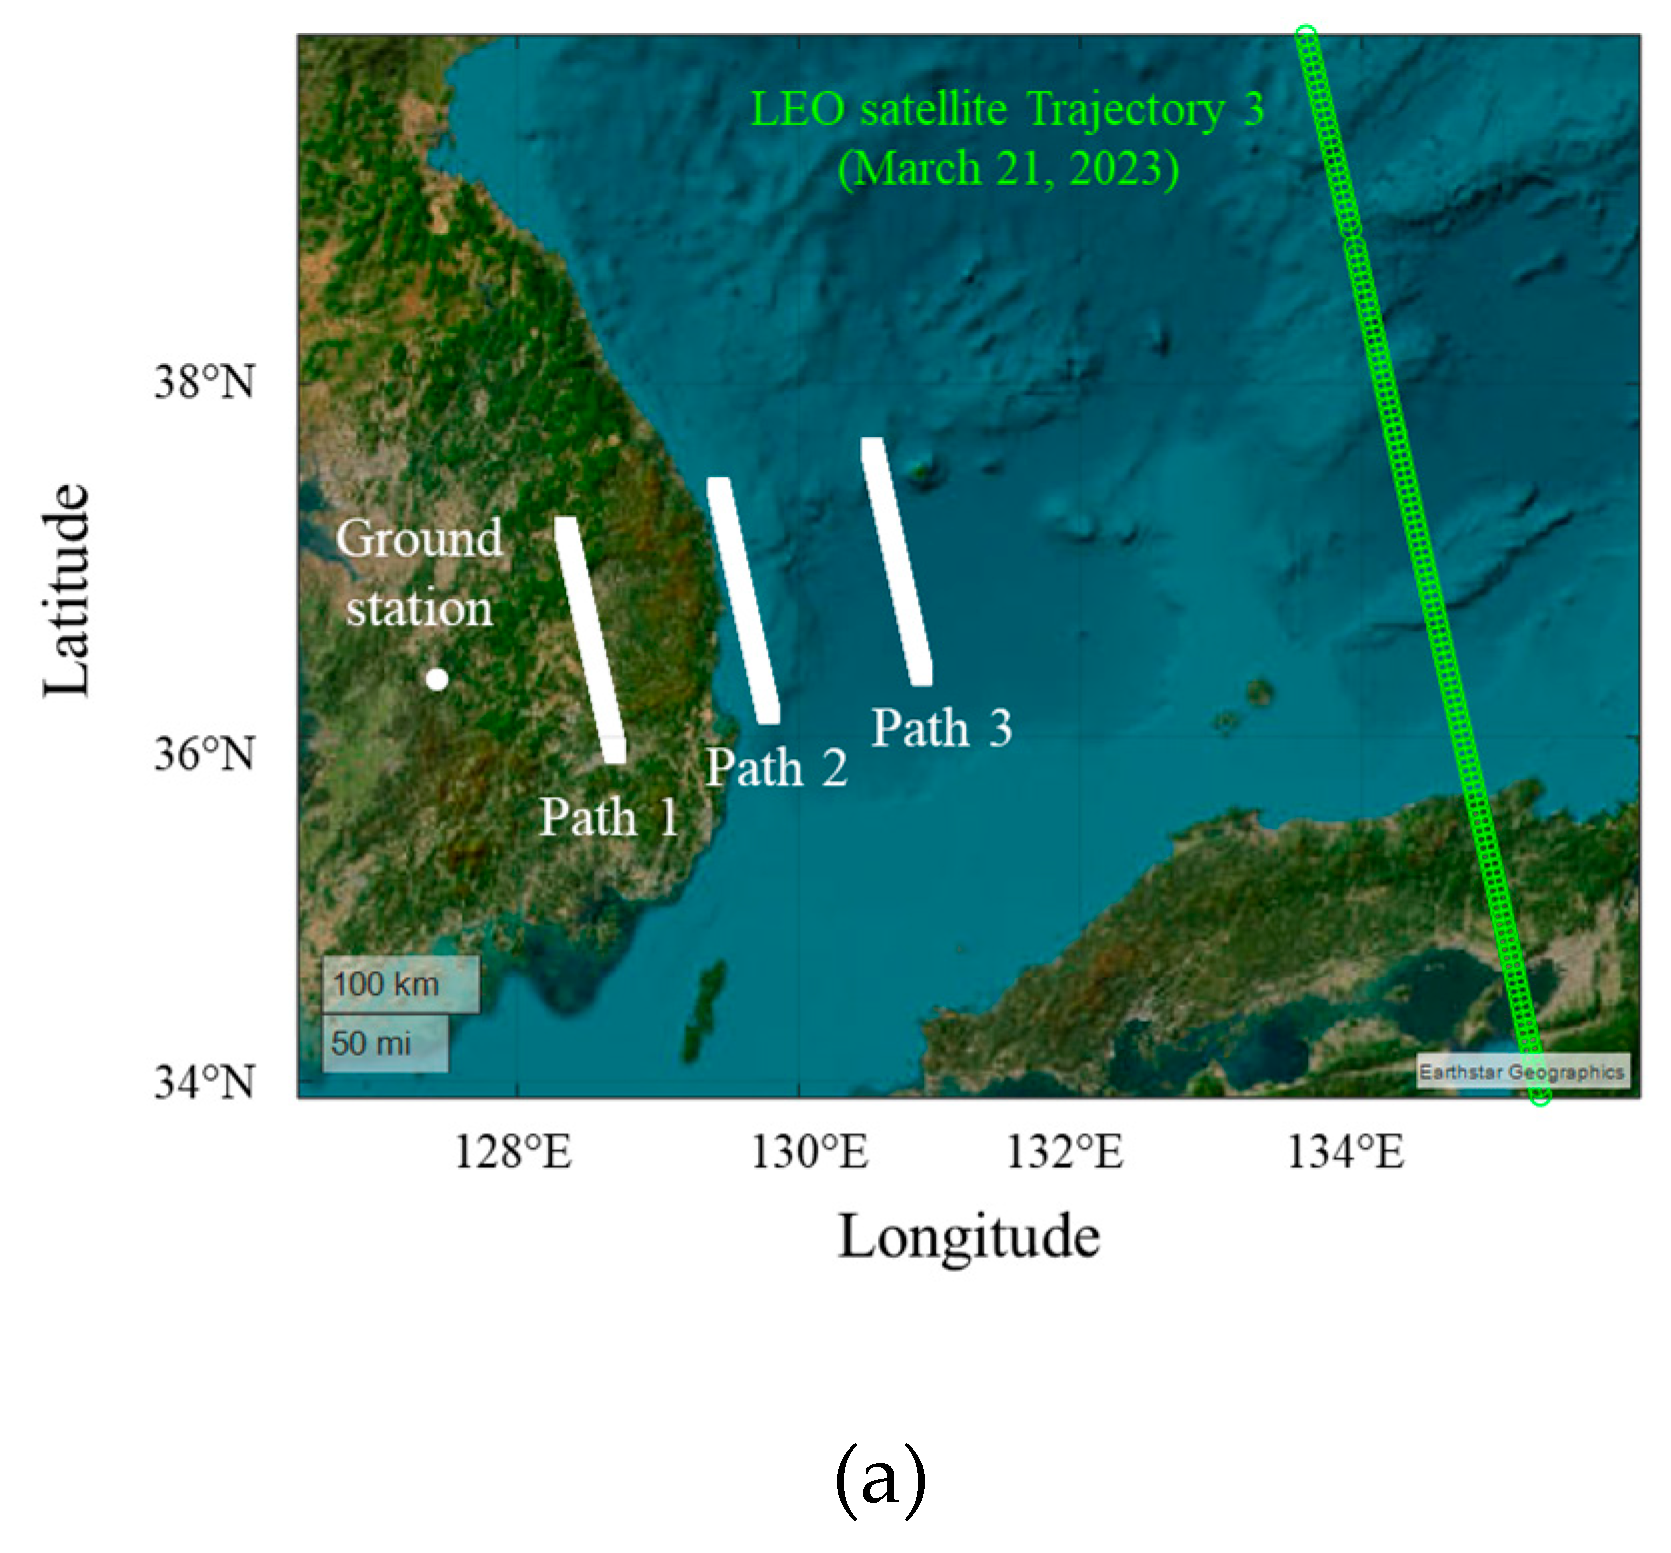
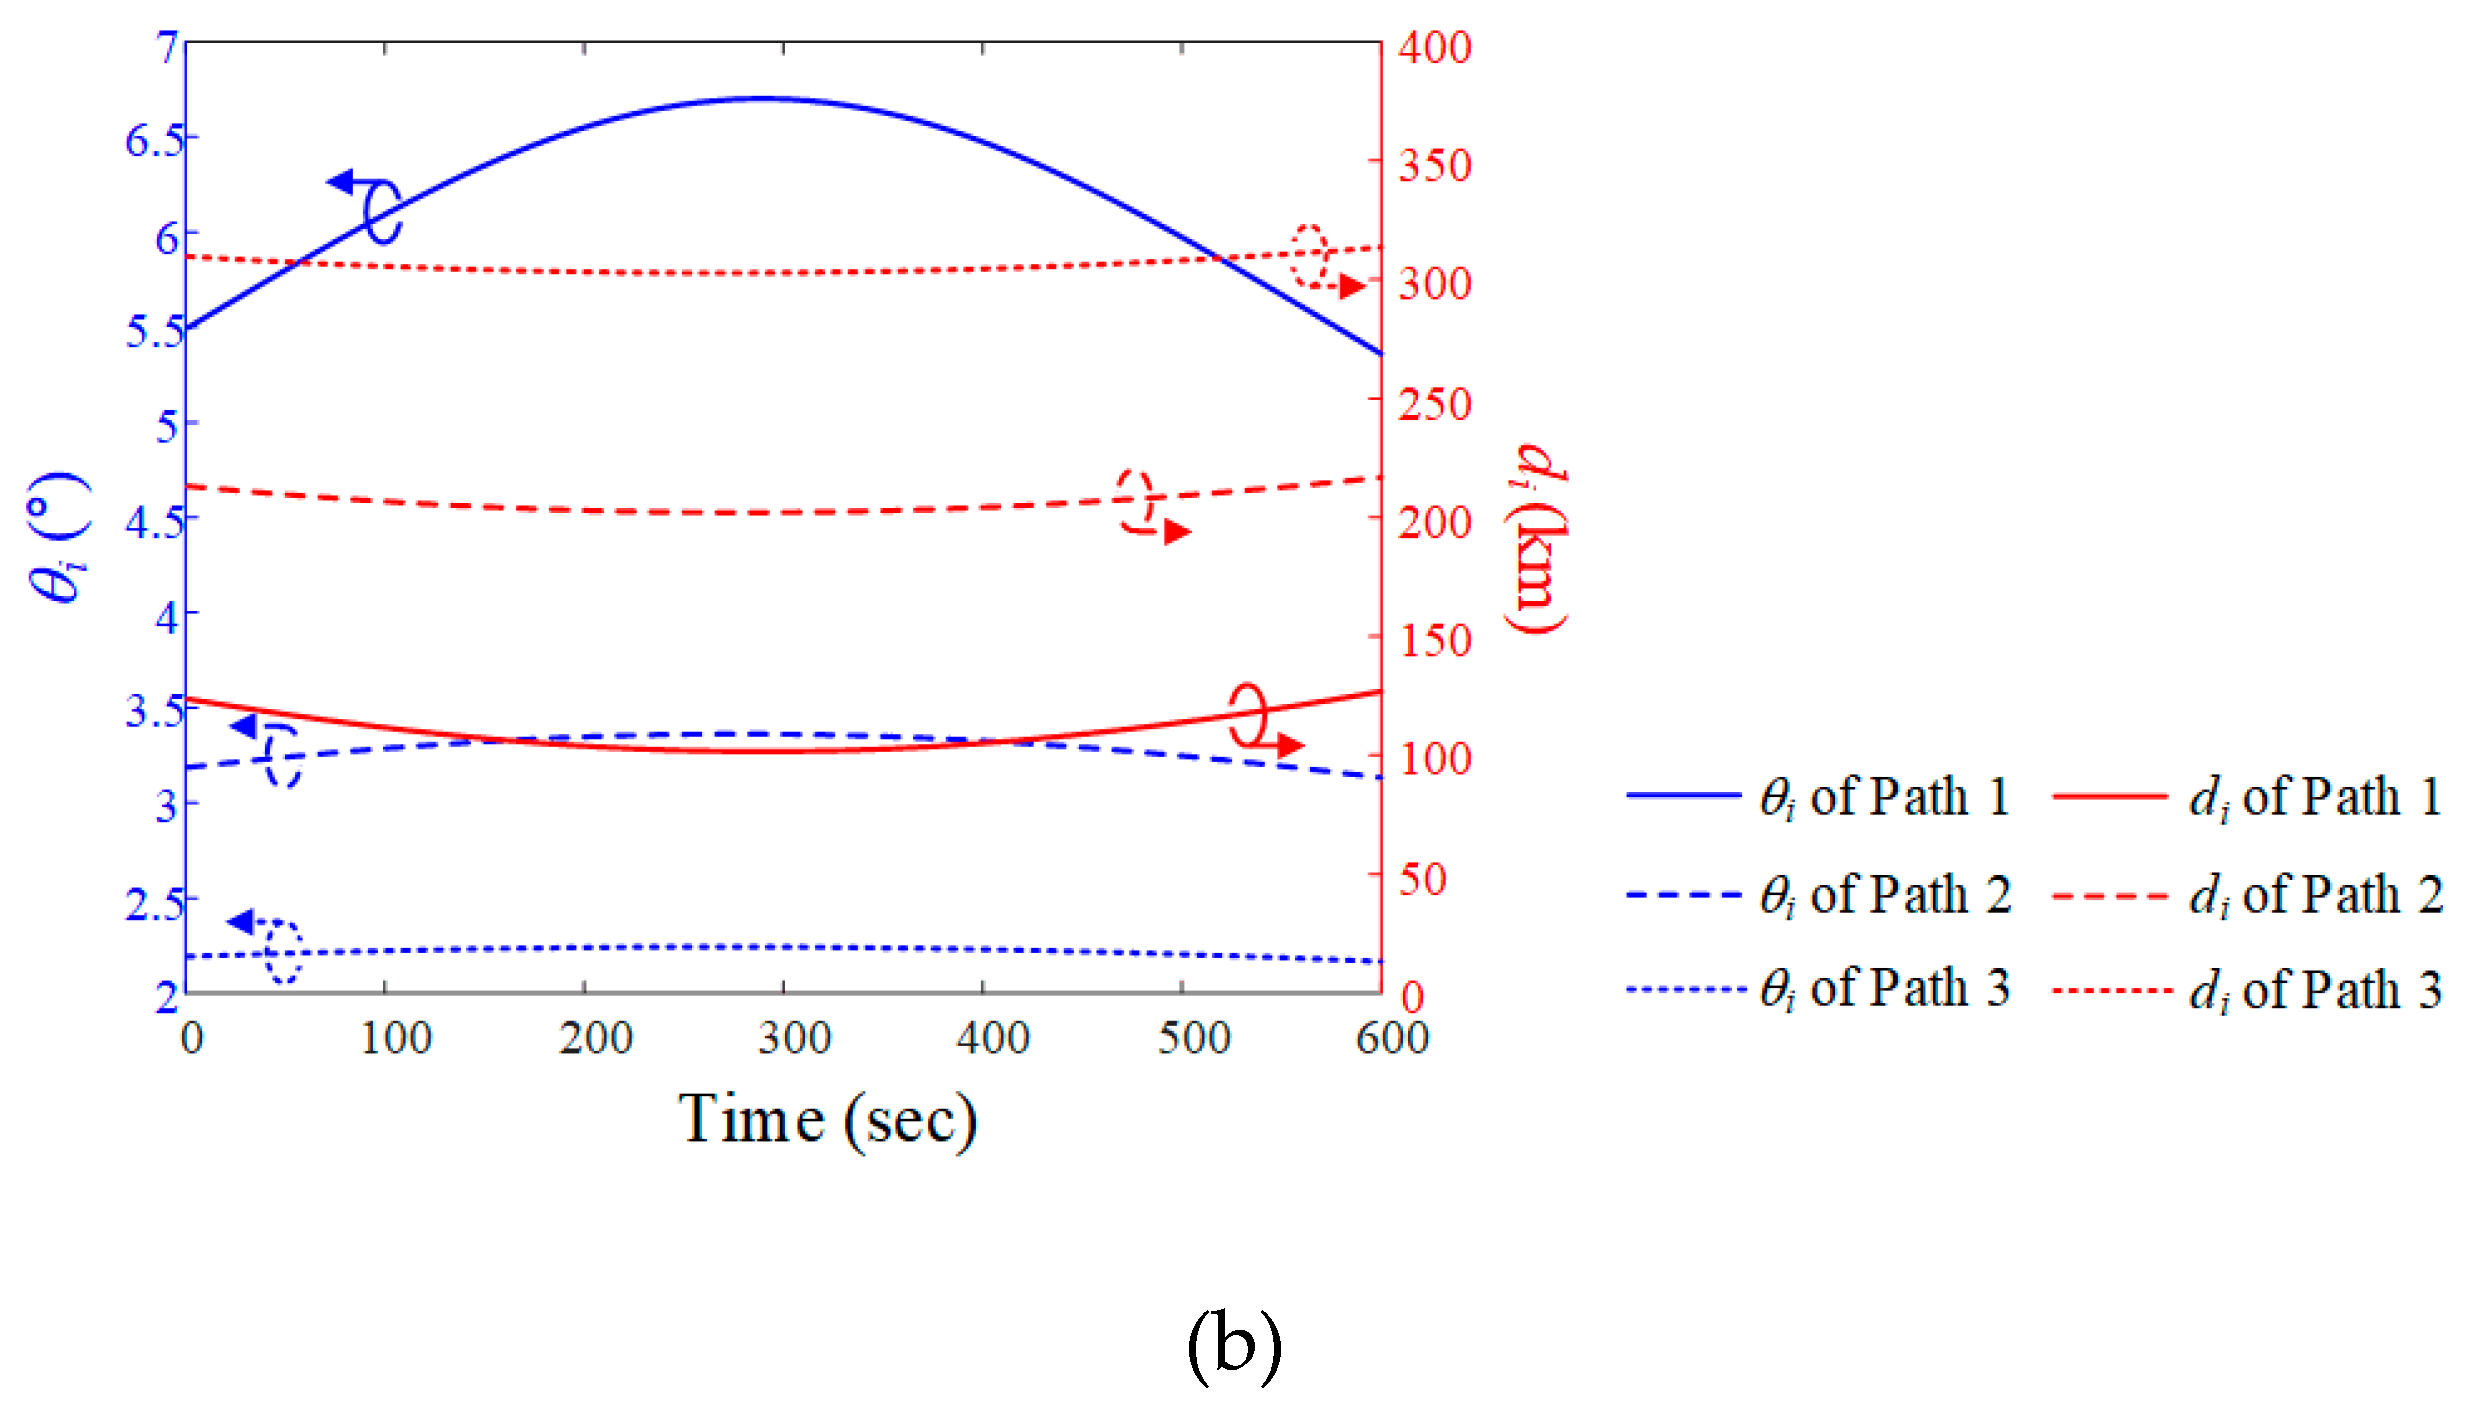
Figure 10.
Relative angle difference and J/S ratio results obtained by varying the altitude of the airborne interference source when the LEO satellite moves along the Trajectory 3: (a) for Path 1; (b) J/S ratio for Path 1; (c) for Path 2; (d) J/S ratio for Path 2; (e) for Path 3; (f) J/S ratio for Path 3.
and J/S ratio results obtained by varying the altitude of the airborne interference source when the LEO satellite moves along the Trajectory 3: (a) for Path 1; (b) J/S ratio for Path 1; (c) for Path 2; (d) J/S ratio for Path 2; (e) for Path 3; (f) J/S ratio for Path 3.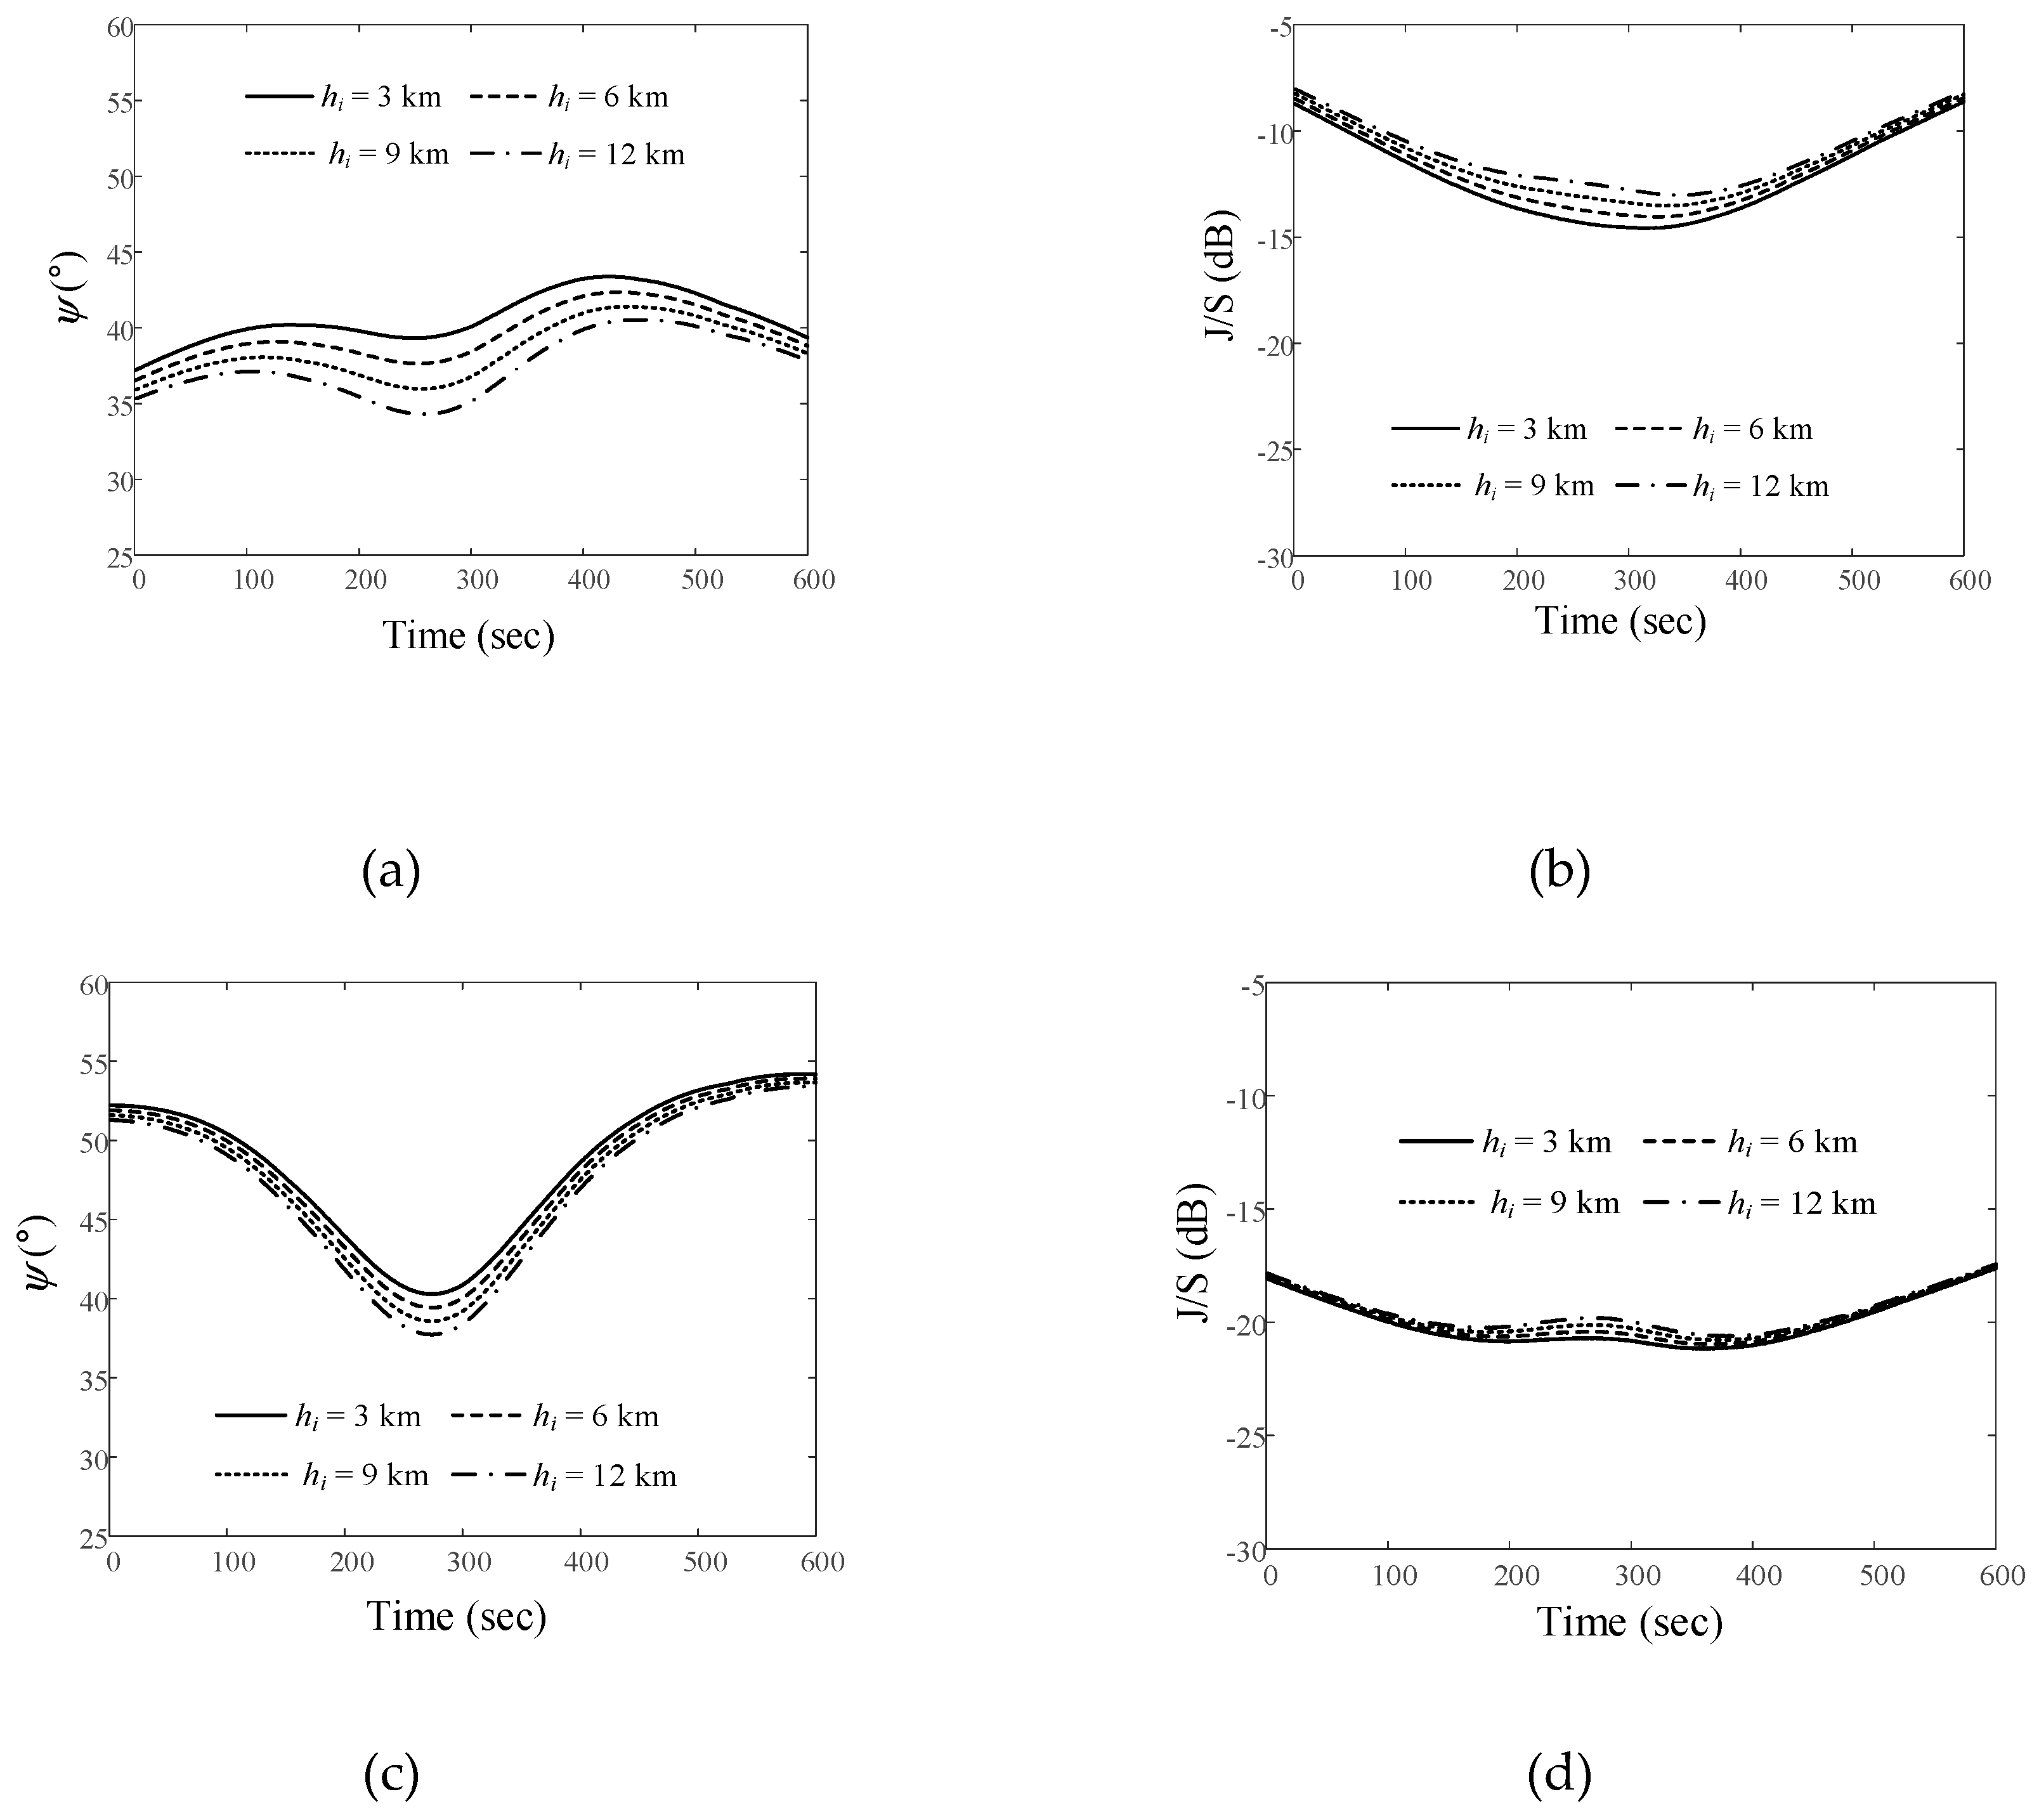
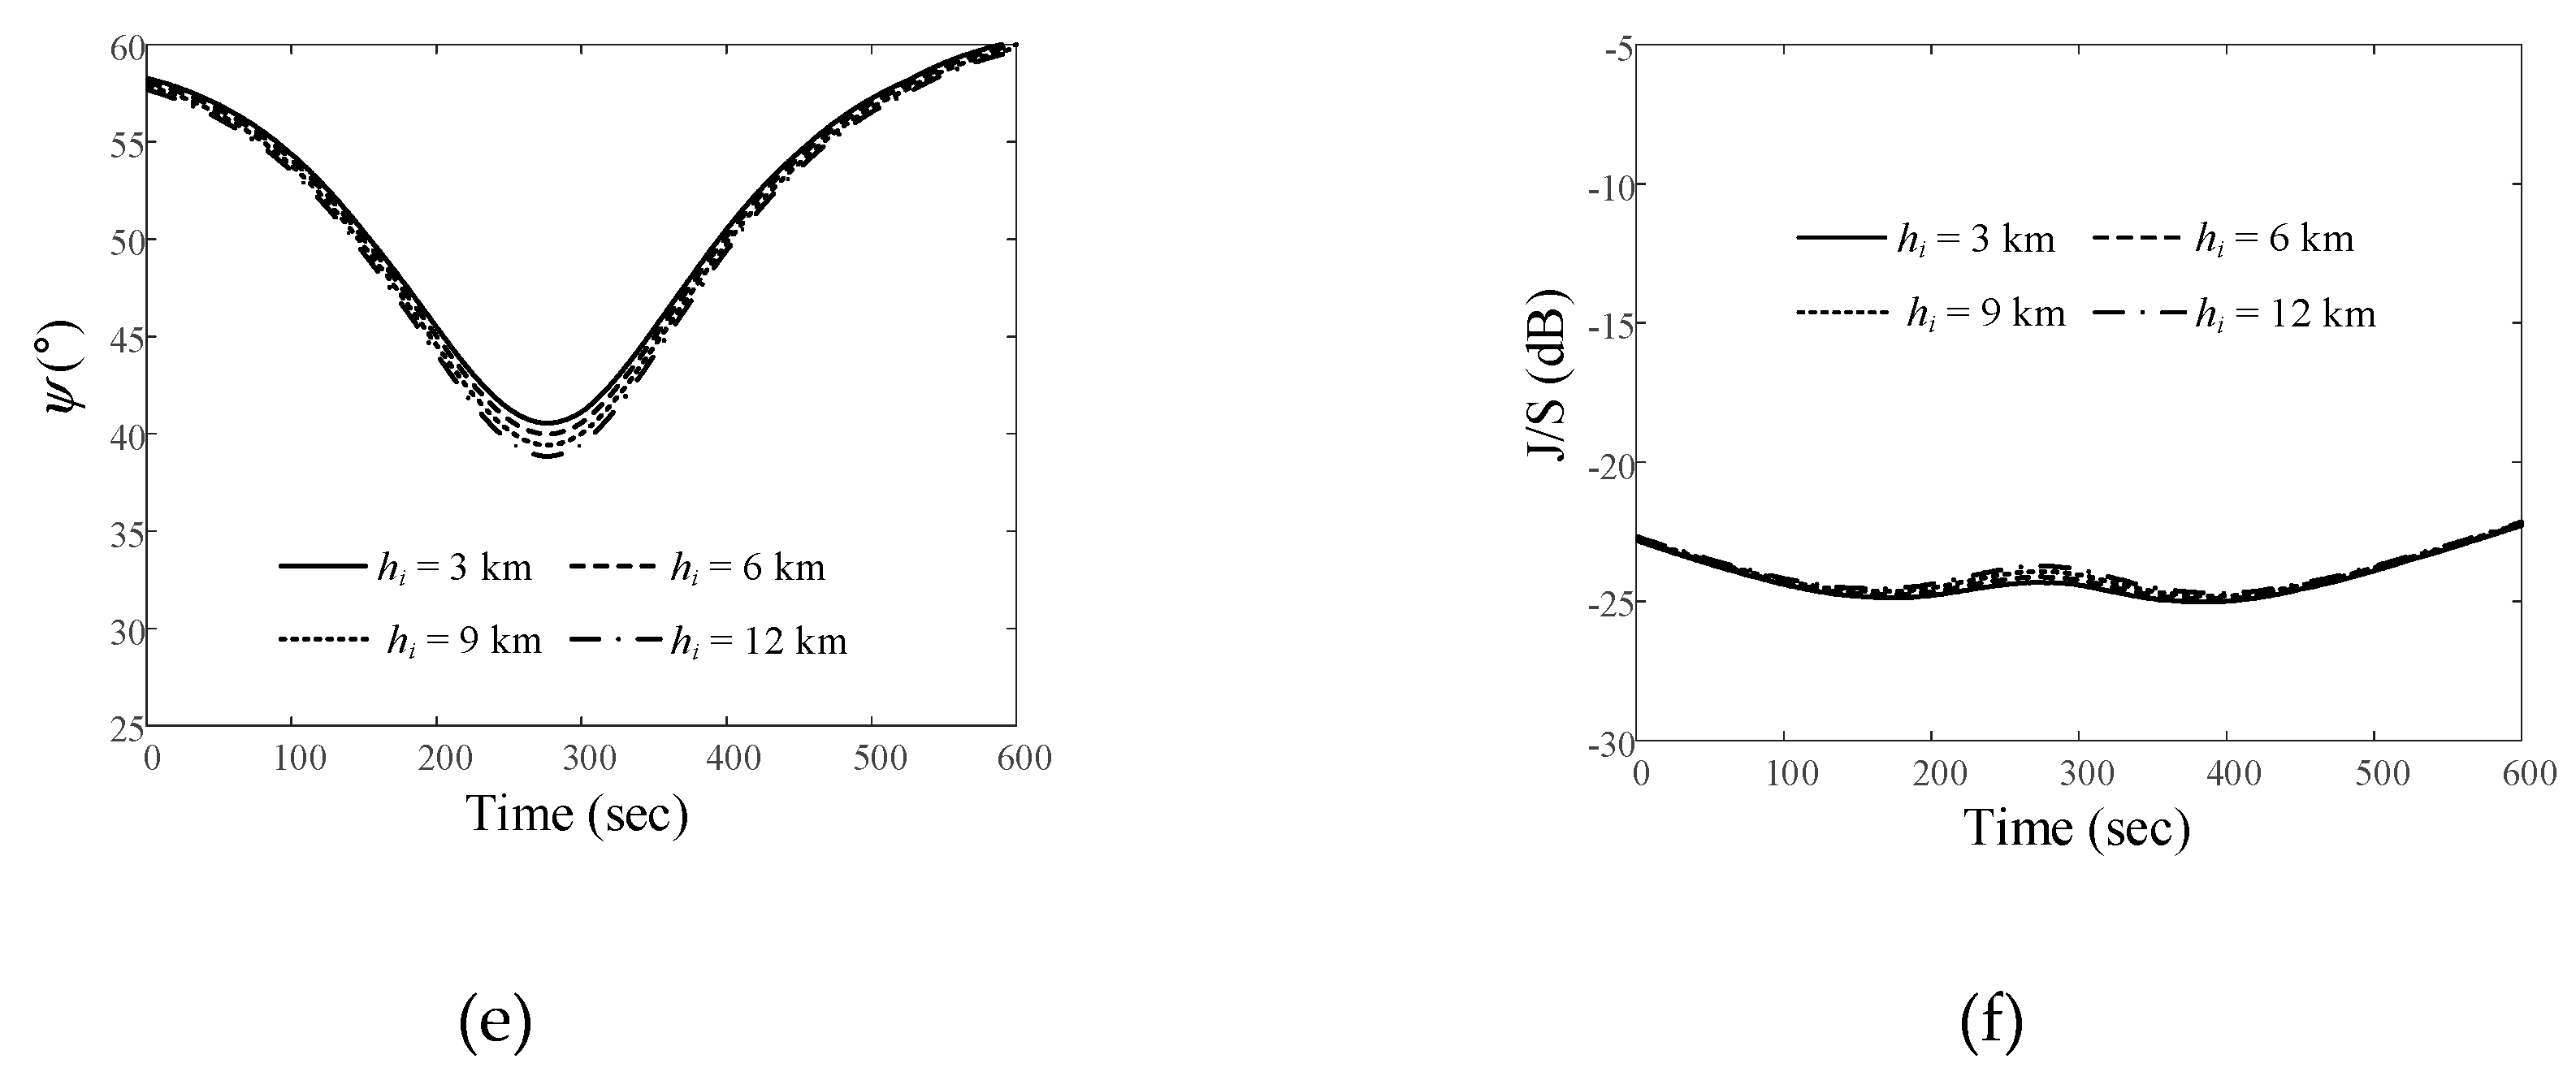

Table 1.
Link budget downlink parameters.
| Downlink Parameters | Values |
|---|---|
| Receiving antenna gain | 59 dBi |
| Satellite altitude | 550 km |
| Frequency range | 8025~8400 MHz |
| Transmitting power | 30 dBm |
| Transmitting antenna bore-sight gain | 4.4 dBi |
| Effective isotopic radiation power (EIRP), Gt + Pt | 34.4 dBm |
| Free-space path loss | Ls and Li (dB) |
| Interference source power | 70 dBm |
| Interference source antenna gain | 30 dBi |
| Interference velocity | 850 km/h |
| Interference source altitude | 3 km, 6 km, 9 km, and 12 km |
Table 2.
Summary of ave and Jave/Save ratio results for all scenarios.
ave and Jave/Save ratio results for all scenarios.| Altitude h i (km) |
Path 1 | Path 2 | Path 3 | ||||
|---|---|---|---|---|---|---|---|
|
ave (°) |
Jave/Save ratio (dB) |
ave (°) |
Jave/Save ratio (dB) |
ave (°) |
Jave/Save ratio (dB) |
||
| Trajectory 1 | 3 | 73.2 | −22.3 | 80.8 | −29.5 | 83.6 | −33.6 |
| 6 | 72.2 | −22.1 | 80.3 | −29.4 | 83.3 | −33.5 | |
| 9 | 71.1 | −21.9 | 79.8 | −29.2 | 82.9 | −33.4 | |
| 12 | 70.2 | −21.7 | 79.3 | −29.1 | 82.6 | −33.4 | |
| Trajectory 2 | 3 | 59.4 | −18.7 | 67.1 | −26 | 70 | −30.3 |
| 6 | 58.4 | −18.4 | 66.6 | −25.9 | 69.7 | −30.2 | |
| 9 | 57.3 | −18.2 | 66 | −25.8 | 69.3 | −30.1 | |
| 12 | 56.3 | −17.9 | 65.5 | −25.7 | 68.9 | −30.1 | |
| Trajectory 3 | 3 | 40.7 | −12.2 | 48.4 | −20.1 | 51.3 | −24.2 |
| 6 | 39.6 | −11.9 | 47.8 | −19.9 | 50.9 | −24.1 | |
| 9 | 38.5 | −11.5 | 47.3 | −19.7 | 50.6 | −24 | |
| 12 | 37.5 | −11.1 | 46.8 | −19.6 | 50.2 | −23.9 | |
Disclaimer/Publisher’s Note: The statements, opinions and data contained in all publications are solely those of the individual author(s) and contributor(s) and not of MDPI and/or the editor(s). MDPI and/or the editor(s) disclaim responsibility for any injury to people or property resulting from any ideas, methods, instructions or products referred to in the content. |
© 2023 by the authors. Licensee MDPI, Basel, Switzerland. This article is an open access article distributed under the terms and conditions of the Creative Commons Attribution (CC BY) license (http://creativecommons.org/licenses/by/4.0/).
Copyright: This open access article is published under a Creative Commons CC BY 4.0 license, which permit the free download, distribution, and reuse, provided that the author and preprint are cited in any reuse.


