
Submitted:
16 November 2023
Posted:
16 November 2023
You are already at the latest version
Abstract
Inland capture fisheries play a critical role in supporting food security and livelihoods in West Africa. Therefore, it is important to evaluate genetic health of exploited fish populations. The African bonytongue, Heterotis niloticus, supports important commercial and subsistence fisheries in West Africa. Sharp declines of stocks have been reported, however. Herein, we estimate contemporary effective population sizes (Ne) of four Heterotis populations in Nigeria, three in Benin, and five in Cameroon using the Linkage Disequilibrium method with correction for age structure. Ne estimates were used to assess genetic short-term (i.e., inbreeding depression) and long-term (i.e., loss of evolutionary potential) risks. Analyses failed to obtain Ne point estimates for two populations. For the remaining ten populations, corrected Ne point estimates fell well below 500, the minimum recommended for populations to retain evolutionary potential; with eight populations below 100 (range 2.8–83.5), the minimum recommended to avoid inbreeding depression, one borderline (100–125), and one above this threshold (312–392). The lower 95% confidence interval bound of Ne for eleven populations was very small (0.7–14.6), and for the remaining population it was 44.2. Accordingly, all populations examined can be considered potentially at risk of inbreeding depression.
Keywords:
Effective population size
; Inland capture fisheries
; West Africa
; Heterotis
Introduction
Inland capture fisheries in Africa comprise 28% of the global total (FAO, 2022) and provide a critical source of protein, micronutrients and income for people in Africa (Béné and Heck, 2005; De Graaf and Garibaldi, 2015; Funge-Smith, 2018; Funge-Smith and Bennett, 2019). Sustainability of these fisheries will be crucial for the food security of the rapidly growing human population of sub-Saharan Africa, which is projected to double by 2050 (United Nations-Department of Economic and Social Affairs-Population Division, 2019). Multiple threats, however, are imperiling native freshwater fish stocks in Africa, including overexploitation, habitat degradation, introduction of exotic species, and aquaculture (Abban, 1999; Lind et al., 2012; Marshall, 2016; Olaosebikan and Bankole, 2005). Therefore, it is important to conduct research that informs the sustainable use of these resources. Estimation of effective population size (Ne) is critically important for conservation and management of freshwater fish stocks. Overfishing, habitat destruction, and other threats can reduce Ne of fish stocks to levels that jeopardize population viability in the long-term and, in severe cases, short-term (Frankham et al., 2010).
Ne translates a population’s census size into the size of hypothetical idealized population (i.e., one that fulfills several unrealistic assumptions including random mating) exhibiting the same rate of loss of genetic diversity as the real population under study (Husemann et al., 2016). Ne estimates the strength of genetic drift in a population, and thus, reflects the rate at which variation is lost from a population. Accordingly, Ne is used to predict the evolutionary potential of populations, or their ability to adapt to environmental change (Allendorf et al., 2012). The “50/500 rule” of Franklin (1980) proposes that a Ne ≥ 50 for a single isolated population is required for short-term persistence, because it minimizes risk of deleterious effects from inbreeding depression (i.e., loss of fitness due to inbreeding). At Ne < 50, an isolated population can enter an “extinction vortex” (Gilpin and Soulé, 1986). Ne ≥ 500 is needed for healthy evolutionary potential and long-term persistence (Allendorf et al., 2012). More recent work revised these numbers upward (Ne ≥ 100 to avoid short-term collapse; Ne ≥ 5000 to retain evolutionary potential) (Frankham et al., 2002; Frankham et al., 2014; Jamieson and Allendorf, 2012; Pérez-Pereira et al., 2022).
Inland capture fisheries are important in West Africa. Nigeria, the most populous (~225 million) country in Africa, ranked 9th in the world in 2020 for inland fisheries yield, accounting for ~11% of the total production in Africa. Nigeria is one of the seven countries that are driving most of the growth in global inland fisheries (Funge-Smith, 2018). This country is also one of nine countries that collectively will contribute more than half the projected growth of the global human population between 2019 and 2050 (United Nations-Department of Economic and Social Affairs-Population Division, 2019), and Nigeria could be one of the world's largest consumers of fish by that year (Chan et al., 2019). Inland fisheries have also been historically very important in neighboring Benin, a country with a much smaller population (13.7 million). In the period 1960–2013, the inland fishery sector of Benin produced an average 27,000 tons annually, employing 57,500 fishers and 40,000 women active in fish processing and marketing (Sonneveld et al., 2019). In 2001, Benin ranked 15th in the world in inland capture fisheries production per capita, and 17th in inland capture fisheries production per unit area (FAO, 2003).
The African bonytongue, Heterotis niloticus (Cuvier, 1829), supports important commercial and subsistence fisheries in West Africa. Nigeria leads wild captures of this fish (Table 1) (FAO, 2021), totaling 409,784 metric tons between 1990 and 2021 (85.3% of the total caught in Africa during that period), of which 23,875 metric tons were caught in 2021 (86% of the total caught in Africa that year). Benin has ranked second for Heterotis yields, with 21,640 metric tons captured between 1987 and 2021 (5% of the total caught in Africa during that period), including 1,095 tons in 2021 (Table 1). In Cameroon, this fish naturally occurs in the Sudano-Sahelian zone (Far North and North regions), and has been introduced from there to other regions in the country (i.e., Centre, South, and Littoral), where it supports subsistence fishery (Brummett et al., 2010; Moreau, 1982). Although FAO does not have capture statistics for H. niloticus in Cameroon, it is an important capture species in the Nyong River (Centre region), where it was introduced in 1958 (Depierre and Vivien, 1977), with reports of 60 tons landed near Ayos in 1976 (Depierre and Vivien, 1977), approximately 616 tons/year prior to 1984 in Akonolinga, and ~240 tons/year in the 2004-2005 season in the middle Nyong River (reviewed in Brummett et al., 2010). Overexploitation and declines of Heterotis stocks have been reported for Nigeria (Mustapha, 2010), Benin (Adite et al., 2006), and other West African countries (Laë, 1995).
Genetically differentiated populations of the African bonytongue, suggested to represent different conservation/management units, have been identified in Benin, Nigeria, and Cameroon (localities shown in Fig. 1). In Benin, large genetic differences were detected among: (1) a population from Malanville, Niger River, in the north; (2) a population from Mono River in the southeast; and (3) a population in the Ouemé-Sô river floodplain system in the southwest (Hurtado et al., 2013). In Nigeria, large genetic differences were detected between fish from Kainji Lake, in the north, and fish from three southern locations (i.e., Epe Lagoon, Igbokoda River, and Ethiope River) (Oladimeji et al., 2022). Lower, yet significant, FST values (i.e., a measure of genetic differentiation among populations) were observed among the southern Nigerian samples (Oladimeji et al., 2022), and all populations examined to date face multiple threats (Oladimeji et al., 2022). In Cameroon, significant genetic differentiation is detected among five populations of Heterotis, including two native (one in Logone River, in the Far-North region, and one in Benoue River, in the North region), and three introduced (Nyong River, in the Centre region; Dja and Lobo Rivers, in the South region, and Nkam River, in the Littoral region), using the dataset of Wikondi et al. (2023). Herein, we estimate Ne for populations of Heterotis in Nigeria, Benin, and Cameroon, to assess genetic indicators of risks of inbreeding depression and loss of evolutionary potential.
Methods
We used published genotypic data (Hurtado et al., 2013; Oladimeji et al., 2022; Wikondi et al., 2023) for Heterotis populations in West Africa (Figure 1), including three localities in Benin (Niger River at Malanville, Mono River; and Ouemé-Sô river floodplain system), four in Nigeria (Kainji Lake, Epe Lagoon, Igbokoda River and Ethiope River), and five in Cameroon (Logone River, Far-North; Benoue River, North region; Nyong River, Centre region; Dja and Lobo Rivers, South region; and Nkam River, Littoral region). For Cameroon, we first assessed genetic differentiation among the five populations using the software GenAlEx v. 6.51b2n (Peakall and Smouse, 2012), and found significant differences in all pairwise comparisons (Supplementary material, Table SM1). Contemporary Ne was estimated for all populations using the LDNe method (Waples and Do, 2008), as implemented in the program NeEstimator (Do et al., 2014). This method estimates Ne based on patterns of linkage disequilibrium between loci, and was shown to perform well relative to other methods when calculating Ne under scenarios of low Ne and low migration rates (Gilbert and Whitlock, 2015). Ne values were calculated assuming random mating and using the following alternate settings: minimum allele frequency (MAF) cutoff values of 0.05, 0.02, 0.01, 0+ (i.e., no alleles excluded), and excluding singleton alleles. Confidence intervals for Ne values were estimated using the parametric and jackknife methods (Waples and Do, 2008) implemented in NeEstimator. Because Ne estimates can be biased by age structure, we used the “two traits” formulas provided in Table 3 of Waples et al. (2014) to adjust our “raw Ne” estimates by incorporating information on the following two life history traits: age at maturity (α) and adult life span (AL); where AL = ω – α + 1; being ω maximum age. Moreau (1982) indicates maturity in this fish occurs at about 2 years, and the maximum age is between 5 and 10 years. Accordingly, we used α = 2, with ω = 10 and 5; which resulted in AL values of 9 and 4.
Results
In Table 2 we report Ne estimates for populations in Nigeria, Benin, and Cameroon under three different assumptions: minimum allele frequency (MAF) = 0.05; MAF = 0.02; and excluding singleton alleles. As explained below, we chose MAF = 0.05 as the best cutoff value for our data, based on our interpretation of the results that appear to indicate that estimates for MAF ≤ 0.02 are driven by the presence of rare alleles. First, except for Kainji Lake, Ouemé-Sô river floodplain, and Benoue River, all Ne point estimations using MAF = 0.05 were identical to those that excluded singleton alleles. In the case of Kainji Lake and Benoue river, Ne point estimates using MAF = 0.05 (23.7 and 48.7, respectively) were very close to Ne point estimates excluding singleton alleles (27.7 and 56.2, respectively). Second, except for the Ouemé-Sô river floodplain population, all results for MAF = 0.01 and MAF = 0+ were identical to those obtained with MAF = 0.02. Third, the Ne point estimate for Kainji Lake based on MAF = 0.02 was approximately twice as large as the one based on MAF = 0.05. A similar pattern was observed in the Ouemé-Sô river floodplain, where the Ne point estimate based on MAF = 0.05 (92.1) was substantially lower than those based on MAF = 0.02, MAF = 0.01, MAF = 0+ and excluding singleton alleles (i.e., 179.5, 197.3 and 238.7, and 266.1, respectively).
After correcting for age structure, Ne point estimates using MAF = 0.05 ranged 25–37 for Kainji Lake, Epe Lagoon, Malanville, and Mono River; 45.7–57.5 for Ethiope River; 51.9–65.4 for Benoue River; 66.3–83.5 for Logone River; and 99.7–125.5 for Ouemé-Sô river floodplain. Ne point estimation for Igbokoda was inconclusive (infinite; see below) using all loci. However, when removing locus Hn45, which was monomorphic in southern Nigeria populations, corrected estimates ranged 311.6–392.3. For the other southern Nigeria populations, Ne estimations were identical including all loci and removing locus Hn45 (not shown). The Ne point estimate for the introduced population of Dja and Lobo rivers was 2.8–3.5, and the analysis failed to estimate Ne for the other two introduced populations (Nyong River and Nkam River). The lower bound of the 95% CI for all populations, with the exception of Ouemé-Sô river floodplain, ranged between 0.7 and 14.6 using the jackknife method, which is less biased (Waples and Do, 2008); suggesting the Ne of these populations can be very small. The lower bound of the 95%CI jackknife for Ouemé-Sô river floodplain was 44.2. Upper 95% CI bounds for some populations were determined as infinite. When estimates of Ne are negative, which is caused by sampling error, the program reports them as infinite (Do et al., 2014).
Discussion
Ne point estimates of all H. niloticus populations examined herein (Table 2) fall well below the minimum recommended for populations to retain evolutionary potential [original criterion Ne ≥ 500, recently revised to Ne ≥ 1000; (Frankham et al., 2014)]. Furthermore, all populations of H. niloticus examined can be considered potentially at risk of inbreeding depression. All corrected Ne point estimations for Kainji Lake, Epe Lagoon, Malanville, and Mono River populations (range = 25–37) were below the original benchmark of Ne ≥ 50 recommended for avoiding the potential deleterious effects of inbreeding depression; whereas corrected Ne point estimates for Ethiope River, Benoue River, and Logone River (range = 46–83.5) were below the benchmark of Ne ≥ 100. According to Frankham et al. (2014), an Ne = 50 is inadequate for preventing inbreeding depression over five generations in the wild, with Ne ≥ 100 being required to limit loss in total fitness to ≤ 10%. In addition, the lower 95% CI (jackknife) bound for all populations examined, except Ouemé-Sô river floodplain, indicates that the Ne of these populations may be very small (range 0.7–14.6). Corrected Ne values for Ouemé-Sô river floodplain were at the 100 threshold (using AL = 9), or slightly higher (125.5 for AL = 4); and the lower 95% CI (jackknife) bound (44.2) indicates Ne of this population may be below the 50 threshold.
The Ne point estimate of the introduced Dja and Lobo rivers population was the smallest (2.8–3.5). Although Ne point estimates of the other two introduced populations were inconclusive, their lower 95% CI values indicate they also can be very small (11.3 and 12.6 for Nkam River and Nyong River, respectively). Low Ne estimates of introduced populations are probably related to bottlenecks experienced during introductions. According to Depierre and Vivien (1977), Heterotis was introduced from northern Cameroon populations to a fish farming station in Melen, a suburb of Yaounde, in 1955, and from there ~20 fries were released into the Nyong River in 1958. Subsequently, in 1961, an accidental spill from a fishpond released several hundred fries into the Nyong River. These authors also indicate that Heterotis appeared in the Lower Sanaga River (Littoral region) around 1968, probably from the lower course of the Nyong, as the two rivers are connected in the mouth of the Sanaga through mangrove channels during periods of high water. It is possible that from the Sanaga, Heterotis colonized other rivers in the Littoral region, such as the Nkam; and that the Dja and Lobo rivers were also colonized by individuals related to the Nyong population. Indeed, STRUCTURE analyses of the five Cameroon populations found two main clusters, one corresponding to the native populations and the other to the introduced populations; suggesting a common origin for the introduced populations (Wikondi et al., 2023).
The cutoff value of MAF = 0.05 has been recommended in simulation analyses to ensure Ne estimations are not being driven by the presence of rare alleles (Gilbert and Whitlock, 2015; Hamilton et al., 2018; Waples and Do, 2010). Nonetheless, if MAF ≤ 0.02 were deemed more appropriate for our data, most of the corrected Ne point estimates would still fall below the critical thresholds (Table 2). All corrected Ne values, assuming MAF ≤ 0.02, were below 50 for Epe Lagoon, Mono River, and Malanville (range = 19.6–39.1), and below 100 for Kainji Lake (range = 47.9–60.4), Ethiope River (range = 61.1–77), and Benoue River (range = 60.8–76.6). Furthermore, the lower 95% CI bounds for the above populations, as well as Logone River and the introduced populations (range 1.3–31), indicate these stocks may be very small. We also note that the Benin samples used to estimate Ne were collected between 2008 and 2009, and the ones from Nigeria were collected in 2018. Thus, it is possible that current Ne of populations are even smaller than estimated, especially values for Benin stocks that were estimated with samples collected more than a decade ago, and considering that factors responsible for reducing Ne (e.g., overfishing and habitat destruction) have likely continued operating or increased in intensity.
According to Waples and Do (2010) precise estimates for relatively small (Ne < 200) isolated populations can be obtained with the LD method; and small populations are not likely to be mistaken for large ones. Gilbert and Whitlock (2015) used simulations to compare the performance of seven methods to estimate Ne under different scenarios of migration with three different Ne values (50, 500 and 5000), and found that the LD method implemented in NeEstimator v2.0 outperformed the other methods in conditions of isolation for Ne = 50 and 500. This method also performed well in scenarios of low migration and small Ne. Accordingly, because the Heterotis populations studied herein exhibit genetic differentiation consistent with isolation (Hurtado et al., 2013; Oladimeji et al., 2022), the small Ne estimations we obtained are likely reflective of the true Ne.
We used reported information on age of maturity and maximum age that allowed for bias corrections of our estimations due to overlapping generations. There was, however, not a single value for the maximum age in this fish, and for this reason we conservatively used the two extremes of the reported maximum age (ω) values (10 and 5), which resulted in AL values 9 and 4. Corrected Ne were larger than raw Ne estimates, and those using AL = 9 resulted in the lower values that were more similar to raw values than those using AL = 4. Considering reports of aquarium-housed fish living between 10–20+ years (e.g., Fish Laboratory, 2021), AL = 9 may represent our best approximation. Ne estimates assuming AL > 9 would be smaller and closer to the raw estimates. Similarly, we used age at maturity (α) = 2, however α = 1 has been reported for fish in aquaculture (Wikondi et al., 2023). Because correction formulas employ the ratio AL/α, designation of α = 1 would result also in smaller corrected Ne estimates (i.e., closer to the raw estimates) than those using α = 2. We note that in the case of the smaller raw point estimations (all, except for Ouemé-Sô river floodplain system and Igbokoda populations), the differences between raw and corrected estimations were small (2–15) with either AL value. That difference was also small using AL = 9 for the Ouemé-Sô river floodplain (8 individuals), Benoue (5 individuals), and Logone (5 individuals); with Igbokoda exhibiting the largest difference (24 individuals).
Ne estimations of Heterotis populations in West Africa are much lower than those reported for the region’s wild populations of Nile tilapia (Oreochromis niloticus), an important species supporting capture fisheries and aquaculture production (Lind et al., 2019). Over 50 % of Nile tilapia samples from 23 localities across West Africa, including eight countries representing the major catchments of the Volta, Niger, Senegal, and Gambia River basins, had Ne in excess of 100 and none below 50. Nonetheless, all populations of Nile tilapia were below the threshold for long-term genetic risks (range: 56–352 individuals), whereas ten (43.5%) were below the revised threshold of 100 for short-term genetic risk; and 14 (60.9%) had lower 95% CI bounds below 100 (the lowest was 30.3). The Ne point estimate for Nile tilapia at Malanville was ~10 times larger (Ne = 236), than that for Heterotis from the same location (Ne = 23). Nile tilapia at Malanville might be part of a more widely distributed metapopulation, whereas Heterotis at this locality might correspond to a more isolated population. Nile tilapia from Malanville and Mopti (Mali), another locality in the Niger River separated by ~1,400 km, show high genetic similarity, suggesting high levels of gene flow. Nile tilapia Ne estimated at Mopti is very similar (Ne = 289) to that in Malanville; thus, it is possible that such Ne estimates reflect the Ne of a broader metapopulation. According to Waples and England (2011), “LD estimates of Ne accurately reflect local (subpopulation) Ne unless m ≥ 5–10%. With higher m, Ne converges on the global (metapopulation) Ne”. For Heterotis, high genetic differentiation appears to occur at comparatively shorter distances within the Niger River, i.e., between Malanville and Kainji Lake (~230 km), and between Kainji Lake and the lower Niger portion (~700 km).
We note that heterozygosity and allelic diversity are poor predictors of short- and long-term genetic risks, underscoring the importance of Ne estimations. Heterozygosity in Kainji Lake was highest among all populations (uHe = 0.72), with second highest allelic diversity (Na = 8.33), yet Ne was only 24. Similarly, for Nile tilapia, the locality with the highest estimated Ne had comparatively low heterozygosity and allelic diversity among Nile tilapia populations examined. Severe declines in Ne can occur without significant loss of genetic diversity (Lonsinger et al., 2018).
Implications for Conservation and Management
Overfishing and habitat destruction likely pose the greatest threat for Heterotis stocks in Benin and Nigeria. This species is highly sought because of its high protein content and firm flesh (Agbugui et al., 2021). Overfishing has been documented in Kainji Lake (Abiodun, 2002; Yem et al., 2007), Malanville (Hauber et al., 2011), Ouémé–So river-floodplain system (Allan et al., 2005), Mono River (Lederoun et al., 2018), and Epe Lagoon (Olukolajo and Hillary, 2012). Illegal fishing activities exacerbate this problem. In Kainji Lake, illegal practices include the use of prohibited gear (e.g., small mesh size nets and destructive fishing gear), fish poisoning, and explosives (Mshelia et al., 2005). In the Ouémé–So river-floodplain system, fish traps are placed near active Heterotis nests to capture brooding adults (Adite et al., 2006). Pollution also impacts Heterotis stocks in some regions (Akinsanya et al., 2020a; Akinsanya et al., 2020b; Arojojoye et al., 2021; Ikomi and Arimoro, 2014).
Our results indicate that Ne values for populations of Heterotis niloticus in Nigeria, Benin, and Cameroon are below the recommended thresholds to avoid short- and long-term genetic risks. Indeed, high inbreeding (FIS) was suggested previously for four of the local stocks (Hurtado et al., 2013; Oladimeji et al., 2022): Igbokoda (FIS = 0.18; the highest inbreeding among Nigerian populations); Malanville (FIS = 0.20); Mono River (FIS = 0.13); and Ouemé-Sô river floodplain (FIS = 0.13). Our Ne estimates are comparable to those of endangered species (Frankham et al., 2010; Palstra and Ruzzante, 2008). For example, Ne, heterozygosity, and FIS values estimated for populations of an endangered snake (Sovic et al., 2019) were similar to estimates for West African Heterotis. Small Ne estimates of genetically differentiated Heterotis populations indicate that conservation and management actions are urgently needed, with special consideration of risks associated with inbreeding depression (but see Wood et al., 2016).
Heterotis niloticus is currently listed as a species of Least Concern by the International Union for Conservation of Nature (IUCN) (Diouf et al., 2020). It is important that future assessments of this species consider: (1) that this species is comprised of multiple genetically differentiated populations with small ranges relative to the species’ global distribution, many of which face multiple threats (i.e., overexploitation, habitat destruction, pollution); (2) populations examined to date reveal Ne estimates below the critical long-term threshold of 500 for retaining evolutionary potential, and most are below the critical short-term threshold of 50 and 100 for preventing inbreeding depression; and (3) all Ne estimations had lower 95% CI values, suggesting Ne of these wild populations may be very small, thus highly vulnerable to inbreeding depression.
Growth of isolated populations may allow their Ne to increase (Kamath et al., 2015), and fishing restrictions may be required to allow stocks to recover (Pita et al., 2017). Gene flow between populations may also boost Ne (Frankham, 2022); however, given that stocks are genetically differentiated, gene flow could result in outbreeding depression (Allendorf et al., 2012). Translocation of stocks erodes distinct population genetic structures, which runs counter to a goal of the Convention on Biological Diversity’s post-2020 global biodiversity framework (Hoban et al., 2023). Future research should examine genetic diversity of other Heterotis populations in West Africa as well as monitor Ne of genetically distinct populations. Heterotis is just one of several fishes important for subsistence and commercial fisheries in West Africa, and the genetic diversity of other fish species also needs to be investigated.
REFERENCES
- Abban, E. K. 1999. Considerations for the conservation of African fish genetic resources for their sustainable exploitation. Towards policies for conservation and sustainable use of aquatic genetic resources. ICLARM Conf. Proc. 59, 277p, 95-100. Available from.
- Abiodun, J. A. 2002. Fisheries Statistical Bulletin Kainji Lake, Nigeria, 2001. Pp. 25p. Nigerian-German Kainji Lake Fisheries Promotion Project. Technical Report Series 18.
- Adite, A., K. O. Winemiller, and E. D. Fiogbe. 2006. Population structure and reproduction of the African bonytongue Heterotis niloticus in the Sô River-floodplain system (West Africa): implications for management. Ecology of Freshwater Fish 15:30-39. [CrossRef]
- Agbugui, M. O., H. O. Egbo, and F. E. Abhulimen. 2021. The Biology of the African Bonytongue Heterotis niloticus (Cuvier, 1829) from the Lower Niger River at Agenebode in Edo State, Nigeria. International Journal of Zoology 2021:1-13. [CrossRef]
- Akinsanya, B., I. O. Ayanda, A. O. Fadipe, B. Onwuka, and J. K. Saliu. 2020a. Heavy metals, parasitologic and oxidative stress biomarker investigations in Heterotis niloticus from Lekki Lagoon, Lagos, Nigeria. Toxicology Reports 7:1075-1082. [CrossRef]
- Akinsanya, B., I. O. Ayanda, B. Onwuka, and J. K. Saliu. 2020b. Bioaccumulation of BTEX and PAHs in Heterotis niloticus (Actinopterygii) from the Epe Lagoon, Lagos, Nigeria. Heliyon 6:e03272. [CrossRef]
- Allan, J. D., R. Abell, Z. E. B. Hogan, C. Revenga, B. W. Taylor, R. L. Welcomme, and K. Winemiller. 2005. Overfishing of inland waters. Bioscience 55:1041-1051. [CrossRef]
- Allendorf, F. W., G. H. Luikart, and S. N. Aitken. 2012. Conservation and the genetics of populations. John Wiley & Sons, Chichester, UK.
- Arojojoye, O. A., A. A. Oyagbemi, O. E. Ola-Davies, R. O. Asaolu, Z. O. Shittu, and B. A. Hassan. 2021. Assessment of water quality of selected rivers in the Niger Delta region of Nigeria using biomarkers in Clarias gariepinus. Environmental Science and Pollution Research 28:22936-22943. [CrossRef]
- Béné, C., and S. Heck. 2005. Fish and food security in Africa. NAGA, WorldFish Center Quarterly 28:8-13.
- Brummett, R., D. Nguenga, F. Tiotsop, and J.-C. Abina. 2010. The commercial fishery of the middle Nyong River, Cameroon: productivity and environmental threats.
- Chan, C. Y., N. Tran, S. Pethiyagoda, C. C. Crissman, T. B. Sulser, and M. J. Phillips. 2019. Prospects and challenges of fish for food security in Africa. Global Food Security 20:17-25. [CrossRef]
- De Graaf, G., and L. Garibaldi. 2015. The value of African fisheries. FAO fisheries and aquaculture circular 1093:1-76.
- Depierre, D., and J. Vivien. 1977. Une réussite du Service Forestier du Cameroun: l'introduction d'Heterotis niloticus dans le Nyong. Revue Bois et Forêts des Tropiques 173:59–68.
- Diouf, K., E. Akinyi, A. Azeroual, M. Entsua-Mensah, A. Getahun, P. Lalèyè, and T. H. Moelants. 2020. Heterotis niloticus. https://dx.doi.org/10.2305/IUCN.UK.2020-2.RLTS.T182580A134764025.en. . Accessed 05 November 2023.
- Do, C., R. S. Waples, D. Peel, G. M. Macbeth, B. J. Tillett, and J. R. Ovenden. 2014. NeEstimator v2: re-implementation of software for the estimation of contemporary effective population size (Ne) from genetic data. Molecular Ecology Resources 14:209-214. [CrossRef]
- FAO. 2003. Review of The State of World Fishery Resources: Inland Fisheries. FAO, Rome.
- FAO. 2021. Global capture production Quantity (1950–2021). https://www.fao.org/fishery/statistics-query/en/capture/capture_quantity. Accessed 05 Nov 2023.
- FAO. 2022. The State of World Fisheries and Aquaculture 2022. Towards Blue Transformation. Pp. 266. FAO, Rome. [CrossRef]
- Fish Laboratory. 2021. African Arowana (Heterotis niloticus): Ultimate Care Guide. https://www.fishlaboratory.com/fish/african-arowana/. Accessed 05 November 2023.
- Frankham, R. 2022. Evaluation of proposed genetic goals and targets for the Convention on Biological Diversity. Conservation Genetics 23:865-870. [CrossRef]
- Frankham, R., J. Ballou, and D. Briscoe. 2002. Introduction to Conservation Genetics. Cambridge University Press, Cambridge.
- Frankham, R., J. D. Ballou, and D. A. Briscoe. 2010. Introduction to Conservation Genetics. Cambridge University Press, Cambridge.
- Frankham, R., C. J. A. Bradshaw, and B. W. Brook. 2014. Genetics in conservation management: revised recommendations for the 50/500 rules, Red List criteria and population viability analyses. Biological Conservation 170:56-63. [CrossRef]
- Franklin, I. R. 1980. Conservation biology: an evolutionary-ecological perspective. Pp. 135–149 in M. E. Soulé and B. A. Wilcox, eds. Conservation biology: An evolutionary-ecological perspective. Sinauer Associates, Sunderland, MA.
- Funge-Smith, S. J. 2018. Review of the state of world fishery resources: inland fisheries. FAO Fisheries and Aquaculture Circular.
- Funge-Smith, S., and A. Bennett. 2019. A fresh look at inland fisheries and their role in food security and livelihoods. Fish and Fisheries (Oxford) 20:1176-1195. [CrossRef]
- Gilbert, K. J., and M. C. Whitlock. 2015. Evaluating methods for estimating local effective population size with and without migration. Evolution 69:2154-2166. [CrossRef]
- Gilpin, M. E., and M. E. Soulé. 1986. Minimum viable populations: processes of species extinction. Pp. 19-34 in M. E. Soulé, ed. Conservation Biology: the Science of Scarcity and Diversity. Sinauer Associates, Sunderland, MA.
- Hamilton, M. B., M. Tartakovsky, and A. Battocletti. 2018. speed-ne: Software to simulate and estimate genetic effective population size (Ne) from linkage disequilibrium observed in single samples. Molecular Ecology Resources 18:714-728. [CrossRef]
- Bierbach, and K. E. Linsenmair. 2011. A description of teleost fish diversity in floodplain pools ('Whedos') and the Middle-Niger at Malanville (north-eastern Benin). Journal of Applied Ichthyology 27:1095-1099. [CrossRef]
- Hoban, S., M. W. Bruford, J. M. da Silva, W. C. Funk, R. Frankham, M. J. Gill, C. E. Grueber, M. Heuertz, M. E. Hunter, and F. Kershaw. 2023. Genetic diversity goals and targets have improved, but remain insufficient for clear implementation of the post-2020 global biodiversity framework. Conservation Genetics 24:181-191. [CrossRef]
- Hurtado, L. A., E. Carrera, A. Adite, and K. O. Winemiller. 2013. Genetic differentiation of a primitive teleost, the African bonytongue Heterotis niloticus, among river basins and within a floodplain river system in Benin, West Africa. Journal of Fish Biology 83:682-690. [CrossRef]
- Husemann, M., F. E. Zachos, R. J. Paxton, and J. C. Habel. 2016. Effective population size in ecology and evolution. Heredity (Edinb) 117:191-2. [CrossRef]
- Ikomi, R. B., and F. O. Arimoro. 2014. Effects of recreational activities on the littoral macroinvertebrates of Ethiope River, Niger Delta, Nigeria. Journal of Aquatic Sciences 29:155-170.
- Jamieson, I. G., and F. W. Allendorf. 2012. How does the 50/500 rule apply to MVPs? Trends in Ecology & Evolution 27:578-584. [CrossRef]
- Kamath, P. L., M. A. Haroldson, G. Luikart, D. Paetkau, C. Whitman, and F. T. Van Manen. 2015. Multiple estimates of effective population size for monitoring a long-lived vertebrate: an application to Yellowstone grizzly bears. Molecular Ecology 24:5507-5521. [CrossRef]
- Laë, R. 1995. Climatic and anthropogenic effects on fish diversity and fish yields in the Central Delta of the Niger River. Aquatic Living Resources 8:43-58. [CrossRef]
- Lederoun, D., K. R. Lalèyè, A. R. Boni, G. Amoussou, H. Vodougnon, H. Adjibogoun, and P. A. Lalèyè. 2018. Length–weight and length–length relationships of some of the most abundant species in the fish catches of Lake Nokoué and Porto-Novo Lagoon (Benin, West Africa). Lakes & Reservoirs: Research & Management 23:351-357. [CrossRef]
- Lind, C. E., S. K. Agyakwah, F. Y. Attipoe, C. Nugent, R. P. Crooijmans, and A. Toguyeni. 2019. Genetic diversity of Nile tilapia (Oreochromis niloticus) throughout West Africa. Scientific Reports 9:1-12. [CrossRef]
- Lind, C. E., R. E. Brummett, and R. W. Ponzoni. 2012. Exploitation and conservation of fish genetic resources in Africa: issues and priorities for aquaculture development and research. Reviews in Aquaculture 4:125-141. [CrossRef]
- Lonsinger, R. C., J. R. Adams, and L. P. Waits. 2018. Evaluating effective population size and genetic diversity of a declining kit fox population using contemporary and historical specimens. Ecology and Evolution 8:12011-12021. [CrossRef]
- Marshall, B. E. 2016. Inland fisheries of tropical Africa. J. F, Graig, Freshwater Fisheries Ecology (eds.). Chichester: John Wiley & Sons, Ltd.:349.
- Moreau, J. 1982. Expose synoptique des donnees biologiques sur Heterotis niloticus (Cuvier, 1829). FAO Synopsis sur les pèches:1-45.
- Mshelia, M. B., A. N. Okaeme, N. O. Dantoro, J. A. Abiodun, O. M. Olowosegun, and I. Y. Yemi. 2005. Responsible fisheries enhancing poverty alleviation of fishing communities of Lake Kainji. 19th Annual Conference of the Fisheries Society of Nigeria (FISON), Ilorin, Nigeria. 597-604. Available from.
- Mustapha, M. K. 2010. Heterotis niloticus (Cuvier, 1829) a threatened fish species in Oyun reservoir, Offa, Nigeria; the need for its conservation. Asian Journal of Experimental Biological Sciences 1:1-7.
- Oladimeji, T. E., I. C. Caballero, M. Mateos, M. O. Awodiran, K. O. Winemiller, A. Adite, and L. A. Hurtado. 2022. Genetic identification and diversity of stocks of the African bonytongue, Heterotis niloticus (Osteoglossiformes: Arapaiminae), in Nigeria, West Africa. Scientific Reports 12:8417. [CrossRef]
- Olaosebikan, B. D., and N. O. Bankole. 2005. An analysis of Nigerian freshwater fishes: those under threat and conservation options. Proceedings of the 19th annual conference of the fisheries society of Nigeria (FISON), 29 Nov - 03 Dec 2004, Ilorin, Nigeria. 754–762. Available from.
- Olukolajo, S., Olufemi, and E. Hillary, Chikezie. 2012. Species diversity and growth pattern of the fish fauna of Epe Lagoon, Nigeria. Journal of Fisheries and Aquatic Science 7:392-401. [CrossRef]
- Palstra, F. P., and D. E. Ruzzante. 2008. Genetic estimates of contemporary effective population size: what can they tell us about the importance of genetic stochasticity for wild population persistence? Molecular Ecology 17:3428-3447. [CrossRef]
- Peakall, R., and P. E. Smouse. 2012. GenAlEx 6.5: genetic analysis in Excel. Population genetic software for teaching and research—an update. Bioinformatics 28:2537-2539. [CrossRef]
- Pérez-Pereira, N., J. Wang, H. Quesada, and A. Caballero. 2022. Prediction of the minimum effective size of a population viable in the long term. Biodiversity and Conservation 31:2763-2780. [CrossRef]
- Pita, A., M. Pérez, F. Velasco, and P. Presa. 2017. Trends of the genetic effective population size in the Southern stock of the European hake. Fisheries research 191:108-119. [CrossRef]
- Sonneveld, B., F. Thoto, D. Houessou, and L. Wesenbeeck. 2019. Tragedy of the inland lakes. International Journal of the Commons 13:609–636. [CrossRef]
- Sovic, M., A. Fries, S. A. Martin, and H. Lisle Gibbs. 2019. Genetic signatures of small effective population sizes and demographic declines in an endangered rattlesnake, Sistrurus catenatus. Evolutionary Applications 12:664-678. [CrossRef]
- United Nations-Department of Economic and Social Affairs-Population Division. 2019. World population prospects 2019: Highlights (st/esa/ser. A/423).
- Waples, R. S., T. Antao, and G. Luikart. 2014. Effects of overlapping generations on linkage disequilibrium estimates of effective population size. Genetics 197:769-80. [CrossRef]
- Waples, R. S., and C. Do. 2008. LDNE: a program for estimating effective population size from data on linkage disequilibrium. Molecular Ecology Resources 8:753-6. [CrossRef]
- Waples, R. S., and C. H. I. Do. 2010. Linkage disequilibrium estimates of contemporary Ne using highly variable genetic markers: a largely untapped resource for applied conservation and evolution. Evolutionary Applications 3:244-262. [CrossRef]
- Waples, R. S., and P. R. England. 2011. Estimating contemporary effective population size on the basis of linkage disequilibrium in the face of migration. Genetics 189:633-644. [CrossRef]
- Wikondi, J., E. P. J. Ngono, A. T. Nana, F. Meutchieye, and M. E. T. Tomedi. 2023. Farming Features of African Bonytongue Fish Heterotis niloticus in Cameroon, Central Africa. Open Journal of Animal Sciences 13:232-248. [CrossRef]
- Wood, J. L. A., M. C. Yates, and D. J. Fraser. 2016. Are heritability and selection related to population size in nature? Meta-analysis and conservation implications. Evolutionary Applications 9:640-657. [CrossRef]
- Yem, I. Y., A. O. Sani, N. O. Bankole, H. U. Onimisi, and Y. M. Musa. 2007. Over fishing as a factor responsible for declined in fish species diversity of Kainji, Nigeria. 21st Annual Conference of the Fisheries Society of Nigeria (FISON), Calabar, Nigeria. 79-85. Available from http://hdl.handle.net/1834/37723.
Figure 1.
Map of the study area depicting sampled localities in Benin, Nigeria, and Cameroon. Collectively, the pink pins represent the Ouemé-Sô river floodplain system.
Figure 1.
Map of the study area depicting sampled localities in Benin, Nigeria, and Cameroon. Collectively, the pink pins represent the Ouemé-Sô river floodplain system.
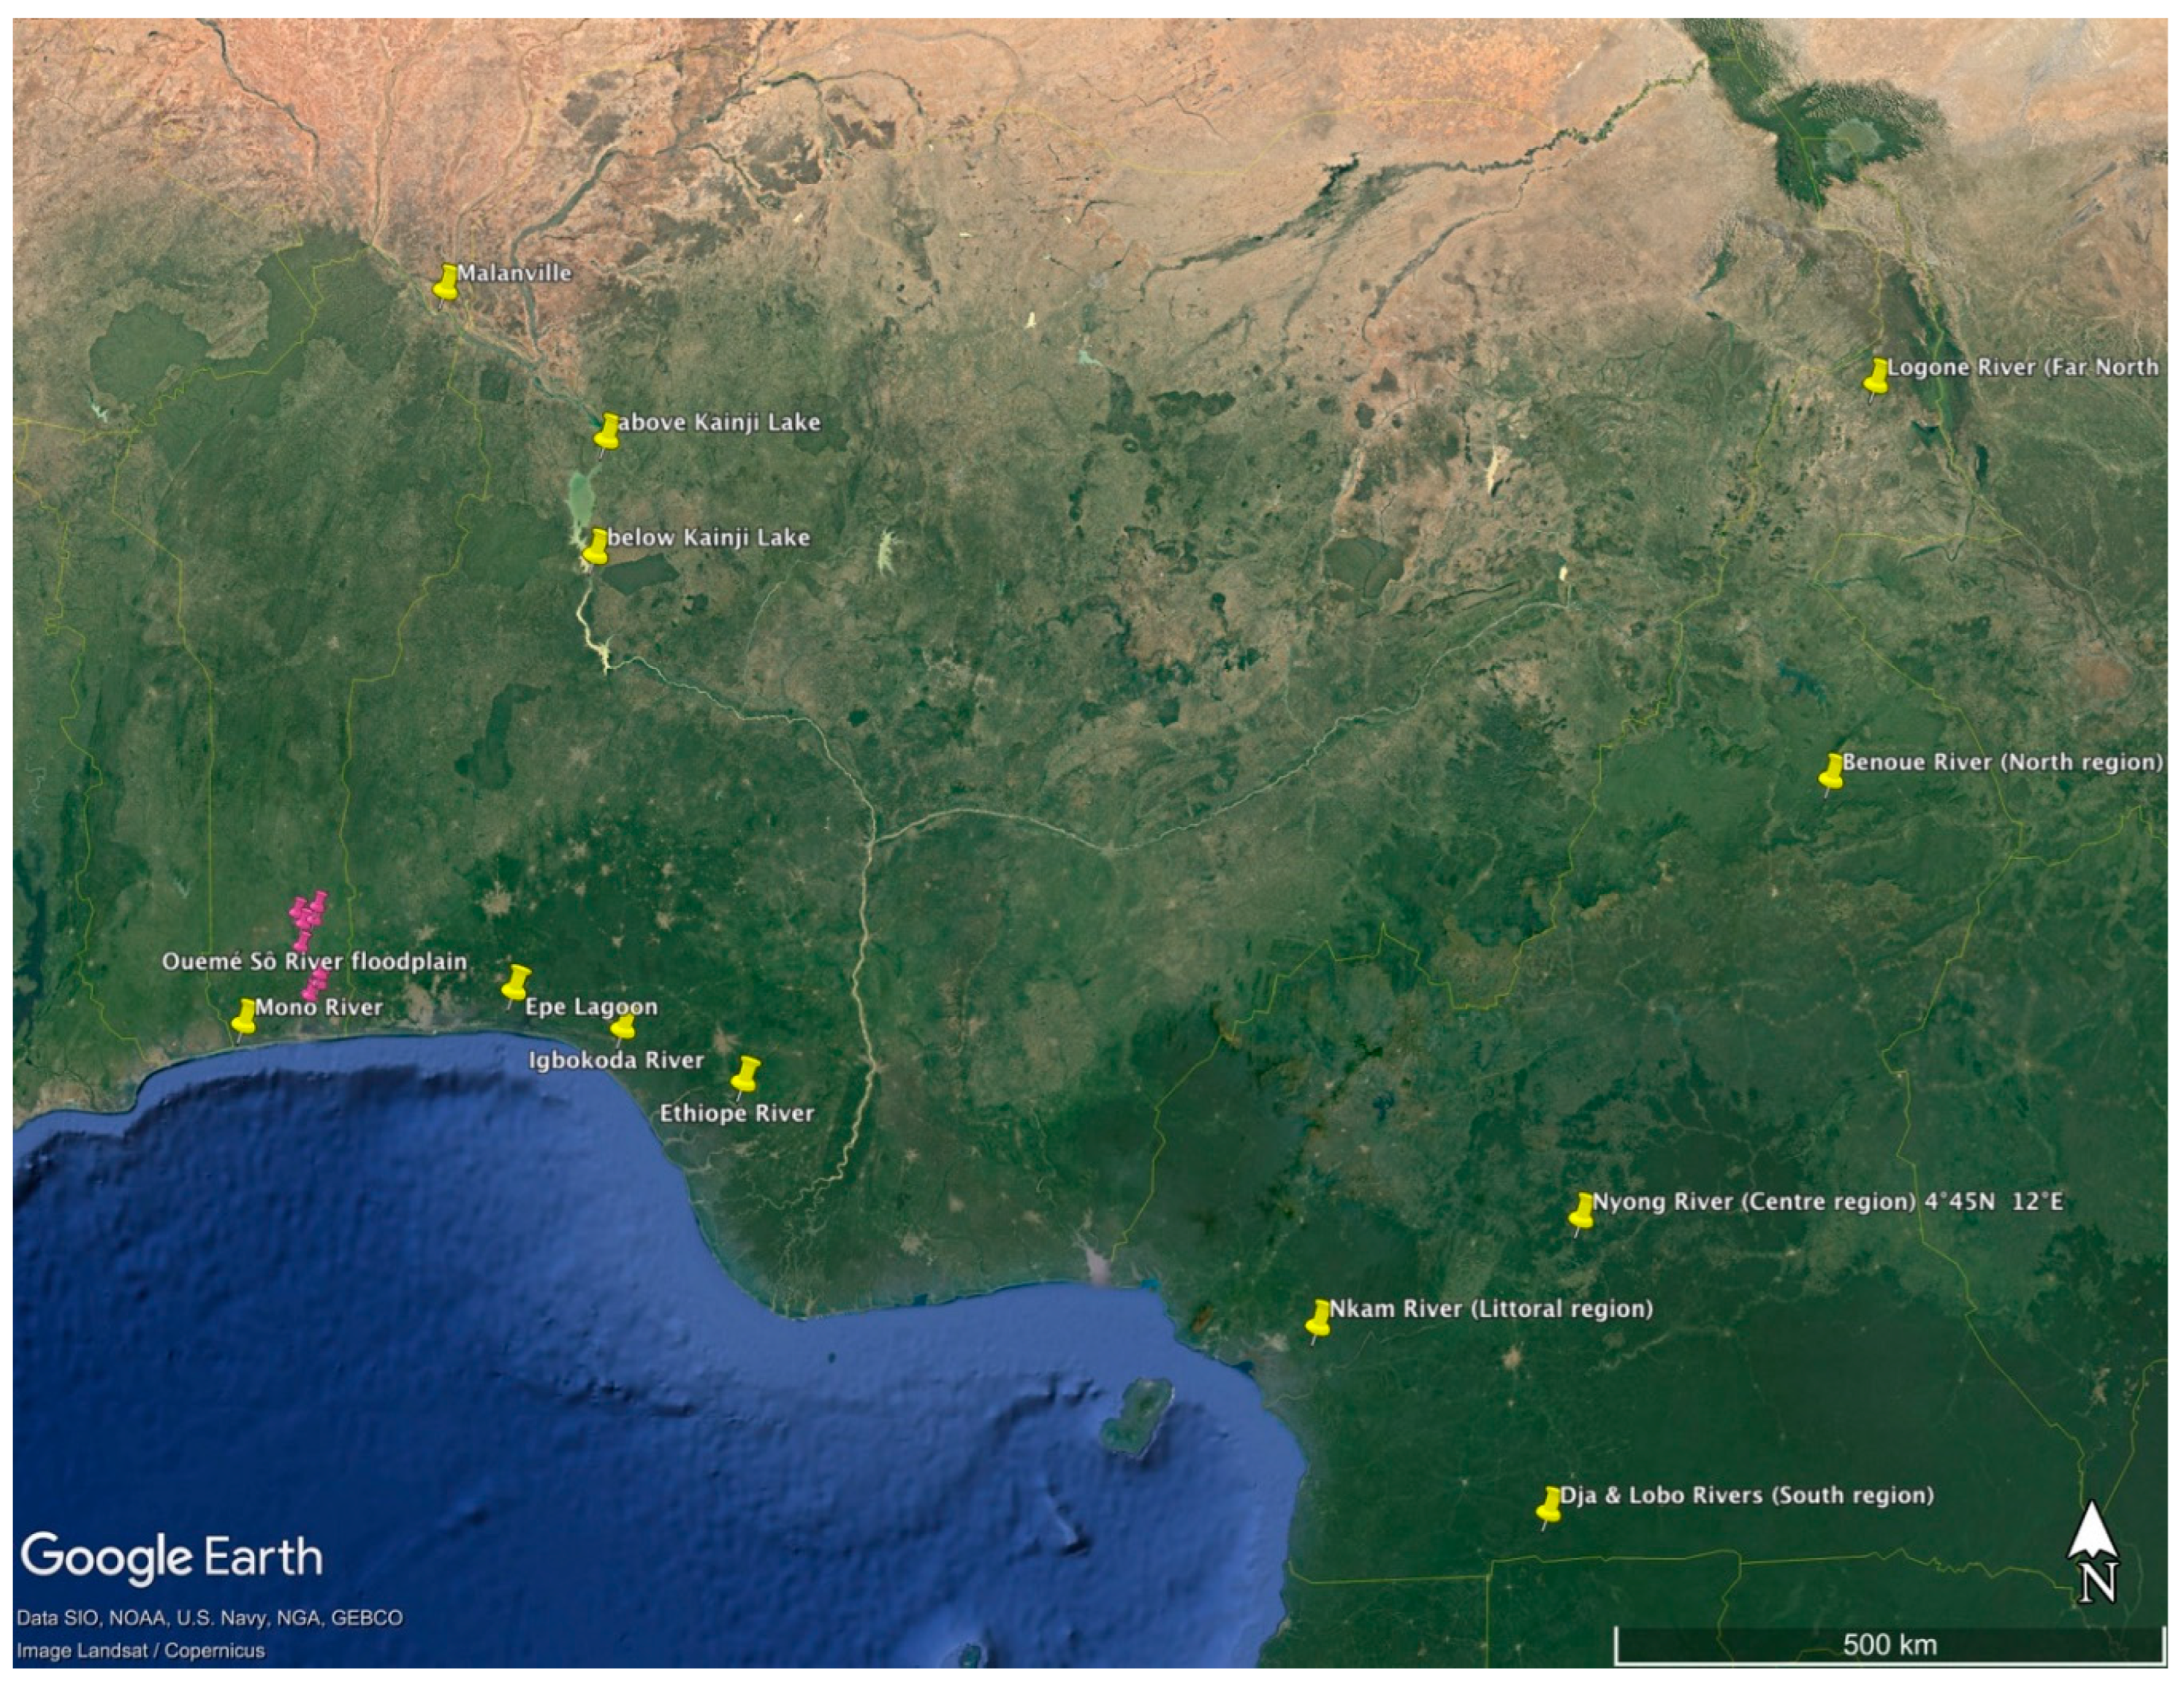

Table 1.
Inland waters capture production in Africa, Nigeria and Benin of live weight.
| Production (average per year) | * Yearly Production * | |||||||||
| Region | 1980s | 1990s | 2000s | 2010s | 2017 | 2018 | 2019 | 2020 | 2021 |
Percentage of world’s total for 2020 |
| Africa – inland | 1.47M | 1.89M | 2.33M | 2.87M | 3.01M | 3.02M | 3.24M | 3.21M | 3.49M | 28 |
| Africa - Heterotis | 5,961 | 12,653 | 23,876 | 31,815 | 29,257 | 28,649 | 27,818 | 27,777 | ||
|
Nigeria – inland % of Africa |
100,513 (6.8%) |
104,173 (5.3%) |
210,970 (9.01%) |
350,175 (12.2%) |
420,078 (14.0%) |
392,188 (12.9%) |
373,344 (11.4%) |
354378 (10.9%) |
362,792 (10.4%) |
3 (9th globally) |
|
Nigeria –Heterotis % of Africa |
4,770 (80.0%) |
10,877 (86.0%) |
20,606 (86.3%) |
27,896 (87.7%) |
25,689 (87.8%) |
24,626 (86.0%) |
23,375 (84.0%) |
23,875 (86.0%) |
||
| Benin - inland | 31,823 | 31,830 | 28,664 | 28,969 | 33,415 | 28,900 | 28,775 | 28,815 | 29,000 | |
| Benin - Heterotis | 421 | 565 | 564 | 791 | 853 | 1398 | 925 | 1,085 | 1,095 | |
M = million tonnes of live weight.
Table 3.
Pairwise genetic differentiation for Cameroon populations of Heterotis niloticus.
| Comparison | Genetic differentiation test | ||||||
| Pop1 | Pop2 | Fst | Gst | G'st(Nei) | G'st(Hed) | G''st | Dest |
| Centre | South | 0.041 | 0.024 | 0.047 | 0.079 | 0.101 | 0.057 |
| Centre | Littoral | 0.035 | 0.023 | 0.045 | 0.082 | 0.103 | 0.061 |
| South | Littoral | 0.049 | 0.031 | 0.060 | 0.097 | 0.124 | 0.068 |
| Centre | North | 0.047 | 0.035 | 0.068 | 0.162 | 0.191 | 0.132 |
| South | North | 0.083 | 0.066 | 0.124 | 0.264 | 0.309 | 0.212 |
| Littoral | North | 0.051 | 0.039 | 0.075 | 0.169 | 0.200 | 0.136 |
| Centre | Far-North | 0.088 | 0.076 | 0.142 | 0.320 | 0.368 | 0.264 |
| South | Far-North | 0.129 | 0.111 | 0.201 | 0.410 | 0.469 | 0.336 |
| Littoral | Far-North | 0.072 | 0.060 | 0.113 | 0.239 | 0.282 | 0.190 |
| North | Far-North | 0.059 | 0.046 | 0.089 | 0.244 | 0.278 | 0.207 |
P-values for Fst, Gst, G'st(Nei), G''st, Dest: p = 0.011 for Centre vs South comparisons; p = 0.001 for all other comparisons P-values for G'st(Hed): p = 0.002 for all comparisons.
Table 2.
Effective population size (Ne) point estimates and 95% Confidence Intervals (CI) under three assumptions of allele frequencies: Minimum Allele Frequency (MAF) = 0.05; MAF =0.02; and no singletons. Ne point estimates corrected for age structure, under adult life span (AL) values of 9–4 (see text), are provided in parenthesis.
| Population |
Raw Ne (Corrected Ne assuming AL = 9–4) 95% CI Parametric of raw Ne 95% CI Jackknife of raw Ne |
||
| MAF = 0.05 | no singletons | MAF = 0.02 | |
| Nigeria Populations: | |||
| Kainji Lake | 23.7(25.6–32.3) | 27.7(30.0–37.7) | 44.3*(47.9–60.4) |
| 14.2–48.9 | 18.1–49.3 | 27.6–93.0 | |
| 9.3–278.0 | 11.6–281.0 | 20.9–333.7 | |
| Epe Lagoon | 23.1(25.0–31.5) | 18.1*(19.6–24.7) | |
| 11.3–84.4 | 10.5–38.8 | ||
| 8.4–∞ | 7.2–116.6 | ||
| Igbokoda1 | ∞ | ∞ | ∞* |
| 21.5–∞ | 21.5–∞ | 242.0–∞ | |
| 14.9– ∞ | 14.9– ∞ | 62.3–∞ | |
| Igbokoda2 | 288.0(311.6–392.3) | ∞* | |
| 18.5–∞ | 4703.4–∞ | ||
| 11.6–∞ | 180–∞ | ||
| Ethiope River | 42.2(45.7–57.5) | 56.5*(61.1–77.0) | |
| 15.6– ∞ | 19.6– ∞ | ||
| 8.2– ∞ | 13.7– ∞ | ||
| Benin Populations: | |||
| Ouemé–Sô River fldp. | 92.1(99.7–125.5) | 266.1(287.9–362.5) | 179.5(194.2–244.5) |
| 69.5–125.8 | 196.5–390.4 | 131.3–262.9 | |
| 44.2–250.1 | 137.8–947.8 | 78.9–1031.0 | |
| Mono River | 22.9(24.8–31.2) | 28.7*(31.1–39.1) | |
| 9.2–904.8 | 12.4–662.8 | ||
| 9.1–2310.1 | 9.8–∞ | ||
| Malanville | 27.0(29.2–36.8) | 25.5*(27.6–34.7) | |
| 3.0–∞ | 4.7–∞ | ||
| 2.1–∞ | 10.0–∞ | ||
| Cameroon Populations: | |||
| Benoue River (North) | 48.0(51.9–65.4) | 56.2(60.8–76.6) | 63.7*(68.9–86.8) |
| 19.1–∞ | 21.6–∞ | 24.4–∞ | |
| 14.6–∞ | 17.3–∞ | 23.0–∞ | |
| Logone Riv. (Far-North) | 61.3(66.3–83.5) | 103.2*(111.7–140.6) | |
| 17.1–∞ | 22.7–∞ | ||
| 11.1–∞ | 17.5–∞ | ||
| Nkam River (Littoral) | ∞ | ∞ | ∞* |
| 36.3–∞ | 82.9–∞ | 32.1–∞ | |
| 11.3– ∞ | 24.4– ∞ | 31.1–∞ | |
| Dja & Lobo Riv. (South) | 2.6(2.8–3.5) | 2.6*(2.8–3.5) | |
| 1.2–18.3 | 1.4–11.9 | ||
| 0.7–∞ | 1.3–14.7 | ||
| Nyong River (Centre) | ∞ | ∞* | |
| 23.1– ∞ | 26.5– ∞ | ||
| 12.6– ∞ | 15.7– ∞ | ||
* Results using MAF = 0.01 and 0+ were identical; 1 including all loci; 2 removing monomorphic locus H45.
Disclaimer/Publisher’s Note: The statements, opinions and data contained in all publications are solely those of the individual author(s) and contributor(s) and not of MDPI and/or the editor(s). MDPI and/or the editor(s) disclaim responsibility for any injury to people or property resulting from any ideas, methods, instructions or products referred to in the content. |
© 2023 by the authors. Licensee MDPI, Basel, Switzerland. This article is an open access article distributed under the terms and conditions of the Creative Commons Attribution (CC BY) license (http://creativecommons.org/licenses/by/4.0/).
Copyright: This open access article is published under a Creative Commons CC BY 4.0 license, which permit the free download, distribution, and reuse, provided that the author and preprint are cited in any reuse.


