
Submitted:
13 May 2025
Posted:
13 May 2025
You are already at the latest version
Abstract
Sustainable aquaculture in sub-Saharan Africa depends on the reliable supply of native Tilapia fingerlings, as reliance on exotic strains threatens biodiversity through hybridization and ecological competition. This study aimed to assess the reproductive performance of three founder populations of Oreochromis andersonii maintained in captivity for varying durations, to inform selective breeding and fingerling production strategies. A total of 513 fish from the NARDC population (over 10 years in captivity), Super Upper Zambezi (SUZ; 5 years), and Luangwa (LUA; 8 months) were reared in sex-segregated hapas under standardised conditions and later bred in intra-population pairs in smaller breeding hapas at a 2:1 female-to-male ratio. LUA fish had the lowest final body mass and condition factor, while NARDC and SUZ were similar and significantly higher. Although the gonadosomatic index varied across groups, pairwise differences between LUA and the other populations were not statistically significant. LUA exhibited the lowest relative fecundity and hatchability but had the highest percentage of females that spawned. These findings suggest that longer domestication periods improved body mass and hatchability, supporting NARDC and SUZ as suitable sources for immediate fingerling production. However, LUA’s higher spawning participation highlights its potential role in maintaining reproductive traits and genetic diversity within selective breeding programs.
Keywords:
Reproductive performance
; Fecundity
; Selective breeding
; domestication
; fecundity
; Tilapia
1. Introduction
Globally, aquaculture is recognised as the fastest-growing industry, and Zambia has followed a similar trajectory. Over the past decade, the country has tripled its production, becoming the fifth-largest aquaculture producer by volume in Africa [1]. This growth is attributed to various government and international agency interventions. Notably, in 2017, the government launched the Zambia Aquaculture Enterprise Development Project (ZAEDP) in partnership with the African Development Bank (AFDB), investing approximately 50 million USD [2].
A key objective of the project was to make fish farming profitable and sustainable nationwide by funding initiatives across the aquaculture value chain. It also aimed to reduce reliance on the exotic Nile tilapia (Oreochromis niloticus), which accounts for over 60% of Zambia’s commercial aquaculture [3]. Most farms are in Southern Zambia, where its culture is legally permitted under the Fisheries Act No. 22 of 2011 [4]. However, in other regions where the exotic species is prohibited (Eastern, Western, and Northern Zambia), farmers have resorted to illegally translocating or importing Nile tilapia, driven by a shortage of quality native fingerlings and the superior performance of the exotic species [5,6]. This illegal trade raises sustainability concerns, including the risk of Tilapia Lake Virus [7], and threatens native tilapia conservation through gene pool erosion mediated by hybridisation and ecological competition [8].
To address these challenges, the ZAEDP project launched a genetic improvement program (GIP) for the indigenous Oreochromis andersonii, receiving technical support from WorldFish, an organisation with decades of experience in developing genetically improved farmed tilapia (GIFT). The program, which ran from 2020 to 2023, aimed to develop a more resilient and productive strain of native tilapia. Following its completion, efforts continued under a new African Development Bank (AFDB) regional initiative, the Programme for Improving Fisheries Governance and Blue Economy Trade Corridors in the SADC Region (PROFISHBLUE), implemented by the Southern African Development Community (SADC) Secretariat. Similar initiatives are ongoing, with the shared goal of providing high-quality indigenous fingerlings to farmers. For example, the Zambia Aquaculture Program (ZAP), funded by the European Union, includes a genetic improvement component focusing on Oreochromis macrochir, another native tilapia species found in Zambia’s northern and central regions [9].
These collective efforts have significantly contributed to the rapid expansion of Zambia’s aquaculture industry, positioning it as one of the fastest-growing sectors in Africa. In 2022, Zambia was the second-highest contributor to the 2.2% increase in African aquaculture, following Ghana, with Tanzania and Rwanda in third and fourth place, respectively [10]. However, to sustain this growth, further research is needed on native tilapia species, particularly on their reproductive performance.
A comprehensive understanding of reproductive performance is vital for maintaining a steady supply of high-quality fingerlings in sufficient quantities that meet market demand. In addition, assessing the reproductive traits of founder stocks for selective breeding programs is important in order to understand the reproductive strengths and weaknesses of each population being used. High fertility, proper spawning behaviour, and strong fry survival rates are essential traits in the founder stock. In this study, we evaluated the reproductive performance of three Oreochromis andersonii founder populations, a species considered the most suitable native tilapia for aquaculture in Zambia, as cited in Basiita et al. [5]. We hypothesised that differences in reproductive performance among the three populations would primarily be influenced by domestication time, whereas similarities would be as a result of uniform conditioning and management.
2. Materials and Methods
Three previously hydrogeographically isolated populations were used in this study: the National Aquaculture Research Development Centre (NARDC), which had been maintained at the station for over ten years; the Super Upper Zambezi (SUZ) population, collected from the wild and held at the research station for five years; and the Luangwa (LUA) population, collected from the wild eight months before the study began. The LUA and SUZ populations were approximately 1,080 kilometres apart, with the NARDC population located midway (Figure 1).
2.1. Experimental Design
A total of 513 fish (322 females and 191 males) were used in this study. Prior to conditioning, fish had an initial body mass ranging from 80-100 grams and were approximately three months old, except for the LUA population, whose exact age was unknown. LUA individuals were collected as immature fish and were unlikely to have previously spawned in the wild. The fish were tagged with passive integrated transponders (PIT), which assigned each fish a unique alphanumeric code. This was done to maintain track of individual broodstock in each population. Following tagging, the fish were placed in six hapas measuring 4m x 25m x 1.5m (width, length, and depth) based on population and sex.
2.2. Broodstock Nutrition and Management
All hapas were placed in one pond measuring 25 m x 40 m. To ensure the broodstock received a nutritionally complete diet, proximate analysis was conducted on the commercial feed to verify the manufacturer's declared nutritional composition. Proximate analyses were carried out at the Zambia Bureau of Standards (ZABS) laboratory, following the methods of the Association of Official Analytical Chemists (AOAC, 1990) [11] for parameters shown in Table 1. Based on the results, most nutrient levels were comparable and within the optimal ranges for tilapia broodstock [12,13], except for crude fat, where our lab analysis found a lower amount compared to literature recommendations for optimum tilapia broodstock diets [12]. To address this deficiency, squid oil was sprayed onto the feed pellets before feeding to raise the fat content. Squid oil has been shown to enhance reproductive performance and spawning success in various fish species, including tilapias [14,15,16].
2.3. Water Quality Parameters
Water quality measurements were taken twice daily at 7 a.m. and 2 p.m. using an 86031 Multiple Parameters Water Tester (AZ Instrument Corp, Taichung, Taiwan). To ensure that the values were consistently within acceptable ranges for Oreochromis andersonii broodstock [17]. If any deviations were observed, appropriate mitigation measures were immediately implemented, such as aeration and introducing fresh water into the ponds. The mean water quality values over six months are presented in Table 2.
2.4. Pairing for Breeding, Condition Factor and Batch Fecundity Estimation
After six months of broodstock conditioning, the fish were evaluated for spawning readiness. The mature fish were weighed (Wt), and their total length (L) was measured to calculate the condition factor (K) using the formula K = 100 × Wt/L³ [18].
The average body mass of broodstock selected for mating was 158.67 ± 0.096 g for females and 125.02 ± 0.067 g for males (Mean ± SD). Only females weighing more than 150g were used, as this threshold is considered optimal for reproductive performance in tilapia broodstock [19]. Females were paired with males of similar body mass at a 2:1 female-to-male ratio. The mating pairs were stocked in hapas measuring 2 m × 1 m × 1 m (width × length × depth). 40 pairs were set for LUA, 44 pairs for NARDC and 47 pairs for SUZ. The number of pairs set per population and the sex ratio were based on the number of mature fish per population at the time of pairing.
additionally, 40 fish per population were killed with an overdose of clove powder suspension, then the gonads were excised and weighed using an analytical balance (Mettler Toledo, Giessen, Germany) to calculate the gonadal somatic index (GSI), using the equation GSI = (gonad weight/total body weight) * 100 [20]. The ovaries were then placed in 10% formalin for preservation to later determine the batch fecundity by counting the number of hydrated oocytes as described by Hunter et al. [21].
2.5. Relative Fecundity, Percentage of Spawned Females, and Hatching Efficiency
Following pairing, females were inspected weekly for eggs over eight weeks. Eggs were gently removed by carefully opening the mouths of brooding females over a bowl. The eggs were then cleaned with a 10 ppt sodium chloride solution and counted. The egg counts were used to estimate the relative fecundity (number of eggs per gram of female). Additionally, the number of females that spawned was recorded to calculate the percentage of spawned females (%SF) using the equation %SF = (total number of spawned females / total paired females) × 100. During incubation, hatchery conditions were similar for all the populations. Eggs in the jars were regularly monitored, with dead eggs removed and their numbers recorded. At the end of the incubation period, the total number of hatched eggs was recorded to calculate the hatchability percentage(H) using the equation H = (total hatched eggs / hatched + unhatched + dead eggs) × 100.
2.6. Statistical Analysis
Statistical analyses were conducted using SPSS (version 23). Data normality was assessed with the Shapiro-Wilk test, and homogeneity of variance using Levene's test. All data (Body mass, Total Length, Condition Factor, Gonadal Somatic Index, Relative Fecundity, and Batch Fecundity) did not meet the assumption of normality; therefore, Kruskal-Wallis was used to test for statistical differences. Dunn's pairwise comparison with Bonferroni correction was performed for significant Kruskal-Wallis results to determine which mean was different. Visualisations were generated using the R package ggplot2. The ggpubr and ggsignif packages were used to annotate statistical significance and visualise pairwise comparisons on the box plots. Results were considered significant at P ≤ 0.05.
3. Results
3.1. Body Mass and Total Length of the Broodstock Before Pairing
The body mass and total length of broodstock from each population were measured after six months of conditioning and are presented in Table 3. The results showed that LUA had 40% significantly lower final body mass than NARDC and SUZ, whilst the total length did not differ significantly across populations.
3.2. Condition Factor and Gonadal Somatic Index of Broodstock Before Pairing
The Condition Factor was calculated to determine the physiological status or degree of nourishment of the broodstock after the six-month conditioning period, as well as the gonadal somatic index (GSI) to gauge the broodstock's maturity and spawning readiness, presented in Figure 2. The Kruskal-Wallis test detected significant differences (P ≤ 0.05) in Condition Factor between the populations. The LUA population was significantly lower compared to NARDC and SUZ, whilst NARDC and SUZ were not statistically significant (Figure 2a). Similarly, GSI was also significant (P=0.03); however, further, Dunn post hoc pairwise comparison showed that LUA was not statistically different from NARDC and SUZ (Figure 2b).
3.3. Relative and Batch Fecundity
The Kruskal-Wallis H test showed significant differences in the relative fecundity of the three populations. Further, Dunn post hoc pairwise comparison showed that LUA significantly differed from the NARDC and SUZ populations, whilst the NARDC and SUZ populations were not statistically different (Figure 3a). Interestingly, there was no significant difference in the batch fecundity of the three populations (Figure 3b).
3.4. Percentage of Spawned Females and Egg Hatchability
The percentage of Oreochromis andersonii broodstock that spawned from the total number of pairs set per population was calculated. The results showed that the LUA population had the highest rate of spawning females (Figure 4a). In addition, the hatchability of the spawned eggs was also analysed. Conversely, the LUA population had the lowest hatchability percentage, while SUZ was highest, followed by NARDC (Figure 4b).
4. Discussion
Several factors have been reported to influence tilapia's reproductive performance, with environmental conditions such as temperature, photoperiod, water quality, and nutrition being significant [22,13]. In this study, these conditions were similar across three populations of Oreochromis andersonii (LUA, NARDC, SUZ), and broodstock received a nutritionally complete diet. This ensures that any observed differences in reproductive performance among the populations can be attributed to domestication time, population origin, or genetic differences, while the lack of differences would be associated with uniform later-life conditioning. This study provides critical insights into the reproductive performance of Oreochromis andersonii in real aquaculture settings.
4.1. Pre-Spawning Condition of Broodstock
There were notable differences in the broodstock's body mass after six months of conditioning among the populations (Table 3). The LUA population exhibited the lowest final body mass, being 40% lower in comparison to both NARDC and SUZ. We anticipated that the LUA population would attain a comparable final body mass to that of the other populations, given that their initial body mass before conditioning was within a similar range. Furthermore, if the LUA population had been pre-stunted before their inclusion in this study, due to factors such as limited food availability, predation, and competition in the wild, it was still expected that they would achieve final body mass similar to NARDC and SUZ through the process of compensatory growth. Compensatory growth is defined as a phenomenon where previously deprived fish, upon receiving an ample supply of high-quality feed, demonstrate exponential growth to attain their respective age-weight [23]. The lack of compensatory growth in the LUA population may be attributed to their shorter duration of domestication, which implies that they were still in the process of acclimatising to the aquaculture environment. In contrast, NARDC and SUZ had already been acclimatised to the aquaculture environment for over 10 and 5 generations, respectively. The LUA population was introduced to aquaculture only 8 months before the study; therefore, the first generation in the aquaculture environment. Acclimatisation to aquaculture involves confinement, adaptation to formulated feeds, and adjustment to human husbandry practices [24]. All these elements can significantly affect the feeding efficiency of newly introduced fish, in turn impacting their weight gain and ultimately their condition factor (K), which serves as a quantitative measure for evaluating the relative level of nourishment [25]. Notably, the LUA population also displayed the lowest condition factor (K = 1.2) in comparison to NARDC and SUZ (both K ~1.8) (Figure 2a). These results show that domestication time has a clear impact on the condition factor and consequently the body mass gain of Oreochromis andersonii. In the present study, the population with the longest domestication time (NARDC) had the best condition factor and achieved the greatest final body mass.
The Kruskal-Wallis test revealed significant differences in the gonadal somatic index (GSI) among the three populations. However, post hoc Dunn pairwise comparisons showed no significant differences between LUA versus NARDC or SUZ (Figure 2b). The gonadosomatic index (GSI) reflects the proportion of energy allocated to gonadal development relative to somatic growth, serving as an indicator of reproductive investment [26]. GSI is a valuable measure for comparing reproductive maturity, as it accounts for body size differences by expressing gonad weight relative to an individual's total body weight. This result indicates that the LUA population invested energy in reproduction as efficiently as the NARDC and SUZ populations, despite being new to the aquaculture environment and likely disadvantaged during the early conditioning periods due to possible acclimation adjustments.
4.2. Relative and Batch Fecundity
Our results revealed borderline significant differences in the relative fecundity of the three populations (P = 0.05). Dunn pairwise comparison showed that LUA had significantly lower relative fecundity (P ≤ 0.05) than NARDC and SUZ (Figure 3a). These findings align with Mohamed et al. [27], who similarly reported reduced relative fecundity in Oreochromis mossambicus with decreasing broodstock size. In our study, LUA broodstock were approximately 40% smaller than those of NARDC and SUZ (Table 3). However, our results are contrary to those of Elsherbeny [28], who found higher relative fecundity in smaller Oreochromis niloticus broodstock. This discrepancy may be explained by domestication history: unlike our study, Elsherbeny [28] examined fish from a single, equally domesticated population, all similarly acclimatised to aquaculture conditions. In our study, the LUA population may have needed time earlier on to acclimate to aquaculture conditions, hence the observed lower relative fecundity. The NARDC and SUZ populations that were acclimated to the aquaculture environment exhibited no significant difference (p = 0.96) in their relative fecundity.
No significant differences were observed in the batch fecundity among the populations (Figure 3b). Previous studies suggest that batch fecundity is influenced primarily by geographic and environmental factors [29,30]. In this study, all populations experienced similar conditions and underwent a six-month conditioning period, likely neutralising pre-existing differences between populations. Schofield et al. [31] similarly reported no significant differences in batch fecundity in Oreochromis niloticus across different salinity treatments. While their study focused on environmental stress, their results suggest that batch fecundity may be a relatively stable trait. Therefore, it is conceivable that in the present study, where conditions were kept uniform, with only population origin and domestication time as variables, batch fecundity would also not be significantly different across populations.
4.3. Percentage of Spawned Females and Hatchability
Regarding the percentage of spawned females, the results indicated that the LUA population had the highest percentage of spawned females (Figure 4a). These findings could be attributed to two factors. Firstly, broodstock sizes. Previous studies have shown that larger females have a slightly reduced ability to spawn [32]. The NARDC and SUZ populations were 40% larger compared to LUA. Secondly, the longer use of these two populations (NARDC and SUZ) at the aquaculture station could have resulted in reduced reproductive performance over time. In long-term hatchery stocks, this can occur unintentionally. Typically, fish that perform well are selected as broodstock for the next generation, often based on traits such as growth and survival. However, some studies have reported that these traits may be negatively correlated with reproductive success in species like tilapia and rainbow trout [32,33]. Furthermore, several factors can influence the participation of tilapia females in spawning, including temperature, photoperiod, nutrition, and management [34,35]. In the present study, these factors were similar across the populations, which may indicate that the observed differences in spawning participation could be a result of domestication time. In this case, domestication time is inversely related to spawning participation, implying that newly introduced fish in aquaculture from the wild may spawn more readily compared to long-term hatchery populations. This is possibly linked to the reproductive strategy of fishes, including tilapia, to synchronise spawning with periods of food abundance to maximise offspring survival [36]. Given that the LUA population had been recently introduced to aquaculture, the sudden increase in the availability of feed may have functioned as a cue to prioritise spawning. This strategy may be more active in newly captive fishes than in long-term hatchery populations that have been captive for several generations and are already accustomed to abundance and continuous feeding in aquaculture systems.
The SUZ population had the highest hatchability rate (99%). In comparison, the LUA population had the lowest (86%) (Figure 4b). These findings align with Osure & Phelps [37], who reported that recently introduced Nile tilapia populations to aquaculture environments had lower hatch rates and survival to the swim-up stage compared to strains that had been domesticated for 20-30 years. These results highlight the influence of domestication on hatchability and fry survival, with longer domestication periods generally leading to improved offspring hatchability due to better adaptation to aquaculture conditions [37]. The eggs from the LUA population represented the first generation (F1) in the aquaculture environment. Unlike the SUZ and NARDC populations, which had been reared in aquaculture for multiple generations, F1 fish undergo significant phenotypic changes and face natural selection pressures as they adapt to new conditions [38]. These phenotypic changes can increase vulnerability to environmental stressors, often leading to higher mortality rates and lower hatchability [39].
4.4. Fingerling Supply and Selective Breeding Programs
The local aquaculture industry faces the pressing challenge of an insufficient supply of native Oreochromis andersonii fingerlings. The findings of this study offer two practical solutions to address this issue. Firstly, in the short term, fingerling supply can be improved by leveraging the higher fecundity, better condition factor, and superior weight gain performance observed in the SUZ and NARDC populations. These two populations can be utilised and crossbred to provide a reliable and enhanced supply of fingerlings to farmers in Zambia.
Secondly, for a long-term solution, the results present promising opportunities for improving fingerling quality through selective breeding. Each of the three studied populations exhibited distinct strengths that can be harnessed. Selectively breeding these populations could lead to developing a superior strain that combines these desirable traits. Moreover, the observed differences in reproductive performance among the populations suggest underlying genetic variation [40], further supporting their potential in selective breeding programs. However, this study also highlights important trade-offs that hatcheries and selective breeding programs must consider. While introducing wild stock into breeding programs is essential to enhance and maintain genetic diversity in the long term [41,42], it may lead to reduced short-term production efficiency. As observed in the present study, wild populations may exhibit lower performance compared to long-term aquaculture populations before they acclimatise to the aquaculture environment. Therefore, careful planning is required to balance the immediate demands of fingerling production with the long-term goals of genetic sustainability.
5. Conclusions
Our results support the hypothesis that domestication time significantly influences differences in reproductive traits among Oreochromis andersonii populations, as reflected by differences in body mass, hatchability, and female participation in spawning despite similar management. In contrast, the relative similarity observed in gonadal somatic index and fecundity across populations suggests that uniform later-life conditioning may mitigate domestication effects, population origin or underlying genetic differences in these traits. Our results offer promising solutions for addressing the immediate demand for high-quality native tilapia fingerlings. The NARDC and SUZ populations demonstrated superior fecundity and hatchability, making them well-suited for use to meet the immediate local industry's fingerling demand. However, the LUA population, more recently from the wild, exhibited higher spawning efficiency, presenting an opportunity to enhance genetic diversity in long-term breeding programs.
Author Contributions
Buumba Hampuwo: Data collection, writing – original draft, formal analysis, investigation, Alexander Kefi: funding acquisition. Rose Basiita Komugisha: Experiment design. Alexander Kefi, Rose Basiita Komugisha, Jeremiah Kang’ombe, Daud Kassam: First draft revision.
Funding
The research was financed by the African Development Bank, the Government of Zambia [Financing agreement no. 2000200000602]. Partly also by WorldFish through the CGIAR Research Initiative on Resilient Aquatic Food Systems for Healthy People and Planet.
Institutional Review Board Statement
This research was undertaken under the broader Zambia Aquaculture Enterprise Development project. Research approval for the Genetic Improvement Program of the Kafue bream under the Zambia Research Body ECRES CONVERGE IRB no. 00005948 was adhered to, particularly while handling fish (WorldFish, 2004).
Data Availability Statement
All data generated in this research can be made available upon request.
Acknowledgments
The authors express sincere gratitude to the Department of Fisheries staff in Zambia for their invaluable support, especially in collecting wild fish. Special thanks to Mr. Chad Kancheya for providing the SUZ and LUA coordinates and to Yonas Asfaha for the map illustration. We also thank the GIP team from WorldFish and the National Aquaculture Research and Development Centre (NARDC), including Moses Phiri, Sylvester Musonda, Beenzu Gambwe, Trevor Mutondo, Patience Chungu and Tom Malambo, for their dedication to water quality monitoring, fish feeding, broodstock tagging and overall husbandry. This study was conducted as part of the corresponding author's MSc dissertation in Aquaculture at the University of Natural Resources and Life Sciences (LUANAR). The corresponding author extends heartfelt thanks to the ZAEDP project for awarding the scholarship that made this MSc program possible and to LUANAR for its academic supervision. Lastly, we acknowledge WorldFish for their invaluable resources and technical guidance throughout this research.
Conflicts of Interest
The authors declare no conflicts of interest.
References
- Zhang, L., Maulu, S., Hua, F., Chama, M. K. H., & Xu, P. (2023). Aquaculture in Zambia: The Current Status, Challenges, Opportunities and Adaptable Lessons Learnt from China. Fishes, 9(1), 14. [CrossRef]
- African Development Bank (AFDP). (2016). Zambia Aquaculture Enterprise Development Project. Available online: https://www.afdb.org/en/documents/document/zambia-aquaculture-enterprise-development-project-93700 (accessed on 3 March 2025).
- Hasimuna, O. J., Maulu, S., Monde, C., & Mweemba, M. (2019). Cage aquaculture production in Zambia: Assessment of opportunities and challenges on Lake Kariba, Siavonga district. Egyptian Journal of Aquatic Research, 45(3), 281–285. [CrossRef]
- Kaminski, A. M., Genschick, S., Kefi, A. S., & Kruijssen, F. (2018). Commercialization and upgrading in the aquaculture value chain in Zambia. Aquaculture, 493, 355–364. [CrossRef]
- Basiita, R. K., Trinh, T. Q., Sakala, M. E., Chungu, P., Malambo, T., Hampuwo, B., Mwema, C., & Benzie, J. A. H. (2022). Performance of Oreochromis niloticus and Oreochromis andersonii in controlled laboratory conditions in Zambia. Aquaculture Reports, 27, 101338. [CrossRef]
- Simataa, S., & Musuka, C. G. (2013). Impact of Withdrawing Oreochromis niloticus (Nile Tilapia) from Aquaculture Production in Zambia: A Case Study of Solwezi District. International Journal of Aquaculture. [CrossRef]
- Jansen, M. D., Dong, H. T., & Mohan, C. V. (2019). Tilapia lake virus: a threat to the global tilapia industry? Reviews in Aquaculture, 11(3), 725–739. [CrossRef]
- Bbole, I., Cyprian, K., Andrew, M. D., Overson, S., & David, M. L. (2014). Hybridization between non-indigenous Oreochromis niloticus and native Oreochromis species in the lower Kafue River and its potential impacts on fishery. Journal of Ecology and The Natural Environment, 6(6), 215–225. [CrossRef]
- Ministry of Fisheries and Livestock (MoFL). (2024). Zambia Aquaculture Program. Available online: https://www.mfl.gov.zm/?page_id=404 (accessed on 6 March 2025).
- FAO. The State of World Fisheries and Aquaculture 2024. Blue Transformation in Action. Rome. [CrossRef]
- Association of Official Analytical Chemists. (2000). Official methods of analysis of the Association of Official Analytical Chemists (Vol. 11).
- Izquierdo, M. S., Fernandez-Palacios, H., & Tacon, A. G. J. (2001). Effect of broodstock nutrition on reproductive performance of fish. Aquaculture, 197(1-4), 25-42. [CrossRef]
- Engdaw, F., & Geremew, A. (2024). Broodstock nutrition in Nile Tilapia and its implications on reproductive efficiency. Frontiers in Aquaculture, 3, 1281640. [CrossRef]
- Hernandez de-Dios, M. A., Tovar-Ramírez, D., Maldonado García, D., Galaviz-Espinoza, M. A., Spanopoulos Zarco, M., & Maldonado-García, M. C. (2022). Functional Additives as a Boost to Reproductive Performance in Marine Fish: A Review. Fish, 7(5), 262. [CrossRef]
- Hossain, M. S., Moniruzzaman, M., Parvin Rumki, S., Kumar Saha, T., Matiur Rahman, M., Bai, S. C., Min, T., & Hossain, Z. (2024). Effects of dietary squid oil on breeding performance and embryonic and larval development of butter catfish Ompok pabda. Heliyon, 10(2), e24995. [CrossRef]
- Torsabo, D., Ishak, S. D., Noordin, N. M., Koh, I. C. C., Abduh, M. Y., Iber, B. T., Kuah, M.-K., & Abol-Munafi, A. B. (2022). Enhancing Reproductive Performance of Freshwater Finfish Species through Dietary Lipids. Aquaculture Nutrition, 2022, 1–13. [CrossRef]
- Boyd, C. E. (2017). General relationship between water quality and aquaculture performance in ponds. In Fish diseases (pp. 147-166). Academic Press. [CrossRef]
- Froese, R. (2006). Cube law, condition factor and body mass–length relationships: history, meta-analysis and recommendations. Journal of applied ichthyology, 22(4), 241-253. [CrossRef]
- Bhujel, R. C. (2000). A review of strategies for the management of Nile tilapia (Oreochromis niloticus) broodstock in seed production systems, especially hapa-based systems. Aquaculture, 181(1–2), 37–59. [CrossRef]
- Ricker, W.E. Computation and interpretation of biological statistics of fish populations. Fish. Res. Board Can. Bull. 1975, 191, 1–382. [Google Scholar]
- Hunter, J.R.; Lo, N.C.; Leong, R.J. Batch fecundity in multiple spawning fishes. NOAA Technical Report Nmfs 1985, 36, 67–77. [Google Scholar]
- Sumon, M. A. A., Molla, M. H. R., Hakeem, I. J., Ahammad, F., Amran, R. H., Jamal, M. T., ... & Hasan, M. T. (2022). Epigenetics and probiotics application toward the modulation of fish reproductive performance. Fishes, 7(4), 189. [CrossRef]
- Ali, M., Nicieza, A., & Wootton, R. J. (2003). Compensatory growth in fishes: a response to growth depression. Fish and Fisheries, 4(2), 147–190. [CrossRef]
- Lu, Y., Shi, C., Jin, X., He, J., & Yin, Z. (2022). Domestication of farmed fish via the attenuation of stress responses mediated by the hypothalamus–pituitary–inter-renal endocrine axis. Frontiers in Endocrinology, 13. [CrossRef]
- Ferdous Jerin, J., Akther, S., Debnath, J., & Saha, D. (2023). Length-Body mass Relationships and Condition Factor of Four Threatened Riverine Catfish Species in the Meghna River Estuary, Bangladesh. Journal of Applied Ichthyology, 2023, 1–4. [CrossRef]
- Caballero-Huertas, M., Frigola-Tepe, X., Viñas, J., & Muñoz, M. (2022). Somatic condition and reproductive potential as a tandem in European sardine: an analysis with an environmental perspective in the northern adriatic (Gulf of trieste). Fishes, 7(3), 105. [CrossRef]
- Mohamed, A. H., Traifalgar, R. F. M., & Serrano, A. E. (2013). Maternal size affects fecundity of saline-tolerant tilapia Oreochromis mossambicus (Peters) in freshwater tanks. Annals of Biological Research, 4(3), 138-142. https://www.scholarsresearchlibrary.com/.
- Elsherbeny, A. (2015). Effect of Brood Stock Size Combination on Reproductive Performance of Nile Tilapia (Oreochromis niloticus). Journal of Animal, Poultry & Fish Production, 4(1), 1–5. [CrossRef]
- Orlando, T. M., Oliveira, M. M. de, Paulino, R. R., Costa, A. C., Allaman, I. B., & Rosa, P. V. (2017). Reproductive performance of female Nile tilapia (Oreochromis niloticus) fed diets with different digestible energy levels. Revista Brasileira de Zootecnia, 46(1), 1–7. [CrossRef]
- Silva, A. C. F., Corrêa Filho, R. A. C., Ventura, A. S., Nunes, A. L., Laice, L. M., Ribeiro, R. P., Oliveira, C. A. L., Almeida, L. C., Barbosa, P. T. L., & Povh, J. A. (2020). Reproductive traits in different Nile tilapia genetic groups. Arquivo Brasileiro de Medicina Veterinária e Zootecnia, 72(5), 1797–1804. [CrossRef]
- Schofield, P. J., Peterson, M. S., Lowe, M. R., Brown-Peterson, N. J., & Slack, W. T. (2011). Survival, growth, and reproduction of non-indigenous Nile tilapia, Oreochromis niloticus (Linnaeus 1758). I. Physiological capabilities in various temperatures and salinities. Marine and Freshwater Research, 62(5), 439. [CrossRef]
- Trọng, T. Q., van Arendonk, J. A., & Komen, H. (2013). Genetic parameters for reproductive traits in female Nile tilapia (Oreochromis niloticus): I. Spawning success and time to spawn. Aquaculture, 416, 57-64. [CrossRef]
- Osure, G. O., & Phelps, R. P. (2006). Evaluation of reproductive performance and early growth of four strains of Nile tilapia (Oreochromis niloticus, L) with different histories of domestication. Aquaculture, 253(1–4), 485–494. [CrossRef]
- Gonçalves, T. G., da Silva Ataides, K., Carvalheiro, R., Nova, F. A. P. C., & Neto, R. V. R. (2024). Genetic parameter estimates indicate the possibility of genetic gain by selecting for reproductive traits of females from a commercial tilapia population (Oreochromis niloticus). Aquaculture, 586, 740818. [CrossRef]
- Coward, K. (1997). Aspects of the reproductive biology and endocrinology of the substrate-spawning cichlid Tilapia zillii. Available online: http://hdl.handle.net/1893/415.
- Tave, D. (1999). Inbreeding and brood stock management (Vol. 392). Food & Agriculture Organisation.
- Dunham, R. A., Majumdar, K., Hallerman, E., Bartley, D., Mair, G., Hulata, G., ... & Hörstgen-Schwark, G. (2000, February). Review of the status of aquaculture genetics. In Aquaculture in the Third Millennium. Technical Proceedings of the Conference on Aquaculture in the Third Millennium, Bangkok, Thailand (Vol. 20, p. 25).
- Milla, S., Pasquet, A., El Mohajer, L., & Fontaine, P. (2021). How domestication alters fish phenotypes. Reviews in Aquaculture, 13(1), 388–405. [CrossRef]
- Bombardelli, R. A., dos Reis Goes, E. S., de Negreiros Sousa, S. M., Syperreck, M. A., Goes, M. D., de Oliveira Pedreira, A. C., & Meurer, F. (2017). Growth and reproduction of female Nile tilapia fed diets containing different levels of protein and energy. Aquaculture, 479, 817-823. [CrossRef]
- Ansah, Y., Frimpong, E., & Hallerman, E. (2014). Genetically Improved Tilapia Strains in Africa: Potential Benefits and Negative Impacts. Sustainability, 6(6), 3697–3721. [CrossRef]
- Johnson, P., Crossman, J., Miller, A., Nichols, B., McLellan, J., Howell, M., & Schreier, A. (2025). Conservation aquaculture of wild-origin offspring preserves genetic diversity in an endangered population of white sturgeon. Conservation Genetics, 1-12. [CrossRef]
- Kim, K. R., Kim, K. Y., & Song, H. Y. (2024). Genetic Structure and Diversity of Hatchery and Wild Populations of Yellow Catfish Tachysurus fulvidraco (Siluriformes: Bagridae) from Korea. International Journal of Molecular Sciences, 25(7), 3923. [CrossRef]
Figure 1.
Map showing population origin geographic location: Zambia.
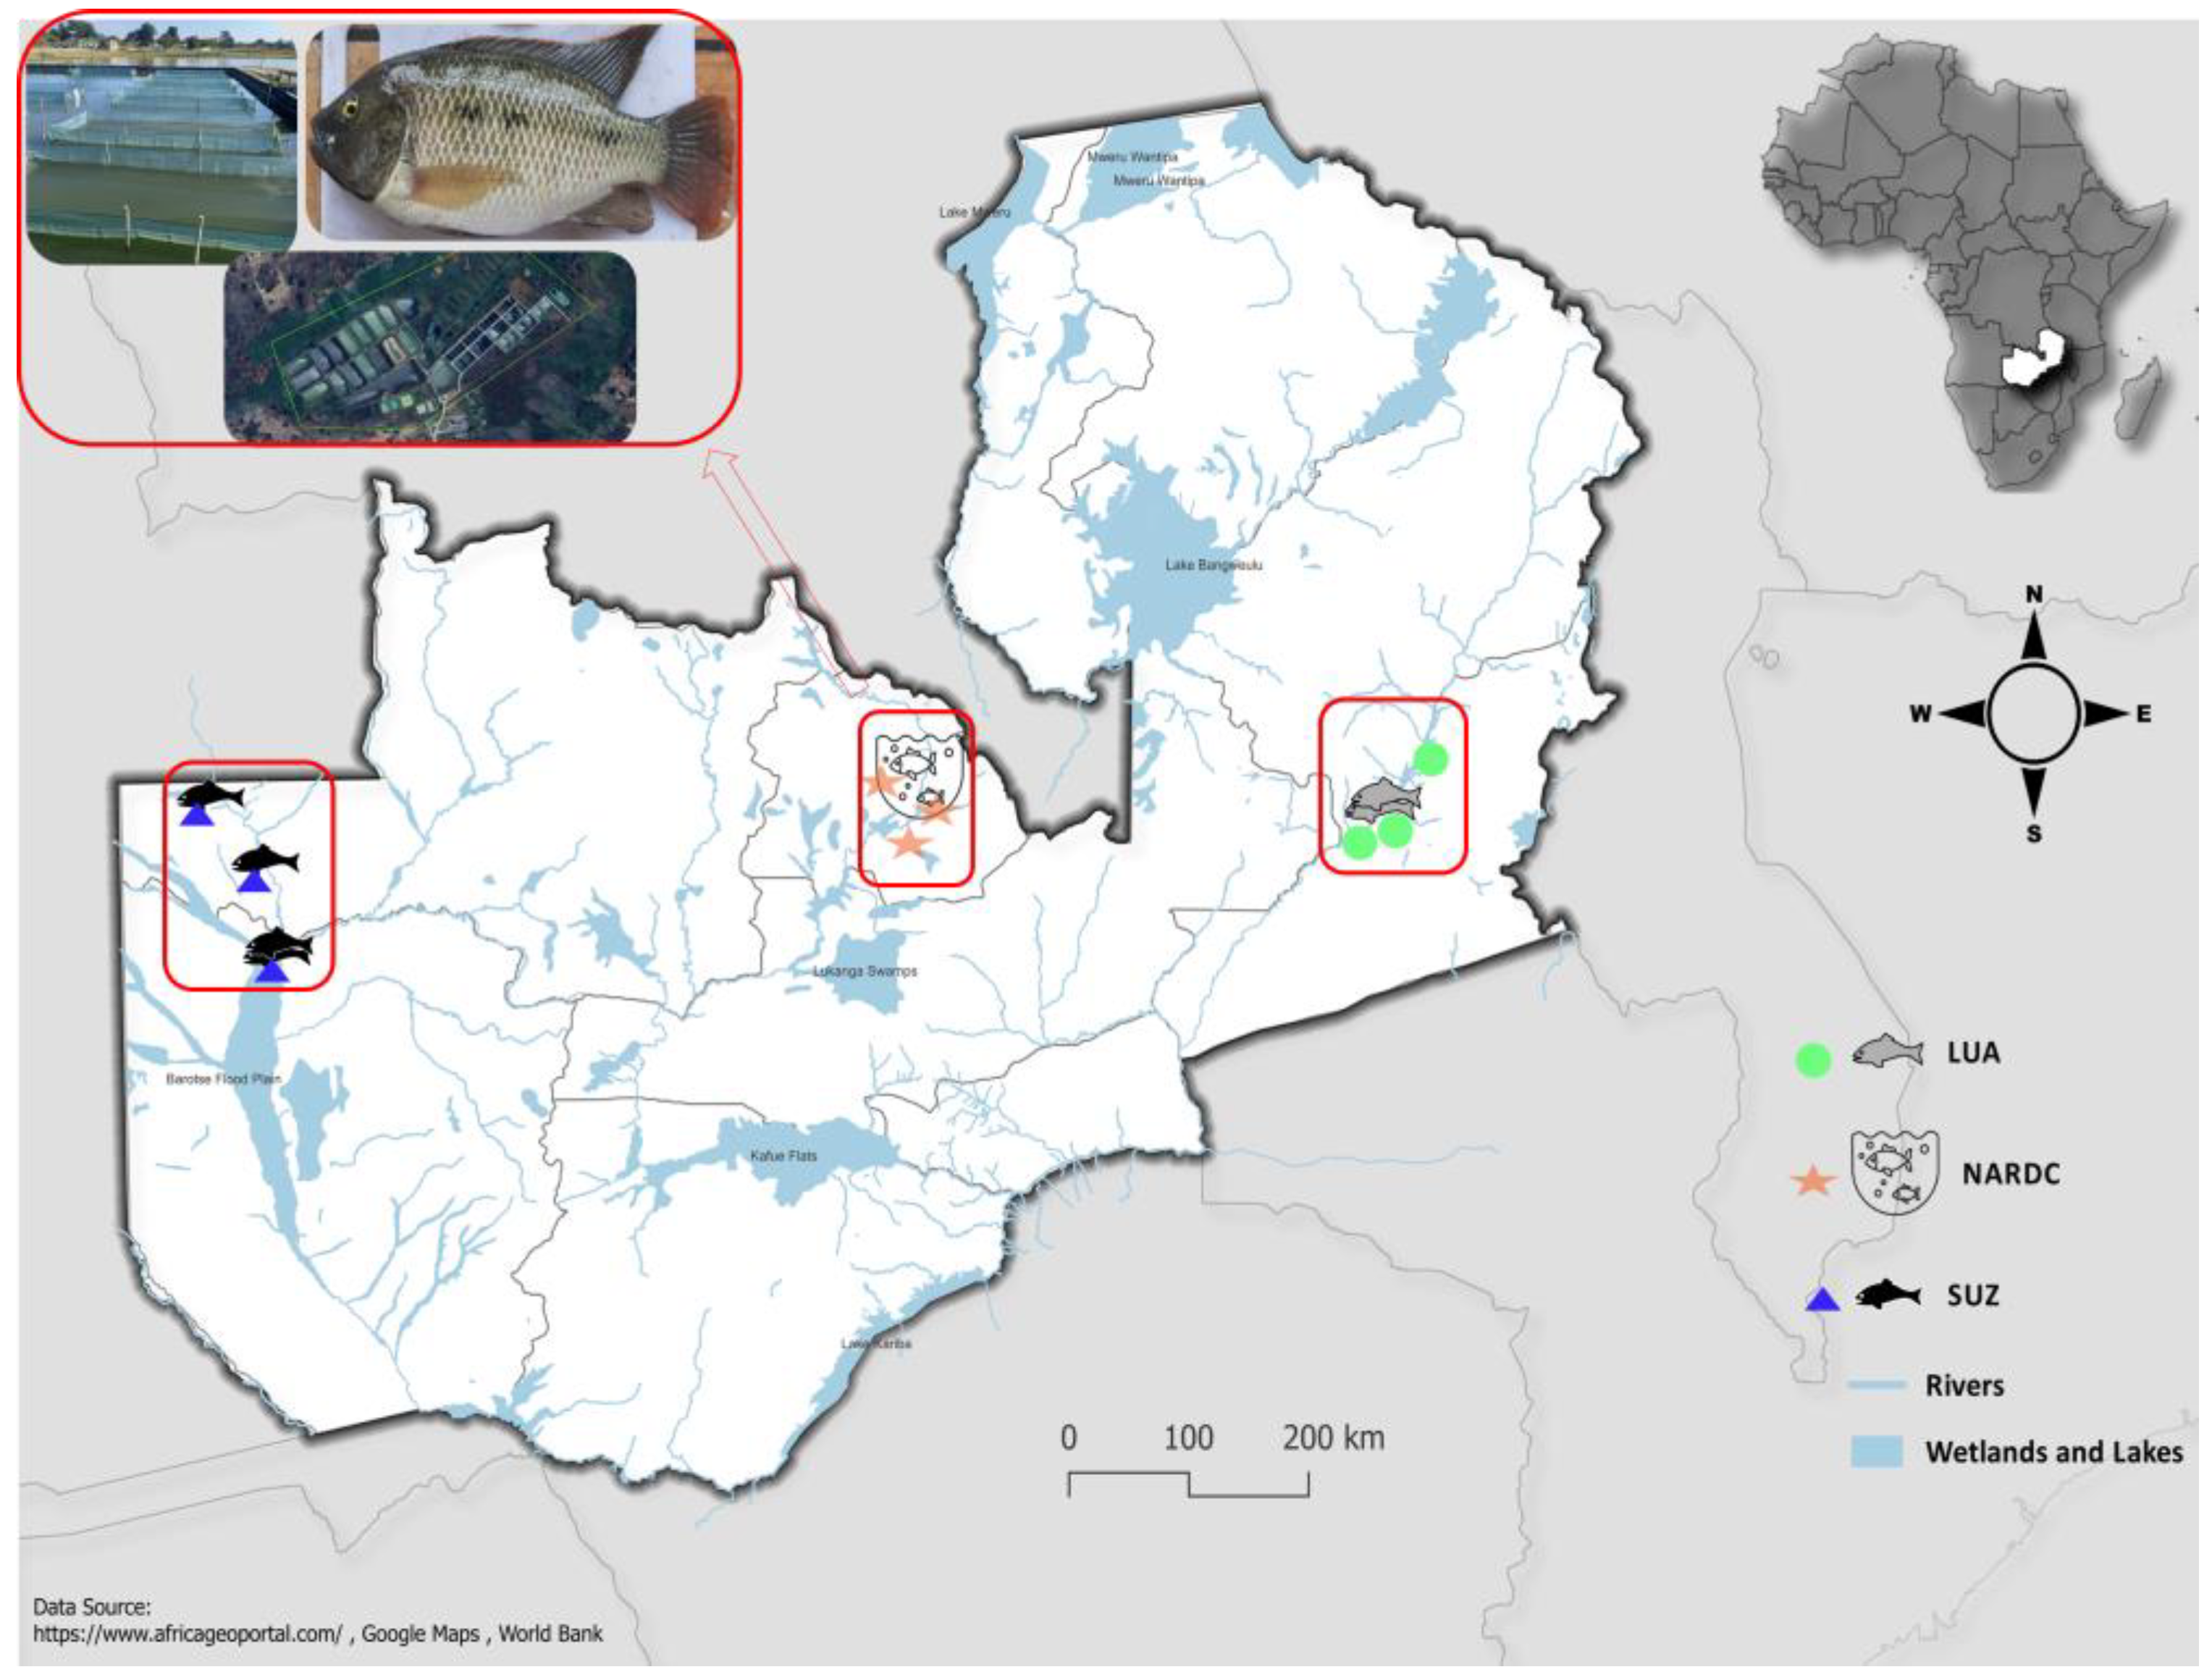
Figure 2.
Condition factor (a) and gonadosomatic index (GSI) (b) of Oreochromis andersonii broodstock from three populations (LUA, NARDC, and SUZ) after 6 months of conditioning. Sample sizes were n = 15 (LUA), 40 (NARDC), and 40 (SUZ). Brackets indicate pairwise comparisons between groups, with corresponding p-values shown above the brackets. The maroon-colored points in the middle of the boxplots represent the Mean.
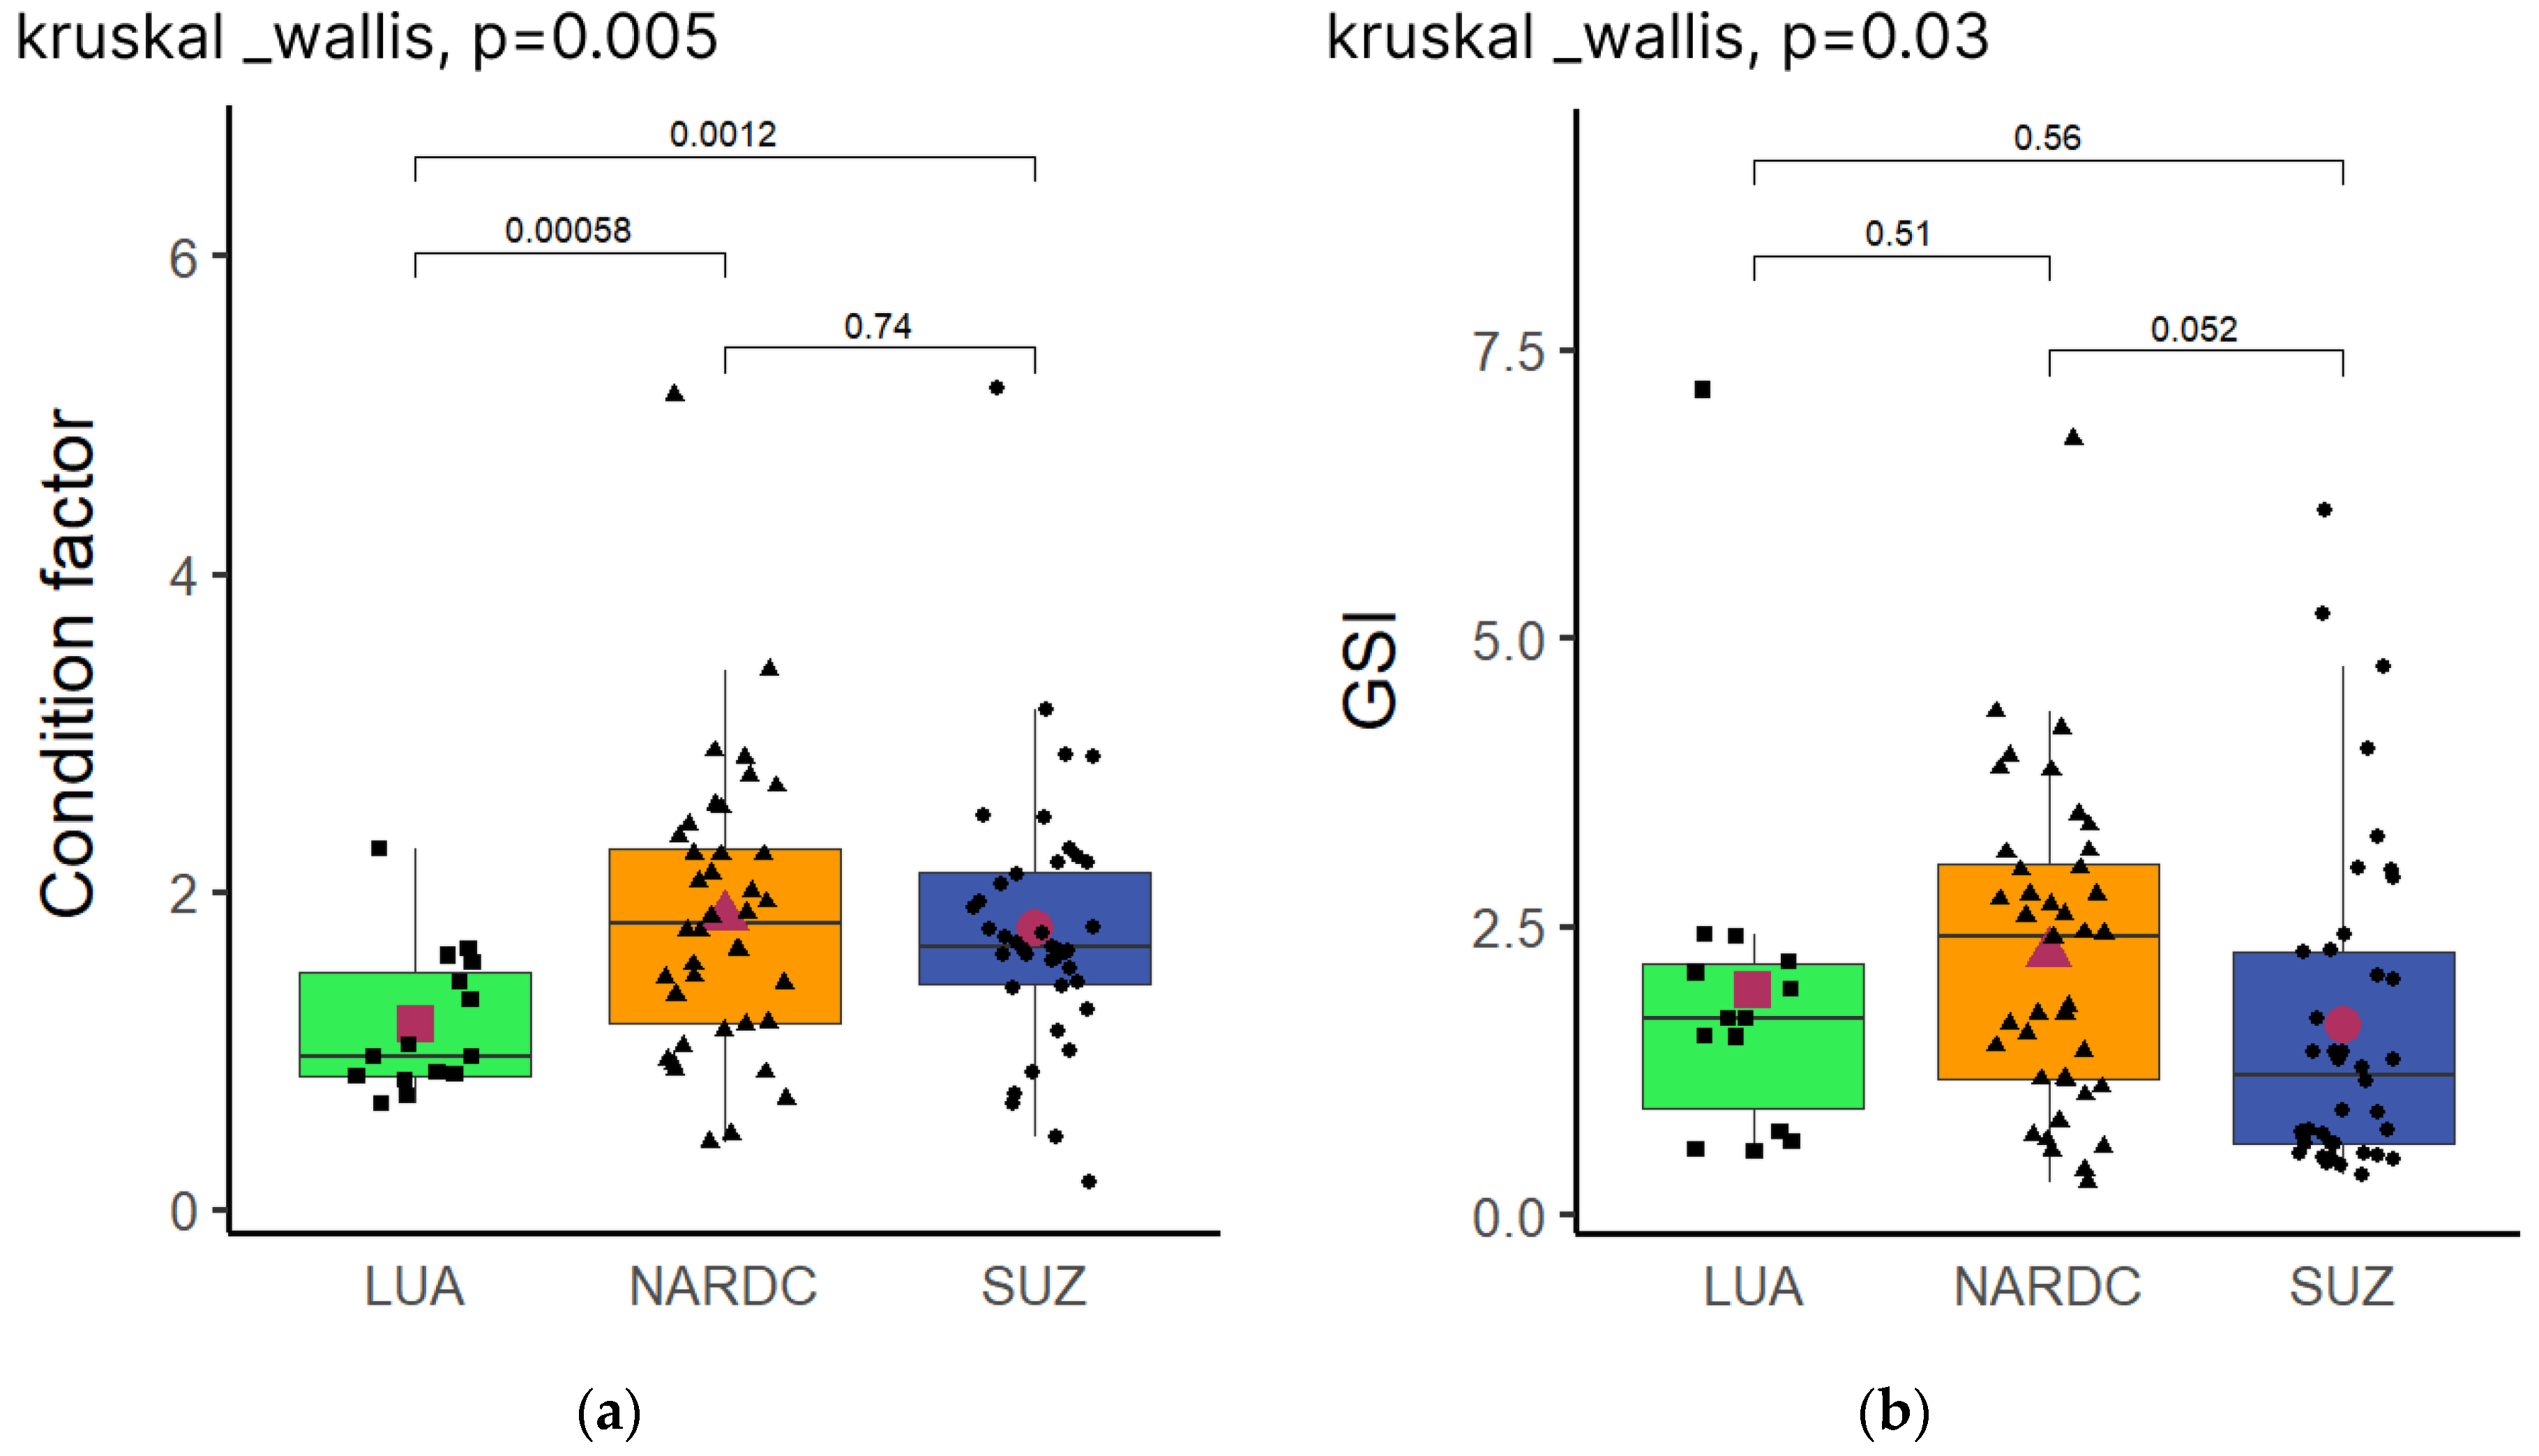
Figure 3.
Relative fecundity (RF) (a) and batch fecundity (BF) (b) of Oreochromis andersonii broodstock from three populations (LUA, NARDC, and SUZ) after 6 months of conditioning. Sample sizes for RF were n = 15 (LUA), 37 (NARDC), and 13 (SUZ), and for BF were n = 11 (LUA), 12 (NARDC), and 12 (SUZ). Brackets indicate pairwise comparisons between groups, with corresponding p-values shown above the bracket. The maroon-colored points in the middle of the boxplots represent the Mean.
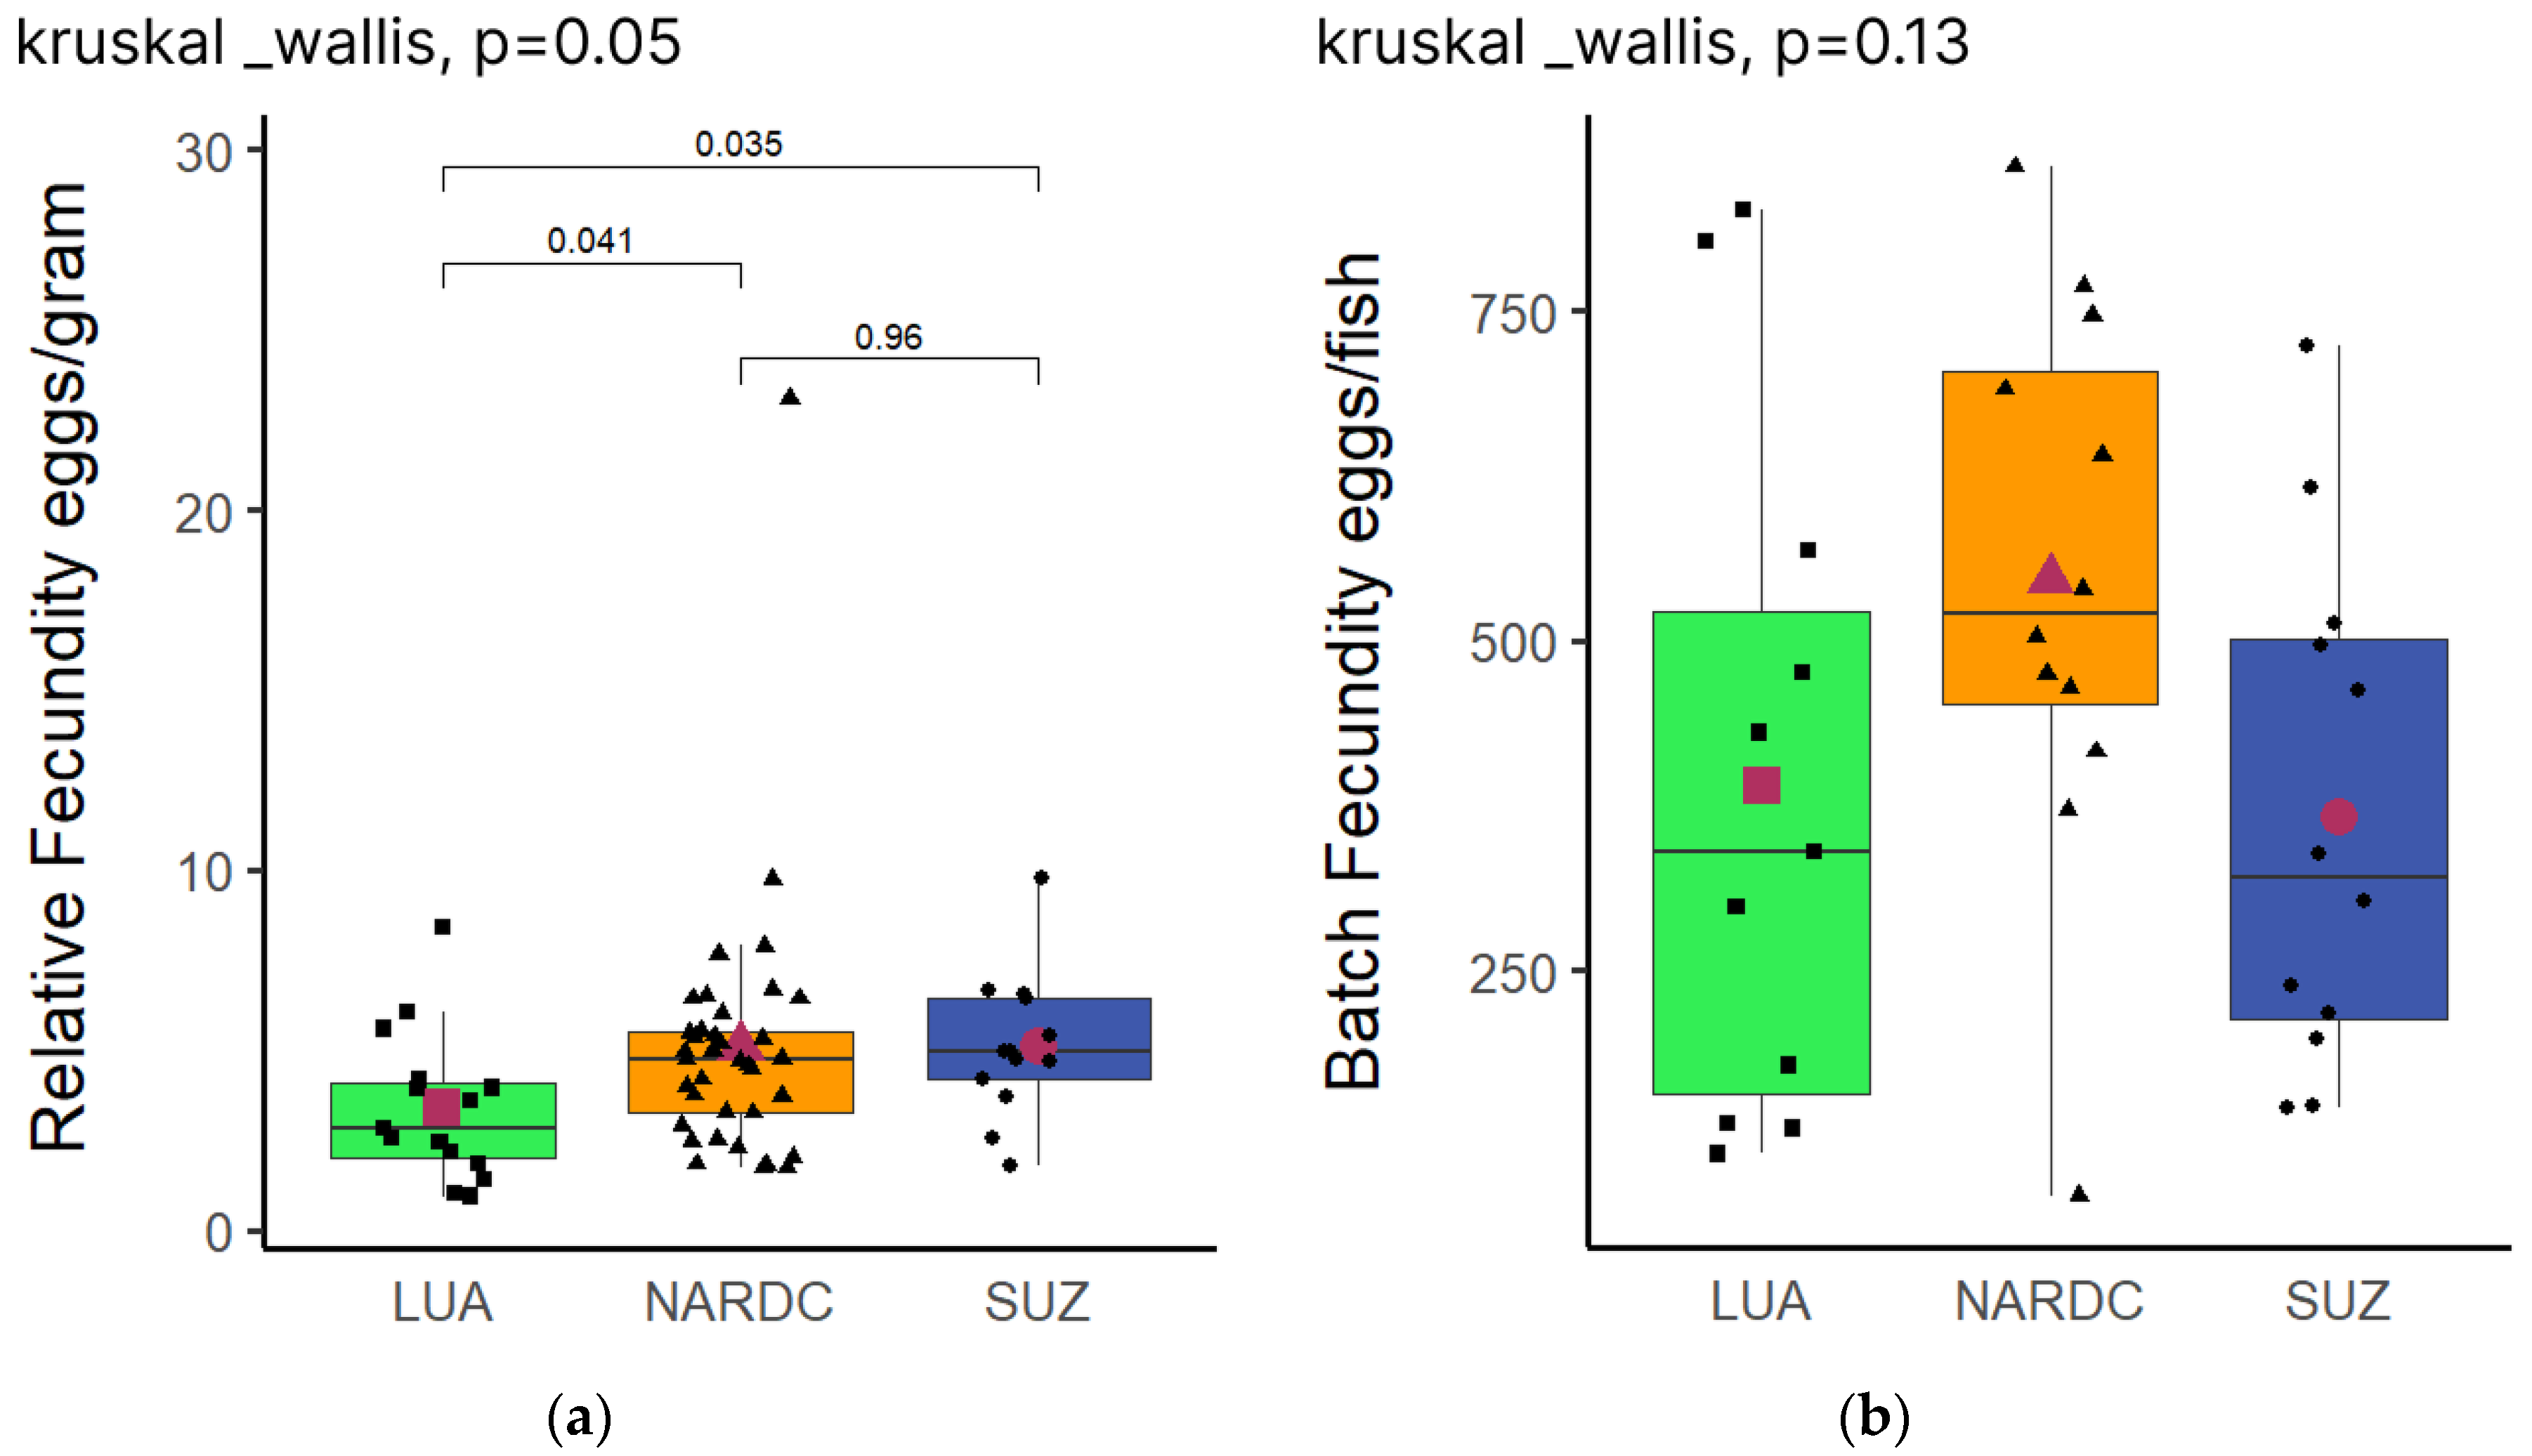
Figure 4.
Percentage of spawned females (a) and hatchability (b) of Oreochromis andersonii broodstock from three populations (LUA, NARDC, and SUZ) after 6 months of conditioning. Sample sizes were n = 15 (LUA), 40 (NARDC), and 40 (SUZ).
Figure 4.
Percentage of spawned females (a) and hatchability (b) of Oreochromis andersonii broodstock from three populations (LUA, NARDC, and SUZ) after 6 months of conditioning. Sample sizes were n = 15 (LUA), 40 (NARDC), and 40 (SUZ).
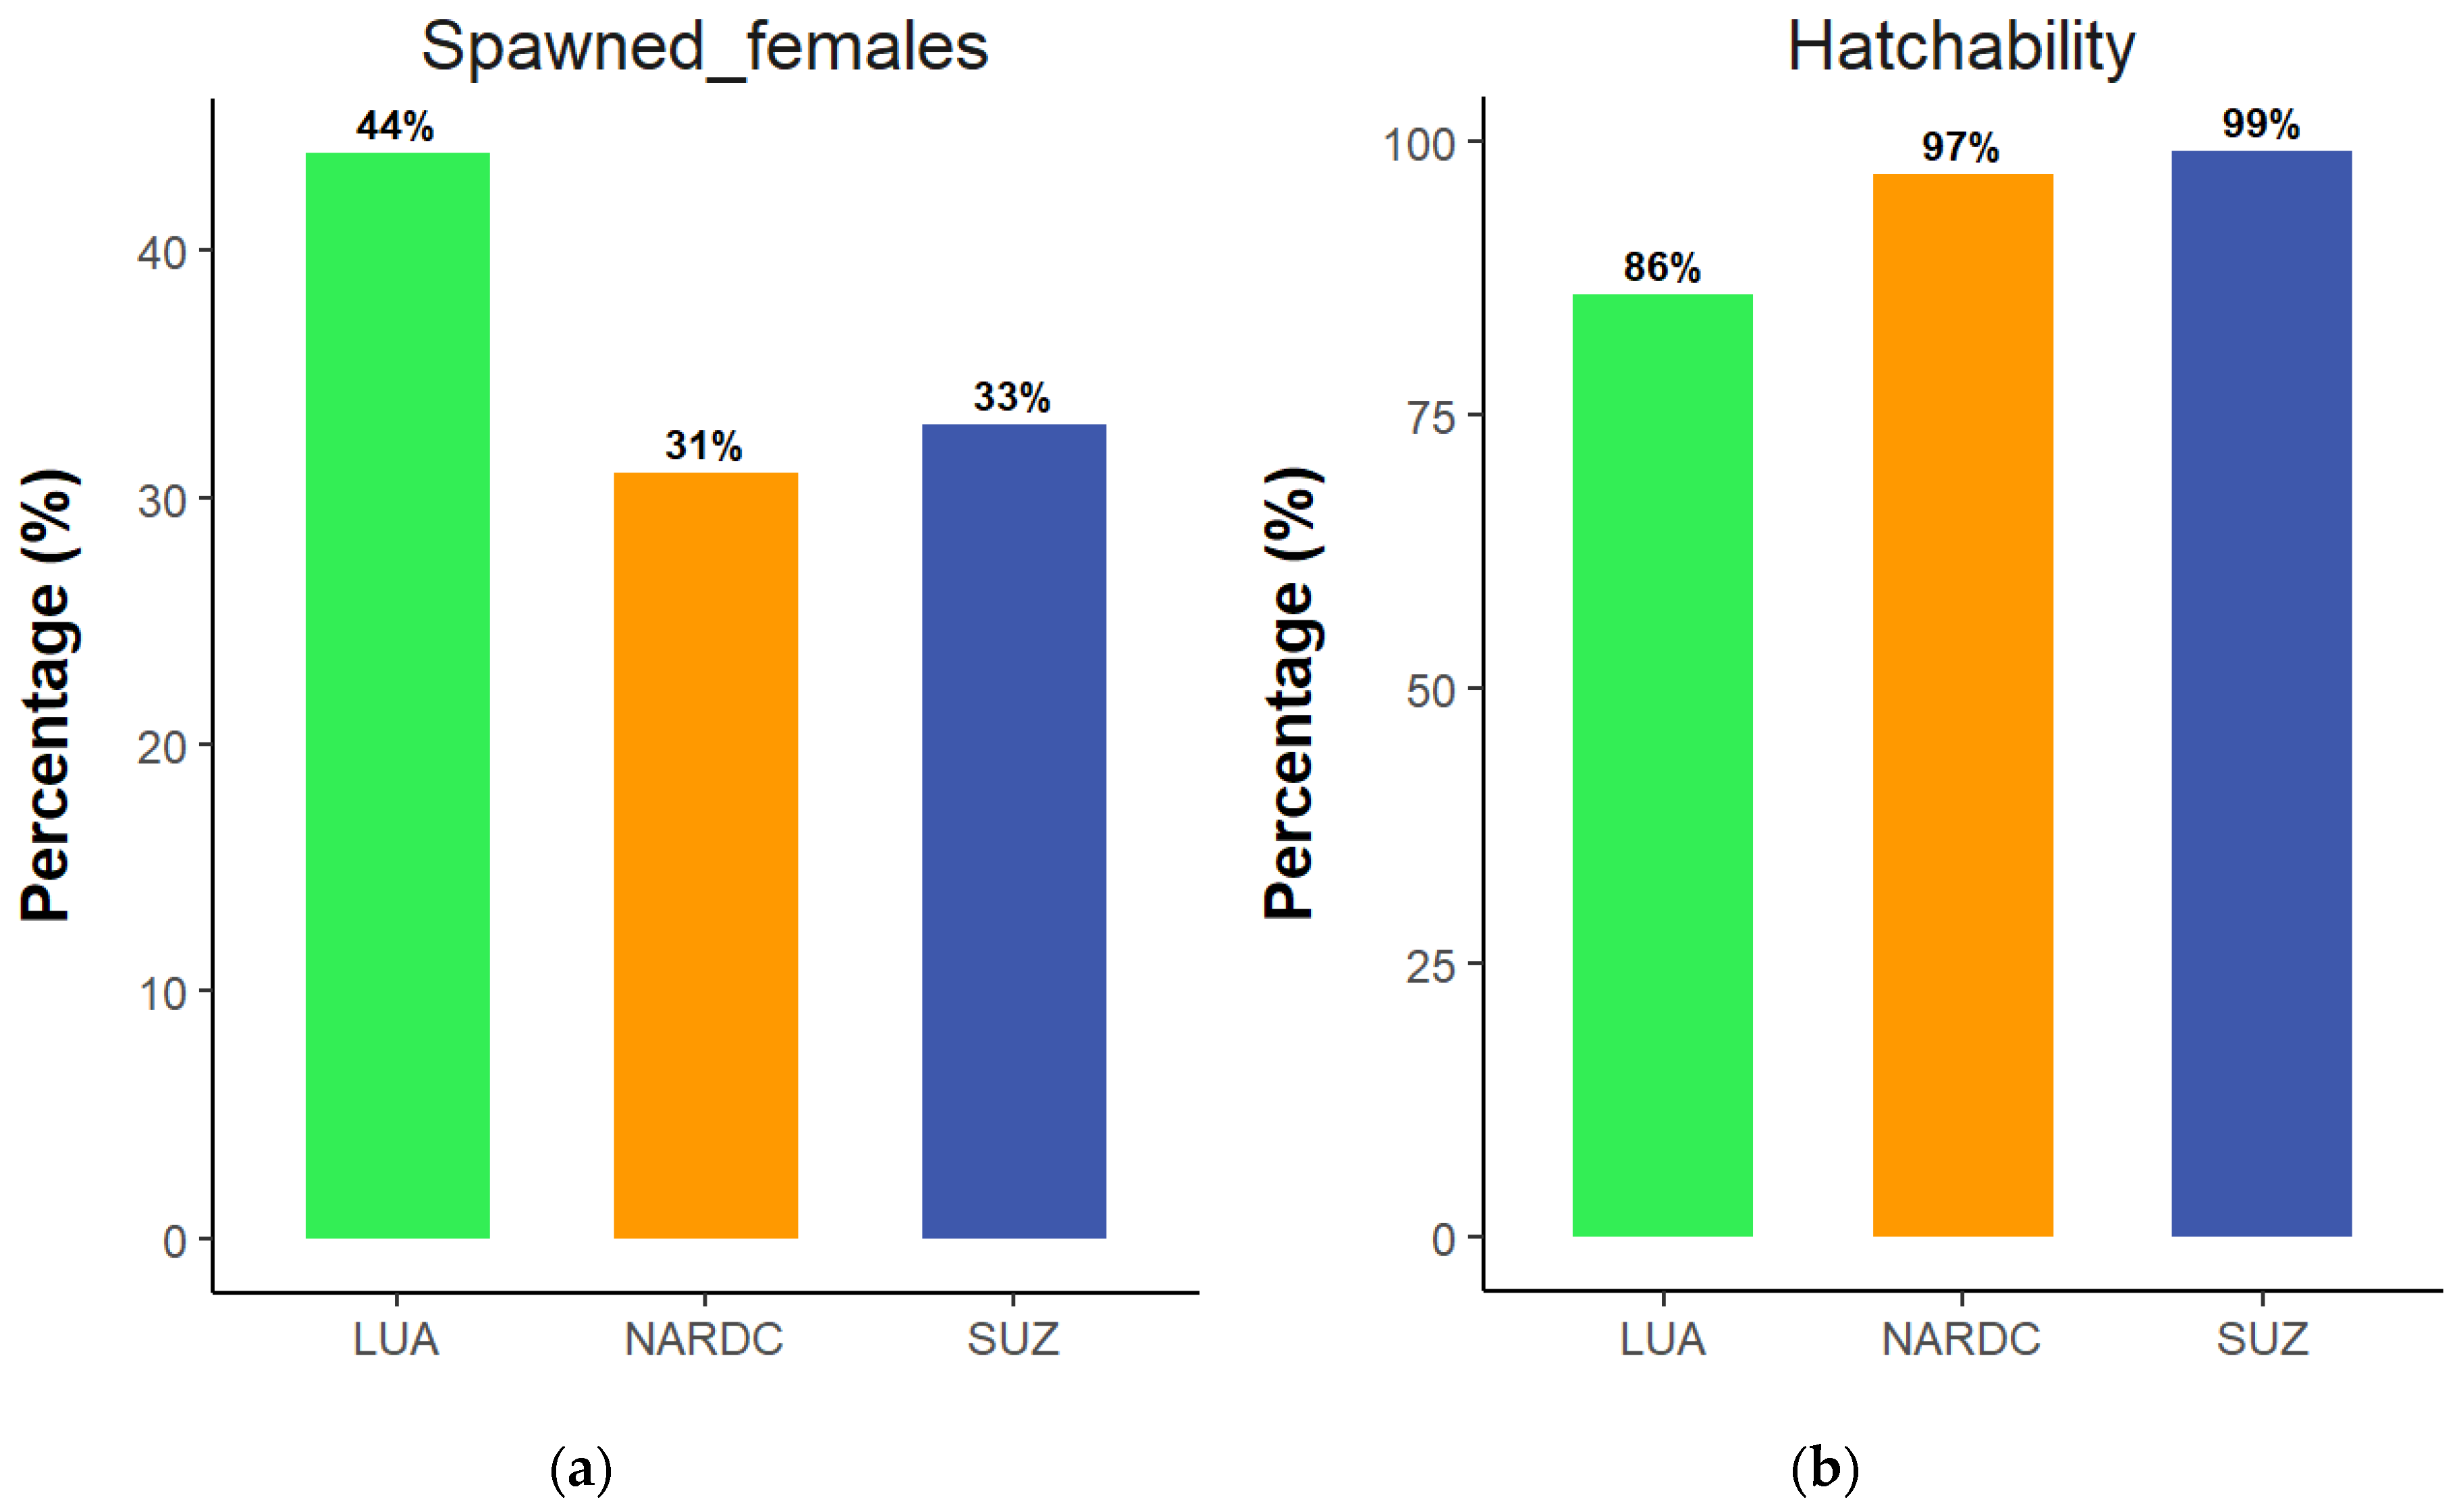

Table 1.
Commercial broodstock feed proximate analysis.
| Nutrient | Manufacturer's Claim | Lab Analysis (Actual) |
|---|---|---|
| Crude Protein [%] | 42 | 45 ± 0.001 |
| Crude Fat [%] | 12 | 8.61 ± 0.57 |
| Carbohydrates [%] | Not provided | 36 ± 0.03 |
| Fiber [%] | 3.0 | 3.49 ± 0.06 |
| Ash (%) | 6.8 | 7.79 ± 0.16 |
| Moisture [%] | Not provided | 8.61 ± 0.57 |
| Energy [kJ/g] | 2000 | 2062.71 ± 1.88 |
1 Values are expressed as means ± standard deviation (SD). Gross energy is reported in kilojoules per gram (kJ/g). All analyses were conducted in triplicate and values are presented as mean ± standard deviation.
Table 2.
Commercial broodstock feed proximate analysis.
| Parameters | Mean value ± SD |
|---|---|
| Temperature [°C] | Temperature [°C] |
| Dissolved oxygen [mg/L] | Dissolved oxygen [mg/L] |
| pH | pH |
| Conductivity [µS/cm] | Conductivity [µS/cm] |
| Salinity [ppt] | Salinity [ppt] |
2 Values are presented as mean ± standard deviation.
Table 3.
Commercial broodstock feed proximate analysis.
| Parameter | LUA | NARDC | SUZ |
|---|---|---|---|
| Body mass [g] | 182.400 ± 15.93a | 341.250 ± 16.13b | 334.000 ± 20.37b |
| Total Length [cm] | 25.233 ± 0.4807a | 27.347 ± 0.5189a | 27.363 ± 0.93a |
3 Table 3 presents the mean final body mass (g) and the total length (cm) of Oreochromis andersonii broodstock from three populations (LUA, NARDC, and SUZ). with sample sizes of n = 40 for each population. Different superscript letters indicate significant difference (p ≤ 0.05). Values are presented as mean ± standard deviation.
Disclaimer/Publisher’s Note: The statements, opinions and data contained in all publications are solely those of the individual author(s) and contributor(s) and not of MDPI and/or the editor(s). MDPI and/or the editor(s) disclaim responsibility for any injury to people or property resulting from any ideas, methods, instructions or products referred to in the content. |
© 2025 by the authors. Licensee MDPI, Basel, Switzerland. This article is an open access article distributed under the terms and conditions of the Creative Commons Attribution (CC BY) license (http://creativecommons.org/licenses/by/4.0/).
Copyright: This open access article is published under a Creative Commons CC BY 4.0 license, which permit the free download, distribution, and reuse, provided that the author and preprint are cited in any reuse.


