
Submitted:
13 November 2023
Posted:
14 November 2023
You are already at the latest version
Abstract
Soy leghemoglobin (LegH) has been gaining interest over the last years as an efficient flavor and aroma compound in plant-based meat substitutes. Hence, in the following article we demonstrate the methods for LegH production using a recombinant Komagataella phaffii strain. Multiple fed-batch fermentation with an alternative to BSM medium, where glucose was used as the main carbon source, were implemented and the growth kinetics, e.g., maximal specific biomass growth - 0.239 g·g−1·h−1, biomass yield from substrate - 0.298 g·g−1 and maximal specific substrate consumption rate - 0.81 g·g−1·h−1, were identified. Leghemoglobin production resulted in a yield of 0.513 mg·gDCW 1, while the highest biomass density achieved in the study was 121.80 gDCW·L 1. The applied medium showed potential for additional optimization studies, as in contrast to BSM, made it possible to separate pH control from nitrogen supply, does not affect medium turbidity measurements and does not induce metabolite synthesis during yeast biomass growth.
Keywords:
yeast
; Komagataella phaffii
; leghemoglobin
; meat taste and smell substitute
; fed-batch fermentation
; nitrogen source
; model predictive control
1. Introduction
Humans are physiologically omnivorous and animal meat provides several essential nutrients (vitamin B12, essential amino acids, complete proteins, heme iron, creatine etc.) for maintaining health and promoting organism development, especially for children. Historically, livestock provides us foods of animal origin including meat. Although, during the last two centuries population growth, urbanization, economic growth, and flourishing markets all lead to the rapid increase in demand for meat and animal products on a global scale [1]. Global meat production has tripled over the last four decades alone and is expected to more than double by the year 2050 to reach a total capacity of 470 million tons [2]. Thus, the livestock sector can be considered as the fastest growing agricultural subsector as of today, employing 1.3 and supporting about 4 billion people worldwide. Of the total global protein consumption animal proteins now represent 40 % and this number is anticipated to increase with increasing population [3].
Unfortunately, modern livestock production systems are associated with multiple environmental problems such as soil and water pollution, loss of habitat and biodiversity, increased soil erosion, and greenhouse gas emissions. World meat production at present is contributing between 15 to 24 % of total greenhouse gas emissions (higher than the transport industry) [2]. Considering that the fossil energy to animal protein ratios as of now are at their lowest in the case of broilers (4:1) and at their highest in the case of lamb (57:1) it can be concluded that traditional meat production systems are also associated with energy inefficiencies, which only aggravate the summarized environmental concerns [4].
Furthermore, even though animal meat is the most accessible source of essential nutrients, the production and consumption of meat, has been reported to also causes negative effects on human health. For example, there are reports that consumption of red and processed meat increases the risk of developing colon, lung, pancreatic and prostate cancers [5,6,7,8,9,10] and other chronic diseases [6,9,11].
Adding to the stated above, traditional meat production is often unsanitary and relatively inefficient from the point of view of raw material transformation. By removing animals from the meat production process, most of the summarized problems may be alleviated [12]. Thus, in recent years, cell-based meat (CBM), plant-based meat (PBM) and filamentous fungi-based meat (FBM) have raised great interest as efficient animal meat substitutes.
Cell-based meat (CBM), also known as in vitro meat, lab-grown meat, or cultured meat, refers to a range of products that are produced by cultivating animal cells in laboratory or industrial equipment. The technology behind CBM was developed upon advancements in stem cell biology, such as induced pluripotent stem cells, and tissue engineering techniques that were originally developed for medical purposes. CBM production consists of the isolation and cultivation of muscle and fat cells, the formulation of xeno-free culture mediums, the development of scaffolds, and the cultivation process within a bioreactor [2].
Although, concerning human health, large-scale in vitro meat manufacturing may require increased artificial hormone supplementation into the cultivation medium. Additionally, so far, no viable methods have been adapted for the production of CBM on large scale without the use of antibiotics to prevent bacterial infections [13]. Due to slower growth, the contamination risk in mammalian cell cultures is much higher than in microbial or yeast processes [14]. Additionally, mammalian cells are generally difficult to work with since they are fragile in nature and the conventionally applied cultivation mediums are expensive, which in turn impacts the feasibility of such production [15]. Furthermore, a notable challenge associated to in vitro meat production is scale-up [1]. Current CBM production systems can reach production volumes of several dozen m3 at maximum (per one bioreactor), which is insufficient to satisfy the potential consumer demand [1]. Thus, current cell-based meat manufacturing at an industrial scale is hampered by high production costs, scale-up difficulties, and gaps in fundamental knowledge about employing cell cultures for food application [12].
Another key challenge is the perception of in vitro meat by the public. Several limitations of CBM have been outlined previously, e.g., social, economic, and technical constraints including uncertain acceptance by the consumers [16]. The latter prima facie seems to be a serious challenge, which renders the perception of in vitro meat as unattractive and ‘unnatural’. Additionally, although cultured meat does not require slaughtering of farm animals for its production, multiple vegetarian sub-classes (such as emotional vegetarians) are considered not likely to include CBM in their diet. The mentioned statement can be explained by the fact that cultured meat is still formally meat and multiple vegetarian groups have already developed a visceral resistance to meat itself, not simply as a fear of health problems or disapproval of farming practices but more as a moral emotion of disgust and revulsion [17].
Another alternative is fungal-based meat, e.g., mycoproteins, which compared to proteins from plant or animal sources poses multiple characteristic advantages. Products derived from fungi exhibit distinct nutritional profiles, lower production costs, and greater environmental benefits. Notably, filamentous fungi can be cultivated on inexpensive substrates, and even in substrates comprised from food industry by-products, e.g., sugarcane bagasses, and agricultural or forestry waste materials [18,19,20] The meat-like texture of fungal mycelium is suitable to form traditional shaped food, e.g., meatballs, nuggets etc., which benefits the consumer acceptance. However, a major disadvantage is the sensory role, which might delay the filamentous fungi-based meat integration into Western markets, as it occasionally may be perceived as tough to chew and bitter. In eastern countries, fungi-based foods already have taken a niche in everyday human diets, therefore the acceptance of fungal derived products on a global scale could be a matter of time [21].
Plant-based meat can be described as a meat-like substance, which is vegetarian and/or vegan friendly, as it uses ingredients derived solely from plant sources. Such products aim to recreate the flavor and texture close to that of animal meat using compounds derived from plants, to make it more compelling for consumers. However, recipe development and cooking methods play a crucial role in reaching the mentioned aim. The conventional components used in such recipes include proteins (sourced from soy and potatoes), fats (derived from coconut and sunflower oils), carbohydrates (such as potato starch and corn starch), nutritional additives (like yeast extract and vitamins), and other additives (including beet juice extract, apple extract, and plant hemoglobins), which are usually added to recreate ‘meat-like’ flavors [22]. Genetically modified yeast strains, for example Komagataella phaffii, previously known as Pichia pastoris, were utilized to produce soy leghemoglobin (LegH), which mimics the color and flavor of meat in plant-based meatballs, patties, rissoles, etc. [23]. Leghemoglobin is usually added to plant-based meat products in 0.5-2 % by mass (like the quantity of myoglobin in animal meat).
It’s worth noting that the LegH protein used in these processes via recombinant microorganism strains has received safety approval from the Food and Drug Administration (FDA) [24]. As the GMO is not itself an ingredient of plant-based meat, such products are not considered genetically modified (or containing genetically modified ingredients) according to both European and US legislations. Thus, recent trends indicate that LegH meat substitutes will gain more interest in the near future, which will inevitably give rise to the demand for efficient cultivation/fermentation systems of plant-based meat mass production.
Apart from artificially adding LegH to the end product, the development of fermented PBM (using leghemoglobin containing cultures) has been investigated. The utilization of microorganisms or the construction of microbial consortia with specific bioconversion capabilities (e.g., proteolysis, aromatization via amino acid metabolism, or other) can offer a highly efficient means to make PBM more palatable. Presently, this approach is used to develop fermented products based on pea protein, aimed at diminishing the characteristics of the legumes and introducing new flavors (e.g., fruity or dairy-like palate) that are more appealing to consumers [25,26].
LegH producing recombinant microorganism strains, which were studied previously include Candida, Hansenula, Komagataella, and Toruplosis genus representatives [27]. The mentioned strains are considered methylotrophic yeasts, which utilize alcohols (usually methanol) as substrates, and in their recombinant form can produce LegH via methanol-inducible promoter element. Although, Komagataella phaffii seems to have promoted the most noticeable interest for LegH production, due to the positive characteristics of this strain, e.g., high growth rates and recombinant protein production capacities, a wide industrial application history in production of both pharma and food products and availability of standardized gene alteration methods [28].
Conventionally, Komagataella phaffii fermentations for recombinant protein production are operated in fed-batch, which is justified by the ability to provide controlled nutrient feeding, thus ensuring a possibility to optimize cell growth and protein expression [29]. Furthermore, this approach extends the production phase, resulting in higher biomass and protein titers (in case the protein is endogenous) compared to traditional batch fermentations, which are often limited by nutrient depletion after the growth phase. Although, controlling feeding rates in fed-batch fermentations can be challenging, as it requires precise monitoring and adjustment to avoid issues such as nutrient imbalances (growth limitation) and the formation of byproducts (acetates and ethanol in the case of K. phaffii), all of which can impact the overall success of the fermentation process [30].
In K. phaffii recombinant protein production the regulation of synthetic pAOX1 variants is based on principles of repression/promotion, using glucose or glycerol as the only substrate. At high concentrations of glycerol or glucose, pAOX1 variants are repressed, but at lower substrate availability are promoted during fed-batch cultures. In contrast to pGAP-controlled protein production with glucose as the substrate, the protein production typically increases with specific growth rates close to μmax. The opposite is often found for pAOX1-controlled high-level recombinant protein formation induced by methanol, where maximum specific secretion rates were observed at a μ considerably below μmax. K. phaffii strains with novel pAOX1 variant promoters, which are cultured with glycerol, are a combination of the two mentioned systems with respect to promoter features and substrate. As a result, product formation is not predictable a priori and has to be determined empirically for each combination of promoter and heterologous gene [31].
The most commonly used medium for the high cell density fed-batch fermentation of K. phaffii is the basal salt medium (BSM) proposed by Invitrogen (USA) [29,32,33]. The two-stage cultivation on glycerol and methanol associated with Invitrogen’s “Pichia Fermentation Process Guidelines” is well documented and present in most pAOX1-promoter-based cultivation strategies. However, recent trends advocate for a move away from standard protocols towards a more conceptual approach, which allows for the development of process-specific strategies tailored both to the specific combination of product/genetic construct and the characteristics of the bioreactor equipment [34]. Furthermore, during the vast history of BSM application, authors have outlined multiple important problems, e.g., precipitation, unbalanced composition, and high ionic strength, which affect the culture performance. For example, as a result of precipitation, the actual concentration of dissolved minerals remaining in the medium is difficult to determine and also the turbidity caused by the salts complicates the measurement of cell densities (optical densities). Additionally, the BSM medium implies the use of NH4OH for both pH control and the supply of nitrogen, which is necessary for cell growth. The mentioned fact can pose a significant problem in cases, where the nitrogen amount in the medium must be maintained at specific values and, thus, cannot be interlinked with other control mechanisms [33]. Hence, the drawbacks of BSM give rise to the necessity to develop other physiologically rational and suitable mediums for efficient recombinant protein production in Komagataella phaffii [33].
Considering the rise in interest towards LegH production processes and apparent blank spots regarding the fermentation process specifics, the focus of the present research was aimed at the development and application of a production protocol for recombinant production of LegH protein by Komagataella phaffii through fed-batch fermentations in an alternative medium. The composition of the fermentation media and feeding solution was chosen among the ones published in the literature (with modifications), which in contrast to BSM do not incorporate nitrogen in the form of ammonium hydroxide (allowing independent pH and nitrogen level control) and do not influence medium turbidity.
2. Materials and Methods
2.1. Yeast Strain and Media
The Komagataella phaffii X-33 strain used a basis for this work was the same as described by Pentjuss et. al. [35]. Although, for the overexpression of leghemoglobin in the mentioned strain, Komagataella phaffii genes involved in the heme pathway were chosen to be paired with strong promoters and integrated into the yeast genome. Sequences for HEM1 (XP_002491645.1) and HEM2 (BA75_04933T0) were identified by searching (BLAST) Saccharomyces cerevisiae homologs in NCBI Komagataella phaffii GS115 entries. The genes were synthesized by Twist Bioscience (USA). Gene sequences are attached in Appendix A. Expression construct (pGAP-HEM1-TDH4tt-pAOX1-HEM2-chr4_0883tt) was created by Golden Gate Assembly as described in Prielhoffer et al. 2017 [36]. The transformation was done by electroporation and positive colonies screened out by colony PCR.
The obtained yeast strain was maintained on YPD agar plates, containing the following reagents (per liter): yeast extract 10 g, bactopeptone 20 g, glucose 20 g, and agar 20 g. The inoculum for bioreactor fermentations was grown in 200 mL Erlenmeyer flask with 100 mL of medium containing (per liter) glucose 20 g, peptone 20 g, and yeast extract 10 g. Incubation was performed for 48 h at 30 °C in orbital shaker-incubator ES-20 (Biosan Ltd., Latvia).
A synthetic growth medium was used during cultivations in the laboratory bioreactor, see Table 1. Each experiment was split into three stages: (1) batch phase – biomass growth without feeding supply, (2) fed-batch biomass growth with feeding supply and (3) LegH production induction. Leghemoglobin production was induced by activating the methanol feeding supply after an optimal fermentation time obtaining the biomass concentration of around 70 g dry cell weight (DCW) per liter. Determination of biomass DCW and leghemoglobin concentration is described below.
2.2. Fed-batch cultivations
Bioreactor fed-batch fermentation processes were carried out in a 5.4 L total volume EDF-5.4_1 (Bioreactors.net AS, Latvia) bench top system. During the fed-batch fermentations, the temperature was maintained at 30 °C, pH was controlled to be at 6.0 ± 0.2, dissolved oxygen was kept at 40 ± 5 %-sat. The pH was controlled by two peristaltic pumps, which automatically dosed H2SO4 (20 W%) or NaOH (10 W%) solutions into the medium. The foam level was registered via a conductivity sensor, which was mounted on the top lid of the bioreactor’s vessel. Upon reaching the set level the designated peristaltic pump automatically dosed Antifoam A (Sigma, Germany) until the foam level decreased to normal levels. The dissolved oxygen (DO) level was maintained according to a cascade algorithm, which operated with two control principles in a defined succession, e.g., primarily regulating the agitation rate (from 100 to 800 rpm), and secondly by enriching the inlet gas with oxygen. A flow rate of gas was maintained at 2.0 standard liter per minute (slpm) throughout the fermentation process.
The CO2 and O2 concentrations were measured online in the off-gas with the help of BlueInOneCell gas analyzer (BlueSens gas sensor GmbH, Germany). The ethanol concentration estimate was determined with an ethanol/methanol sensor MeOH Sensor (Raven BioTech, Canada).
The gas analysis data, e.g., respiratory quotient (RQ) and oxygen uptake rate (OUR) were calculated automatically by the EDF-5.4_1 system from the off-gas data.
The biomass samples were harvested aseptically for off-line product and metabolite measurements. The biomass concentration was determined through optical density (OD) measurements at 600 nm with a spectrophotometer Jenway UV-Visible Spectrophotometer 7205 (Cole-Parmer Instrument Co. Europe, UK). The glucose concentration in the medium was measured by a blood sugar analyzer AccuCheck ACTIVE (Roche, Switzerland).
The permittivity was measured by the Incyte VCD sensor (Hamilton Company, Switzerland).
2.3. Determination of Biomass Dry Cell Weight
The relationship between the dry cell weight (DCW) of biomass and the absorbance at a wavelength of 600 nm was determined using gravimetry. Initially, a portion of the growth medium containing K. phaffii cells was harvested from the bioreactor during the exponential growth phase. The absorbance of this solution was then measured at 600 nm. Subsequently, the solution was divided into two equal parts. One part was placed in a convection oven and dried at 60 °C for a minimum of 24 to 48 h, or until the mass reading reached equilibrium. The second part of the solution underwent centrifugation at 3500 rpm for 10 minutes with lab-scale centrifuge Z 167 M (Hermle Labortechnik GmbH, Germany). The resulting supernatant was filtered through a glass filter and then transferred to a convection oven for drying at 60 °C for at least 24 to 48 h, until the mass reading reached equilibrium. Once both the supernatant and growth medium samples reached a constant mass, their masses were measured and used to calculate correlation coefficients. The following mathematical correlation (Equation (1)) was used to calculate the correlation coefficient:
where, XDCW – biomass concentration in the fermentation medium, g(DCW)·L−1; OD600 – absorbance of the solution measured at 600 nm; mx – mass of dry residue (left from the solution containing K. phaffii cells), g; msn – mass of dry residue (left from the supernatant), g; Vx – volume of the solution containing K. phaffii cells, L; Vsn – volume of the supernatant, L.
During the present study, the correlation coefficients value was determined as 0.145 g(DCW)·L−1·A.U.−1.
2.4. Determination of leghemoglobin concentration
The concentration of leghemoglobin was determined through a developed absorption spectroscopy method, which was developed based on the information published by Hopp et. al. [37]. The first phase of this analysis involves washing the yeast biomass. Medium samples were harvested and transferred into four 15 mL vials at particular cultivation time points and then centrifuged. After centrifugation, the supernatant was carefully removed, and a saline solution (9 g·L-1 NaCl) was added to the remaining precipitate, reaching the 7.5 mL mark. The contents of each two samples were then combined into one vial. This procedure was repeated until a single 15 mL vial with precipitate was obtained.
The second phase of the analysis was the cell disruption. Initially, an anti-coagulant solution, containing per liter: 1.5 g Na-EDTA and 0.2 g NaOH, was added to the 15 mL vial containing the previously obtained biomass precipitate. Suspension was achieved through vigorous agitation using a vortexer LLG-uniTEXER (Lab Logistics Group GmbH, Germany). Next, 1.5 mL of the suspension was transferred into two 2 mL vials. Each vial was then filled with glass beads with a diameter of 0.40-0.60 mm until the liquid level reached the 2.0 mL mark. These vials were then vortexed for at least 15 minutes, which was followed by refrigeration at 4 °C for 10 minutes. The vortexing and refrigeration steps are repeated a total of two times. Finally, the vials were centrifuged at 3500 rpm for 10 minutes. The supernatant is then harvested and diluted as needed with the anti-coagulant solution. The absorption spectra of the solutions were measured within the range of 300 to 600 nm using a quartz cuvette with a light path of 1 cm and a spectrophotometer Jenway UV-Visible Spectrophotometer 7205 (Cole-Parmer Instrument Co. Europe, UK).
The absorption value at 415 nm was used for the calculation of leghemoglobin concentration in the biomass sample. The correlation between the absorption and LegH concentration was determined through calibration of the described method using analogous hemeproteins and compounds, e.g., hemin (51280, Sigma-Aldrich Co, USA) and hemoglobin (08449, Sigma-Aldrich Co, USA). As the heme molecule in leghemoglobin, hemin, and hemoglobin is responsible for light absorption at the characteristic wavelength, the A.U. vs Heme molecule molar concentration was constructed using hemin and validated for the hemoglobin case (see Appendix B).
Considering the mentioned procedure, the following equation was used to calculate the amount of produced leghemoglobin per gram of dry cell mass:
where, YP/DCW – yield of leghemoglobin per gram of yeast biomass, g·g(DCW)−1; cLegH – concentration of leghemoglobin in the final sample (measured through light absorption, see Appendix B).
3. Results
3.1. Fed-batch cultivations of K. phaffii
The key areas of interest for the first cultivation included identifying the strain’s maximal growth rate, substrate consumption rate, biomass yield from substrate and understanding any potential limitations, which should be considered in subsequent processes.
The data on biomass, glucose, and ethanol concentrations, as well as gas analysis data (RQ and OUR) are shown in Figure 1.
During the batch stage an increase in ethanol concentrations was observed, which reached its maximum – 3.8 g·L-1 on the 14th hour (see Figure 1).
The switching between glucose uptake, ethanol production and ethanol consumption can be observed on the RQ diagram in Figure 1. From the beginning of the cultivation, the RQ value increased, reaching its maximal value of 2.6 on the 14th hour. Starting from the 14th hour the RQ decreased, reaching values of roughly 0.3 – 0.5 up until the 19th hour. After the 19th hour the RQ increased to 1.0 – 1.1 and remained such until the end of the cultivation.
The depletion of available substrates can be observed on the OUR diagram (see Figure 1). From the beginning of the cultivation and up until the 19th hour the oxygen uptake rate steadily increased, reaching a maximal value of 2.41 kg·(m3·h)-1. On the 19th hour the OUR abruptly decreased to 1.03 kg·(m3·h)-1, after which continued to increase until 2.47 kg·(m3·h)-1 at the end of the cultivation.
On the 19th hour the feeding stage was initiated by supplying pulses of feeding solution into the cultivation medium (see Figure 1). Two pulses of 7.7 and 13.7 mL were supplied between the 19th and 20th hour to estimate the biomass yield from substrate (Yxs) and biomass growth rate (µmax). Once both mentioned parameters were estimated, an exponential feeding profile was calculated and enabled on the 21.5th hour. Further feeding supply was performed to estimate the biomass yield from substrate (Yxs).
From the generated experimental data, the maximal specific glucose consumption rate was calculated using the following equation:
The mentioned parameters were equal to µmax = 0.16 g·g-1·h-1, σmax = 0.65 g·g-1·h-1 and Yxs = 0.269 g·g-1.
The final biomass concentration, which was measured on the 27th cultivation hour reached 33.28 gDCW·L-1 (see Figure 1).
Based on both µmax and Yxs the feeding profile (feeding rate vs. process time) for the second fed-batch fermentation was calculated (see Figure 2).
Building upon the valuable insights gained from the first fed-batch cultivation, the primary objective of the subsequent experiment was to implement data-driven adjustments to both the cultivation medium composition and the feeding supply. For the second cultivation the initial glucose concentration in the medium was lowered from 20 to 5 g·L-1 (to observe the effect of initial substrate concentration on ethanol production) and the feeding stage was prolonged in order to increase the final biomass concentration in the medium.
The data on biomass, glucose, and ethanol concentrations, as well as feeding rate are shown in Figure 2.
During the batch stage an increase in ethanol concentrations was observed, which reached its maximum – 0.2 g·L-1 at the 6th hour (see Figure 2), which is a substantial decrease in respect to the ethanol concentration achieved in the first cultivation.
In the second cultivation the feeding was initiated on the 10th hour (see Figure 2). The feeding profile for the second cultivation was calculated based on the data gathered from the first experiment.
The final biomass concentration, which was measured on the 49th cultivation hour reached 80.26 gDCW·L-1.
The main goal of the third cultivation was to re-estimate the maximal glucose uptake rate - σmax, the maximal specific biomass growth rate - µmax and the biomass yield from substrate (see Table 2). To achieve the stated above, we implemented a strategy of manually adjusting the feeding rate until the substrate begins to accumulate in the medium. Upon accumulation, the difference between substrate-in and substrate-accumulated in each time frame was considered to be the maximal glucose uptake rate. The biomass yield from substrate was calculated using data from multiple time points (when the RQ was close to 1.0, indicating carbohydrate metabolism solely for biomass growth) and averaged. The maximal specific biomass growth rate was calculated using equation (10)
Furthermore, the third fed-batch cultivation was also aimed at evaluating the effect of elevating the initial glucose concentration in the medium from 5 to 10 g·L-1 on the production of ethanol.
The data on biomass, glucose, and ethanol concentrations, as well as gas analysis data (RQ and OUR), permittivity (proportional to viable cell density) and feeding rate are shown in Figure 3.
During the batch stage an increase in ethanol concentrations was observed, which reached its maximum – 1.8 g·L-1 at the 14th hour (see Figure 3.b).
The switching between glucose uptake, ethanol production and ethanol consumption can be observed on the RQ diagram in Figure 3.b. From the beginning of the cultivation, the RQ value increased, reaching its maximal value of 1.5 on the 12th hour. Starting from the 14th hour the RQ decreased, reaching values of roughly 0.3 – 0.4 and remained in this range up until the 18th hour. After the 18th hour the RQ increased to 1.0 – 1.1 and remained such until the end of the cultivation.
The depletion of available substrates can be observed on the OUR diagram (see Figure 3.b). From the beginning of the cultivation and up until the 18th hour the oxygen uptake rate steadily increased, reaching a maximal value of 1.58 kg·(m3·h)-1. On the 18th hour the OUR abruptly decreased to 0.47 kg·(m3·h)-1, after which continued to increase until 6.12 kg·(m3·h)-1 at the end of the cultivation.
On the 18th hour the feeding stage was initiated (see Figure 3.b). The initial feeding profile for the third cultivation was calculated based on the data gathered from the first experiment. During the initial fed-batch stage, e.g., from the 18th till the 33rd hour, the feeding rate was gradually increased until substrate accumulation was observed (at the 30th hour) (see Figure 3.a). After the accumulated substrate reached 3 g·L-1, the feeding profile was returned to its initial state and proceeded until the end of the cultivation, e.g., the 70th hour.
The final biomass concentration, which was measured on the 70th cultivation hour reached 121.80 gDCW·L-1, which is the highest cell density reached in the context of this study (see Figure 3.a).
3.2. LegH production fed-batch fermentations
The leghemoglobin production fed-batch fermentation was implemented in two phases: (1) glucose phase, during which the yeast biomass was grown until reaching a concentration of about 70 gDCW·L-1 and (2) methanol phase, during which the previous substrate (glucose) was switched to methanol.
For the glucose phase, an exponential feeding profile was calculated based on the data generated from the third cultivation. Additionally, based on the observations from previous experiments, the initial glucose concentration in the medium was chosen to be 5 g·L-1, in order to minimize ethanol production in the pre-feeding phase.
During the methanol phase, the respective feeding solution was supplied into the medium in order to maintain methanol at about 1 g·L-1 (measured by the ethanol/methanol sensor) throughout the fermentation.
The data on biomass, glucose, ethanol, and methanol concentrations, as well as gas analysis data (RQ) and glucose/methanol feeding rates are shown in Figure 4.
During the batch stage an increase in ethanol concentrations was observed, which reached its maximum – 0.6 g·L-1 (see Figure 4.b). On the 68th hour of the fermentation, the methanol phase was initiated by supplying a single pulse of the methanol feeding solution, which raised the MeOH concentration in the medium to 2.0 g·L-1 (see Figure 4.b). After the first pulse, no feeding was implemented, thus letting the culture to switch to alcohol consumption. On the 83rd hour, when the MeOH concentration in the medium fell to 0.7 g·L-1 the feeding was initiated in pulse mode to maintain the substrate concentration at about 1.0 g·L-1 (see Figure 4.b).
The switching between glucose uptake, ethanol production and ethanol/methanol consumption can be observed on the RQ diagram in Figure 4.b. From the beginning of the cultivation, the RQ value increased, reaching its maximal value of 2.7 on the 15th hour. Starting from the 15th hour the RQ decreased, reaching values of roughly 0.3 – 0.4 and remained in this range up until the 18th hour (when the produced ethanol was fully consumed). After the 18th hour the RQ increased to 0.9 – 1.0 and remained such until the end of the glucose phase (the 68th hour). After the 68th hour (end of the glucose and start of the methanol phase) the RQ decreased to 0.6 – 0.7 and remained in the mentioned range until the end of the fermentation.
The biomass concentration, which was measured on the 68th cultivation hour (end of the glucose phase) reached 68.44 gDCW·L-1 (see Figure 4.a). After the end of the methanol phase, the biomass concentration decreased to 51.04 gDCW·L-1, which is most likely attributed to fermentation medium dilution.
For LegH quantification two medium samples were harvested from the bioreactor at the 66th hour and processed according to the previously described procedure. Thus, the UV/Vis absorption spectrums for the biomass lysate prior methanol phase initiation were obtained and an average was calculated (Prior MeOH (average)) (see Figure 5.a). The second set of absorption (ABS) measurements was carried out for the biomass lysate sample harvested at the 140th hour (end of the fermentation), see Figure 5.a (sample 1 and sample 2). In order to determine the absorption, increase at the characteristic wavelength in respect to the pre-induction sample, the first averaged absorption set data was subtracted from the second averaged set, thus obtaining the information on the relative ABS increase due to LegH production (see Figure 5.b).
The measured ABS increase for the post-induction samples amounted to 0.162. For estimating the concentration of heme and, leghemoglobin respectively, in the biomass lysate the previously constructed calibration curve was used (see Appendix B). Finally, using equation (9) and taking into account the final dilution (x200) of the sample prior measuring the absorbance, the LegH yield per gram of dry biomass was calculated and amounted to 0.513 mg·gDCW -1.
4. Discussion
Primarily, the obtained experimental data on ethanol production in K. phaffii cultivations under the conditions of excess substrate, indicate that the even at relatively low initial glucose concentrations (5 g·L -1) ethanol synthesis is stimulated. From cultivations 1 – 3 it can be observed that the ethanol concentration during the batch phase is proportional to the initial glucose concentration, e.g., 0.2, 1.8 and 3.8 g·L -1 of ethanol at initial glucose concentration of 5, 10 and 20 g·L -1 respectively. The latter could be a potential bottleneck in the utilization of glucose-containing fermentation mediums for processes, where K. phaffii is used as the production platform. One aspect is the inefficient utilization of available substrate for biomass growth, e.g., a portion of the available substrate is converted into the secondary metabolite. Even though eventually, when the glucose is depleted, the yeast switches to ethanol consumption, such intermediate processes lower the final biomass yield as a portion of carbon is lost during the conversion from glucose to ethanol. The latter can be observed from the difference in Yxs estimated for the batch phase of the first (higher ethanol production) cultivation and the feeding phase of the third (no ethanol production) cultivation. The second most noticeable aspect is the lag, which is present when the biomass switches from one substrate to another, which could prolong the production process. For example, in the case of the LegH production phase the lag of switching from glucose to methanol amounted to roughly 10 hours.
Considering the stated above, 5 g·L-1 of initial glucose in the cultivation mediums could be suitable for K. phaffii based processing using the proposed medium composition as an alternative to BSM. Furthermore, the amount of biomass produced at the end of the pre-feeding phase is enough to implement continuous feeding techniques, e.g., without posing significant technical constraints on the liquid supply equipment (peristaltic pump productivity).
In comparison to medium based on glycerol as the main carbon source, glucose in the applied medium composition seemed to promote similar biomass growth rates [33]. Although, a decrease in biomass yield from substrate, in relation to previously published data, has been noticed [38]. The latter confirms the fact that glycerol as a substrate, delivers more ATP than glucose under aerobic conditions, leading to higher biomass and product yields compared to the use of glucose [39]. Nevertheless, the properties of glucose, which make it highly easier to quantify at-line during the cultivation can justify the use of this substrate especially in process development, where determination of mass fluxes and calculation of growth kinetics is highly important.
In the context of biomass switching to different substrates, the RQ data exhibited high potential as a means of identifying the current state of the cultivation. In respect to the data available in multiple publications, the RQ value denotes the currently utilized substrate type, e.g., RQ values for fat, protein, and carbohydrate are 0.7, 0.8, and 1.0, respectively. RQ of > 1.0 might suggest excessive substrate provision that can result in the production of metabolites linked to the particular overflow metabolism state. A RQ of < 0.7 might suggest underfeeding and/or utilization of ketones and alcohols as substrates [31]. From the presented data of the third cultivation experiment and the LegH production fermentation, the RQ indicates, that during the feeding phase the supplied glucose was utilized solely for biomass growth (RQ = 1.0 ± 0.1) and the methanol was utilized by the cells during production (RQ = 0.6 ± 0.5). Thus, the applied medium and feeding solution compositions did not induce shifts to metabolite synthesis or limited the biomass growth/recombinant protein production.
Apart from RQ, the gas analysis data (OUR), which was gathered for the third cultivation gave valuable insight into the changes in the culture state, especially at higher biomass concentrations. At RQ = 1.0 ± 0.1 (glucose feeding stage) the oxygen uptake rate grew proportionally to the biomass concentration, thus indicating that the culture remained in a steady state, e.g., the specific oxygen consumption rate (qox) was constant. The latter indicates on the potential of linking the gas analysis data with the biomass concentration, thus creating an indirect estimator (soft-sensor) for measuring cell densities online for the particular process configuration. Furthermore, the permittivity (viable cell density) data also exhibited good correlation both with OUR and biomass density, thus indicating that natural cell lysis and growth remained proportional throughout the cultivation.
The fed-batch fermentation process for the engineered K. phaffii strain, aimed at leghemoglobin production, was managed, taking into consideration the observation from the previously performed cultivations. This fermentation, as was stated previously, was divided into two phases: glucose feeding phase and the methanol feeding phase. The transition to the methanol feeding phase was strategically set at a biomass concentration of 70 gDCW·L-1. The mentioned cell density was selected due to the slight change in cell size, which was observed on the third cultivations 51st hour through optical microscopy (data not shown). The latter could indicate on an increase in osmatic pressure of the medium due to the accumulation of salts. Thus, even though the applied medium and feeding solution composition showed optimistic results in the context of this study, the composition of said solutes should be optimized as part of future research. Nevertheless, to circumvent this issue a lower biomass concentration was selected for the start of the methanol feeding phase.
Upon enabling methanol feeding, we observed a gradual decrease in cell density over time, which appeared to be linked to fermentation medium dilution. This observation has led us to contemplate the possibility that the methanol concentration in the feeding solution should be increased to maintain an equilibrium between the dilution effects and substrate consumption.
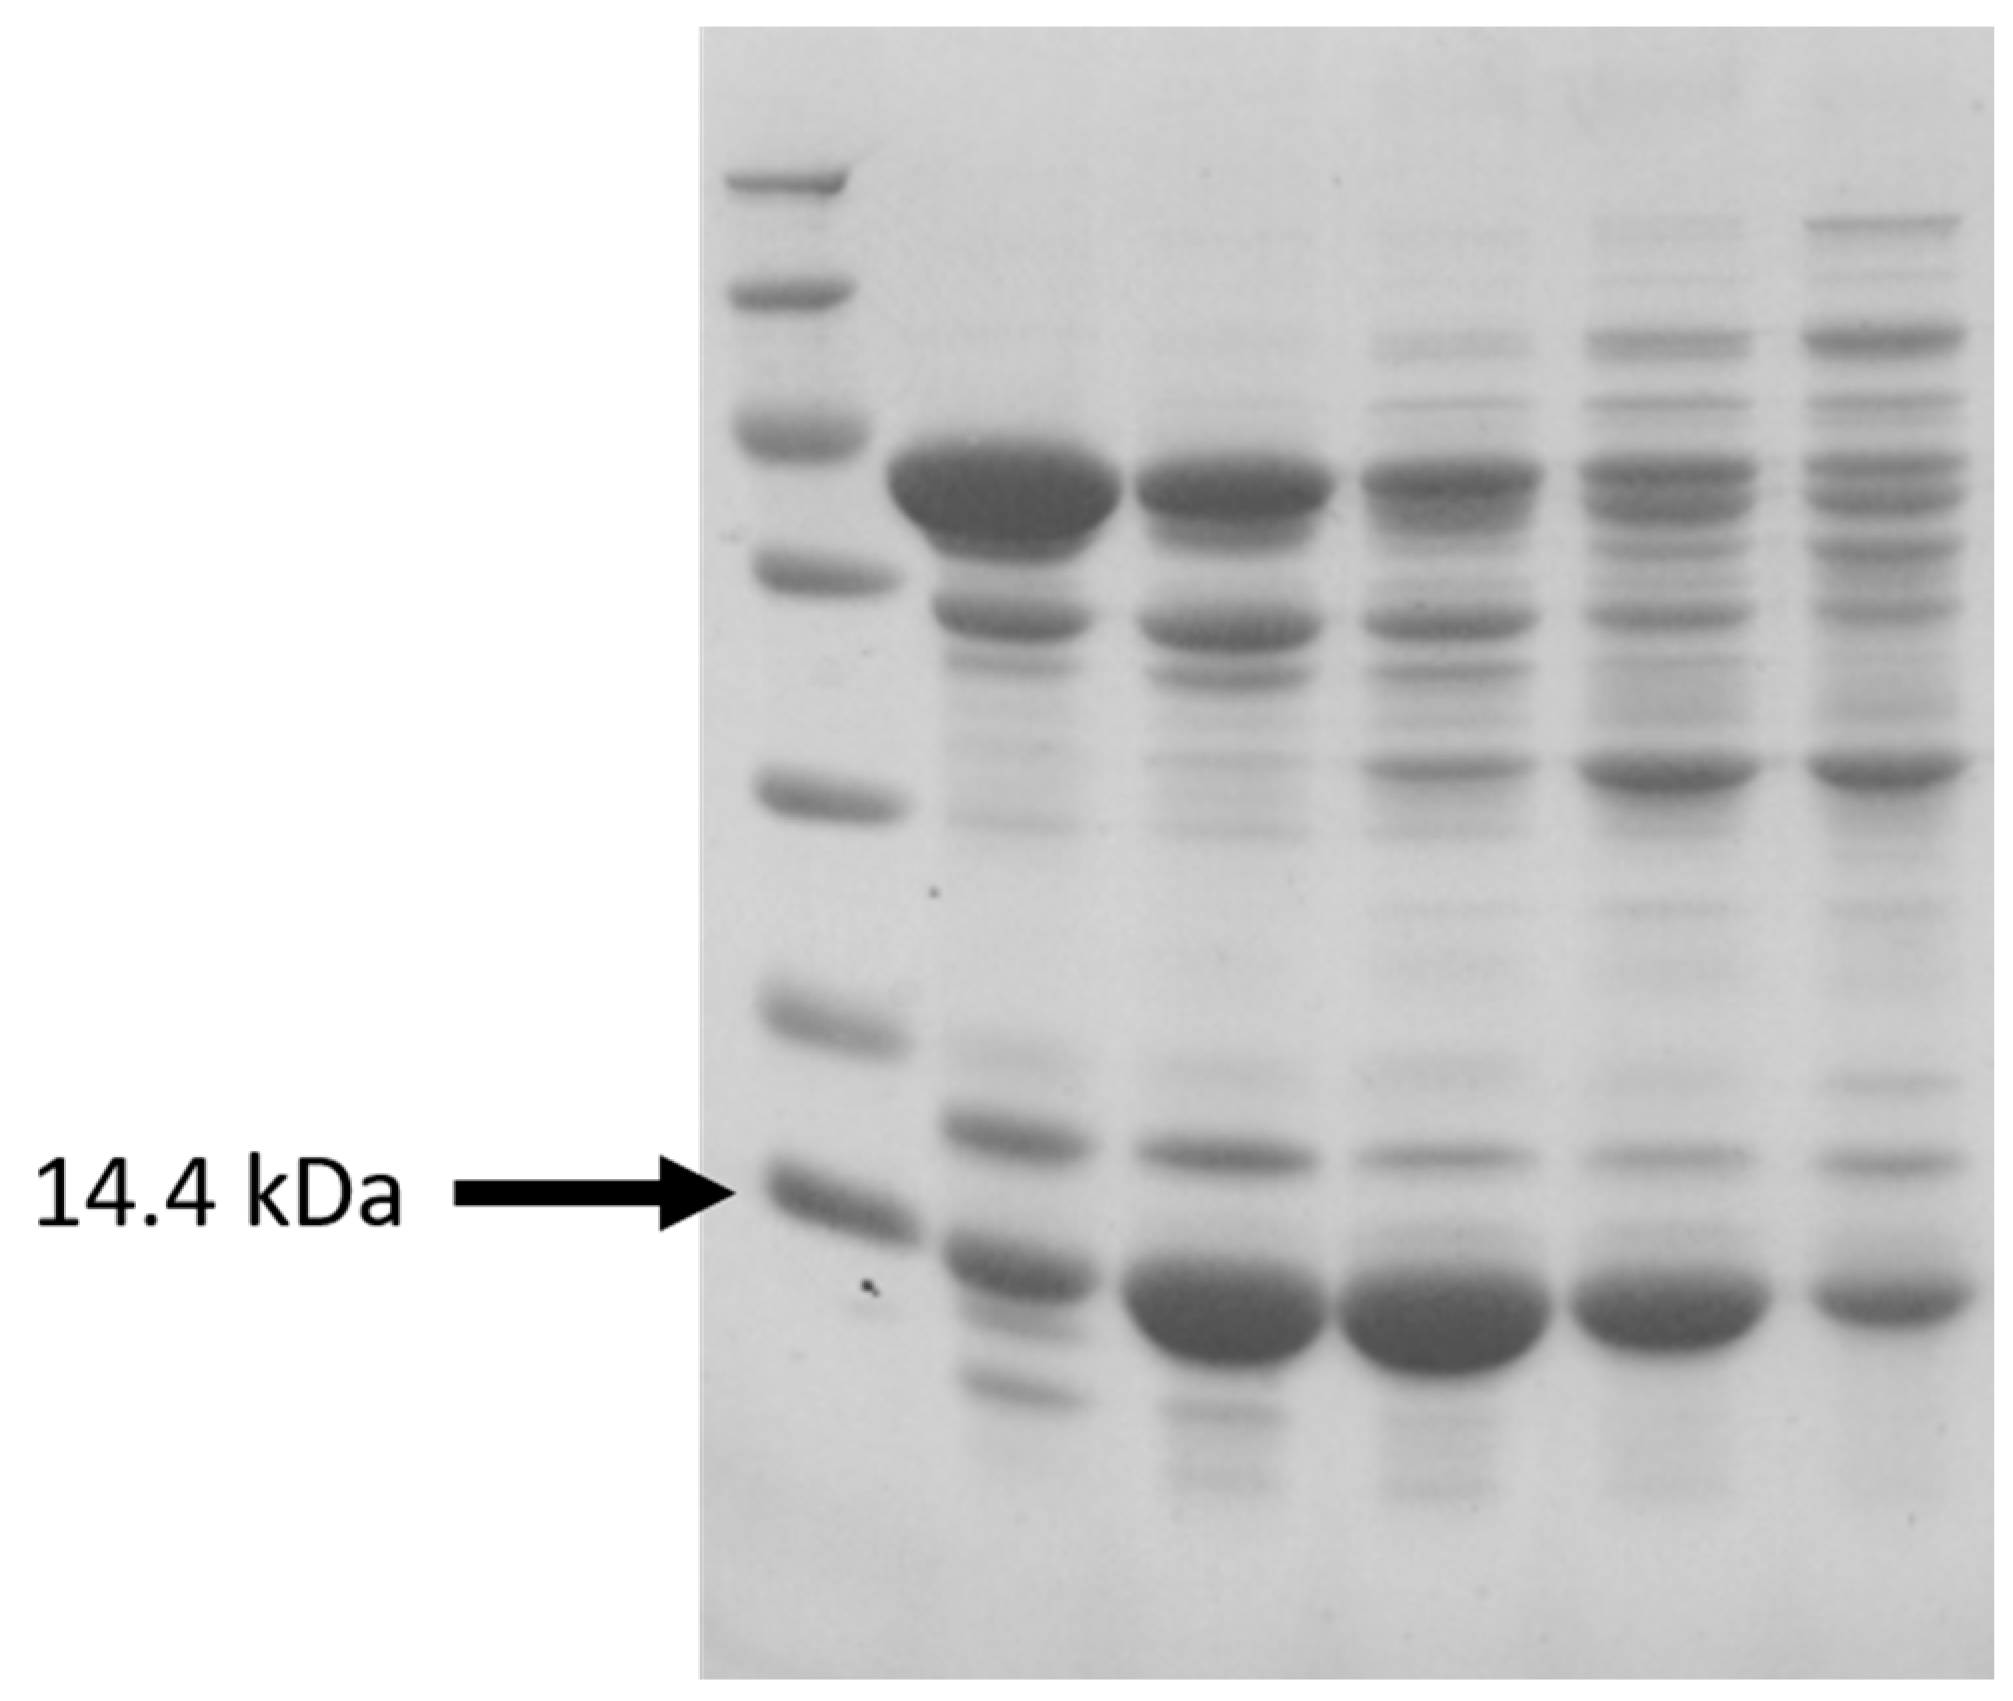
The obtained LegH yield per gram of biomass, as was stated previously, amounted to 0.513 mg·gDCW -1 (additionally confirmed through gel electrophoresis, see Appendix C Figure A3). In comparison to the results published by other authors for similar yeast strains, the mentioned yield is comparable, thus indicating that the particular medium composition effect on protein synthesis is negligible and can be attributed to the peculiarities of the specific K. phaffii modification [3,1,28]. Although, considering the increased LegH yields for recombinant strains holding a higher count of gene alterations as in the results demonstrated by Shao et. al. [28], the current strain should be improved as part of future studies, with the aim of increasing its efficiency and, as a result, commercial potential as a food-grade LegH production platform.
Considering the main goal set for the current article, e.g., production of leghemoglobin in K. phaffii fermentations, the data gathered from the three fed-batch cultivations enabled the development of a protocol (feeding profiles, medium/feeding solution compositions) suitable for this particular strain. Although, as part of future research multiple crucial points have to be addressed, in order to improve and/or optimize the developed methods, e.g., medium/feeding solution optimization and certain improvements of the engineered K. phaffii strain.
Author Contributions
Conceptualization, A.S. and K.D.; methodology, A.S., An.S., E.D., E.B.; investigation, A.S. and K.D.; writing—original draft preparation, A.S., J.D., O.G., J.V.; writing—review and editing, K.D., A.K., J.L. and J.V.; visualization, A.S.; supervision, J.V.; project administration, E.D.; funding acquisition, A.S. All authors have read and agreed to the published version of the manuscript.
Funding
This research was performed with financial support from the ERDF project no. 1.1.1.1/21/A/044 “The development of an efficient pilot-scale leghemoglobine production technology, based on recombinant Pichia pastoris and Kluyveromyces lactis fed-batch fermentations. (BioHeme).
Institutional Review Board Statement
Not applicable.
Informed Consent Statement
Not applicable.
Data Availability Statement
Not applicable.
Conflicts of Interest
The authors declare no conflict of interest.
Appendix A
HEM1 and HEM2 genes synthesized for the integration in K. phaffii
HEM1
cgatgcagctcgcagaccgGGTCTCccATGGAGTTCGTTGCAAGGCAATCCATGAATGCATGTCCCTTTGTCCGTTCTACCAGTACACATCATTTAAAAAAACTAGCAGCAAACTCTAGTTTGGCAGCCACCGCAAGTCACTGTCCAGTTGTTGGCCCCGCTCTACAGCAACAGAGGTACTACTCACAGCCATCTAAACCAGCTCAGGCTCAAACTTCTGACATAGCCACCGGTATCAAAAAGGATGTATCCCCAATCAGAATGGACTCTAACGAAACCGCCTTCGATTACAACGGTATGTATGAATCTGACCTAGCTAATAAGCGTAAAGATAACTCCTACAGATACTTCAACAATATCAACAGATTAGCAAAAGAATTCCCTAAGGCTCATAGACAGACTGAGGACGATAAAGTGACTGTATGGTGCTCCAATGATTATTTGGGAATGGGCCGTCATCCCGAGATCATTAAGACTATGAAAGCCACGATGGATAAGTACGGTTCTGGTGCTGGCGGCACGAGGAACATTGCAGGTCACAACCACGCAGCAATCAATCTGGAATCTGAGCTGGCCTGCCTAAACAAGAAGGAAGCTGCTCTGGTTTTCTCCTCCTGCTTCATCGCAAATGATGCTATTATCTCCTTGCTGGGTCAGAAAATAAAGAACCTGGTCATCTTCAGTGATCAATCTAACCACGCATCTATGATCTTAGGAGTGAGGAACTCTAAGGCTAAAAAGCATATCTTTAAACACAACAATCTTAAGGATTTAGAATCACAGTTGGCTCAGTATCCAAAGTCCACCCCAAAGCTTATAGCCTTCGAGAGTGTGTACAGTATGTGTGGTAGTGTAGCTCCCATTGAAAAAATATGTGATCTGGCAAAAAGGTATGGCGCTTTGACGTTTTTAGATGAGGTCCATGCAGTAGGAATGTATGGTCCTCATGGCCAAGGCGTCGCCGAACACCTGGACTTTGATCTACACTTGCAGTCCGGCATTGCATCCCCAAGTGTAGTAGACAAACGTACAATTTTAGATAGGGTCGATATGATCACGGGTACCTGCGGTAAATCATTCGGAACCGTCGGAGGCTACGTGGCCGGATCTGCTAACTTAATAGACTGGCTGCGTTCCTACGCACCTGGATTTATCTTTACCACAACGCTACCACCTGCTATTATGGCCGGTACGGCAACTTCAGTACGTATTGTTAGGGCTGATATAGAGGCTAGGATTAAGCAACAACTGAATACTCGTTATGTAAAAGACAGTTTCGAGAACCTTGGTATCCCCGTGATCCCCAATCCCTCCCATATCGTTCCAGTATTAGTGGGAAACGCAGCAGATGCAAAGAAAGCCTCCGACATGCTAATGAATAAACACCGTATCTATGTGCAAGCAATAAACTACCCTACAGTGCCAGTGGGTGAAGAGCGTTTGAGAATCACACCTACCCCCGGTCATGGCAAAGAGATTTGCGACCAACTTATCTCCGCTGTCGACGATGTCTTTACCGAGTTGAACCTGCCCCGTATTAATAAGTGGCAATCTCAAGGCGGACACTGCGGCGTGGGTGATGCAAACTATGTTCCTGAACCCAATTTATGGACTCAGGATCAGCTATCTCTTACCAACCAGGATCTTCACAGTAACGTCCACAATCCTGTCATCGAGCAAATTGAGACGTCCTCAGGTGTCAGACTAtaagcttgGAGACCccgagcactatgccgactgagc
HEM2
cgatgcagctcgcagaccgGGTCTCccATGGTACACAAAGCAGAATATTTAGATGATCATCCTACGCAAATATCCTCTATACTATCCGGCGGTTACAATCATCCTCTTTTGCGTGAGTGGCAACATGAGAGACAACTAAATAAAAATATGTTCATATTCCCCTTATTTGTGACTGATAGACCTGATGAGGAAGAACCCATTCCTTCCCTACCTAATATTAAGAGGTTTGGCGTCAATAAACTTATTCCATATGTGGGTGGTCTAGTAGCTAAAGGCCTAAGGGCCGTCATTCTTTTTGGTGTGCCACTTAAACCAGGTGTGAAAGATGAGGAAGGTACCGCAGCAGATGACCCTGAGGGCCCTGTCATCCAAGCTATCAAACACCTACGTAAGAACTTTCCTGACCTTTATATCATTACAGACGTGTGCTTGTGCGAGTATACGAGTCATGGACACTGCGGTATATTATACGAgGACGGAACTATTAATAGGGAGTTGAGTGTAAGACGTATCGCTGCTGTTGCTGTAAAGTATGCCCAAGCTGGTGCCAATAGTGTCGCCCCAAGTGACATGATCGATGGCCGTATAAGAGATATTAAAGAGGGCCTACTTAGTGCCGGCCTGGCTCACAAAACATTCGTTATGTCTTACGCAGCTAAATTCAGTGGTAACTTATATGGTCCTTTCCGTGACGCCGCCGGCTCATGTCCATCTCAGGGTGACAGGAAATGCTATCAACTGCCCTCTGGAGGTAAGGGTCTTGCACACCGTGCCTTGATACGTGATATGAATGAAGGAACTGACGGAATTATTGTCAAGCCCAGTACATTTTACCTGGATATTGTTGCTGATGCTTACCAACTATGCAAAGACTACCCCATATGCTGTTATCAGGTGTCTGGTGAGTACGCAATGCTACATGCCGCCGCTGAGAAGAATATTGTAGATTTGAAATCAATAGCTTTTGAGGCACATCAGGGATTTCTAAGGGCAGGTGCCCGTCTAATTATATCTTATTTTACCCCCGAATTCCTAGAATGGCTGTCTGAAtaagcttgGAGACCccgagcactatgccgactgagc
Appendix B
The LegH quantification method was developed based on the Heme molecules characteristic property of absorbing light at 415 nm. Initially, eight calibration solutions were prepared using hemin. The molar concentration of heme in said solutions was calculated and used for the creation of the calibration curve (ABS vs. Heme, mM). The data on the mentioned solutions are presented in Table A1.

Table A1.
K.phaffii glucose uptake, biomass growth and biomass yield from substrate parameter values identified from the third cultivation data.
Table A1.
K.phaffii glucose uptake, biomass growth and biomass yield from substrate parameter values identified from the third cultivation data.
| Sample Nr. | Hemin, g/L | Heme, mM |
|---|---|---|
| I | 0.00013 | 0.00021 |
| II | 0.00026 | 0.00042 |
| III | 0.00039 | 0.00063 |
| IV | 0.00052 | 0.00085 |
| IV | 0.00065 | 0.00106 |
| VI | 0.00098 | 0.00159 |
| VII | 0.00130 | 0.00212 |
| VIII | 0.00163 | 0.00264 |
The absorption spectrums of each solution were measured in the range of 200 to 700 nm (see Figure A1(a)).
The calibration curve (ABS vs. Heme, mM) was constructed using the absorption values at the peak maximums, plotting them against the respective heme concentrations and fitting a line equation to the obtained data (see Figure A1(b)).
Figure A1.
The construction of the heme vs. ABS calibration curve, which was used for LegH quantification: (a) absorption spectrums for all used hemin samples; (b) the heme vs. abs data with a fitted line equation.
Figure A1.
The construction of the heme vs. ABS calibration curve, which was used for LegH quantification: (a) absorption spectrums for all used hemin samples; (b) the heme vs. abs data with a fitted line equation.
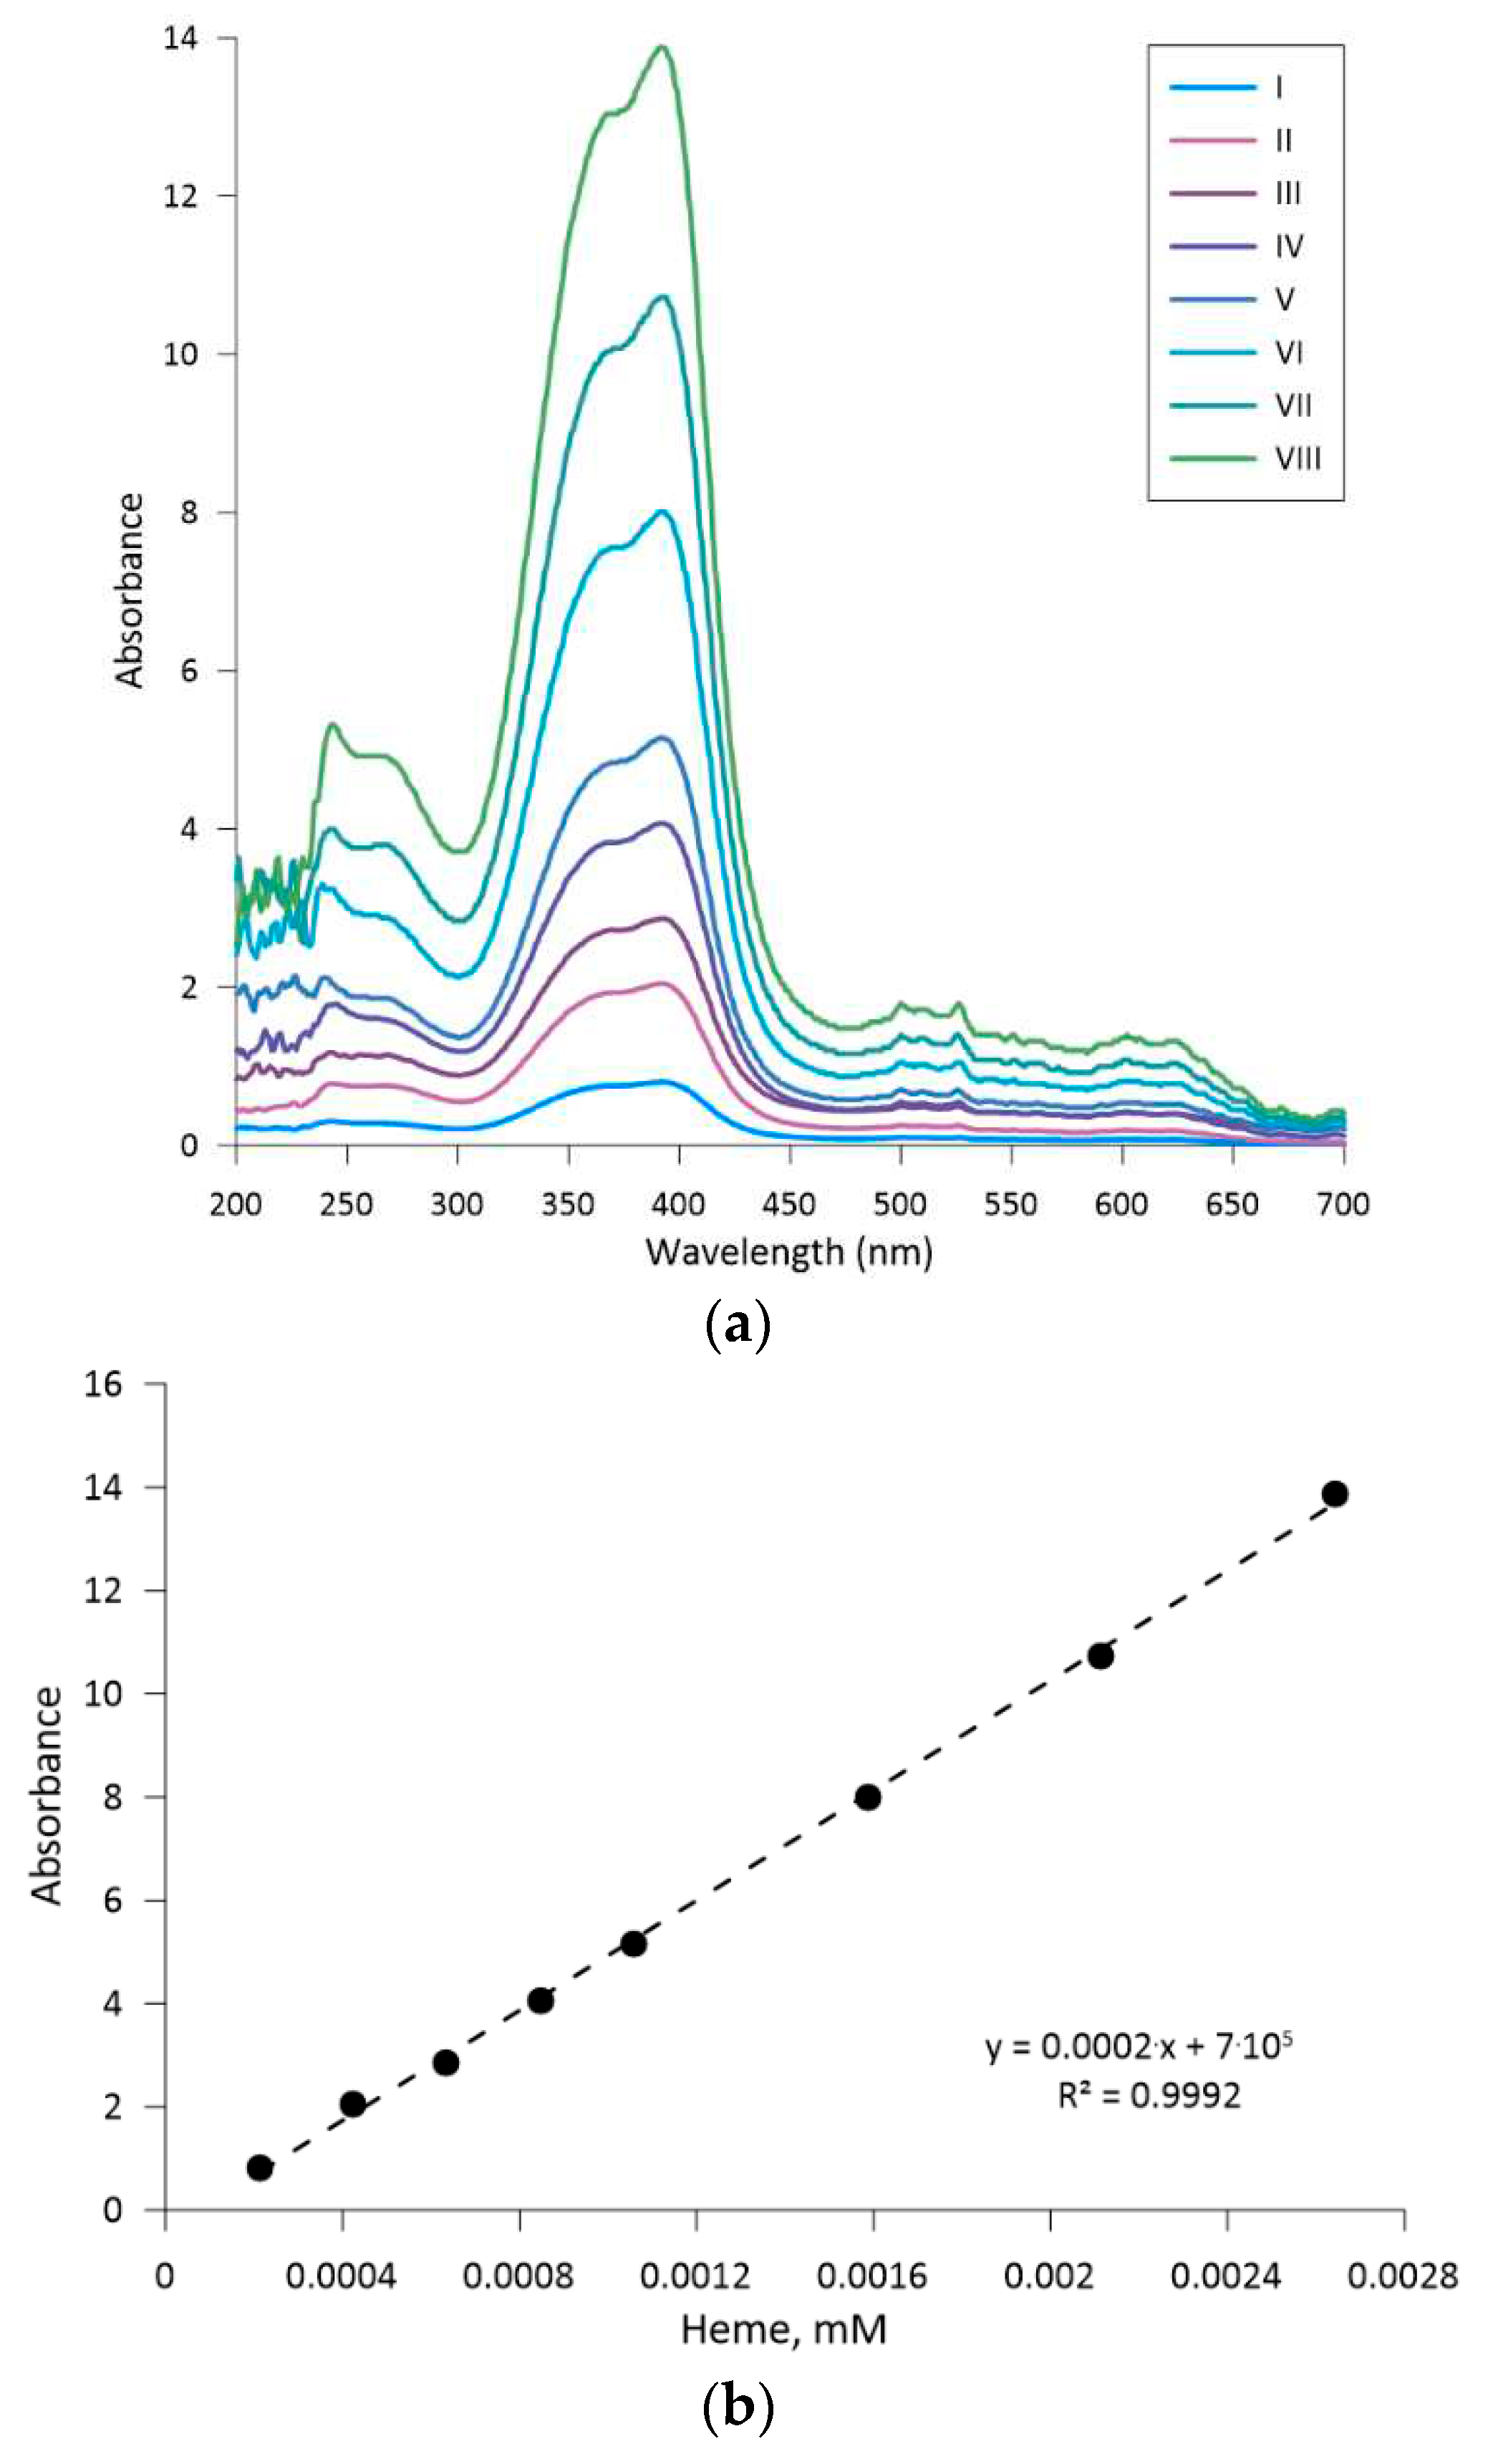
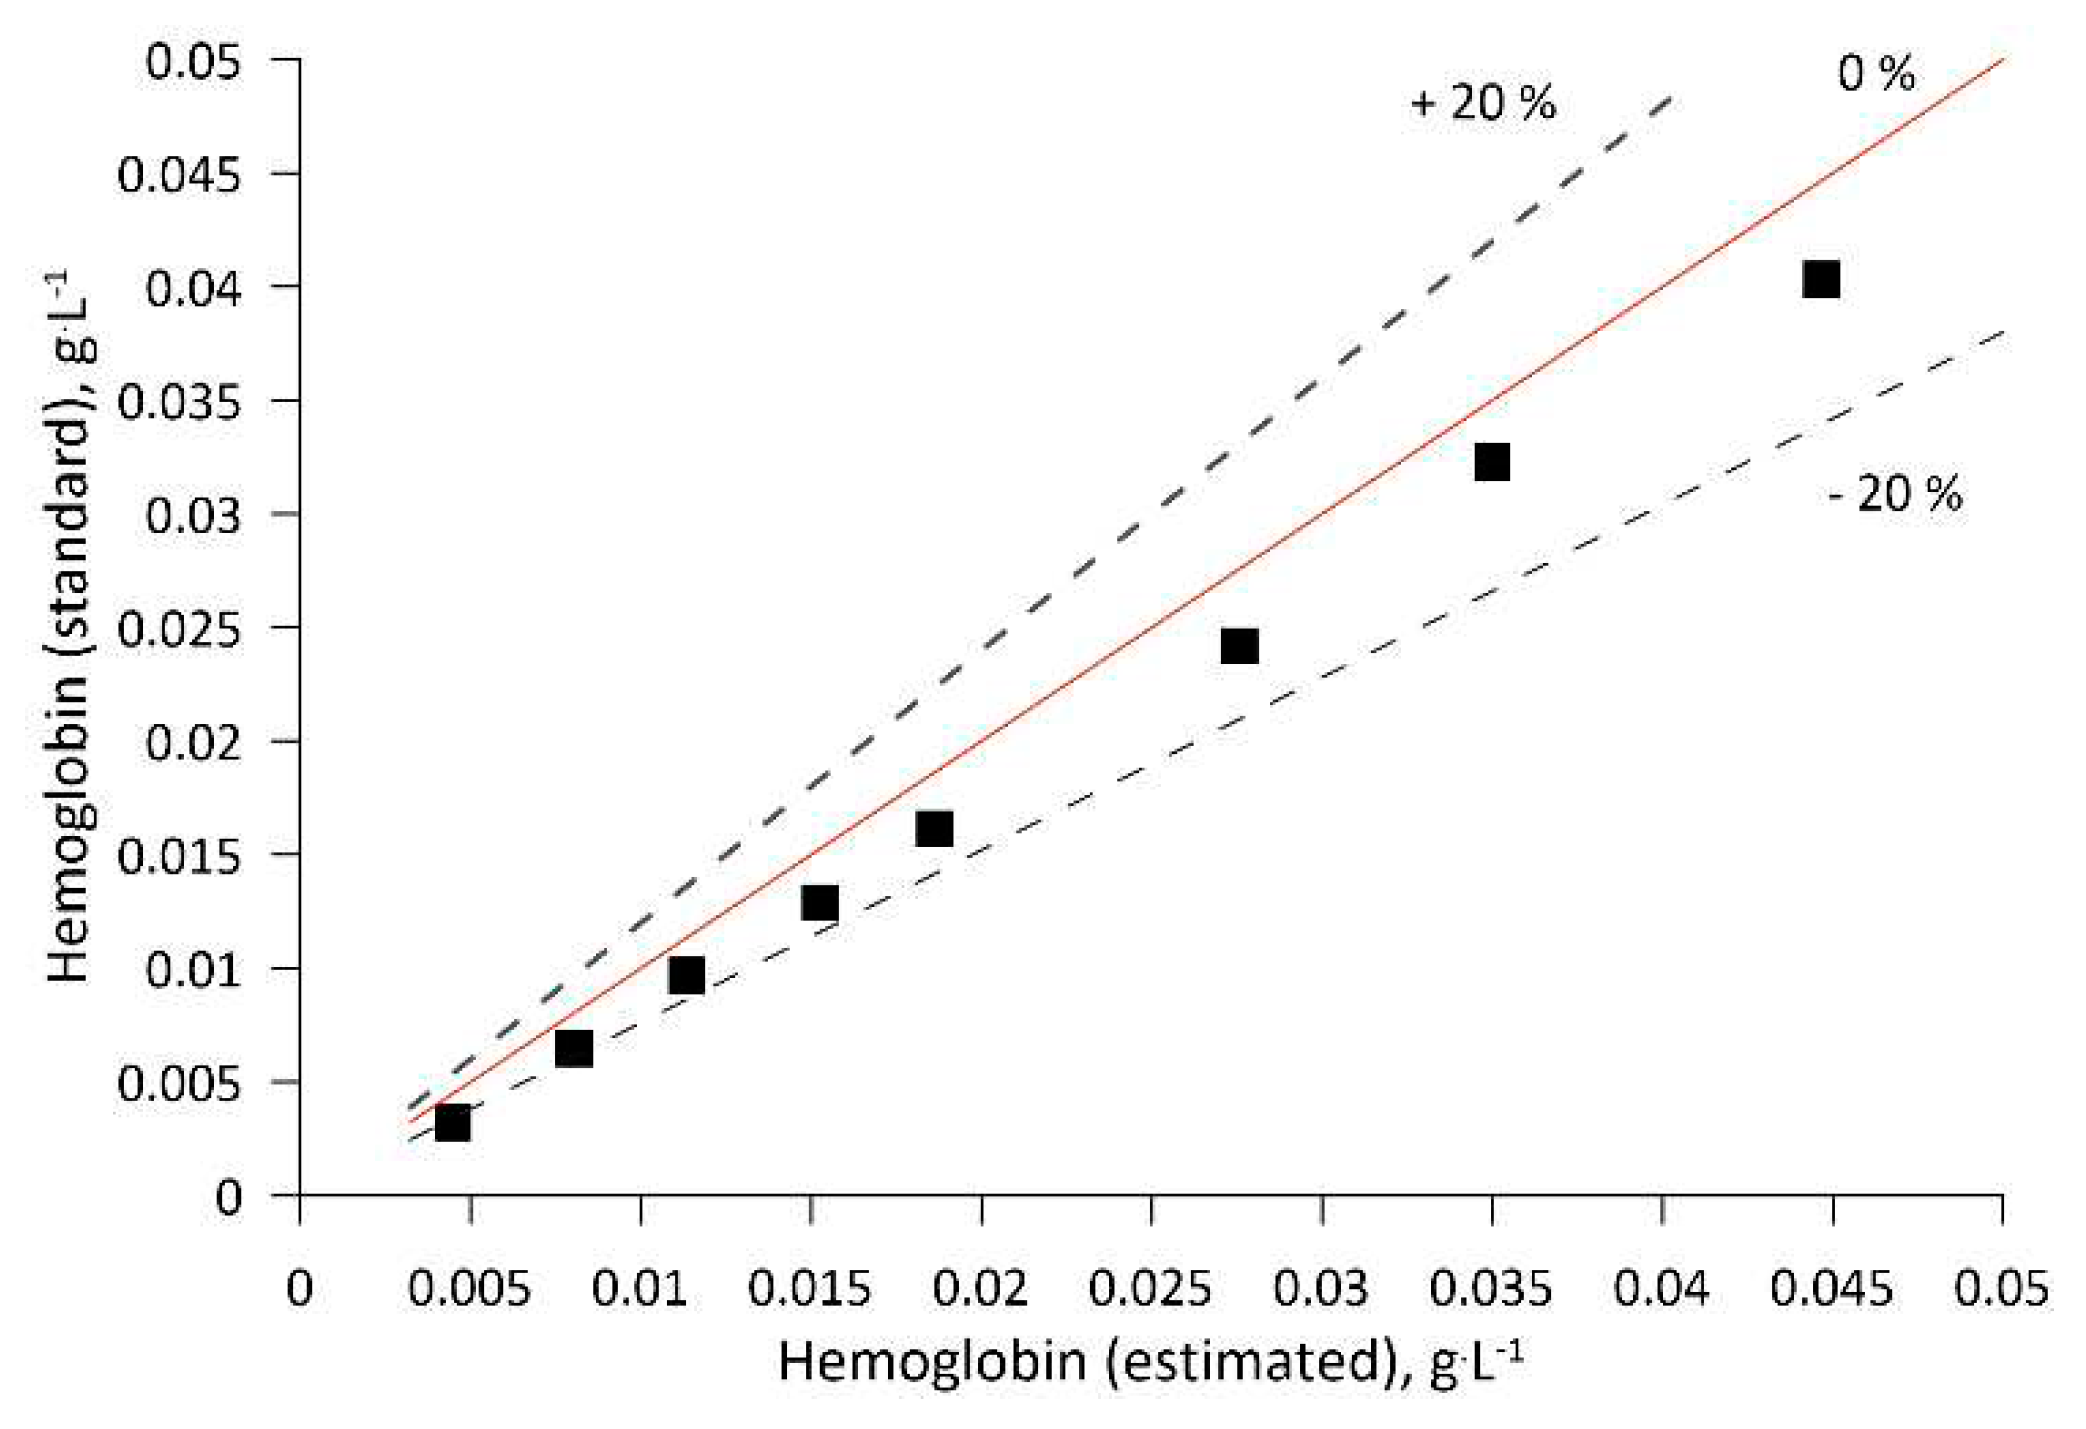
To validate the method a separate set of hemoglobin solutions (standards) were prepared, and their absorption spectrums were measured. By using the previously mentioned linear equation, the hemoglobin concentrations were estimated from the absorption data. The estimated hemoglobin concentration was plotted against the standard concentrations, thus a maximal deviation of 20 % was observed (at lower hemoglobin concentrations).
Figure A2.
The deviations of estimated and standard hemoglobin concentrations.
Appendix C
The heme identification in the sample was performed through gel electrophoresis. The in-depth description of the method can be found in the article by Bolmanis et. al. 2023 [40].
Figure A3.
SDS page photo displaying the presence of LegH in the biomass lysate sample.
References
- BHAT, Zuhaib F., James D. MORTON, Susan L. MASON, Alaa El Din A. BEKHIT a Hina F. BHAT. Technological, Regulatory, and Ethical Aspects of In Vitro Meat: A Future Slaughter-Free Harvest. Comprehensive Reviews in Food Science and Food Safety [online]. 2019, (April 2021). ISSN 15414337. [CrossRef]
- DATAR, I. a M. BETTI. Possibilities for an in vitro meat production system. Innovative Food Science and Emerging Technologies [online]. 2010, 11(1), 13–22. ISSN 14668564. [CrossRef]
- BHAT, Zuhaib Fayaz a Hina FAYAZ. Prospectus of cultured meat - Advancing meat alternatives. Journal of Food Science and Technology [online]. 2011, 48(2), 125–140. ISSN 00221155. [CrossRef]
- IJAZ, Muawuz, Muhammad Kashif YAR, Iftikhar Hussain BADAR, Sher ALI, Md Shafiqul ISLAM, Muhammad Hayat JASPAL, Zafar HAYAT, Aneeqa SARDAR, Sana ULLAH a Denise GUEVARA-RUIZ. Meat Production and Supply Chain Under COVID-19 Scenario: Current Trends and Future Prospects. Frontiers in Veterinary Science [online]. 2021, 8(May). ISSN 22971769. [CrossRef]
- HU, Frank B., Brett O. OTIS a Gina MCCARTHY. Can Plant-Based Meat Alternatives Be Part of a Healthy and Sustainable Diet? JAMA [online]. 2019, 322(16), 1547. ISSN 0098-7484. [CrossRef]
- GODFRAY, H. Charles J., Paul AVEYARD, Tara GARNETT, Jim W. HALL, Timothy J. KEY, Jamie LORIMER, Ray T. PIERREHUMBERT, Peter SCARBOROUGH, Marco SPRINGMANN a Susan A. JEBB. Meat consumption, health, and the environment. Science (New York, N.Y.) [online]. 2018, 361(6399). ISSN 10959203. [CrossRef]
- BOUVARD, Véronique, Dana LOOMIS, Kathryn Z. GUYTON, Yann GROSSE, Fatiha El GHISSASSI, Lamia BENBRAHIM-TALLAA, Neela GUHA, Heidi MATTOCK, Kurt STRAIF, B.W. STEWART, S.D. SMET, D. CORPET, M. MEURILLON, Giovanna CADERNI, S. ROHRMANN, P. VERGER, S. SASAZUKI, K. WAKABAYASHI, M.P. WEIJENBERG, A. WOLK, M. CANTWELL, T. NORAT, P. VINEIS, F.A. BELAND, E. CHO, D.M. KLURFELD, L.L. MARCHAND, R. SINHA, M. STERN, R. TURESKY a K. WU. Carcinogenicity of consumption of red and processed meat. The Lancet Oncology [online]. 2015, 2045(15), 1599–1600. ISSN 14745488. [CrossRef]
- AUNE, Dagfinn, Doris S.M. CHAN, Ana Rita VIEIRA, Deborah A. NAVARRO ROSENBLATT, Rui VIEIRA, Darren C. GREENWOOD, Ellen KAMPMAN a Teresa NORAT. Red and processed meat intake and risk of colorectal adenomas: A systematic review and meta-analysis of epidemiological studies. Cancer Causes and Control [online]. 2013, 24(4), 611–627. ISSN 09575243. [CrossRef]
- SCHWINGSHACKL, Lukas, Carolina SCHWEDHELM, Georg HOFFMANN, Sven KNÜPPEL, Khalid IQBAL, Violetta ANDRIOLO, Angela BECHTHOLD, Sabrina SCHLESINGER a Heiner BOEING. Food groups and risk of hypertension: A systematic review and dose-response meta-analysis of prospective studies. Advances in Nutrition [online]. 2017, 8(6), 793–803. ISSN 21565376. [CrossRef]
- JEYAKUMAR, Arunan, Lakal DISSABANDARA a Vinod GOPALAN. A critical overview on the biological and molecular features of red and processed meat in colorectal carcinogenesis. Journal of Gastroenterology [online]. 2017, 52(4), 407–418. ISSN 14355922. [CrossRef]
- GRUNDY, Anne, Christine M. FRIEDENREICH, Abbey E. POIRIER, Farah KHANDWALA a Darren R. BRENNER. Cancer incidence attributable to red and processed meat consumption in Alberta in 2012. CMAJ Open [online]. 2016, 4(3), E471–E478. ISSN 2291-0026. [CrossRef]
- RUBIO, Natalie R., Ning XIANG a David L. KAPLAN. Plant-based and cell-based approaches to meat production. Nature Communications [online]. 2020, 11(1), 1–11. ISSN 20411723. [CrossRef]
- EDELMAN, P.D., D.C. MCFARLAND, V.A. MIRONOV a J. G. MATHENY. Commentary: In Vitro-Cultured Meat Production. Tissue Engineering. Tissue Engineering [online]. 2005, 11(5–6), 659–662. [CrossRef]
- HUMBIRD, David. Scale-up economics for cultured meat. Biotechnology and Bioengineering [online]. 2021, 118(8), 3239–3250. ISSN 10970290. [CrossRef]
- VERMA, R., E. BOLETI a A. J.T. GEORGE. Antibody engineering: Comparison of bacterial, yeast, insect and mammalian expression systems. Journal of Immunological Methods [online]. 1998, 216(1–2), 165–181. ISSN 00221759. [CrossRef]
- HOCQUETTE, Aurélie, Carla LAMBERT, Clémentine SINQUIN, Laure PETEROLFF, Zoé WAGNER, Sarah P.F. BONNY, André LEBERT a Jean François HOCQUETTE. Educated consumers don’t believe artificial meat is the solution to the problems with the meat industry. Journal of Integrative Agriculture [online]. 2015, 14(2), 273–284. ISSN 20953119. [CrossRef]
- HOPKINS, Patrick D. Cultured meat in western media: The disproportionate coverage of vegetarian reactions, demographic realities, and implications for cultured meat marketing. Journal of Integrative Agriculture [online]. 2015, 14(2), 264–272. ISSN 20953119. [CrossRef]
- BAMFORTH, Charles W. a David J. COOK. Food, Fermentation, and Micro-organisms, 2nd Edition. B.m.: Wiley, 2019. ISBN 978-1-119-55741-8.
- BARZEE, Tyler J., Lin CAO, Zhongli PAN a Ruihong ZHANG. Fungi for future foods. Journal of Future Foods [online]. 2021, 1(1), 25–37. ISSN 27725669. [CrossRef]
- HASHEMPOUR-BALTORK, Fataneh, Kianoush KHOSRAVI-DARANI, Hedayat HOSSEINI, Parastou FARSHI a S. Fatemeh S. REIHANI. Mycoproteins as safe meat substitutes. Journal of Cleaner Production [online]. 2020, 253, 119958. ISSN 09596526. [CrossRef]
- MOLFETTA, Mariagrazia, Etiele G. MORAIS, Luisa BARREIRA, Giovanni Luigi BRUNO, Francesco PORCELLI, Eric DUGAT-BONY, Pascal BONNARME a Fabio MINERVINI. Protein Sources Alternative to Meat: State of the Art and Involvement of Fermentation. Foods [online]. 2022, 11(14), 1–30. ISSN 23048158. [CrossRef]
- KYRIAKOPOULOU, Konstantina, Julia K. KEPPLER a Atze Jan VAN DER GOOT. Functionality of ingredients and additives in plant-based meat analogues. Foods [online]. 2021, 10(3). ISSN 23048158. [CrossRef]
- TENG, Ting Shien, Yi Ling CHIN, Kong Fei CHAI a Wei Ning CHEN. Fermentation for future food systems. EMBO reports [online]. 2021, 22(5), 1–6. ISSN 1469-221X. [CrossRef]
- FRASER, Rachel Z., Mithila SHITUT, Puja AGRAWAL, Odete MENDES a Sue KLAPHOLZ. Safety Evaluation of Soy Leghemoglobin Protein Preparation Derived From Pichia pastoris, Intended for Use as a Flavor Catalyst in Plant-Based Meat. International Journal of Toxicology [online]. 2018, 37(3), 241–262. ISSN 1092874X. [CrossRef]
- YOUSSEF, Cynthia El, Pascal BONNARME, Sébastien FRAUD, Anne Claire PÉRON, Sandra HELINCK a Sophie LANDAUD. Sensory improvement of a pea protein-based product using microbial co-cultures of lactic acid bacteria and yeasts. Foods [online]. 2020, 9(3). ISSN 23048158. [CrossRef]
- BEN-HARB, Salma, Françoise IRLINGER, Anne SAINT-EVE, Maud PANOUILLÉ, Isabelle SOUCHON a Pascal BONNARME. Versatility of microbial consortia and sensory properties induced by the composition of different milk and pea protein-based gels. Lwt [online]. 2020, 118, 108720. ISSN 00236438. [CrossRef]
- HOYT, Martin Andrew a San FRANCISCO. Expression constructs and methods of genetically engineering methylotrophic yeast. US10689656B2. 2020.
- SHAO, Youran, Changlu XUE, Wenqian LIU, Siqi ZUO, Peilian WEI, Lei HUANG, Jiazhang LIAN a Zhinan XU. High-level secretory production of leghemoglobin in Pichia pastoris through enhanced globin expression and heme biosynthesis. Bioresource Technology [online]. 2022, 363(July), 127884. ISSN 18732976. [CrossRef]
- SPADIUT, Oliver, Christian DIETZSCH a Christoph HERWIG. Determination of a dynamic feeding strategy for recombinant Pichia pastoris strains. Methods in Molecular Biology [online]. 2014, 1152, 185–194. ISSN 10643745. [CrossRef]
- INAN’, Mehmet a Michael M MEAGHER’. The Effect of Ethanol and Acetate on Protein Expression in Pichia pastoris. 2001.
- LOOSER, Verena, Dominik LÜTHY, Marcel STRAUMANN, Katrin HECHT, Karel MELZOCH a Karin KOVAR. Effects of glycerol supply and specific growth rate on methanol-free production of CALB by P. pastoris: functional characterisation of a novel promoter. Applied Microbiology and Biotechnology [online]. 2017, 101(8), 3163–3176. ISSN 14320614. [CrossRef]
- MATTHEWS, Catherine B., Angel KUO, Kerry R. LOVE a J. Christopher LOVE. Development of a general defined medium for Pichia pastoris. Biotechnology and Bioengineering [online]. 2018, 115(1), 103–113. ISSN 10970290. [CrossRef]
- GHOSALKAR, A., V. SAHAI a A. SRIVASTAVA. Optimization of chemically defined medium for recombinant Pichia pastoris for biomass production. Bioresource Technology [online]. 2008, 99(16), 7906–7910. ISSN 09608524. [CrossRef]
- BOLMANIS, Emils, Oskars GRIGS, Andris KAZAKS a Vytautas GALVANAUSKAS. High-level production of recombinant HBcAg virus-like particles in a mathematically modelled P. pastoris GS115 Mut+ bioreactor process under controlled residual methanol concentration. Bioprocess and Biosystems Engineering [online]. 2022, 45(9), 1447–1463. ISSN 16157605. [CrossRef]
- PENTJUSS, Agris, Emils BOLMANIS, Anastasija SULEIKO, Elina DIDRIHSONE, Arturs SULEIKO, Konstantins DUBENCOVS, Janis LIEPINS, Andris KAZAKS a Juris VANAGS. Pichia pastoris growth - coupled heme biosynthesis analysis using metabolic modelling. bioRxiv [online]. 2023. [CrossRef]
- PRIELHOFER, Roland, Juan J. BARRERO, Stefanie STEUER, Thomas GASSLER, Richard ZAHRL, Kristin BAUMANN, Michael SAUER, Diethard MATTANOVICH, Brigitte GASSER a Hans MARX. GoldenPiCS: A Golden Gate-derived modular cloning system for applied synthetic biology in the yeast Pichia pastoris. BMC Systems Biology [online]. 2017, 11(1), 1–14. ISSN 17520509. [CrossRef]
- HOPP, Marie T., Benjamin F. SCHMALOHR, Toni KÜHL, Milena S. DETZEL, Amelie WISSBROCK a Diana IMHOF. Heme Determination and Quantification Methods and Their Suitability for Practical Applications and Everyday Use. Analytical Chemistry [online]. 2020, 92(14), 9429–9440. ISSN 15206882. [CrossRef]
- REN, H.T., J.Q. YUAN a K.-H. BELLGARDT. Macrokinetic model for methylotrophic Pichia pastoris based on stoichiometric balance. Journal of Biotechnology [online]. 2003, 106(1), 53–68. ISSN 01681656. [CrossRef]
- FINA, Albert, Gabriela Coelho BRÊDA, Míriam PÉREZ-TRUJILLO, Denise Maria Guimarães FREIRE, Rodrigo Volcan ALMEIDA, Joan ALBIOL a Pau FERRER. Benchmarking recombinant Pichia pastoris for 3-hydroxypropionic acid production from glycerol. Microbial Biotechnology [online]. 2021, 14(4), 1671–1682. ISSN 1751-7915. [CrossRef]
- BOLMANIS, Emils ; Bogans, Jānis; Akopjana, Inara; Suleiko, Arturs; Kazaka, Tatjana; Kazaks, Andris. Production and purification of soy leghemoglobin from Pichia pastoris cul-tivated in different expression media. Processes. 2023.
Figure 1.
Diagrams depicting the changes in biomass, glucose, and ethanol concentrations; oxygen uptake rate; respiration quotient and feeding rate during the first K. phaffii cultivation experiment.
Figure 1.
Diagrams depicting the changes in biomass, glucose, and ethanol concentrations; oxygen uptake rate; respiration quotient and feeding rate during the first K. phaffii cultivation experiment.
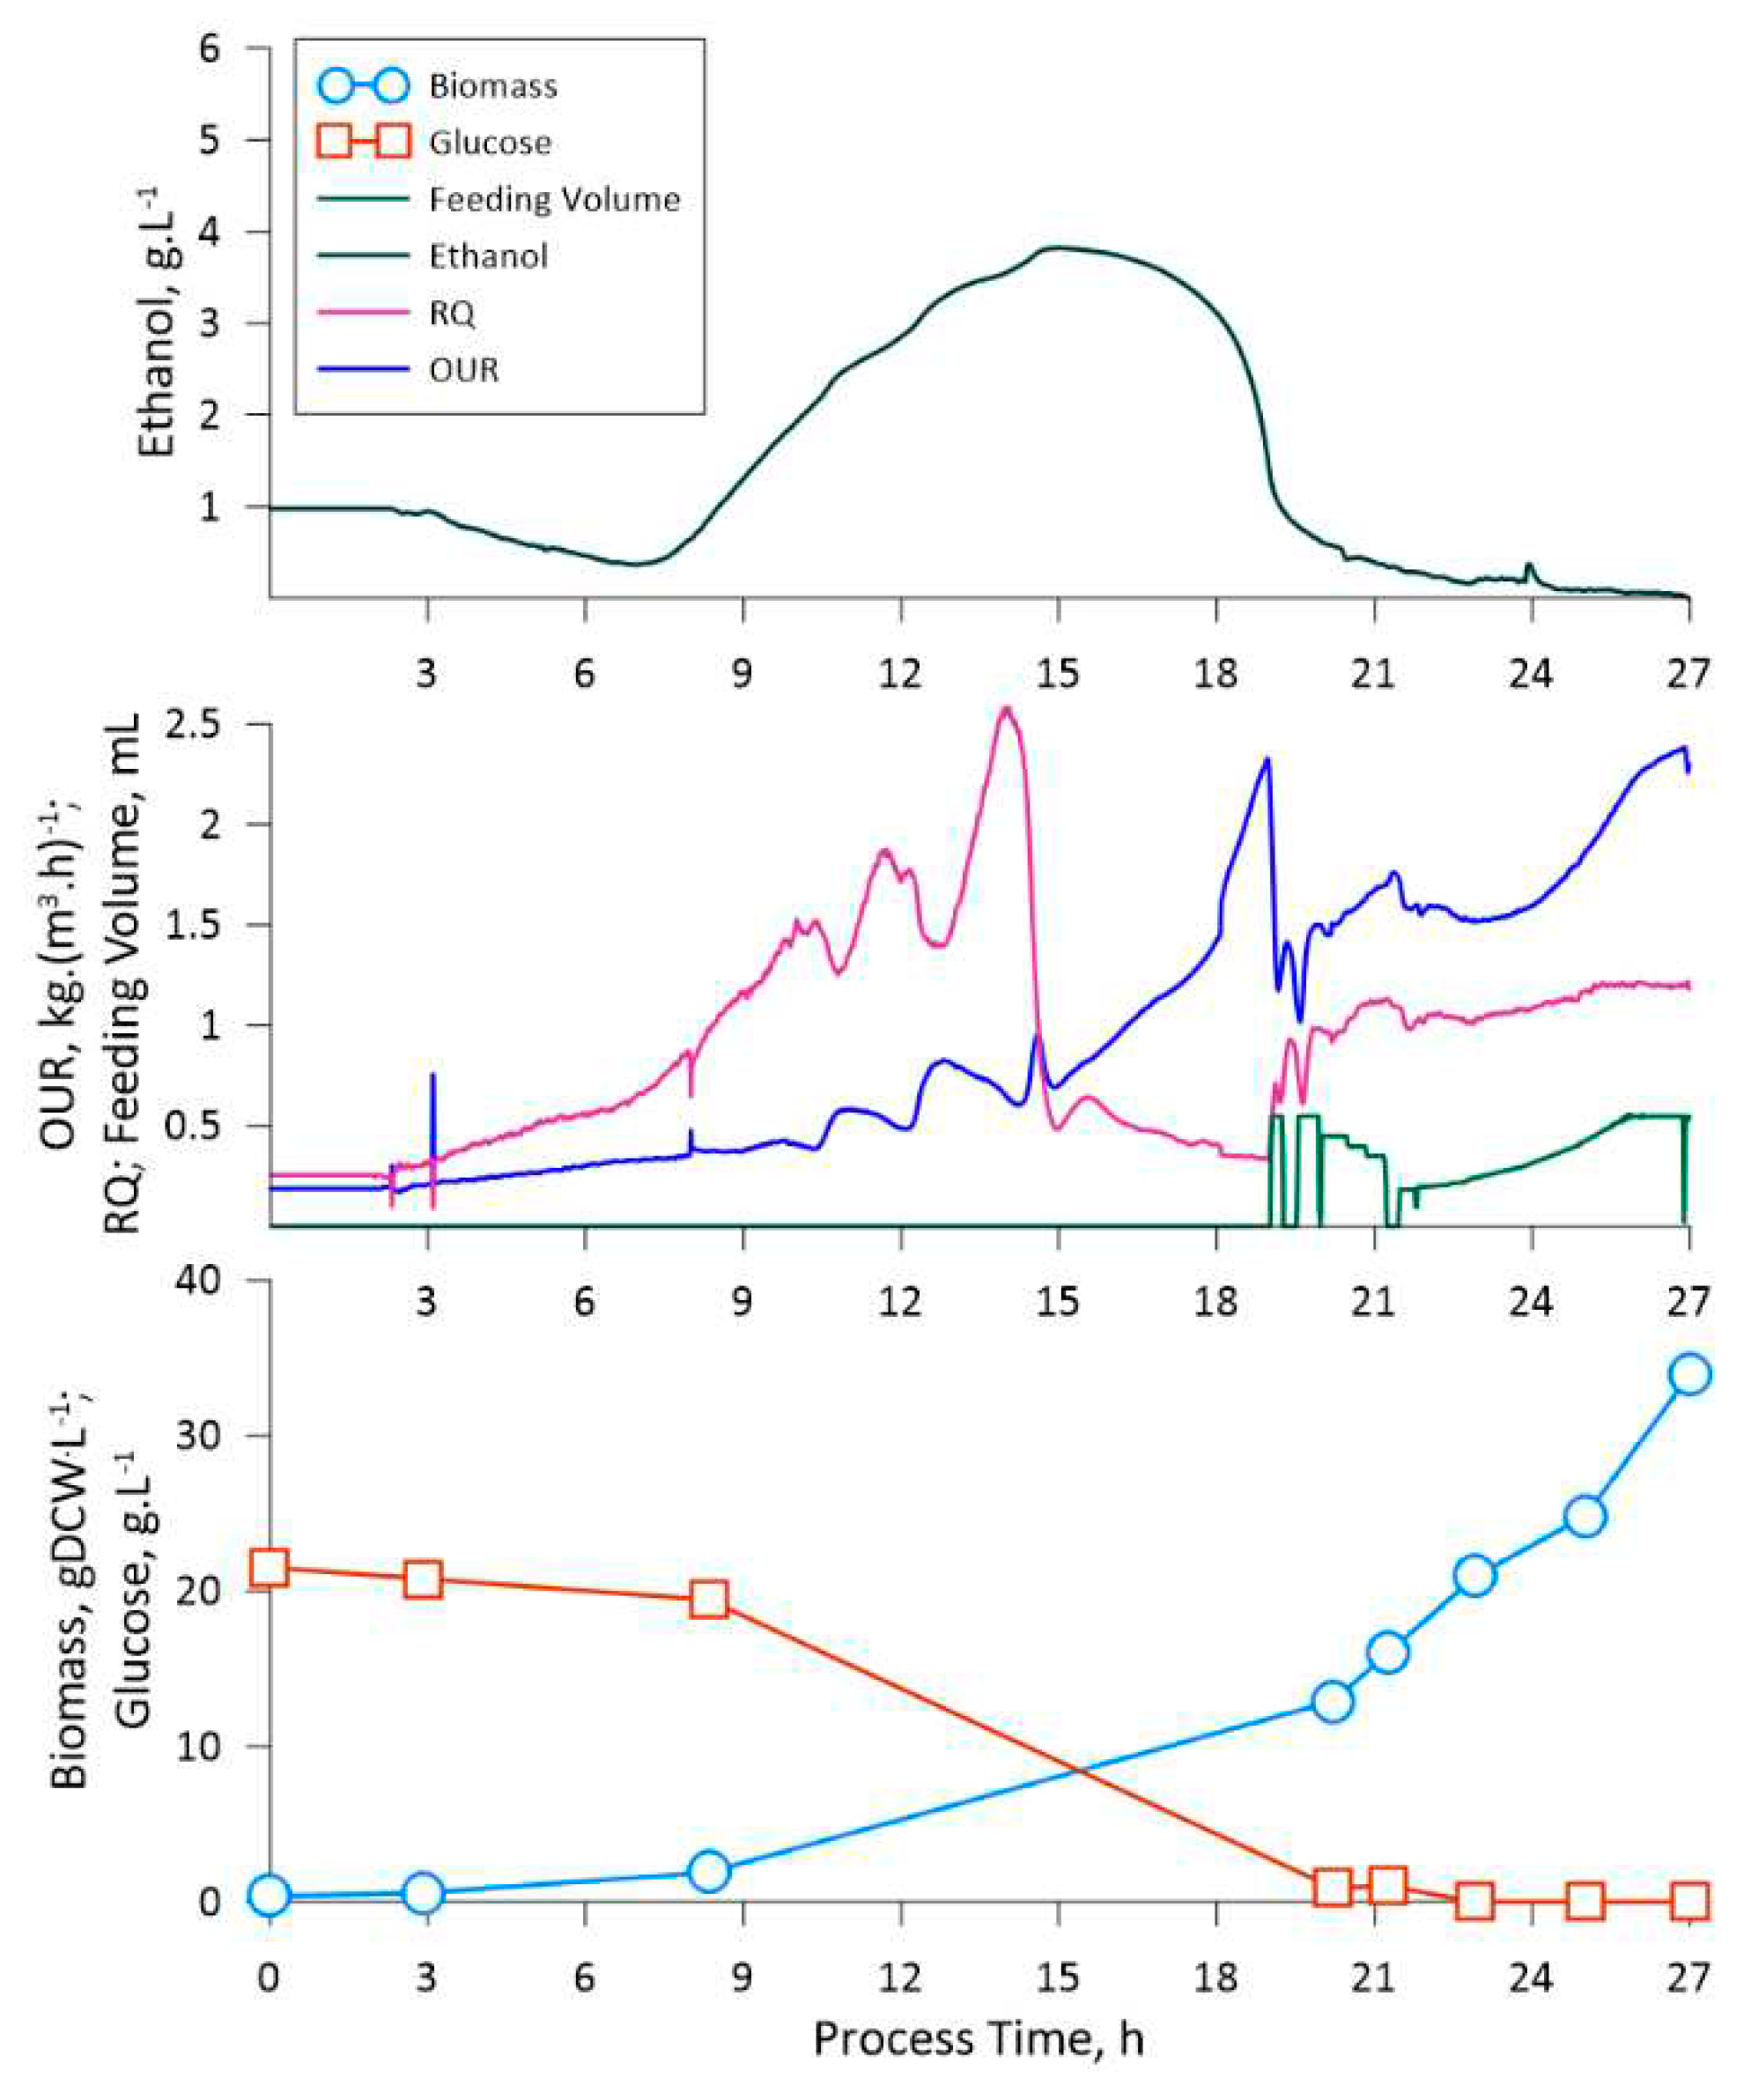
Figure 2.
Diagrams depicting the changes in biomass, glucose and ethanol concentrations and feeding rate during the second K. phaffii cultivation experiment.
Figure 2.
Diagrams depicting the changes in biomass, glucose and ethanol concentrations and feeding rate during the second K. phaffii cultivation experiment.
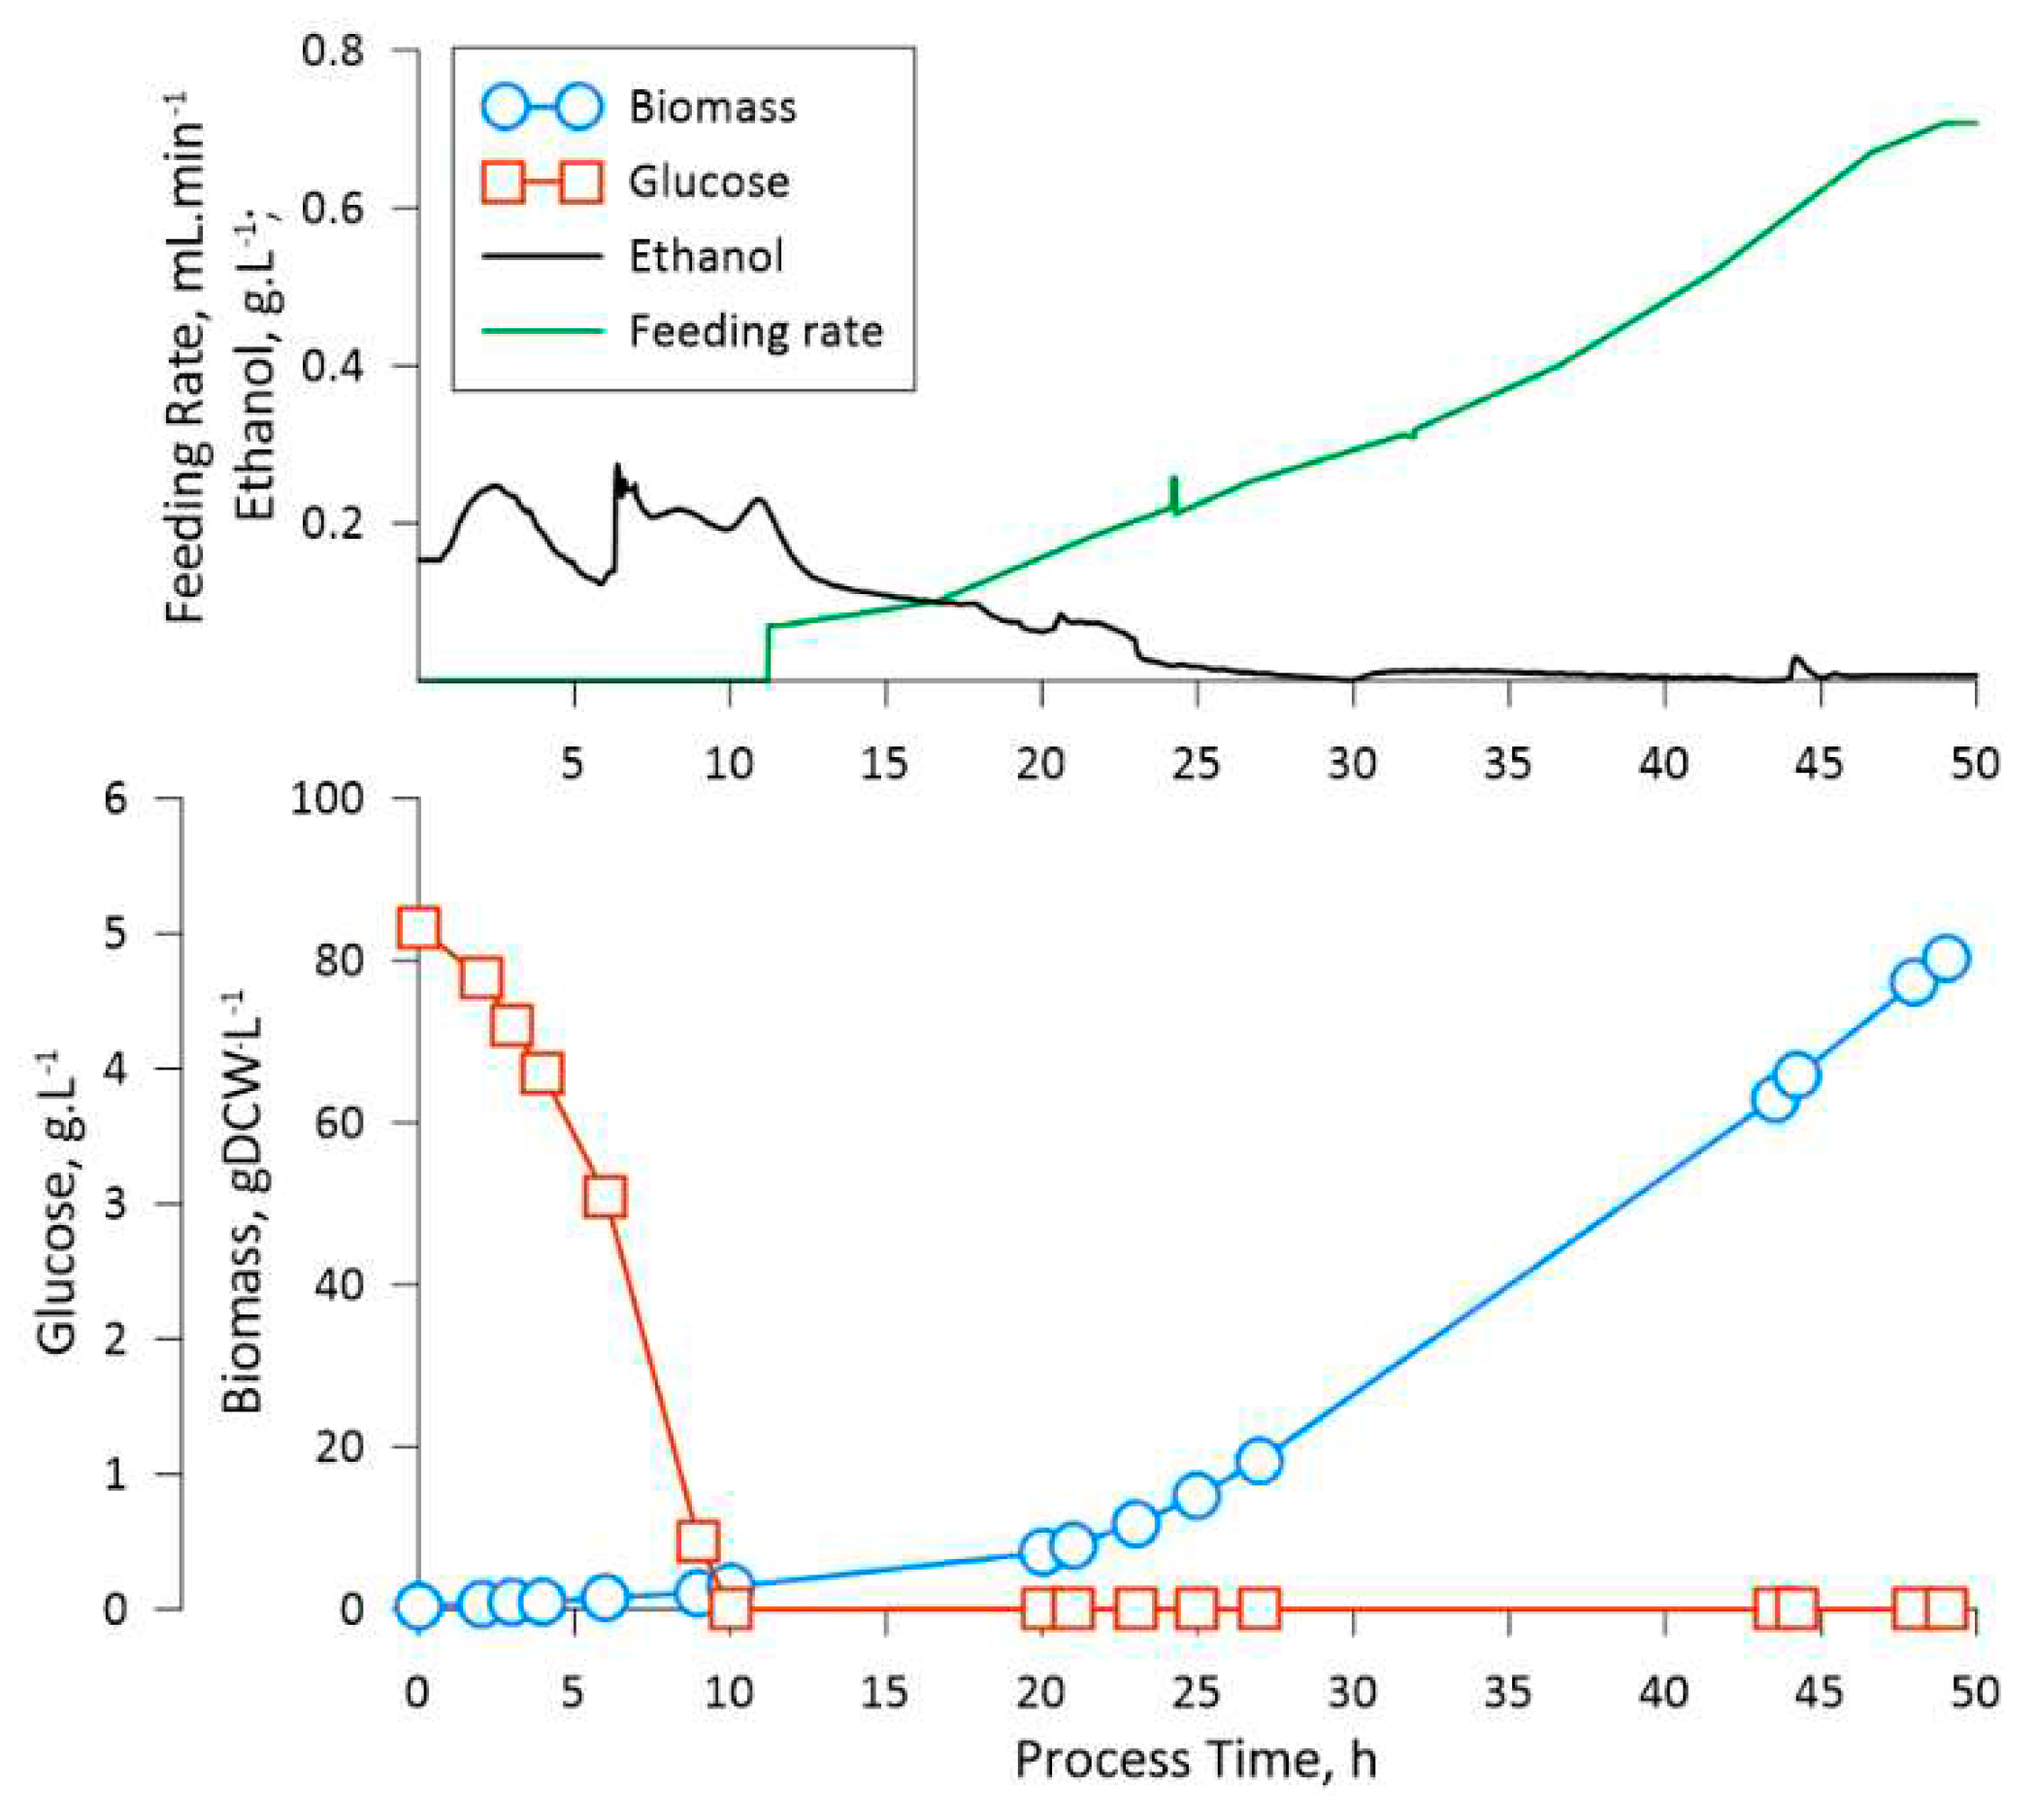
Figure 3.
Diagrams depicting the changes in: (a) biomass and glucose concentrations and permittivity (proportional to viable cell density); (b) oxygen uptake rate; respiration quotient, feeding rate and ethanol concentration during the third K. phaffii cultivation experiment.
Figure 3.
Diagrams depicting the changes in: (a) biomass and glucose concentrations and permittivity (proportional to viable cell density); (b) oxygen uptake rate; respiration quotient, feeding rate and ethanol concentration during the third K. phaffii cultivation experiment.
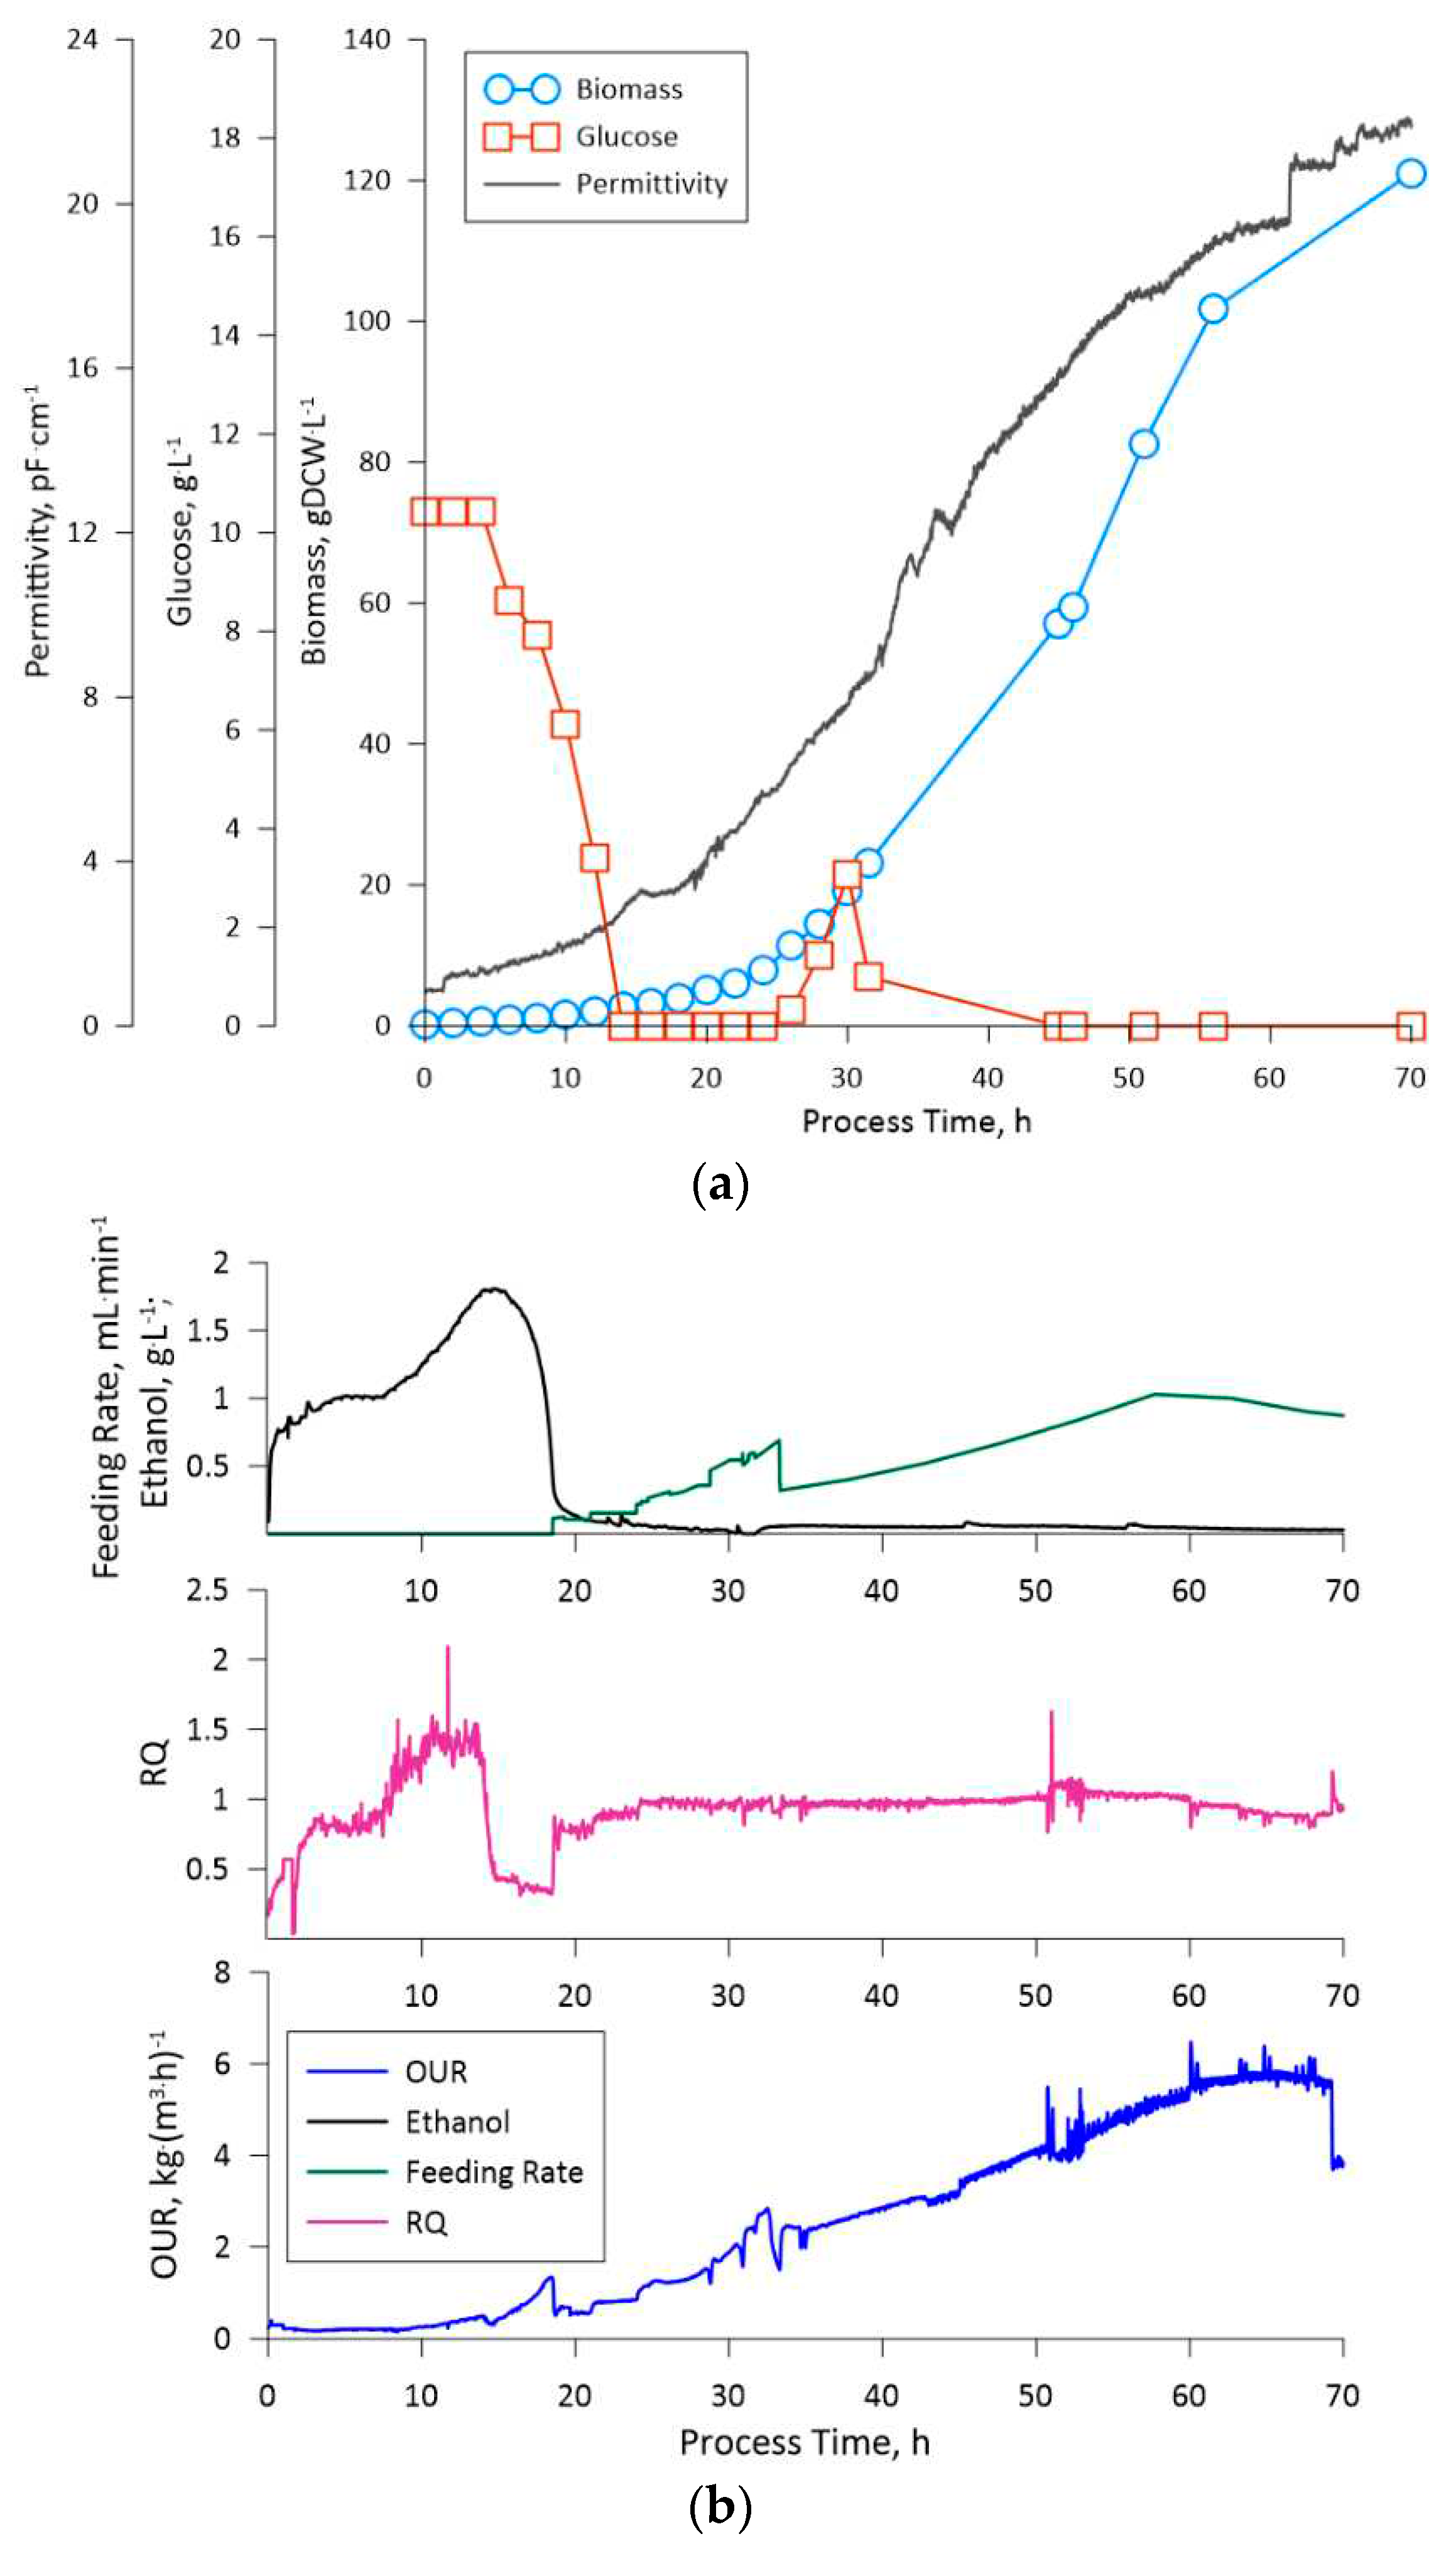
Figure 4.
Diagrams depicting the changes in: (a) biomass and glucose concentrations; (b) respiration quotient, glucose and methanol feeding rate and ethanol/methanol concentration during the LegH production fermentation.
Figure 4.
Diagrams depicting the changes in: (a) biomass and glucose concentrations; (b) respiration quotient, glucose and methanol feeding rate and ethanol/methanol concentration during the LegH production fermentation.
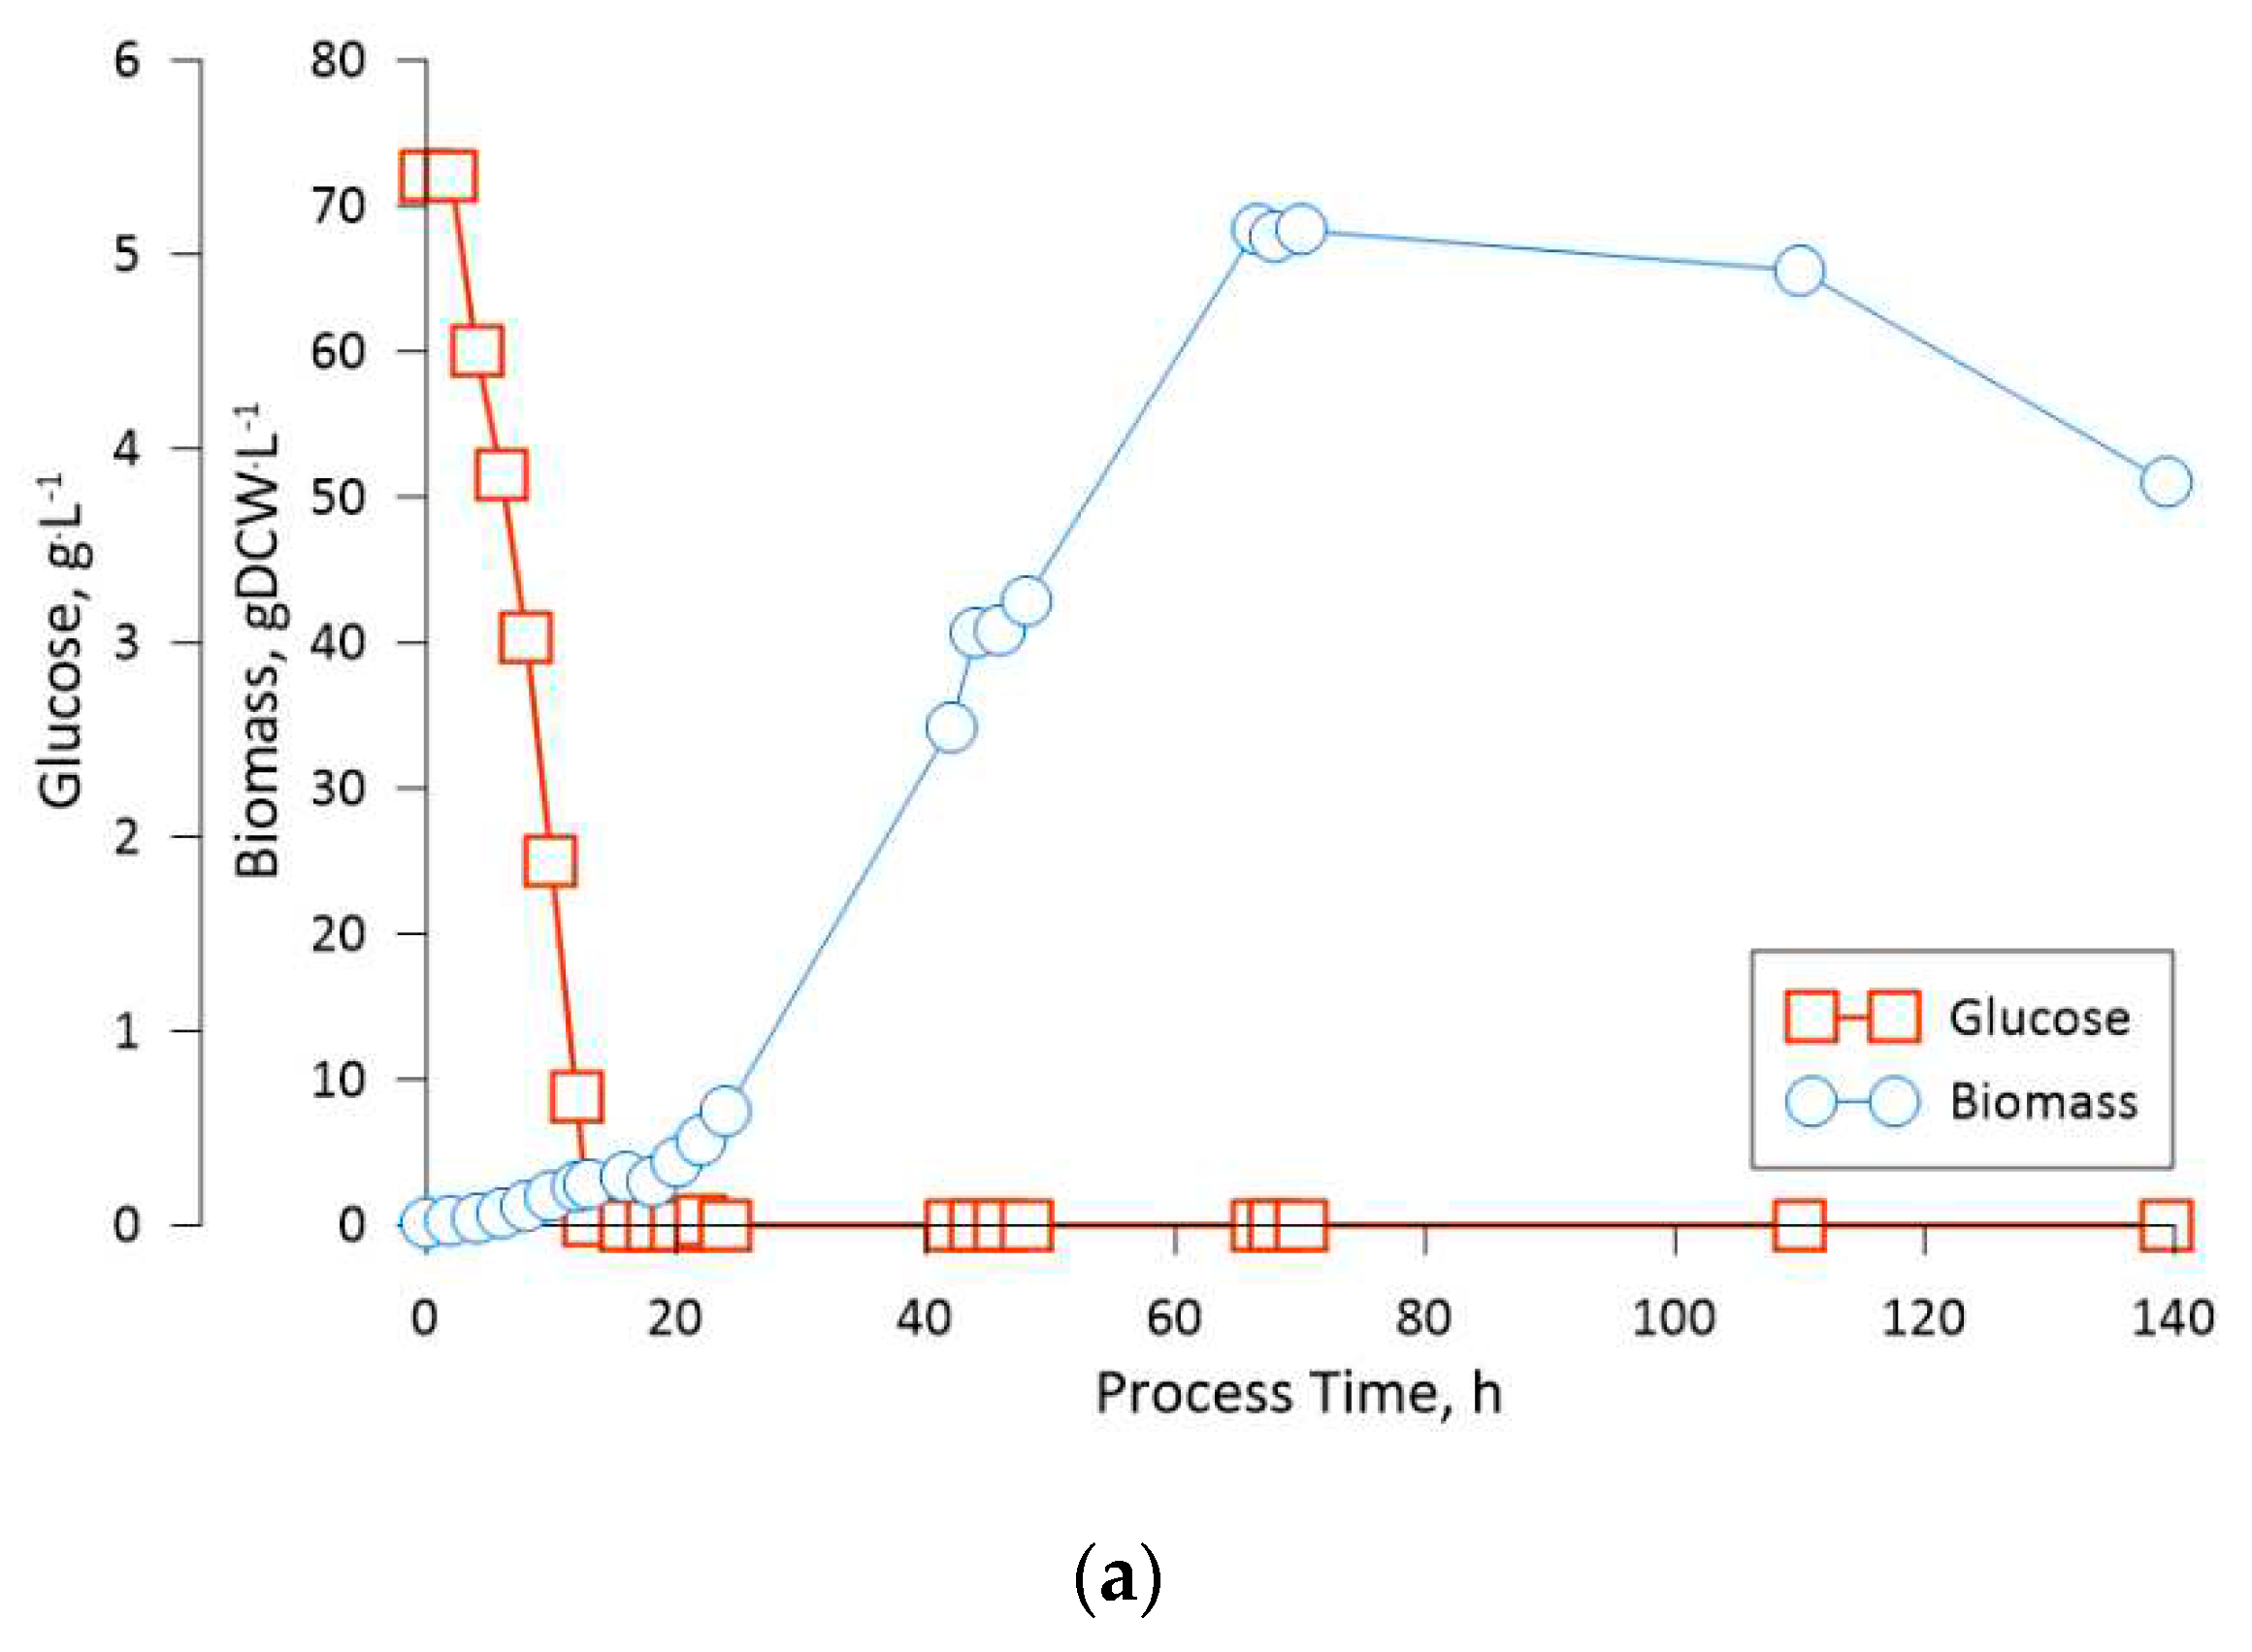
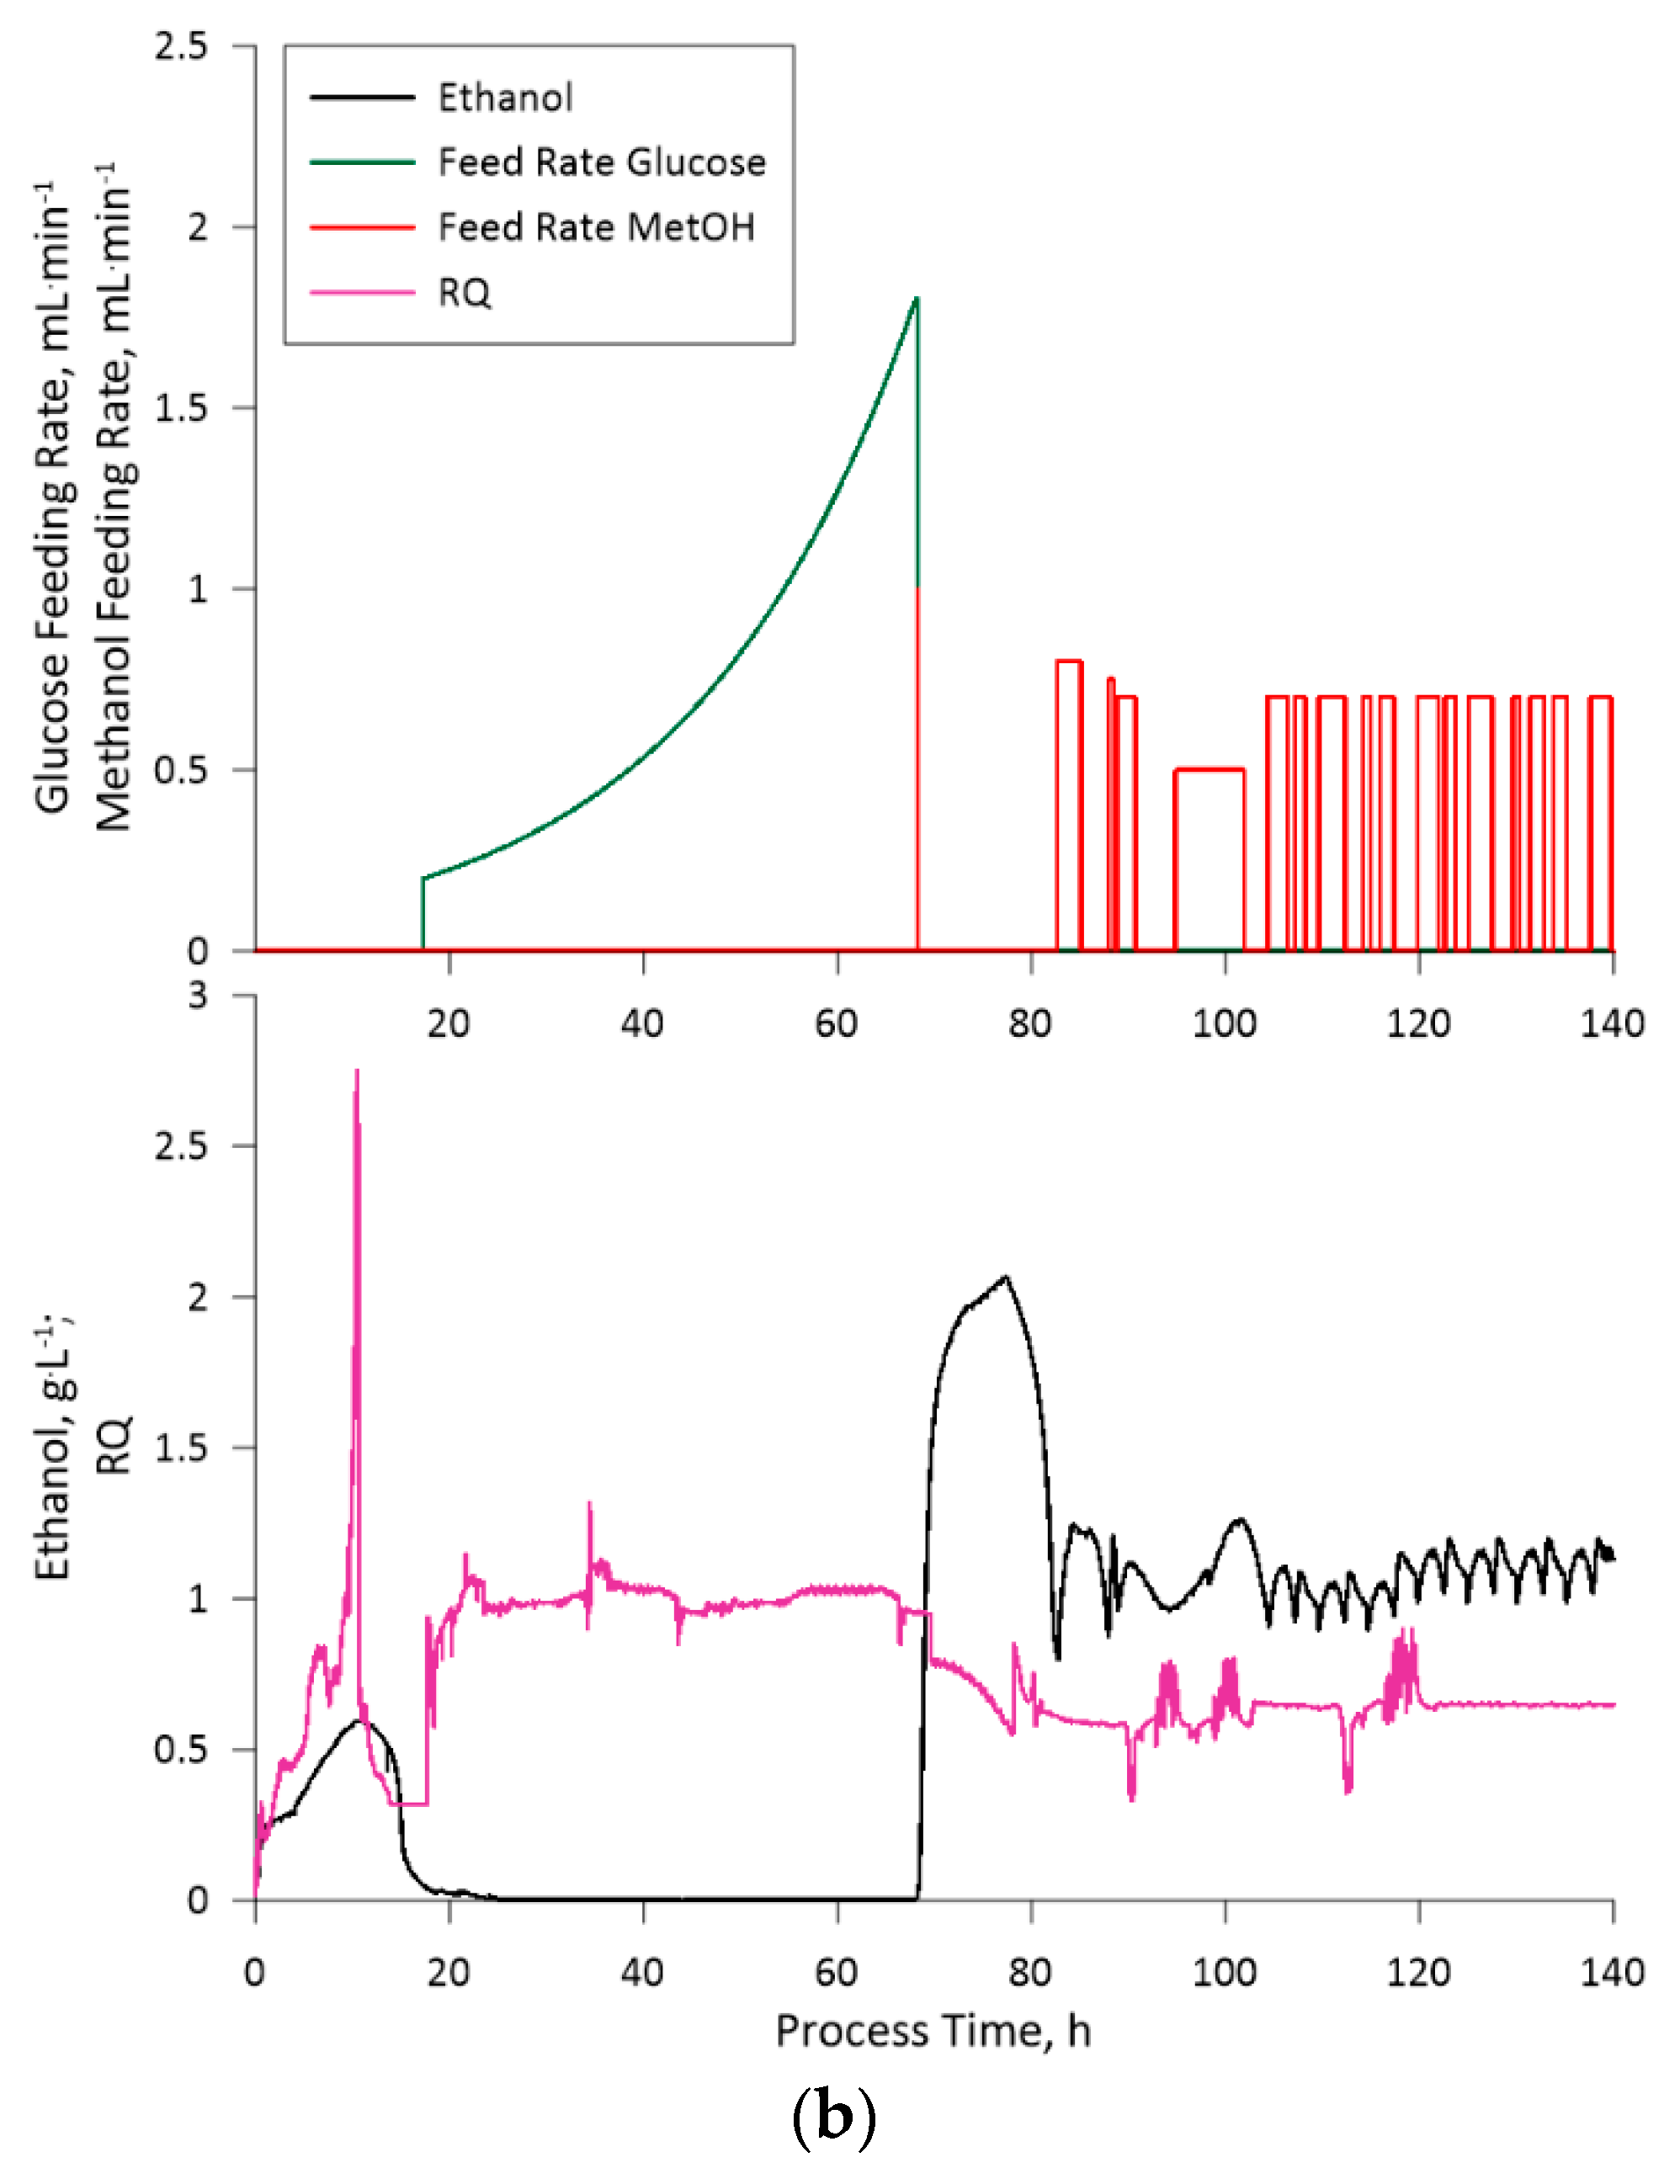
Figure 5.
UV/Vis absorption spectrums. (a) the absorbance of the pre and post-induction biomass lysate samples; (b) relative absorbance of the post-induction lysate sample (averaged) in respect to the pre-induction sample average absorbance.
Figure 5.
UV/Vis absorption spectrums. (a) the absorbance of the pre and post-induction biomass lysate samples; (b) relative absorbance of the post-induction lysate sample (averaged) in respect to the pre-induction sample average absorbance.
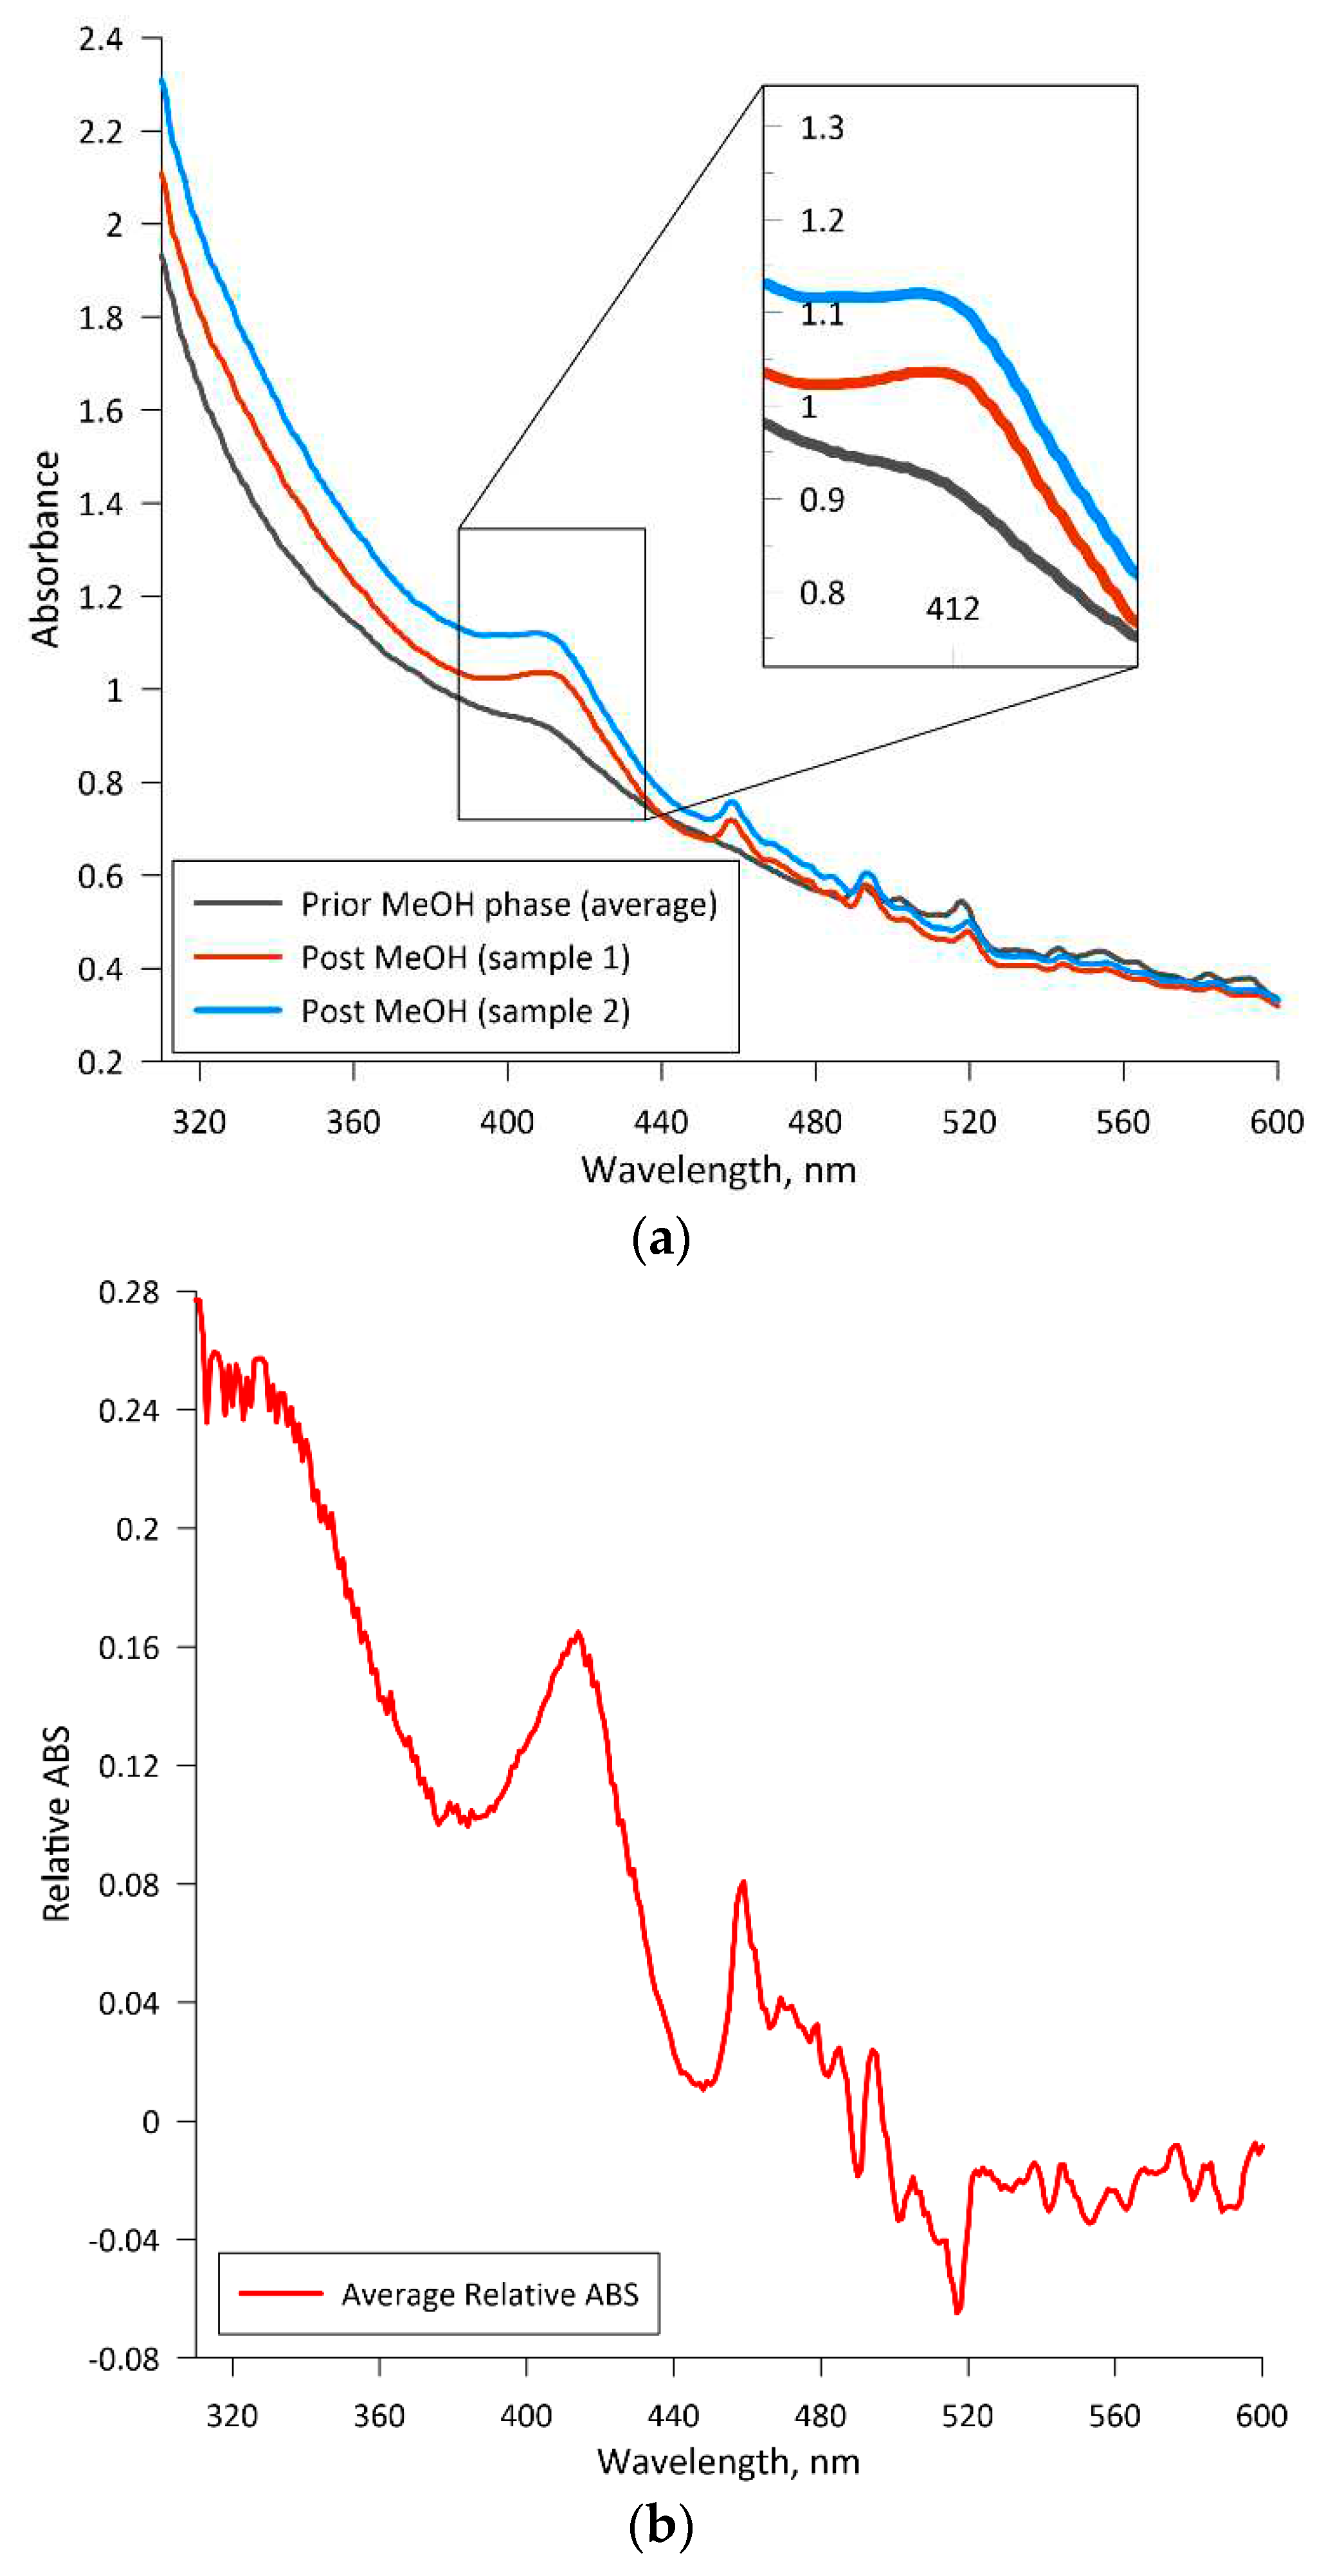
Table 1.
Media and feeding solutions’ composition.
| Component | Batch | Glucose feeding solution | Methanol feeding solution | Component | Vitamin solution | Component | Metal solution |
|---|---|---|---|---|---|---|---|
| g/L | g/L | g/L | |||||
| Glucose | 5,00; 10 or 20 | 400 | - | Ca-panthothenate | 0,001 | CuSO4·5H2O | 0,0003 |
| KH2PO4 | 1,06 | 21,25 | 20 | Nicotinic acid | 0,001 | NaI | 0,0001 |
| K2HPO4 | 0,09 | 1,75 | 1,75 | Inositol | 0,025 | MnSO4·H2O | 0,001 |
| CaCl2·2H2O | 0,005 | 0,20 | 0,20 | Pyridoxine | 0,001 | Na2MoO4·2H2O | 0,0004 |
| (NH4)2SO4 | 1,88 | 75,00 | 75,00 | Para-aminobezoic acid | 0,0002 | H3BO3 | 0,001 |
| MgSO4·7H2O | 0,18 | 7,00 | 7,00 | Biotin | 0,00005 | CoCl2·6H2O | 0,0003 |
| FeSO4·7H2O | 0,003 | 0,016 | 0,016 | Thiamin | 0,001 | ZnSO4·7H2O | 0,0045 |
| Methanol | - | - | 300 | ||||
| mL/L | |||||||
| Vitamin solution | 2 | 4 | 4 | ||||
| Metal solution | 1 | 2 | 2 | ||||
Table 2.
K.phaffii glucose uptake, biomass growth and biomass yield from substrate parameter values identified from the third cultivation data.
Table 2.
K.phaffii glucose uptake, biomass growth and biomass yield from substrate parameter values identified from the third cultivation data.
| Parameter | Value | Dimensions |
|---|---|---|
| Yxs | 0.298 | g·g−1 |
| σmax | 0.81 | g·g−1·h−1 |
| µmax | 0.239 | g·g−1·h−1 |
Disclaimer/Publisher’s Note: The statements, opinions and data contained in all publications are solely those of the individual author(s) and contributor(s) and not of MDPI and/or the editor(s). MDPI and/or the editor(s) disclaim responsibility for any injury to people or property resulting from any ideas, methods, instructions or products referred to in the content. |
© 2023 by the authors. Licensee MDPI, Basel, Switzerland. This article is an open access article distributed under the terms and conditions of the Creative Commons Attribution (CC BY) license (http://creativecommons.org/licenses/by/4.0/).
Copyright: This open access article is published under a Creative Commons CC BY 4.0 license, which permit the free download, distribution, and reuse, provided that the author and preprint are cited in any reuse.


