
Submitted:
28 October 2024
Posted:
30 October 2024
You are already at the latest version
Abstract
This study explores the extraction and characterization of proteolytic enzymes from brewer's spent grain (BSG) and their potential as sustainable coagulants in the dairy industry. BSG samples from various beer types (Blonde Ale, IPA, Kölsch, Honey, and Porter) were obtained from two artisanal breweries in Mar del Plata, Argentina. Optimization of caseinolytic activity (CA) and protein extraction was conducted using a Plackett-Burman design, followed by a Box-Behnken design. Optimal protein concentration was achieved at intermediate pH and high temperature, while CA peaked at pH 8.0. The specific caseinolytic activity (SCA) varied among the extracts, with BSG3 showing the highest activity (99.6 U mg⁻¹) and BSG1 the lowest (60.4 U mg⁻¹). Protease inhibitor assays suggested the presence of aspartic, serine, metallo, and cysteine proteases. BSG3 and BSG4 showed the highest hydrolysis rates for α-casein (70% and 78%). For κ-casein, BSG1, BSG2, and BSG3 demonstrated moderate activity (56.5%, 49%, and 55.8), while BSG4 and BSG5 exhibited the lowest activity. Additionally, the milk-clotting activity (MCA) of BSG extracts was comparable to plant-based coagulants like Cynara cardunculus and Ficus carica. These findings highlight the potential of BSG-derived proteases as alternative coagulants for cheese production, offering a sustainable link between the brewing and dairy industries.
Keywords:
Circular economy
; Barley bioproducts
; vegetable rennet
; biomass sustainability
; food innovation
; enzymes
1. Introduction
Brewer’s spent grain (BSG) is the most abundant solid by-product generated during the beer brewing process, accounting for approximately 85% of the total waste produced by the brewing industry [1]. The increasing demand for a circular economy has driven recent research efforts to optimize its reuse in higher value-added products, thereby reducing the environmental impact of the brewing industry [2]. Currently, there is growing interest in the valorization of BSG due to its high fiber and protein content, making it an attractive raw material for applications in the food, bioenergy, and biotechnology industries [3,4]. Moreover, its nutritional profile, rich in polysaccharides, proteins and phenolic compounds, enhances its potential as an ingredient in functional foods and as a source of bioactive compounds with antioxidant and antimicrobial properties [5,6]. The protein composition of BSG is determined by the enzymatic modifications that barley proteins undergo during the malting and mashing processes. Malting, a controlled germination of barley grains, initiates the partial breakdown of the cell walls, starchy endosperm, and storage proteins. During the early stages of germination, hydrolytic enzymes, including proteases, are synthesized and secreted by the grain. These enzymes play a critical role in protein degradation: endoproteases cleave proteins into peptides, while carboxypeptidases further hydrolyze these peptides into free amino acids, facilitating nutrient availability [7,8]. Proteases, particularly endoproteases, are essential throughout the malting and mashing stages of beer production. Bryce et al. observed that proteolytic activity is initially low during the steeping phase but increases significantly on the first day of germination, reaching its peak by the third day [9,10]. Although partial denaturation of these enzymes occurs during the kilning process, the majority (approximately 90%) remain functional and continue to degrade proteins during mashing [11]. Mashing extends the enzymatic breakdown initiated in malting, leading to further conversion of proteins into peptides and amino acids, which are vital for yeast metabolism during fermentation [11,12]. The stability of proteases, particularly under thermal stress, is a critical factor in their functionality. Studies by Osman et al. and Rizvi et al. on Canadian two-row spring malting barley revealed that certain proteases, including metalloproteases, exhibit notable thermostability [7,8]. These enzymes retain proteolytic activity even after exposure to high temperatures, up to 90°C, demonstrating their robustness and potential utility in various stages of brewing. In this sense, According to Hill and Stewart, the proteolytic activity in barley wort is directly correlated with the efficiency of nitrogen release, which is vital for fermentation [13]. Further research by Laus et al. highlighted that thermostable proteases retain their activity at high mashing temperatures, contributing to more consistent protein breakdown and improving wort clarity [14]. In a study by Jones et al. it was found that specific protease inhibitors in barley can limit protease activity, leading to suboptimal protein degradation in certain barley varieties, thus affecting the final beer quality [15]. Ongoing research focuses on optimizing mashing conditions to maximize protease efficiency, particularly in the presence of high-temperature-resistant proteases, which can enhance the nutritional and sensory attributes of the final product [16,17].
Recently research has extensively explored the protein composition of BSG, revealing its potential for diverse biotechnological applications. Proteins in BSG, primarily composed of storage proteins such as hordeins and glutelins, exhibit a high nutritional value, with considerable amounts of essential amino acids [18]. Beyond the food industry, BSG proteins have shown promise in biotechnological fields such as enzyme production, biodegradable materials, and biofuels. For instance, Xie et al. reported that hydrolyzed BSG proteins serve as an effective nitrogen source in microbial fermentation, optimizing the production of enzymes and bioethanol [19]. Recent studies have highlighted an emerging correlation between beer production and dairy production, driven by the utilization of by-products and sustainable practices across both industries. BSG has been increasingly recognized for its potential as a high-protein, fiber-rich feed supplement in dairy farming. Research by Oancea et al. and Tiruneh et al. demonstrated that BSG supplementation in cattle feed enhances milk yield and improves the nutritional quality of milk, particularly in regions like Europe and North America, where both industries are prominent [20,21]. On the other hand, El-Moneim et al. explored the use of BSG-derived proteins as functional ingredients in dairy products, such as yogurt and cheese, with positive results in terms of texture and flavor [22,23]. This growing body of evidence underscores the value of BSG as a sustainable resource for biotechnological innovations, aligning with the principles of the circular economy [5].
The proposed study is significant as it addresses the unexplored potential of proteases in BSG and their biotechnological applications. Despite the well-known thermostability of these enzymes, no prior research has investigated their presence or optimized their extraction. This research aims to identify and characterize the proteolytic activity in BSG while optimizing the enzyme extraction conditions through mathematical modeling. The study also explores the use of BSG-derived proteases as plant-based coagulants, highlighting the potential cross-industry synergy between the brewing and dairy sectors. Such integration is particularly relevant in countries like Germany and Brazil, where circular economy practices are being employed to reduce waste and improve resource efficiency [24,25]. The growing interest in plant proteases as rennet substitutes in cheese production has already led to the successful application of these enzymes in artisanal cheese making, enhancing both cultural and commercial significance [26,27,28]. Numerous studies have demonstrated the milk-clotting properties of plant-derived coagulants, showcasing their positive impact on the physicochemical, technological, and sensory qualities of curds and cheeses [26,29,30]. By advancing scalable and efficient enzyme extraction techniques and promoting sustainable alternatives to traditional rennet, this study presents a critical opportunity to reduce industrial waste and enhance artisanal cheese production, contributing significantly to sustainability and food innovation
2. Materials and Methods
2.1. BSGs Source
The BSGs were provided by the artisanal breweries “Antares” and “Cheverry”, in the city of Mar del Plata, Argentina.
We designated the BSG used in this work as BSG1, derived from an Blonde Ale beer type, composed of Pilsner malt (87.5%) and Carapils malt (12.5%), sourced from Cheverry Brewery; BSG2, derived from an IPA beer type, which consisted of Pale malt (95.2%) and Crystal malt (4.8%); BSG3 from a Kölsch beer type, containing Pilsner malt (87.5%) and Carapils malt (12.5%); BSG4 from a Honey beer type, composed solely of Pale malt; and BSG5 from a Porter beer type, consisting of Pale Ale malt (75%), Crystal malt (11%), Chocolate malt (7%), black malt (2.5%), wheat malt (4.5%), and oat flakes (4.5%). BSG2, BSG3, BSG4, and BSG5 were provided by Antares Brewery.
2.2. Experimental Design
A Plackett-Burman design was used to determine the significant variables affecting enzyme extraction conditions from BSG. Six independent variables at two levels were evaluated: pH, temperature, homogenization time, dithiothreitol (DTT), Triton X-100, and CaCl2 concentrations. The variables and their levels are shown in Table 1. Two response variables were analyzed: protein concentration and caseinolytic activity. They were measured according to sections Protein determination and Caseinolytic Activity of BSGs extracts.
The significant variables were optimized using a Box-Behnken design (BBD). A Box-Behnken Design (BBD) is an independent, rotatable quadratic design that does not include embedded factorial or fractional factorial points. The variable combinations are located at the midpoints of the edges of the experimental variable space and at the center point [31]. The variables studied and their levels are shown in Table 2. The design included three replicates at the center point.
2.3. Statistical Analysis
The results obtained from the Plackett-Burman and the BBD designs were analyzed and plotted using Minitab Software (Minitab LLC, 2021) and the R software version 3.6.3 [32]. Analysis of variance were used to determine the factors that were significant at the 5% level for both designs, and Pareto charts were plotted. The responses obtained from BBD experiments were analyzed using the response surface methodology (RSM) [33]. Second-order polynomial equations including interaction terms were used to build the models and obtain the coefficients. Analysis of variance was used to determine the significance of each coefficient.
2.4. BSG Protein Extracts
To obtain BSG extracts, different buffers (100 mM Acetate buffer pH 5, 100 mM Phosphate buffer pH 7 and 100 mM Tris-HCl buffer pH 9) were placed in a mixer cup in a 1:5 ratio (BSG:buffer) and supplemented with different concentrations of DTT, Triton X-100, and CaCl2. The mixture was homogenized through 2, 4, or 6 pulses of 30 seconds each, using an immersion blender (SL-SM6038WPN 600 W, Smartlife, Argentina). A water bath was used to fix the temperature to the corresponding value (30, 45, or 60 °C). Then, to obtain the protein extracts, the homogenates were centrifuged at 10,000 g for 20 minutes at 4°C (Thermo Scientific Sorvall ST16R, Fisher Scientific, USA). Once the BSG extracts were prepared, they were sterilized by exposure to shortwave UV light in the UVC band (200–280 nanometers). The supernatant was then collected and stored at -20°C until use.
2.5. Protein Determination
The sample protein content was determined using the bicinchoninic acid (BCA) method [34]. Bovine serum albumin (BSA) was used as the standard for calibration. Protein concentration of the extracts was measured by absorbance at 540 nm using an ELx800 ELISA plate reader (Biotek, USA). Since DTT could interfere with the BCA method [35], the extracts were previously dialyzed. Dialysis of the extract was carried out for 24 h in different buffers, which were replaced after 12 h. The dialyzed extracts were stored at -20°C.
2.6. SDS-PAGE (Sodium Dodecyl Sulfate Polyacrylamide Gel Electrophoresis)
For protein profile analysis SDS-PAGE were performed using 12% (w/v) polyacrylamide gels under reducing conditions, according to the procedure of Laemmli [36]. Samples were dissolved (1:5) in sample buffer containing 60 mM Tris-HCl buffer pH 6.8, 10 %v/v glycerol, 2% SDS, 5 %v/v 2-mercaptoethanol, and 0.05 %v/v bromophenol blue, and heated at 95°C for 5 min. The loading volumes were 5 µL for molecular weight markers (MWM) and 20 µL for the samples. Electrophoresis was carried out at a constant voltage of 100 V during stacking and 120 V until the run was complete. After electrophoresis, the gels were stained with a staining solution containing Coomassie Brilliant Blue R-250 at room temperature for 12 h and subsequently destained with a destaining solution until protein bands were visible against a clear background. The molecular weight of the proteins was estimated by comparing the migration pattern of the bands to the MWM composed of a mixture of BSA (66 kDa), chicken ovalbumin (45 kDa), glyceraldehyde-3-phosphate dehydrogenase (36 kDa), carbonic anhydrase (29 kDa), bovine pancreas trypsinogen (24 kDa), and soybean trypsin inhibitor (20.1 kDa) (Sigma-Aldrich). The gels were scanned and analyzed using the ImageJ software [37].
2.7. Milk-Clotting Activity of BSG1 Extract
To evaluate the milk-clotting activity (MCA) of BSG1 extract, 12 g of skim milk powder (San Regim, Argentina) was reconstituted in 100 mM phosphate buffer pH 6.5 containing 40 µL of 10 mM CaCl₂, to a final volume of 2 mL. The capacity of BSG extract to clot bovine milk was determined by observing the volume and texture of the clots formed after 24 h of incubation at 37 °C. 1 mg/mL commercial chymosin (Chy-Max, CHR-Hansen, Denmark) served as the positive control, while 100 mM phosphate buffer pH 6.5 was used as the negative control. Two different milk:BSG1 ratios were analyzed: 1:1 and 1:2.
2.8. Caseinolytic Activity of BSGs Extracts
The caseinolytic activity (CA) of the BSG extracts was measured using total casein as substrate. 450 µL of each BSG extract was incubated with 150 µL of 2 %w/v casein (Sigma-Aldrich, USA) in 100 mM phosphate buffer pH 6.5 at 37 °C for 5 h. The hydrolysis of casein was evaluated by SDS-PAGE, as described previously. One Caseinolytic Activity Unit (U) was defined according to Equation (1).
where I_(casein+BSG) is the intensity of the band corresponding to casein incubated with the BSG extract, I_casein is the intensity of the band corresponding to casein alone, both calculated from the densitometry of the SDS-PAGE gels.
2.9. Influence of pH and Temperature on CA
The influence of pH on CA of BSG1 extract was determined across a pH range of 3 to 9, using the following buffers: 100 mM acetic acid/acetate buffer (pH 3-5), 100 mM phosphate buffer (pH 6-7), and 100 mM carbonate/bicarbonate buffer (pH 8-9). The activity was determined as described in section Caseinolytic Activity of BSG extracts and was expressed as a percentage relative to the sample exhibiting the highest enzymatic activity (relative activity).
The enzymatic behavior at different temperatures was assessed by measuring CA across a temperature range of 30 °C to 70 °C in 10°C intervals. The activity was expressed as a percentage relative to the sample exhibiting the highest enzymatic activity (relative activity).
2.10. Endopeptidases Inhibition Profile
Endopeptidases are classified into four main groups based on their active sites, according to the MEROPS database [38]: aspartic peptidases, serine peptidases, metallopeptidases, and cysteine peptidases. To determine the main peptidase types that contribute to the proteolytic activity of BSG extract, an inhibition profile was performed. The effect of specific inhibitors on the CA of the BSG1 extract was assessed by pre-incubating the samples with 40 mM pepstatin A (aspartic peptidase inhibitor), 1.5 mM phenylmethylsulfonyl fluoride (PMSF) (serine peptidase inhibitor), 5 mM ethylenediaminetetraacetic acid (EDTA) (metallopeptidase inhibitor), or 4 mM iodoacetamide (cysteine peptidase inhibitor) for 1 h at 37°C. Then, the CA of the BSG1 extract was measured as described in section Caseinolytic Activity of BSG extracts.
2.11. Hydrolysis of the Bovine Casein Subunits
BSG’s endopeptidases activity on bovine α, β and k-casein subunits was determined according to the method described by Pontual [39]. Commercial bovine αs-, β-, and κ-casein subunits (Sigma-Aldrich, USA) with molecular weights of 22-25, 24, and 19 kDa respectively, were dissolved in 100 mM phosphate buffer pH 6.5 to a final concentration of 0.8 mg/mL for αs- and β-casein, and 0.65 mg/mL for κ-casein. Each subunit was independently incubated with the different BSG extracts in 100 mM phosphate buffer pH 6.5 at 37 °C for 6 h. The reaction was stopped by adding a sample buffer. Digestion products were analyzed by SDS-PAGE as described previously. Hydrolysis percentage was calculated from SDS-PAGE densitometric analysis, considering 100 % hydrolysis as the complete disappearance of the casein bands. 1 mg/mL commercial chymosin (Chy-Max, CHR-Hansen, Denmark) was used as control.
3. Results and Discussion
The brewing process significantly alters the protein content of barley grains [7,40]. Mashing, the first key step in brewing, continues the enzymatic degradation initiated during malting, with around 90% of endoproteases surviving the kilning process and remaining active during mashing, facilitating further protein breakdown into peptides and amino acids [7,40]. The hydrolytic enzymes involved in this degradation, mainly endoproteases and carboxypeptidases, are produced during malting and act to cleave proteins into smaller peptides and free amino acids. Jones et al. and Osman et al. demonstrated that endoproteases remain highly active, into the wort, at approximately 38 °C during the protein rest phase of mashing, but their activity declines rapidly when the temperature increases to 70 °C, where starch hydrolysis occurs and proteases are inactivated [7,41]. On the other hand, Rizvi et al. isolated and characterized proteases thermostables, from Canadian two-row spring malting barley lines, after kilning process (air drying at 40–60 °C, followed by a gradual temperature increase to 85–95 °C) [8].
Despite substantial research on protease activity during malting and mashing, there is a critical gap in the literature regarding the residual activity of endoproteases in BSG after mashing, representing a promising area for further investigation.
3.1. Finding Significant Variables That Affect Extraction of Endopeptidases with Caseinolytic Activity from BSG
To identify the significant variables influencing the extraction of active endopeptidases from BSG, a Plackett-Burman experimental design [42] was used. This approach allowed us to systematically evaluate multiple factors simultaneously, providing insight into which variables have the most substantial impact on enzyme activity. The results obtained from this design are critical for optimizing the extraction process, ensuring maximum yield and efficiency in subsequent studies [43,44,45]. While the Plackett-Burman design does not differentiate between main effects and interaction effects, it effectively identifies factors with significant impacts by comparing the response differences between the two levels of each factor [46].
Table 3 outlines the screening design used and the associated response values. The response variables assessed were caseinolytic activity and protein concentration in the extracts.
The analysis of the Plackett-Burman design revealed that pH, temperature, Triton X-100, and CaCl₂ concentration had a significant impact on CA (Figure 1A). Higher CA was associated with elevated pH and CaCl₂ concentration, and lower temperature and Triton X-100 concentration (Figure 1B). For protein concentration, the significant variables were temperature, pH, and Triton X-100 concentration, all of which were positively correlated with the response (Figure 1C, Figure 1D).
To further optimize the significant variables that maximize both CA and protein concentration, a BBD was analyzed using RSM [47]. Table 4 presents the selected variables, their levels, and the corresponding responses obtained. The upper and lower limits for each variable were determined based on the results of the Plackett-Burman design analysis. A full quadratic model, including interaction terms, was employed to analyze the data. The two responses evaluated were CA and protein concentration.
Figure 2 presents the RSM analysis of the BBD. The variables that positively influenced CA and protein concentration (pH, temperature, and CaCl₂ concentration) were selected for this design.
Figure 2A highlights the significant terms in the CA analysis. All three quadratic terms were significant, and the linear terms for pH and temperature were also significant (p < 0.05). The resulting model is represented in Equation (2). The lack of fit was non-significant (p = 0.67), and the adjusted R² value of 0.91 indicates that the model explains 91% of the variance.
Figure 2E presents the significant terms in the analysis for protein concentration (PC). The linear terms for pH and temperature were significant (p < 0.05), and the quadratic term for pH was also significant. The resulting model is represented in EEquation (3). The lack of fit was non-significant (p = 0.37), and the adjusted R² of the model was 0.87, indicating that the model explains 87% of the variance. In both models (Figure 2A and E), none of the interaction terms were significant.
The optimal values found for the variables evaluated for both responses are shown in Table 5. Protein concentration optimal conditions were different from those corresponding to CA. The response surface plots for protein concentration (Figure 2 F, G, and H) reveal that pH was the only significant quadratic term, while all quadratic terms were significant for CAS (Figure 2 B, C, and D). The differences in the response surfaces indicate that the maximum protein concentration was obtained at an intermediate pH and maximum temperature, with no significant effect from CaCl₂ concentration. In contrast, for CA, the highest values were observed at intermediate levels of all independent variables.
The maximum protein extraction occurred at pH 7.0 and 60 °C. Similar conditions have been reported for other BSG extracts obtained involving physical methods such as sonication [46,48]; suggesting that neutral pH and elevated temperature optimize protein extraction from BSG [18]. However, the model for CA shows that to achieve significant CA in BSG extracts, the pH should be around 8. Figure 2 B and C illustrate that caseinolytic activity decreases as the pH deviates from this value. Although temperature and CaCl₂ concentration were also significant, their effects were smaller and less critical compared to pH (Equation (2)). Based on these results (Table 5), the conditions of pH 8, room temperature, and 10 mM CaCl₂ were selected for obtaining the BSG extracts used in this study.
The use of a BBD for optimizing the extraction process was effective in maximizing enzyme activity from BSG. Similar methodologies have been employed in other studies to optimize enzyme extraction from plant sources [43,49,50]. This statistical approach not only improved enzyme yield but also ensured that BSG extracts could be utilized in industrial-scale applications.
3.2. Characterization of CA of BSG1 Extract
The CA of the BSG extract from Blonde Ale-type beer (Cheverry Brewery), named BSG1 and obtained under the optimum conditions described above, was assessed. Results obtained are shown in Figure 3.
The effect of pH on relative activity of BSG1 extract shows a clear trend, with the enzyme displaying its highest activity at a neutral pH of 7 (Figure 3A). As the pH moves away from neutrality, both in more acidic and basic conditions, the enzyme’s activity declines. In acidic conditions (pH 3 to 5), the relative activity decreases progressively, with the lowest activity observed at pH 5. In basic conditions (pH 8 to 9), there is a similar drop in activity, with the lowest activity at pH 9. During mashing, protease softens the outer layer of the kernel by breaking down the cell wall proteins, which exposes the starch to mashing enzymes, thereby improving both the mashing process and wort fermentability [51]. While proteases from malted barley typically function best in acidic conditions, it has been found to remain active even at higher pH levels, potentially up to pH 10 [51,52].
The temperature-dependent activity of the BSG1 extract (Figure 3B), as indicated by its proteolytic activity profile, aligns with findings from studies on proteases derived from plant-based or industrial byproducts [26,29,53]. The BSG1 optimal CA around 40 °C, followed by a sharp decline beyond this temperature, is a typical pattern observed in enzymes sensitive to thermal denaturation. Similar observations were made in studies of plant-derived proteases, where moderate proteolytic activity was recorded at lower temperatures, peaking between 35 °C and 45 °C, followed by a decrease due to protein unfolding or denaturation [54]. This thermal behavior is crucial for applications in brewing and food processing, where temperature control ensures maximal enzyme efficiency without compromising stability.
To identify the types of proteolytic enzymes present in the BSG1 extract, the effect of protease inhibitors on the CA was analyzed. Results showed that the caseinolytic activity of the BSG extract was partially inhibited by pepstatin A (50 %), PMSF (56 %), EDTA (61 %), and Iodoacetamide (78 %) (Figure 3C). BSG1 extract shows that multiple classes of proteases contribute to its enzymatic profile, suggesting the presence of aspartic, serine, metallo, and cysteine proteases in varying degrees. Additionally, the type of proteolytic enzymes determined in BSG1 extract reveals both similarities and key differences, with proteins previously described in barley malted grains and wort [55,56,57,58,59], particularly regarding the roles of aspartic, serine, metalloproteases, and cysteine proteases. These proteases are crucial in the breakdown of storage proteins during mashing, with implications for the solubilization of protein and the production of free amino nitrogen, both of which influence wort composition and beer quality. In comparison, Jones and Budde examined the roles of proteases in barley malt during mashing and found that metalloproteases had the most significant effect on protein solubilization, particularly at pH 6.0 [15]. Their experiments showed that metalloproteases, inhibited by o-phenanthroline, played a larger role in solubilizing proteins than cysteine proteases, which were expected to be more active at acidic pH. This observation is consistent with the BSG data, where metalloproteases also played a prominent role, as indicated by EDTA inhibition. However, Jones and Budde noted that EDTA often increased protease activity in their barley malt system, which contrasts with the inhibitory effect observed in BSG extract [15]. This discrepancy could be explained due to the different extraction conditions or substrates used, with EDTA potentially having variable impacts depending on the proteolytic environment and the metal ions involved. On the other hand, the partial inhibition by pepstatin A of BSG1 extract confirmed the presence of aspartic proteases, consistent with their secondary but important role observed in barley mashes at acidic pH levels (pH 3.8). This supports earlier research by Brijs et al., which highlighted the key role of aspartic proteases in hydrolyzing storage proteins during seed germination [60]. These proteases may also contribute to protein degradation in barley during both malting and mashing. Serine proteases also exhibit similar behavior to aspartic and metalloproteases in the BSG1 extract. Similar results were previously reported for Jones and Budde et al., where serine proteases were active at higher pH (pH 8.0). The role of serine proteases in BSG is comparable to that in barley malt mashes, where they contribute to protein solubilization during mashing. These enzymes likely play a crucial role in processing proteins at more alkaline pH levels, helping to degrade proteins that resist the action of other proteases under standard mashing conditions. A key distinction between the studies is the relatively minor role of cysteine proteases in the BSG1 extract, as evidenced by the weaker inhibition with iodoacetamide. This is consistent with previous findings, where cysteine proteases had a limited effect on protein solubilization, even at acidic pH levels [15]. The results suggest that in both BSG and malt mashes, cysteine proteases may not be as significant as previously assumed, particularly when compared to the more dominant roles of metalloproteases and aspartic proteases.
The analysis of the CA on bovine casein subunits of BSG1 (Figure 3D) showed selective proteolysis of α-, β-, and κ-casein subunits under conditions resembling industrial coagulation (pH 6.5, 37 °C). κ-casein underwent the most extensive hydrolysis (56 %), followed by α-casein (25 %) and β-casein (13 %). The varying degrees of hydrolysis observed in α-casein , β-casein, and κ-casein, are in line with the distinct roles these subunits play in casein micelle structure. β-casein is known for its high hydrophobicity, which makes it more resistant to enzymatic hydrolysis, explaining the lower hydrolysis percentage observed in the BSG1 extract [61]. In contrast, α- and κ-casein subunits are more accessible to proteolytic enzymes due to their structural positions and solubility characteristics, resulting in higher degradation rates. This pattern has been observed in other studies investigating plant-based coagulants, where proteases from cardoon and papaya showed preferential hydrolysis of κ-casein and α-casein, facilitating micelle destabilization and curd formation [29]. In dairy processing, particularly in cheese production, the proteolysis of casein subunits is crucial for curd formation, with κ-casein playing a vital role in micelle stability and α-casein contributing to curd firmness [62].
In order to evaluate the capacity of BSG1 extract to coagulate bovine milk for cheese-making, a MCA test was performed as detailed in Materials and Methods. This assay allows the evaluation of the first stage of cheese-making called enzymatic coagulation, which directly affects the quality of the final product [63]. Results shown in Figure 4 demonstrate that BSG1 extract exhibits MCA in a dose-dependent manner. After 24 h of incubation, no significant differences were observed in the volume or texture of the clots formed using chymosin or BSG1 extract at a 1:1 (milk:BSG) ratio.
The biochemical characterization of the CA and MCA of the BSG1 extract highlights its potential as an alternative coagulant in artisanal cheese production, and provides a sustainable option that utilizes the functional properties of brewing industry byproducts. These findings align with the growing interest in plant-based and waste-derived enzymes, which offer both environmental benefits and novel functionalities for industrial applications [64,65,66]. However, further studies will be necessary to investigate the organoleptic characteristics of the resulting curds in greater detail, in order to fully assess this potential.
3.3. Comparative Analysis of BSGs Derived from Different Beer Styles: Impact on CA and MCA
To investigate whether the CA and MCA of BSG extracts are influenced by the type of malt used, both activities were measured using BSG derived from various beer styles, each with different malt composition and malting processes. The different types of BSG used and their composition were previously described in Materials and Methods, and were abbreviated as BSG1, BSG2, BSG3, BSG4, and BSG5.
To determine the specific caseinolytic activity (SCA) of the different BSGs, the protein concentration and the CA of each BSG extract was measured using casein as the substrate. The protein concentration of the BSG extracts was determined, and results are shown in Figure 5A. The BSG1 extract showed the highest protein concentration (1.4 mg/mL) while BSG2, BSG3 and BSG4 extracts presented moderate protein concentration values with 1.01, 0.89, and 0.76 mg/mL respectively. The value of BSG1 extract was significantly higher than the one obtained for BSG5 extract, which presented a protein concentration of 0.64 mg/mL extract.
Figure 5B shows the SCA of the BSG extracts tested. BSG2 exhibited moderate activity with an average SCA of 67.2 U mg-1, while BSG3 showed the highest activity with a value of 99.6 U mg-1, indicating that this extract contains the most active proteases. BSG4 also displayed a significant specific activity of 84.5 U mg-1. In contrast, BSG5 had a moderate specific activity of 71.8 U mg-1. Although the BSG1 extract displayed the highest protein content, its SCA value was the lowest (60.4 U mg-1), indicating that only a part of these proteins corresponds to active proteases. These results highlight significant differences in the enzymatic profiles of the extracts, suggesting their dependence with the BSG malt composition and malting processes.
The specificity of BSG extracts on bovine casein subunits (α-, β-, and κ-casein) was analyzed for the BSG extracts and for chymosin (Figure 5 C). For α-casein, the BSG3 and BSG4 extracts exhibited the highest hydrolysis rates, at 70% and 78%, respectively. These values are notably higher than those for BSG1 (25 %), BSG2 (25 %), and BSG5 (20%), which showed activities similar to chymosin (20%). In the case of β-casein, the hydrolysis percentages were generally lower across all samples compared to α-casein. The BSG3 extract demonstrated the highest activity (30%), followed by BSG2 (27%), BSG4 (15%), and BSG1 (13 %). Chymosin and BSG5 had the lowest activities, at 8% and 2%, respectively, indicating that β-casein is less susceptible to hydrolysis by these extracts. For κ-casein, the chymosin extract exhibited the highest mean hydrolysis rate at 95%, indicating strong proteolytic activity against this subunit. The BSG extracts displayed varying activities, with BSG1 (56.5 %), BSG2 (49%), and BSG3 (55.8%) showing moderate hydrolysis, while BSG4 (37%) and BSG5 (35.8%) had the lowest activities.
In summary, the data indicates that BSG extracts exhibit different levels of proteolytic activity depending on the casein subunit. The BSG3 and BSG4 extracts were most effective against α-casein, while β-casein was less susceptible to hydrolysis by both chymosin and the BSG extracts, with the BSG3 extract being the most effective among the BSG samples. These variations may result from the different brewing processes used by artisanal beer producers, leading to different enzymatic profiles in the BSG extracts. Such differences should be considered when using BSG for artisanal cheese production.
To evaluate the MCA of the different BSG extracts, milk clots were obtained for each extract as described in Materials and Methods (Figure 6A) and the volume of the clots obtained were determined (Figure 6B and C). There were no significant differences in clot volume between the samples, indicating that all tested BSG extracts exhibited significant MCA comparable to chymosin after 24 h.
All the BSG extracts tested induced the formation of a clot (Figure 6A), indicating the capacity of the proteases present to coagulate milk. However, differences in the texture of the clots formed using some of the BSG extract were observed when compared to the one obtained with chymosin. BSG3 and BSG2 produced a spongy clot with higher whey retention, while the clot formed by BSG4 and BSG5 did not show differences compared to Chymosin. The nature of the coagulant plays an important role in defining the characteristics of the clot, as it can influence micellar aggregation and interfere with the rate of gel hardening and its final firmness [67]. These effects, in turn, can affect the curd’s drainage properties, moisture content, texture, and cheese flavor [68]. The difference in the general characteristics of the clots produced compared to chymosin could be primarily due to specific activities of each peptidase on the different casein subunits [69].
The MCA of the BSG extracts previously described was comparable to plant-derived enzymes such as those from Cynara cardunculus and Ficus carica. Studies by Shah et al. [27], and Nitu et al. [70]. During the last years, plant-based coagulants have gained attraction as alternatives to calf rennet, especially in regions like the Mediterranean. The ability of BSG extracts to clot milk without excessive proteolysis offers a distinct advantage over other plant coagulants, such as those from Ficus and Cynara, which often lead to bitter flavors and poor cheese texture. The findings presented here showed a favorable MCA/PA (milk-clotting activity to proteolytic activity) ratio, align with Roa et al. [71], who noted that a high MCA/PA ratio is crucial for ensuring both cheese yield and flavor [27,70].
4. Conclusions
This work demonstrates that BSG protein extracts exhibit significant CA and MCA, making them a suitable alternative to traditional animal rennet and plant-based coagulant. Importantly, this is the first research to report the presence of proteolytic activity in BSG, highlighting its novel application potential in the food industry, particularly for artisanal cheese production. All BSG extracts tested were capable of inducing milk clot formation, and the MCA of BSG extracts was comparable to that of well-known plant-derived coagulants such as C. cardunculus and F. carica. Additionally, the study optimized the conditions for extracting proteases with CA from BSG, focusing on the influence of pH, temperature, and calcium chloride concentration. The optimal conditions for enzyme extraction were found to be at a neutral pH and moderate temperatures, which align with conditions previously reported for plant-based protease extractions. The resulting extracts were rich in all types of active proteases, with their activity further characterized by selective hydrolysis of α-, β-, and κ-casein subunits, crucial for cheese formation. Overall, this study demonstrates that BSG-derived proteases can serve as an innovative and eco-friendly alternative in the dairy industry, contributing to both waste valorization and food innovation in terms of promoting circular economy practices by utilizing BSG, a major byproduct of the brewing industry. The findings not only reduce waste but also open avenues for the development of functional food ingredients, further enhancing the commercial value of BSG. Future studies should explore the industrial scalability of these extracts, as well as their sensory and organoleptic impacts on cheese quality, ensuring that the functional properties of these enzymes can be fully harnessed.
Declaration of Generative AI and AI-Assisted Technologies in the Writing Process
During the preparation of this work the author(s) used ChatGPT - Open AI in order to readability and language of the manuscript. After using this tool/service, the author(s) reviewed and edited the content as needed and take(s) full responsibility for the content of the publication.
Declaration of Conflict of Interest
The authors declare no conflict of interest.
Author Contributions
MMV, Investigation, Validation, Visualization, Writing - Original Draft. JNS, Investigation, Validation, Visualization, Writing - Original Draft. FRT, Investigation, Validation, Visualization, Writing - Review & Editing. CVT, Investigation, Validation, Visualization. FFM, Writing - Review & Editing. AP, Data curation, Methodology, Formal Analysis, Software, Visualization, Writing - Original Draft, Writing - Review & Editing. MGG, Project Administration, Conceptualization, Writing - Review & Editing.
Acknowledgments
This work was supported by National Scientific and Technical Research Council (CONICET) (grant PIP 2021-2023) to M.G.G., University of Mar del Plata (UNMDP) (grant 15/E785) to M.G.G. and National Agency for the Promotion of Science and Technology (grant PICT SU 100-2018) to M.G.G. We also thank Dr. Claudia V Tonon for assistance with SDS-PAGE assays (supporting staff of the CIC – Scientific Research Commission of Prov. Buenos Aires).
Abbreviations
| BSG | brewer’s spent grain |
| BBD | box-behnken design |
| RSM | response surface methodology |
| CA | caseinolytic activity |
| MCA | milk-clotting activity |
| BCA | bicinchoninic acid |
| BSA | bovine serum albumin |
| MWM | molecular weight markers |
| PMSF | phenylmethylsulfonyl fluoride |
| EDTA | ethylenediaminetetraacetic acid |
| SCA | specific caseinolytic activity |
References
- Jackowski, M.; Niedźwiecki, Ł.; Kacper, O.J.; Uchańska; Trusek, A. Brewer’s Spent Grains-Valuable Beer Industry By-Product. Biomolecules. [CrossRef] [PubMed]
- Mainardis, M.; Hickey, M.; Dereli, R.K. Lifting craft breweries sustainability through spent grain valorisation and renewable energy integration: A critical review in the circular economy framework. J. Clean. Prod. 2024, 447, 141527. [Google Scholar] [CrossRef]
- Chetrariu; Dabija, A. Spent grain: A functional ingredient for food applications. Foods 2023, 12, 1533. [Google Scholar] [CrossRef] [PubMed]
- Pabbathi, N.P.P.; Velidandi, A.; Pogula, S.; Gandam, P.K.; Baadhe, R.R.; Sharma, M.; Sirohi, R.; Thakur, V.K.; Gupta, V.K. Brewer’s spent grains-based biorefineries: A critical review. Fuel (Lond.) 2022, 317, 123435. [Google Scholar] [CrossRef]
- Nyhan, L.; Sahin, A.W.; Schmitz, H.H.; Siegel, J.B.; Arendt, E.K. Brewers’ spent grain: An unprecedented opportunity to develop sustainable plant-based nutrition ingredients addressing global malnutrition challenges. J. Agric. Food Chem. 2023, 71, 10543–10564. [Google Scholar] [CrossRef]
- Verni, M.; Pontonio, E.; Krona, A.; Jacob, S.; Pinto, D.; Rinaldi, F.; Verardo, V.; Díaz-de-Cerio, E.; Coda, R.; Rizzello, C.G. Bioprocessing of brewers’ spent grain enhances its antioxidant activity: Characterization of phenolic compounds and bioactive peptides. Front. Microbiol. 2020, 11, 1831. [Google Scholar] [CrossRef]
- Osman, A.M.; Coverdale, S.M.; Cole, N.; Hamilton, S.E.; Jersey, J.; Inkerman, P.A. Characterisation and assessment of the role of barley malt endoproteases during malting and Mashing1. J. Inst. Brew. 2002, 108, 62–67. [Google Scholar] [CrossRef]
- Rizvi, S.M.H.; Beattie, A.D.; Rossnagel, B.; Scoles, G. Thermostability of barley malt proteases in western Canadian two-row malting barley. Cereal Chem. 2011, 88, 609–613. [Google Scholar] [CrossRef]
- Bryce, J.H.; Goodfellow, V.; Agu, R.C.; Brosnan, J.M.; Bringhurst, T.A.; Jack, F.R. Effect of different steeping conditions on endosperm modification and quality of distilling malt. J. Inst. Brew. 2010, 116, 125–133. [Google Scholar] [CrossRef]
- Bryce, J.H.; Scott, M.B.; McCafferty, K.A.; Johnston, J.A.; A, M; Raven; Thornton, J.M.; Morris, P.C.; Footitt, S. Mobilisation of energy reserves in barley grains during imbibition of water. In Distilled Spirits: New Horizons: Energy, Environment And; Independent Publishers Group, 2010; pp. 39–47. [Google Scholar]
- Potokina, E.; Caspers, M.; Prasad, M.; Kota, R.; Zhang, N.; Sreenivasulu; Wang, M.; Graner, A. Functional association between malting quality trait components and cDNA array based expression patterns in barley (Hordeum vulgare L.). Mol. Breed. 2004, 14, 153–170. [Google Scholar] [CrossRef]
- Jones, B.L. Endoproteases of barley and malt. J. Cereal Sci. 2005, 42, 139–156. [Google Scholar] [CrossRef]
- Hill, A.E.; Stewart, G.G. Free Amino Nitrogen in brewing. Fermentation 2019, 5, 22. [Google Scholar] [CrossRef]
- Laus; Endres, F.; Hutzler, M.; Zarnkow, M.; Jacob, F. Isothermal mashing of barley malt: New insights into wort composition and enzyme temperature ranges. Food Bioproc. Tech. 2022, 15, 2294–2312. [Google Scholar] [CrossRef]
- Jones, B.L.; Budde, A.D. How various malt endoproteinase classes affect wort soluble protein levels. J. Cereal Sci. 2005, 41, 95–106. [Google Scholar] [CrossRef]
- Durand, G.A.; Corazza, M.L.; Blanco, A.M.; Corazza, F.C. Dynamic optimization of the mashing process. Food Control 2009, 20, 1127–1140. [Google Scholar] [CrossRef]
- Viader, R.P.; Yde, M.S.H.; Hartvig, J.W.; Pagenstecher, M.; Bille, T.B.C.J.; Christensen; Andersen, M.L. Optimization of beer brewing by monitoring α-amylase and β-amylase activities during mashing. Beverages 2021, 7, 13. [Google Scholar] [CrossRef]
- Devnani, B.; Moran, G.C.; Grossmann, L. Extraction, Composition, Functionality, and Utilization of Brewer’s Spent Grain Protein in Food Formulations, and. Foods 2023, 12. [Google Scholar] [CrossRef]
- Xie, Z.; Dan, M.; Zhao, G.; Wang, D. Recent advances in microbial high-value utilization of brewer’s spent grain. Bioresour. Technol. 2024, 408, 131197. [Google Scholar] [CrossRef]
- Oancea, A.-G.; Dragomir, C.; Untea, A.; Saracila, M.; Turcu, R.; Cismileanu, A.; Boldea, I.; Radu, G.L. The effects of brewer’s spent yeast (BSY) inclusion in dairy sheep’s diets on ruminal fermentation and milk quality parameters. Agriculture 2023, 13, 1605. [Google Scholar] [CrossRef]
- Tiruneh, A.T.; Adane, K.; Tikunesh, W.Z. Atalel Effects of Brewery Spent Grain Silage Based Feeding on Feed Intake, Milk Yield, Milk Efficiency, and, Proceedings of the 16th Annual Regional Conference on Completed Research Activities. 2024. [Google Scholar]
- EL-Moneim, R.A.; Shamsia, S.; EL-Deeb, A.; Ziena, H. Utilization of brewers spent grain (bsg) in making functional yoghurt. Journal of Food and Dairy Sciences 2015, 6, 577–589. [Google Scholar] [CrossRef]
- El-Moneim, R.A.; Shamsia, S.; EL-Deeb, A.; Ziena, H. Utilization of brewers spent grain (BSG) in producing functional processed cheese “‘block’”. Journal of Food and Dairy Sciences 2018, 2018, 103–109. [Google Scholar] [CrossRef]
- Julkovski, D.J.; Sehnem, S.; da C, M. ; Ramos Circularity of resources in the craft brewery segment: An analysis supported by innovation. Environ. Qual. Manage. 2024, 33, 265–281. [Google Scholar] [CrossRef]
- Pasquet, P.-L.; Villain-Gambier, M.; Trébouet, D. By-product valorization as a means for the brewing industry to move toward a circular bioeconomy. Sustainability 2024, 16, 3472. [Google Scholar] [CrossRef]
- Mohsin, A.Z.; Norsah, E.; Marzlan, A.A.; Rahim, M.H.A.; Hussin, A.S.M. Exploring the applications of plant-based coagulants in cheese production: A review. Int. Dairy J. 2024, 148, 105792. [Google Scholar] [CrossRef]
- Shah, M.A.; Mir, S.A.; Paray, M.A. Plant proteases as milk-clotting enzymes in cheesemaking: A review. Dairy Sci Technol 2014, 94, 5–16. [Google Scholar] [CrossRef]
- Amira, B.; Besbes, S.; Attia, H.; Blecker, C. Milk-clotting properties of plant rennets and their enzymatic, rheological, and sensory role in cheese making: A review. Int. J. Food Prop. 2017, 20, S76–S93. [Google Scholar] [CrossRef]
- Mazorra-Manzano, M.A.; Moreno-Hernández, J.M.; Ramírez-Suarez, J.C. Milk-Clotting Plant Proteases for Cheesemaking. In Biotechnological Applications of Plant Proteolytic Enzymes; Springer International Publishing: Cham, 2018; pp. 21–41. [Google Scholar]
- Troncoso, F.D.; Sánchez, D.A.; Ferreira, M.L. Production of Plant Proteases and New Biotechnological Applications: An Updated Review. ChemistryOpen 2022, 11, 1–38. [Google Scholar] [CrossRef]
- Maran, J.P.; Manikandan, S.; Priya, B.; Gurumoorthi, P. Box-Behnken design based multi-response analysis and optimization of supercritical carbon dioxide extraction of bioactive flavonoid compounds from tea (Camellia sinensis L.) leaves. J. Food Sci. Technol. 2015, 52, 92–104. [Google Scholar] [CrossRef]
- Team, R.C. R: A Language and Environment for Statistical Computing; Team, R.C., 2020. [Google Scholar]
- Lenth, R.V. Response-Surface Methods in R, Using rsm. J. Stat. Soft. 2009, 32, 1–17. [Google Scholar] [CrossRef]
- Smith, P.K.; Krohn, R.I.; Hermanson, G.T.; Mallia, A.K.; Gartner, F.H.; Provenzano, M.D.; Fujimoto, E.K., N M; Olson; Klenk, D.C. Measurement of protein using bicinchoninic acid. Anal. Biochem. 1985, 150, 76–85. [Google Scholar] [CrossRef]
- Kao, S.-H.; Wong, H.-K.; Chiang, C.-Y.; Chen, H.-M. Evaluating the compatibility of three colorimetric protein assays for two-dimensional electrophoresis experiments. Proteomics 2008, 8, 2178–2184. [Google Scholar] [CrossRef] [PubMed]
- Laemmli, U.K. Cleavage of Structural Proteins during the Assembly of Head of Bacteriophage T4. Nature Publishing Group 1970, 227, 680–685. [Google Scholar] [CrossRef] [PubMed]
- Schneider, C.A.; Rasband, W.S.; Eliceiri, K.W. NIH Image to ImageJ: 25 years of image analysis. Nat. Methods 2012, 9, 671–675. [Google Scholar] [CrossRef] [PubMed]
- Rawlings, N.D. Protease families, evolution and mechanism of action. In Proteases: Structure and Function; Springer Vienna: Vienna, 2013; pp. 1–36. [Google Scholar]
- Pontual, E.V.; Carvalho, B.E.A.; Bezerra, R.S.; Coelho, L.C.B.B.; Napoleão, T.H.; Paiva, P.M.G. Caseinolytic and milk-clotting activities from Moringa oleifera flowers. Food Chem. 2012, 135, 1848–1854. [Google Scholar] [CrossRef]
- Celus; Brijs, K.; Delcour, J.A. The effects of malting and mashing on barley protein extractability. J. Cereal Sci. 2006, 44, 203–211. [Google Scholar] [CrossRef]
- Jones, B.L.; Marinac, L. The effect of mashing on malt endoproteolytic activities. J. Agric. Food Chem. 2002, 50, 858–864. [Google Scholar] [CrossRef]
- Vanaja, K.; Rani, R.H.S. Design of Experiments: Concept and Applications of Plackett Burman Design. Clin. Res. Regul. Aff. 2007. [CrossRef]
- Chaudhari, S.R.; Shirkhedkar, A.A. Application of Plackett-Burman and central composite designs for screening and optimization of factor influencing the chromatographic conditions of HPTLC method for quantification of efonidipine hydrochloride. J Anal Sci Technol 2020, 11, 1–13. [Google Scholar] [CrossRef]
- Karlapudi, A.P.; Krupanidhi, S., Reddy; Md, N.B.; V. T., C. Plackett-Burman design for screening of process components and their effects on production of lactase by newly isolated Bacillus sp. VUVD101 strain from Dairy effluent. Beni Suef Univ J Basic Appl Sci 2018, 7, 543–546. [Google Scholar] [CrossRef]
- Filgueiras, A.V.; Gago, J.; García, I.; León, V.M.; Viñas, L. Plackett Burman design for microplastics quantification in marine sediments. Mar. Pollut. Bull. 2021, 162, 111841. [Google Scholar] [CrossRef]
- Fang, M.; Yu, Z.; Zhang, W.; Cao, J.; Liu, W. Friction coefficient calibration of corn stalk particle mixtures using Plackett-Burman design and response surface methodology. Powder Technol. 2022, 396, 731–742. [Google Scholar] [CrossRef]
- Said, K.A.M.; Amin, M.A.M. Overview on the response surface methodology (RSM) in extraction processes. Journal of Applied Science & Process Engineering 2015, 2, 8–17. [Google Scholar]
- Li, W.; Yang, H.; Coldea, T.E.; Zhao, H. Modification of structural and functional characteristics of brewer’s spent grain protein by ultrasound assisted extraction. LWT 2021, 139, 110582. [Google Scholar] [CrossRef]
- Pepe; Tito, F.R., Raúl. Guevara Optimization of fibrinogenolytic activity of Solanum tuberosum subtilisin-like protease (StSBTc-3) by response surface methodology. Biotechnology Reports 2019, 22, e00330. [Google Scholar] [CrossRef]
- Tito, F.R.; Pepe, A.; Tonón, C.V.; Daleo, G.R.; Guevara, M.G. Optimization of caseinolytic and coagulating activities of Solanum tuberosum rennets for cheese making. J Sci Food Agric 2023, 103, 6947–6957. [Google Scholar] [CrossRef]
- Sammartino, M. Enzymes in brewing. Mbaa Tq 2015, 52, 156–164. [Google Scholar]
- Sarker, P.K.; Talukdar, S.A.; Promita, S.A.D.; Sayem; Mohsina, K. Optimization and partial characterization of culture conditions for the production of alkaline protease from Bacillus licheniformis P003. Springerplus 2013, 2, 506. [Google Scholar] [CrossRef]
- Liu, X.; Wu, Y.; Guan, R.; Guochao, Y.J.; Zhang, Y. Advances in research on calf rennet substitutes and their effects on cheese quality. Food Res. Int. 2021, 149, 110704. [Google Scholar] [CrossRef]
- Sharma, S.; Vaid, S.; Bhat, B.; Singh, S.; Bajaj, B.K. Thermostable Enzymes for Industrial Biotechnology. In Advances in Enzyme Technology; Elsevier, 2019; pp. 469–495. [Google Scholar]
- Connolly; Piggott, C.O.; FitzGerald, R.J. Characterisation of protein-rich isolates and antioxidative phenolic extracts from pale and black brewers’ spent grain. Int. J. Food Sci. Technol. 2013, 48, 1670–1681. [Google Scholar] [CrossRef]
- Jaeger; Zannini, E.; Sahin, A.W.; Arendt, E.K. arley protein properties, extraction and applications, with a focus on brewers’ spent grain protein. Foods 2021, 10, 1389. [Google Scholar] [CrossRef]
- Castro, L.E.N.; Colpini, L.M.S. All-around characterization of brewers’ spent grain. Eur. Food Res. Technol. 2021, 247, 3013–3021. [Google Scholar] [CrossRef]
- Lalor, E.; Goode, D. Brewing with Enzymes. In Enzymes in Food Technology; Wiley-Blackwell: Oxford, UK, 2009; pp. 163–194. [Google Scholar]
- Bamforth, C.W. Current perspectives on the role of enzymes in brewing. J. Cereal Sci. 2009, 50, 353–357. [Google Scholar] [CrossRef]
- Brijs, K.; Trogh, I.; Jones, B.L.; Delcour, J.A. Proteolytic Enzymes in Germinating Rye Grains. Cereal Chem 2002, 79, 423–428. [Google Scholar] [CrossRef]
- Creamer, L.K.; MacGibbon, A.K.H. Some recent advances in the basic chemistry of milk proteins and lipids. Int. Dairy J. 1996, 6, 539–568. [Google Scholar] [CrossRef]
- Lucey, P.F.F.J.A. Importance of Calcium and Phosphate in Cheese Manufacture: A Review. J Dairy Sci 1993, 76, 1714–1724. [Google Scholar] [CrossRef]
- Harboe, M.; Broe, M.L.; Qvist, K.B. The production, action and application of rennet and coagulants. In Technology of Cheesemaking; Wiley-Blackwell: Oxford, UK, 2010; pp. 98–129. [Google Scholar]
- Rojas, L.F.; Zapata, P.; Ruiz-Tirado, L. Agro-industrial waste enzymes: Perspectives in circular economy. Curr. Opin. Green Sustain. Chem. 2022, 34, 100585. [Google Scholar] [CrossRef]
- Ravindran, R.; Hassan, S.S.; Williams, G.A.; Jaiswal, A.K. A review on bioconversion of Agro-industrial wastes to industrially important enzymes. Bioengineering (Basel) 2018, 5, 93. [Google Scholar] [CrossRef]
- Murlidhar, M.; Anusha, R.; Bindhu, O.S. Plant-based coagulants in cheese making: Review. In Dairy Engineering, 1st ed.; Apple Academic Press: Waretown, NJ; Apple Academic Press, 2017; pp. 3–35. [Google Scholar]
- Gomes, S.; Belo, A.T.; Alvarenga, N.; Dias, J.; Lage, C.; Pinheiro; Pinto-Cruz, C.; Brás, T.; Duarte, M.F.; Martins, A.P. Characterization of Cynara cardunculus L. flower from Alentejo as a coagulant agent for cheesemaking. Int. Dairy J. 2019, 91, 178–184. [Google Scholar] [CrossRef]
- Mazorra-Manzano, M.A.; Martin, J.C.M.-H.J.; Ramírez-Suarez; de Jesús, A.F.T.-L.M.; González-Córdova; Vallejo-Córdoba, B. Sour orange Citrus aurantium L. flowers: A new vegetable source of milk-clotting proteases. Lebenson. Wiss. Technol. 2013, 54, 325–330. [Google Scholar] [CrossRef]
- Freitas, C.D.T.; Leite, H.B.; João, J.L.O.; P, B; Amaral; Egito, A.S.; Vairo-Cavalli, S.; Lobo, M.D.P.; Monteiro-Moreira, A.C.O.; Ramos, M.V. Insights into milk-clotting activity of latex peptidases from Calotropis procera and Cryptostegia grandiflora. Food Res. Int. 2016, 87, 50–59. [Google Scholar] [CrossRef]
- Nitu, S.; Geicu-Cristea, M.; Matei, F. MILK-CLOTTING ENZYMES OBTAINED FROM PLANTS IN CHEESEMAKING - A REVIEW. Scientific Bulletin Series F. Biotechnologies 2021, 25, 66–75. [Google Scholar]
- Roa; Belén, L.M.; Javier, M.F. Residual clotting activity and ripening properties of vegetable rennet from Cynara cardunculus in La Serena cheese. Food Res. Int. 1999, 32, 413–419. [Google Scholar] [CrossRef]
Figure 1.
Pareto (A and C) and Main Effect Plots (B and D) from the Plackett-Burman Design Analysis. The six independent variables examined were pH, temperature, homogenization time, and the concentrations of Triton X-100, DTT, and CaCl₂. The blue plots represent CA, while the green plots correspond to protein concentration. Variables with values exceeding the threshold indicated by the dashed red line are considered significant.
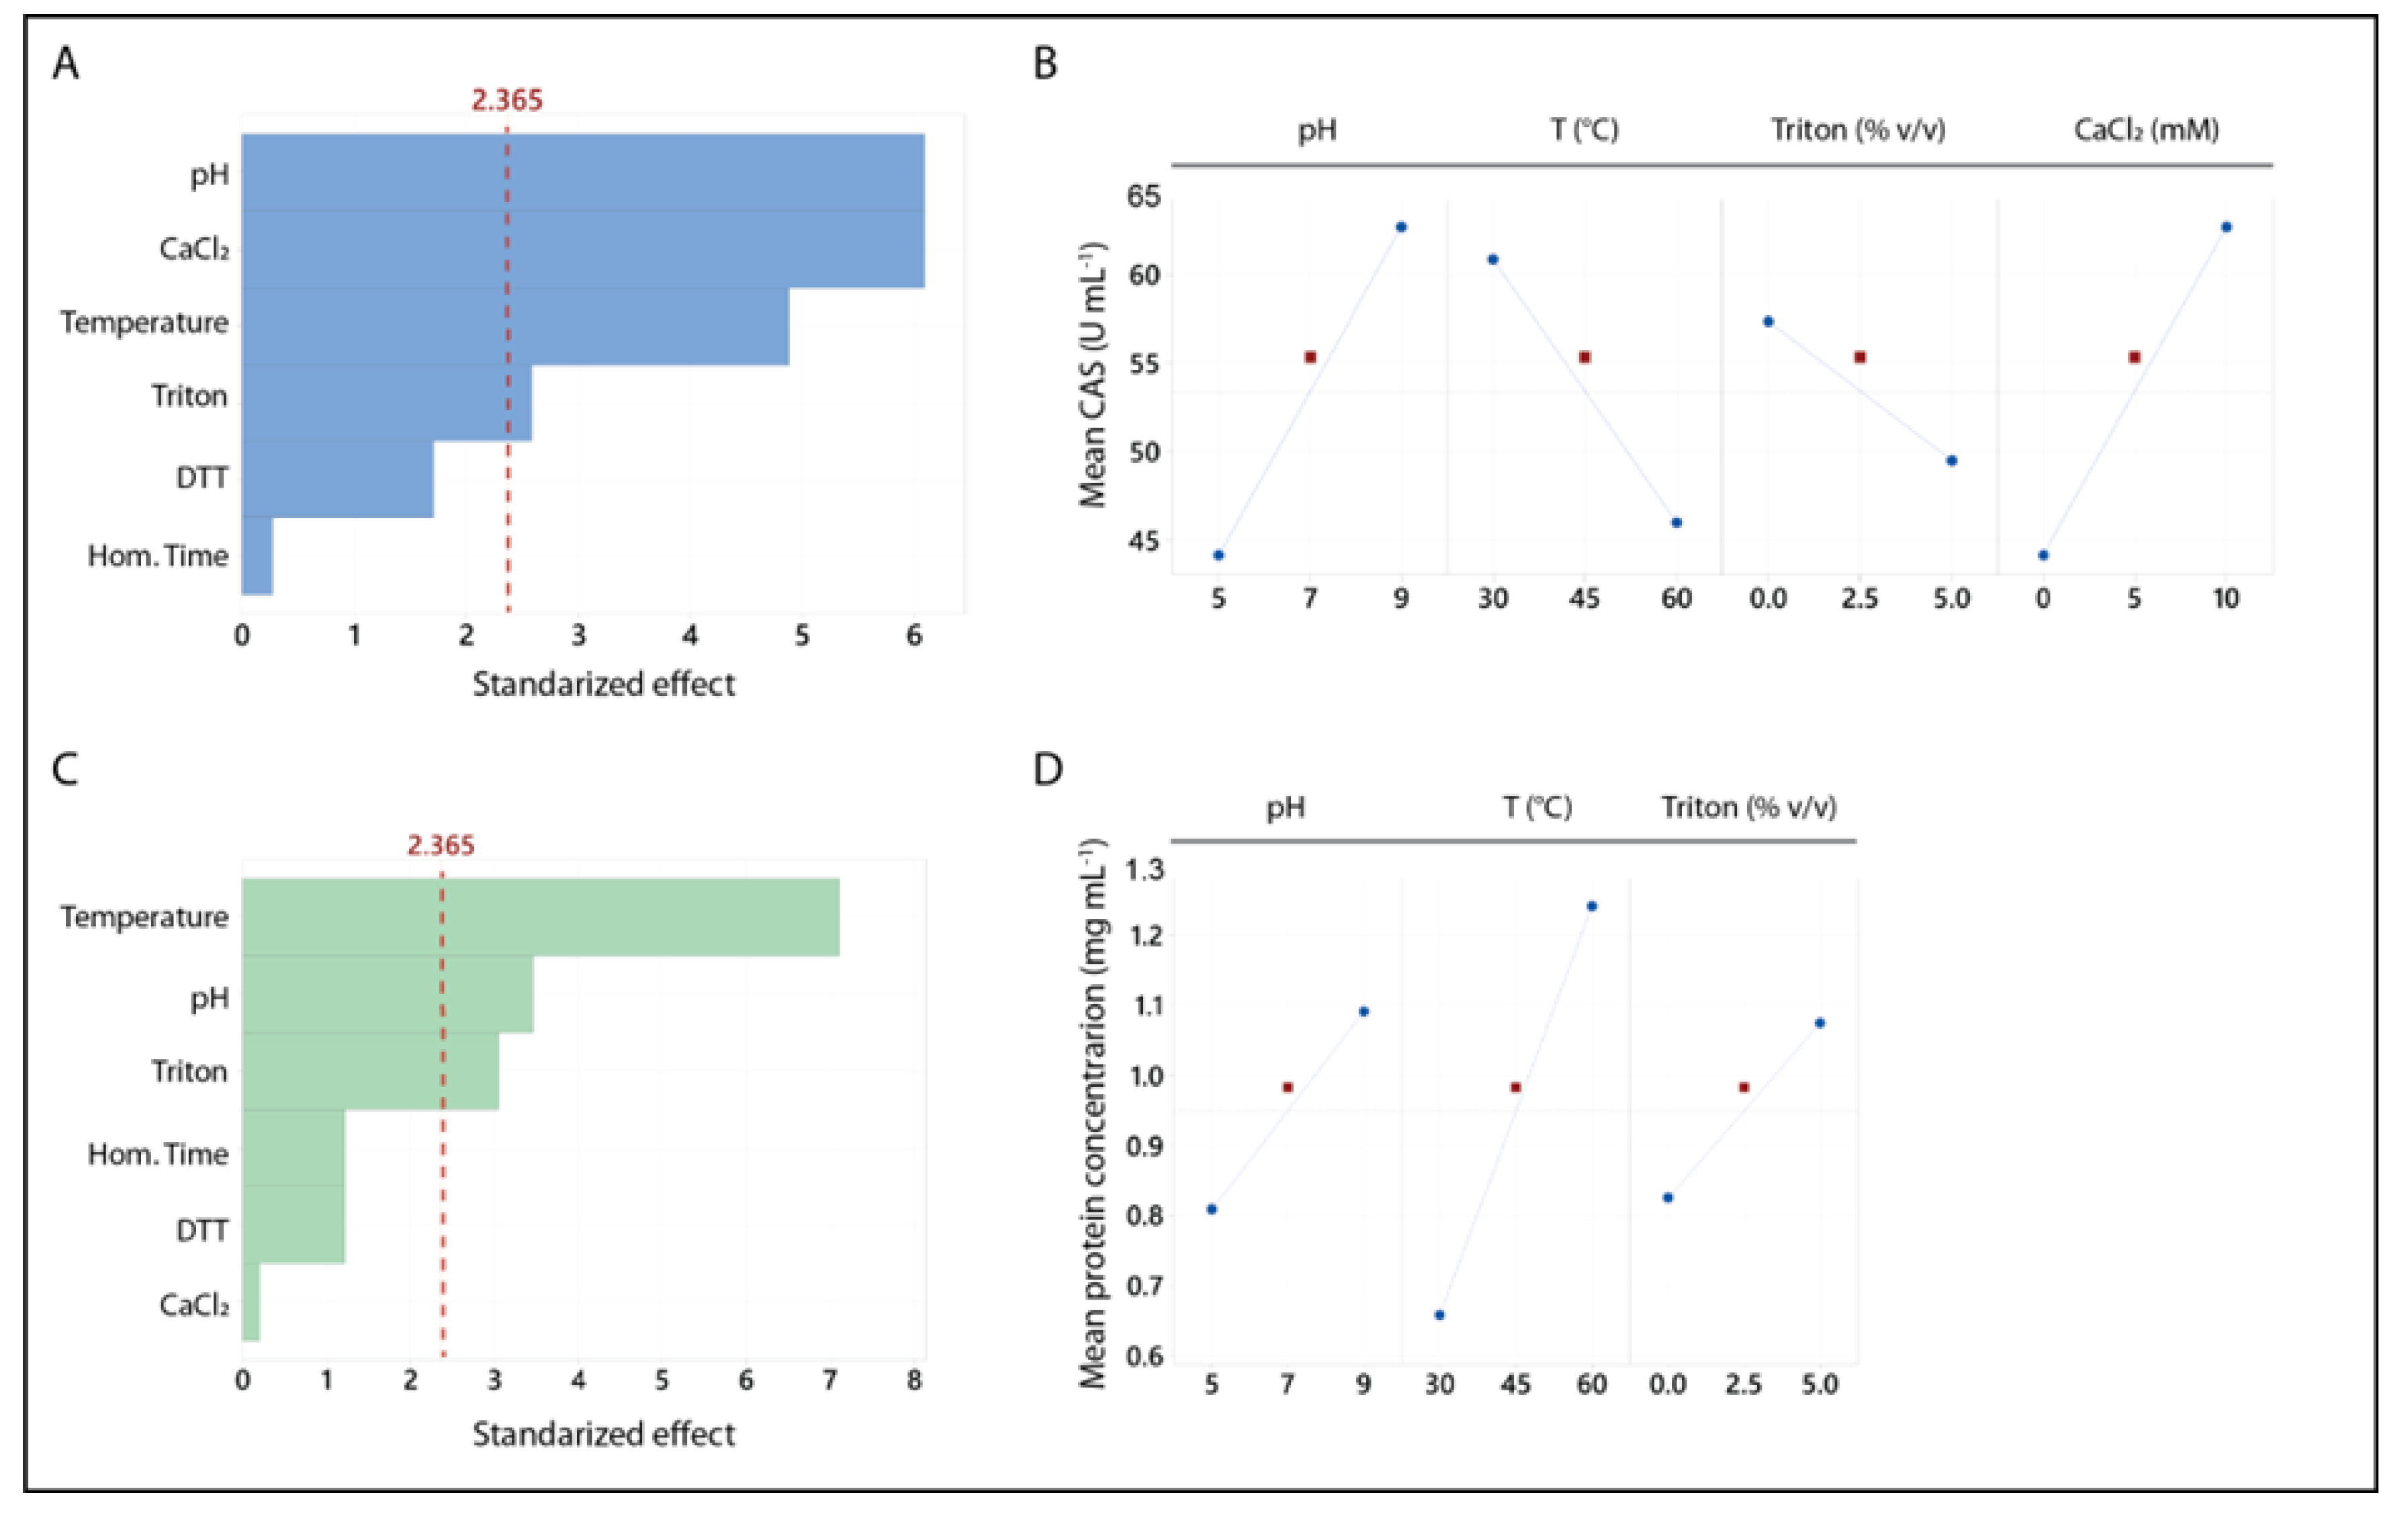
Figure 2.
RSM Analysis of the Box-Behnken Design. Two response variables were evaluated: CA and protein concentration. The independent variables identified as significant in the screening design (pH, temperature, and CaCl₂ concentration) were selected for the BBD. Subpanels A and E display the significant terms for each model, with values exceeding the threshold indicated by the dashed red line considered significant. The remaining subpanels depict the 3D response surfaces, showing the interactions between two independent variables while holding the third at its optimal level. The blue plots correspond to CA, and the green plots correspond to protein concentration.
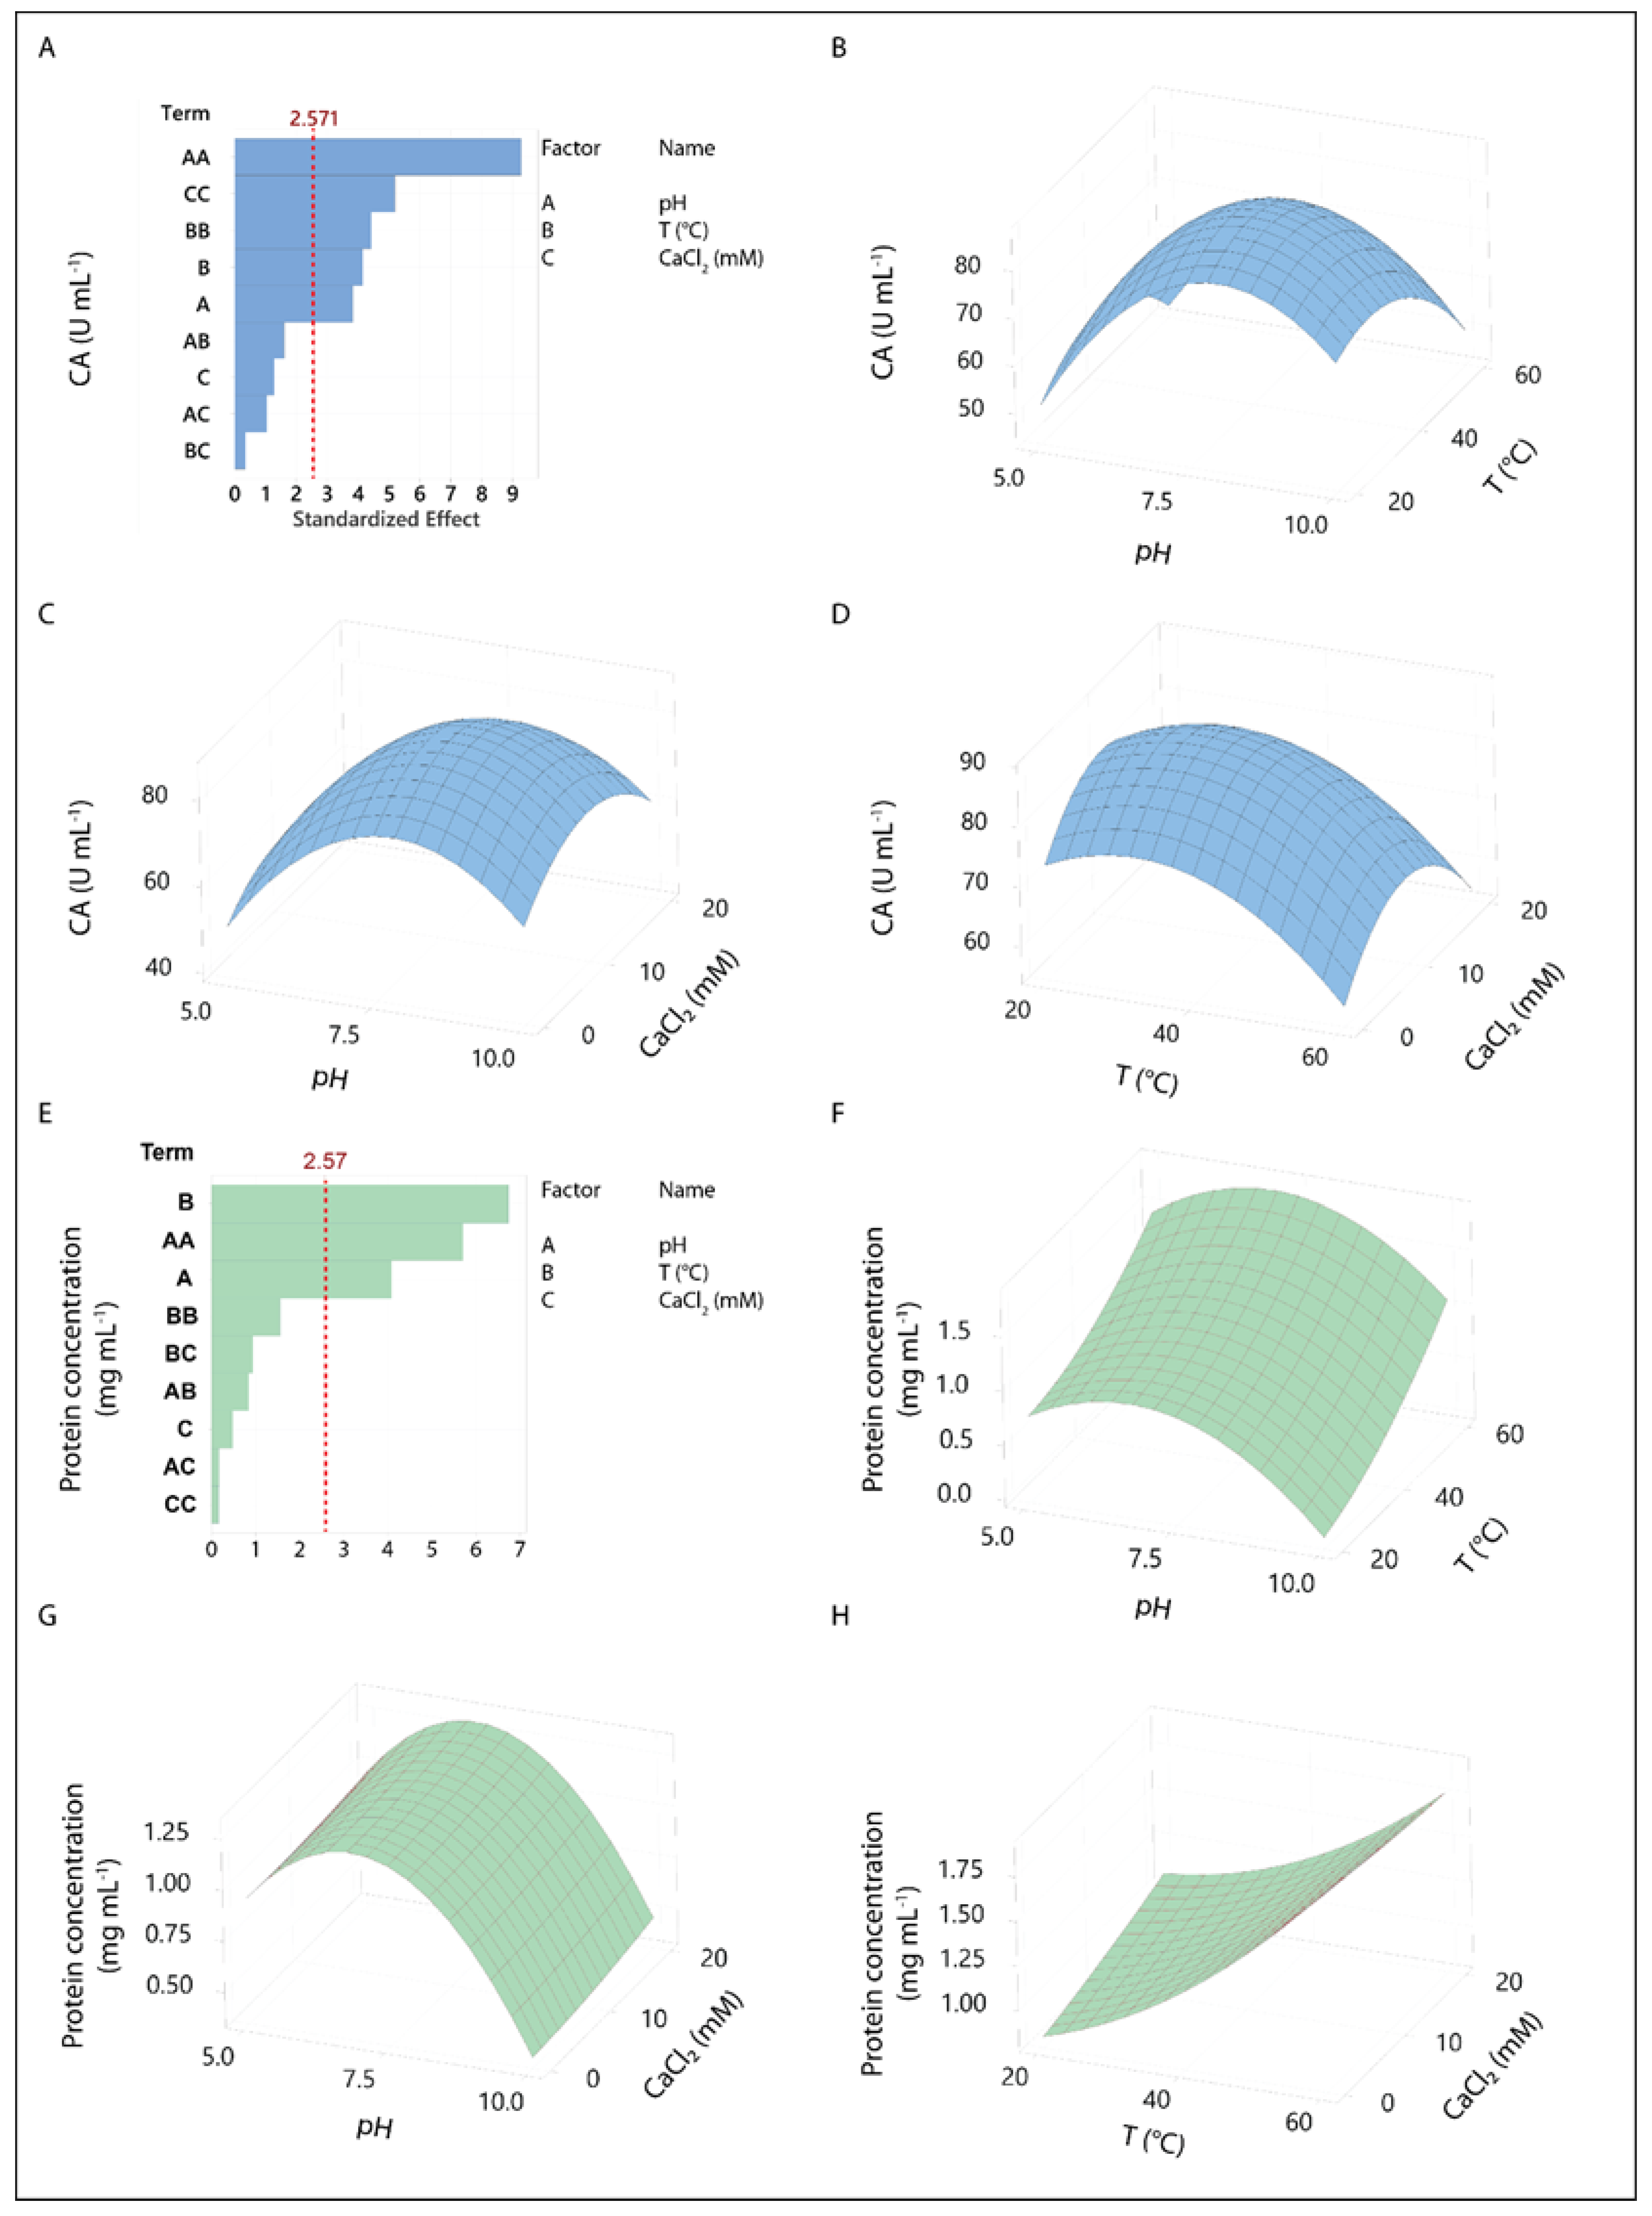
Figure 3.
Biochemical characterization of CA of BSG1. (A) pH Dependence: Relative activity of the BSG extract was measured across different pH values using citrate buffer (pH 3, 4, 5), phosphate buffer (pH 6, 7, 8), and Tris-HCl buffer (pH 9). (B) Temperature Dependence: The relative activity of the extract was assessed at various temperatures using 100 mM phosphate buffer at pH 6.5. (C) Endopeptidases Inhibition Profile: Inhibitory effects on CA of BSG protein extracts of 40 mM Pepstatin A (aspartic peptidase inhibitor), 1.5 mM PMSF (serine peptidase inhibitor), 5 mM EDTA (metallopeptidase inhibitor), and 4 mM Iodoacetamide (cysteine peptidase inhibitor) were analyzed. CA values for each condition were calculated relative to BSG without inhibitors (control), as described in Materials and Methods. (D) Specific Caseinolytic Activity (SCA): SCA of BSG endopeptidases on bovine α-, β- and κ-casein subunits was determined as indicated in the Materials and Method section. Hydrolysis percentages were calculated using SDS-PAGE densitometric analysis, considering 100% hydrolysis as the complete disappearance of the casein bands. Bars represent the standard deviation of three independent assays. Different letters indicate statistically significant differences (p < 0.05).
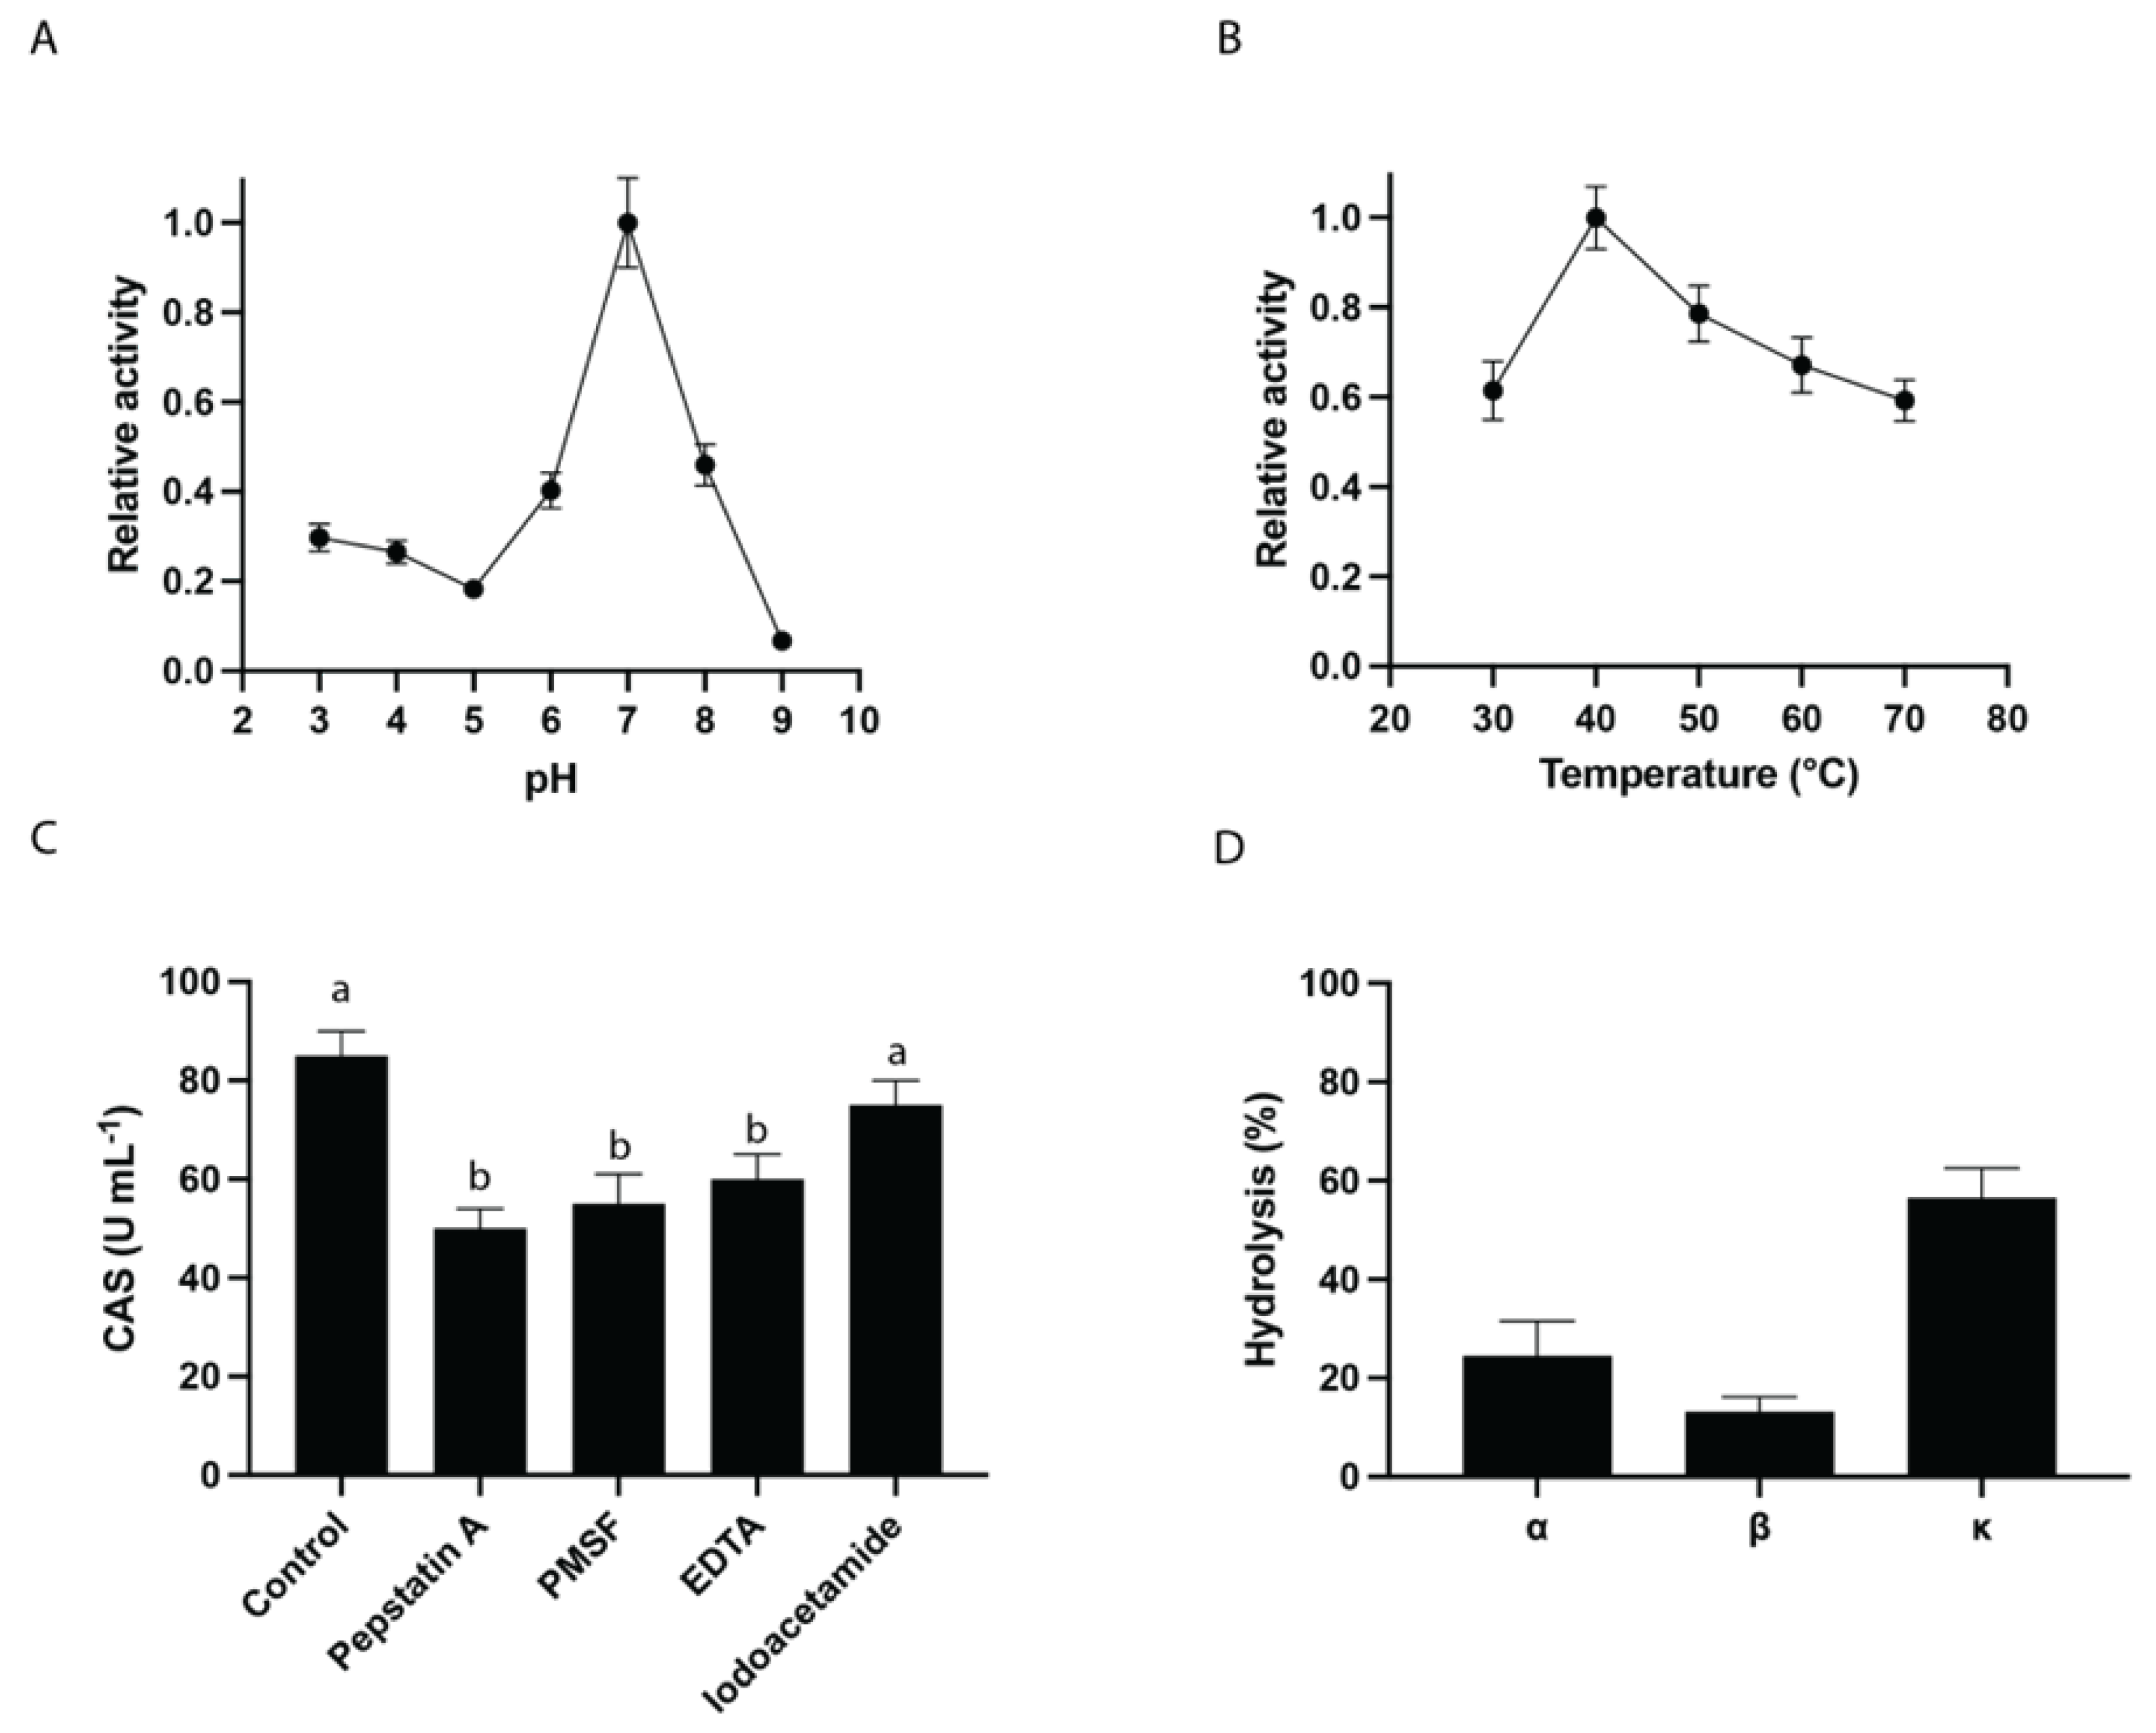
Figure 4.
Milk-Clotting Activity of BSG Proteases. Commercial skim milk was dissolved in a phosphate buffer (pH 6.5) containing 40 µL of 10 mM CaCl₂, in a final volume of 2 mL, and incubated at 37 °C for 24 h. The following conditions were tested: (A) Chymosin served as a positive control, (B) Phosphate buffer pH 6.5 was used as a negative control, (C) Commercial skim milk in phosphate buffer pH 6.5 with 10 mM CaCl₂ and BSG extract at a 1:2 ratio, and (D) 1:1 ratio.
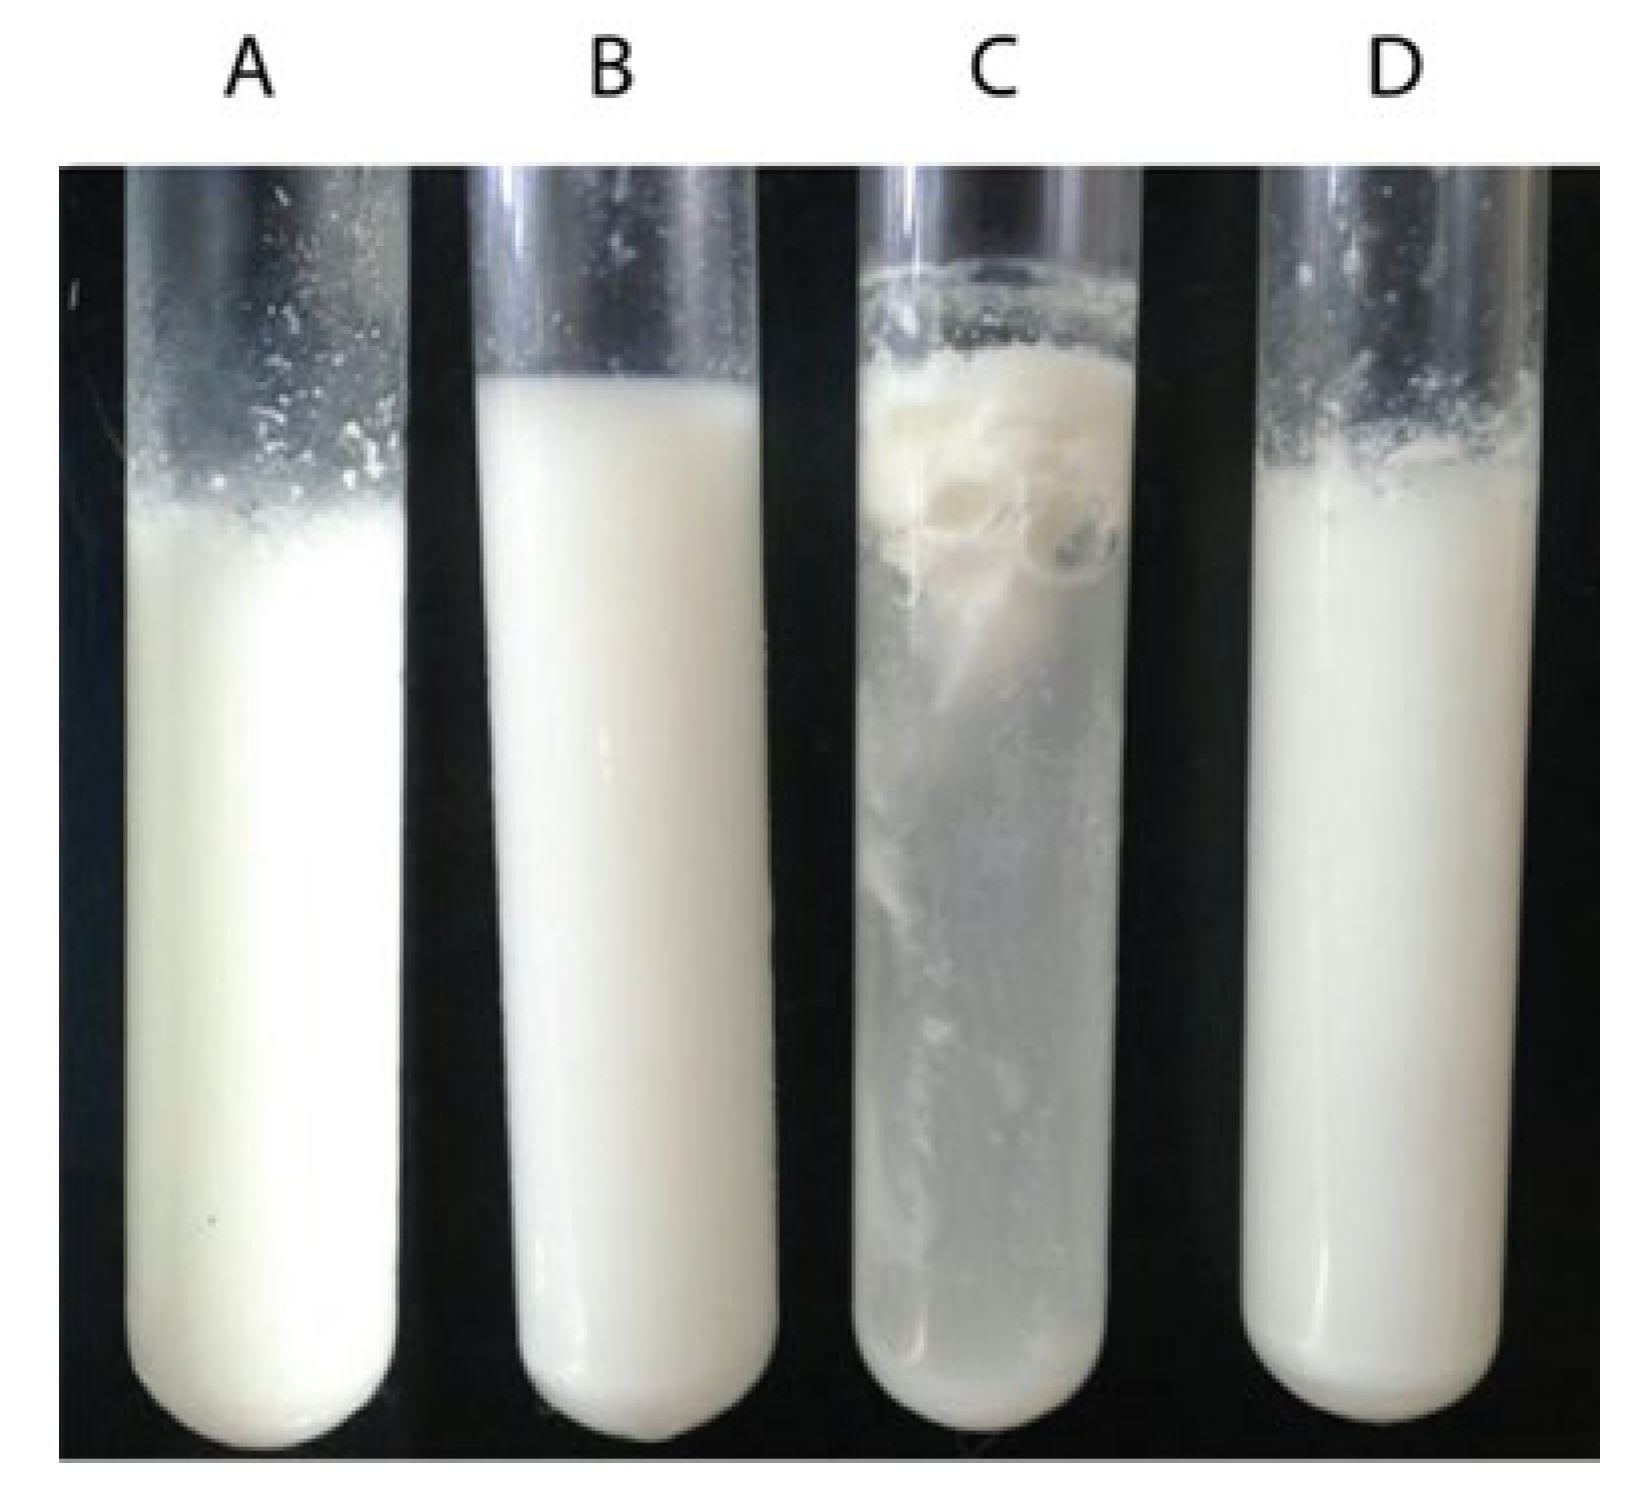
Figure 5.
Comparative analysis of BSG extracts: protein concentration, Specific caseinolytic Activity, and activity on different casein subunits. (A) Protein concentration (mg/mL) of different BSG extracts evaluated. (B) Specific caseinolytic activity of BSG extracts from different styles of beer. (C) Proteolytic activity on different casein subunits of BSG extracts from different styles of beer. Bars represent the standard deviation of three independent assays. Different letters indicate statistically significant differences (p < 0.05).
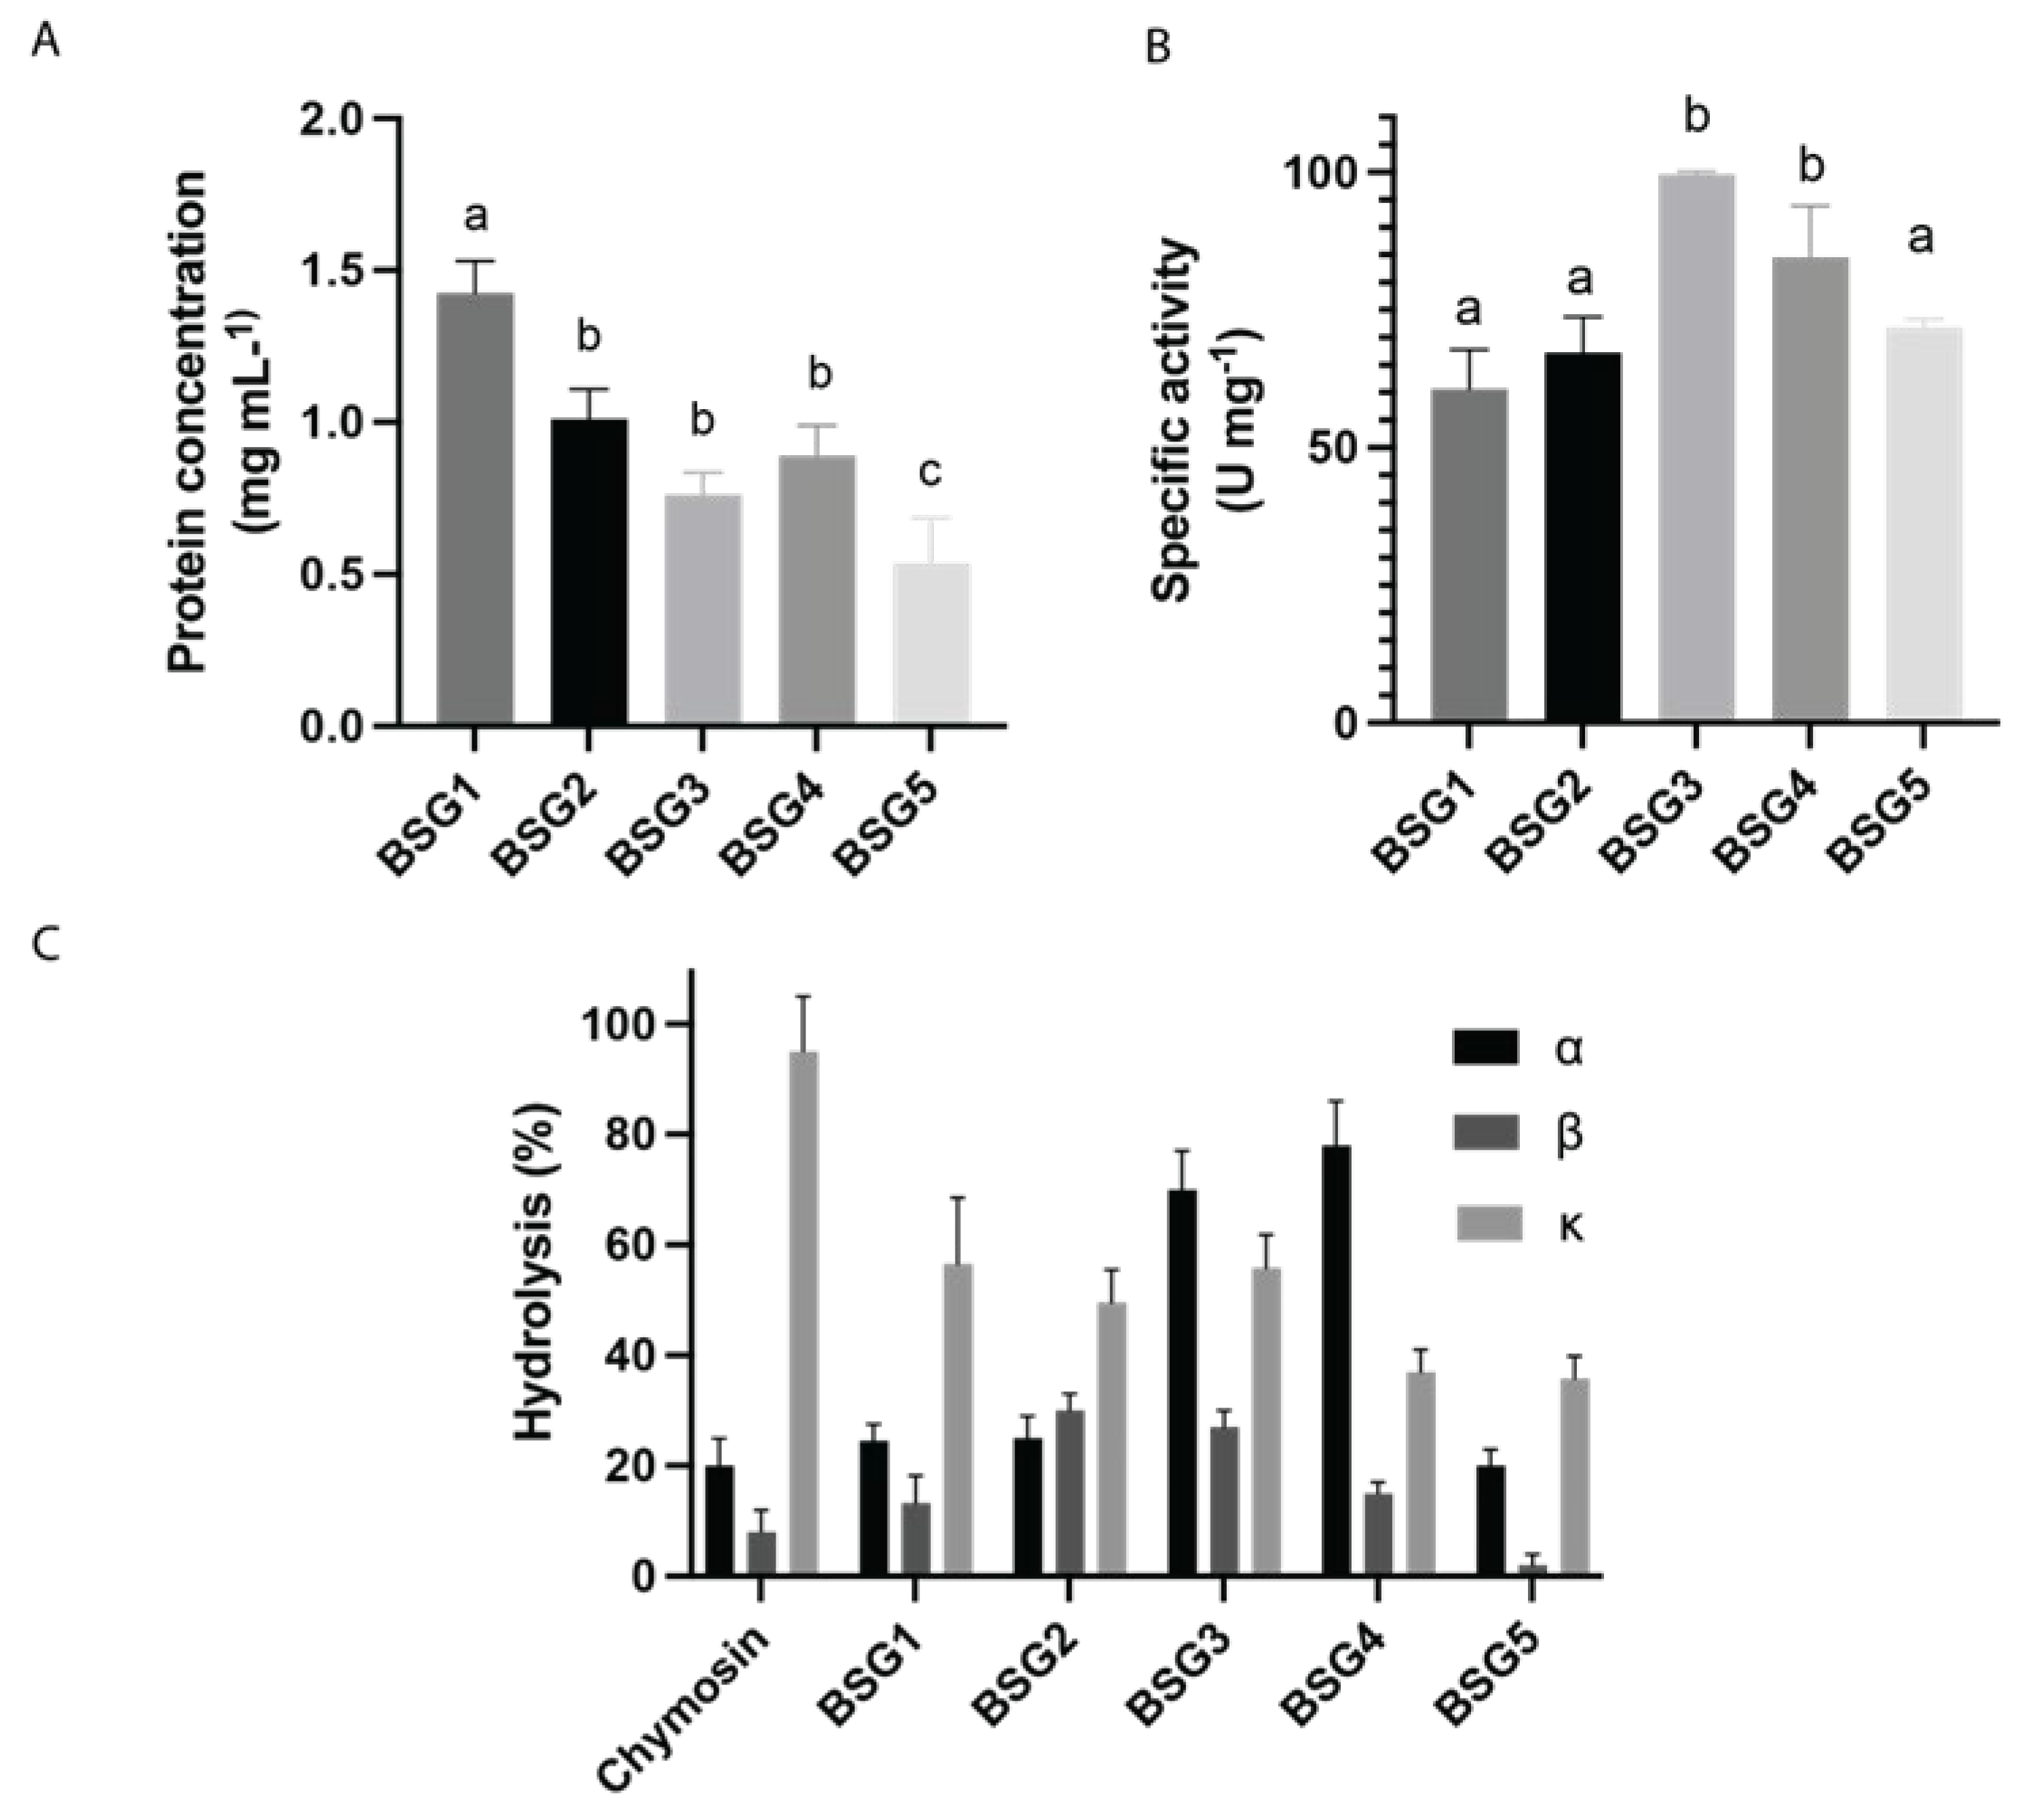
Figure 6.
Milk-clotting activity of BSG extracts from different beer types. (A) 1 mL extract was added to 1 mL of 12 % w/v commercial skim milk dissolved in 100 mM phosphate buffer pH 6.5 containing 40 μl of 10 mM CaCl2, in a final volume of 2 mL. The mixture was incubated at 37 ºC for 24 h. Chymosin was used as the positive control (Chym), and 100 mM phosphate buffer pH 6.5 was used as the negative control (Milk). The clot area was measured using the ImageJ software (B) and plotted relative to the negative control (C).
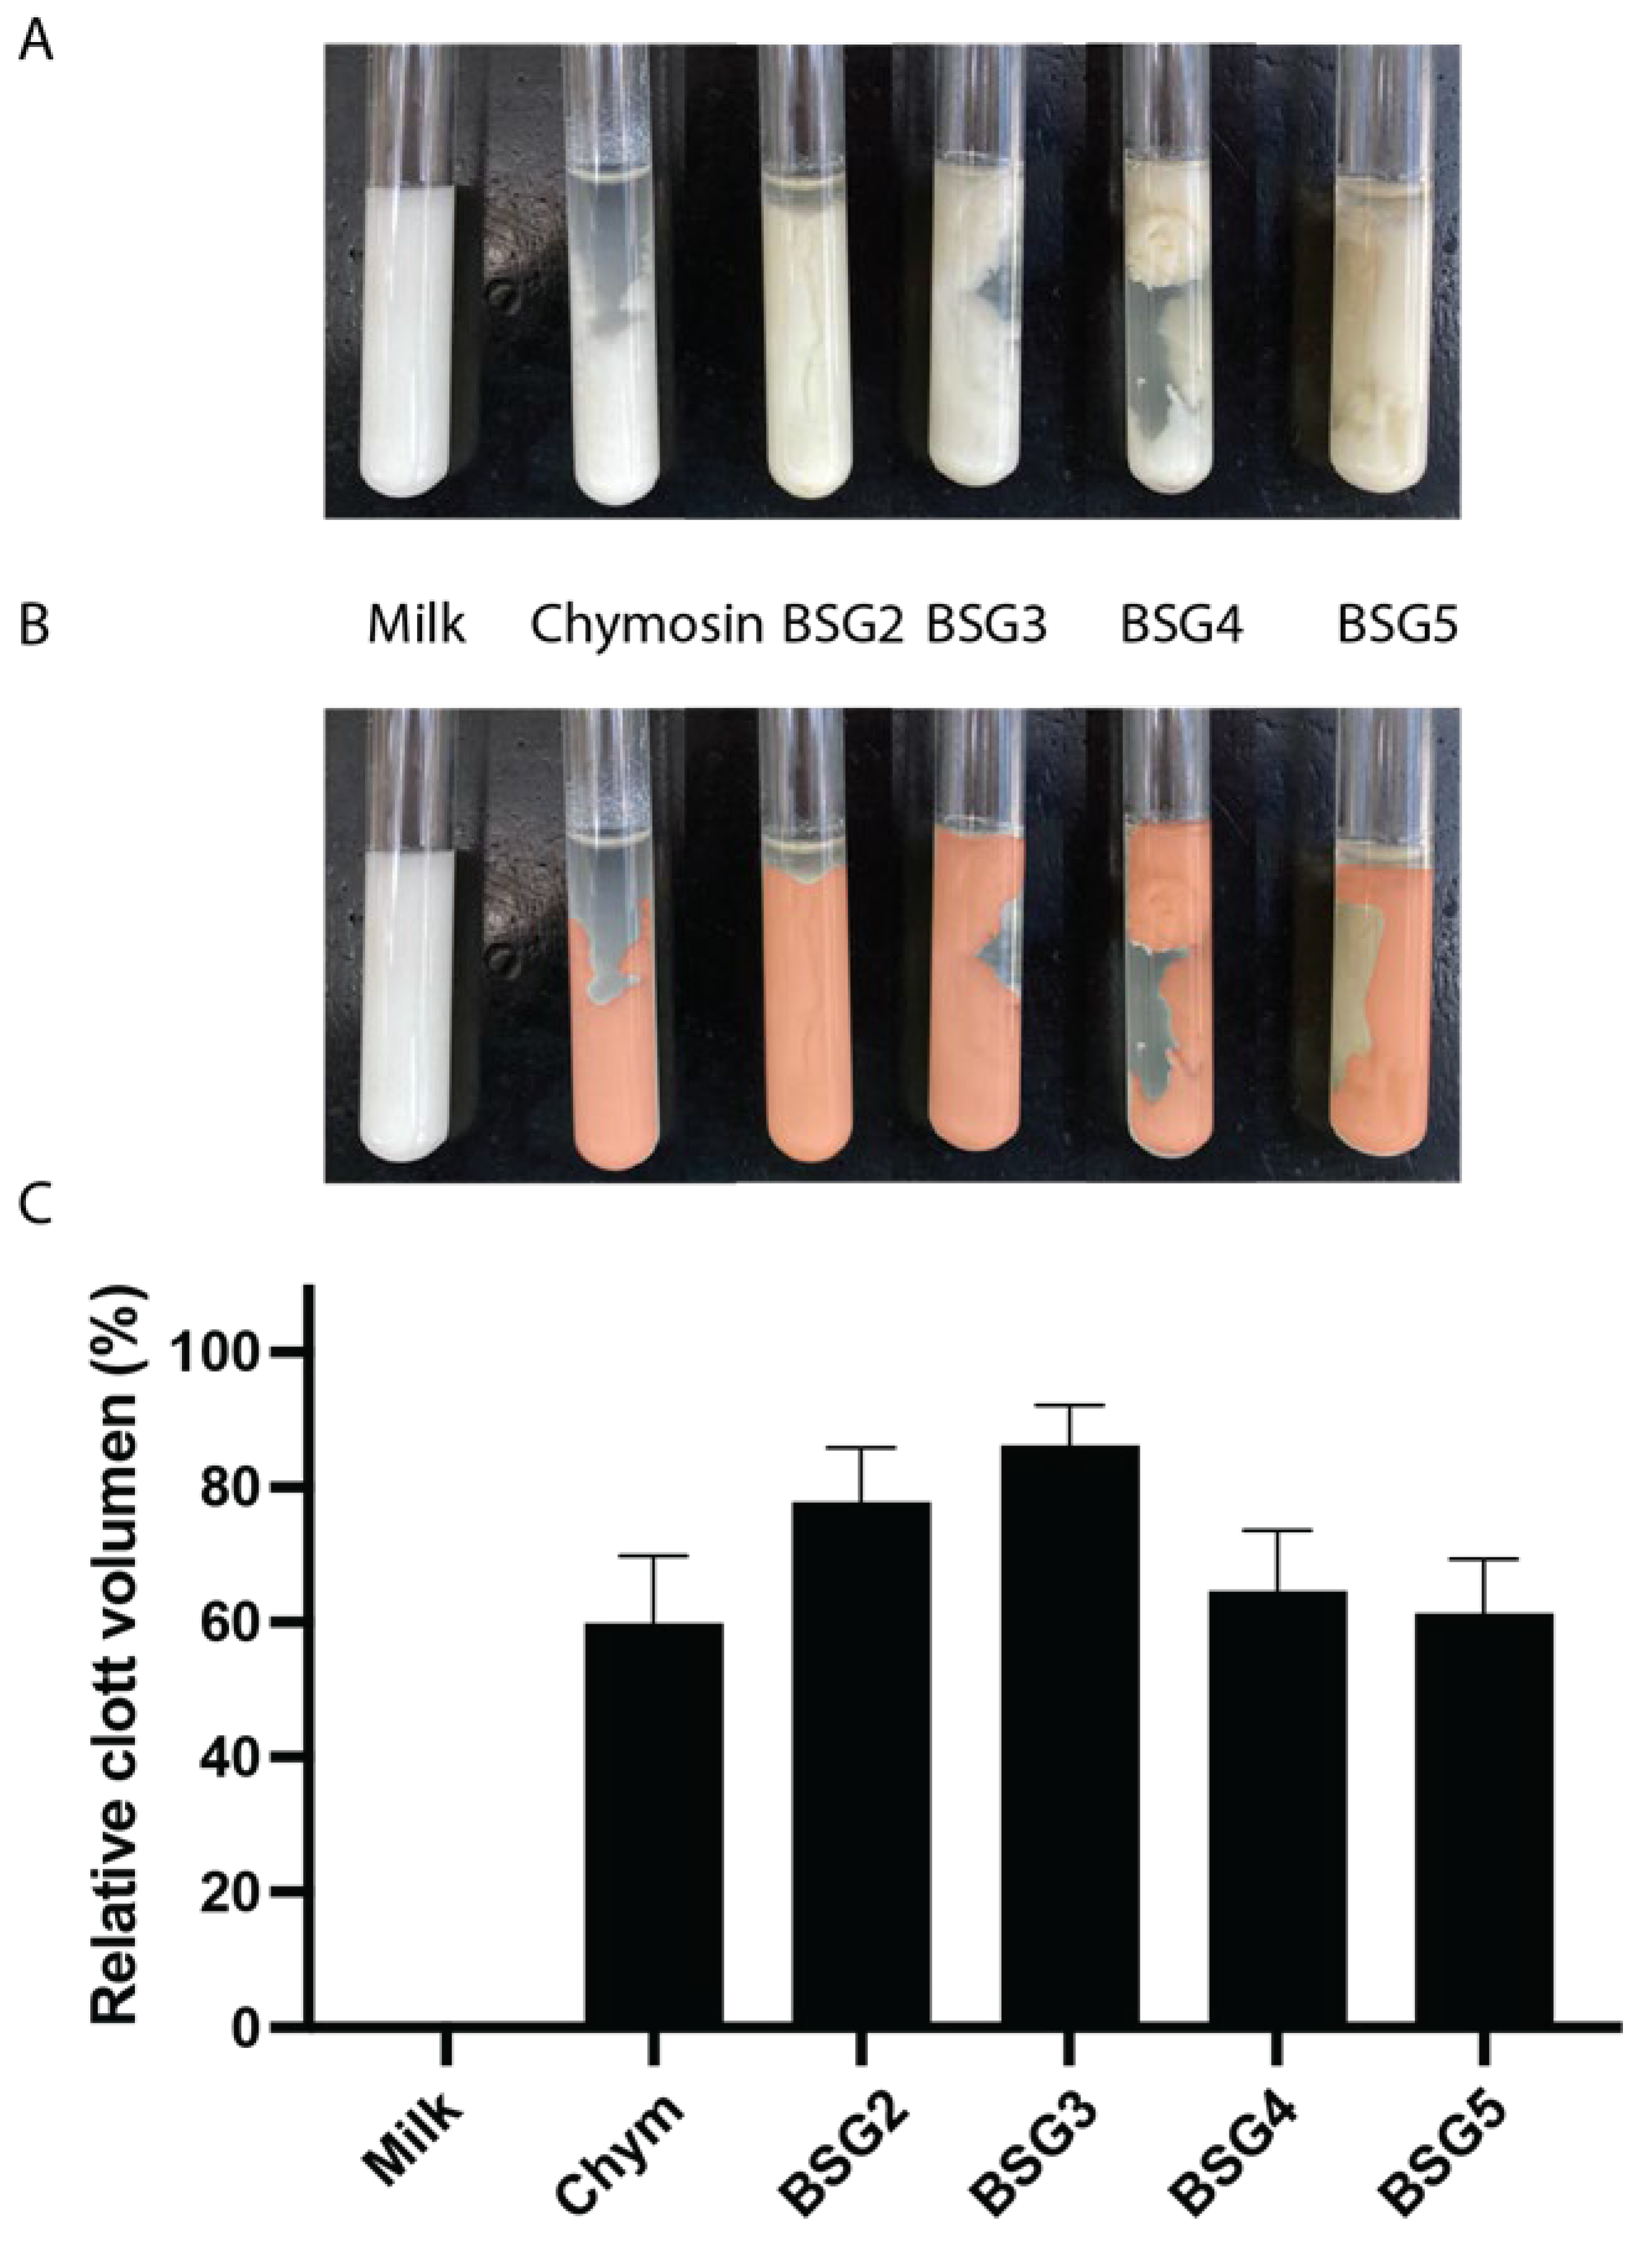

Table 1.
Plackett-Burman evaluated variables and their levels.
| Variable | Levels | |
|---|---|---|
| -1 | +1 | |
| pH | 5 | 9 |
| Temperature (°C) | 30 | 60 |
| Homogenization time (min) | 1 | 3 |
| DTT (mM) | 0 | 10 |
| Triton X-100 (%v/v) | 0 | 5 |
| CaCl2 (mM) | 0 | 10 |
Table 2.
BBD evaluated variables and their levels.
| Variable | Levels | |
|---|---|---|
| -1 | +1 | |
| pH | 5 | 10 |
| Temperature (°C) | 20 | 60 |
| CaCl2 (mM) | 0 | 20 |
Table 3.
Plackett-Burman design for six factors and their responses.
| Run | pH | T (°C) | Homogenization time (min) | Triton (%v/v) | DTT (mM) | CaCl2 (mM) | CA (U mL-1) | Protein concentration (mg mL-1) |
|---|---|---|---|---|---|---|---|---|
| 1 | 9 | 30 | 3 | 0.0 | 0 | 0 | 61 | 0.80 |
| 2 | 9 | 60 | 1 | 5.0 | 0 | 0 | 42 | 1.60 |
| 3 | 5 | 60 | 3 | 0.0 | 10 | 0 | 31 | 1.00 |
| 4 | 9 | 30 | 3 | 5.0 | 0 | 10 | 83 | 0.90 |
| 5 | 9 | 60 | 1 | 5.0 | 10 | 0 | 43 | 1.30 |
| 6 | 9 | 60 | 3 | 0.0 | 10 | 10 | 65 | 1.20 |
| 7 | 5 | 60 | 3 | 5.0 | 0 | 10 | 45 | 1.50 |
| 8 | 5 | 30 | 3 | 5.0 | 10 | 0 | 33 | 0.60 |
| 9 | 5 | 30 | 1 | 5.0 | 10 | 10 | 51 | 0.55 |
| 10 | 9 | 30 | 1 | 0.0 | 10 | 10 | 82 | 0.75 |
| 11 | 5 | 60 | 1 | 0.0 | 0 | 10 | 50 | 0.85 |
| 12 | 5 | 30 | 1 | 0.0 | 0 | 0 | 55 | 0.35 |
| 13 | 7 | 45 | 2 | 2.5 | 5 | 5 | 55 | 0.95 |
| 14 | 7 | 45 | 2 | 2.5 | 5 | 5 | 51 | 1.10 |
| 15 | 7 | 45 | 2 | 2.5 | 5 | 5 | 60 | 0.90 |
Table 4.
BBD and their responses. The significant variables that positively affected CA and protein concentrations were selected.
Table 4.
BBD and their responses. The significant variables that positively affected CA and protein concentrations were selected.
| Run | pH | T (°C) | CaCl2 (mM) | CA (U mL-1) | Protein concentration (mg mL-1) |
|---|---|---|---|---|---|
| 1 | 5 | 20 | 10 | 50 | 0.82 |
| 2 | 10 | 20 | 10 | 70 | 0.12 |
| 3 | 5 | 60 | 10 | 45 | 1.38 |
| 4 | 10 | 60 | 10 | 51 | 0.99 |
| 5 | 5 | 40 | 0 | 49 | 1.03 |
| 6 | 10 | 40 | 0 | 55 | 0.48 |
| 7 | 5 | 40 | 20 | 45 | 0.87 |
| 8 | 10 | 40 | 20 | 60 | 0.39 |
| 9 | 7.5 | 20 | 0 | 75 | 0.66 |
| 10 | 7.5 | 60 | 0 | 60 | 1.87 |
| 11 | 7.5 | 20 | 20 | 65 | 1.08 |
| 12 | 7.5 | 60 | 20 | 53 | 1.95 |
| 13 | 7.5 | 40 | 10 | 85 | 1.08 |
| 14 | 7.5 | 40 | 10 | 90 | 1.38 |
| 15 | 7.5 | 40 | 10 | 80 | 1.22 |
Table 5.
Optimal conditions for CA and protein concentration determined by RSM.
| CA | Protein concentration | |
|---|---|---|
| pH | 7.9 | 7.0 |
| T (°C) | 33 | 60 |
| CaCl2 (mM) | 9 | Non significant |
Disclaimer/Publisher’s Note: The statements, opinions and data contained in all publications are solely those of the individual author(s) and contributor(s) and not of MDPI and/or the editor(s). MDPI and/or the editor(s) disclaim responsibility for any injury to people or property resulting from any ideas, methods, instructions or products referred to in the content. |
© 2024 by the authors. Licensee MDPI, Basel, Switzerland. This article is an open access article distributed under the terms and conditions of the Creative Commons Attribution (CC BY) license (http://creativecommons.org/licenses/by/4.0/).
Copyright: This open access article is published under a Creative Commons CC BY 4.0 license, which permit the free download, distribution, and reuse, provided that the author and preprint are cited in any reuse.


