Submitted:
13 November 2023
Posted:
14 November 2023
You are already at the latest version
Abstract
Cut chrysanthemum, renowned as a highly favored floral choice globally, experiences a significant decline in production due to the practice of continuous cropping. The adverse physiological effects on cut chrysanthemums have been observed as a result of the degradation of soil physical and chemical properties, coupled with the proliferation of pathogens. It is noteworthy that the 'Guangyu' cultivar in Xinxiang, Henan province, China, has been specifically impacted by these effects. This study effectively identified and validated the precise pathogen accountable for wilt disease initially. Subsequently, an analysis was conducted to examine the invasion pattern of the pathogen and the physiological response of the chrysanthemum. Finally, PacBio platform was employed to investigate the dynamic alterations in the microbial community within the soil rhizosphere, comparing the effects of seven years of monocropping with the first year. The findings indicated that Fusarium solani was the primary causative agent responsible for wilt disease, as it possessed the ability to invade and establish colonies in plant roots, leading to alterations in various physiological parameters of the plants. Furthermore, the practice of continuous cropping had been observed to significantly disturb the microbial community composition, potentially acting as an additional influential factor in the advancement of wilt.
Keywords:
cut chrysanthemum
; continuous cropping wilt
; pathogen invasion
; plant physiological response
; rhizosphere microorganisms
1. Introduction
Chrysanthemum morifolium, which belongs to the genus Chrysanthemum, is one of the oldest ornamental and medicinal flowers, and is the second-largest cut flower in the world [1]. It was first cultivated in China and is loved by people all over the world due to its attractive colors and shapes. In recent years, increasing demand for cut chrysanthemum has led to an increase in chrysanthemum cultivation areas, and monocropping is usually the most effective method for maximizing economic benefits. However, during long periods of cultivation, chrysanthemum in continuous cropping areas showed yellowing and wilting leaves, stunted growth, and sharp yield declines. As the cropping time increased, diseases raged, resulting in complete failure of harvest in some areas, which seriously affected the economic income of growers and caused huge economic losses [2]. It is believed that soil microorganisms, specifically soil-borne pathogens, are a major cause of this decline in productivity [3].
Rhizospheres represent dynamic soil regions that are regulated by intricate interactions between plants and organisms closely associated with roots. These regions are characterized by a high abundance of microorganisms, often referred to as the second genome of plants, which play a crucial role in promoting plant health and enhancing crop yield. These microorganisms significantly influence mineral element availability, carbon and nitrogen cycling, as well as the development of soil structure [4,5,6]. The practice of long-term continuous cropping has been observed to have a profound impact on the structure of soil microbial communities, leading to the emergence of soil-borne diseases and a decline in crop yield. In typical soil conditions, certain native microorganisms possess the ability to suppress the growth of pathogens. However, in conducive soil environments, pathogens are able to rapidly invade and proliferate, consequently diminishing the presence of beneficial bacteria. Research conducted on the continuous cropping of Rehmannia glutinosa has revealed significant alterations in the abundance of bacteria and fungi within the rhizosphere soil, disrupting the delicate equilibrium between beneficial and pathogenic microorganisms [7].
The Fusarium genus encompasses several economically significant plant pathogenic species that induce wilt disease in various plants [8], including vegetables, grasses, fruit trees, and flowers. The majority of research efforts have predominantly concentrated on F. oxysporum, the primary causative agent of fusarium wilt on a global scale [9]. This fungal disease poses a substantial threat to crop production, inflicting severe economic losses, particularly in regions characterized by elevated temperatures and humidity levels. The growth of the plant infected with the pathogen in the early stage is comparatively sluggish in comparison to a healthy plant, as the disease symptoms begin to appear from the lower leaves. Subsequently, the leaves curl and yellow from the bottom to the top, ultimately resulting in the complete withering and demise of the entire plant. Additionally, other species within the Fusarium genus, such as F. solani, F. incarnatum, and F. falciforme [10], have also been identified as pathogens for Chrysanthemum. Wilt disease in chrysanthemum has been reported globally, including in regions such as northern India, South Korea, Italy, the Netherlands, and Japan [11]. The frequency of fusarium wilt also outbreaks in various chrysanthemum production areas in China, such as Zhejiang, Fujian, Hebei, and Nanjing, has progressively emerged as a primary constraint on the advancement of the local chrysanthemum industry.
In order to better study the soil microbial community structure, the advent of third generation sequencing technology in recent years, specifically PacBioSMRT sequencing, has a significant impact on the disciplines of genomics and microbiology [12]. This technology has successfully addressed the limitations of conventional culture methods in identifying microorganisms that are challenging to cultivate or have become inactivated. By enabling a comprehensive exploration of the microflora’s composition in various environments, PacBio sequencing offers a novel and efficient approach to investigating microbial community structure, thereby facilitating substantial advancements in the field of microbial research. The study conducted by Pootakham et al. [13] employed full-length ITS and 16S rRNA genes to categorize and examine the symbiotic algae family and bacterial communities present in Indo-Pacific corals located in the Gulf of Thailand. The findings indicated that environmental factors exerted an influence on both the composition of plant structures and the diversity of bacterial communities associated with corals. Furthermore, the study demonstrated the efficacy of PacBioSMAT sequencing in accurately classifying coral-related microbiota at the species level.
Limited research has been conducted on a comprehensive investigation into the factors that contribute to the occurrence of chrysanthemum continuous cropping wilt. Studies pertaining to pathogen infection in chrysanthemum often adopt a descriptive approach, primarily examining pathogen species within host populations, rather than delving into the underlying mechanisms that drive these interactions. So, our study was primarily to isolate and purify the pathogen that may be associated with Fusarium wilt from the rhizosphere soil in cultivar ‘Guangyu’. Additionally, examine the invasion pattern of the pathogen and assess the physiological response of chrysanthemum plants to stress induced by the pathogen. Finally, the PacBio platform was utilized to analyze complete 16S rRNA and ITS sequences to investigate the attributes of microbial communities in the rhizosphere of the soil from the local cut chrysanthemum that has been subjected to continuous cropping for a duration of 7 years, as well as the soil from the initial cropping. The aim of the aforementioned study is to offer a comprehensive comprehension of the potential mechanisms that underlie wilt disease in the ‘Guangyu’ cultivar. Consequently, these findings will contribute to the establishment of a vital theoretical basis for the sustainable advancement of diverse crop varieties.
2. Materials and Methods
2.1. Field investigation and Soil samples collection
The study conducted a field investigation on Fusarium wilt in a cut chrysanthemum planting base located in Xinxiang, Henan province, China (35°24′ N, 114°55′ E). The continuous cropping field and healthy field of chrysanthemum were divided into five districts, from which 20 chrysanthemum samples were randomly selected. The height and leaf width of each plant were measured. Furthermore, several chrysanthemum samples exhibiting severe disease symptoms were randomly selected from each district, and their root and stem characteristics were observed compared with those of healthy plants. Simultaneously, samples of rhizosphere soil were collected and analyzed from 7 years continuous cropping and a first-year cropping fields. A multi-point sampling method was employed to select five sampling points in each field, and the collected samples were subsequently merged. The samples were promptly placed into sterile bags, transported to the laboratory under low temperature conditions, and stored at -80 °C.
2.2. Isolation and identification of the pathogen
Using the dilution-plate method, the fungi were isolated from soil samples collected from a Fusarium wilt field. The strains were isolated and purified by singlespore isolation, which were then inoculated into PDA solid medium and incubated at a temperature of 30 ℃ for a period of 3-7 days [14]. Once the hyphae were fully covered on a 90 mm plate, the colony morphology, color, texture, and growth rate were carefully observed and recorded. The purified fungi were subsequently cultured in PDA for 7 days, and the surface conidia were washed with aseptic water, filtered using 4 layers of lens paper, and finally, 20 μL of the filtered solution was placed under a light microscope (NikonHFX-IIA, Japan) to observe the morphology of the conidia.
The fungal genomic DNA was extracted from fresh fungal cultures following the methodology described by Al-Sadi et al. [15]. The rDNA-ITS region was amplified using the universal primers ITS1 (5′-TCCGTAGGTGAACCTGCGG-3′) and ITS4 (5′-TCCTCCGCTTATTGATATGC-3′) as outlined by White et al. [16]. Subsequently, the amplified DNA fragments were purified and ligated into the pMD19-T vector. The resulting constructs were then submitted to Sangon Biotech Co., Ltd. (Shanghai) for sequencing. The obtained sequencing results were compared and analyzed using Blast against the NCBI database (http://blast.ncbi.nlm.nih.gov), and the phylogenetic tree was constructed using Clustal X v1.83 software [17] and MEGA 4.0 [18].
2.3. Pathogenicity test
The healthy chrysanthemum cultivar ‘Guangyu’ was selected from a chrysanthemum field, following three generations of consecutive cutting and transplanting in an indoor environment. The plants that remained asymptomatic were chosen as the inoculated hosts. The uppermost 10-15 cm of these plants were trimmed and immersed in rooting fluid for 30 min, before being transplanted into flowerpots (a diameter of 7 cm and a height of 10 cm) filled with sterile vermiculite. Subsequently, following a rooting period of 15-20 days, the plants were relocated to flowerpots containing sterile nutrient soil and vermiculite in a ratio of 2:1 (with a flowerpot diameter of 16 cm and height of 14 cm). Following an additional 1-2 weeks of cultivation under controlled conditions in a illuminating incubator (at a temperature of 30 °C, with a photoperiod of 14 h of light and 10 h of darkness), the treated plants were utilized as the subsequent experimental hosts.
To determine which specie of Fusarium are responsible for inducing plant disease, the root-drenching method described by Getha et al. [19] was employed. In the treatment group, each plant was subjected to a fungal spore suspension of 20 mL at a concentration of 106/mL. Conversely, the control group was treated with sterile water. The treated plants were then placed in the illuminating incubator and cultured at a temperature of 30 ℃, following a 14 h light and 10 h dark cycle. The plants were observed until the appearance of disease spots. Subsequently, diseased stem tissue was collected, and the pathogen was isolated and purified from the tissue. Finally, the isolated fungal specimen was compared with the inoculated pathogen to determine whether it was the causative agent of chrysanthemum wilt.
2.4. Observation of colonization process and disease assessment
The root-dipping method was employed to investigate the pathway of pathogen invasion. Initially, chrysanthemum seedlings were subjected to a 30 min wash under running water, followed by rinsing with aseptic water. Subsequently, they were immersed in 75% alcohol for a duration of 10-15 s and rinsed with sterile water three times. The roots were then incised using sterilized scissors. The treatment group was immersed in the prepared spore solution for 30 min, while the control group was immersed in aseptic water for the same time. The chrysanthemums were subsequently removed and transplanted into flowerpots containing sterilized soil. Following the watering process, the flowerpots were subsequently relocated to an incubator with specific conditions, including a temperature of 30 ℃, a photoperiod of 14 h, and a dark cycle of 10 h. The morbidity and mortality rates of chrysanthemums were then diligently monitored and documented every 10 days. The disease index (DI) was determined by carefully observing the progression of symptoms such as leaf yellowing, wilting, and plant demise. To establish a classification system for Fusarium wilt, a grading scale ranging from 0-4 was adopted, referring to Alkher et al. [20]. Grade 0 signified the absence of symptoms in the leaf, grade 1 denoted the presence of a single leaf exhibiting yellowing or curling at the basal region <30%, grade 2 signified the yellowing, curling, or wilting of approximately 30% to 50% of the entire plant’s leaves, accompanied by a slight reduction in plant height, grade 3 indicated the yellowing, curling, or wilting of approximately 50% to 75% of the plant’s leaves, resulting in leaf abscission, grade 4 signified the 75% to 100% yellowing, curling, or wilting of all leaves on the plant, or the demise of the plant. The disease grade for each plant was documented at 10 and 20 days post-inoculation (dpi), and subsequently, the disease index was computed using the following formula: disease index = Σ (number of diseased leaves at each grade × the corresponding grade) / (total number of leaves examined × highest grade).
The root tissues of chrysanthemum were collected at specific time intervals (12 h, 5 day, 10 day, 15 day, 20 day) and subjected to a 30 min washing procedure with running water to thoroughly remove any soil adhered to the root surface. For each period, 20 fresh root segments were carefully selected and prepared for scanning electron microscopy (SEM) according to the method described by Boamah et al. [21]. Simultaneously, the root samples were subjected to WGA-AF488&PI co-staining, and observed by laser confocal scanning microscopy (LCSM) to observe the colonization of pathogens in the root system [22].
2.5. Plant cell wall degrading enzyme (CWDE) activity of pathogen
The enzymatic activity responsible for degrading the cell wall of plants by the pathogen was assessed using the 3, 5-dinitrosalicylic acid (DNS) method [23], specifically measuring the activities of cellulase (CX), β-glucosidase (βG), pectin methylgalactuionase (PMG), polygalacturonase (PG), and xylanase.
2.6. Physiological response of plants after infection by pathogen
The concentrations of photosynthetic pigment including carotenoid and chlorophyll (chla, chlb), soluble sugar, and soluble protein in plants were quantified using spectrophotometry [24], anthrone colorimetry [25], and the Coomassie bright blue method [26], respectively. The levels of ash content, potassium (K), phosphorus (P), and calcium (Ca) in leaves were measured using Inductively Coupled Plasma-Mass Spectrometry (ICP-MS) [27].
The content of H2O2 was determined as follows: 0.1 g of sample tissue was weighed, and subsequently mixed with 0.9 mL of normal saline. The resulting mixture was then subjected to quick-freezing and grinding in liquid nitrogen, followed by centrifugation at 10,000 rpm for 10 min. The supernatant obtained from this process was utilized for testing purposes and measured the absorbance at 405 nm. The activities of superoxide dismutase (SOD), catalase (CAT), peroxidase (POD) and malondialdehyde (MDA) were determined using Kits (Grace Biotechnology, Suzhou, China) according to instructions. The activity of polyphenol oxidase (PPO), phenylalanine ammonialyase (PAL), and Chitinase (CHI) was determined using the Polyphenol Oxidase Kit, Phenylalanine Ammonialyase Kit, and Chitinase Kit (Nanjing JianCheng Bioengineering Institute, China) based on the manufacturer’s protocols.
The content of (Salicylic acid) SA and (Jasmonic acid) JA in the supernatant was measured using the Plant Jasmonic acid elisa kit and Plant Salicylic acid elisa Kit, respectively, following the provided instructions (Quanzhou Ruixin Biological Technology Co., LTD Quanzhou, China).
2.7. Soil DNA extraction and microbiome profiling
The soil samples from mixed continuous cropping were subjected to parallel sequencing and labeled as LZ1861a-a, LZ1861a-b, and LZ1861a-c, while the healthy soil samples were labeled as XT1861a-a, XT1861a-b, and XT1861a-c. The DNA extraction process for fungi and bacteria in each soil sample followed the standard protocol of the OMEGA DNA isolation kit (Omega, USA). The quality of the extracted DNA was assessed for degradation and contamination using 1% agarose gels. The purity of DNA was assessed using a NanoDrop™ One UV-Vis spectrophotometer (Thermo Fisher Scientific, USA), with an OD260/280 ratio ranging from 1.8 to 2.0 and an OD260/230 ratio between 2.0-2.2. Subsequently, the DNA concentration was determined using a Qubit® 4.0 Fluorometer (Invitrogen, USA). Amplification of the full length of the 16s rRNA gene was achieved using the forward 27F primer (5′-GAGAGTTTGATCCTGGCTCAG-3′) and reverse 1541R primer (5′-AAGGAGGTGATCCAGCCGCA-3′). The ITS1 (5′-TCCGTAGGTGAACCTGCGG-3′) and ITS4 (5′-TCCTCCGCTTATTGATATGC-3′) primers were used to amplify the full length ITS rRNA gene. Following purification, the amplified product was submitted to Grandomics Co., Ltd. (Wuhan) for DNA sequencing using the PacBio RS II sequencer.
2.8. Bioinformatic analysis
The initial dataset was partitioned based on barcode information using SMRT Portal v2.3.0, resulting in the acquisition of high-quality CCS (Circular Consensus Sequencing) sequences. Subsequently, the split sequences underwent filtration to eliminate extraneous data, including fragments outside the length range of 1400-1600 bp, reads containing “N” bases, reads containing homopolymers exceeding 6 base pairs, and sequences with an average mass below 90. The resulting set of filtered high-quality data was subjected to removal using Usearch software (v10) and subsequently clustered using OTU (Operational Taxonomic Units) methodology. The representative sequences of OTU at a 97% similarity level were subjected to classification and analysis using the uclust algorithm. The species present in each sample were classified and quantified at various taxonomic levels, including boundary, phylum, class, order, family, genus, and species. The relative abundance of species at the gate and genus levels was visualized using R software. Bacterial and fungal communities were compared against the Silva (v138.1) and Unite (v8.2) databases, respectively. The α diversity, β diversity, and species differences among the samples were assessed using the Qiime software and R language.
2.9. Statistical analytical methods
Statistical analysis was performed using Excel 2016 and GraphPad Prism (v 8.0.2) for Windows. The data were expressed as mean ± standard error of the mean and assessed through two-way ANOVA of the three biological replicates, followed by the least significant difference test. Statistical significance was determined at p < 0.05, p < 0.01, and p < 0.001.
3. Results
3.1. Chrysanthemum disease symptoms in the field
Following continuous cropping, negative physiological characteristics were observed in the chrysanthemum plants. Initially, the lower leaves exhibited wilting and yellowing, while no evident browning was observed at the stem base. As the disease progressed, the plants exhibited stunted growth, blackening and rotting of the diseased roots, and increased susceptibility to uprooting. Ultimately, the entire plant withered and perished (Figure 1 A, B). According to the statistical analysis conducted on healthy and diseased plants in the field (Figure 1C), it was evident that the leaf width and plant height of diseased plants were significantly lower compared to those of healthy plants (p < 0.001). This observation suggested that the presence of Fusarium wilt disease had a substantial detrimental impact on the overall quality of chrysanthemum plants.
3.2. Isolation and identification of Fusarium pathogens
A sample of rhizosphere soil from chrysanthemum wilt plants was taken, and a total of 53 strains of fungi were isolated and purified using the gradient dilution plate culture method. Among these fungi, 37 were initially identified as Fusarium species based on morphology observation. The 37 strains exhibited two distinct colony forms, referred to as type A and type B. Type A colonies displayed an intermediate raised villous structure, with a neat edge and dense aerial mycelium (Figure 2A, B). Additionally, it was observed that the color of the colonies changed from white to light yellow and wheel lines appeared after continued cultivation. After a period of 7 days of cultivation, the entire plate became completely covered with colonies. Two distinct types of conidia were produced by type A fungus. The large conidia exhibited a sickle-shaped morphology, were colorless and transparent, and possess 2-4 septa. They were measured approximately 15-20 µm in length and 2-3 µm in width. On the other hand, the small conidia were oval-shaped, possessed 0-1 septa, and had dimensions of 4-5 µm in length and 2-3 µm in width (Figure 2C, D). The type B colony displayed protruding villi in the central region, although its colony edges were irregular. Furthermore, the aerial hyphae of this colony were longer compared to those of the type A hyphae. As the culture time progressed, the colony gradually transitioned in color from red to purple. The colony lacked a ring pattern and exhibited slower growth compared to the type A. After 10 days of culture, the entire plate became covered (Figure 2E, F). The conidia of the type B fungus were characterized by their small, rounded, colorless morphology, with 0-1 septum and a size ranging from 2-9.5 μm. Notably, no large conidia were visible (Figure 2G, H).
The amplified rDNA-ITS sequences of 37 strains fragment had a length of approximately 600 bp. Subsequently, the fragment was ligated to pMD19-T and sent to Shenggong Bio (Shanghai) Co., Ltd. for sequencing. Upon comparing the sequences with the NCBI Blast database, it was observed that among the 37 strains, the sequence of 16 type B strains exhibited complete consistency with F. oxysporum, with a homology of 100% (designated as Fo). Conversely, the remaining 21 type A strains displayed a homology of 99.8% with F. solani in their ITS sequences (designated as Fs). The phylogenetic tree further proved the isolated strains were conclusively identified as F. oxysporum and F. solani (Figure 2I).
3.3. Pathogenicity determination of pathogen
The strains of Fo and Fs were subsequently reintroduced to the healthy plants under identical growth conditions. The findings indicated that chrysanthemums in the aseptic water treatment group (CK) (Figure 3A, B) and Fo treatment group (Figure 3C, D) exhibited normal growth without any signs of disease. Conversely, the chrysanthemums in the Fs treatment group displayed symptoms consistent with those observed in naturally occurring chrysanthemum wilt in the field (Figure 3E, F). Specifically, the lower leaves began to curl and yellow from the 30 dpi, with an incidence rate exceeding 80%. The pathogen was subsequently reisolated from the stem base of the affected plant, and the colony and conidia were consistent with those of the previously isolated.
3.4. Invasion and colonization of F. solani in Chrysanthemum Root
The plant cell wall served as the initial barrier against pathogen enter. Pathogens were capable of generating certain substances that broke down polymers like pectin and cellulose within the plant cell wall to disrupt the structural integrity of plant cell tissue and a reduction in cell adhesion. Specifically, these substances were observed as cell wall degrading enzymes (CWDE), such as cellulase, pectinase, and hemicellulase, and others. The secretion of CWDE by pathogen played a vital role in the process of infection. According to the data presented in Figure 4, the results suggested that F. solani exhibited the capacity to synthesize a range of plant CWDE, including cellulase (Cx), β-glucosidase (βG), polygalacturonase (PG), pectin methylgalacturonidase (PMG), and xylanase. These enzymes played a crucial role in enabling F. solani to penetrate plant tissue.
The characteristic symptoms observed in potted chrysanthemum plants affected by F. solani were as follows: during the initial phase (0-10 days), the lower leaves gradually exhibited curling, and this indicated the disease severity reached grade 1. In the intermediate phase (10-15 days), approximately 30% of the lower leaves display yellowing and wilting, accompanied by browning of the roots, indicating a disease severity of grade 2. In the later stage of the disease (15-20 days), a significant proportion of leaves (50%-75%) exhibited yellowing and withering at the bottom, while individual leaves gradually turned brown. Additionally, the base of the stem displayed a dark brown color, and the disease severity reached grade 3. Following a growth period of 20 days, the entire plant’s leaves assumed a yellow-brown hue, making it susceptible to easy uprooting. Furthermore, the roots underwent rotting and blackening, accompanied by an unpleasant odor. Ultimately, the entire plant withered and perished, resulting in a disease severity of grade 4. Incidence and incidence index statistics at 10 and 20 dpi were shown in Table 1. The symptoms exhibited by the F. solani treatment group closely resembled the naturally occurring symptoms of chrysanthemum wilt observed in the field. Conversely, the potted chrysanthemum plants in the control group remained symptom-free and exhibited healthy growth (Figure 5).
The pathway by which F. solani infiltrated the plant root was depicted in Figure 6. Following a 12-hour invasion period, a limited quantity of conidium adhered to the root hair and intercellular space, with some conidium initiating germination to generate bud tubes (Figure 6B), but no invasive structures were observed. At 1 dpi, the pathogen’s hyphae that had attached to the root surface began elongating and intertwining (Figure 6D), yet they remained confined to the cell gaps to seek opportunities for invasion. At 3 dpi, there was a notable increase in pathogen abundance within the root system, accompanied by the infiltration of certain hyphae through the intercellular space and the attachment of numerous conidia to side space (Figure 6F). At 5 dpi, pathogen propagation and subsequent conidia production commenced on the root surface, coinciding with the partial destruction of cellular structures (Figure 6H). At 10 dpi, the plant had transitioned into the initial phase of the disease, characterized by the presence of hyphae and conidia covering the surface of the root system, leading to a substantial proliferation of the pathogen, and the morphology of root cell appeared abnormal. (Figure 6J, K, L). In contrast, the control group root consistently exhibited intact and well-organized cell morphology, with cells appearing full, smooth, and closely aligned (Figure 6A, C, E, G, I).
The invasion and colonization of pathogens in plant roots was also visualized using LCSM, as depicted in Figure 7. In the control group (CK), plant cells were consistently arranged in a dense and orderly manner, with no evidence of pathogen hyphae or conidia observed within the tissue (Figure 7A, E, I, M, Q). Conversely, in the pathogen treatment group (Fs), a limited number of pathogen conidium were observed to adhere to the root hairs and aggregate in the intercellular space at 12 hours post-inoculation (Figure 7B, C, D), while the cellular structure remained intact. At 1 dpi, the conidium that accumulated in close proximity to and within the root hairs initiated the process of hyphal formation (Figure 7F, G, H). Consequently, the mycelium structure became discernible within the plant roots, exhibiting growth and extension along the intercellular space. However, the colonization of pathogens within the roots remained limited. At 3 dpi, the hyphae within the root continued to proliferate along the intercellular space, while the germinated conidia that had attached themselves externally to the root commenced invasion through the intercellular spaces, with observable apical growth ends (Figure 7J, K, L). At 5 dpi, the pathogens present in the root system transitioned into the asexual reproductive phase (Figure 7N, O, P), resulting in the generation of a significant quantity of conidia. Subsequently, these pathogens initiated the upward transportation of conidium through the intercellular space and vascular bundles (Figure 7P). By the 10 dpi, the hyphae had successfully colonized the entire root system of the chrysanthemum plant (Figure 7R, S, T). Consequently, the aboveground leaves of the chrysanthemum plant began to exhibit signs of water loss and subsequent shrinkage.
3.5. Chrysanthemum’s physiological response to F. solani inoculation
Effects on plant nutrition and growth
In the intermediate stage of infection, which occurred 15 dpi, a substantial decline in growth indexes of plants, encompassing fresh weight, plant height, and photosynthetic pigment (chla, chlb and carotenoid) was observed in treatment group (Fs). Furthermore, the ash content in tissues exhibited a notable increase in comparison to the control group (CK) (Figure 8A). The contents of inorganic P, K and Ca began to accumulate and reached the peak during the early stage of pathogen infection (0-10 dpi), and subsequent decline. Furthermore, there was an elevation in soluble sugar and protein concentrations, but as the severity of the plant disease intensified, the levels of inorganic substances and nutrients gradually diminished in Fs group. Conversely, the inorganic substances and nutrients in CK did not show any noteworthy alterations throughout the experiment (Figure 8B).
Oxidative stress on plants
Within 5 dpi of F. solani (Fs), the H2O2 content in the infected tissue exhibited minimal variation. However, subsequent to the 5 dpi, a rapid increase in H2O2 levels was observed, peaking at the 10 dpi. This increase was significantly higher compared to the control group (CK) (p < 0.001), suggesting the occurrence of oxidative stress in plants. Consequently, upon pathogen infection and the subsequent buildup of H2O2, The concentration of malondialdehyde (MDA) in plants exhibited a rapid increase starting at 5 dpi, and the increase was sustained and reached its peak at 10 dpi, remaining consistently high thereafter. The findings indirectly suggested that during the middle and later stages of F. solani infection, the plants’ capacity to manage reactive oxygen diminished, leading to the accumulation of H2O2, which in turn could cause membrane lipid peroxidation and exacerbated cellular damage (Figure 8C).
Plant hormone level
The data presented in Figure 8F demonstrated that F. solani infection in chrysanthemum roots induced the synthesis of endogenous hormones JA and SA. The concentration of JA exhibited an initial rise upon infection, reaching its peak at 5 dpi, which was higher than the CK (p < 0.01). However, this increase was transient. Conversely, the concentration of SA in Fs showed a rapid increase from the early stages of infection and remained significantly higher than CK (p < 0.001) until the 7 dpi. Subsequently, it gradually decreased but remaind higher than that of CK.
3.6. Rhizosphere microbial community diversity changes during continuous monocropping
Changes in the Bacterial Community Composition
Chao1, Richness, Shannon, and ACE index were utilized to evaluate the abundance and diversity of bacteria in soil samples. The results revealed a significantly higher bacterial species abundance and diversity in soil samples from continuous cropping compared to healthy soil. The sequencing details and α diversity index of the samples were presented Table S1. The sparse curve and Shannon diversity curve were depicted in Figure 9A, which offered an evaluation of the sequencing quantity for each sample. The presented curves provided evidence that the sequencing depth employed facilitated a thorough depiction of bacterial diversity within the sample, while also enabling the identification of a substantial proportion of the microbial composition.
Additionally, Figure 9B presented the bacterial community structure and dominant species at the phylum level for both continuous cropping soil and healthy soil. The phyla Planctomycetota, Bacteroidota, Proteobacteria, Acidobacteriota, and Chloroflexi exhibited the highest relative abundance of bacterial communities in both continuous cropping soil (LZ1861a-a,b,c) and healthy soil (XT1861 a-a,b,c), ranging from 19.73% to 22.82%, 16.10% to 17.08%, 13.01% to 16.54%, 6.98% to 11.23%, and 8.48% to 10.28%, respectively. Collectively, these phyla account for 64.30% to 77.95% of the total bacterial community in the soil. The relative abundance of phyla such as Patescibacteria, Verrucomicrobiota and Methylomirabiota in continuous cropping soil exhibited a statistically significant increase compared to healthy soil, with respective increases of 44.32%, 48.62%, and 33.33%. Conversely, the relative abundance of Actinomycetota, Cyanobacteria, and Firmicutes in continuous cropping soil significantly decreased by 54.79%, 97.97%, and 85.47% when compared to healthy soil. At the genus level, the differences in bacterial community structure between continuous cropping soil and healthy soil were shown in Figure 9C. In comparison to the bacterial community observed in healthy soil, the relative abundance of beneficial bacteria, namely Luteimonas, Nitrosospira, Pirellula, Terrimonas, Actinomyces, and Steroidobacteria, exhibited a significant decrease in continuous cropping soil. Conversely, numerous unclassified genera, such as Bacteroidota env.OPS17, and unknown genera like AKYG587 and Rokubacteriales in Planctomycetota, experienced a substantial increase.
Principal Coordinate Analysis (PCoA) was employed to investigate dissimilarities in the composition of sample communities. Additionally, hierarchical clustering analysis was conducted to construct a dendrogram (Figure 9D) that visually represents the influence of continuous cropping on the structure of soil bacteria communities. The findings revealed that the distances between all items on the coordinate axis of the continuous cropping soil samples (LZ1861 a-a,b,c) were greater compared to those of the healthy soil samples (XT1861 a-a,b,c), thus indicating that perennial continuous cropping exerted a more substantial impact on the bacterial community structure within the soil. LEfSE analysis was conducted on the sequencing samples, and the communities or species that exhibited noteworthy disparities in the samples were depicted in Figure 9D. The findings indicated that the species belonging to Planctomycetes, Actinobacteria, Bacilli, Chitinophagales, and Cyanobacteria in healthy soil, as well as the species in Phycisphaerae, Patescibacteria, Pedosphaeraceae, and Geosphere bacteria in continuous cropping soil, were the primary contributors to significant variations in community structure.
Changes in the fungal Community Composition
Chao1 index, Richness, Shannon index, and ACE index were conducted to evaluate of fungal abundance and diversity in soil samples. The findings indicated a significant decrease in species abundance and diversity of fungi in soil samples subjected to continuous cropping compared to healthy soil. The sequencing information and α diversity index of the samples were presented in Table S2. The sparse and Shannon diversity curves of continuous cropping soil and healthy soil samples demonstrated that the fungal diversity in the samples was adequately represented at this sequencing depth (Figure 10A),and meeting the necessary prerequisites for subsequent bioinformatics analysis.
The fungal community structure and dominant species of continuous cropping soil and healthy soil were depicted at the phylum level in Figure 10B. Both continuous cropping soil and healthy soil exhibited three main phyla, namely Ascomycota, Basidiomycota, and Chytridiomycota, with Ascomycota being the most abundant phylum in the soil samples. Notably, the relative abundance of Ascomycota significantly declined in continuous cropping soil samples, while the relative abundance of Basidiomycota in soil was significantly greater than that in healthy soil samples. Significant differences in the fungal community composition were observed at the genus taxonomic level between the soil subjected to continuous cropping and the soil classified as healthy (Figure 10C). In comparison to the fungal community found in the healthy soil, the continuous cropping soil exhibited a significant decrease in the relative abundance of beneficial species belonging to Microdochium, Aspergillus, Ceratobasidium, and Torula. Conversely, there was a noteworthy increase in the relative abundance of species affiliated with Ascobolus, Myriococcum, Rhizophlyctis, Lodophhanus, Piskurozyma, and other unnamed genera. The findings indicated that continuous cropping practices had a pronounced influence on the composition and distribution of fungal communities within the soil. Notably, the pathogen responsible for the occurrence of chrysanthemum wilt in the local area was identified as F. solani, which differs from previous reports. Consequently, a detailed analysis of the Fusarium community structure was conducted at the species level, and the corresponding results were presented in Figure 10D. The findings indicated that the practice of continuous cropping resulted in a notable rise in the relative abundance of F. solani, aligning with previous research outcomes. Furthermore, the previously documented pathogen F. oxysporum constituted less than 1% of the Fusarium present in the local soil samples, potentially attributed to variances in geographical conditions.
The examination of the fungal community composition in the samples was conducted through the utilization of PCoA analysis (Figure 10E). The findings of the study indicated that perennial continuous cropping had a substantial impact on the fungal community structure in the soil. To further analyze the sequencing samples, LEfSE analysis was conducted, revealing the fungal species that exhibited significant differences among the samples (Figure 10E). In healthy soils, the community structure displayed notable variations primarily due to the presence of Ascomycota, Sordariomycetes, Dothideomycetes, Xylariales, Microdochium, and Aspergillacea. Conversely, Chytridiomycota, Pezizales, Atheliales, Botryoderma, and Cantharellus were found to be predominant in soils subjected to continuous cropping.
4. Discussion
This study primarily concentrated on the chrysanthemum cultivar “Guangyu,” which had experienced significant susceptibility to wilt disease as a result of prolonged consecutive cultivation. Initially, the research involved the isolation and identification of the Fusarium wilt pathogens, followed by the assessment of their pathogenicity and exploration of the infection pathway. Subsequently, the investigation delved into the physiological and biochemical responses of the infected chrysanthemum. Lastly, the study analyzed the changes in the microbial community composition within the soil subjected to continuous cultivation.
Various pathogens, including F. incarnatum, Dickeya chrysanthemi, Rhizoctonia solani, Erwinia chrysanthemi, and F. oxysporum, have been identified as potential causes of wilt on Chrysanthemum [28]. Through pathogenicity detection and verification, the results in this research demonstrated that F. solani displayed pathogenicity, with pathogenic characteristics consistent with those observed in the natural field. Therefore, it was recognized as the primary pathogen accountable for chrysanthemum wilt in the ‘Guangyu’ cultivar. The strain’s capacity to produce cellulase, β-glucosidase, polygalacturonase, pectin methylgalacturonidase, and xylanase which facilitated fungal penetration of the plant cell wall. Furthermore, it was observed that the infection induced by this pathogen exerted a substantial inhibitory effect on the growth and metabolic activities of the afflicted plants. Soluble proteins and sugars had proven to be valuable indicators for evaluating the physiological metabolism of plant cells. The presence of pathogen infection could trigger the defense response in plants, resulting in the production of pathogenesis-related proteins. Sugars played a crucial role in the material and energy metabolism of plants, as an increase in soluble sugar levels facilitated the maintenance of cell osmotic pressure, augmentation of metabolic capabilities, and adaptation to stressful conditions. The findings of this study indicated that the infection of chrysanthemum by F.solani resulted in a significant increase in the levels of soluble protein and soluble sugar in the leaves, which could play a crucial role in preserving the integrity of the plant cell membrane structure and enhancing the plant’s resistance against diseases. However, as the invasion prolonged, the plant’s autoimmune response became insufficient to counteract the pathogens, leading to a decline in its physiological indices and eventual death.
Pathogen-induced infection in plants could result in the occurrence of oxidative outbreak, characterized by the rapid and instantaneous generation of reactive oxygen species (ROS) [29]. The excessive accumulation of ROS triggered an oxidative stress response in plants, leading to detrimental effects on nucleic acids, proteins, lipids, and other macromolecules, ultimately disrupting cellular function [30]. To counteract the oxidative damage caused by the excessive ROS accumulation, plants had developed various coping mechanisms. An effective approach to detoxification involved enhancing the activity of antioxidant enzymes in order to safeguard plants [31]. Within plants, the key antioxidant enzymes including SOD, CAT, POD, which served as a strategy to combat pathogen invasion [32]. SOD, functioning as the primary defense against oxidation, was a vital protective enzyme in plant tissues, primarily engaged in oxygen metabolism and contributing significantly to the investigation of plant disease resistance mechanisms [33]. Previous research had demonstrated that disease-resistant varieties exhibited significantly higher SOD activity compared to susceptible varieties following infection by F. trichothecioide [34]. CAT, an essential protective enzyme in plant tissues, played a crucial role in breaking down the accumulated H2O2 resulting from plant metabolism, thereby reducing oxidative damage to cells. POD, apart from its role as a prominent component of the antioxidant enzyme system, it also played a crucial role in facilitating the synthesis of lignin, thereby promoting the process of lignification in affected tissues. Additionally, it acted as a catalyst for the production of phenols that possessed toxicity towards pathogens, effectively inhibiting their proliferation and expansion within the host organism. The antioxidant enzymes in plants consistently maintained a dynamic equilibrium with ROS, thereby regulating cellular levels of free radicals to a normal range. In this study, the activities of CAT and POD in the early stage of infection showed an upward trend, while the contents of ROS and free radicals did not change significantly, indicating that the outbreak of ROS activated the antioxidant system response in plants. With the prolonged duration of infection, the activities of CAT and POD exhibited a decline, while the concentration of H2O2 showed an accumulation, and the levels of MDA significantly increased. These observations indicated a substantial accumulation of ROS within plants, intensifying peroxidation and exacerbating cellular damage. This accumulation surpassed the regulatory limits of plant autoimmunity, leading to metabolic disturbances and disruption of normal physiological structure and function. Consequently, this process accelerates the senescence and demise of plant leaves.
During the course of pathogen infection, plants could also augment the activity of defense enzymes to mitigatie the accumulation of detrimental substances and bolstered own resistance [35]. Notably, defense enzymes such as PAL, PPO and CHI [36], were instrumental in the synthesis of lignin and phenolic compounds, which served as barriers against pathogen invasion and mitigated the toxic substances [37,38]. Additionally, these enzymes could directly contribute to enhance disease resistance by generating quinone substances that impeded the growth and expansion of fungal hyphae. PAL was a crucial enzyme in the phenylpropane metabolic pathway in plants, and its activity served as a dependable indicator for evaluating the disease resistance of host plants. PPO could reinforced plant disease resistance through its involvement in the synthesis of lignin precursors and the oxidation of phenolic substances in plants. CHI encoded a protein associated with disease progression, capable of degrading the cell wall of pathogen and playing a significant role in plant defense mechanisms. During the initial phases of the disease, plants exhibited an augmented resistance mechanism through the reinforcement of enzymatic activity of PAL, PPO and CHI to combat the pathogenic agents. Nevertheless, as the disease progressed, the continuous accumulation of toxins in plants became relentless. Consequently, the innate resistance of the plants proved inadequate to counterbalance the hazardous substances imposed by the pathogen, ultimately resulting in the withering and demise of the plants.
The phytohormones salicylic acid (SA) and jasmonic acid (JA) were significant mediators of plant immunity against pathogens, with SA and JA signaling playing crucial roles in defending against both biotrophic and necrotrophic pathogens [39]. Recent investigations had shed light on the pivotal function of SA in impeding biotrophic infections, as they have unraveled the biosynthesis and signaling pathways linked to the modification of pathogen susceptibility [40]. The results of our study suggested that pathogen infection may trigger the activation of the SA defense pathway. However, additional research was needed to determine the extent of the involvement of the JA pathway in the defense response against Fusarium wilt in chrysanthemum.
The soil environment was a multifaceted ecosystem, wherein the composition, diversity, and function of the soil microbial community were influenced by various factors such as climate, cultivation techniques, soil nutrient levels, introduction of foreign pathogens, and agricultural management practices. The soil microbial community played a crucial role in suppressing soil-borne diseases through mechanisms such as promoting the synthesis of plant hormones, competing with soil-borne pathogens for essential nutrients, engaging in direct competition with plants, or activating immune responses regulated by microorganisms. Consequently, the rhizosphere was widely recognized as the primary barrier against soil-borne pathogens. Furthermore, plants had the ability to develop defense mechanisms against soil-borne pathogens through the targeted stimulation of antagonistic microorganisms, resulting in a significant increase in the abundance of these antagonistic microorganisms. In this study, the prolonged cultivation of chrysanthemum over numerous years led to the microbial community structure towards an unfavorable environment for plant growth. Significant decrease was observed in the populations of beneficial bacteria,specifically Nitrosospira and Pirellula, as well as in the proportion of antagonistic microorganisms, such as Actinbacteria and Aspergillus. Conversely, a noteworthy increase was observed in the proportion of pathogen and saprophytic fungi, including species in Myriococcum, Rhizophlyctis, and Ascobolus. Moreover, a significant rise in the occurrence of F. solani, the causative agent of localized chrysanthemum wilt disease, was observed, surpassing a prevalence of 60%. Consequently, the soil microbial community underwent a gradual modification, adversely affecting plant growth and resulting in the emergence of soil-borne Fusarium wilt among the native chrysanthemum population. However, the specific molecular mechanisms governing the interaction between F. solani and chrysanthemum remain unexplored. Therefore, it is imperative to conduct further investigation on the interplay between pathogen and host, as it will augment our understanding of the fundamental molecular mechanisms implicated in pathogen infiltration.
Supplementary Materials
The following supporting information can be downloaded at the website of this paper posted on Preprints.org.
Author Contributions
LL, YQJ and MMC performed the experiments and wrote the main text of the manuscript. HJL,YYL and QXY analyzed the data. HLW designed and directed the experiments. All authors have read and approved the manuscript.
Funding
This work was supported by the Science and Technology Research and Development Plan Joint Fund of Henan Province (222301420115), the National Science Foundation of China (31700435), and Key scientific research of colleges and universities in Henan Province (22A180019).
Institutional Review Board Statement
Not applicable.
Informed Consent Statement
Not applicable.
Data Availability Statement
The datasets generated for this study can be found in the NCBI BioProject databases with accession code PRJNA865142
Conflicts of Interest
The authors declare that they have no known competing financial interests or personal relationships that could have appeared to influence the work reported in this paper.
References
- Shibata, M. Importance of genetic transformation in ornamental plant breeding. Plant Biotechnol. 2008, 25, 3–8. [Google Scholar] [CrossRef]
- Li, P.; Chen, J.C.; Li, Y.; Zhang, K.; Wang, H.L. Possible mechanisms of control of Fusarium wilt of cut chrysanthemum by Phanerochaete chrysosporium in continuous cropping fields: A case study. Sci Rep. 2017, 7, 15994. [Google Scholar] [CrossRef] [PubMed]
- Song, A.P.; Zhao, S.; Chen, S.S.; Jiang, J.F.; Chen, S.M.; Li, H.Y.; Chen, Y.; Chen, X.; Fang, W.M.; Chen, F.D. The abundance and diversity of soil fungi in continuously monocropped chrysanthemum. Sci. World J. 2013, 2013, 632920. [Google Scholar] [CrossRef] [PubMed]
- Kerry, B.R. Rhizosphere interactions and the exploitation of microbial agents for the biological control of plant-pathogenic fungi. Ann. Rev. Phytopahtol. 2000, 38, 423–441. [Google Scholar] [CrossRef] [PubMed]
- Berendsen, R.L.; Pieterse, C.M.J.; Bakker, P.A.H.M. The rhizosphere microbiome and plant health. Trends Plant Sci. 2012, 17, 478–486. [Google Scholar] [CrossRef] [PubMed]
- Philippot, L.; Raaijmakers, J.M.; Lemanceau, P.; van der Putten, W.H. Going back to the roots: the microbial ecology of the rhizosphere. Nat. Rev. Microbiol. 2013, 11, 789–799. [Google Scholar] [CrossRef] [PubMed]
- Chen, H.; Hao, H.R.; Xiong, J.; Qi, X.H.; Zhang CY, Lin WX. Effects of successive cropping Rehmannia glutinosa on rhizosphere soil microbial flora and Enzyme activities. Chinese J. Appl. Ecol. 2007, 18, 2755–2759. [Google Scholar]
- Li, X.; Chen, D.; Carrión, V.J.; Revillini, D.; Yin, S.; Dong, Y.; Zhang, T.; Wang, X.; Delgado-Baquerizo, M. Acidification suppresses the natural capacity of soil microbiome to fight pathogenic Fusarium infections. Nat. Commun. 2023, 14, 5090. [Google Scholar] [CrossRef] [PubMed]
- Edel-Hermann, V.; Lecomte, C. Current Status of Fusarium oxysporum Formae Speciales and Races. Phytopathology 2019, 109, 512–530. [Google Scholar] [CrossRef] [PubMed]
- Farr, D.F.; Rossman, A.Y. Fungal Databases, Systematic Mycology& Microbiology Laboratory, ARS, USDA,USA. (http://nt.ars-grin.gov/fungaldatabases/).
- Mun, H.Y.; Jeong, J.Y.; Kim, C.J.; Lee, H.B. First report of chrysanthemum (chrysanthemum morifolium) crown rot caused by Fusarium solani in Korea. Plant Pathol. J. 2012, 28, 49–54. [Google Scholar] [CrossRef]
- Mosher, J.J.; Bowman, B.; Bernberg, E.L.; Shevchenko, O.; Kan, J.; Korlach, J.; Kaplan, L.A. Improved performance of the PacBio SMRT technology for 16S rDNA sequencing. J. Microbiol. Meth. 2014, 104, 59–60. [Google Scholar] [CrossRef] [PubMed]
- Pootakham, W.; Mhuantong, W.; Yoocha, T.; Sangsrakru, D.; Kongkachana, W.; Sonthirod, C.; Naktang, C.; Jomchai, N.; U-Thoomporn, S.; Yeemin, T.; Pengsakun, S.; Sutthacheep, M.; Tangphatsornruang, S. Taxonomic profiling of Symbiodiniaceae and bacterial communities associated with Indo-Pacific corals in the gulf of Thailand using PacBio sequencing of full-length ITS and 16S rRNA genes. Genomics 2021, 113, 2717–2729. [Google Scholar] [CrossRef] [PubMed]
- Romero, A.; Carrion, G.; Rico-Gray, V. Fungal latent pathogens and endophytes from leaves of Parthenium hysterophorus (Asteraceae). Fungal Divers. 2001, 7, 81–87. [Google Scholar]
- Al-Sadi, A.M.; Al-Masoodi, R.S.; Al-Ismaili, M.; Al-Mahmooli, I.H. Population Structure and Development of Resistance to Hymexazol Among Fusarium solani Populations from Date Palm, Citrus and Cucumber. J. Phytopathol. 2015, 163, 947–955. [Google Scholar] [CrossRef]
- White, T.J.; Bruns, T.; Lee, S.; Taylor, J.W. Amplification and direct sequencing of fungal ribosomal RNA genes for phylogenetics. In PCR Protocols: A Guide to Methods and Applications; Innis, M.A., Gelfand, D.H., Sninsky, J.J., White, T.J., Eds.; Academic Press: San Diego, CA, USA, 1990; pp. 315–322. [Google Scholar]
- Thompson, J.D.; Gigson, T.J.; Plewniak, F.; Jeanmougin, F.; Higgins, D.G. The Clustal X windows interface: flexible strategies for multiple sequence alignment aided by qualityanalysis tools. Nucleic Acids Res. 1997, 25, 4876–4882. [Google Scholar] [CrossRef] [PubMed]
- Tamura, K.; Dudley, J.; Nei, M.; Kumar, S. MEGA4:Molecular Evolutionary Genetics Analysis (MEGA) software version 4.0. Mol. Biol. Evol. 2007, 24, 1596–1599. [Google Scholar] [CrossRef] [PubMed]
- Getha, K.; Vikineswary, S.; Wong, W.H.; Seki, T.; Ward, A.; Goodfellow, M. Evaluation of Streptomyces sp. strain g10 for suppression of Fusarium wilt and rhizosphere colonization in pot-grown banana plantlets. J. Ind. Microbiol. Biotechnol. 2005, 32, 24–32. [Google Scholar] [CrossRef]
- Alkher, H.; El-Hadrami, A.; Rashid, K.Y.; Adam, L. R.; Daayf, F. Cross-pathogenicity of Verticillium dahliae between potato and sunflower. Eur. J. Plant Pathlo. 2009, 3, 505–519. [Google Scholar] [CrossRef]
- Boamah, S.; Zhang, S.W.; Xu, B.L.; Li, T.; Calderón-Urrea, A. Trichoderma longibrachiatum (TG1) Enhances Wheat Seedlings Tolerance to Salt Stress and Resistance to Fusarium pseudograminearum. Front. Plant Sci. 2021, 12, 741231. [Google Scholar] [CrossRef]
- Mitic, M.; Berry, D.; Brasell, E.; Green, K.; Young, C.A.; Saikia, S.; Rakonjac, J.; Scott, B. Disruption of calcineurin catalytic subunit (cnaA) in Epichloë festucae induces symbiotic defects and intrahyphal hyphae formation. Mol. Plant. Pathol. 2018, 19, 1414–1426. [Google Scholar] [CrossRef]
- Helal, G.A.; Khalil, R.R.; Galal, Y.G.; Soliman, S.M.; Abd Elkader, RS. Studies on cellulases of some cellulose-degrading soil fungi. Arch. Microbiol. 2021, 204, 65. [Google Scholar] [CrossRef] [PubMed]
- Pocock, T.; Król, M.; Huner, N.P. The determination and quantification of photosynthetic pigments by reverse phase high-performance liquid chromatography, thin-layer chromatography, and spectrophotometry. Methods Mol. Biol. 2004, 274, 137–148. [Google Scholar] [PubMed]
- Chang, D.; Liu, H.; An, M.; Hong, D.; Fan, H.; Wang, K.; Li, Z. Integrated Transcriptomic and Metabolomic Analysis of the Mechanism of Foliar Application of Hormone-Type Growth Regulator in the Improvement of Grape (Vitis vinifera L.) Coloration in Saline-Alkaline Soil. Plants (Basel). 2022, 11, 2115. [Google Scholar] [CrossRef] [PubMed]
- Vieira, E.G.; Henriques, S.B. Comparison of the Lowry and Coomassie Blue methods for the determination of protein concentration. Braz. J. Med. Biol. Res. 1992, 25, 583–591. [Google Scholar] [PubMed]
- Schwerbel, K.; Tüngerthal, M.; Nagl, B.; Niemann, B.; Drößer, C.; Bergelt, S.; Uhlig, K.; Höpfner, T.; Greiner, M.; Lindtner, O.; Sarvan, I. Results of the BfR MEAL Study: The food type has a stronger impact on calcium, potassium and phosphorus levels than factors such as seasonality, regionality and type of production. Food Chem. X. 2022, 13, 100221. [Google Scholar] [CrossRef] [PubMed]
- Miao, W.H.; Yang, Y.R.; Wu, M.T.; Huang, G.; Ge, L.J.; Liu, Y.; Guan, Z.Y.; Chen, S.M.; Fang, W.M.; Chen, F.D.; Zhao, S. Potential pathways and genes expressed in Chrysanthemum in response to early fusarium oxysporum infection. BMC Plant Biol. 2023, 23, 312. [Google Scholar] [CrossRef] [PubMed]
- Sewelam, N.; Kazan, K.; Schenk, P.M. Global plant stress signaling: reactive oxygen species at the cross-road. Front. Plant Sci. 2016, 23, 187. [Google Scholar] [CrossRef] [PubMed]
- Van Breusegem, F.; Dat, J.F. Reactive oxygen species in plant cell death. Plant Physiol. 2006, 141, 384–390. [Google Scholar] [CrossRef] [PubMed]
- Foyer, C.H.; Noctor, G. Redox regulation in photosynthetic organisms: signaling, acclimation, and practical implications. Antioxid. Redox. Sign. 2009, 11, 861–905. [Google Scholar] [CrossRef]
- Fareed, G.; Atiq, M.; Abbas, M.; Usman, M.; Qamar, S.H. Varietal reaction of Cucumber (Cucumis sativus L.) germplasm for management of Fusarium wilt of cucumber (FWC). Adv. Zool. Bot. 2017, 5, 1–3. [Google Scholar] [CrossRef]
- Małolepsza, U.; Nawrocka, J.; Szczech, M. Trichoderma virens 106 inoculation stimulates defence enzyme activities and enhances phenolic levels in tomato plants leading to lowered Rhizoctonia solani infection. Biocontrol Sci. Techn. 2017, 27, 180–199. [Google Scholar] [CrossRef]
- Chen, F.; Wang, M.; Zheng, Y.; Luo, J.M.; Yang, X.R.; Wang, X.L. Quantitative changes of plant defense enzymes and phytohormone in biocontrol of cucumber Fusarium wilt by Bacillus subtilis B579. World J. Microb. Biot. 2010, 26, 675–684. [Google Scholar] [CrossRef]
- Anothai, J.; Chairin, T. Soil physicochemical properties closely associated with fungal enzymes and plant defense enzymes in ganoderma-infected oil palm orchards. Plant Soil 2020, 456, 99–112. [Google Scholar] [CrossRef]
- Sasaki, C.; Yokoyama, A.; Itoh, Y.; Hashimoto, M.; Watanabe, T.; Fukamizo, T. Comparative study of the reaction mechanism of eamily 18 chitinases from plants and microbes. J. Biochem. 2002, 131, 557–564. [Google Scholar] [CrossRef]
- Anand, T.; Chandrasekaran, A.; Kuttalam, S.; Raguchander, T.; Prakasam, V.; Samiyappan, R. Association of some plant defense enzyme activities with systemic resistance to early leaf blight and leaf spot induced in tomato plants by azoxystrobin and Pseudomonas fluorescens. J. Plant Interact. 2007, 2, 233–244. [Google Scholar] [CrossRef]
- Chen, W.; He, J.; Wang, B.; Wang, X.J.; Luo, T.Z.; Liu, J.J. Effect of potato glycoalkaloids on induced resistance of Fusarium fruit rot on Lycium barbarum and activities of related defense enzymes. J. Plant Prot. 2018, 45, 1129–1136. [Google Scholar]
- Hou, S.; Tsuda, K. Salicylic acid and jasmonic acid crosstalk in plant immunity. Essays Biochem. 2022, 66, 647–656. [Google Scholar]
- Li, N.; Han, X.; Feng, D.; Yuan, D.; Huang, L.J. Signaling Crosstalk between Salicylic Acid and Ethylene/Jasmonate in Plant Defense: Do We Understand What They Are Whispering? Int. J. Mol. Sci. 2019, 20, 671. [Google Scholar] [CrossRef]
Figure 1.
Chrysanthemum disease symptoms investigated in the field. (A) The Fusarium wilt field, (B) The diseased plants. (C) The statistical analysis of plant height and leaf width of both Fusarium wilt and healthy plants.
Figure 1.
Chrysanthemum disease symptoms investigated in the field. (A) The Fusarium wilt field, (B) The diseased plants. (C) The statistical analysis of plant height and leaf width of both Fusarium wilt and healthy plants.
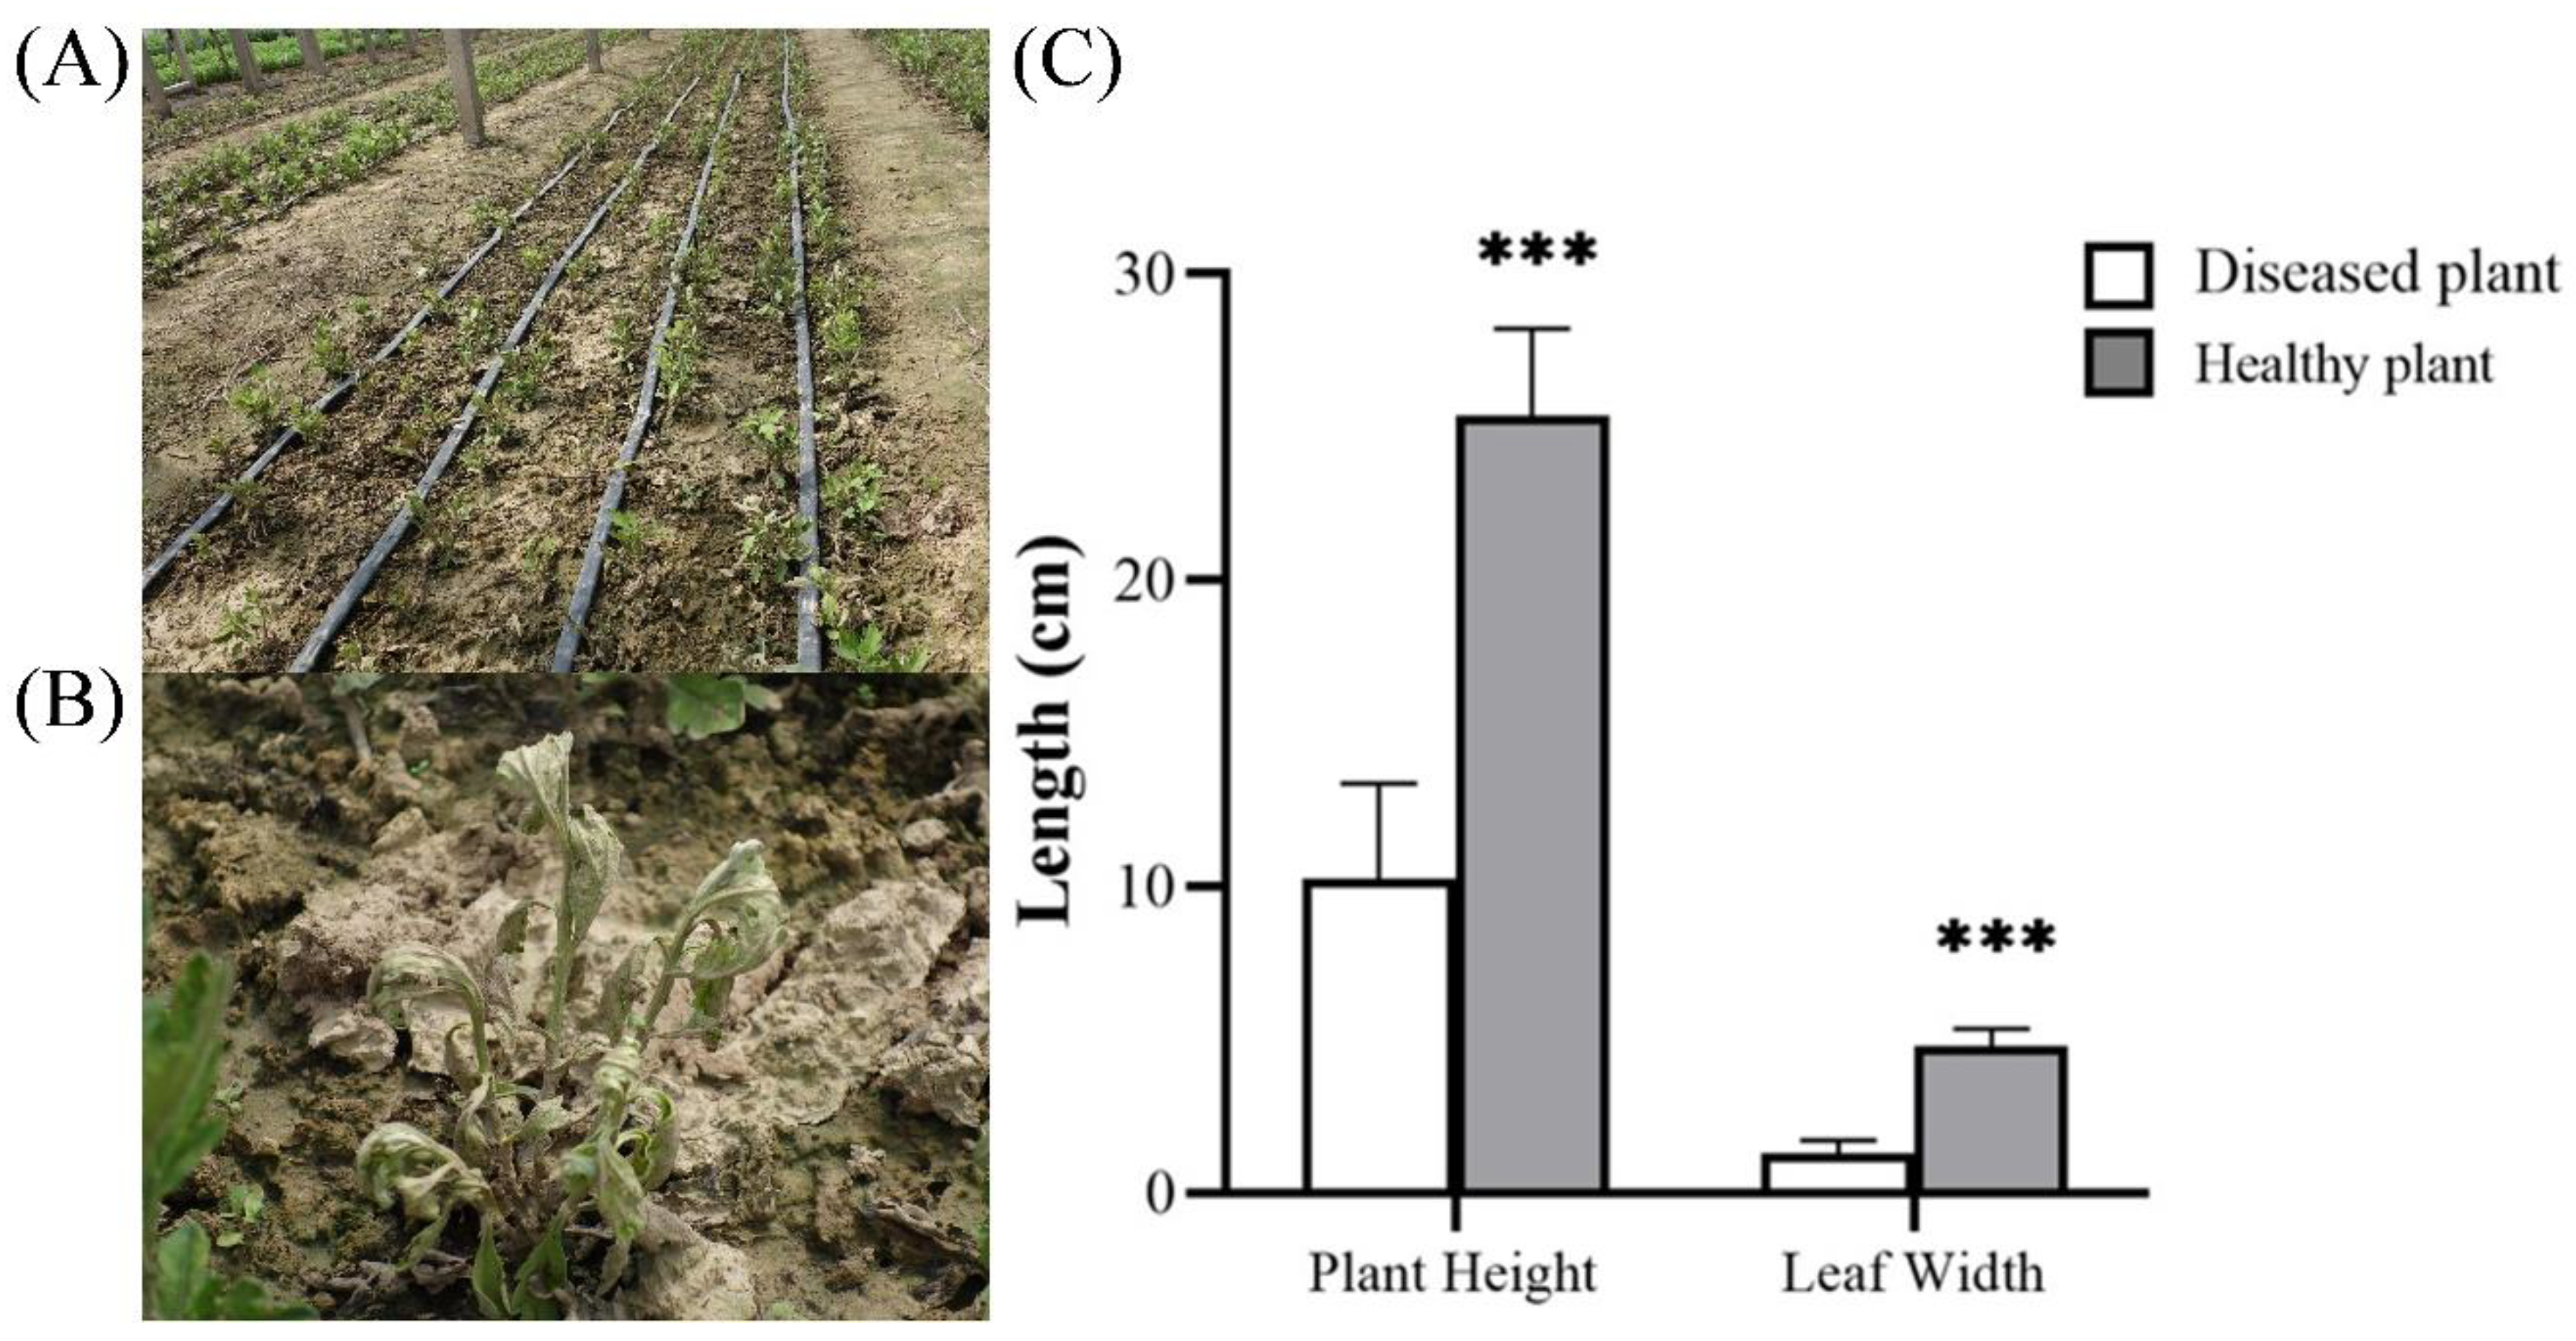
Figure 2.
Morphological characteristics of Fusarium strains and identification. (A-D) The colony and light microscope images of the type A strain at a magnification of 400×. (E-H) The colony and light microscope images of the type B strain at a magnification of 400×. (I) A neighbour-joining tree was constructed based on ITS sequences of strain F. oxysporum (Fo) and F. solani (Fs).
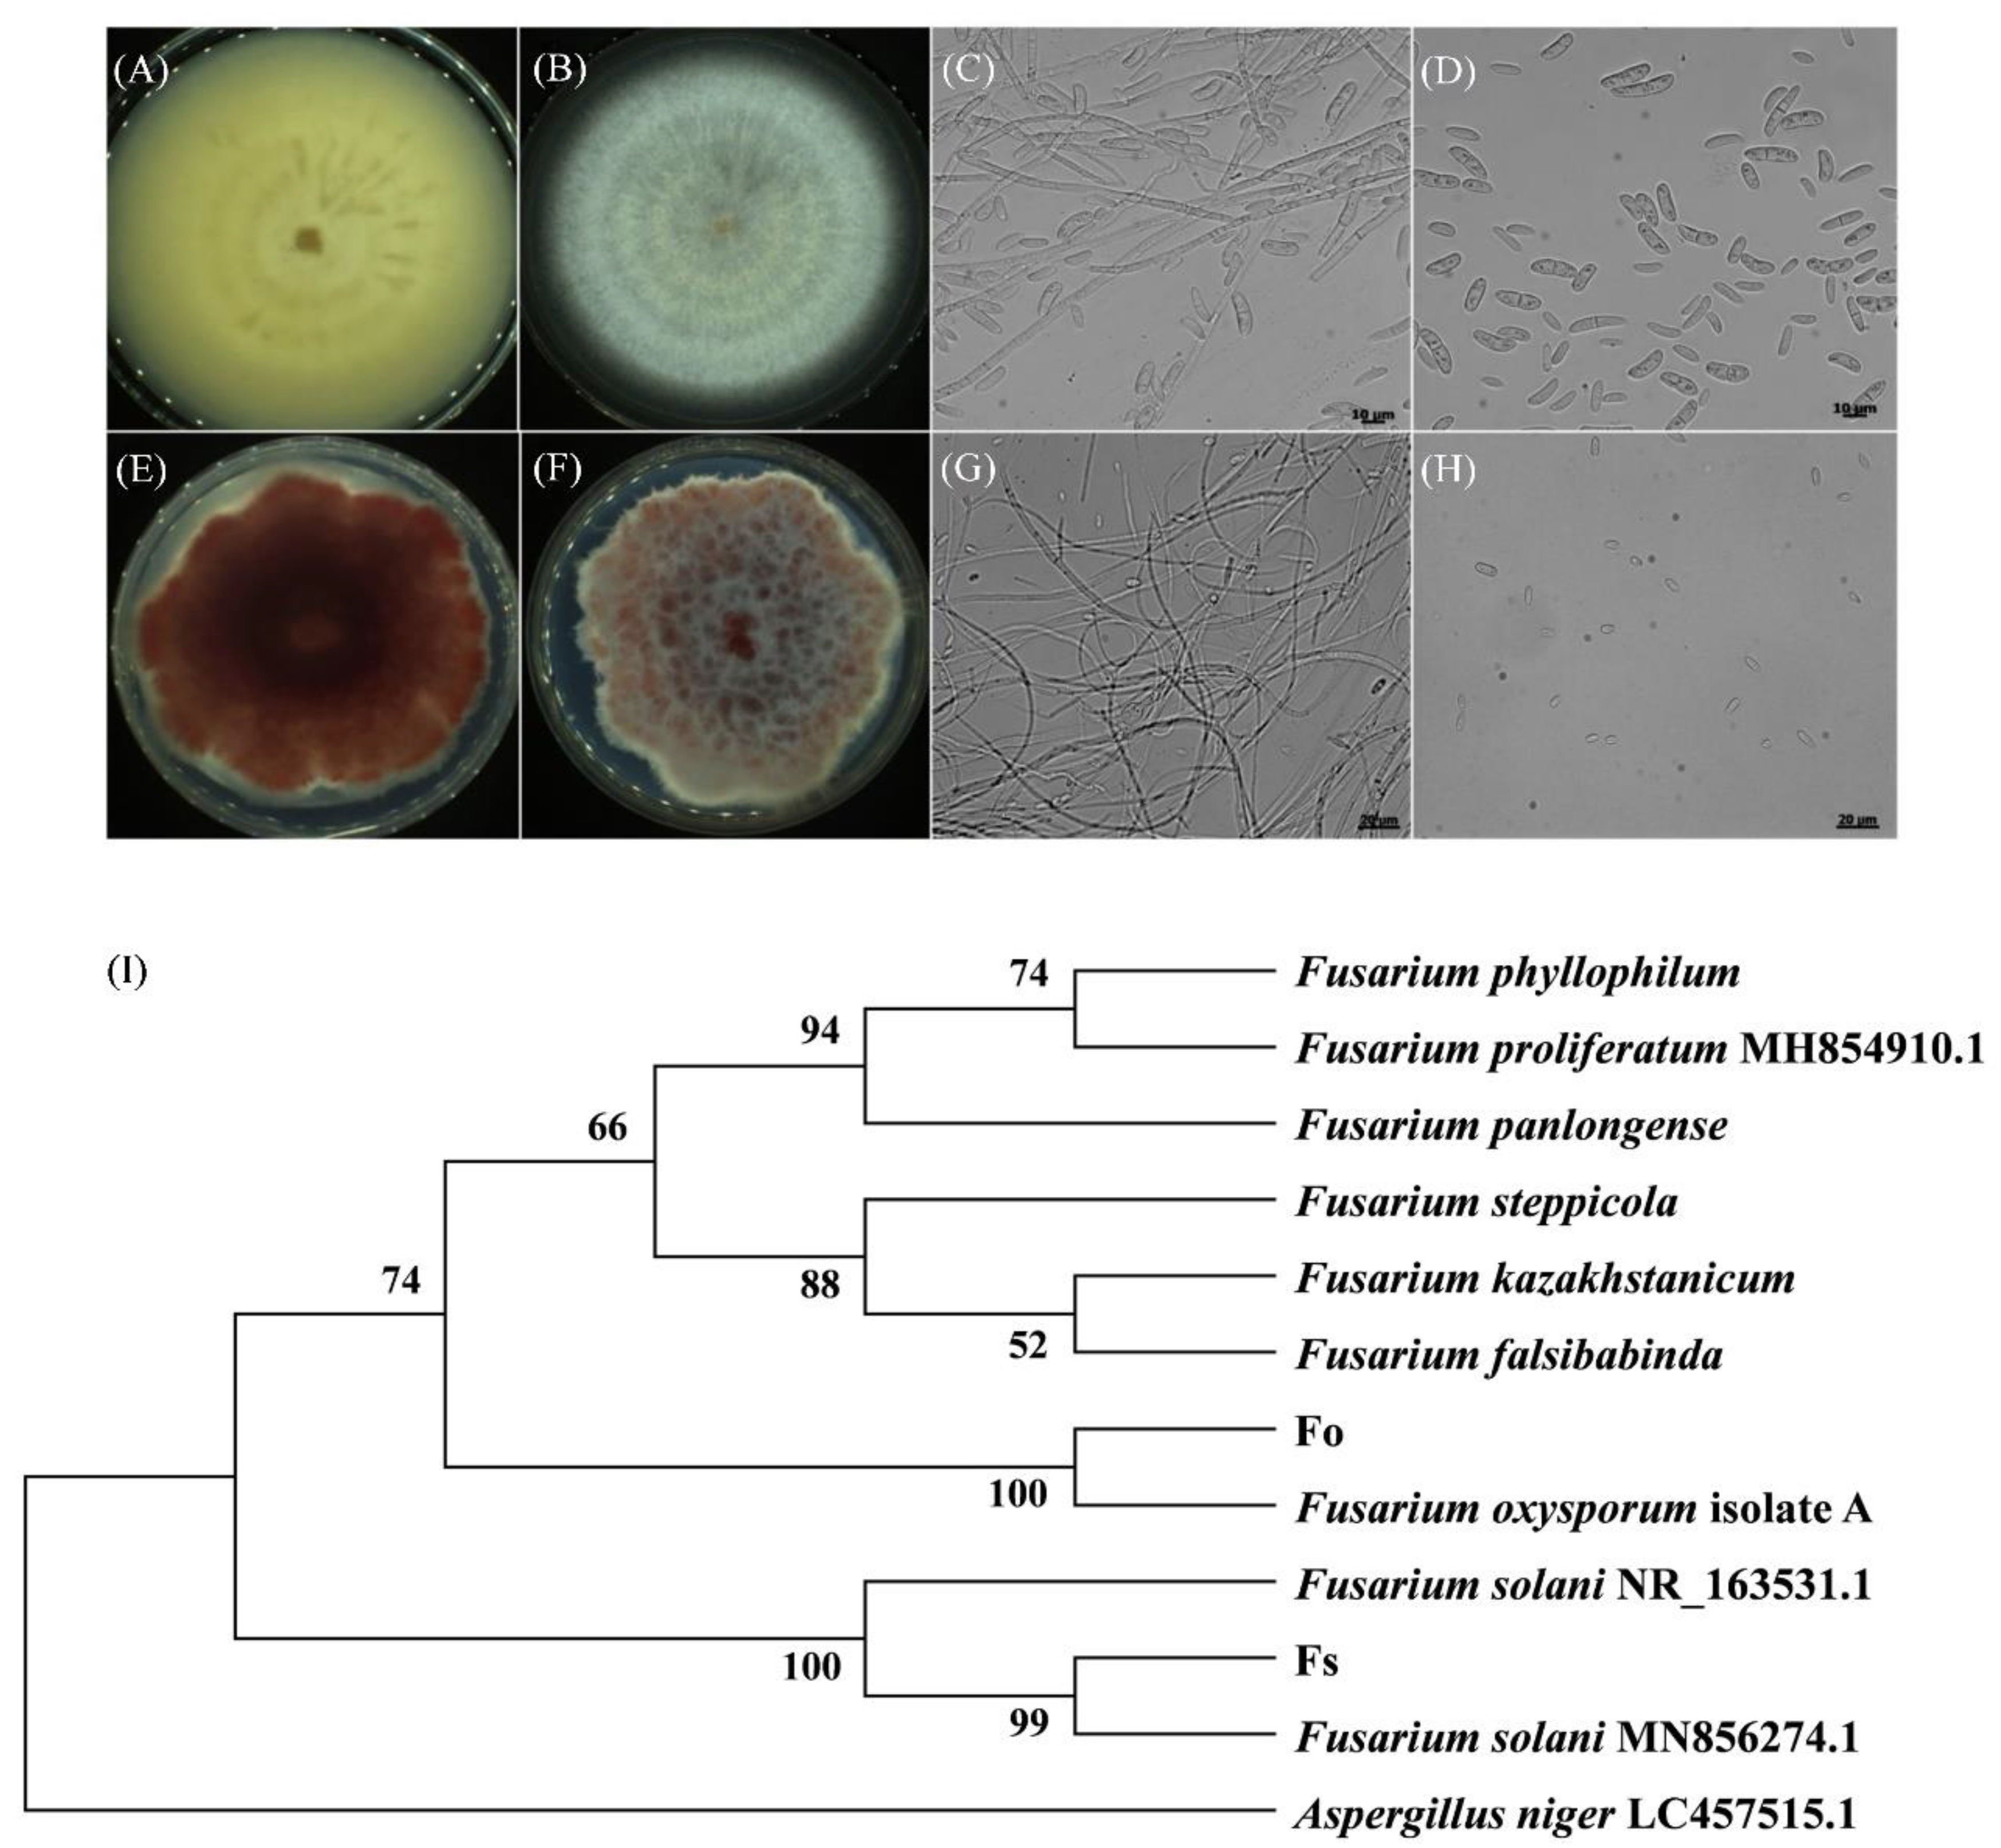
Figure 3.
The pathogenicity test of Fo and Fs. (A-C) Symptoms of of each treatment group at 0 dpi. (D-F) Symptoms of each treatment group at 30 dpi.
Figure 3.
The pathogenicity test of Fo and Fs. (A-C) Symptoms of of each treatment group at 0 dpi. (D-F) Symptoms of each treatment group at 30 dpi.
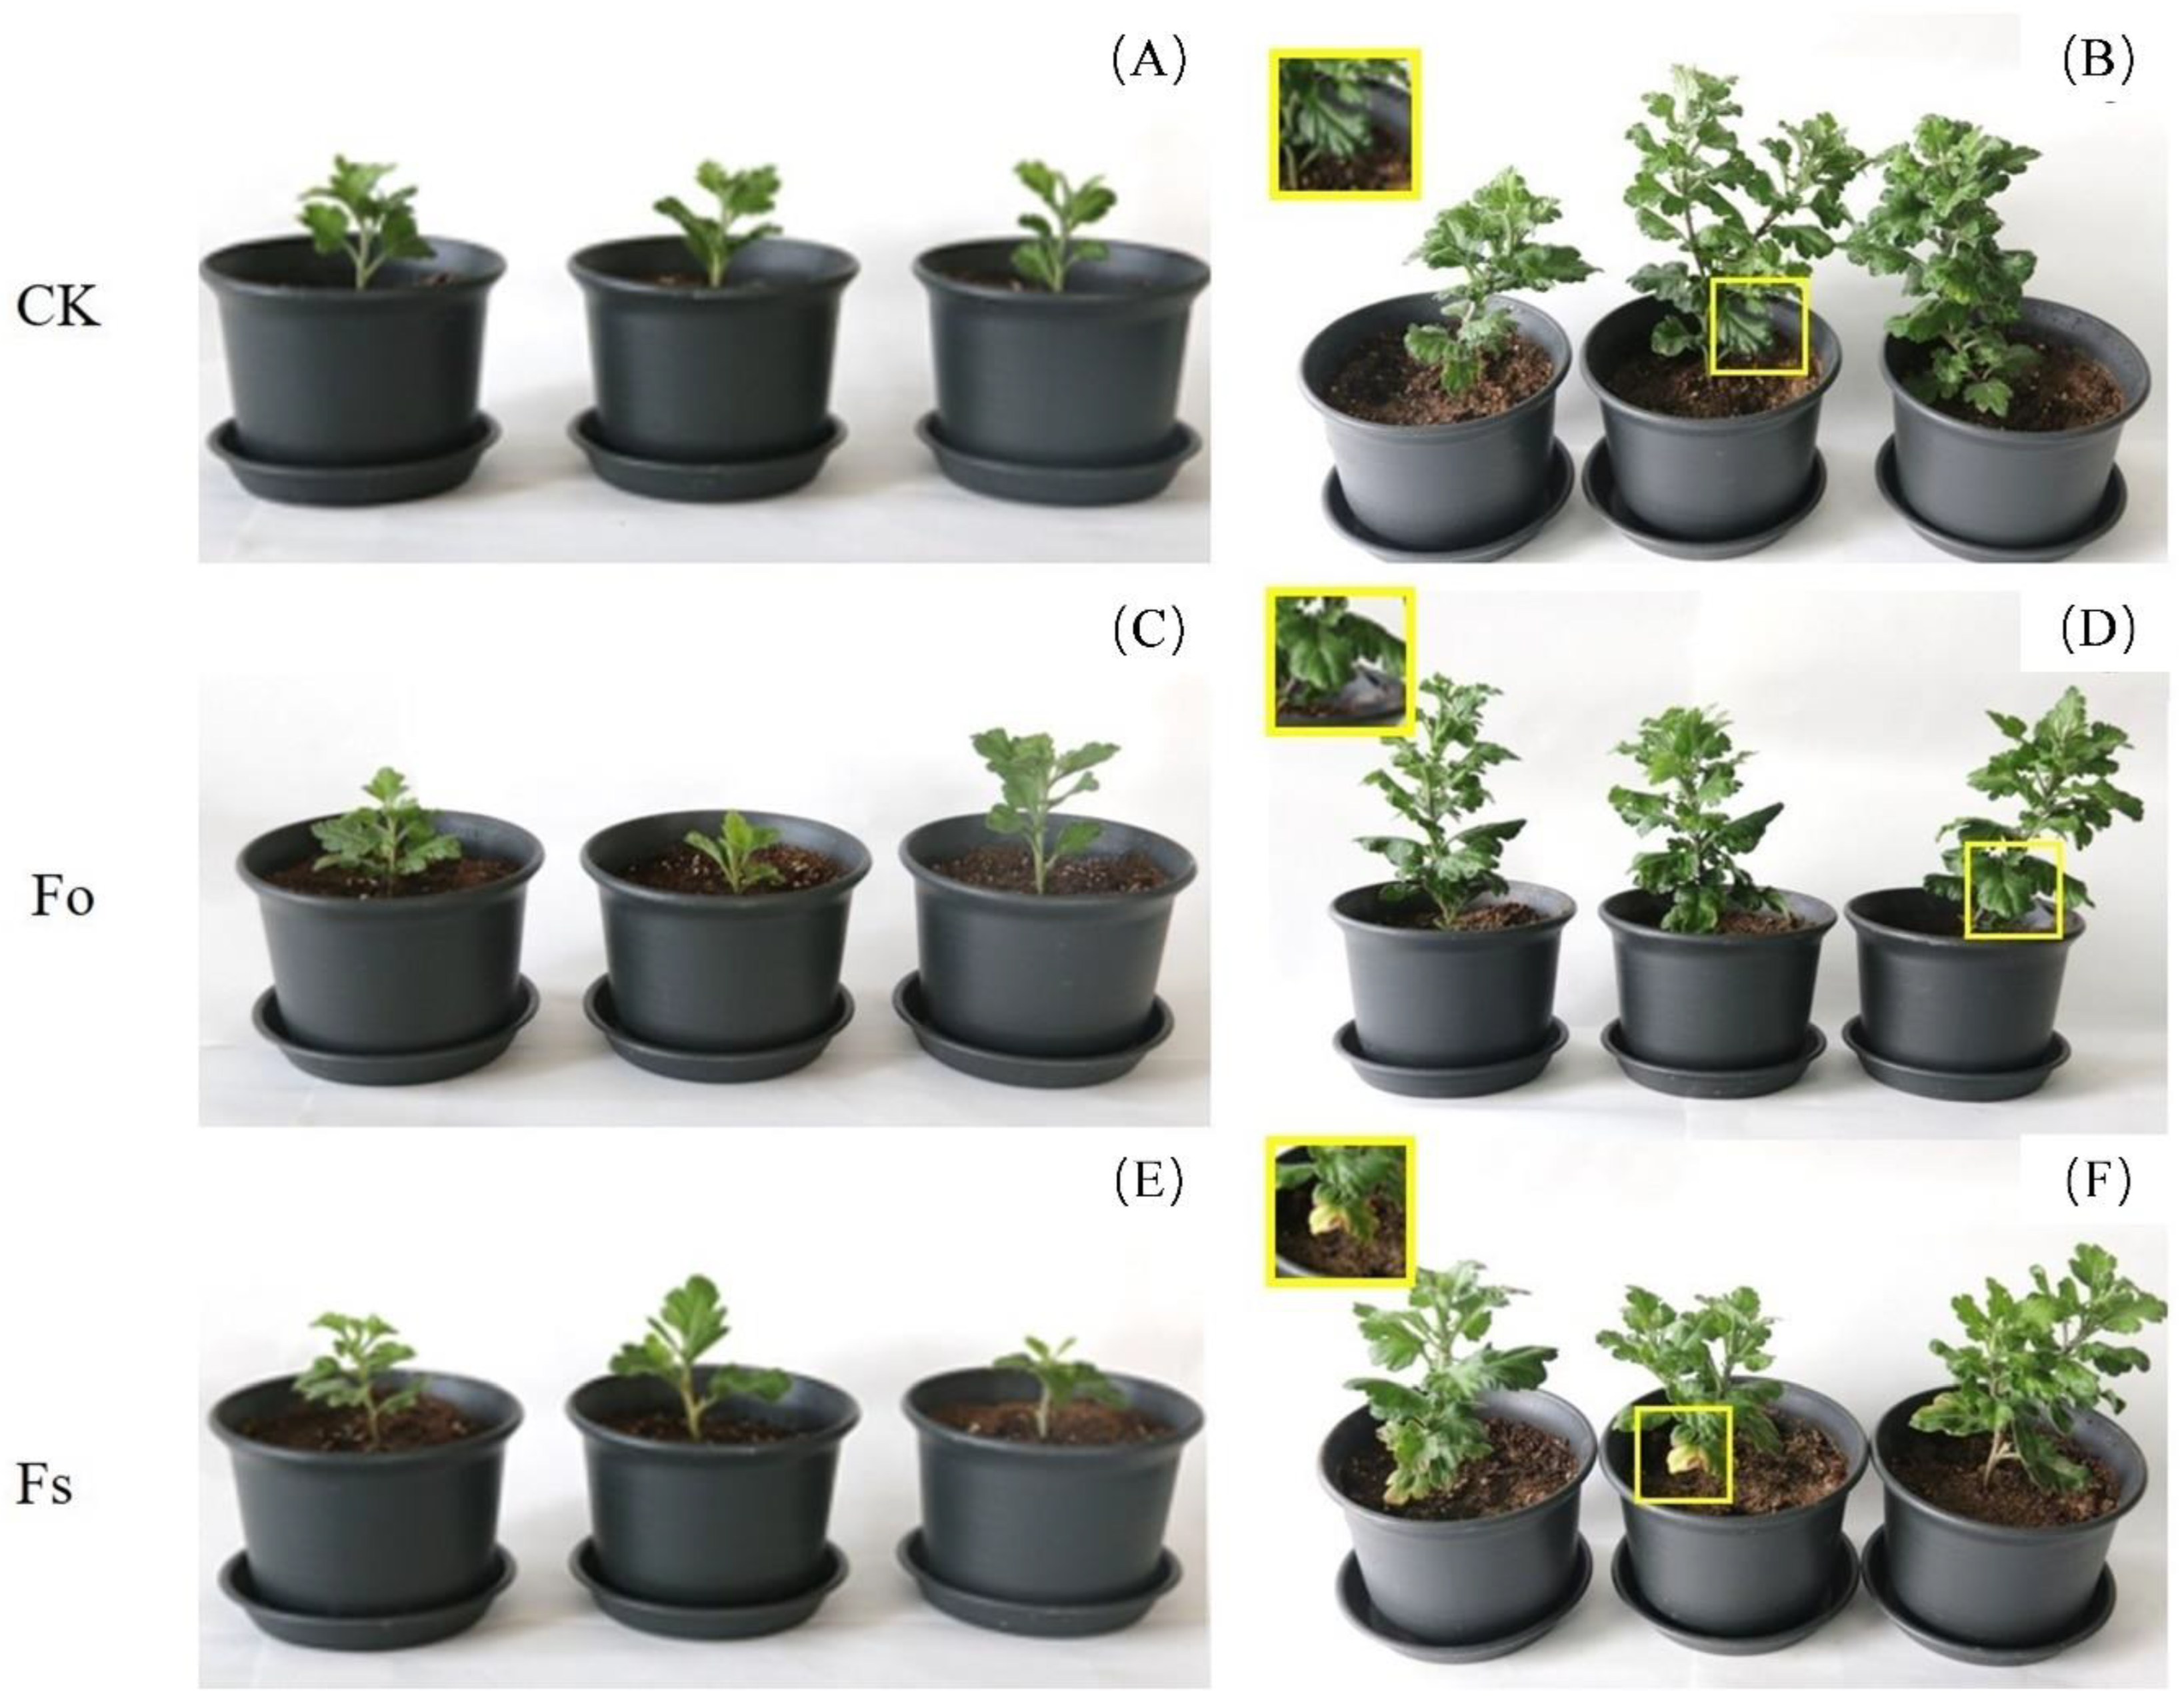
Figure 4.
The activity of cell wall degrading enzymes produced by F. solani. Cellulase (CX), β-glucosidase (βG), Pectin methylgalactuionase (PMG), polygalacturonase (PG).
Figure 4.
The activity of cell wall degrading enzymes produced by F. solani. Cellulase (CX), β-glucosidase (βG), Pectin methylgalactuionase (PMG), polygalacturonase (PG).
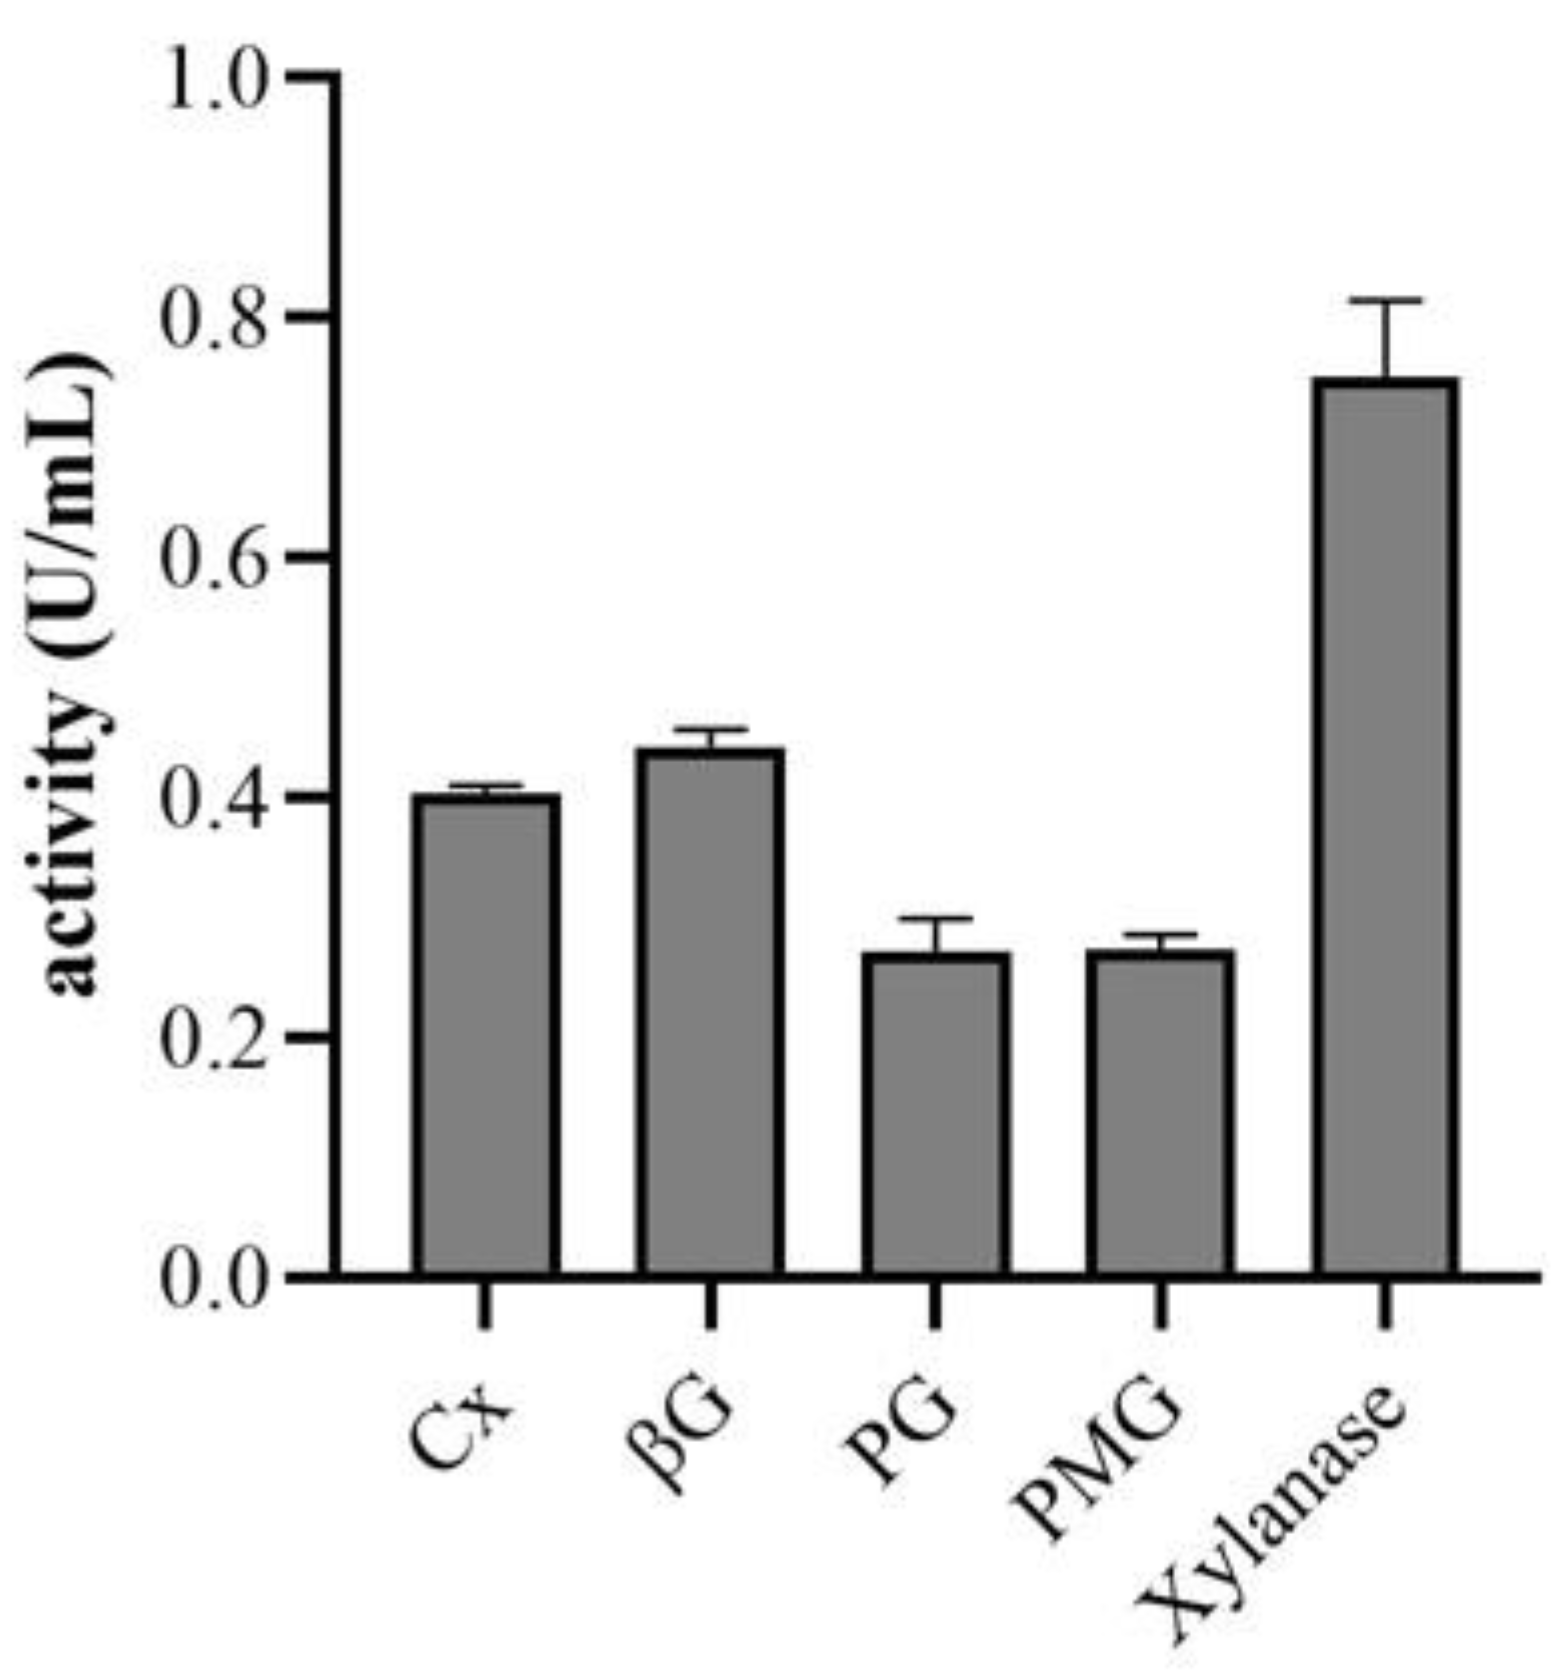
Figure 5.
The pathogenic process of chrysanthemum following infection by F. solani. Control group (CK); Treatment group (Fs).
Figure 5.
The pathogenic process of chrysanthemum following infection by F. solani. Control group (CK); Treatment group (Fs).
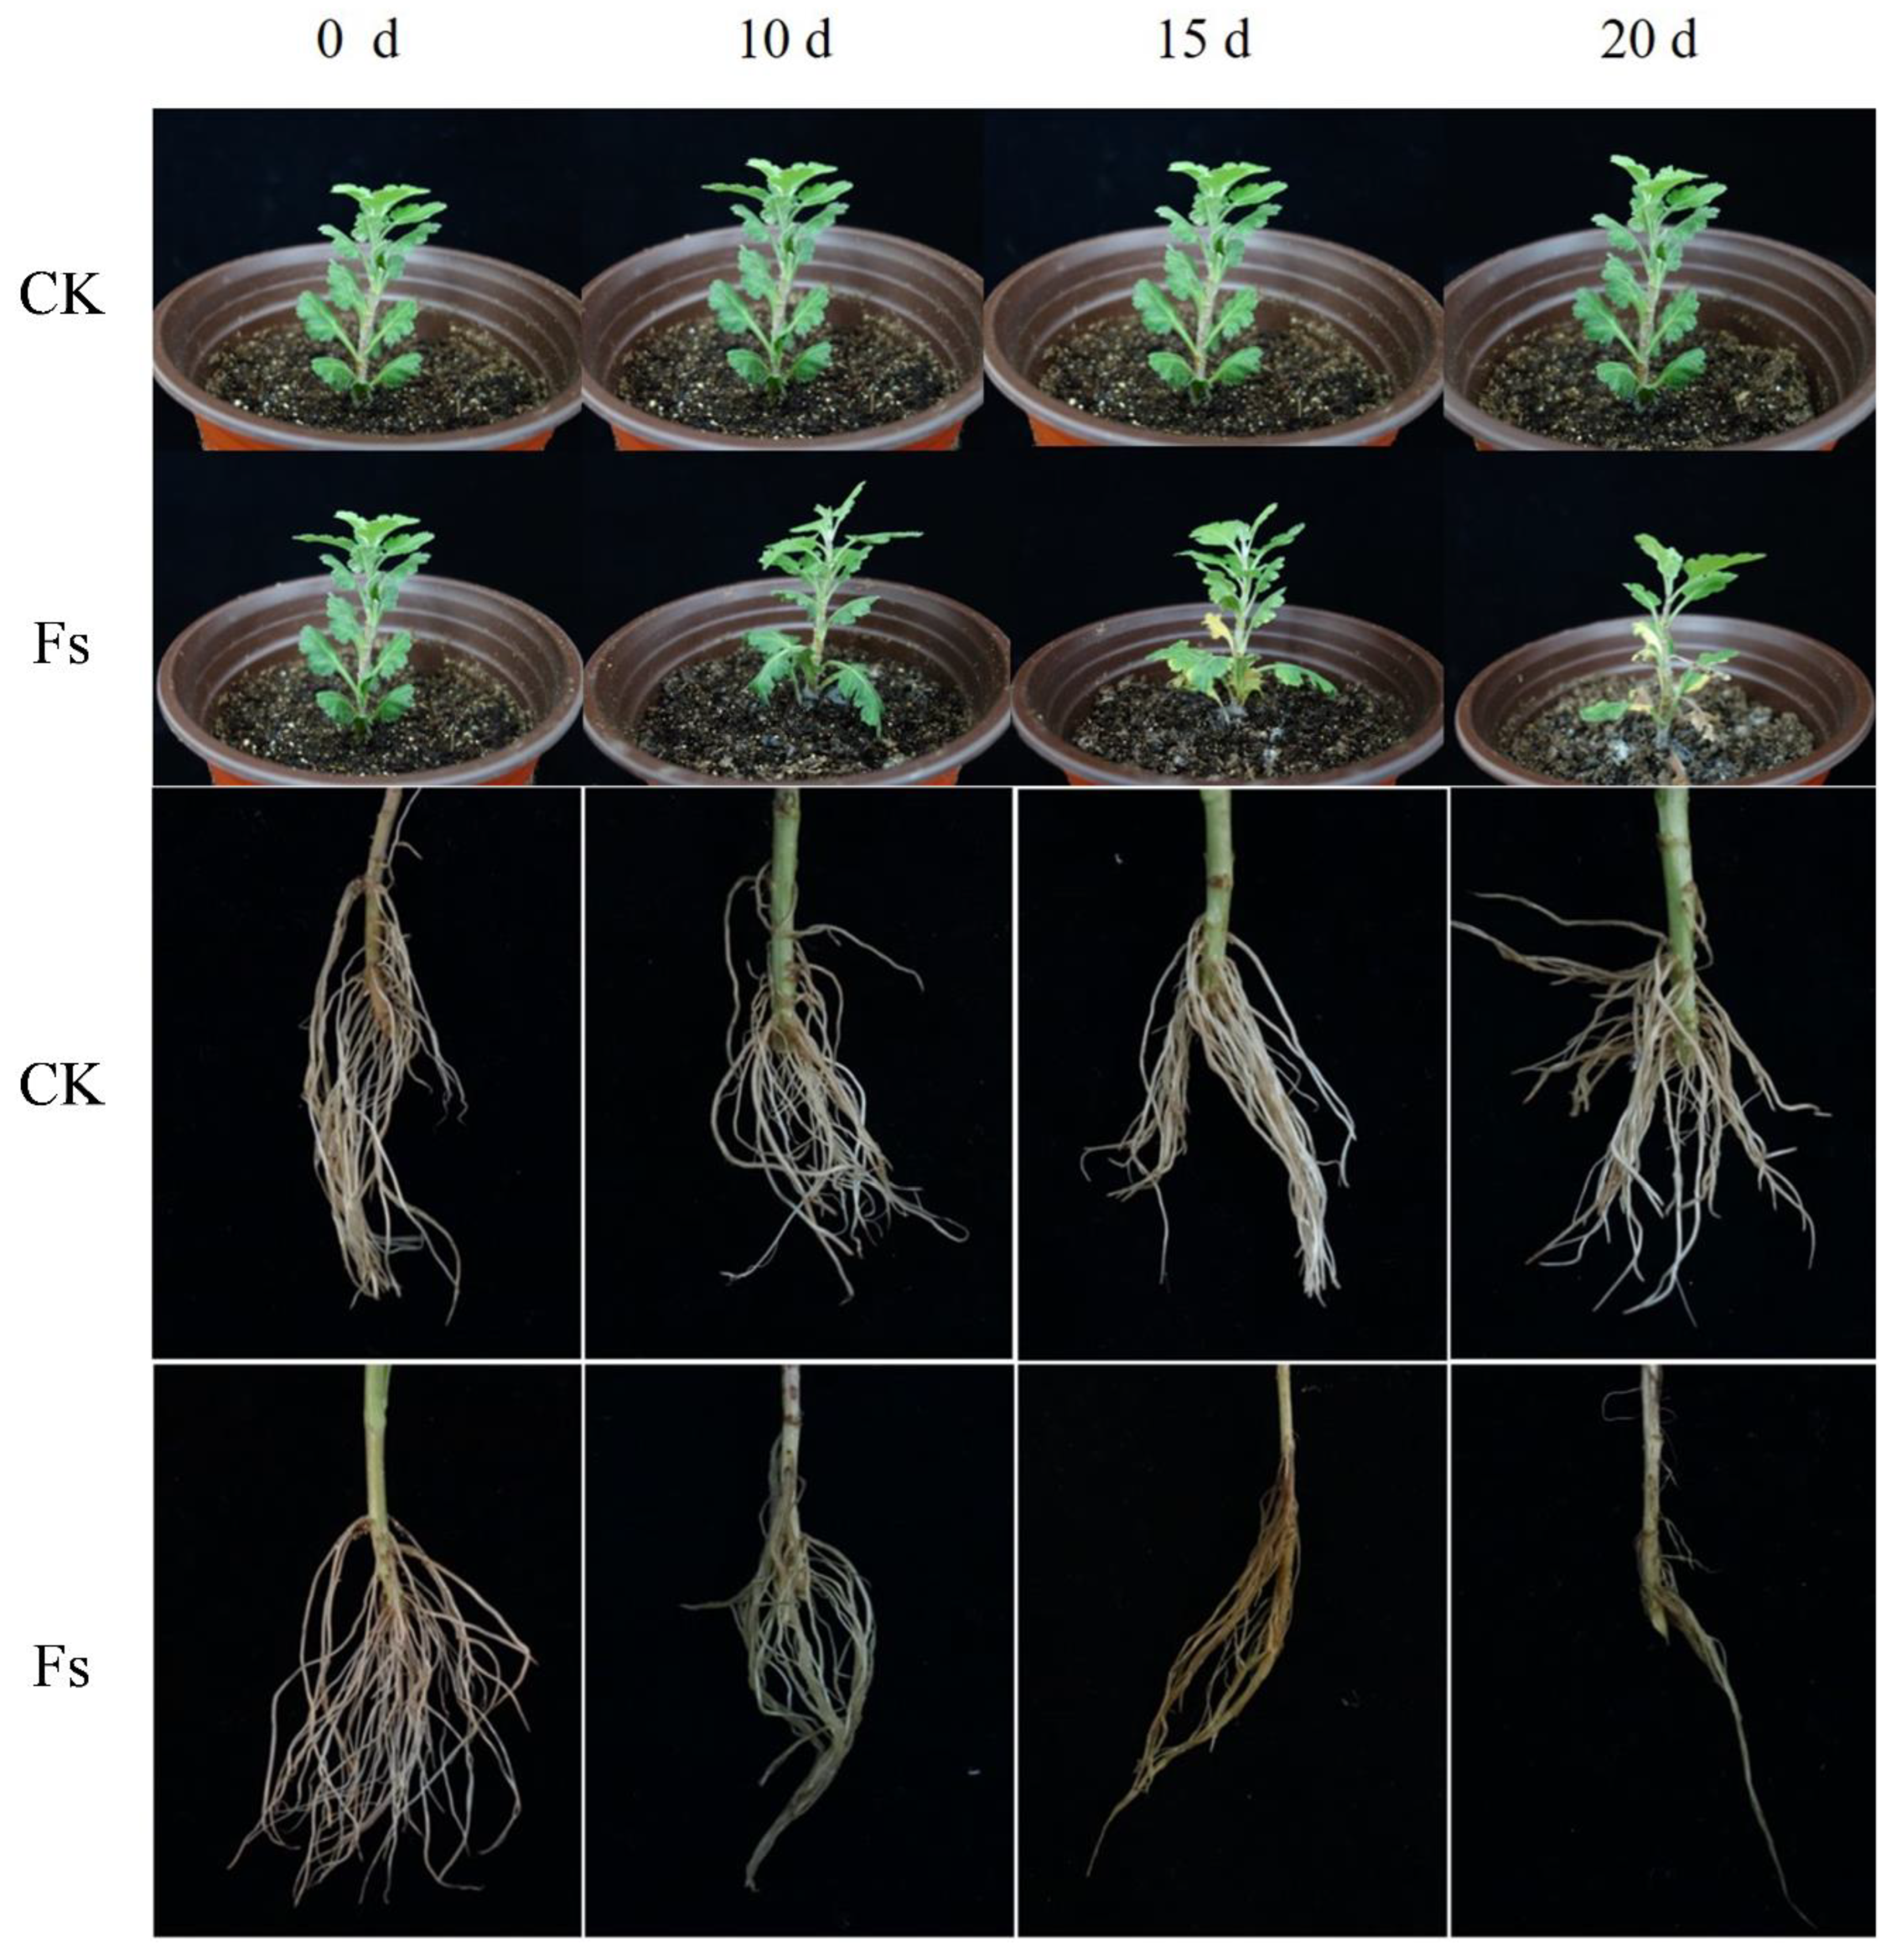
Figure 6.
The invasion of chrysanthemum roots by F. solani under scanning electron microscopy (SEM) at magnifications ranging from 200-2.0 k×. (A, C, E, G, I) The roots of the control group were observed at 12 h, 1 d, 3 d, 5 d, and 10 d. (B, D, F, H, J, K, L) The roots of the pathogen infection group were observed at 12 h, 1 d, 3 d, 5 d, and 10 d.
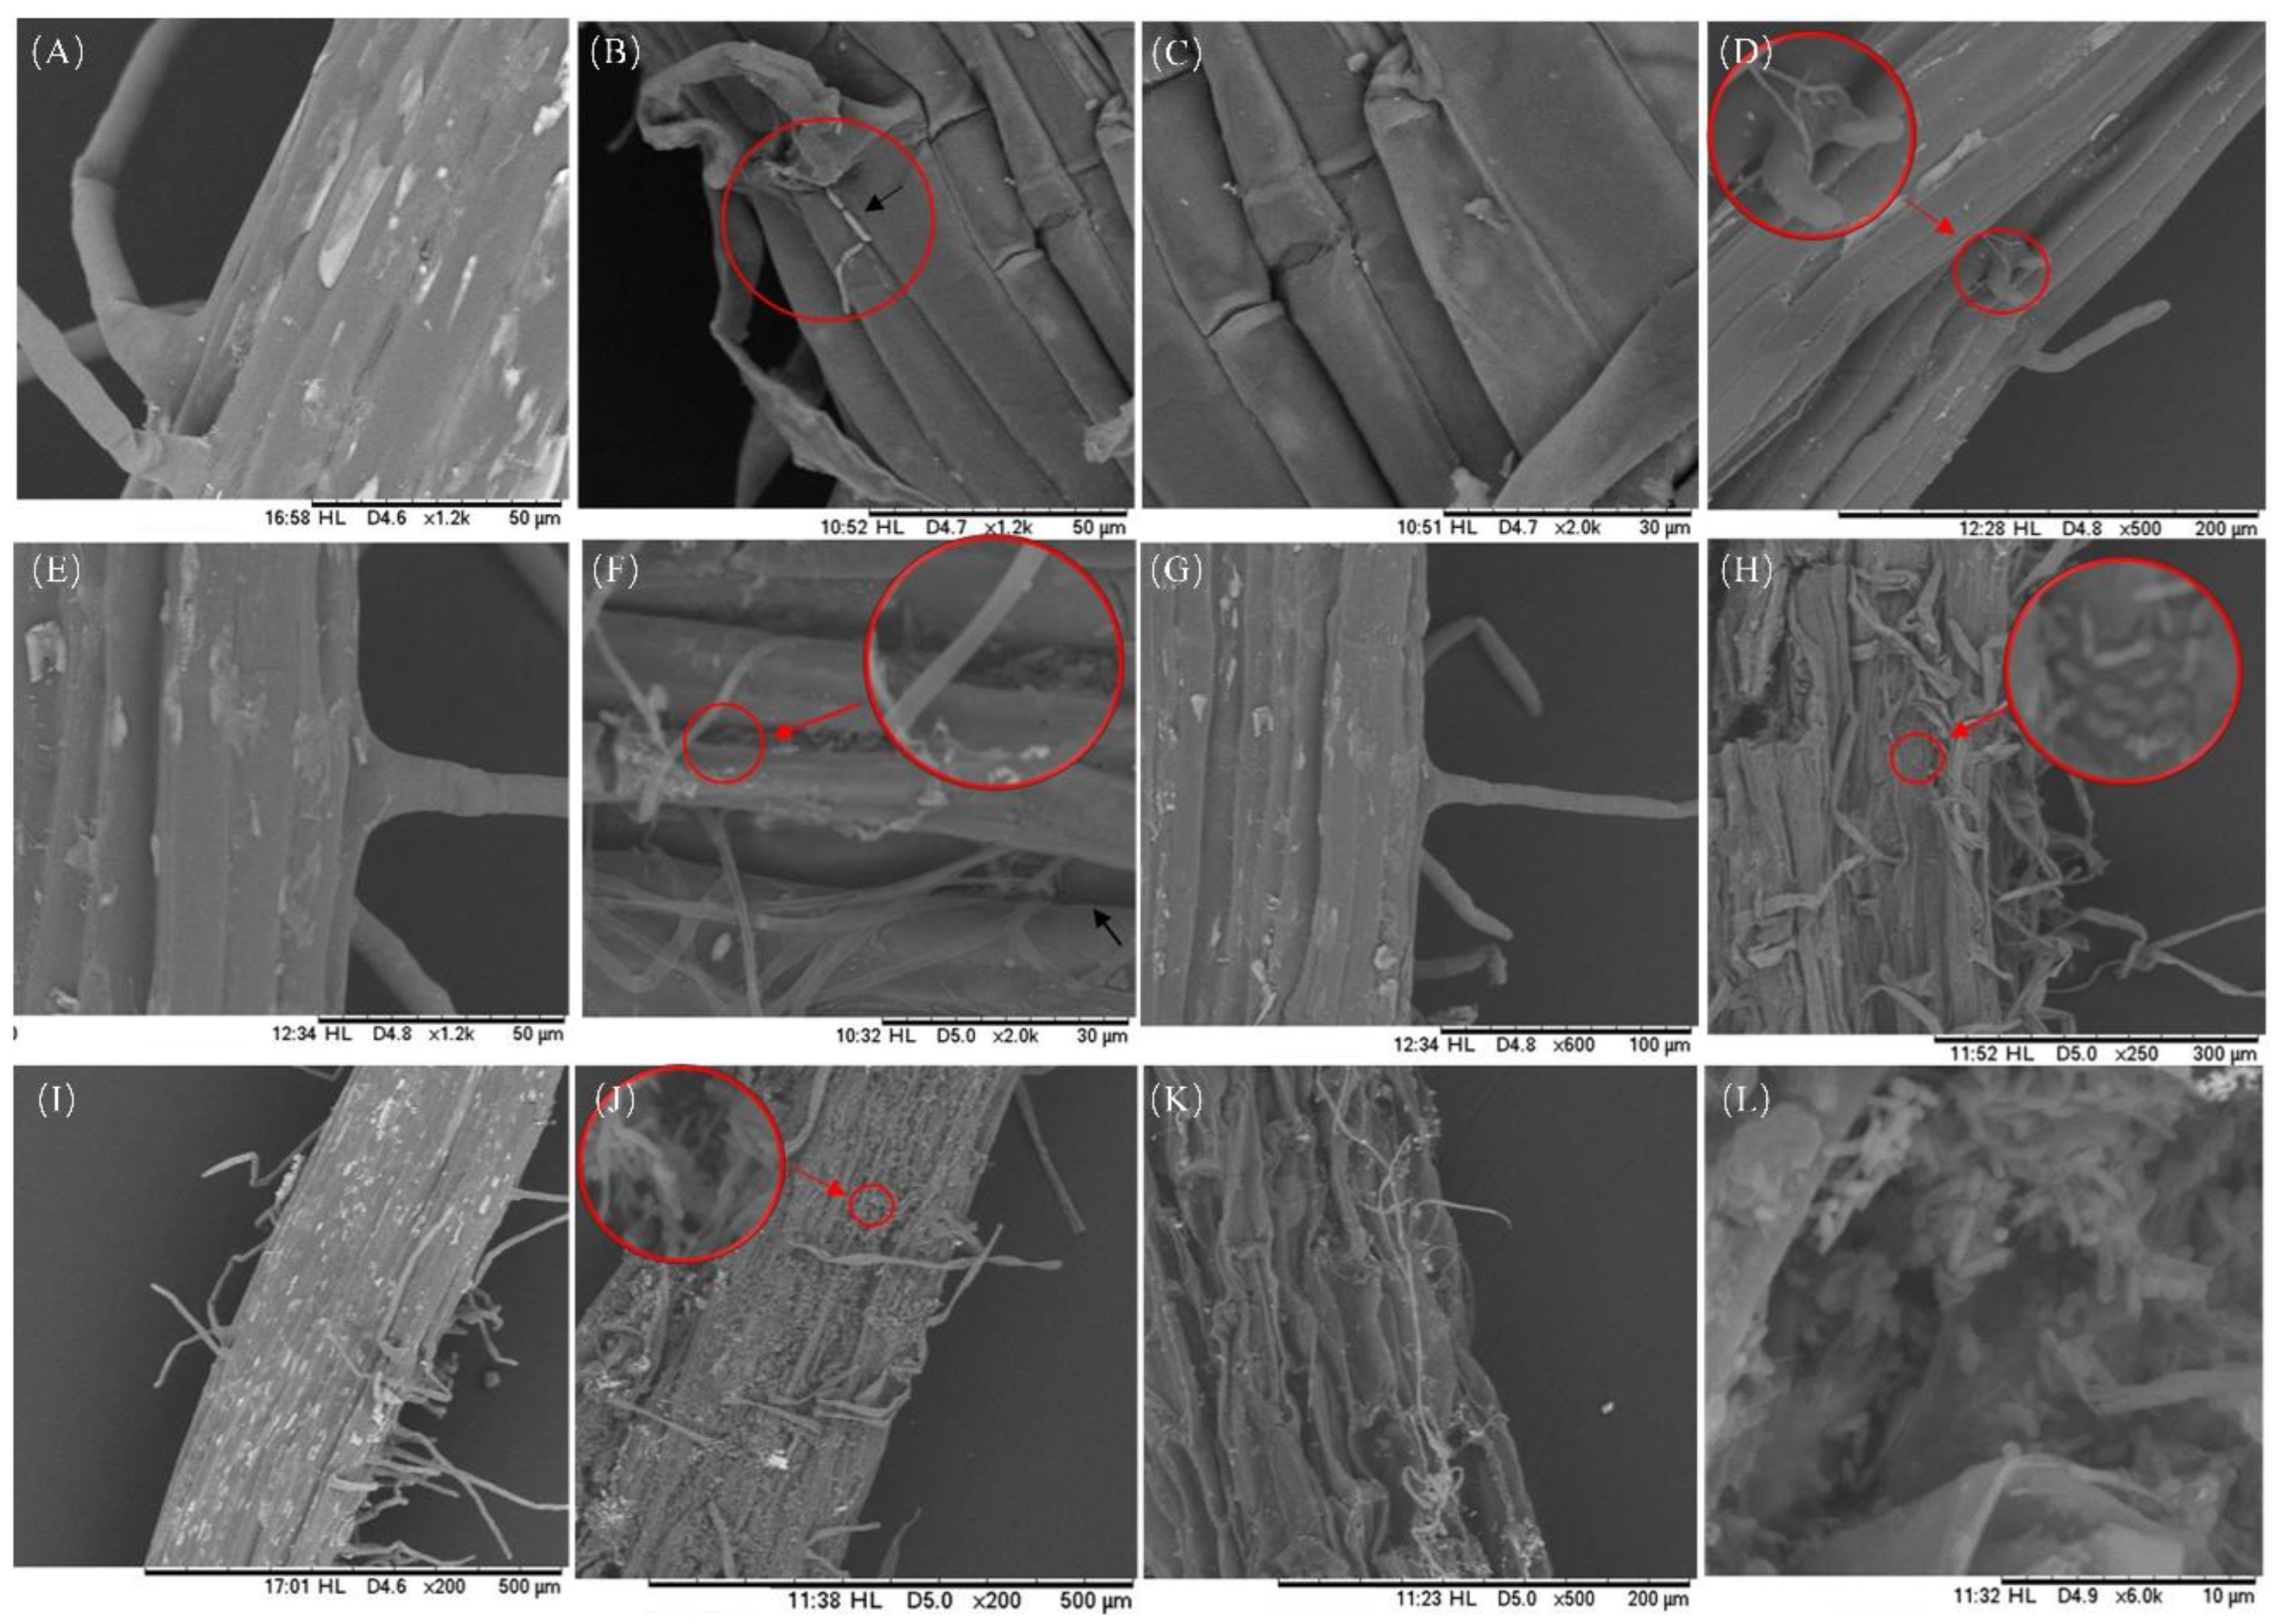
Figure 7.
The process of F. solani infecting chrysanthemum roots under laser confocal scanning microscopy (LCSM) (400×). (A, E, I, M, Q) The roots of the control group at 12 h, 1 d, 3 d, 5 d and 10 d. (B-D, F-H, J-L, N-P and R-T) The roots of the pathogen infection group at 12 h, 1 d, 3 d, 5 d and 10 d.
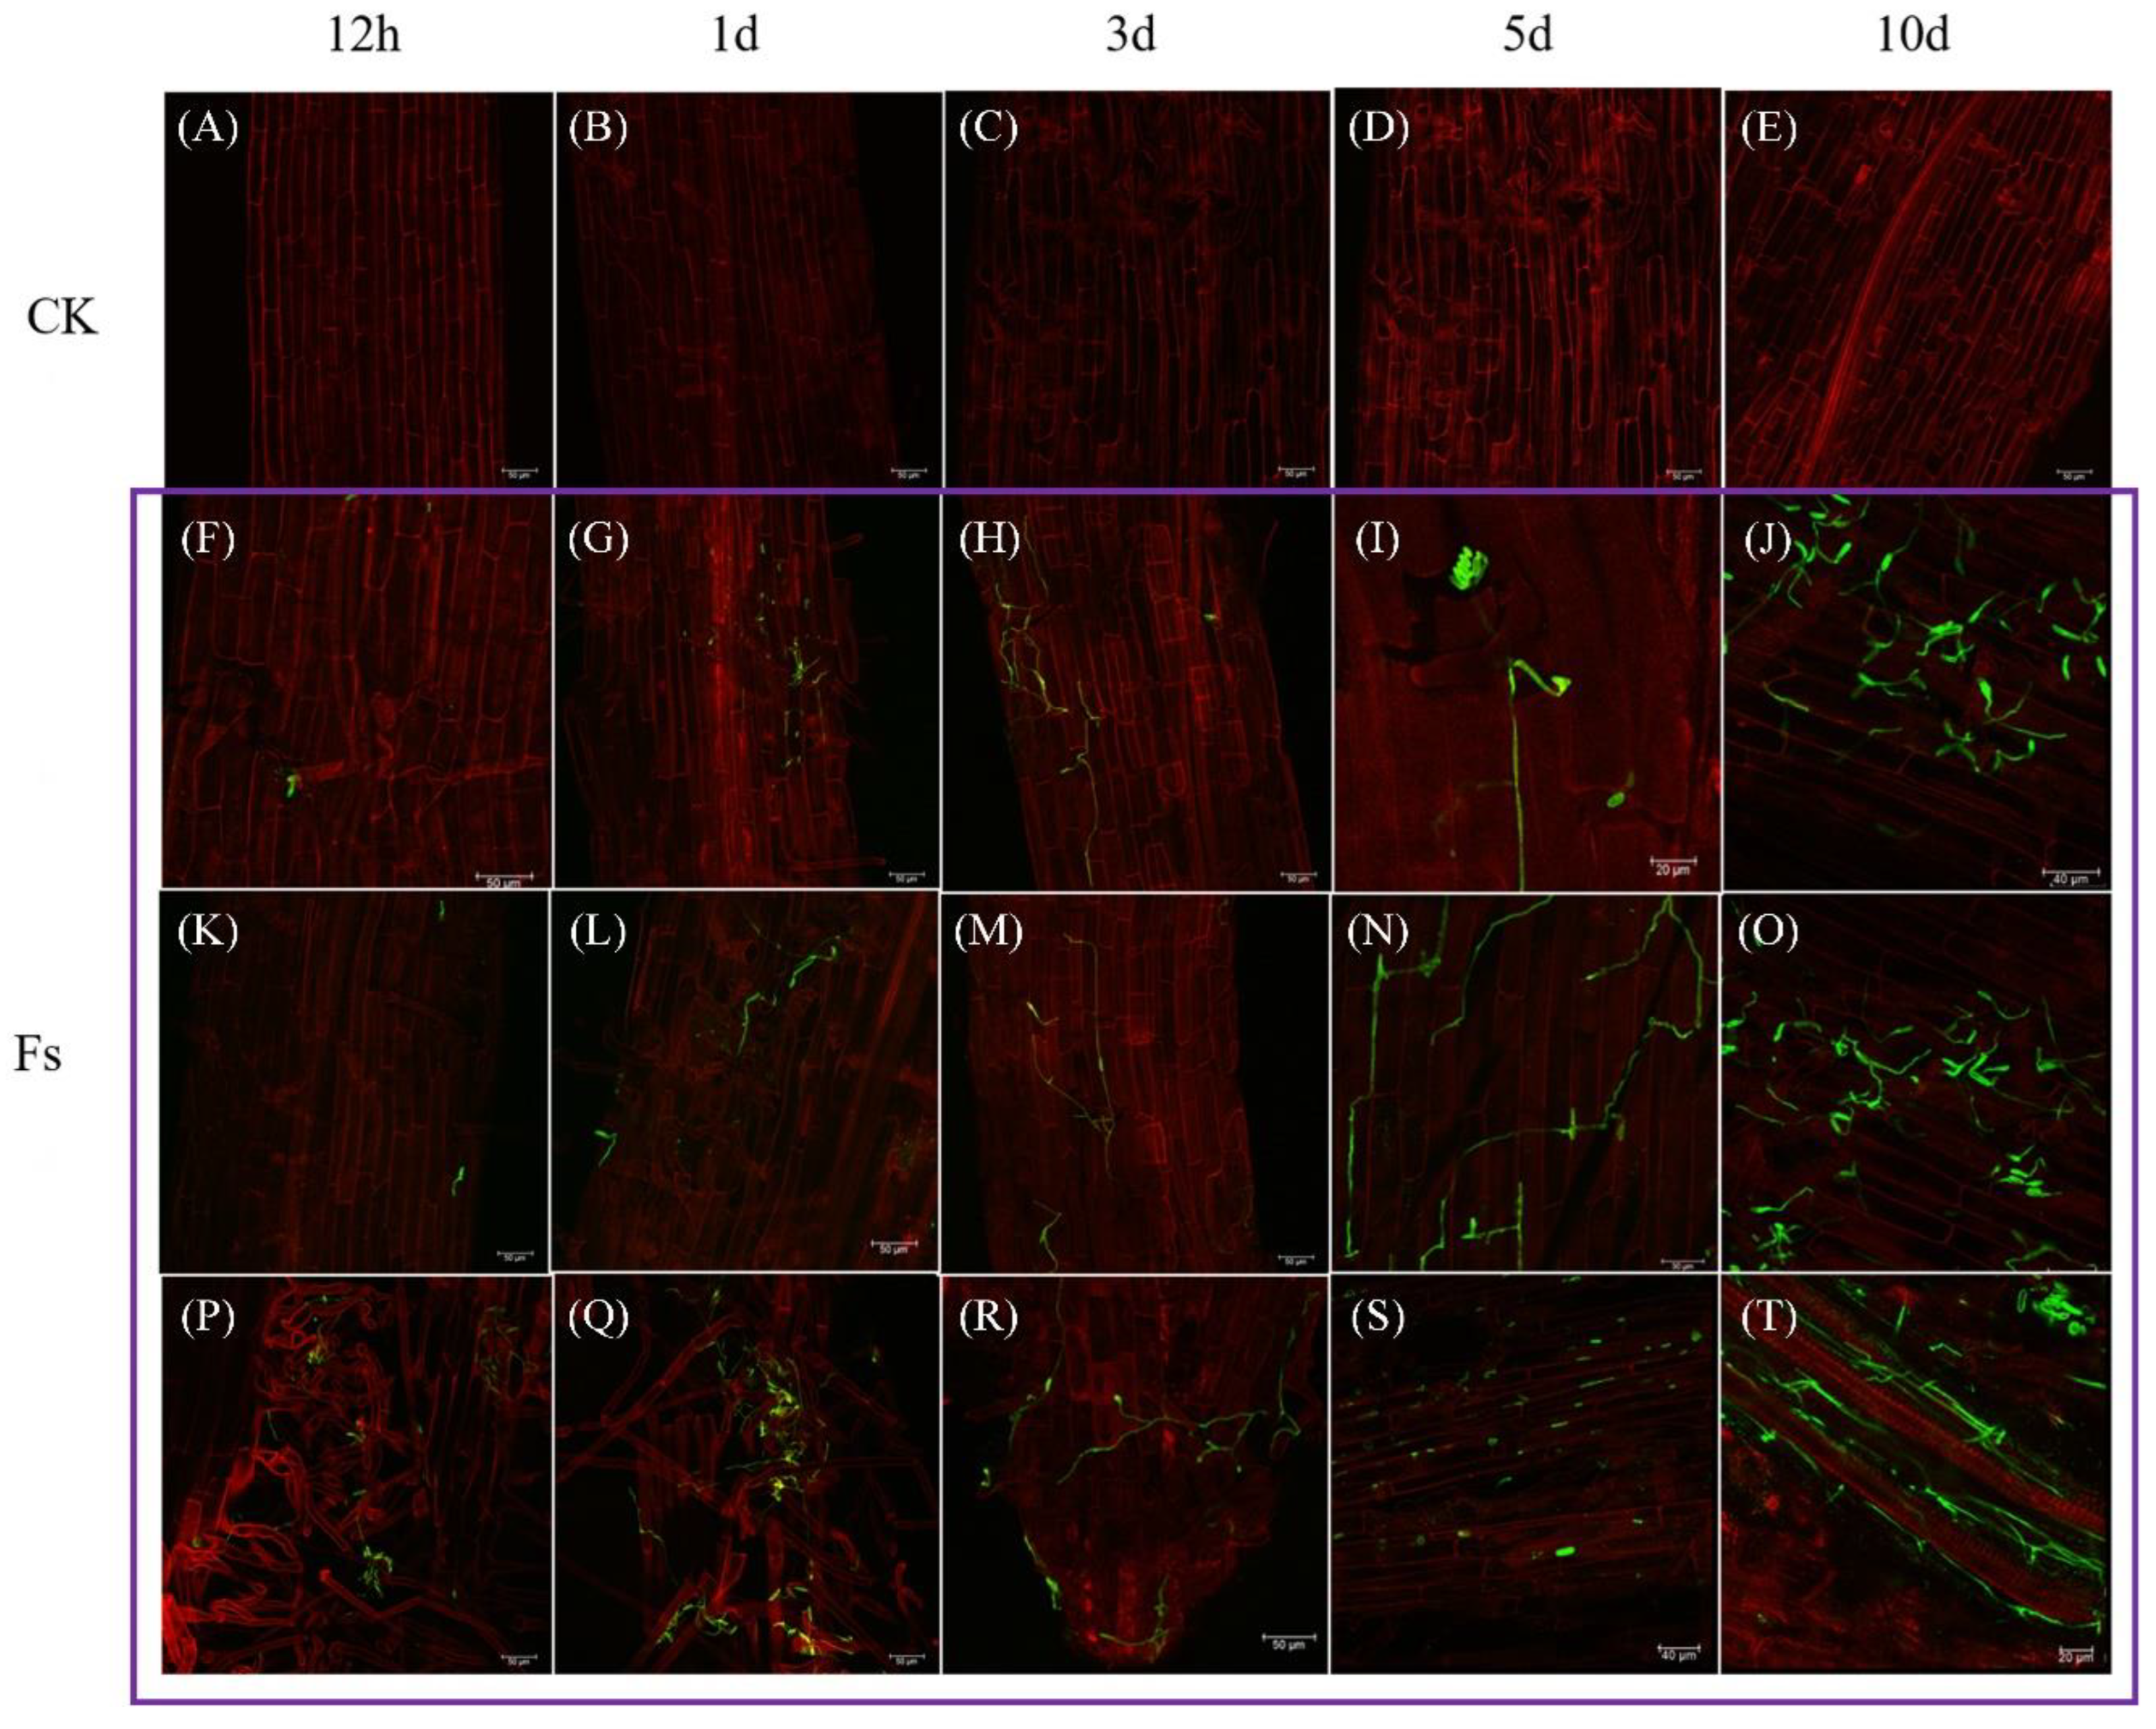
Figure 8.
Physiological responses of chrysanthemum to F. solani inoculation (A) Plant growth and photosynthetic pigment changes on the 15 dpi of F. solani. (B) Changes of nutrient contents in plants after inoculation by F. solani, including protein, soluble sugar, and Ca, P, K content. (C) Changes of hydrogen peroxide and MDA content in plant leaves after F. solani inoculation. (D) Changes of antioxidant enzyme activity in leaves after inoculation including Catalase, Peroxidase and Superoxide dismutase. (E) Changes of leaf defense enzyme activity after inoculation, including Polyphenol oxidase, Phenylalanine ammonialyase and Chitinase. (F) Changes of JA and SA in leaves after F. solani inoculation.
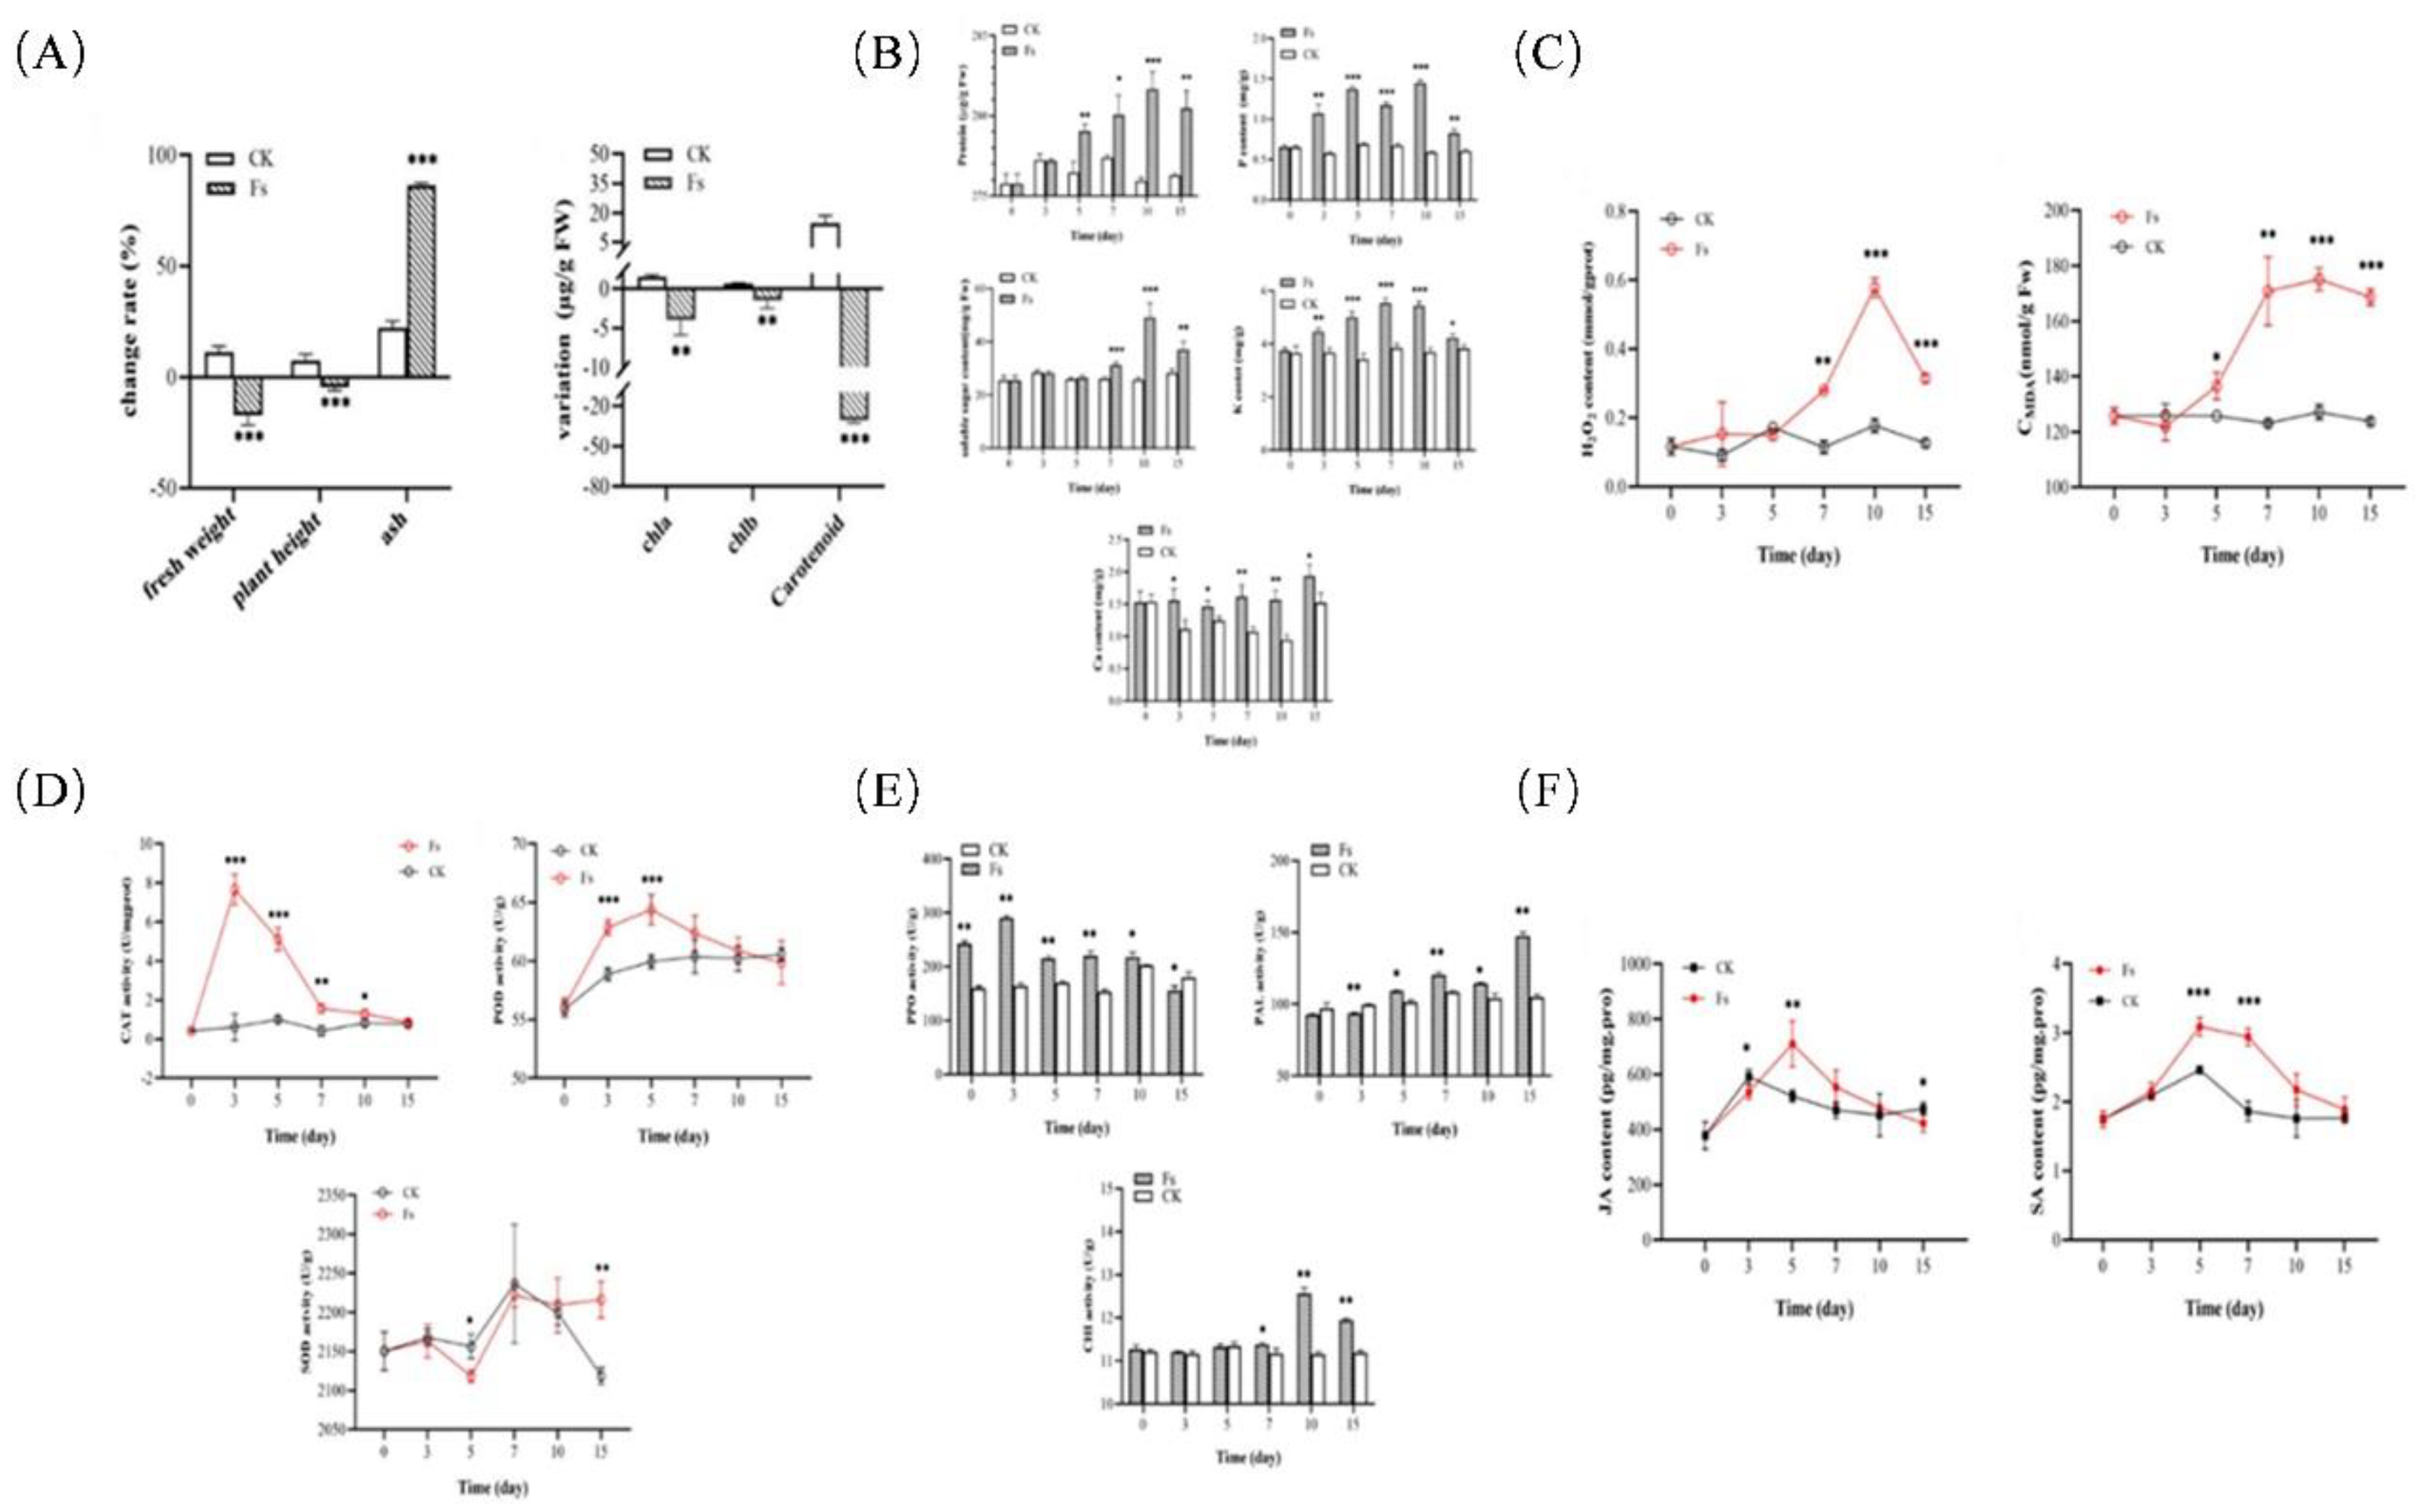
Figure 9.
Analysis of soil bacterial microbial community structure. (A) Sample sparsity curve and Shannon index. (B) Relative abundance of bacterial at phylum level. (C) Relative abundance of bacteria at genus level. (D) Sample difference analysis, LEfSE analysis, PCoA principal coordinate analysis and Sample similarity tree.
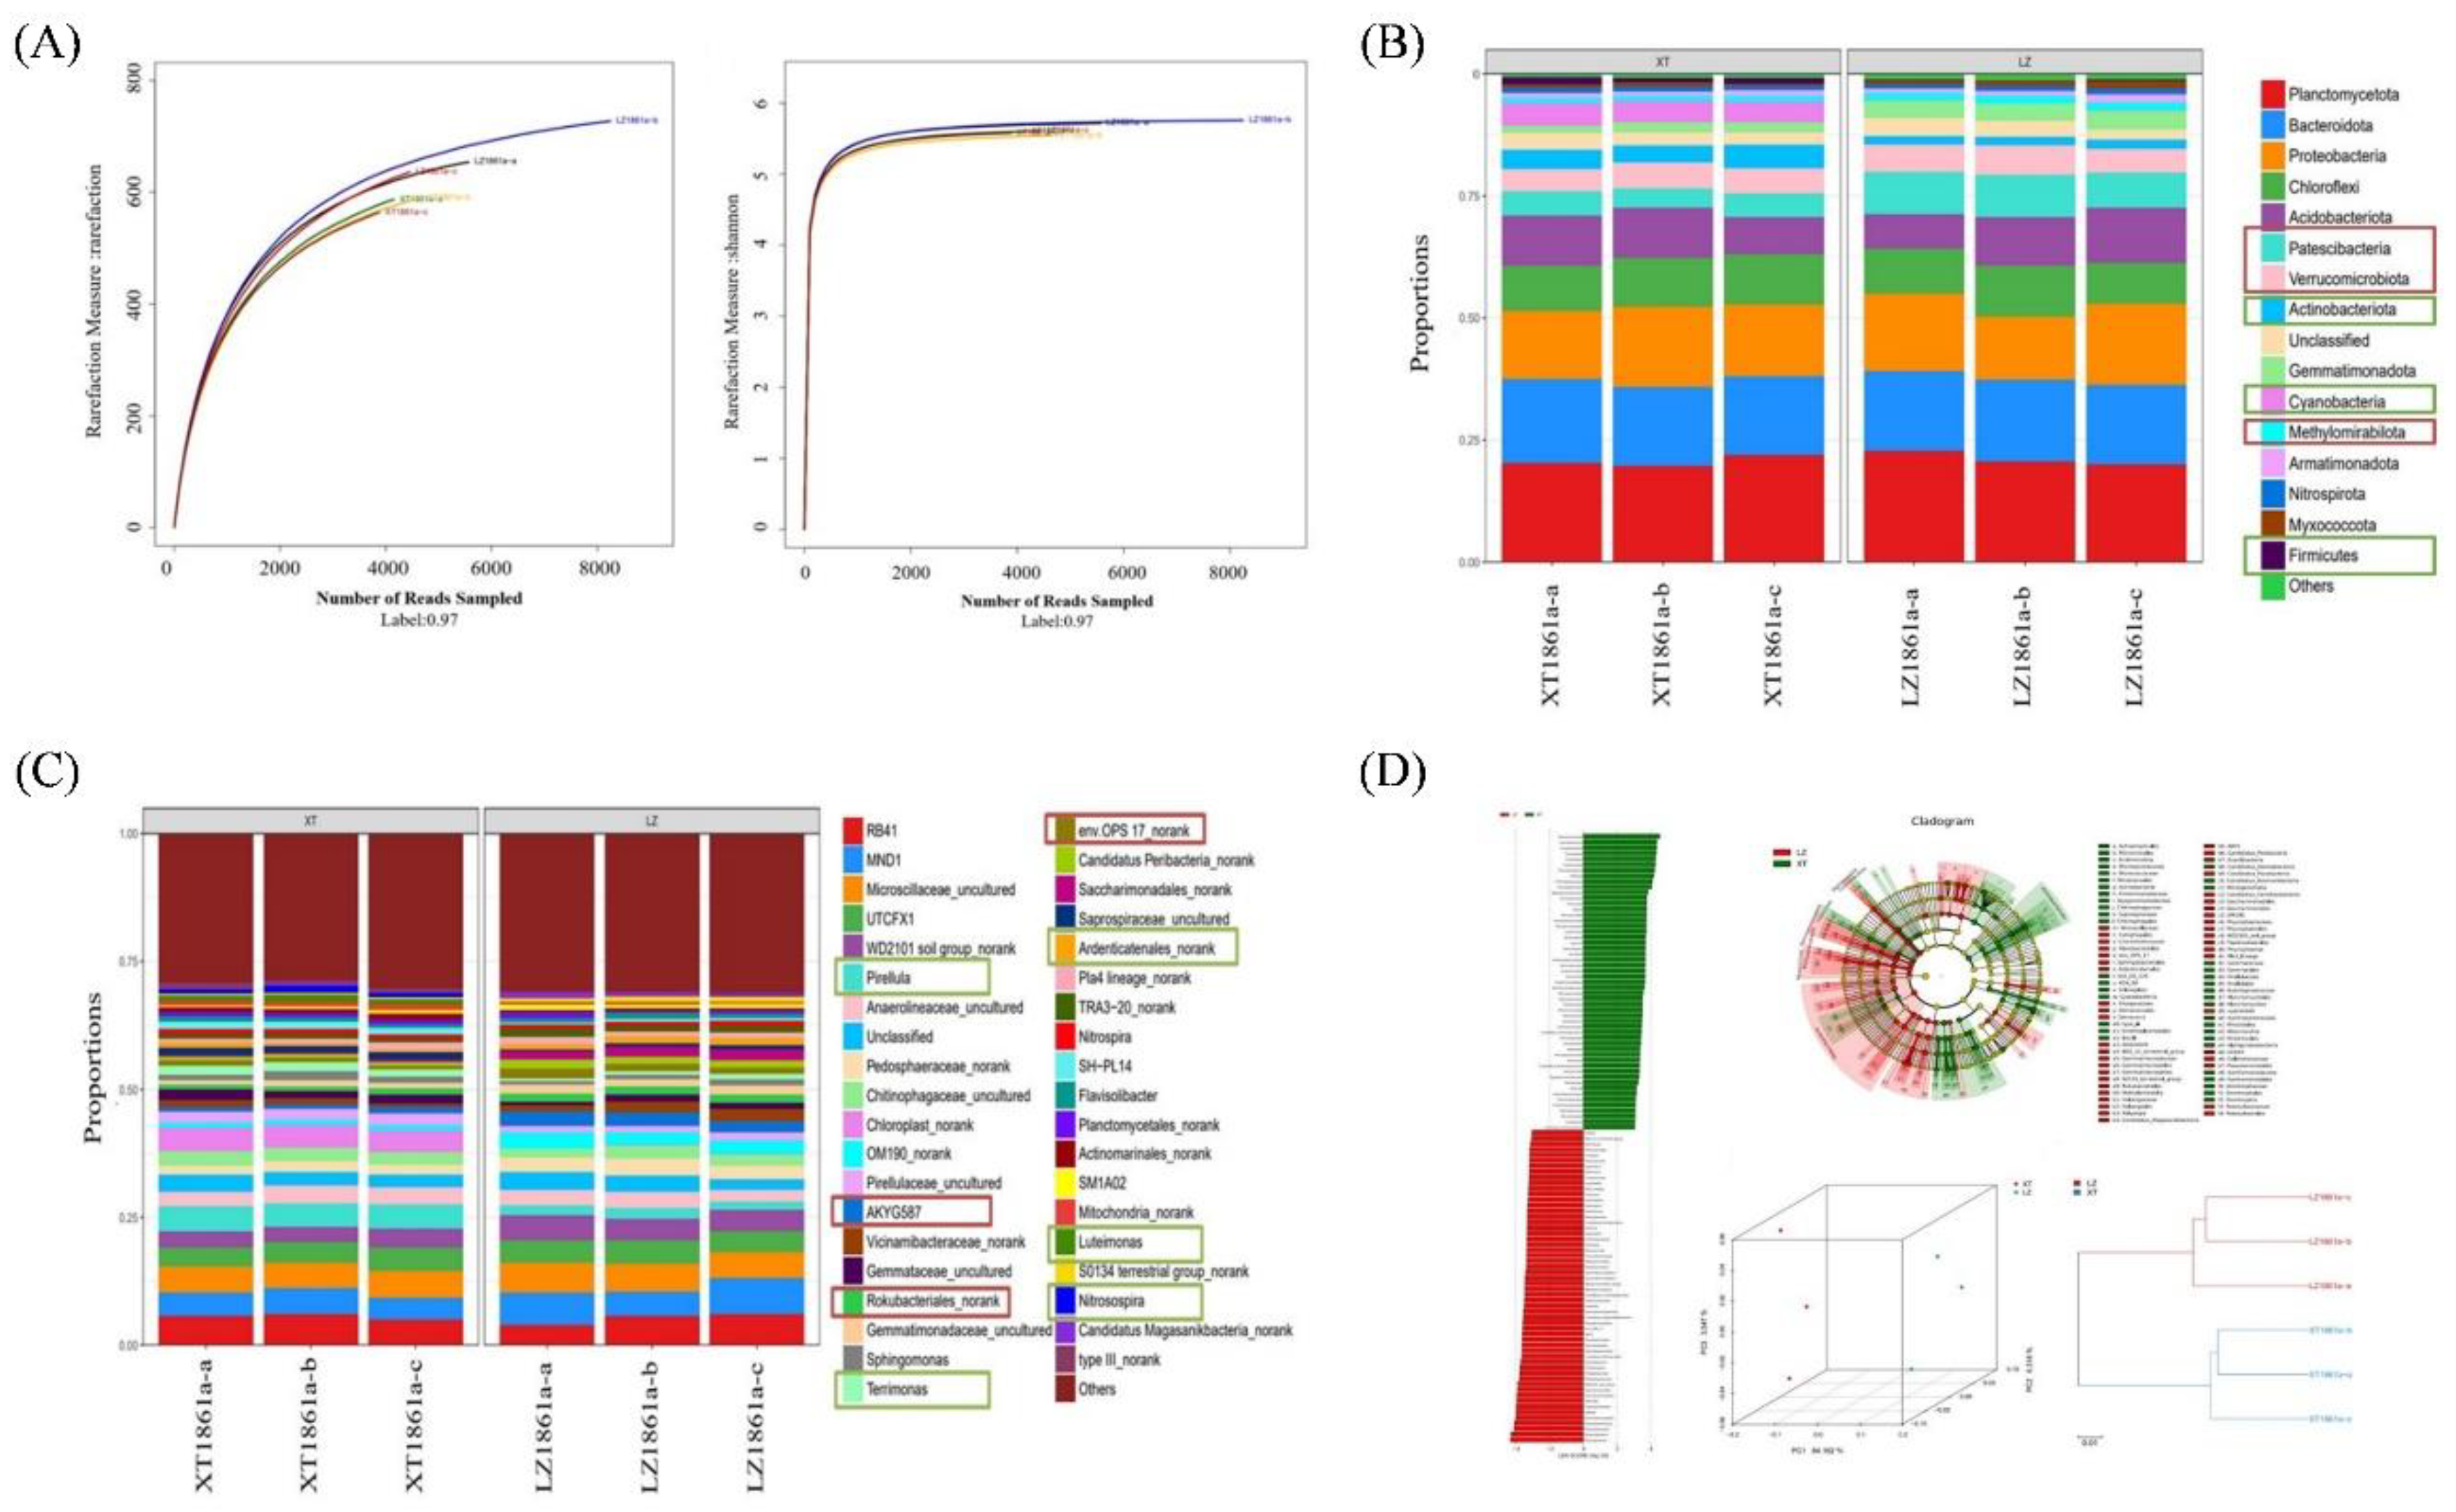
Figure 10.
Analysis of soil fungal microbial community structure. (A) Sample sparsity curve and Shannon index. (B) Relative abundance of fungi at phylum level. (C) Relative abundance of fungi at genus level. (D) Relative abundance of Fusarium at species level. (E) Sample difference analysis, LEfSE analysis, PCoA principal coordinate analysis and Sample similarity tree.
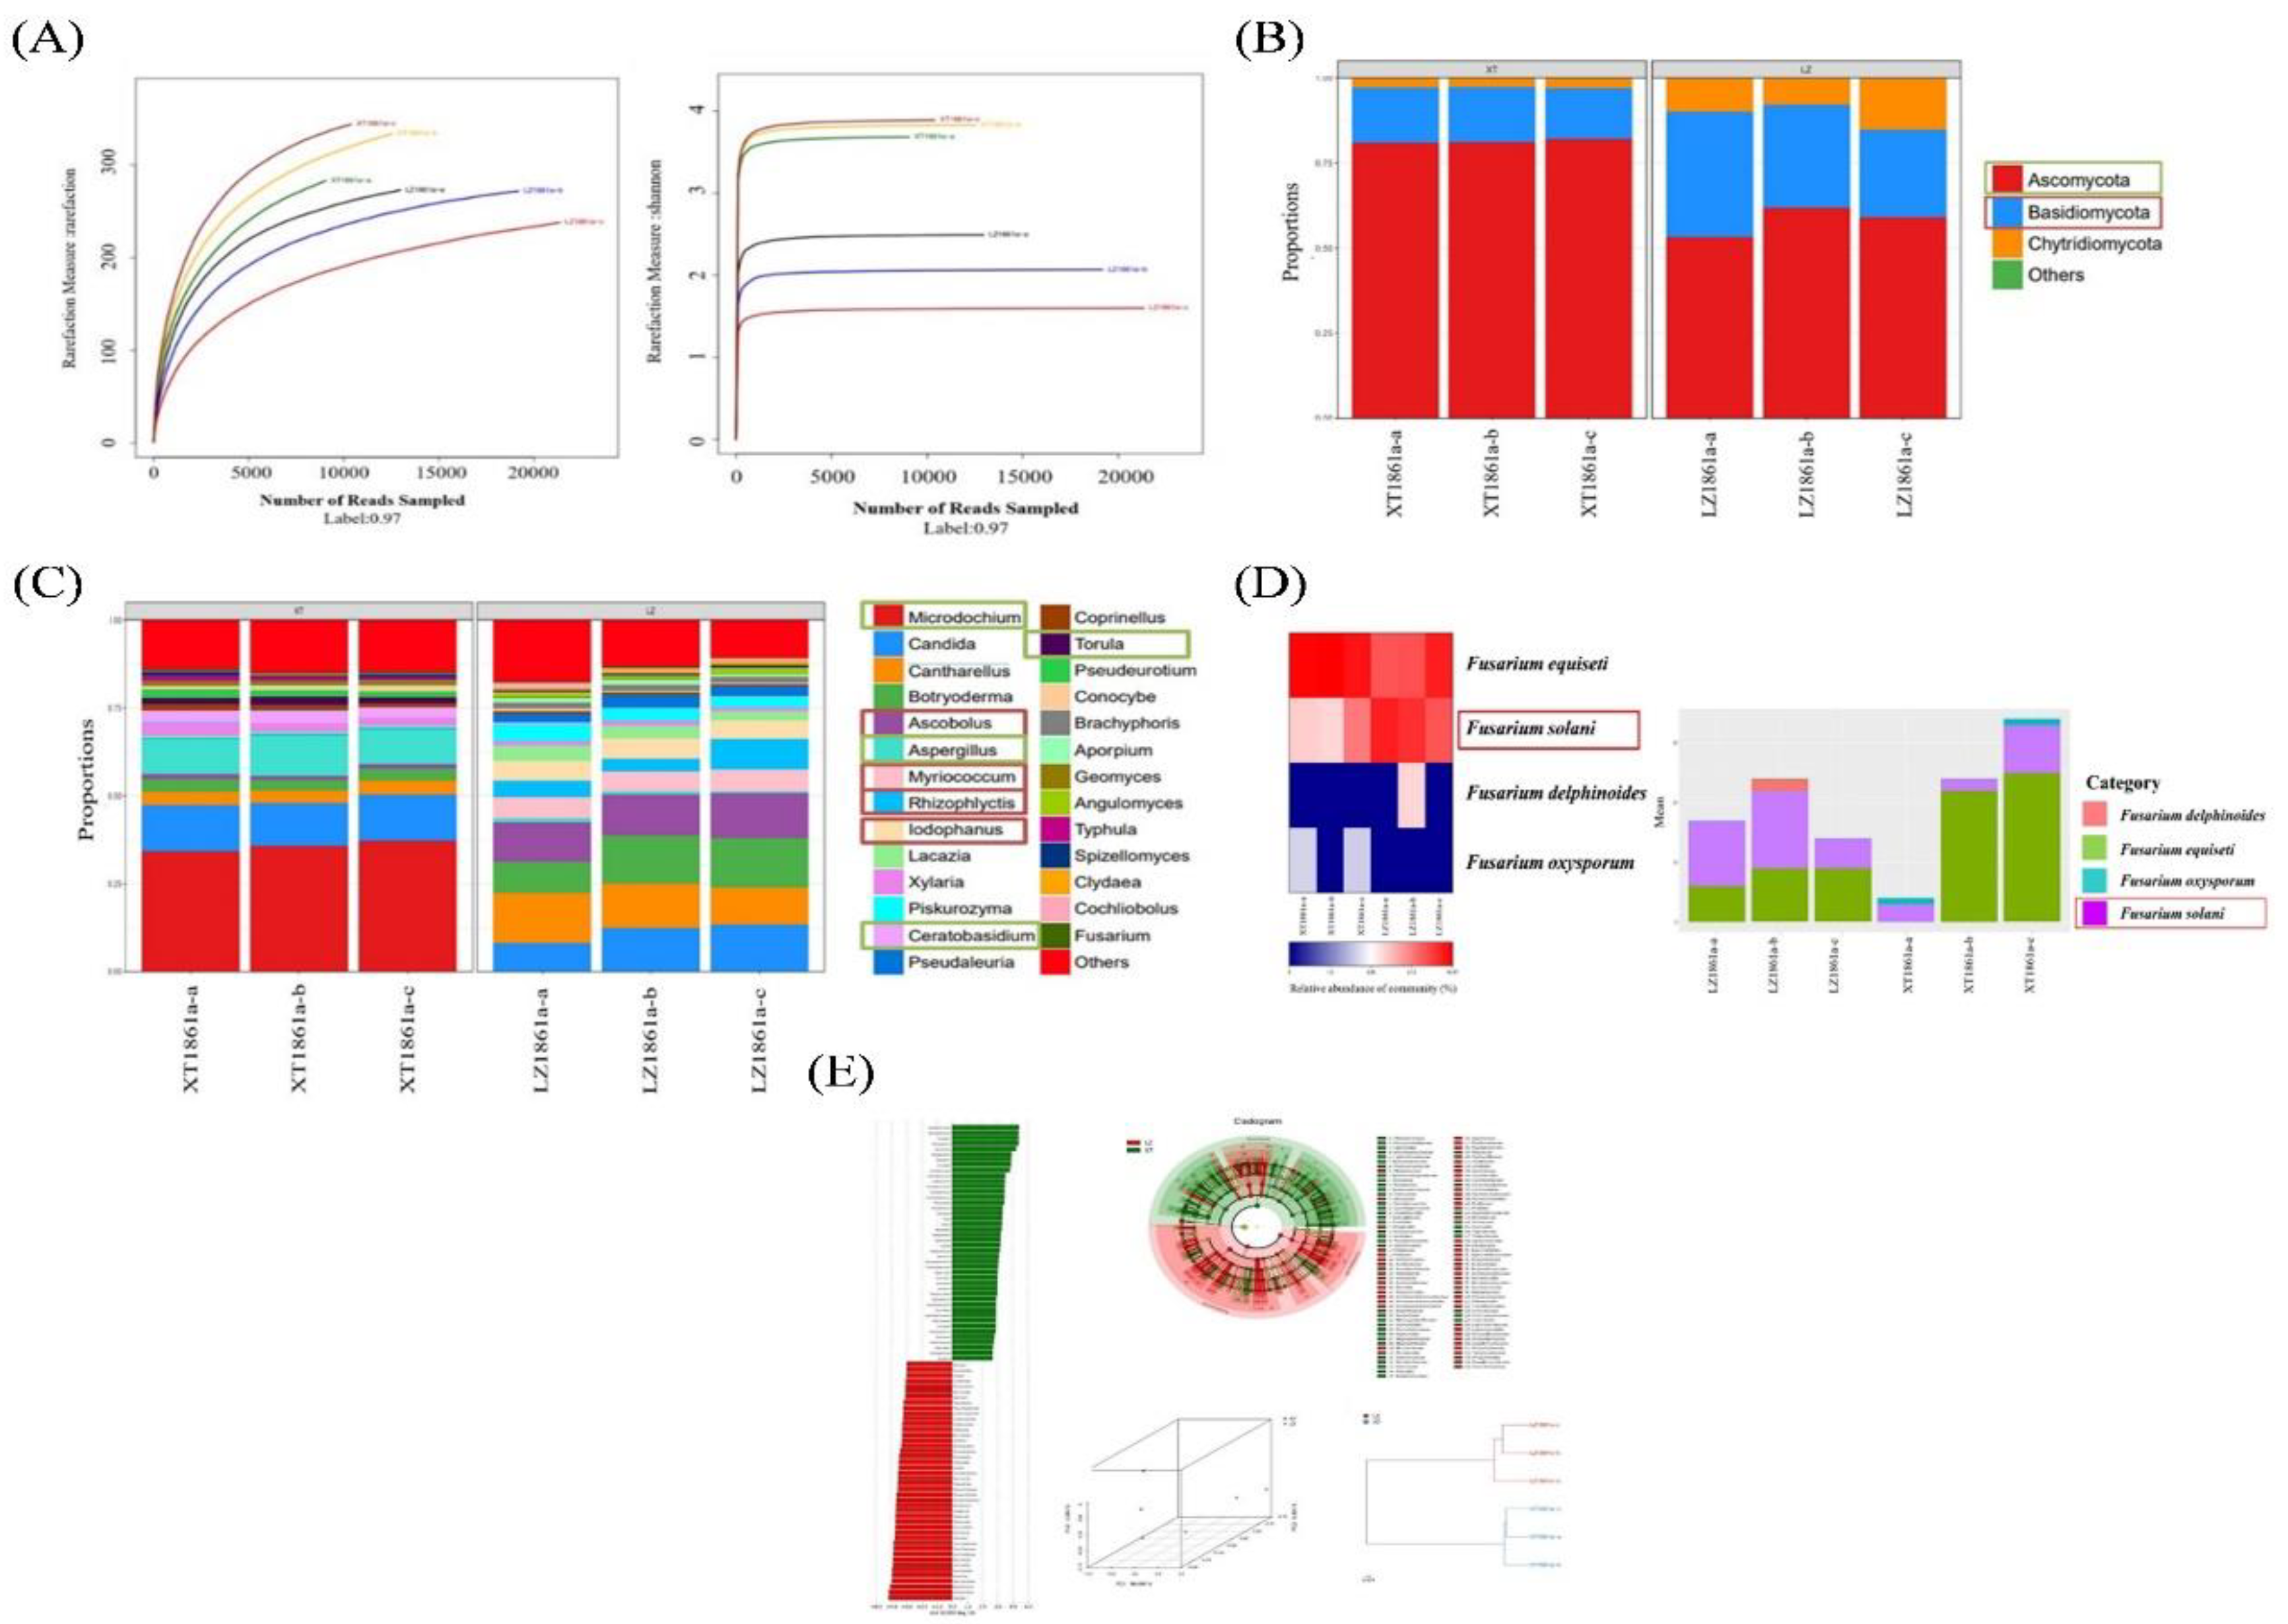

Table 1.
Statistics of disease incidence and index in 10th, 20th days.
| 10 d | 20 d | |||
|---|---|---|---|---|
| Incidence (%) | Index (%) | Incidence (%) | Index (%) | |
| CK | 0 | 0 | 0 | 0 |
| Fs | 53.85 | 42.31 | 92.30 | 65.38 |
Disclaimer/Publisher’s Note: The statements, opinions and data contained in all publications are solely those of the individual author(s) and contributor(s) and not of MDPI and/or the editor(s). MDPI and/or the editor(s) disclaim responsibility for any injury to people or property resulting from any ideas, methods, instructions or products referred to in the content. |
© 2023 by the authors. Licensee MDPI, Basel, Switzerland. This article is an open access article distributed under the terms and conditions of the Creative Commons Attribution (CC BY) license (http://creativecommons.org/licenses/by/4.0/).
Copyright: This open access article is published under a Creative Commons CC BY 4.0 license, which permit the free download, distribution, and reuse, provided that the author and preprint are cited in any reuse.


