
Submitted:
07 November 2023
Posted:
08 November 2023
You are already at the latest version
Abstract
Dietary protein quality plays a key role in maintaining intestinal mucosal integrity, but also modulates the growth of luminal microorganisms. This work assessed the effect of dietary protein sources on the performance, gut morphology, and microbiome in Nile tilapia. Four isonitrogenous and isolipidic diets comprising equivalent amounts of the protein supply derived from either PLANT, ANIMAL, INSECT, or MICROBIAL (bacterial biomass) sources were fed to triplicate groups of fish (IBW: 12 g) during 46 days. Fish fed ANIMAL and MICROBIAL diets showed significantly higher growth than those fed the PLANT and INSECT diets (P < 0.05). Relative abundance at the phylum level shows Bacteroidetes, Fusobacteria and Proteobacteria as more abundant phyla in tilapia’s intestine, while Cetobacterium is the most representative genera in all treatments. Interesting patterns were observed in the correlation between amino acid intake and genus and species abundance. Metabolism prediction analysis showed that microbial amine and polyamine degradation pathways are modulated depending on diets. In conclusion, different protein sources interfere directly with the cross-talk of bacteria pathways and amino acid intake.
Keywords:
protein sources
; gut health
; microbiome
; Oreochromis niloticus
; amino acid intake
1. Introduction
Meeting the ever-increasing demand for protein, within environmental limits, is one of the biggest challenges faced by the global food system in the 21st century. In a resource-constrained world, aquaculture is an attractive option for expanding the animal protein supply. However, the current trend towards sustainable growth and eco-intensification of aquaculture has brought new challenges to the aquafeed industry. There is a need to use novel sources of proteins and oils and increase the incorporation of improved industrial by-products, functional ingredients, and additives to promote the welfare and health resistance of fish as well as mitigate the environmental impact of feeding.
Gut health affects animal performance, feed efficiency, and overall health and welfare, thus, its maintenance is key for animal nutrition. Gaining increasing attention in aquaculture, it is a complex balance of diet, mucosa integrity, the immune system, and commensal microbiota. As one of the main bulk ingredients in fish feeds, dietary protein supply (i.e., amino acids) plays a core role in fish development but is also pivotal for the maintenance of the intestinal mucosal integrity, while providing nutritional support to gut microorganisms in the gut [1,2,3,4]. In a recent examination [5], the functions and mechanisms of action of amino acids on the intestinal physiology and health in land-dwelling vertebrates were delineated. Certain amino acids, such as glutamate, glutamine, and aspartate, are catabolized by enterocytes to fulfill their increased energy demands and produce bioactive metabolites like glutathione or nitric oxide. In contrast, other amino acids (such as threonine and tryptophan) are primarily utilized as fundamental components for protein synthesis in connection with epithelium renewal and mucin production mechanisms. Several amino acids have been proven to support the endocrine and barrier function of the intestine. Furthermore, amino acids are also metabolized by the gut microbiota that employ them for protein synthesis and in catabolic reactions releasing metabolites into the intestinal lumen, such as ammonia, hydrogen sulfide, branched-chain amino acids, polyamines, and phenolic compounds. Some of these, like hydrogen sulfide, a bacterial metabolite derived from cysteine, can interfere with epithelial energy metabolism and elicit mucosal inflammation when present in excess, whereas others (like indole derivatives originating from tryptophan) tend to avert dysfunction of the gut barrier or regulate enteroendocrine functions.
In the year 2017, tilapia obtained the fourth position when considering both production quantity and value within the aquaculture species group [6]. The leading species of cultured tilapia is the Nile tilapia (Oreochromis niloticus). The grow-out feeds for tilapia generally contain moderate levels of crude protein (ranging from 28% to 36%) which are mainly derived from defatted oilseed meals like soybean, peanut, and rapeseed. Additionally, these feeds consist of relatively low levels (ranging from 3% to 10%) of fishmeal and/or land-animal processed by-product meals such as poultry meal. Considering the large scale of tilapia production, even a slight increase in production volumes would result in a significant rise in the demand for protein sources for their feeds. Recent studies have explored the use of emerging protein sources in Nile tilapia feeds, including insects [7], seaweeds [8], microalgae [9], yeasts [10], bacteria [11], and land-animal processed by-products meals [12]. These are some of the alternative protein sources that have been suggested to reduce reliance on fishmeal and promote tilapia growth. However, only a few studies have investigated their effects on intestinal health criteria, such as microbiota and mucosa integrity. Therefore, the objective of this trial was to compare the impact of different dietary protein sources on the performance, gut morphology, and microbiome of Nile tilapia juveniles.
2. Materials and Methods
2.1. Experimental diets
The trial comprised four dietary treatments, isonitrogenous (35% crude protein), isolipidic (9% crude fat), and isoenergetic (gross energy 18.8 MJ/kg). The main variable among the diets was the nature of 30% the total protein supply, which was derived from either fishmeal and poultry meal (ANIMAL), dehulled solvent extracted soybean meal and corn gluten meal (PLANT), microbial biomasses from Corybacterium glutamicum and Methylococcus capsulatus (MICROBIAL) or a defatted Tenebrio molitor larvae meal (INSECT) (Table 1). The remaining 70% of the total protein supply was derived from corn gluten meal, dehulled solvent extracted soybean meal, rapeseed meal, wheat gran, full-fat rice bran, wheat, and corn meal) were kept fairly constant among the various diets. Fish oil and soybean oil were used as main lipid sources, with a slight increase of fish oil in the fishmeal-free diets to guarantee constant EPA and DHA levels. All diets were supplemented with selected crystalline indispensable amino acids and monocalcium phosphate to avoid any essential amino acid or phosphorus imbalance. Diets comprised also 1% chromium oxide as an inert digestibility marker.
Diets were manufactured by extrusion at the SPAROS feed mill (Olhão, Portugal). All powder ingredients were mixed according to the target formulation in a double-helix mixer (model 500L, TGC Extrusion, France) and ground (below 400 µm) in a micropulverizer hammer mill (model SH1, Hosokawa-Alpine, Germany). Diets (pellet size: 2.0 mm) were manufactured with a twin-screw extruder (model BC45, Clextral, France) with a screw diameter of 55.5 mm. Extrusion conditions: feeder rate (73-76 kg/h), screw speed (246-252 rpm), water addition (345 ml/min), temperature barrel 1 (30-32ºC), temperature barrel 3 (111-114°C). Extruded pellets were dried in a vibrating fluid bed dryer (model DR100, TGC Extrusion, France). After cooling, oils were added by vacuum coating (model PG-10VCLAB, Dinnissen, The Netherlands). Coating conditions were: pressure (700 mbar); spraying time under vacuum (approximately 90 seconds), and return to atmospheric pressure (120 seconds). Immediately after coating, diets were packed in sealed plastic buckets and shipped to the research site where they were stored at room temperature, but in a cool and aerated emplacement. Representative samples of each diet were taken for analysis.
The amino intake of experimental diets, expressed as a percentage relative to the amino acid composition of the ANIMAL diet is presented in Figure 1 (absolute amino acid values are presented in Table S1 Supplementary material Appendix A). Although formulated to cover the known amino acid requirements of Nile tilapia, dietary changes altered the amino acid profile among diets. In comparison to the ANIMAL diet, some of the most striking differences worth mentioning are the lower content of Arg, His, and Gly in PLANT, MICROBIAL, and INSECT diets; the higher content of Thr found in the MICROBIAL diet; the lower content of Cys of PLANT and MICROBIAL diets; and the higher level of Glx (glutamic acid + glutamine) in the PLANT and INSECT diets.
2.2. Growth trial
The trial was conducted at the experimental facilities of the University of Trás-os-Montes e Alto Douro (UTAD, Vila Real, Portugal), which are registered for experimentation with aquatic species (0421/2018) by Direção-Geral de Alimentação e Veterinária (Ministry of Agriculture, Portugal). The experimental protocol was approved by the Animal Welfare Committee - Órgão Responsável pelo Bem-Estar Animal (ORBEA) of UTAD and was performed in compliance with the European (Directive 2010/63/EU) and Portuguese (Decreto-Lei nº. 113/2013, August 7th) legislation on the protection of animals for scientific purposes.
Nile tilapia (Oreochromis niloticus) originated from TIL-Aqua International (Velden, The Netherlands). Triplicate groups of 15 fish, with a mean initial body weight (IBW) of 12.1 ± 1.3 g were fed one of the four experimental diets during 46 days. Fish were grown in glass rectangular aquaria (volume: 90 L) supplied with recirculated freshwater (water flow rate: 4.5 L/min). The average water temperature during the trial was 24.8 ± 0.3ºC and the dissolved oxygen levels were kept above 6.5 mg/L. Fish were subjected to a photoperiod regime of 16 hours light and 8 hours dark. Fish were hand-fed to visual satiety, in 3 meals per day (09:00, 14:00, and 17.00h). Utmost care was taken to avoid feed wastage and allow precise quantification of feed intake. Allocation of test diets to the experimental units (tanks) was made by full randomization. After being subjected to lethal anesthesia (250 mg/L ethylene glycol monophenyl ether, Sigma-Aldrich, Spain), a pool of 10 whole fish from the initial stock (start of the trial) and a pool of 5 whole fish from each replicate tank at the end of the trial were sampled and stored at -20°C for subsequent analysis of whole-body composition. For the microbiome screening, three fish from each replicate had their peritoneal area cleaned with ethanol 70% to avoid bacterial contaminant, and a cut from the anus to the intraperitoneal cavity was made to remove the intestine, which was sampled and placed on a sterile Petri dish. The posterior intestine from the fish was sampled and the intestinal content was removed using forceps. The intestinal tissue (Mucosa) was washed with sterile PBS to remove any digest attached to the intestine walls and then placed into DNA-free cryovials. The samples were stored at -80ºC until further analysis. A section of approximately 1 cm of the hindgut of the same 3 fish sampled for microbiome was dissected and placed immediately in formaldehyde 4% for further histological analysis.
2.3. Apparent digestibility measurements
In parallel to the growth performance trial, groups of 15 fish from the same initial stock, with a mean body weight (BW) of 25.3 ± 3.1 g, were used to determine the apparent digestibility coefficients (ADC) of the dietary components, by the indirect method with diets containing 1% chromium oxide as the inert tracer. Each dietary treatment was tested in triplicate. Fish were stocked in cylindro-conical tanks (volume: 60 L), supplied with recirculated freshwater at an average water temperature of 25ºC. Before the start of feces collection, fish were adapted over 16 days to the experimental diets. Fish were fed twice a day (9.00 and 14.00 h), by hand in slight excess. After the last daily meal, tanks were thoroughly cleaned to eliminate any feed residues, and feces were collected daily for the following 12 days using a mechanical system for the continuous filtration of feces in the outlet water (INRA system). After daily collection, feces from each replicate tank were frozen at -20°C and subsequently freeze-dried before analysis.
2.4. Analytical methods
2.4.1. Nutritional characterization
Analysis of diets, whole fish, and feces followed the methodology described by AOAC (2006). Dry matter after drying at 105ºC for 24 h; total ash by combustion (550ºC during 6 h) in a muffle furnace (Nabertherm L9/11/B170, Germany); crude protein (Nx6.25) by a flash combustion technique followed by a gas chromatographic separation and thermal conductivity detection with a Leco N Analyzer (Model FP-528, Leco Corporation, USA); crude lipid by petroleum ether extraction (40-60ºC) using a Soxtec™ 2055 Fat Extraction System (Foss, Denmark), with prior acid hydrolysis with 8.3 M HCl; gross energy in an adiabatic bomb calorimeter (Werke C2000, IKA, Germany). Chromium concentration in feeds and feces was determined according to Bolin et al. (1952), after perchloric acid digestion. Amino acids were determined after hydrolysis in 6M HCL at 108ºC for 24h in nitrogen-flushed glass vials. A Waters Pico-Tag reversed-phase HPLC system, using norleucine as an internal standard, was used. The resulting chromatograms were analyzed with Breeze software (Waters, USA). Tryptophan in complete feeds was analyzed according to ISO 13904:2016 by HPLC-FD methodology (ISO, 2016).
2.4.2. Microbiome
- DNA extraction
The DNA was extracted from a total of 36 samples (3 per replicate) using the DNA extraction High Pure PCR Template Preparation Kit (Roche, Portugal). A Lysozyme pre-lysis step was performed to guarantee the extraction of gram-positive bacteria adding 500 ul of freshly made lysozyme (50 mg/ml of TE buffer or PBS) per sample and incubating for 30 min at 37ºC. The further DNA extraction procedure was followed by the manufacturer's protocol. The extracted DNA was sent to GENOINSEQ (Cantanhede, Portugal) laboratory for generation of the raw sequence data of the 16S V1 and V2 amplicon through Next-generation Sequencing of DNA molecules.
- High-throughput sequencing
Samples were prepared for Illumina Sequencing by 16S rRNA gene amplification of the bacterial community. The DNA was amplified for the hypervariable V1-V2 region with specific primers and further reamplified in a limited-cycle PCR reaction to add sequencing adapters and dual indexes. First PCR reactions were performed for each sample using KAPA HiFi HotStart PCR Kit according to manufacturer suggestions, 0.3 μM of each PCR primer: forward primer 27F 5’– AGAGTTTGATCMTGGCTCAG-3’ and a pool of reverse primers 338R-I-R 5’– GCWGCCTCCCGTAGGAGT-3’ and 338R-II-R 5’– GCWGCCACCCGTAGGTGT-3’ [13] and 12.5 ng of template DNA in a total volume of 25 μL. The PCR conditions involved a 3 min denaturation at 95 ºC, followed by 35 cycles of 98 ºC for 20 s, 56 ºC for 30 s, and 72 ºC for 30 s, and a final extension at 72 ºC for 5 min. Second PCR reactions added indexes and sequencing adapters to both ends of the amplified target region according to the manufacturer’s recommendations [14]. Negative PCR controls were included for all amplification procedures. PCR products were then one-step purified and normalized using SequalPrep 96-well plate kit (ThermoFisher Scientific, Waltham, USA) [15], pooled and paired-end (2x300bp) sequenced in the Illumina MiSeq® sequencer with the V3 chemistry, according to manufacturer’s instructions (Illumina, San Diego, CA, USA) at Genoinseq (Cantanhede, Portugal). Sequence data was processed at Genoinseq (Cantanhede, Portugal). Raw reads were extracted from Illumina MiSeq® System in fastq format for further analysis.
- Bioinformatics
Sequences were demultiplexed and non-biological nucleotides (e-g-, primers, adapters) were removed with the in-house protocols of the sequencing provider. Bioinformatic analyses were performed with QIIME 2 VERSION 2021.11 [16]. Paired-end raw sequences were trimmed and truncated to perform a quality filter, after which they were merged and chimeras removed by denoising with DADA2 via q2-dada2 script [17]. The alignment of the obtained amplicon sequence variants (ASVs) was performed with mafft [18] and fasttree2 (via q2-phylogeny) was used to construct the phylogeny [19]. Taxonomy was assigned to ASVs using the q2-feature-classifier [20] using as reference the Greengenes 13_8 99% OTUS sequences database [21]. To evaluate microbial diversity, samples were rarefied to 293 sequences per sample. The alpha-diversity metrics Shannon, observed species, and faith_pd and beta-diversity metrics bray_curtis_distance, weighted and unweighted unifrac were estimated using q2-diversity script. Beta diversity results were further analyzed through Principal Coordinate Analysis (PCoA) to represent inter-sample phylogenetic differences in a low-dimensional Euclidean space, using q2-diversity script as well. Differences between the group’s alpha-diversity metrics were assessed using QIIME2 significance tests based on the Kruskal-Wallis test, whereas the group’s beta diversity significance was tested by PERMANOVA that uses the distances between samples of the same group and compares them to the distances between groups [22,23]. Differential relative abundances at the genus level were assessed with DESeq2 [24].
The functional profile of the microbiome was predicted with the Phylogenetic Investigation of Communities by Reconstruction of Unobserved States (PICRUST2) [25]. PICRUST2 considers that phylogenetically related organisms are more likely to have similar gene contents, and based on that concept the algorithm uses several gene family databases. Here the functional profiles of the bacterial communities from fish fed the four different diets were predicted using the MetaCyc pathways database [26]. The evaluation of the pathway’s proportions between the microbial communities from the intestines of Nile tilapia fed the different diets was performed using Statistical Analysis of Metagenomics Profiles [27], considering an FDR-corrected pvalue<0.05 for acceptance of significant differences.
2.4.3. Histology
Formalin-fixed hindgut samples were submitted for semi-quantitative histopathological analysis and complementary morphometric analysis. Samples were distributed in 4 different diet groups containing different protein sources (animal, bacteria, insect, and plant protein). The 4 μm-thick thick sections were stained using haematoxylin and eosin for histopathological analysis. Additionally, PAS-Alcian Blue stained sections were used for morphometric analysis. Semi-quantitative analysis of the most significant histopathological features for liver and intestine samples was performed according to the following criterion including half scores for intermediate intensities: 0 = no incidence; 1 = mild incidence; 2 = moderate incidence; 3 = marked incidence.
Additionally, image analysis software was used on hindgut sections to measure gut health indicators including internal (lumen) diameter (M)/ external diameter (S) ratio, average intestinal fold height and width (average of 3 consecutive intestinal folds), as well as, mucus cell counts.
2.5. Zootechnical performance evaluation criteria
To evaluate growth performance, the following equations were used.
Specific growth rate, SGR (%/day): (Ln FBW – Ln IBW) x 100/days.
Feed conversion ratio, FCR: crude feed intake/weight gain.
Feed intake, FI (%BW/day): (crude feed intake / (IBW+FBW) / 2 / days) x 100.
Protein efficiency ratio, PER: wet weight gain / crude protein intake.
Were:
IBW (g): Initial mean body weight.
FBW (g): Final mean body weight.
NFF: Nutrient content of final fish
NIF: Nutrient content of initial fish
Apparent digestibility coefficients (ADC) of dietary nutrients and energy in the experimental diets were calculated according to NRC (2011):
2.6. Statistical analysis
Zootechnical performance data are presented as the mean of three replicates' standard deviation. Data were subjected to a one-way analysis of variance. When appropriate, means were compared by the Student-Newman-Keuls test. Before ANOVA, values expressed as percentages were subjected to arcsine square root transformation. Chi-square tests were used to compare associations between histological scores and fish diets [28]. Statistical significance was tested at a 0.05 probability level and performed using the IBM SPSS Statistics software (version 21, USA).
Intestine histological traits were further associated with microbiota composition by correlating histology scores with genus relative abundance using the correlation function (name of function) in R [29] to find association patterns that could be modulated by diets. Considering the amino acid profile of each diet and the assessed feed intake throughout the trial, a possible association between this diet feature and microbiota composition and microbiome functionality was further investigated. Here, Pearson correlation between amino acid intake and microbiota relative abundance as well as the abundance of the identified MetaCyc pathways in each diet, considering the ANIMAL diet as the reference for comparison. Both microbiota and microbiome pathways were previously filtered and analysis included features that occur in at least 30% of the samples. Correlations were considered significant when p value<0.01.
3. Results
3.1. Zootechnical performance
Data on the apparent digestibility of experimental diets and zootechnical data after 46 days of feeding is presented in Table 2. The apparent digestibility coefficients (ADC) of protein and lipid were not affected by dietary treatments (P>0.05). However, the energy digestibility of the insect diet was significantly higher than that of the PLANT diet (P<0.05).
No mortality was recorded during the 46 days of experimental feeding. The final body weight (FBW) ranged between 66.4 and 73.0 grams, which in the best-performing treatment represented a 6-fold increase of the initial body weight. The specific growth rate (SGR) varied between 3.67 and 3.94 %/day. Fish fed the ANIMAL and MICROBIAL diets showed a significantly higher FBW and SGR than those fed the PLANT and INSECT diets (P<0.05). The feed conversion ratio (FCR) ranged between 1.00 and 1.13. Fish fed the PLANT and INSECT diets showed a significantly higher FCR than those fed the ANIMAL diet (P<0.05). Feed intake was not significantly affected by dietary treatments (P>0.05). Fish fed the ANIMAL and MICROBIAL diets showed a significantly higher protein efficiency ratio (PER) than those fed the PLANT and INSECT diets (P<0.05).
The whole-body composition of fish was not affected by dietary treatments (data presented in Appendix A Table S2). However, there were significant changes in whole-body nutrient retention (expressed as % of nutrient intake) (Table 3). Fish fed the ANIMAL diet showed significantly higher protein retention than those fed the INSECT diet (P<0.05). Fish fed the ANIMAL diet showed a significantly higher lipid retention than those fed all other diets (P<0.05), while fish fed the PLANT and MICROBIAL diets showed also a significantly higher lipid retention than those fed the INSECT diet (P<0.05). Fish fed the ANIMAL diet showed a significantly higher energy retention than those fed all other diets (P<0.05), while fish fed the MICROBIAL diet showed also a significantly higher energy retention than those fed the INSECT diet (P<0.05).
3.2. Histology
Hindgut sections presented lymphocyte infiltrates within mucosa and lamina propria (LP). Additionally, mucosa presented variable impact of intraepithelial degenerated forms compatible with degenerating enterocytes, as well as, variable presence of well-defined supranuclear vacuoles (SNV). LP presented with increased thickness, mostly affecting the distal end of intestinal folds. Intestinal submucosa (SM) presented with variable mixed cellular infiltrate with a predominance of lymphocytes and eosinophilic granular cells (EGC) and limited impact of congested blood vessels. Average scores for each group of main histopathological features are summarized in Table 4. Although a high total score in ANIMAL fed fish, no difference was observed in the histopathological parameters analyzed. Average morphometric measurements and mucus counts are presented in Table 5. No statistical difference was also found when analyzing differential mucus cell counts, submucosa/mucosa ratio, and villi height.
3.3. Microbiome
3.3.1. Descriptive microbiome results
A total of 36 samples were analyzed resulting in 2,131,845 counts and 5,248 features (OTUs). After filtering analysis and non-chimeric sequences removed a total of 2,623 features were further analyzed until genus level. DADA2 stats summary is presented in a supplementary table (Table S3).
The first set of analyses examined the impact of diet on the modulation of microbial abundance in tilapia gut after fed with diets containing different protein sources using classical microbiome analysis. Relative abundance of tilapia´s intestine at the phylum level shows that around 90% of the abundance is comprised of the phyla Bacteroidetes, Fusobacteria, and Proteobacteria together (Appendix A supplementary Figure S1). From this data, Proteobacteria resulted in the highest abundance (p<0.05) in fish fed ANIMAL (29.43%) when compared to other groups (14-16%). This phylum decreased its abundance in the intestine when tilapia were fed diets containing alternative protein sources. When we analyze the abundance at the genus level, it can be seen that by far the greatest abundance (41-52%) is comprised of Cetobacterium on all treatments (Figure 2). A high abundance of genera (19 in total) from the Proteobacteria phylum can be observed in addition to a great abundance of Paludibacter and Bacteriodales in intestines of tilapia fed diets with different protein sources (PLANT, MICROBIAL, and INSECT).
This trend of genus differences was confirmed after DeSeq2 analysis. Figure 3 shows the genus that has differential abundance among groups. In this case, the genus Paludibacter was more abundant in tilapia´s gut when fed MICROBIAL and PLANT diets when compared to other groups. PLANT diet led to and higher abundance of Novosphigobium and Laucobacter when compared to other groups. On the other hand, Cetobacterium was lower in ANIMAL-fed tilapia when compared to other groups.
Community richness was assessed using alpha diversity parameters which shows general quantitative measurements (e.g., Shannon and observed features) and quantitative measure incorporates phylogenetic relationships between the features (e.g., faith_pd) (Table 6). Despite abundance differences shown previously, no statistical difference was observed in the richness of abundance in tilapia fed different diets after the Kruscall-Wallis test. The p-values of these tests are shown in Appendix A (supplementary Table S4).
Beta diversity instead represents the degree to which each sample differs from one another based on species abundance. The principal component analysis (PCA) plot shows (Figure 4) the overlapping of samples in all treatments and does not reveal differences in diversity or clear clusters grouping similar abundances. In addition, PERMANOVA pairwise statistical analysis did not reveal any statistical differences among groups for both weighted Unifrac (counting the abundance in each sample) and unweighted Unifrac (diversity of the samples without evaluating the abundance) (Table S5).
When assessing the most correlated microbial genera and species with amino acid intake in each diet (Figure 5 and Figure 6) the majority of the microbial groups were groups with low abundance. The exceptions were Pludibacter sp., Agrobacterium sp., and Propionibacterium acnes. Some patterns were observed according to the diet fish had. For example, Pirellula sp. abundance increases with the increase in intake of amino acids (Leu, Lys, Thr, Val, Met, Cys) but only in fish fed INSECT diet. The same group increased abundance when fish fed the PLANT diet ingested less alanine and glycine. Other examples were Flavisolibacter sp., Roseococcus sp., and Tatlockia sp. which increased abundance when the intake of some amino acids was reduced but only in fish fed PLANT diet. The latter was also modulated by the intake increase in non-essential amino acids Glx, Pro, and Ser in the PLANT diet.
Arginine and tyrosine intake seems to have a stronger effect on modulating microbiota in fish fed diets with alternative proteins, and PLANT and INSECT diets seem to have a higher impact on the modulation of the selected taxonomical groups.
3.3.2. Prediction analysis and correlations
Among the pathways that were identified through the functional prediction analysis, we focused on the most directly related to amino acids and gut responses. These were amine and polyamine biosynthesis and degradation pathways, the amino acids biosynthesis and degradation pathways, and the fermentation pathways. Here, to assess a possible effect of amino acid in fish gut microbiota predicted functionality, a correlation was performed (Figure 7 and Figure 8) considering the AA intake from the different diets. Microbiota amine and polyamine biosynthesis pathways abundance was reduced when fish amino acid intake was higher in the INSECT diet. Amine and polyamine degradation pathways are modulated in a different manner depending on diets. Here, reduction of intake of Arg, His, and Lys in the PLANT diet group correlated with an increased abundance of creatinine degradation pathway. On the other hand, increases in Leu, Tyr, and Glx intake are strongly related to a reduction of the abundance of the 4-aminobutanoate degradation pathway (Supplementary Table S6).
As expected, amino acid biosynthesis pathways abundance is modulated by alterations in amino acid intake, and interestingly, it seems to happen more frequently in the MICROBIAL diet group (Figure 7 and Figure 8). A reduction in His intake relates to the increase of the biosynthesis of isoleucine, lysine, ornithine, and histidine biosynthesis pathways but only in fish fed the MICROBIAL diet despite the same intake reduction is observed when fish are fed the INSECT diet. On the other hand, an increase in Met intake in fish fed MICROBIAL diet relates to the increase of isoleucine, lysine, ornithine, histidine, and tryptophane biosynthesis pathways abundance but also with a decrease in the methionine one. However, when the Met intake decreases in fish fed INSECT diet there is an increase in arginine and methionine biosynthesis and a strong reduction in lysine biosynthesis pathway.
In diet MICROBIAL, the intake of Thr was considerably higher when compared with the ANIMAL diet, and this relates to a reduction in amine and polyamine degradation and an increase in amino acid biosynthesis. The latter was loaded by an increase in isoleucine, lysine, ornithine, histidine, and tryptophan biosynthesis pathways and a reduction in methionine biosynthesis pathway. As seen for instance with Met intake increase with alternative diets, the predicted response of the microbiome is strongly correlated in a differential manner depending on the core protein of the diet more than the amino acid alone. The same was observed regarding the predicted modulation of fermentation pathways. As an example, an increase in leucine uptake was correlated with an increase in fermentation pathways responsible for fermenting pyruvate into butanoate and propanoate in fish fed PLANT diet, whereas in fish fed INSECT diet it was correlated with a reduction of glycerol degradation to butanol (Figure 7 and Supplementary Table S6).
4. Discussion
Nile tilapia feeds are generally characterized by moderate crude protein levels (28 to 36%), derived mostly from defatted plant oilseed meals and low levels of fishmeal and/or land-animal processed by-products meals (e.g., poultry meal). In line with the current drive towards the use of new sustainable and economically viable ingredients, to alleviate the dependency on fishmeal, several studies have assessed the use of emergent protein sources in Nile tilapia feeds [30]. Most studies on this topic, have focused on the impact of such formulation changes on growth performance criteria, but very few investigated the effects of protein sources on intestinal health criteria, such as microbiota or mucosal integrity. The relationship between dietary protein quality, namely variations in dietary amino acid supply, and the intestinal microbiota has gone largely unexplored. Emerging evidence suggests that dietary protein supply, both quantitative and qualitative, strongly impacts intestinal microbiota composition and function and that protein-microbiota interactions can have critical impacts on host health [31]. In this context, the current study intends to contribute to a better understanding of the mechanisms underlying the modulation of gut morphology and microbiome in Nile tilapia juveniles fed various dietary protein sources.
When trying to vary the dietary protein quality under practical formulations, we often rely on the use of ingredients of various origins. In our study, fish fed the commercial-like diet, with 30% of the total crude protein supply provided by fishmeal and poultry meal served as control (ANIMAL). While maintaining isoproteic levels among all diets, these 30% of the crude protein supply derived from animal protein sources, were replaced by an equivalent protein supply derived from vegetables (PLANT), microbial biomasses (MICROBIAL), and insect meal (INSECT). The remaining 70% of the crude protein supply was kept fairly constant among all diets. The adoption of this formulation design tries to minimize changes in nutritional variables. A comparison of formulas differing on protein quality implies a trade-off between guaranteeing variable, but adequate, protein profiles (i.e., amino acid), although without disregarding other nutritional features of a given ingredient. For instance, the inclusion of insect meal, besides altering the amino acid profile, will inevitably lead to a higher dietary chitin level.
Overall, tilapia fed the ANIMAL and MICROBIAL diets showed a significantly higher growth (FBW and SGR) and protein efficiency ratio (PER) than those fed the PLANT and INSECT diets. Moreover, tilapia fed the PLANT and INSECT diets showed a significantly higher FCR than those fed the ANIMAL diet. While the whole-body composition of fish was not affected by dietary treatments, tilapia fed the ANIMAL diet showed the highest whole-body retention of protein, lipids and energy. Prior studies support our findings that microbial biomasses are adequate protein sources for tilapia, without any detrimental effects on zootechnical performance [32]. In contrast to our findings, previous studies have shown insect meals as good alternative protein sources in several fish species, including tilapia [33,34,35]. It is also worth pointing out, that the differences found on the zootechnical performance criteria could not be directly associated with changes in the apparent digestibility of nutrients nor to the histomorphological features analyzed in tilapia hindgut (e.g., villi length, villi height, mucus cell types), which were similar among dietary treatments.
Available literature data highlights the importance of microbiota in the health, performance, and various physiological functions of fish. The intestinal microbiota affects the nutritional metabolism, immunity, and disease resistance of the fish, while the host regulates the intestinal microbiota in a reciprocal way through both immune and non-immune factors. Criteria such as diet and environmental conditions are recognized to play a key role in intestinal microbiota in fish and terrestrial animals [36,37]. At the phylum level, and for all dietary treatments, representatives of Bacteroidetes, Fusobacteria, and Proteobacteria were the main constituents of the microbial community, which is in agreement with previous studies on the characterization of intestinal microbiota in Nile tilapia [38,39,40,41]. The replacement of animal proteins (fishmeal and poultry meal) with the various alternative protein sources resulted in intestinal microbiota modulation at the phylum level. In comparison to PLANT, MICROBIAL, and INSECT treatments, fish fed the ANIMAL diet showed a lower abundance of Bacteroidetes and a higher abundance of Proteobacteria. This decrease in Proteobacteria abundance is an interesting feature because its swift increase in the gut has been associated with dysbiosis in mammals [42], and many genera of this group of bacteria can be pathogenic in fish [43]. Although assessed by a semi-quantitative approach, and without reaching a statistical significance, it is interesting to note that fish fed the ANIMAL diet presented the highest intestinal histopathological score. However, we should remember that Proteobacteria are one of the main representatives of commensal fish gut microbiome and no definitive conclusions can be made on the impact of such change.
At the genus level, the greatest abundance (41-52%) is comprised of Cetobacterium on all treatments. Although Cetobacterium was lower in fish fed the ANIMAL, this genus is commonly present in freshwater fish microbiota [38,41,44] and it is known to have a high capacity to produce vitamin B12 and other compounds such as organic acids and enzymes [45]. In relation to the ANIMAL treatment, we observed a decrease in the abundance of several genus species within the Proteobacteria phylum and an increase in the genus Paludibacter and family Bacteriodales within the Bacteroidetes. The genus Paludibacter was more abundant in tilapia´s gut fed MICROBIAL and PLANT diets when compared to other groups. Paludibacter sp. and other Bacteroides from the order Bacteroidales are anaerobic bacteria that have been associated with the degradation of carbohydrates (oligofructose) and produce propionate [46,47]. Tilapia fed diets supplemented with a carbohydrate-degrading enzyme, such as xylanase, presented an increase of Paludibacter in their intestinal tract [48]. Additionally, an increase of the genus Paludibacter was found in the intestinal tract of Senegalese sole with a 5% dietary supplementation of Ulva, a carbohydrate-rich macroalgae. The rise in Paludibacter in tilapia fed the PLANT diet may therefore be associated with a higher intake of certain carbohydrate fractions, derived from soybean meal and corn gluten meal. However, this same hypothesis does not hold true for the enhanced Paludibacter levels found in tilapia fed the MICROBIAL diet. Nevertheless, a recent study with rainbow trout mentions that being fermentative bacteria, species from the genus Paludibacter, can degrade dead microbial biomass and produce organic alcohols and fatty acid by-products [49]. Still, at the genus level, we found that PLANT fed fish showed a higher abundance of Novosphigobium and Leucobacter when compared to all other groups. The Novosphigobium genus has been generally associated with polycyclic aromatic hydrocarbons (PAHs)-degrading pathways, which does not seem to be a relevant variable in our trial. However, Xie et al. [50] refer that Novosphingobium produces prolyl endopeptidase, which is an enzyme that degrades lignin present in plant substrates. The genus Leucobacter has been mainly associated with detoxifying pathways of chromium compounds. Although often detected in the fish intestine and feces, information on its modulation by dietary factors is extremely scarce. Despite these changes found on microbiome abundance, no differences were found on a wide spectrum of diversity indexes, in tilapia fed the various diets.
In this study, we chose to explore how the variable amino acid (AA) intake impacts the intestinal microbial community in tilapia. It is known that the available AA in the intestine can be used by intestinal bacteria for their own protein synthesis and in catabolic reactions releasing in the intestinal lumen numerous metabolites such as ammonia, hydrogen sulfide, polyamines, phenolic and indolic compounds. In a recent review, Beaumont et al [5] consider the effects of nourishing the gut microbiota with amino acids and explores the effects of the “aminobiotics”, a new term in functional nutrition. It is worth mentioning, that in our study, apart from Paludibacter sp., Agrobacterium sp. and Propionibacterium acnes, the most correlated microbiota had low abundance. Lower abundance taxa are normally not identified in core microbiomes; however, studies have shown a strong impact on the host’s health [44,51]. As an example, in invertebrate animals, such as termites, low abundant microorganisms shift with dietary factors and drive the whole microbial community leading to a higher resistance [52], whereas in humans several keystone low-abundance microorganisms are pathobionts associated with diseases [53]. How and to what extent fish gut microbiota utilizes available AA is still under study, however in other species such as pigs it is known that AA in the intestine are the main constituents of ileum bacterial protein, with an unlikely AA de novo synthesis [54,55]. The utilization of AA by intestinal bacteria is known to be species-dependent. This has been described in pigs [56,57], and it was evident in the present study where the modulation of AA intake had different outcomes in microbial taxon abundance. Although this can be due to many of the roles of AA in the gut [58], the impact of AA in taxon-specific metabolic pathways modulation might be a core feature and should be further addressed.
Paludibacter genus was found as a highly abundant member in tilapia’s microbial community here reported and, as previously mentioned, its relative abundance increased when fish were fed diets with more microbial and plant proteins, having the latter a strong correlation with the higher intake of leucine and tyrosine. Paludibacter is considered a primary fermentative bacterium that degrades microbial biomass and produces organic alcohols and intermediary products that can have beneficial effects in the gut (e.g. propionate, benzoate, acetate) [49]. Interestingly, when addressing the microbial pathways prediction, the increase in leucine intake in plant protein-based diet was correlated with an increase in the pyruvate fermentation to butanoate and propanoate pathway. If this modulation is linked with Paludibacter abundance shift is unknown, however, it indicates a possible relationship between AA intake and microbial modulation and function with potential positive effects for the host that deserves further studies. In contrast, the low abundant genus Pirellula increases abundance in tilapias fed with all alternative proteins but only correlates with higher AA intake derived from insect protein in diet, such as leucine, methionine, and cysteine. Here, the fermentation pathways were modulated as well, however, it was due to a reduction of the glycerol degradation to butanol. This exemplifies the intricacy of microbial utilization of accessible amino acids and suggests that the reactions are specific to each species, and are probably correlated with the overall source of the ingredient, in addition to the availability of the AA.
Considering the correlation found between microorganisms and AA intake, we observed that Arg, Tyr, Phe, and Ile show a higher modulatory potential. Tyrosine (Tyr) intake, for example, was higher in the PLANT group. It is interesting that despite Tyr being normally associated with inductions of DNA damages and lower mitochondrial respiratory capacity in intestinal epithelial cells [59], a positive correlation with fermentation pathways (pyruvate to butanoate and propanoate) was seen. This might be related to the strong positive correlation between Paludibacter abundance with the action of this taxon counteracting possible negative effects derived from this in the PLANT diet. We also observed a higher input of Thr when fish were fed the MICROBIAL diet, and although no strong correlation was found with a taxonomic group, a reduction of the 4-aminobutanoate degradation was predicted within the amine and polyamine degradation pathways. Threonine has been described as a gut barrier and immunity enhancer amino acid [60] through the production of SCFA and other metabolites. Although dedicated research is required on this topic, it is inevitable to associate the observed good performance in MICROBIAL group with this dramatic difference in Thr intake, which might be related to the several health-promoting functions already attributed to this AA [61]. On the other hand, Cys intake was lower in the MICROBIAL diet group. As for Thr, the different intake in Cys was not correlated with a specific microbial group, however, it was associated with a (predicted) reduction of the microbiome 4-aminobutanoate degradation and the aromatic biogenic amine degradation pathways. 4-aminobutanoate is known for improving growth, digestive performance, and immunocompetence [5]. This effect is linked with a reduction of the detrimental effect of ammonia release in the epithelium [62,63], and might counteract the known negative effect of the Cys degradation by microbiota that releases hydrogen sulfide and potentiates inflammation [64]. The functional prediction of the microbiome is regarded as a valuable instrument for initiating novel perspectives on the impacts of nutritional manipulation in fish. Nevertheless, it is important to note that additional investigation is required to enhance and affirm these impacts, alongside the associations and their connection to a plausible cause-and-effect relationship involving the intake of amino acids, modulation of the microbiome, and the performance of the host.
5. Conclusions
Increasing knowledge about the impact of dietary protein on the composition of the gut microbial population is emerging. Protein is the primary substrate for important beneficial short-chain fatty acids (SCFAs) and harmful putrefactive metabolites (such as ammonia, amines, hydrogen sulfides, phenols, and indoles), which can be produced by the gut microbiota through proteolytic fermentation and may influence host health and contribute to the risk of diseases. This study addressed the effect of different alternative protein sources on Nile tilapia intestinal microbiota, correlating the nutritional inputs of the different diets, in specific, variations on amino acid intake patterns with gut microbial community.
Supplementary Materials
The following are available online at www.mdpi.com/xxx/s1, Figure S1: Percentage of abundance at phylum and genus level for tilapia fed diets containing different protein sources: Animal, insect, Plant and Microbial. Legend represents the most abundant phyla for each treatment., Table S1: Absolute values for amino acid intake per treatment, Table S2: Whole body composition of fish under the dietary treatments., Table S3: DADA2 table output, Table S4: Kruscall-wallis stats, Table S5: Permanova values for weighted and unweighted Unifrac, Table S6: Prediction pathways.
Author Contributions
All co-authors contributed to undertake the current study. More specifically: Conceptualization, G.dV.P. and J.D.; methodology, G.dV.P., ATG and J.D.; trial and sampling, C.T, J.C. and P.R. ; formal analysis, ATG, G.dV.P.; investigation, G.dV.P., ATG and J.D.; writing—original draft preparation, G.dV.P. ATG and J.D.; writing—review and editing, G.dV.P., ATG and J.D.; funding acquisition, G.dV.P. and J.D. All authors have read and agreed to the published version of the manuscript.
Funding
This work is part of project 47175_FICA, supported by Portugal and the European Union through FEDER/ERDF, COMPETE 2020 and CRESC Algarve 2020, in the framework of Portugal 2020.
Institutional Review Board Statement
The study was conducted according to the guidelines of the DGAV (Direção Geral de Alimentação e Veterinária), Portugal, considering that the conditions of animal welfare and application of the policy of the 3Rs of protection of animals used for scientific purposes are fulfilled, in accordance with Decree-Law n.º 113/2013 of 7 August and Dispatch No. 2880/2015 of the General Director of Food and Veterinary Medicine.
Data Availability Statement
Not applicable.
Acknowledgments
We acknowledge the support of C.T and J.C for undertaking the trial and sampling of the present work.
Conflicts of Interest
The authors declare no conflict of interest.
Appendix A
This appendix provides the supplementary data.
References
- Lin, R.; Liu, W.; Piao, M.; et al. A review of the relationship between the gut microbiota and amino acid metabolism. Amino Acids 2017, 49, 2083–2090. [Google Scholar] [CrossRef]
- Yang, Z.; Liao, S. Physiological Effects of Dietary Amino Acids on Gut Health and Functions of Swine. Front. Vet. Sci 2019, 6, 2297–1769. [Google Scholar] [CrossRef]
- Zhao, J.; Zhang, X.; Liu, H.; Brown; M. A.; Qiao S. Dietary Protein and Gut Microbiota Composition and Function. Curr. Protein Pept. Sci. 2019, 20, 145–154. [Google Scholar] [CrossRef] [PubMed]
- Dawood, M. A, Nutritional immunity of fish intestines: important insights for sustainable aquaculture. Rev. Aquacult. 2021, 13, 642–663. [Google Scholar] [CrossRef]
- Beaumont, M.; Blachier, F. Amino Acids in Intestinal Physiology and Health. In Amino Acids in Nutrition and Health. Advances in Experimental Medicine and Biology. Wu, G., Eds.; Publisher: Springer, Cham., Switzerland, 2020; Volume 1265. [Google Scholar] [CrossRef]
- Food and Agriculture Organization of the United Nations (FAO). Top 10 species groups in global aquaculture 2017. Available online: https://www.fao.org/3/ca5224en/ca5224en.pdf (accessed on 15/11/2022).
- Tippayadara, N.; Dawood, M.A.O.; Krutmuang, P.; Hoseinifar, S.H.; Doan, H.V.; Paolucci, M. Replacement of Fish Meal by Black Soldier Fly (Hermetia illucens) Larvae Meal: Effects on Growth, Haematology, and Skin Mucus Immunity of Nile Tilapia, Oreochromis niloticus. Animals 2021, 11, 193. [Google Scholar] [CrossRef]
- Silva, D.M.; Valente, L.M.P.; Sousa-Pinto, I.; et al. Evaluation of IMTA-produced seaweeds (Gracilaria, Porphyra, and Ulva) as dietary ingredients in Nile tilapia, Oreochromis niloticus L., juveniles. Effects on growth performance and gut histology. J Appl Phycol 2015, 27, 1671–1680. [CrossRef]
- Sarker, P.K.; Kapuscinski, A.R.; McKuin, B.; et al. Microalgae-blend tilapia feed eliminates fishmeal and fish oil, improves growth, and is cost viable. Sci Rep 2020, 10, 19328. [Google Scholar] [CrossRef]
- Yossa, R.; Greiling, A. M.; Basiita, R. K.; Sakala, M. E.; Baumgartner, W. A.; Taylor, A.; Gatlin, D. M. Replacing fishmeal with a single cell protein feedstuff in Nile tilapia Oreochromis niloticus diets. Anim. Feed Sci. and Technol 2021, 281, 115089. [Google Scholar] [CrossRef]
- Chama, M. K. H.; Liang, H.; Huang, D.; Ge, X.; Ren, M.; Zhang, L.; Wu, L.; Ke, J. Methanotroph (Methylococcus capsulatus, Bath) as an alternative protein source for genetically improved farmed tilapia (GIFT: Oreochromis niloticus) and its effect on antioxidants and immune response. Aquac. Reports 2021, 21, 100871. [Google Scholar] [CrossRef]
- Sathishkumar, G. , Felix, N., & Elangovan, P. Effects of dietary protein substitution of fish meal with bioprocessed poultry by-product meal on growth performances, nutrient utilization, whole-body composition and haemato-biochemical responses of GIFT tilapia reared in floating cages. Aquac. Research 2021, 52, 5407–5418. [Google Scholar] [CrossRef]
- Pereira, G. V.; da Cunha, D. G.; Pedreira Mouriño, J. L.; Rodiles, A.; Jaramillo-Torres, A.; Merrifield, D. L. Characterization of microbiota in Arapaima gigas intestine and isolation of potential probiotic bacteria. J. of Appl. Microbiol 2017, 123, 1298–1311. [CrossRef]
- Illumina. 16S Metagenomic Sequencing Library Preparation. Preparing 16S Ribosomal RNA Gene Amplicons for the Illumina MiSeq System. 2013. Available online: https://emea.illumina.com/content/dam/illumina-support/documents/documentation/chemistry_documentation/16s/16s-metagenomic-library-prep-guide-15044223-b.pdf.
- Comeau, A.M.; Douglas, G.M.; Langille, M.G. Microbiome Helper: a Custom and Streamlined Workflow for Microbiome Research. mSystems 2017, 2, e00127–16. [Google Scholar] [CrossRef]
- Bolyen, E.; Rideout, J. R.; Dillon, M. R.; Bokulich, N. A.; Abnet, C. C.; Al-Ghalith, G. A.; Alexander, H.; Alm, E. J.; Arumugam, M.; Asnicar, F.; Bai, Y.; Bisanz, J. E.; Bittinger, K.; Brejnrod, A.; Brislawn, C. J.; Brown, C. T.; Callahan, B. J.; Caraballo-Rodríguez, A. M.; Chase, J.; Cope, E. K.; … Caporaso, J. G. Reproducible, interactive, scalable and extensible microbiome data science using QIIME 2. Nature biotech. 2019, 37, 852–857. [Google Scholar] [CrossRef] [PubMed]
- Callahan, B.; McMurdie, P.; Rosen, M.; et al. DADA2: High-resolution sample inference from Illumina amplicon data. Nat Methods 2016, 13, 581–583. [Google Scholar] [CrossRef] [PubMed]
- Katoh, K.; Misawa, K.; Kuma, K.; Miyata, T. MAFFT: a novel method for rapid multiple sequence alignment based on fast Fourier transform. Nucleic acids res 2002, 30, 3059–3066. [Google Scholar] [CrossRef] [PubMed]
- Price, M.N.; Dehal, P.S.; Arkin, A.P. FastTree 2 – Approximately Maximum-Likelihood Trees for Large Alignments. PLoS ONE 2010, 5, e9490. [Google Scholar] [CrossRef]
- Bokulich, N.A.; Kaehler, B.D.; Rideout, J.R.; et al. Optimizing taxonomic classification of marker-gene amplicon sequences with QIIME 2’s q2-feature-classifier plugin. Microbiome 2018, 6, 90. [Google Scholar] [CrossRef] [PubMed]
- McDonald, D.; Price, M.; Goodrich, J.; et al. An improved Greengenes taxonomy with explicit ranks for ecological and evolutionary analyses of bacteria and archaea. ISME J 2012, 6, 610–618. [Google Scholar] [CrossRef]
- Anderson, M.J.; Walsh, D.C.I. PERMANOVA, ANOSIM, and the Mantel test in the face of heterogeneous dispersions: What null hypothesis are you testing? Ecol. Monogr., 2013, 83, 557-574. [CrossRef]
- Anderson, M.J. Permutational Multivariate Analysis of Variance (PERMANOVA). In Wiley StatsRef: Statistics Reference Online, ed.; Balakrishnan, N., Colton, T., Everitt, B., Piegorsch, W., Ruggeri F., Teugels J.L., 2017. [CrossRef]
- Love, M.I.; Huber, W.; Anders, S. Moderated estimation of fold change and dispersion for RNA-seq data with DESeq2. Genome Biol 2014, 15, 550. [Google Scholar] [CrossRef]
- Douglas, G.M. , Maffei, V.J., Zaneveld, J.R. et al. PICRUSt2 for prediction of metagenome functions. Nat Biotechnol 2020, 38, 685–688. [Google Scholar] [CrossRef]
- Caspi, R.; Billington, R.; Keseler, I. M.; Kothari, A.; Krummenacker, M.; Midford, P. E.; Ong, W. K.; Paley, S.; Subhraveti, P.; Karp, P. D. The MetaCyc database of metabolic pathways and enzymes - a 2019 update. Nucl. acids res 2020, 48, 445–453. [Google Scholar] [CrossRef]
- Parks, D. H.; Tyson, G. W.; Hugenholtz, P.; Beiko, R. G. STAMP: statistical analysis of taxonomic and functional profiles. Bioinfo 2014, 30, 3123–3124. [Google Scholar] [CrossRef]
- Green, J.W.; Springer, T.A.; Saulnier, A.N.; Swintek, J. Statistical analysis of histopathological endpoints. Environ Toxicol Chem, 2014, (33), 1108-1116. 1108. [Google Scholar] [CrossRef]
- R version 4.1.0; R Core Team, 2021.
- Montoya-Camacho, N.; Marquez-Ríos, E.; Castillo-Yáñez, F.J.; Cárdenas López, J.L.; López-Elías, J.A.; Ruíz-Cruz, S.; Jiménez-Ruíz, E.I.; Rivas-Vega, M.E.; Ocaño-Higuera, V.M. Advances in the Use of Alternative Protein Sources for Tilapia Feeding. Rev Aquac 2019, 11, 515–526. [Google Scholar] [CrossRef]
- Bartlett, A.; Kleiner, M. Dietary Protein and the Intestinal Microbiota: An Understudied Relationship. iScience 2022, 25. [Google Scholar] [CrossRef]
- Chama, M.K.H.; Liang, H.; Huang, D.; Ge, X.; Ren, M.; Zhang, L.; Wu, L.; Ke, J. Methanotroph (Methylococcus Capsulatus, Bath) as an Alternative Protein Source for Genetically Improved Farmed Tilapia (GIFT: Oreochromis Niloticus) and Its Effect on Antioxidants and Immune Response. Aquac Rep 2021, 21, 100872. [Google Scholar] [CrossRef]
- Aragão, C.; Gonçalves, A.T.; Costas, B.; Azeredo, R.; Xavier, M.J.; Engrola, S. Alternative Proteins for Fish Diets: Implications beyond Growth. Animals 2022, 12, 1211. [Google Scholar] [CrossRef]
- Basto A, Marques A, Silva A, Sá T, Sousa V, Oliveira MBPP, et al. Nutritional, organoleptic and sensory quality of market-sized European sea bass (Dicentrarchus labrax) fed defatted Tenebrio molitor larvae meal as main protein source. Aquaculture [Internet]. 2023, 566, 739210. [CrossRef]
- Kishawy, A.T.Y.; Mohammed, H.A.; Zaglool, A.W.; Attia, M.S.; Hassan, F.A.M.; Roushdy, E.M.; Ismail, T.A.; Ibrahim, D. Partial Defatted Black Solider Larvae Meal as a Promising Strategy to Replace Fish Meal Protein in Diet for Nile Tilapia (Oreochromis Niloticus): Performance, Expression of Protein and Fat Transporters, and Cytokines Related Genes and Economic Efficiency. Aquaculture 2022, 555, 738195. [Google Scholar] [CrossRef]
- Ghanbari, M.; Kneifel, W.; Domig, K. J. A new view of the fish gut microbiome: Advances from next-generation sequencing. Aquaculture, 2015, 448, 464–475. [CrossRef]
- Naya-Català, F.; do Vale Pereira, G.; Piazzon, M. C.; Fernandes, A. M.; Calduch-Giner, J. A.; Sitjà-Bobadilla, A.; Conceição, L. E. C.; Pérez-Sánchez, J. Cross-Talk Between Intestinal Microbiota and Host Gene Expression in Gilthead Sea Bream (Sparus aurata) Juveniles: Insights in Fish Feeds for Increased Circularity and Resource Utilization. Front Physiol. 2021, 12, 748265. Available online: https://www.frontiersin.org/articles/10.3389/fphys.2021.748265. [CrossRef]
- Standen, B. T.; Rodiles, A.; Peggs, D. L.; Davies, S. J.; Santos, G. A.; Merrifield, D. L. Modulation of the intestinal microbiota and morphology of tilapia, Oreochromis niloticus, following the application of a multi-species probiotic. Appl microbiol biot, 2015, 99, 8403–8417. [CrossRef]
- Chen, J., Li, Q., Tan, C., Xie, L., Yang, X., Zhang, Q., & Deng, X. Effects of enrofloxacin’s exposure on the gut microbiota of Tilapia fish (Oreochromis niloticus). Comp biochem phys D, 2023, 46, 101077. [CrossRef]
- Xia, Y., Yu, E., Lu, M., & Xie, J. Effects of probiotic supplementation on gut microbiota as well as metabolite profiles within Nile tilapia, Oreochromis niloticus. Aquaculture, 2020, 527, 735428. [CrossRef]
- Adeoye, A. A.; Yomla, R.; Jaramillo-Torres, A.; Rodiles, A.; Merrifield, D. L.; Davies, S. J. Combined effects of exogenous enzymes and probiotic on Nile tilapia (Oreochromis niloticus) growth, intestinal morphology and microbiome. Aquaculture, 2016, 463, 61–70. [CrossRef]
- Shin, N.-R.; Whon, T. W.; Bae, J.-W. Proteobacteria: microbial signature of dysbiosis in gut microbiota. Trends biotechnol, 2015, 33, 496–503. [CrossRef]
- Kim, P. S.; Shin, N.-R.; Lee, J.-B.; Kim, M.-S.; Whon, T. W.; Hyun, D.-W.; Yun, J.-H.; Jung, M.-J.; Kim, J. Y.; Bae, J.-W. Host habitat is the major determinant of the gut microbiome of fish. Microbiome, 2021, 9, 166. 9. [CrossRef]
- Medina-Félix, D.; Garibay-Valdez, E.; Vargas-Albores, F.; Martínez-Porchas, M. Fish disease and intestinal microbiota: A close and indivisible relationship. Rev Aquac. 2023, 15 820-839. [CrossRef]
- de Cena, J. A.; Zhang, J.; Deng, D.; Damé-Teixeira, N.; Do, T. (2021). Low-Abundant Microorganisms: The Human Microbiome’s Dark Matter, a Scoping Review. Front cell infect mi, 11. [CrossRef]
- Han, G.; Luong, H.; Vaishnava, S. Low abundance members of the gut microbiome exhibit high immunogenicity. Gut Microbes, 2022, 14, 2104086. [CrossRef]
- Benjamino, J.; Lincoln, S.; Srivastava, R.; Graf, J. Low-abundant bacteria drive compositional changes in the gut microbiota after dietary alteration. Microbiome, 2018, 6, 86. [CrossRef]
- Han, G.; Luong, H.; Vaishnava, S. Low Abundance Members of the Gut Microbiome are Potent Drivers of Immune Cell Education. Research Square. 2021. [Google Scholar] [CrossRef]
- Mahmoud, M.A.A.; Magdy, M. Metabarcoding Profiling of Microbial Diversity Associated with Trout Fish Farming. Sci Rep 2021, 11, 421. [Google Scholar] [CrossRef] [PubMed]
- Xie, M.; Zhang, S.; Xu, L.; Wu, Z.; Yuan, J.; Chen, X. Comparison of the Intestinal Microbiota During the Different Growth Stages of Red Swamp Crayfish (Procambarus clarkii). Front Microbiol 2021, 12. [Google Scholar] [CrossRef] [PubMed]
- Tsuchiya, C.; Sakata, T.; Sugita, H. Novel ecological niche of Cetobacterium somerae, an anaerobic bacterium in the intestinal tracts of freshwater fish. Lett appl microbiol, 2008, 46, 43–48. [CrossRef]
- de Cena, J. A.; Zhang, J.; Deng, D.; Damé-Teixeira, N.; Do, T. (2021). Low-Abundant Microorganisms: The Human Microbiome’s Dark Matter, a Scoping Review. Front cell infect mi, 11. [CrossRef]
- Han, G.; Luong, H.; Vaishnava, S. Low abundance members of the gut microbiome exhibit high immunogenicity. Gut Microbes, 2022, 14, 2104086. [CrossRef]
- Sadsad Reese, A.T. , Pereira, F. C., Schintlmeister, A. et al. Microbial nitrogen limitation in the mammalian large intestine. Nat Microbiol 2018, 3, 1441–1450. [Google Scholar] [CrossRef]
- Benjamino, J.; Lincoln, S.; Srivastava, R.; Graf, J. Low-abundant bacteria drive compositional changes in the gut microbiota after dietary alteration. Microbiome, 2018, 6, 86. [CrossRef]
- Han, G.; Luong, H.; Vaishnava, S. Low Abundance Members of the Gut Microbiome are Potent Drivers of Immune Cell Education. Research Square. 2021. [Google Scholar] [CrossRef]
- Libao-Mercado, A.J., Zhu, C.L., Cant, J.P., Lapierre, H., Thibault, J.N., Sève, B., Fuller, M.F., de Lange, C.F. Dietary and endogenous amino acids are the main contributors to microbial protein in the upper gut of normally nourished pigs. J Nutr. 2009, 139, 1088–94. [CrossRef]
- Dai ZL, Zhang J, Wu G, Zhu WY. Utilization of amino acids by bacteria from the pig small intestine. Amino Acids. 2010, 39, 1201–15. [CrossRef]
- Dai ZL, Li XL, Xi PB, Zhang J, Wu G, Zhu WY. Metabolism of select amino acids in bacteria from the pig small intestine. Amino Acids. 2012, 42, 1597–608. [CrossRef]
- Pifer, R., Russell, R. M., Kumar, A., Curtis, M. M., Sperandio, V. Redox, amino acid, and fatty acid metabolism intersect with bacterial virulence in the gut. Proceedings of the National Academy of Sciences, 2018, 201813451. [CrossRef]
- Blachier, F., Andriamihaja, M. Effects of the L-tyrosine-derived bacterial metabolite p-cresol on colonic and peripheral cells. Amino Acids. 2022, 54, 325–338. 54. [CrossRef]
- Farris, N.W.; Hamidoghli, A.; Bae, J.; Won, S.; Choi, W.; Biró, J.; Lee, S.; Bai, S.C. Dietary Supplementation with γ-Aminobutyric Acid Improves Growth, Digestive Enzyme Activity, Non-Specific Immunity and Disease Resistance against Streptococcus iniae in Juvenile Olive Flounder, Paralichthys olivaceus. Animals 2022, 12, 248. [Google Scholar] [CrossRef] [PubMed]
- Andriamihaja, M.; Davila, A.M.; Eklou-Lawson, M.; Petit, N.; Delpal, S.; Allek, F.; Blais, A; Delteil, C.; Tomé, D.; Blachier, F. Colon luminal content and epithelial cell morphology are markedly modified in rats fed with a high-protein diet. Am J Physiol Gastrointest Liver Physiol. 2010, 299, G1030-7. [CrossRef]
- Villodre Tudela, C.; Boudry, C.; Stumpff, F.; Aschenbach, J.R.; Vahjen, W.; Zentek, J.; Pieper, R. Down-regulation of monocarboxylate transporter 1 (MCT1) gene expression in the colon of piglets is linked to bacterial protein fermentation and pro-inflammatory cytokine-mediated signalling. Br J Nutr. 2015, 113, 610–617. [Google Scholar] [CrossRef] [PubMed]
- Blachier, F.; Beaumont, M.; Kim, E. Cysteine-derived hydrogen sulfide and gut health: a matter of endogenous or bacterial origin. Curr Opin Clin Nutr Metab Care. 2019, 22, 68–75. [Google Scholar] [CrossRef] [PubMed]
Figure 1.
Intake of essential amino acids (EAA; above) and non-essential amino acids (NEEA; below) profile of experimental diets, expressed as a percentage relative to the amino acid composition of the ANIMAL diet.
Figure 1.
Intake of essential amino acids (EAA; above) and non-essential amino acids (NEEA; below) profile of experimental diets, expressed as a percentage relative to the amino acid composition of the ANIMAL diet.
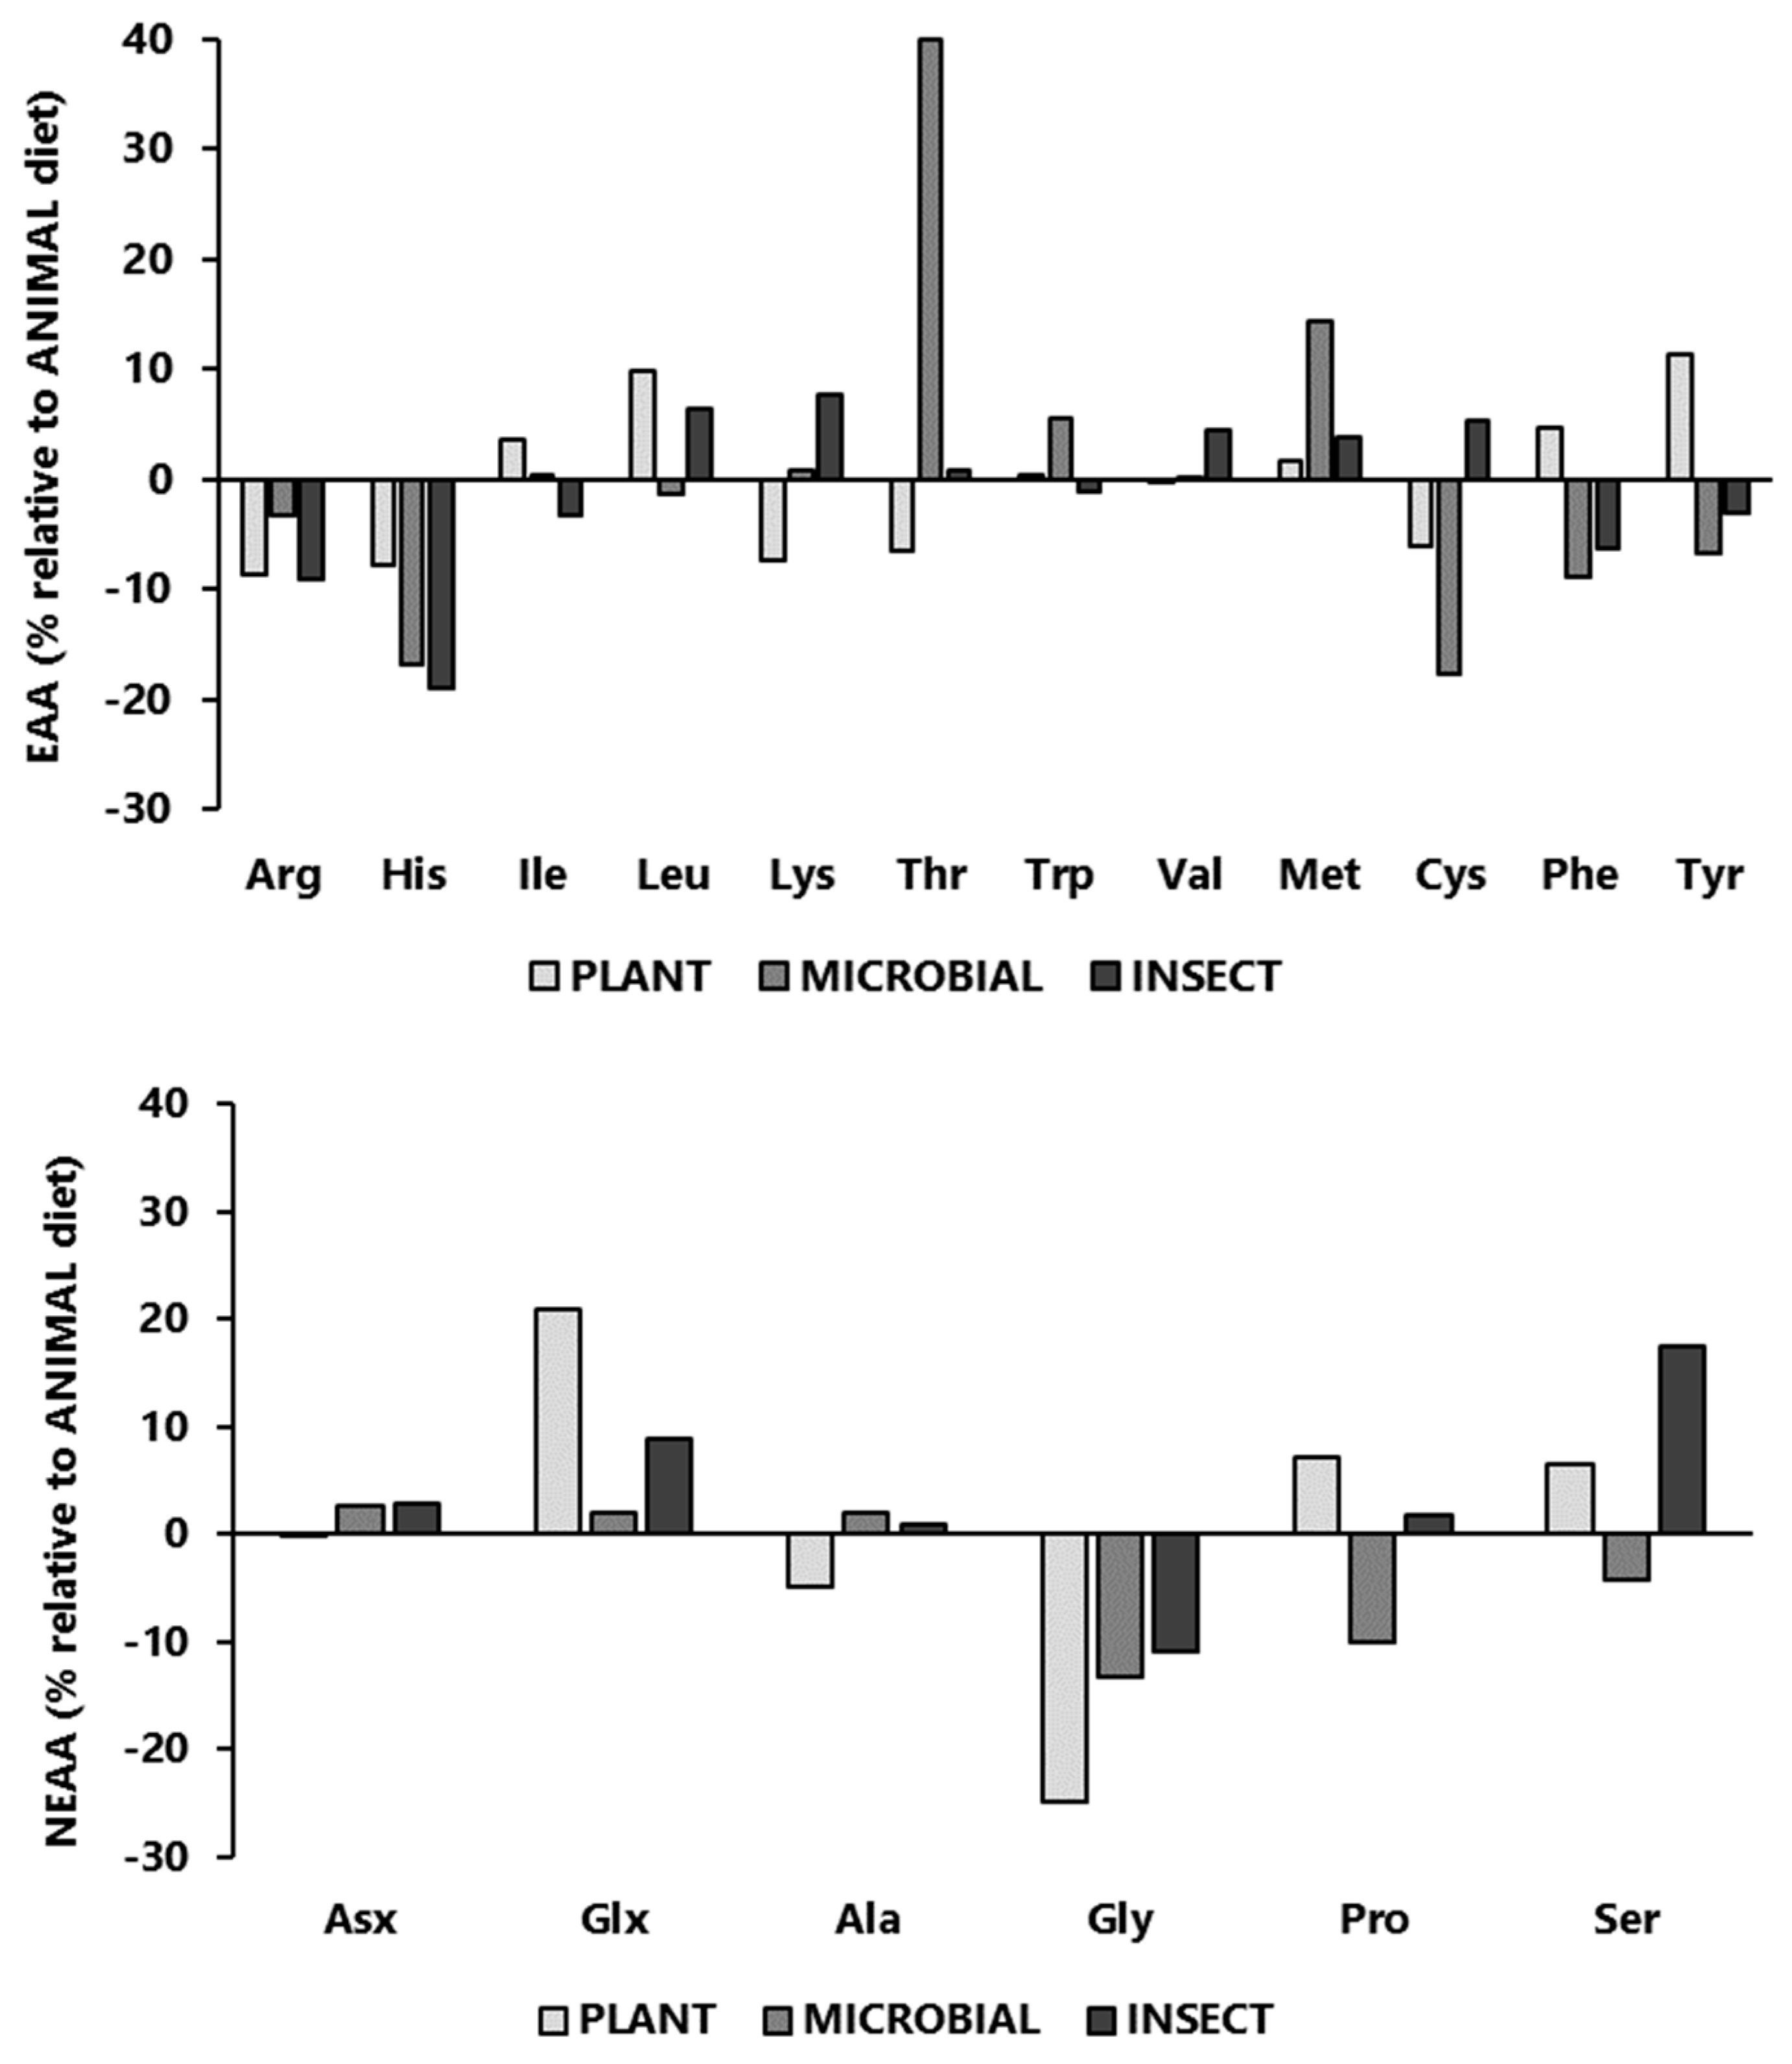
Figure 2.
Percentage of relative abundance at and genus level for tilapia fed diets containing different protein sources. Legend represents the most abundant genus for each treatment. Others represent the genera with abundance <0.3% in at least one treatment.
Figure 2.
Percentage of relative abundance at and genus level for tilapia fed diets containing different protein sources. Legend represents the most abundant genus for each treatment. Others represent the genera with abundance <0.3% in at least one treatment.
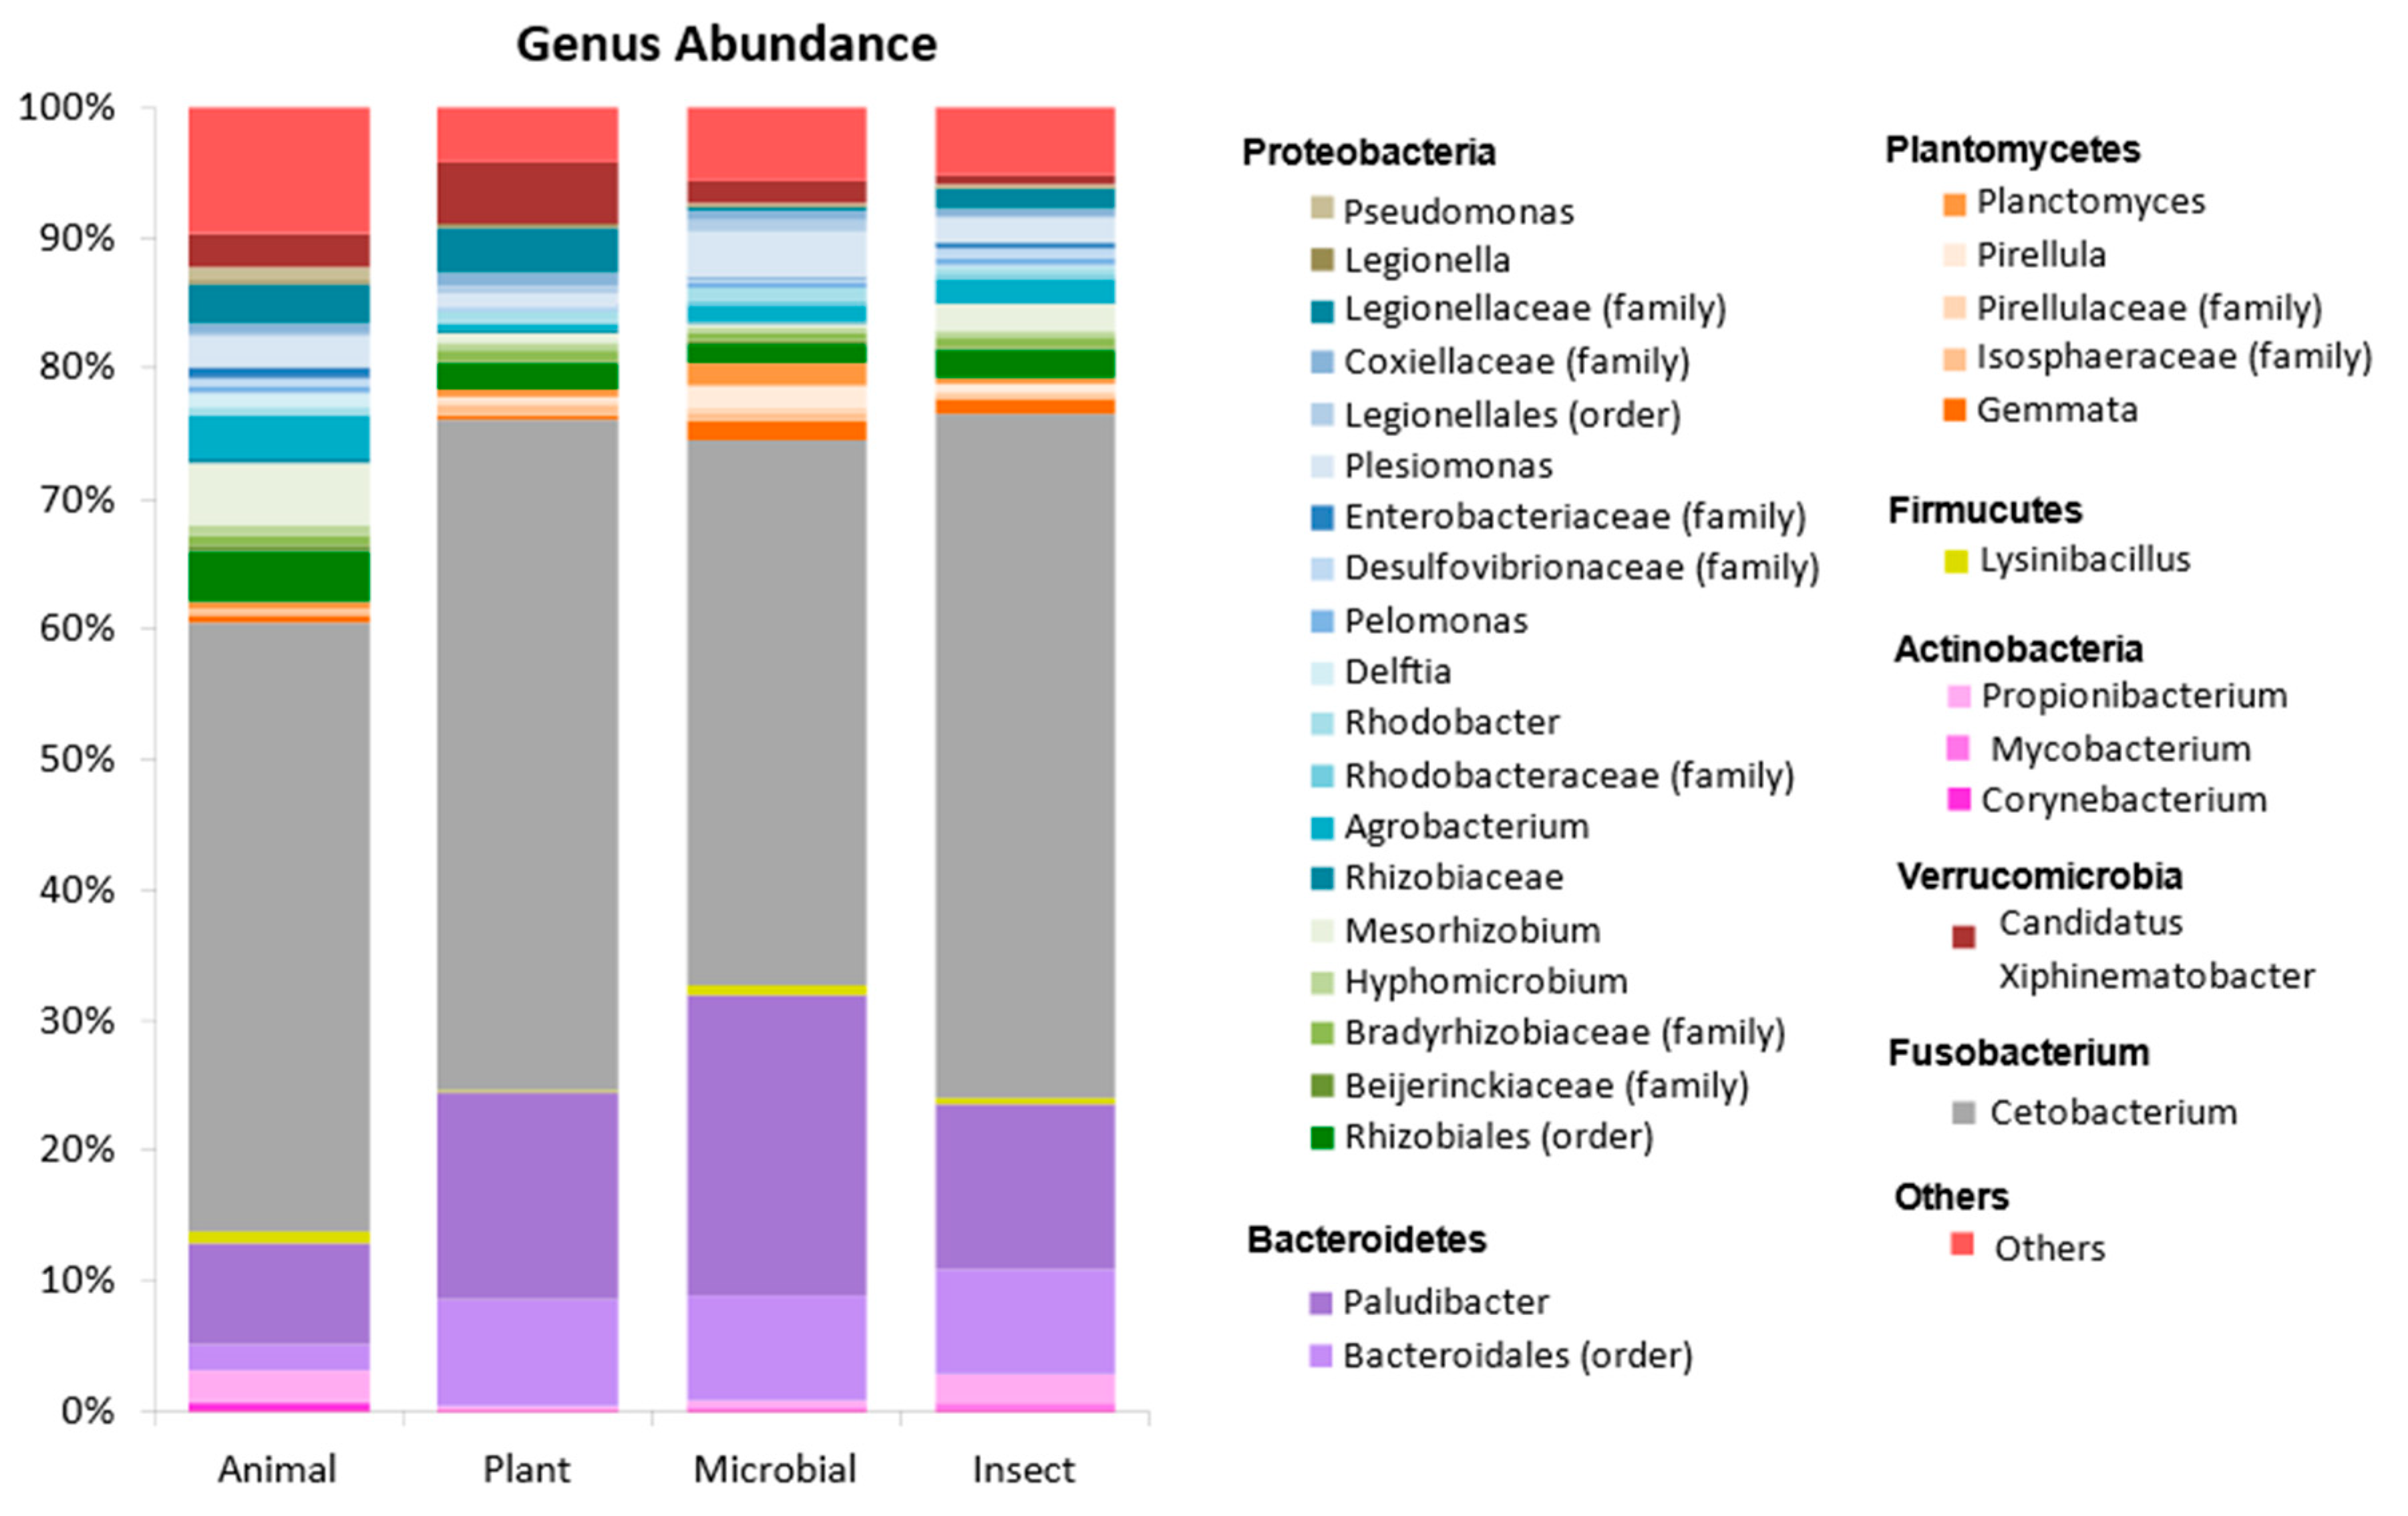
Figure 3.
Genera with differential abundance among the experimental groups based on DeSeq2 (adjusted P value < 0.05).
Figure 3.
Genera with differential abundance among the experimental groups based on DeSeq2 (adjusted P value < 0.05).
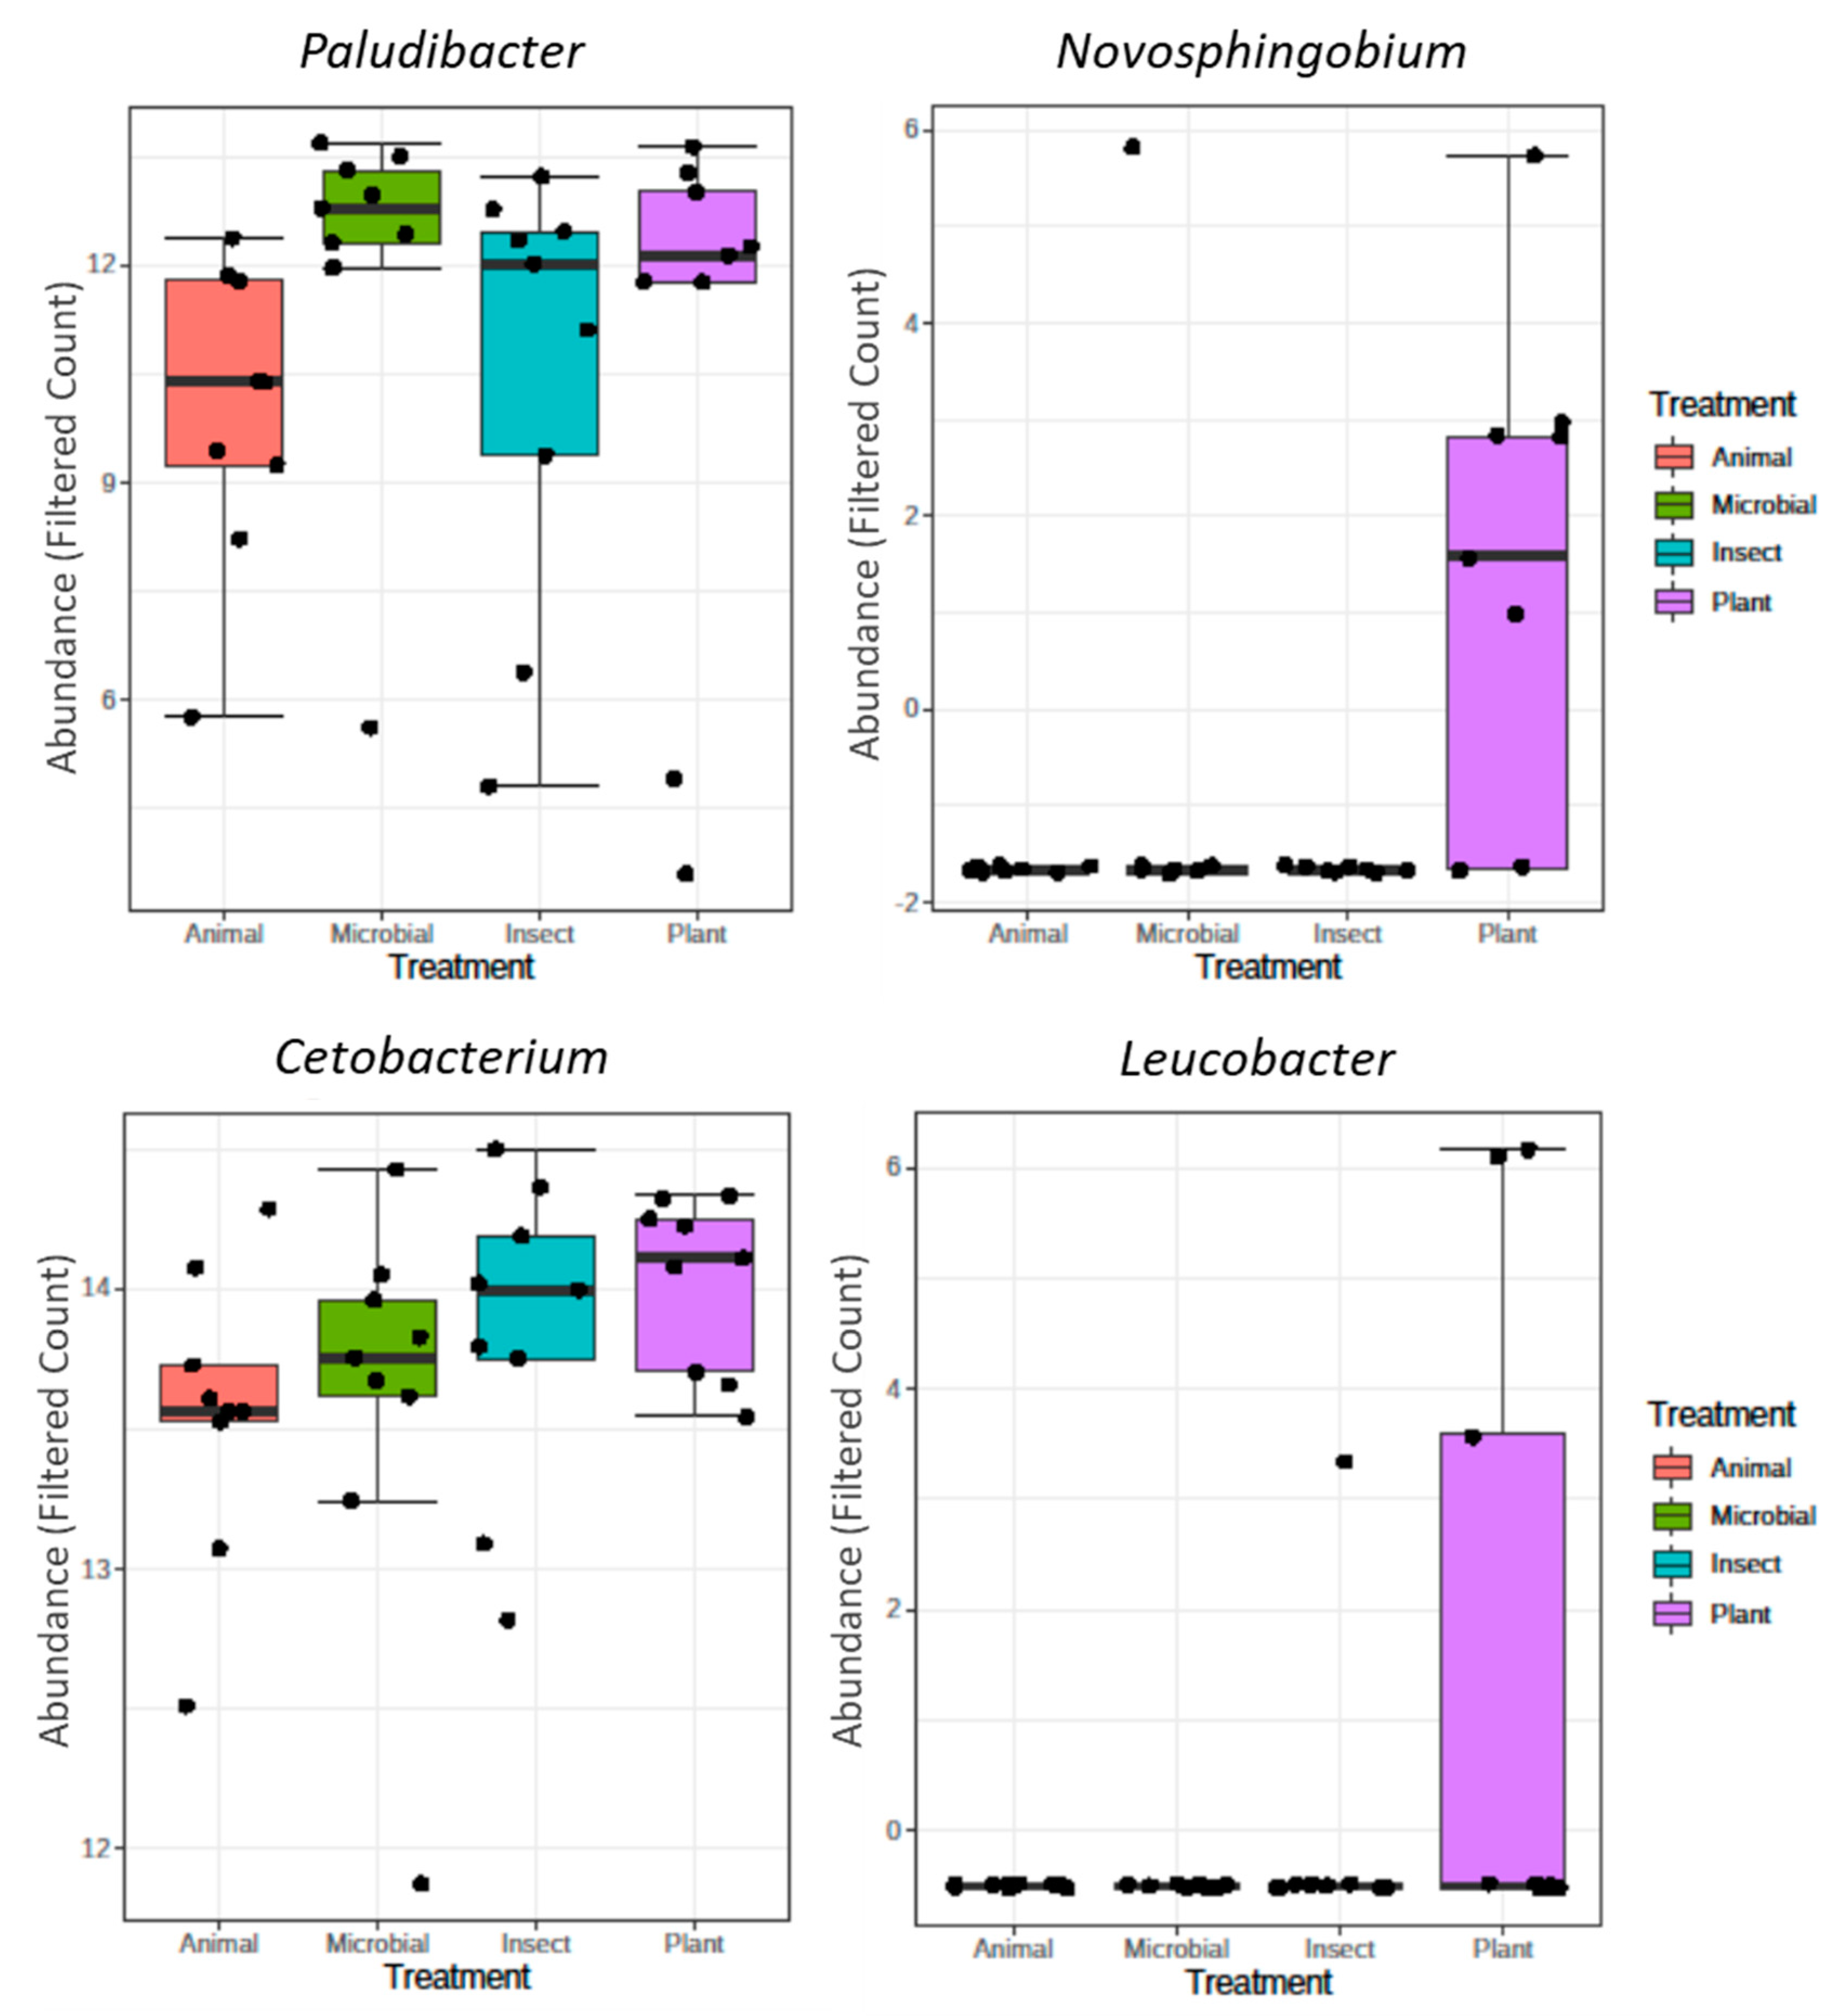
Figure 4.
Score plots of the PCA at genus level showing the distribution of abundance among samples of fish intestine fed diets containing different protein sources: Animal, Insect, Plant and Microbial.
Figure 4.
Score plots of the PCA at genus level showing the distribution of abundance among samples of fish intestine fed diets containing different protein sources: Animal, Insect, Plant and Microbial.
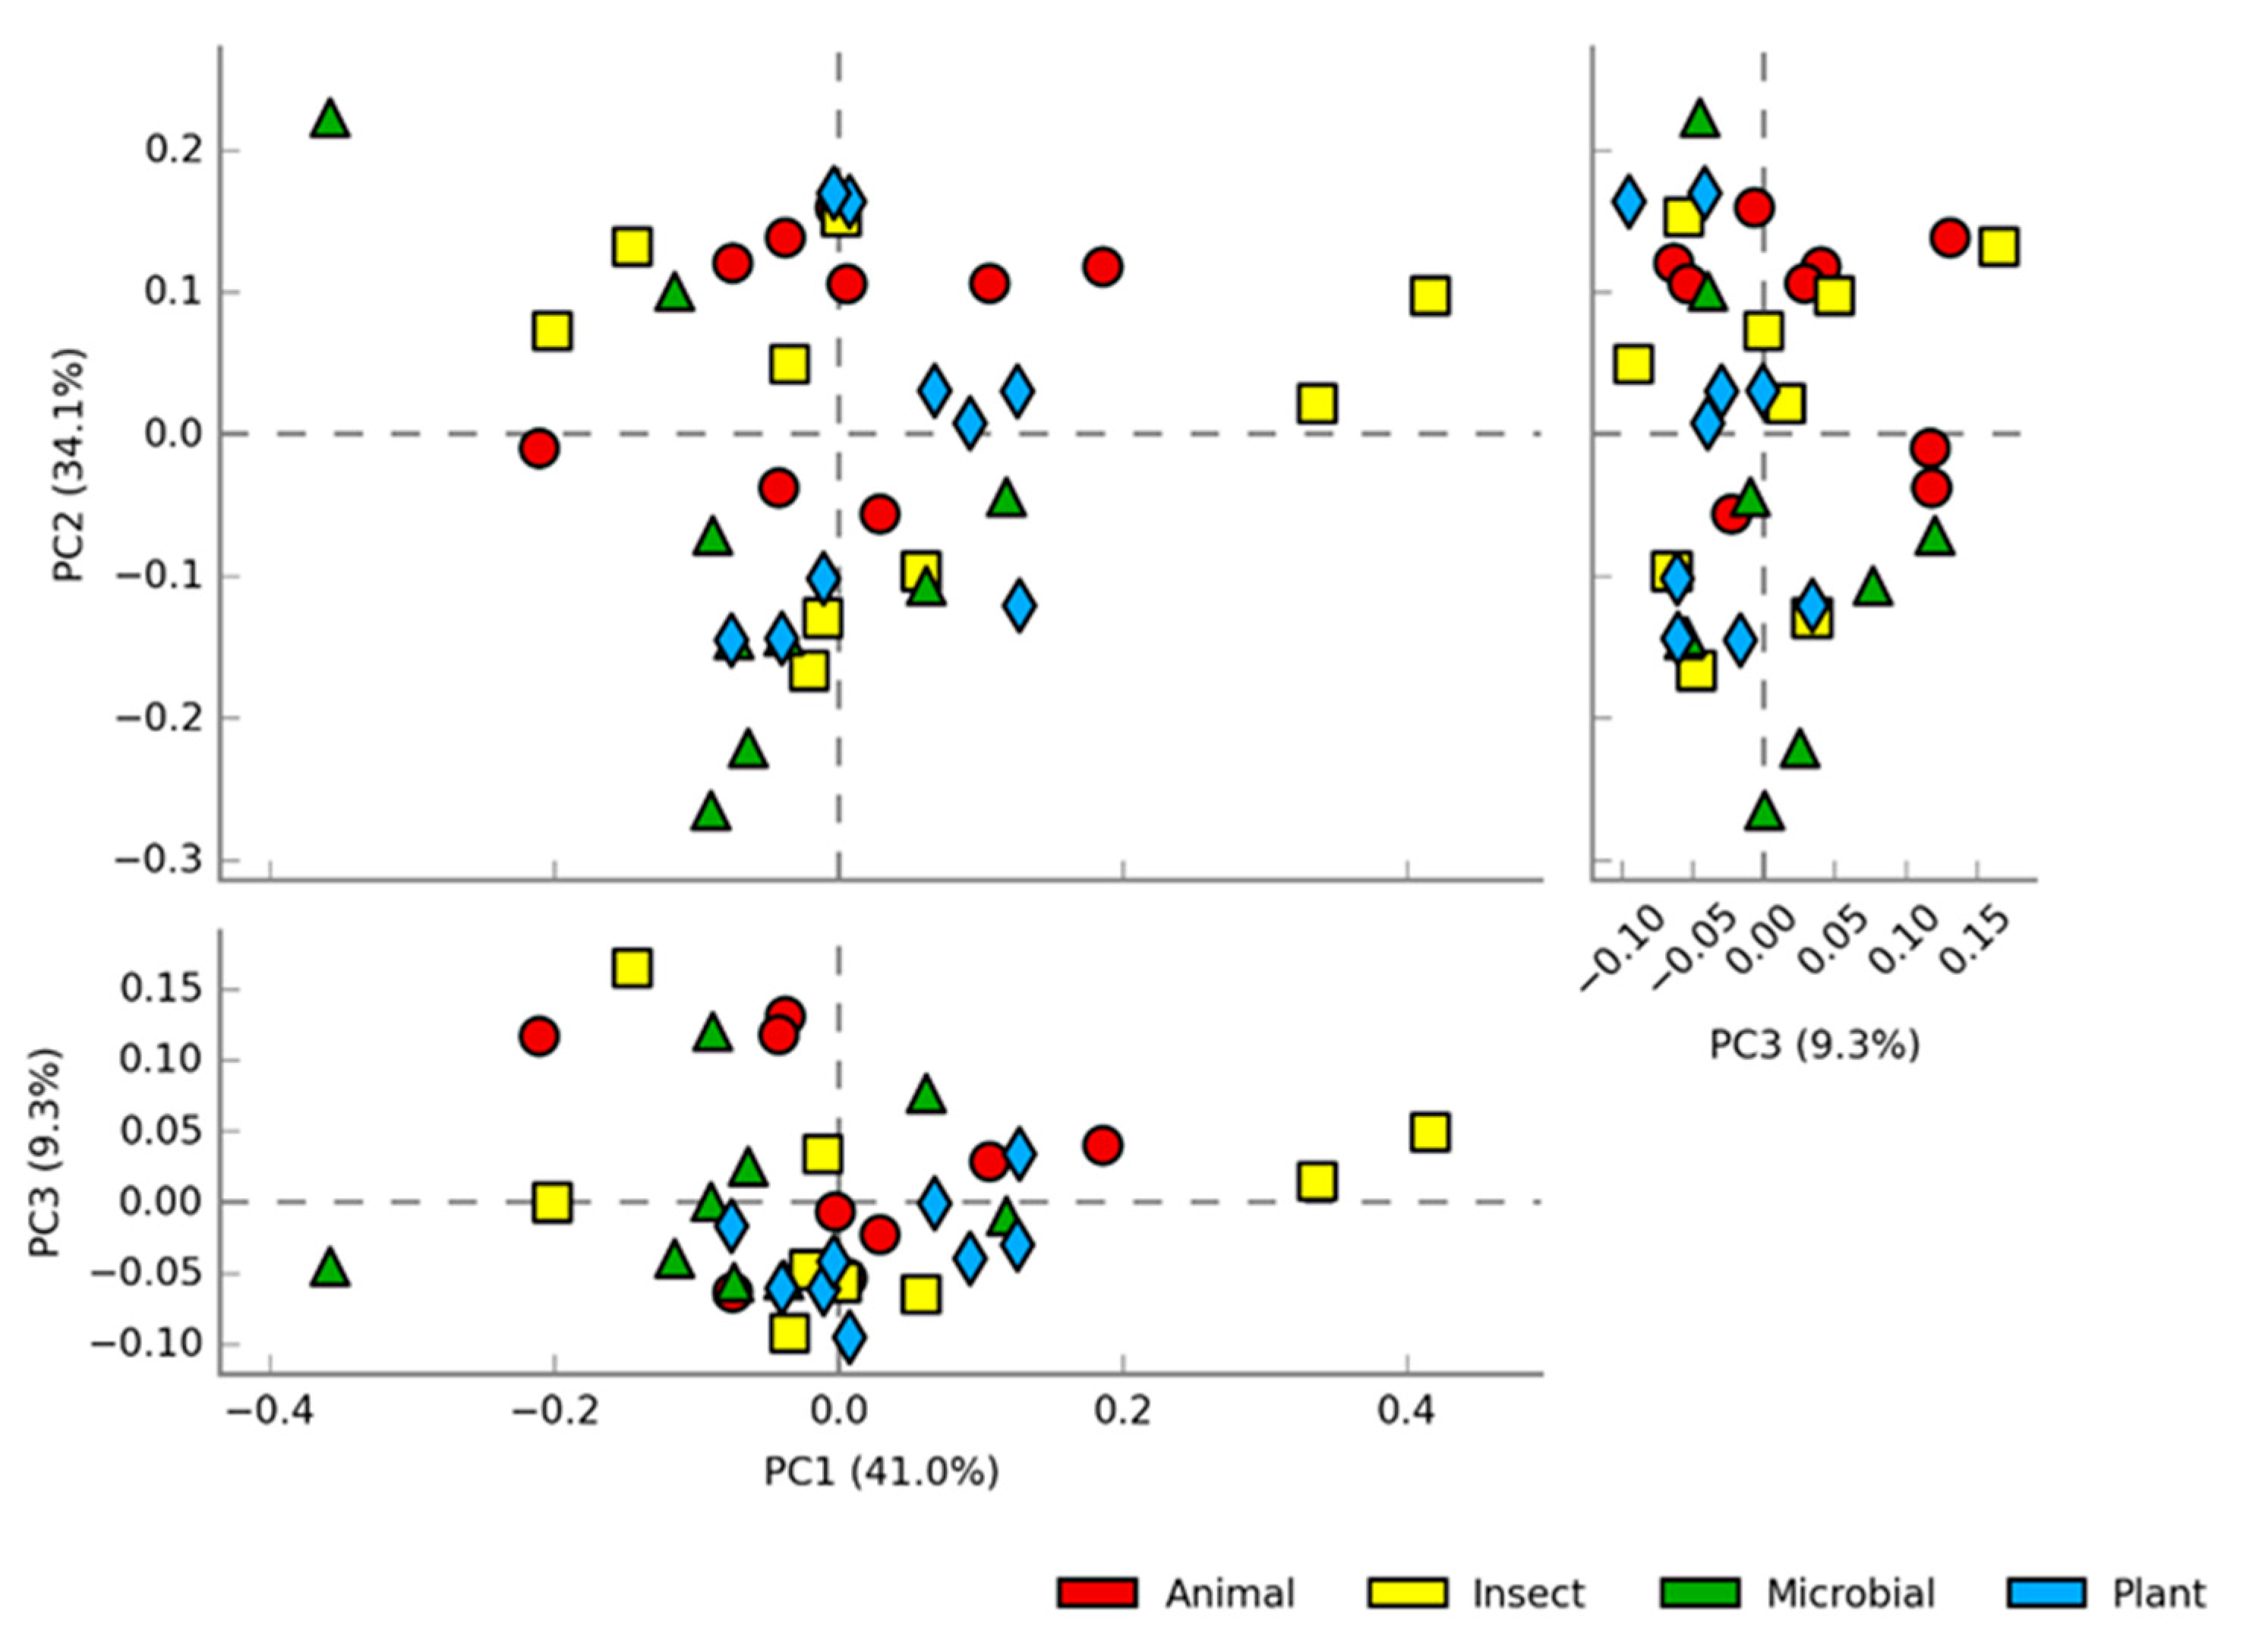
Figure 5.
Correlation between Non-essential amino acids (NEAA) intake and abundance of genera and species groups of different treatments in the intestine of tilapia (O. niloticus).
Figure 5.
Correlation between Non-essential amino acids (NEAA) intake and abundance of genera and species groups of different treatments in the intestine of tilapia (O. niloticus).
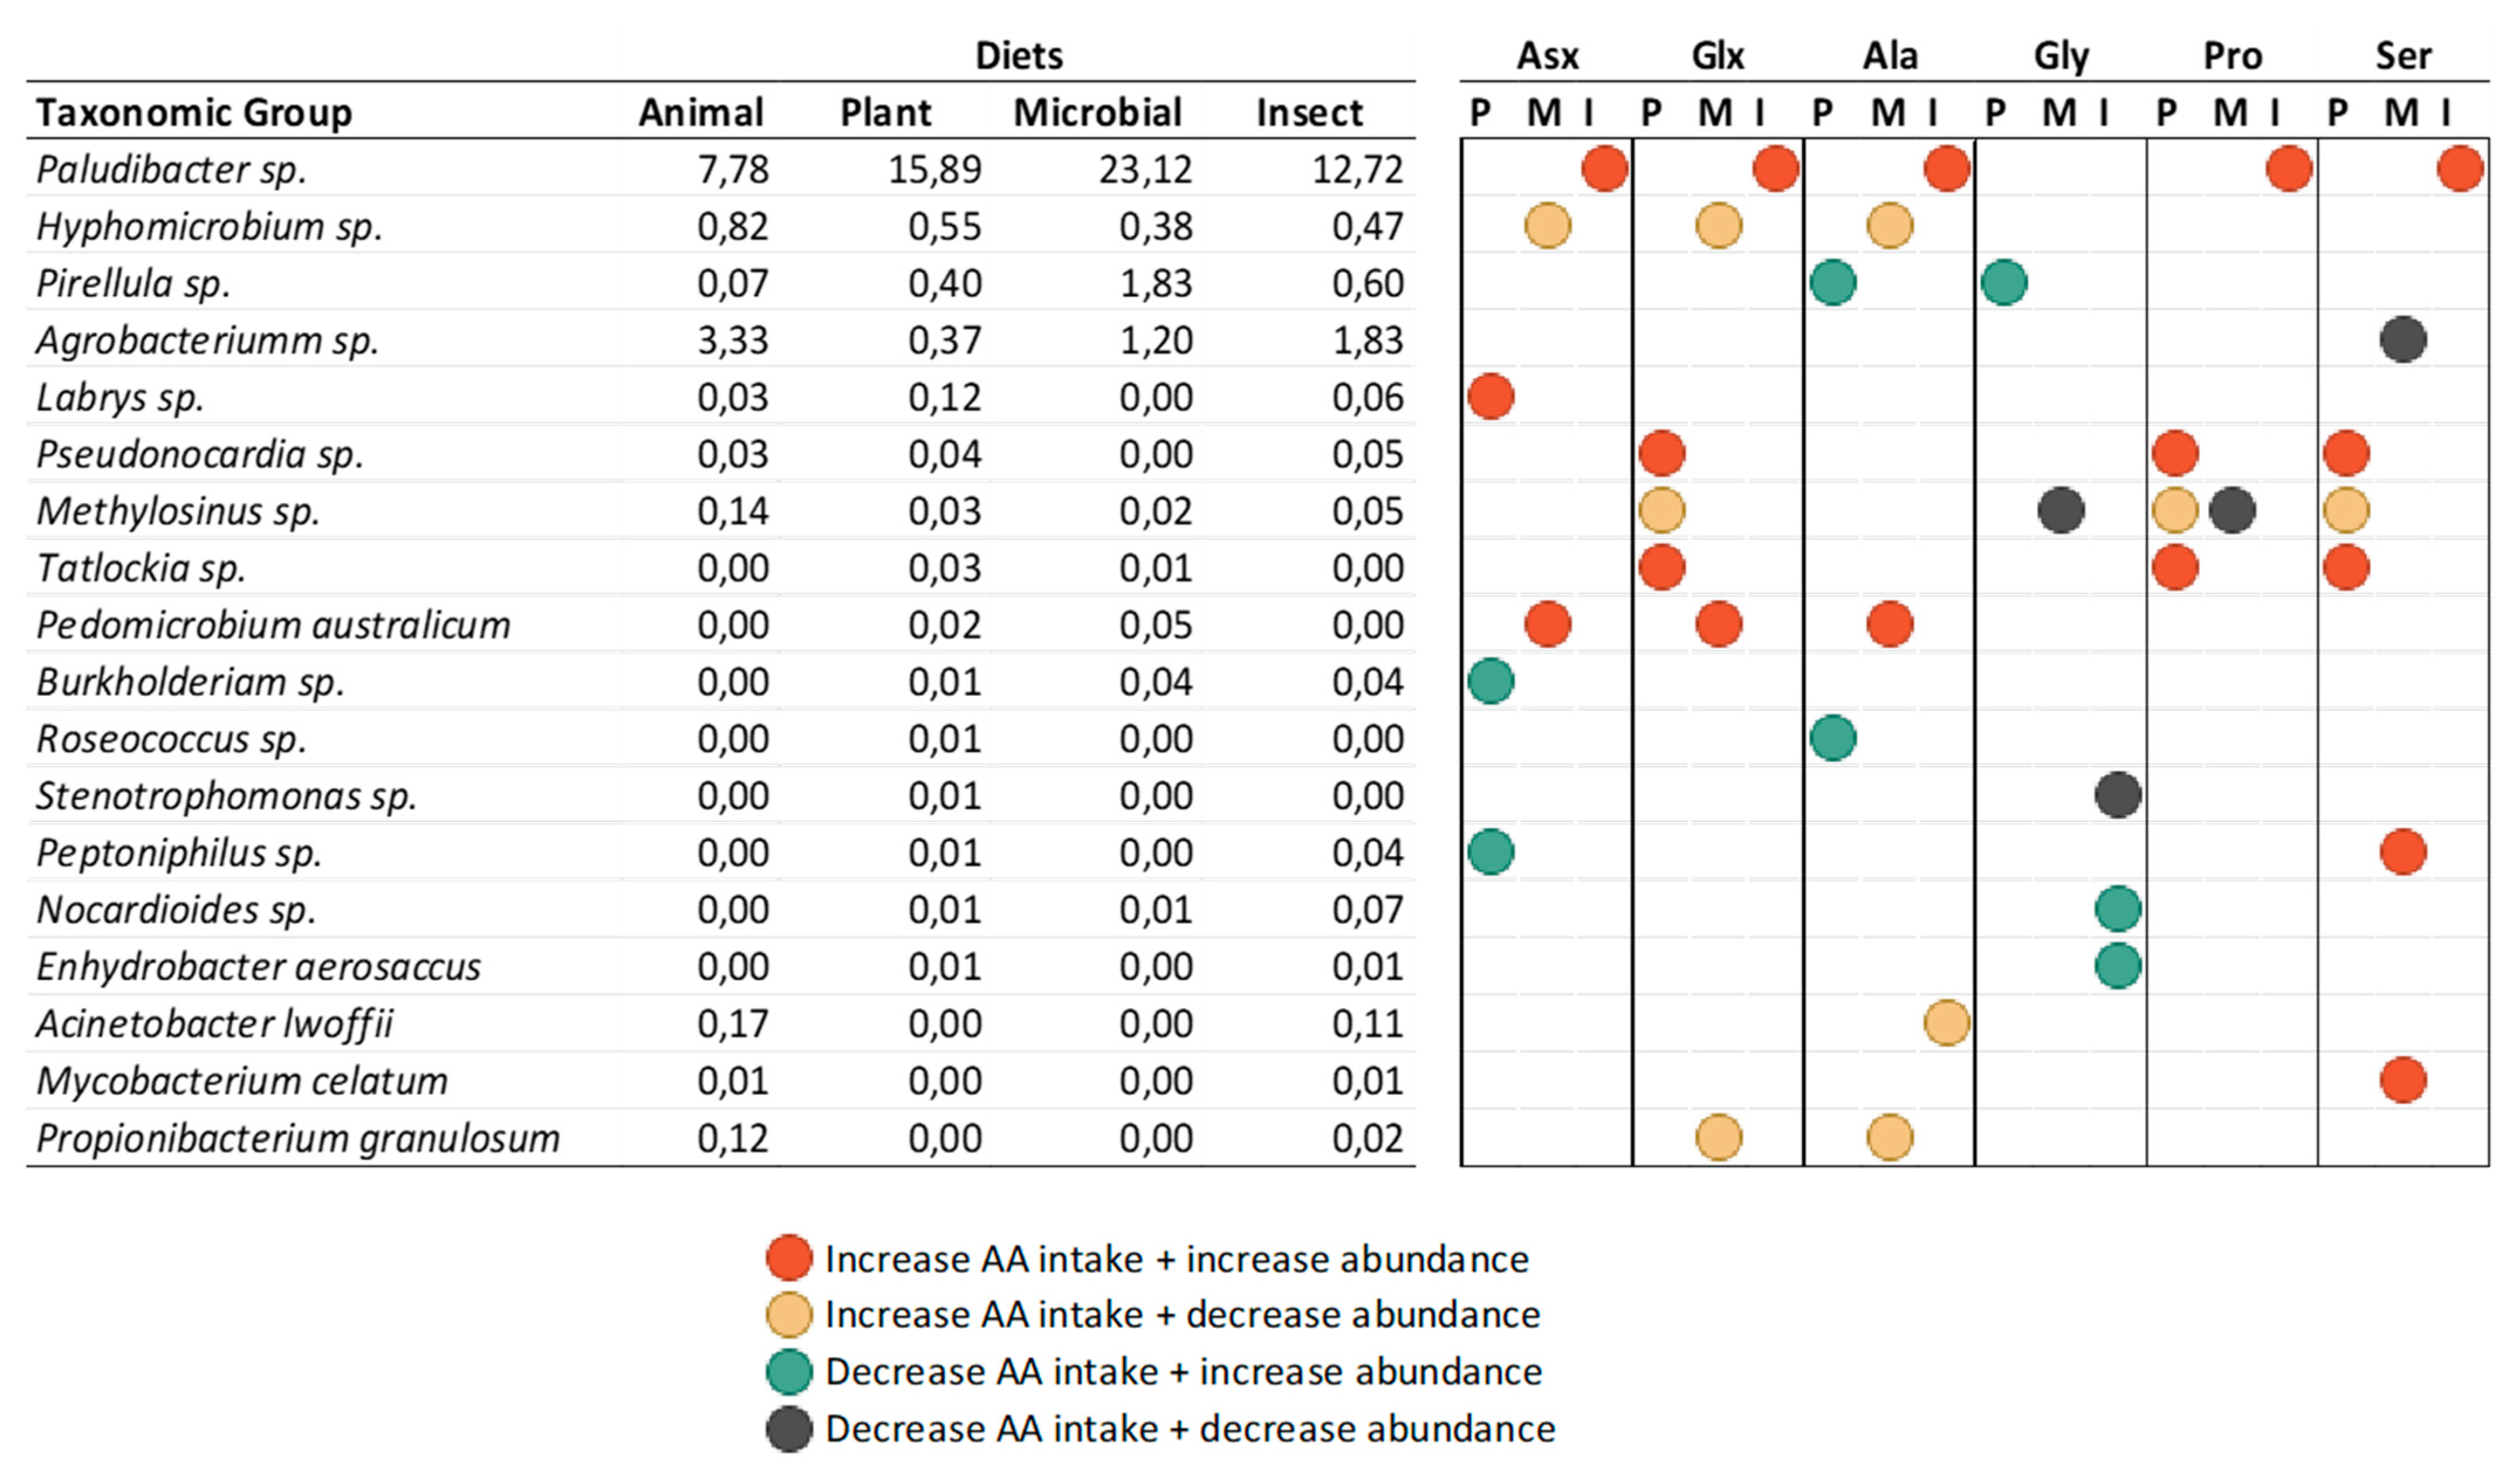
Figure 6.
Correlation between Essential amino acids (NEAA) intake and abundance of genera and species groups of different treatments in the intestine of tilapia (O. niloticus).
Figure 6.
Correlation between Essential amino acids (NEAA) intake and abundance of genera and species groups of different treatments in the intestine of tilapia (O. niloticus).
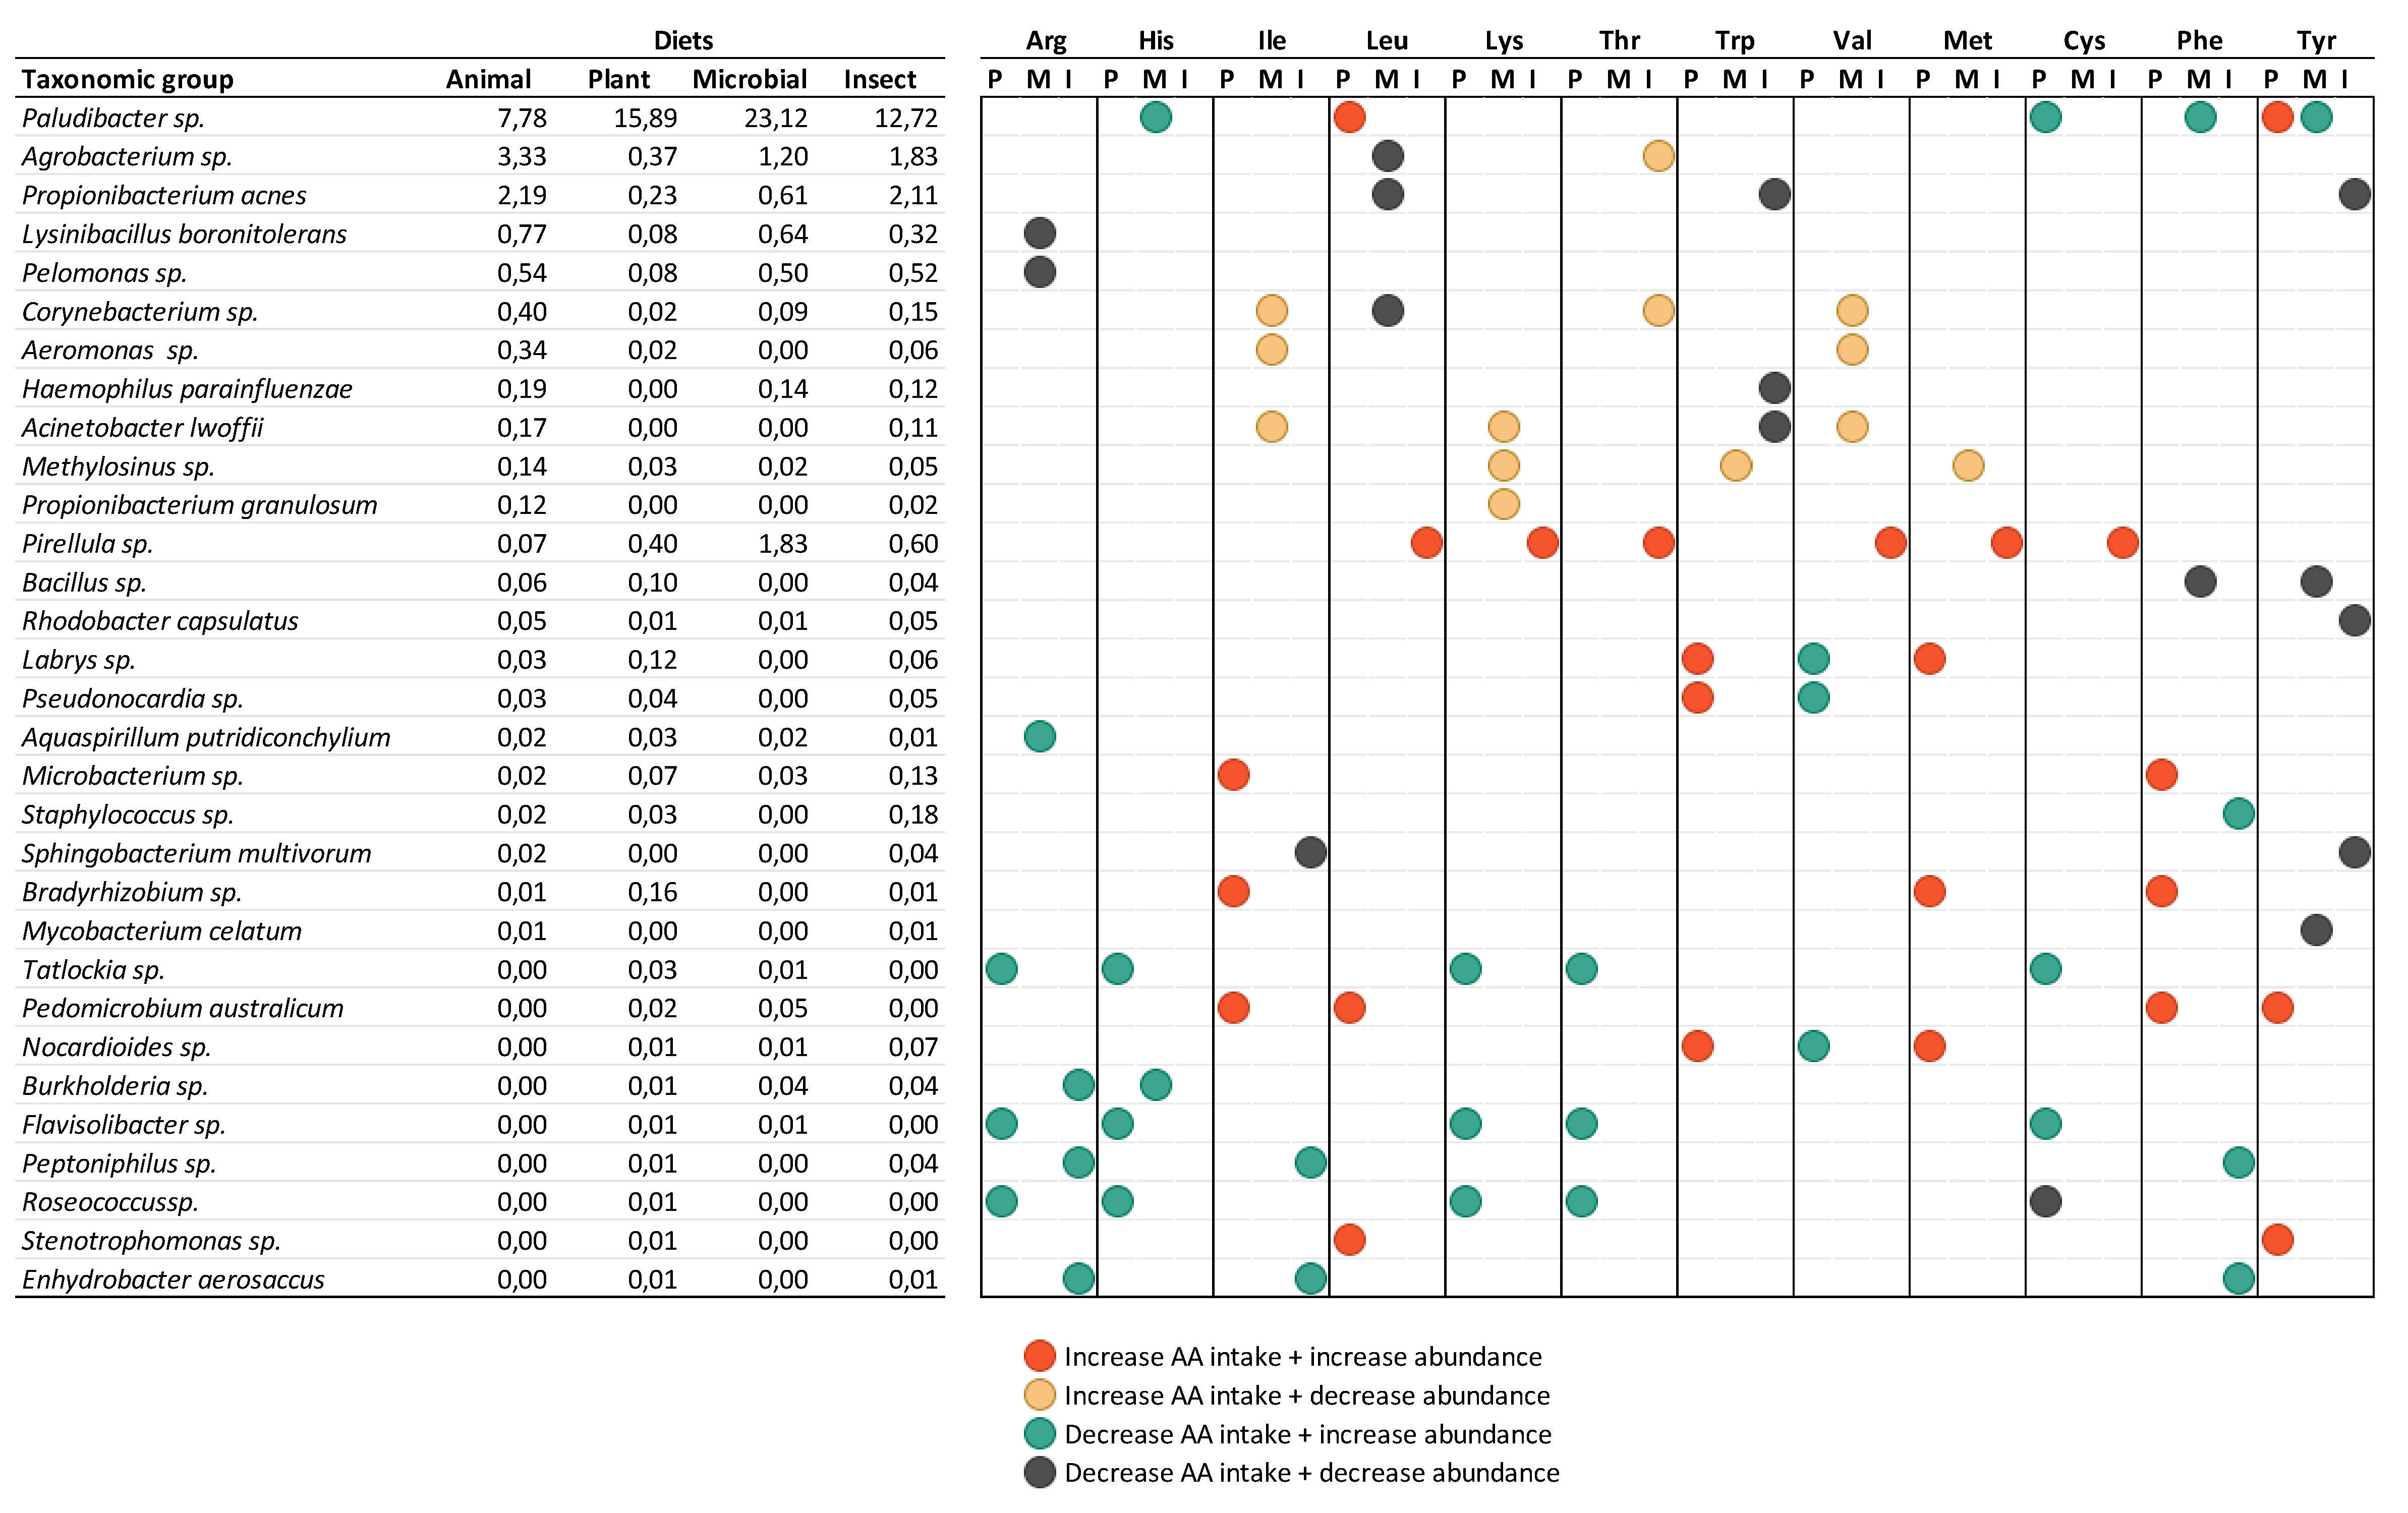
Figure 7.
Percentage of essential amino acids (EAA) intake with correlation with increase or reduction of prediction pathways relative to animal diet,.
Figure 7.
Percentage of essential amino acids (EAA) intake with correlation with increase or reduction of prediction pathways relative to animal diet,.
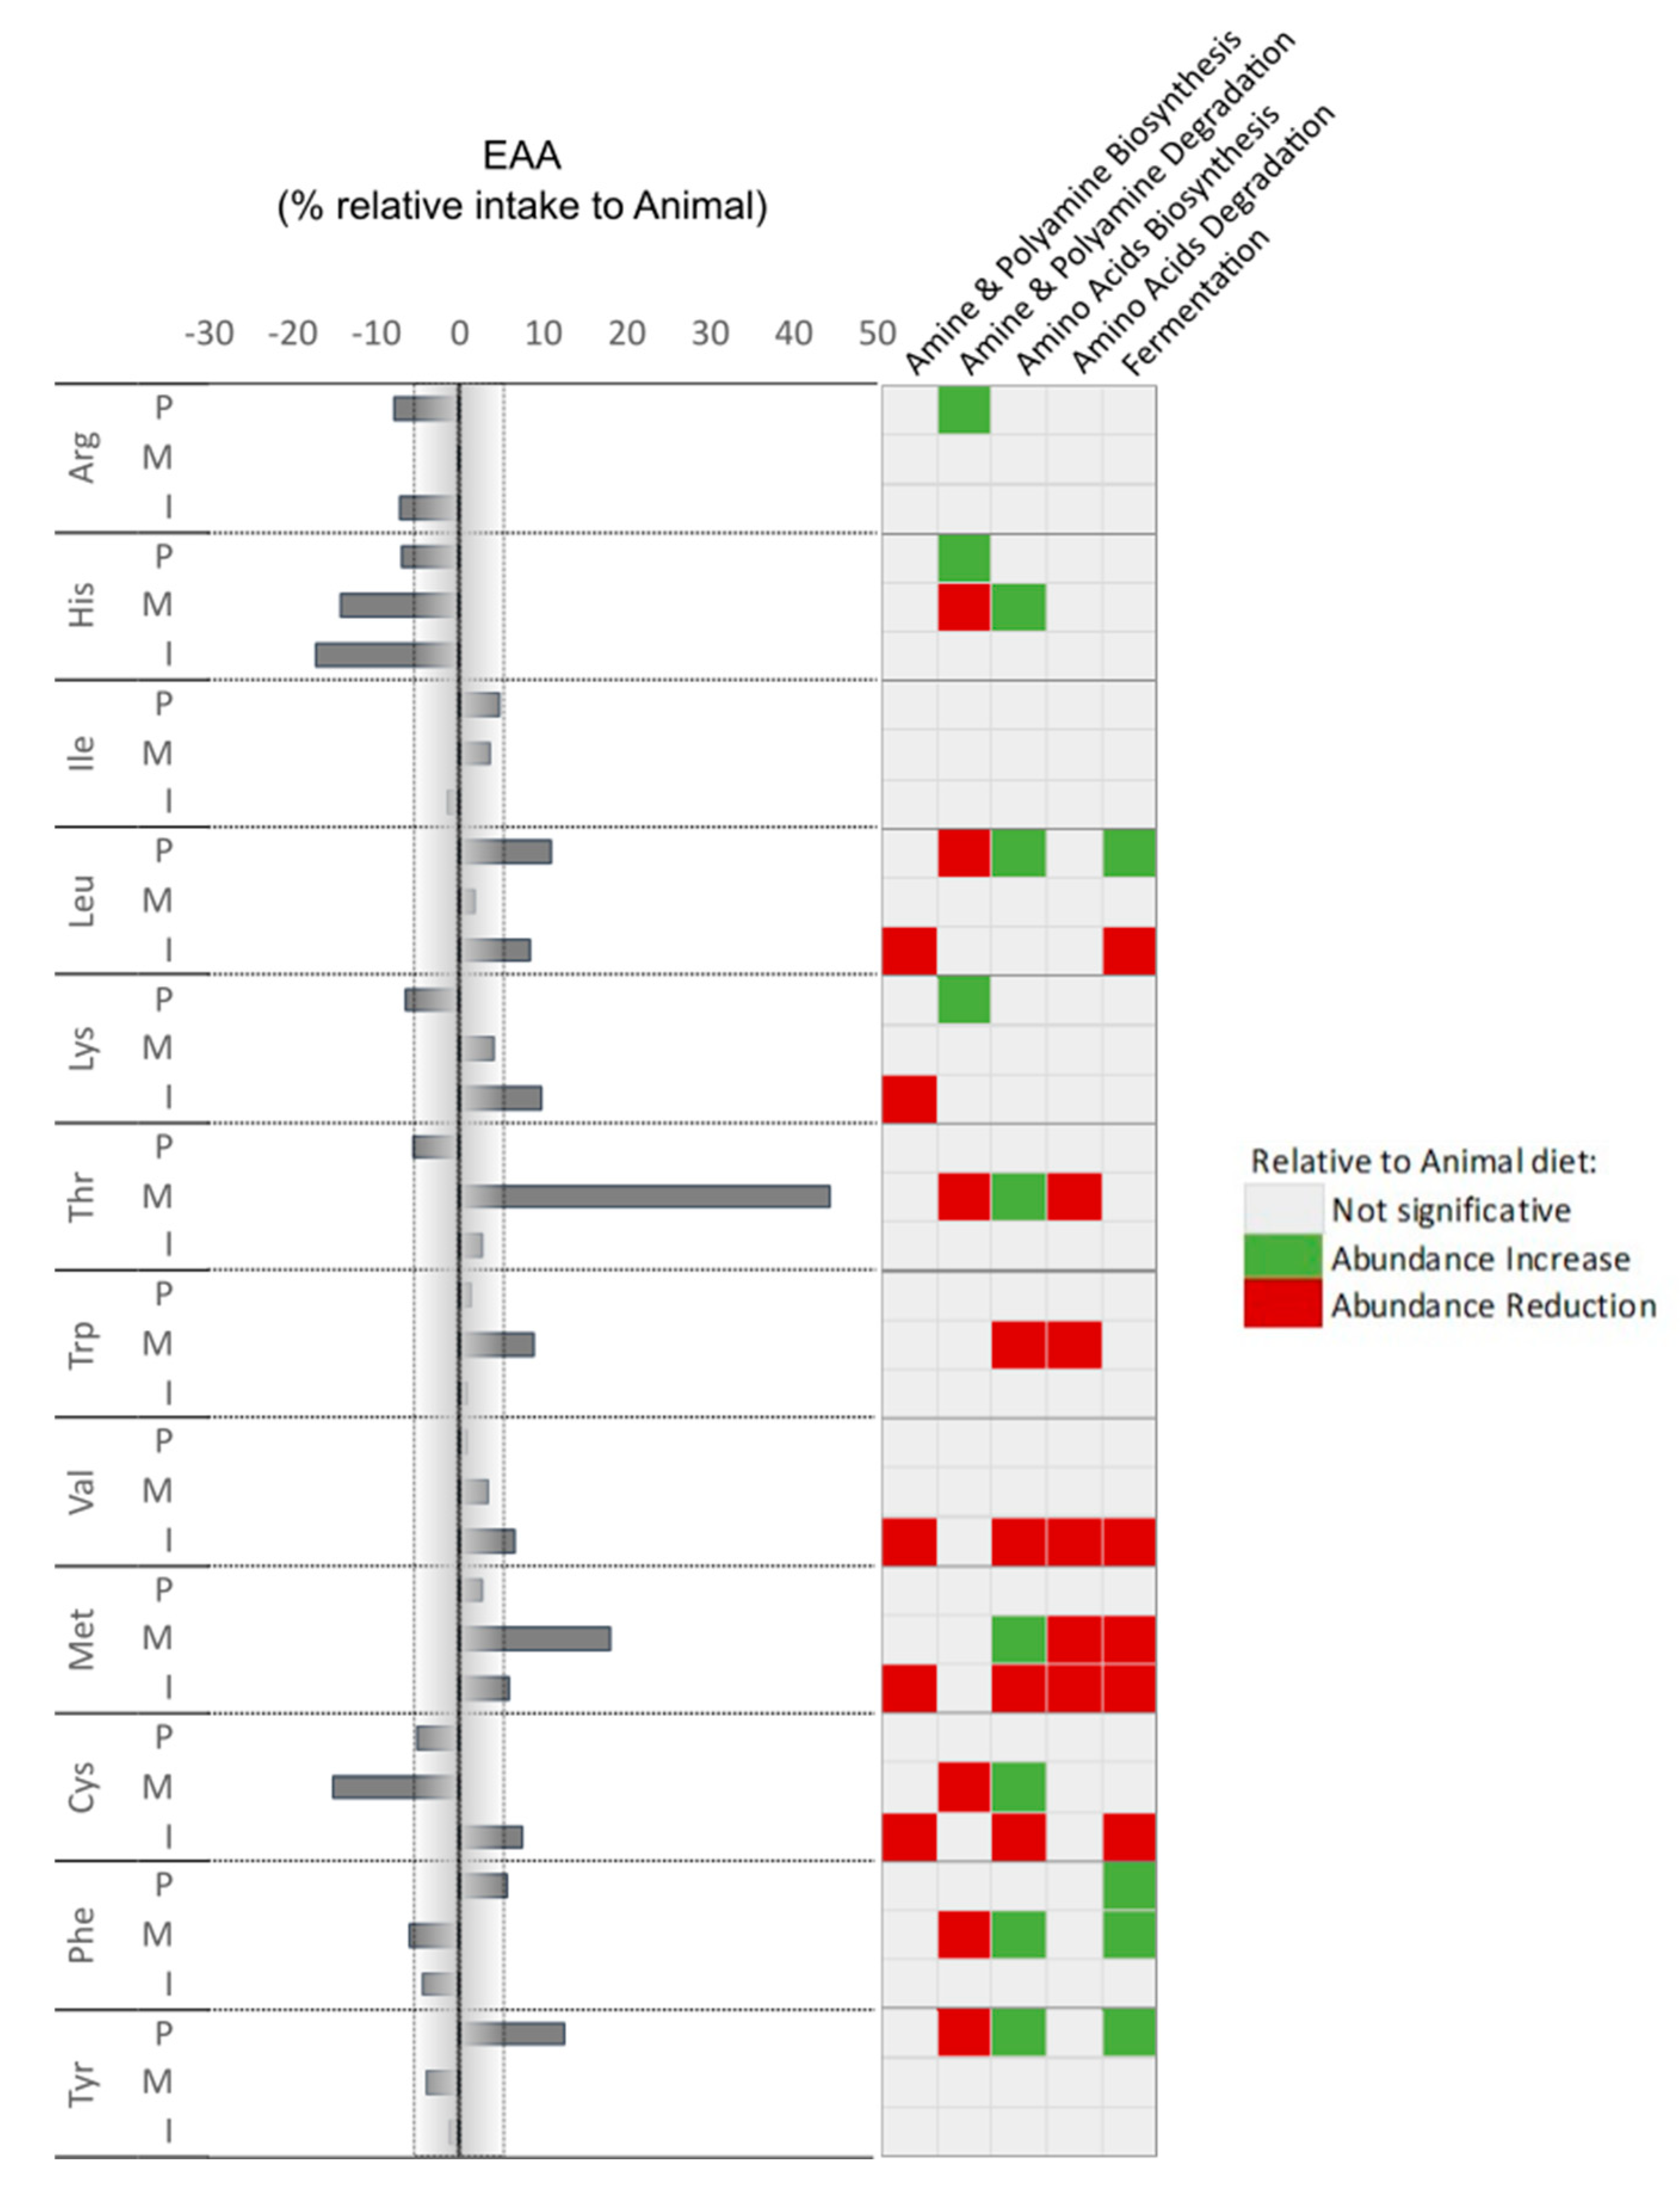
Figure 8.
Percentage of Non-Essential amino acids (NEAA) intake with correlation with increase or reduction of prediction pathways relative to animal diet,.
Figure 8.
Percentage of Non-Essential amino acids (NEAA) intake with correlation with increase or reduction of prediction pathways relative to animal diet,.
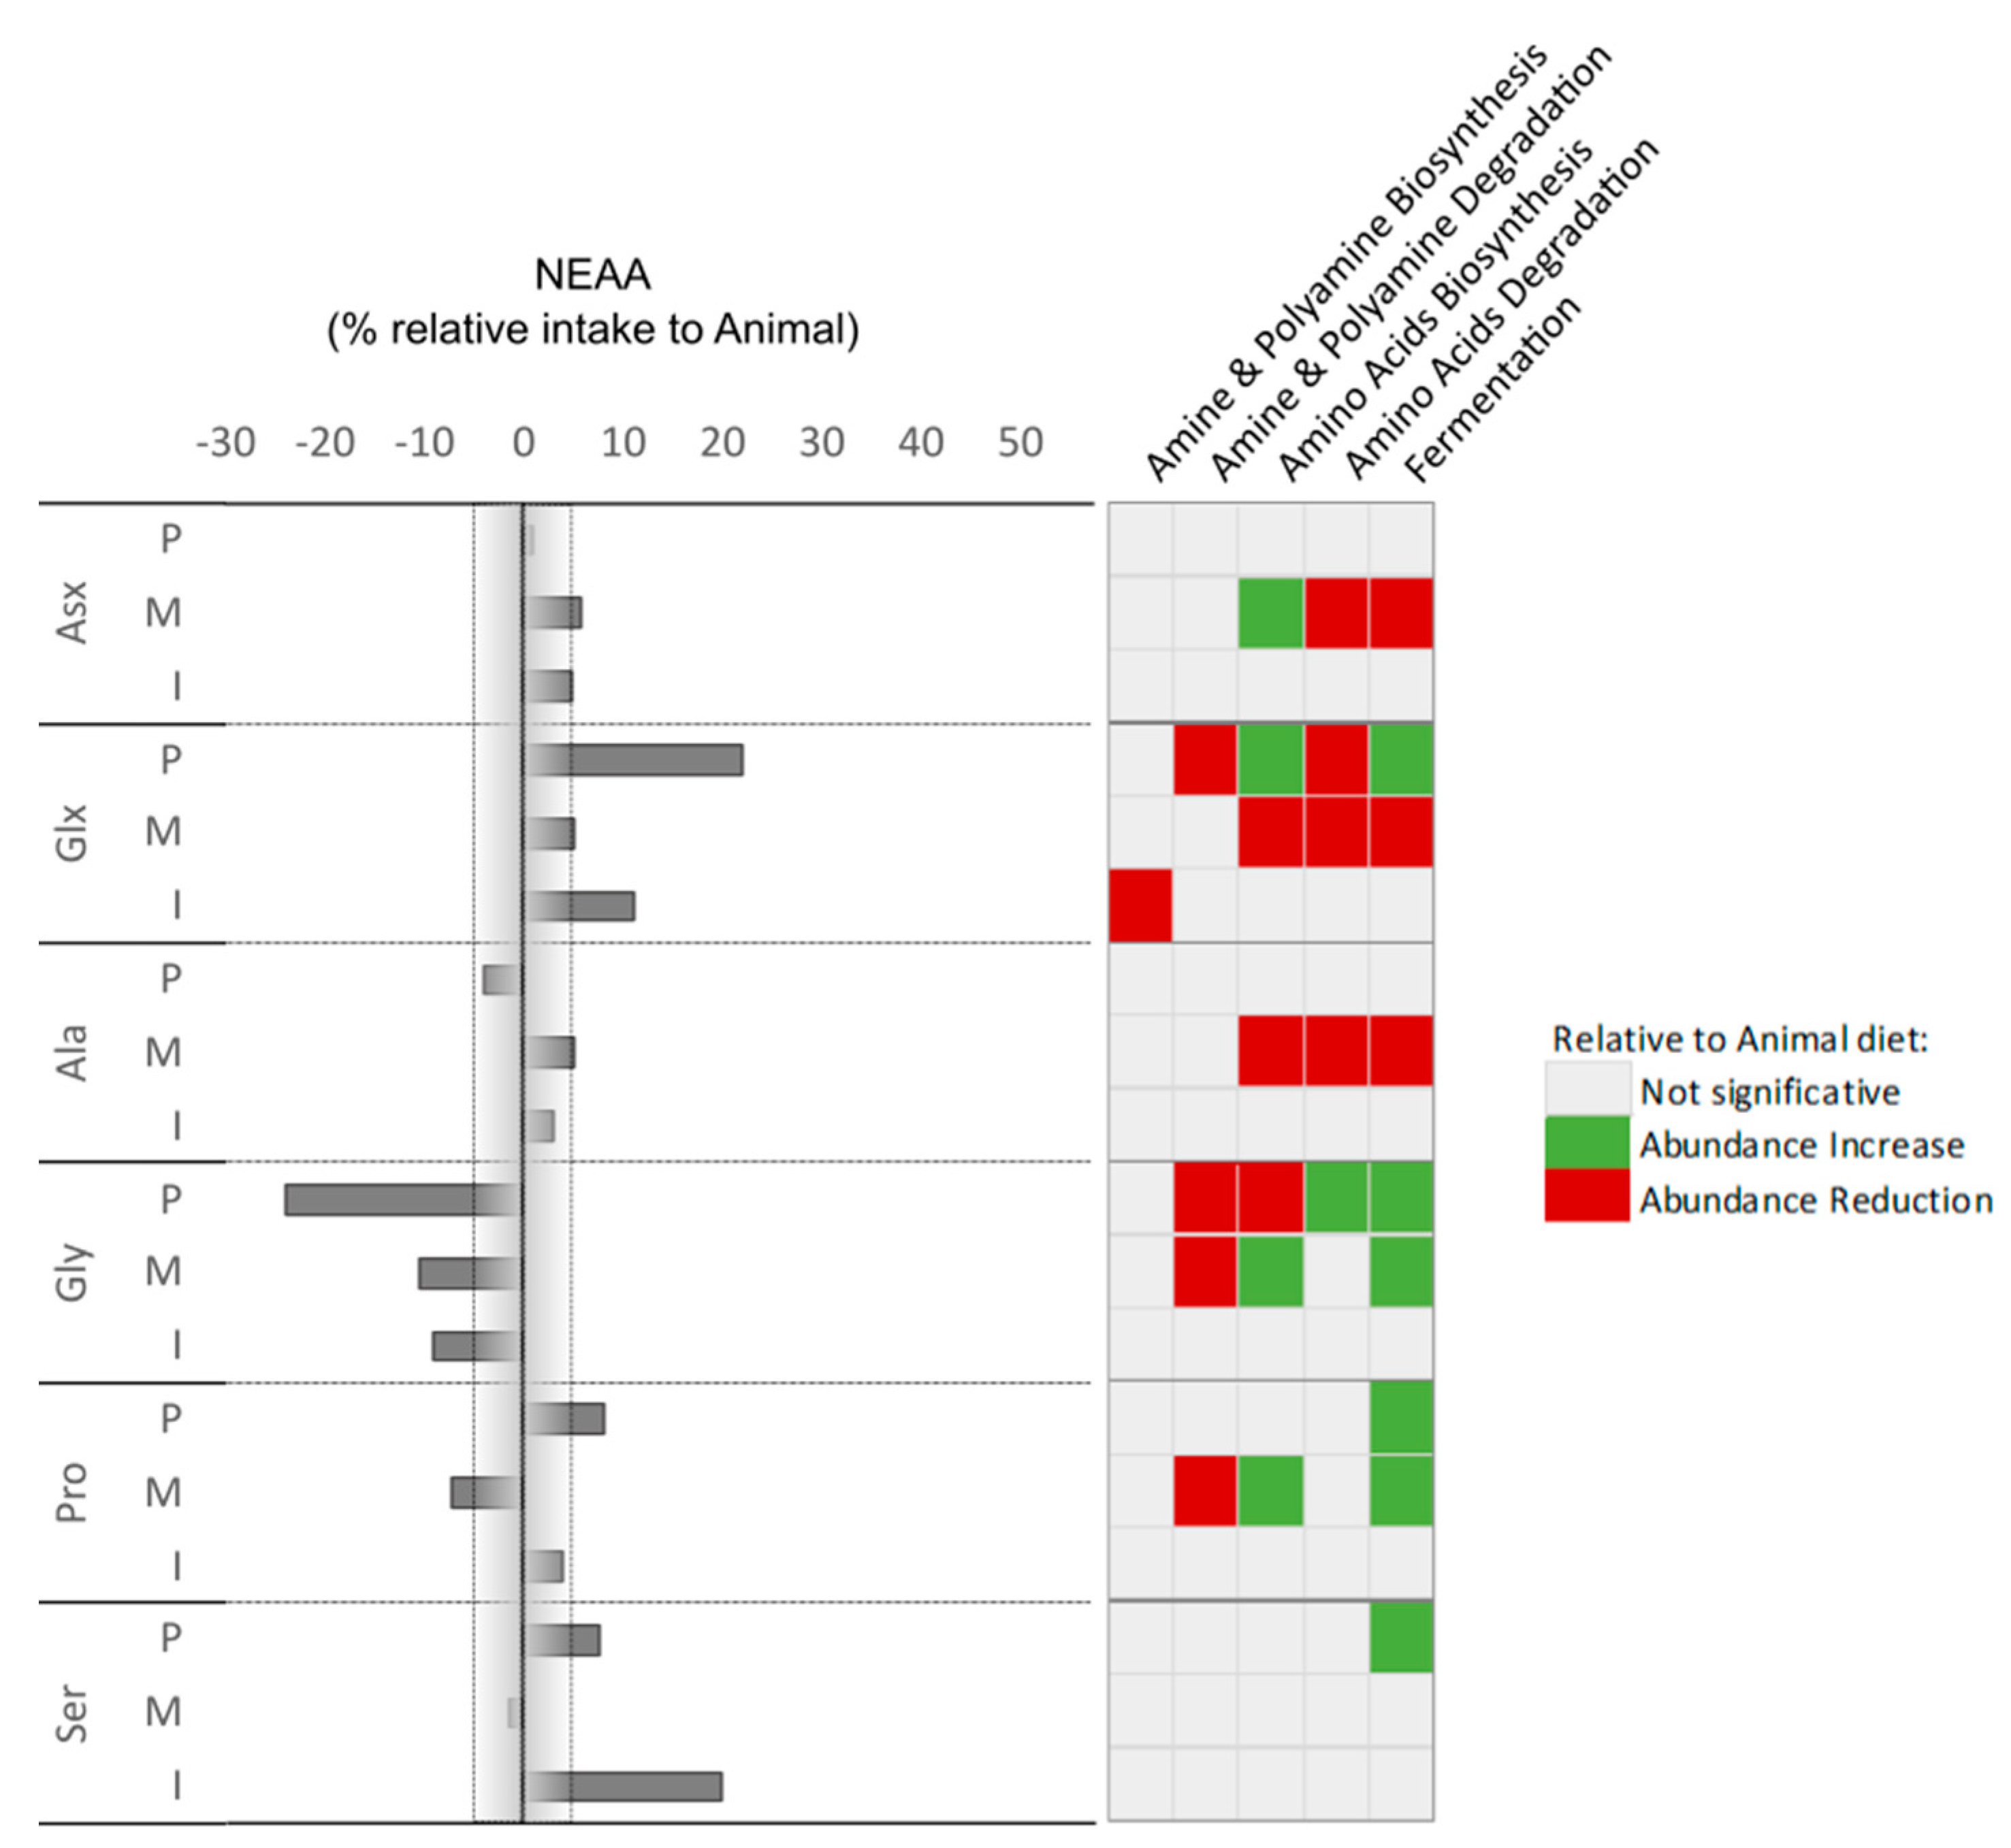

Table 1.
Ingredient composition and proximal analysis of the four diets tested.
| Ingredients, % | ANIMAL | PLANT | MICROBIAL | INSECT |
|---|---|---|---|---|
| Fishmeal 60 1 | 5.00 | |||
| Poultry meal 2 | 10.00 | |||
| Insect meal 3 | 13.00 | |||
| Microbial biomass (C. glutamicum) 4 | 6.50 | |||
| Microbial biomass (M. capsulatus) 5 | 6.50 | |||
| Corn gluten meal 6 | 10.00 | 15.00 | 10.00 | 10.00 |
| Soybean meal 48 7 | 15.00 | 30.75 | 15.00 | 15.00 |
| Rapeseed meal 8 | 15.00 | 15.00 | 15.00 | 15.00 |
| Wheat bran 9 | 10.00 | 10.00 | 10.00 | 10.00 |
| Rice bran 10 | 10.00 | 10.00 | 10.00 | 10.00 |
| Wheat meal 11 | 6.30 | 5.65 | 6.60 | |
| Corn meal 12 | 10.00 | 7.75 | 10.00 | 10.00 |
| Vitamin and mineral premix 13 | 1.00 | 1.00 | 1.00 | 1.00 |
| Antioxidant 14 | 0.30 | 0.30 | 0.30 | 0.30 |
| Monocalcium phosphate 15 | 1.10 | 2.60 | 2.40 | 2.50 |
| Guar gum 16 | 0.50 | 0.50 | 0.50 | 0.50 |
| L-Lysine 17 | 0.20 | 0.25 | 0.40 | 0.40 |
| L-Threonine 18 | 0.10 | |||
| DL-Methionine 19 | 0.10 | 0.15 | 0.25 | 0.20 |
| Chromium oxide 20 | 1.00 | 1.00 | 1.00 | 1.00 |
| Fish oil 21 | 1.00 | 1.40 | 1.40 | 1.40 |
| Soybean oil 22 | 3.50 | 4.30 | 4.10 | 3.00 |
| Proximate composition | ||||
| Moisture, % | 7.3 ± 0.0 | 6.5 ± 0.4 | 6.3 ± 0.0 | 6.3 ± 0.0 |
| Ash, % | 6.9 ± 0.0 | 6.6 ± 0.0 | 6.6 ± 0.0 | 6.9 ± 0.0 |
| Crude protein, % | 35.0 ± 0.1 | 34.8 ± 0.2 | 34.5 ± 0.1 | 35.1 ± 0.1 |
| Crude fat, % | 9.0 ± 0.1 | 9.1 ± 0.1 | 8.9 ± 0.2 | 8.9 ± 0.1 |
| Gross energy, MJ/kg | 18.7 ± 0.0 | 18.8 ± 0.0 | 18.8 ± 0.1 | 18.8 ± 0.1 |
| Chromium oxide, % | 0.9 ± 0.0 | 0.9 ± 0.0 | 1.0 ± 0.0 | 0.8 ± 0.0 |
1 COFACO 60: 62.3% crude protein (CP), 8.4% crude fat (CF), COFACO, Portugal; 2 Poultry meal: 63% CP, 11% CF, SAVINOR UTS, Portugal; 3 Defatted meal worm powder (Tenebrio molitor) from ground larvae: 69% CP, 5.2% CF, AnimalPro Nutrition GmbH, Germany; 4 Aminopro NT70: 74% CP, 3% CF, MAZZOLENI SPA, Italy; 5 FeedKind: 71% CP, 8% CF, Calysta UK Ltd, United Kingdom; 6 Corn gluten meal: 58% CP, 4% CF, MPS, France; 7 Dehulled solvent extracted soybean meal: 47% CP, 3% CF, CARGILL, Spain; 8 Defatted rapeseed meal: 34% CP, 2% CF, União Agrícola do Norte U.C.R.L., Portugal; 9 Wheat bran: 15.7% CP, 4.7% CF, Casa Lanchinha, Portugal; 10 Rice bran full-fat: 12.6% CP; 15.5% CF, Casa Lanchinha, Portugal; 11 Wheat meal: 10.2% CP; 1.2% CF, MOLISUR, Spain; 12 Corn meal: 10.1% CP; 4.2% CF, Casa Lanchinha, Portugal; 13 PREMIX Lda, Portugal: Vitamins (IU or mg/kg diet): DL-alpha tocopherol acetate, 100mg; sodium menadione bisulphate, 25mg; retinyl acetate, 20,000 IU; DL-cholecalciferol, 2,000 IU; thiamin, 30mg; riboflavin, 30mg; pyridoxine, 20mg; cyanocobalamin, 0.1mg; nicotinic acid, 200mg; folic acid, 15mg; ascorbic acid, 500mg; inositol, 500mg; biotin, 3mg; calcium pantothenate, 100mg; choline chloride, 1,000mg, betaine, 500mg. Minerals (g or mg/kg diet): copper sulfate, 9mg; ferric sulfate, 6mg; potassium iodide, 0.5mg; manganese oxide, 9.6mg; sodium selenite, 0.01mg; zinc sulfate,7.5mg; sodium chloride, 400mg; excipient wheat middling’s; 14 VERDILOX PX, KEMIN EUROPE NV, Belgium; 15 MCP: 22.7% P, Premix Lda, Portugal; 16 Seah International, France; 17 Biolys: 54.6% Lysine, Evonik Nutrition & Care GmbH, Germany; 18 ThreAMINO: 98.5% Threonine, Evonik Nutrition & Care GmbH, Germany; 19 Rhodimet NP99, ADISSEO, France; 20 Sigma-Aldrich, USA; 21 Sopropêche, France; 22 J.C. Coimbra Lda, Portugal.
Table 2.
Apparent digestibility coefficients and zootechnical performance criteria.
| ANIMAL | PLANT | MICROBIAL | INSECT | P- value | |
|---|---|---|---|---|---|
| ADC Protein, % | 86.4 ± 0.9 | 85.2 ± 0.5 | 85.8 ± 1.4 | 84.5 ± 1.9 | 0.401 |
| ADC Lipid, % | 91.7 ± 1.9 | 90.3 ± 2.8 | 91.9 ± 1.0 | 93.3 ± 1.0 | 0.325 |
| ADC Energy, % | 75.9 ± 2.2 ab | 71.5 ± 0.4 a | 74.4 ± 1.0 ab | 78.5 ± 2.7 b | 0.034 |
| IBW (g) | 12.3 ± 0.3 | 12.0 ± 0.2 | 11.9 ± 0.2 | 12.4 ± 0.5 | |
| FBW (g) | 73.0 ± 1.3 b | 66.4 ± 0.9 a | 72.7 ± 2.9 b | 67.2 ±1.4 a | 0.003 |
| SGR (%/day) | 3.88 ± 0.07 b | 3.72 ± 0.07 a | 3.94 ± 0.09 b | 3.67 ± 0.06 a | 0.006 |
| FCR | 1.00 ± 0.03 a | 1.12 ± 0.07 b | 1.03 ± 0.04 ab | 1.13 ± 0.04 b | 0.026 |
| Intake (%BW/day) | 3.09 ± 0.08 | 3.39 ± 0.22 | 3.21 ± 0.10 | 3.37 ± 0.11 | 0.080 |
| PER | 2.86 ± 0.09 b | 2.56 ± 0.17 a | 2.82 ± 0.12 b | 2.53 ± 0.09 a | 0.018 |
Values are means ± standard deviation (n=3). Different superscripts within a row, denote statistical differences (P<0.05).
Table 3.
Whole-body nutrient retention (expressed as % of nutrient intake).
| Retention | ANIMAL | PLANT | MICROBIAL | INSECT | P- value |
|---|---|---|---|---|---|
| Protein, % | 42.2 ± 0.4 a | 37.5 ± 2.5 ab | 41.3 ± 2.3 ab | 36.7 ± 3.0 a | 0.046 |
| Lipid, % | 85.5 ± 0.7 c | 76.9 ± 3.5 b | 77.4 ± 1.5 b | 69.2 ± 1.4 a | <0.001 |
| Energy, % | 36.6 ± 0.7 c | 30.2 ± 1.8 ab | 31.8 ± 0.8 b | 28.5 ± 1.4 a | <0.001 |
Values are means ± standard deviation (n=3). Different superscripts within a row, denote statistical differences (P<0.05).
Table 4.
Histopathological features analyzed in tilapia hindgut fed diets containing different protein sources: Animal, Microbial, Insect and Plant (mean ± standard deviation, n=3).
Table 4.
Histopathological features analyzed in tilapia hindgut fed diets containing different protein sources: Animal, Microbial, Insect and Plant (mean ± standard deviation, n=3).
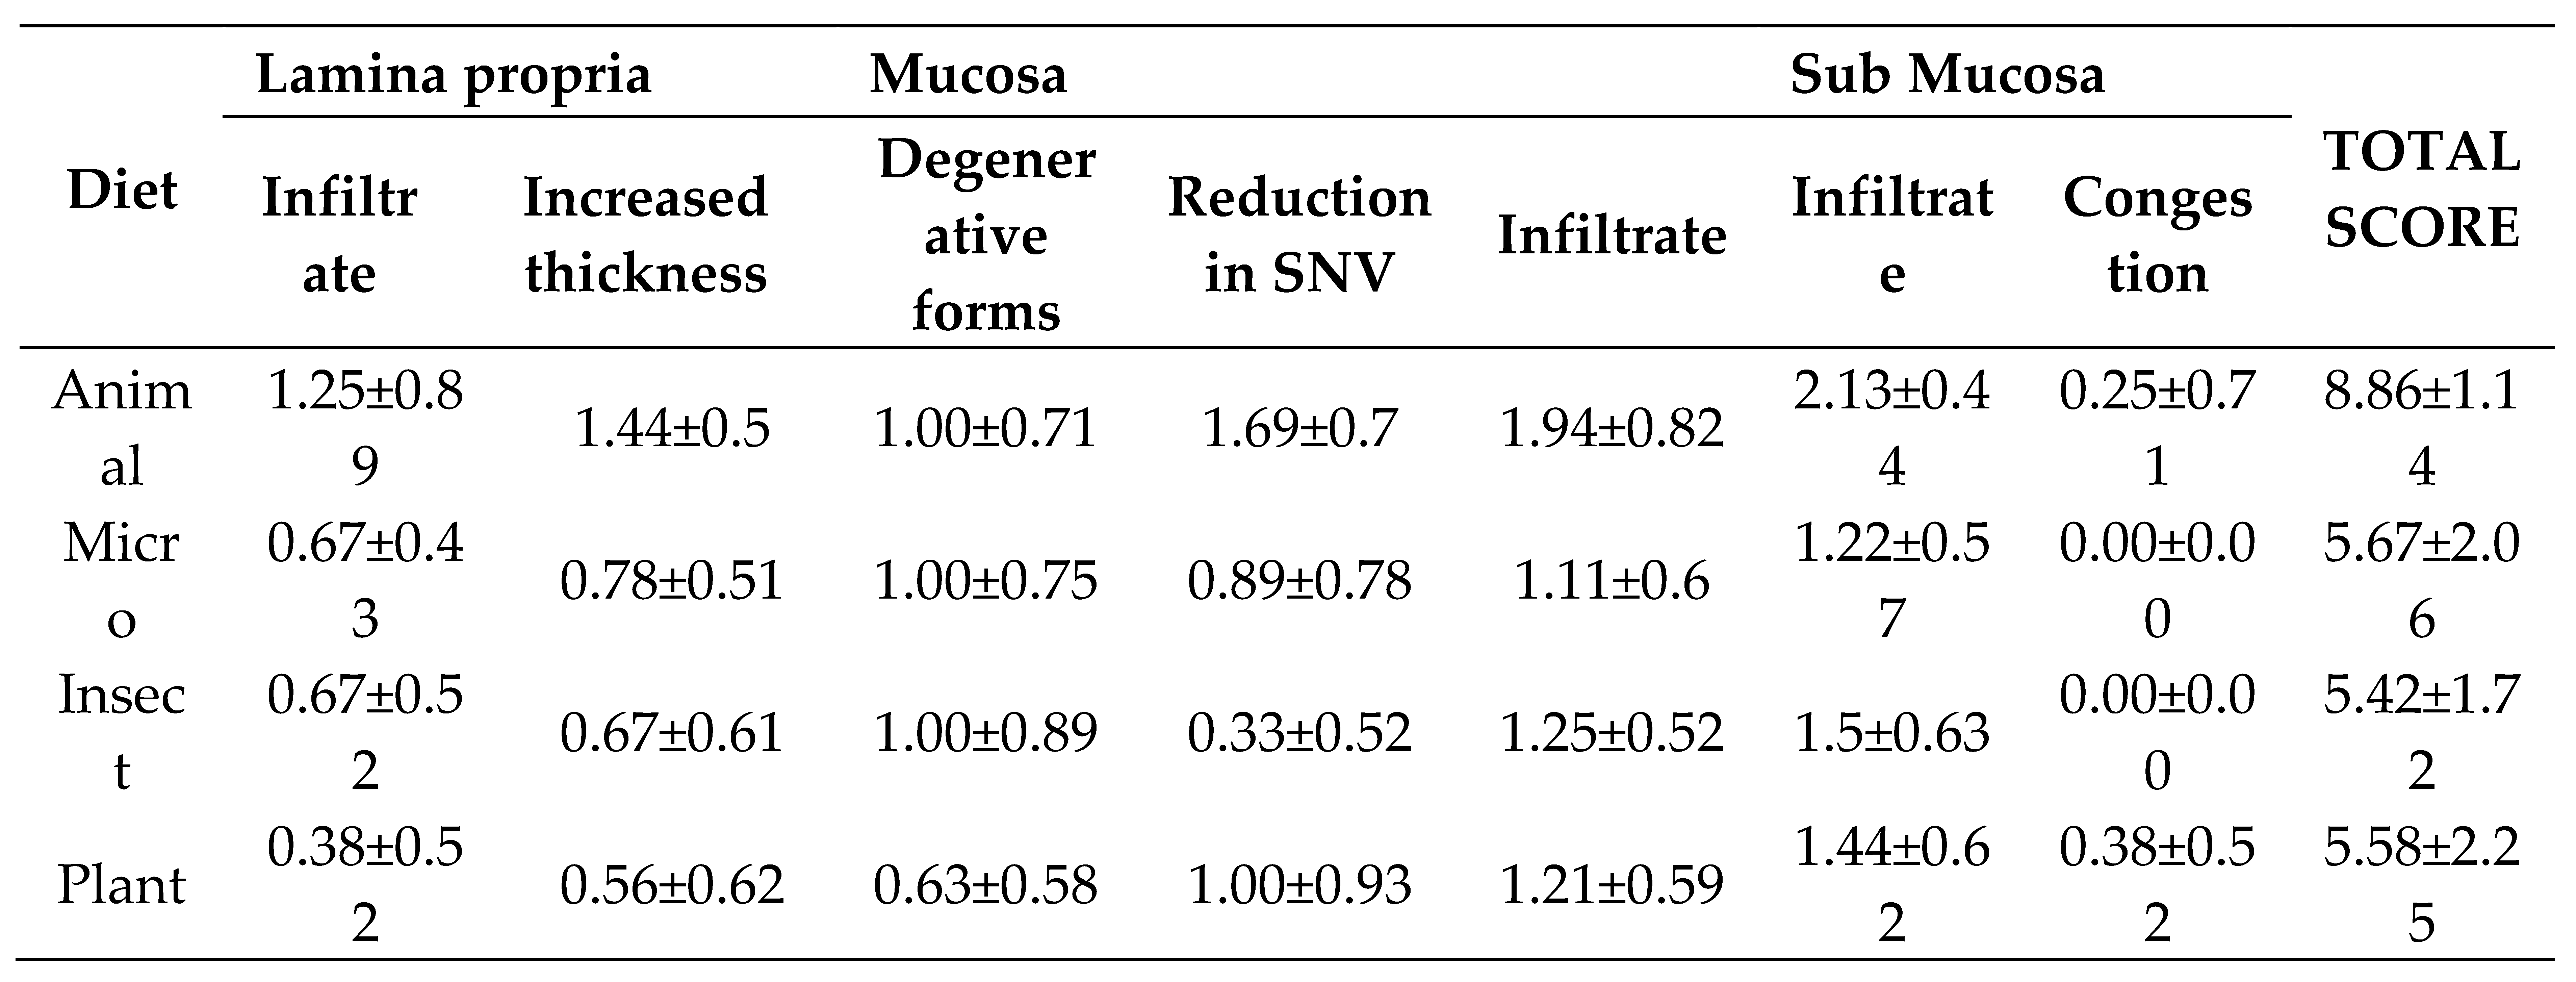 |
Table 5.
Histomorphology features analyzed in tilapia hindgut fed diets containing different protein sources: Animal, Microbial, Insect and Plant (mean ± standard deviation, n=3).
Table 5.
Histomorphology features analyzed in tilapia hindgut fed diets containing different protein sources: Animal, Microbial, Insect and Plant (mean ± standard deviation, n=3).
| Diet | Diameter (mm) | Villi (mm) |
Mucus cells | |||
|---|---|---|---|---|---|---|
| Ratio S/M | Average height | Average width | % Neutral mucins | % Acid mucins | % Mixed mucin | |
| Animal | 4.03±2.06 | 0.27±0.03 | 0.17±0.06 | 8.38±10.38 | 76.98±18.5 | 14.65±12.14 |
| Microbial | 4.55±3.68 | 0.29±0.11 | 0.15±0.05 | 13.18±9.58 | 72.48±21.98 | 14.33±13.11 |
| Insect | 5.98±7.26 | 0.32±0.07 | 0.17±0.06 | 13.88±10.59 | 66.94±16.23 | 19.19±11.55 |
| Plant | 8.99±8.71 | 0.29±0.09 | 0.14±0.03 | 15.72±14.59 | 68.22±17.48 | 16.06±13.41 |
Table 6.
Alpha diversity parameters results for Shannon, faith_pd, and observed features for tilapia fed diets containing different protein sources: Animal, Insect, Plant, and Microbial.
Table 6.
Alpha diversity parameters results for Shannon, faith_pd, and observed features for tilapia fed diets containing different protein sources: Animal, Insect, Plant, and Microbial.
| Treatments | Shannon | faith_pd | observed features |
|---|---|---|---|
| Animal | 5.64±0.32 | 12.98±4.39 | 169.44±52.53 |
| Microbial | 5.35±0.82 | 11.63±8.77 | 149.44±88.20 |
| Insect | 5.31±0.87 | 15.51±10.08 | 155.88±94.32 |
| Plant | 5.38±0.42 | 13.55±4.38 | 177.22±55.62 |
Disclaimer/Publisher’s Note: The statements, opinions and data contained in all publications are solely those of the individual author(s) and contributor(s) and not of MDPI and/or the editor(s). MDPI and/or the editor(s) disclaim responsibility for any injury to people or property resulting from any ideas, methods, instructions or products referred to in the content. |
© 2023 by the authors. Licensee MDPI, Basel, Switzerland. This article is an open access article distributed under the terms and conditions of the Creative Commons Attribution (CC BY) license (http://creativecommons.org/licenses/by/4.0/).
Copyright: This open access article is published under a Creative Commons CC BY 4.0 license, which permit the free download, distribution, and reuse, provided that the author and preprint are cited in any reuse.


