
Submitted:
28 August 2024
Posted:
29 August 2024
You are already at the latest version
Abstract
The growing demand for sustainable aquaculture requires exploring alternative protein sources for fish diets. However, some of these alternatives can have adverse health effects, prompting research into functional feed ingredients to mitigate these issues. This study investigated pistachio shell powder (PSP), a by-product rich in antioxidants, as a functional feed ingredient in rainbow trout diets. The dose-dependent effects of PSP inclusion (0%, 0.5%, 1%, 2%) on growth performance, intestinal health, and gut microbiota were assessed in fish fed either a fish meal (FM) or plant meal (PM) diet. Over a 12-week feeding period, rainbow trout fingerlings were assigned to diets incorporating varying levels of PSP in either FM or PM diets. Growth performance, intestinal morphology, gene expression, total antioxidant capacity (TAC), total phenolic compound (TPC) levels, and gut microbiota composition were evaluated. PSP at 1% significantly (P<0.05) improved weight gain and growth index in FM diets but did not affect growth in PM diets. No significant differences (P>0.05) were observed in other growth parameters, intestinal health, or oxidative stress markers, though a trend toward down-regulation of inflammatory genes was noted in PM diets at 2% PSP. PSP inclusion did not significantly alter gut microbiota alpha diversity but significantly (P<0.05) affected beta diversity in FM diets at the 0.5% level. Differential abundance analysis of gut microbiota revealed taxa-specific responses to PSP, particularly the genus Candidatus arthromitus increasing in relative abundance with PSP inclusion in both FM and PM based diets. Overall, PSP inclusion up to 2% did not elicit significant adverse effects on growth, intestinal health, or antioxidant status.
Keywords:
sustainable aquaculture
; antioxidants
; functional feed ingredients
; pistachio shell powder
; gut microbiome
; rainbow trout
1. Introduction
Aquaculture is a rapidly growing sector within the global food industry, offering a sustainable solution to meet the increasing demand for animal proteins. Recently, the contribution of salmonids to global aquaculture production has seen a marked increase. Specifically, rainbow trout (Oncorhynchus mykiss) accounts for approximately 1.5% of the total global finfish production in inland aquaculture systems while Atlantic salmon constitutes about 32.6% of finfish production within marine and coastal aquaculture settings [1]. Amidst the rising production of salmonids in aquaculture, production of these carnivorous fish is faced with significant challenges due to the relatively high costs of conventional feed ingredients, particularly fish meal and fish oil. To address these economic constraints, nutritionists have been exploring plant-based diets as a means to reduce feed expenses. However, plant-based diets have been linked to several adverse effects in carnivorous fish like rainbow trout, including enteritis triggered by soybean products [2,3,4] and an increased production of reactive oxygen species (ROS) resulting from plant-based oils [5]. In response to these challenges, researchers have embarked on developing different solutions. These include the selective breeding of rainbow trout strains with higher tolerance to plant-based diets [6,7], as well as the incorporation of specific enzymes and additives into the feeds to improve the digestion and assimilation of complex plant-derived nutrients [8,9]. Despite their potential, these approaches may require considerable time and financial investment. A more widely accepted approach involves incorporating dietary supplements into fish diets [10,11,12].
Over the past few years, pistachio production in the U.S. has increased significantly, with the U.S. contributing around 47% global pistachio production in 2020 [13]. Of the pistachios sold for human consumption in the U.S., roughly 50% of the mass from the harvest is considered by-product. Without alternative uses, these by-products would be disposed of as waste [14]. Pistachio shell waste is a by-product of pistachio nut processing, which is rich in biologically active compounds like, antioxidant polyphenols present in the shells and skins [13,14], and prebiotic polysaccharides found in both the hulls and shells [15,16]. Such components suggest that pistachio by-products could serve as functional dietary supplements in aquafeeds, potentially offering a cost-effective and sustainable alternative to conventional feed ingredients, while mitigating the adverse effects associated with plant-based diets in carnivorous aquaculture species. Research in other organisms on the use of pistachio shells has highlighted their potential to have beneficial effects on gut health [13,17,18]. Recent studies report fiber content around 10% of the pistachio shell’s dry weight [19]. This high fiber content contributes to various health benefits in humans, including improved digestion and modulation of gut microbiota [19]. Additionally, the high content of antioxidants in the PSP may mitigate the negative effects of reactive oxygen species (ROS) in the gut. These antioxidants can reduce ROS production, thereby preventing the formation of by-products that act as terminal electron acceptors, which could promote the overgrowth of certain facultative anaerobes and could lead to gut dysbiosis [20,21,22]. Concurrently, the high fiber content may enhance microbial stability within the gut, promoting the proliferation of beneficial commensal bacteria [19,23,24,25]. This dual action of antioxidants and fiber in PSP could potentially contribute to maintaining a balanced and healthy gut microbiome by reducing oxidative stress and promoting the growth of beneficial bacteria. However, there are currently limited studies evaluating the efficacy of dietary supplementation with pistachio by-products in omnivorous [26,27,28] and carnivorous fish species.
The objective of this study was to determine the dose-dependent effects of pistachio shell powder (PSP) supplementation on growth performance, oxidative and inflammatory gene expression, and gut health of rainbow trout fed either a traditional fishmeal (FM) diet or an ultramodern plant-meal (PM) based diet.
2. Materials and Methods
2.1. Experimental Diets and Fish Husbandry
A total of eight diets were prepared and extruded into 4.5 mm pellets at the Bozeman Fish Technology Center, MT, USA. Diets within each protein group were formulated to be isonitrogenous, isolipidic, and isocaloric (Table 1), with four diets in each protein category (fishmeal vs. plant-meal). The base control diets for each protein category (FM1 and PM1) had 0% PSP inclusion. The subsequent diets contained increasing levels of PSP: FM2 and PM2 had 0.5% PSP, FM3 and PM3 had 1% PSP, and FM4 and PM4 had 2% PSP inclusion.
A twelve-week feeding trial was conducted at the University of Idaho Aquaculture Research Institute, Hagerman, USA, following approval from the University of Idaho’s Institutional Animal Care and Use Committee (IACUC- 2022-41).
A total of 840 rainbow trout fingerlings (initial average live weight of 19.15 ± 0.25 g/fish) were sourced from a commercial germ plasm line. Thirty-five fish were randomly stocked in each of twenty-four 1300-L tanks. A flow-through system with a spring water source was maintained at a constant temperature of 15 °C and a flow rate of 8–10 L min−1. pH, Nitrite, and ammonia were periodically monitored using LaMotte kit (LaMotte company, Chestertown, MD) and remained well within acceptable range. Dissolved oxygen was measured using YSI Pro 20 DO meter (Xylem Inc, Yellow Springs, OH) and was maintained at > 6.5 mg / L.
During the trial, fish were hand-fed to apparent satiation three times daily, and feed consumption was recorded by tank. Every three weeks, bulk fish weights were recorded in each tank to track growth.
Growth and feed consumption data were used to calculate average weight gain, feed conversion ratio, specific growth rate, daily growth index, average weight gain, protein efficiency ratio, protein retention, energy retention, and survival as shown below.
2.2. Sample Collection
At the conclusion of the twelve-week study, three fish from each tank were sampled for collection of biological samples following euthanasia via overdose with MS-222. Sample collection included: (1) mucosa from the distal intestine for microbiome analysis, (2) distal intestinal tissue for gene expression analysis and histology, and (3) whole blood collected by caudal venipuncture to evaluate physiological effects of PSP inclusion in serum. In addition, three fish from each tank were sacrificed for whole-body proximate analysis to evaluate effects of PSP on gross nutrient assimilation and retention.
2.3. Isolation of Serum for TAC and TPC Assays
At the end of the study, 2 mL of whole blood was collected from three fish per tank (a total of 72 blood samples) using syringes. Blood samples were centrifuged at 1,500 x g for 10 minutes at 4°C. The resulting supernatant was transferred into a new 1.5 ml tube and stored at -80°C for TAC and TPC analysis.
2.4. Diet Extraction for TAC and TPC Assays
For the TAC assay, diet and PSP samples were processed by homogenizing in deionized water at a ratio of 1:2 (w/v) and centrifuging at 10,000 x g for 10 minutes at 4°C. The resulting supernatant (water-soluble fraction) was recovered and stored. The remaining insoluble fraction (pulp) was further extracted with pure acetone at a ratio of 1:4 (w/v), mixed at room temperature for 60 minutes, and centrifuged again at 10,000 x g for 10 minutes at 4°C. The combined results from the water-soluble fraction and acetone extract were used to determine TAC values.
For the TPC assay, diet and PSP samples were processed by homogenizing in a Methanol:H2O:1NHCl solution (70:29.5:0.5) at 37°C for 4 hours. The mixture was then briefly centrifuged at 3,000 x g for 30 seconds at 4°C. The resulting supernatant was diluted to a 2X concentration and then processed for TPC analysis.
2.5. TPC Assay
Total phenolic compounds (TPC) content was measured using a TECAN Infinite M200 PRO (Tecan) with half-area clear 96-well flat-bottom plates (Corning Incorporated, ME). Duplicate aliquots of 25 µL of raw serum from each of the 72 samples, as well as 25 µL of the homogenized diet and PSP samples were processed in duplicates using the ab273293 Phenolic Compounds Assay Colorimetric Kit (Abcam) according to the manufacturer’s protocol. After the assay was run, absorbance readings were collected and the catechin equivalents according to the standards were collected. A catechin standard curve was generated from each assay run, and the regression equation was used to determine the catechin equivalents for each sample. An R² value greater than 0.98 was maintained for all assays. The total concentration of TPC for each sample was calculated as (BxD/V) = nmol/µL where:
2.6. TAC Assay
Total antioxidant capacity (TAC) was assessed using a TAC assay kit (STA-360, Cell Biolabs Inc., San Diego, CA, USA) and measured on a TECAN Infinite M200 PRO (Tecan) with full-area clear 96-well flat-bottom plates (Greiner Bio-One, North America Inc.). Duplicate aliquots of 25 µL of raw serum from each of the 72 samples, as well as 25 µL of the homogenized diet and PSP samples were analyzed. Initial and final absorbances at 490 nm were recorded for both the samples and standards. Net absorbance values were used to create a uric acid standard curve, from which uric acid equivalents (UAE) of the samples were calculated. The μM copper reducing equivalents (CRE), proportional to TAC, were then determined by multiplying the UAE concentrations by a factor of 2189 μM Cu++/μM uric acid.
2.7. Genomic DNA Extraction, Library Preparation, and 16S rRNA Gene Sequencing
Microbial DNA was extracted from 72 mucosal samples (three individual fish samples from each of the 24 tanks) using the DNeasy 96 PowerSoil Pro kit (Qiagen) according to the manufacturer’s protocol. DNA concentrations were measured using a Nanodrop 2000 spectrophotometer (Thermo Fisher Scientific). To ensure high purity (260/280 and 260/230 ratios of approximately 1.8), DNA samples were cleaned and concentrated using a gDNA Clean and Concentrate Kit (Zymo Research).
Cleaned DNA samples were processed for library preparation using the Quick-16S™ Plus NGS Library Prep Kit (V3-V4) (Zymo Research) following the manufacturer’s protocol. 16S rRNA gene sequencing libraries were amplified using 341f and 806r 16S V3-V4 primers. The PCR conditions included a 10-minute initial denaturation at 95°C, followed by 42 cycles of 30-second denaturation at 95°C, 30-second annealing at 55°C, and 3-minute elongation at 72°C. 16S amplification was confirmed on a 2% agarose gel prior to equimolar pooling and 0.8x purification with Select-a-Size™ MagBeads (Zymo Research). After purification, the pooled library was quantified using the NEBNext Library Quant Kit for Illumina (New England Biolabs), and DNA fragment analysis confirmed the final library size of approximately 600 bp. The ultra-pure pooled library was then processed for sequencing. The library was loaded on a MiSeq (Illumina) at a final concentration of 12 pM with 15% PhiX spike-in using the MiSeq Reagent Kit v3 (600-cycle) (Illumina).
After sequencing, raw reads were demultiplexed using Illumina’s Local Run Manager software. To optimize quality control and ensure accurate downstream analysis, Figaro [29]was employed to determine the ideal parameters for trimming the demultiplexed reads. These trimmed sequences were then imported into the DADA2 pipeline [30] within the R statistical environment [31]. DADA2 facilitated the correction of sequencing errors and the resolution of raw reads into high-resolution amplicon sequence variants (ASVs), representing unique biological sequences. Subsequently, chimeric sequences were removed, and taxonomic classification was assigned to the remaining amplicon sequence variants (ASVs) using the Silva nr99_v138.1 rRNA reference database [32]. ASVs were clustered based on sequence similarity using BLASTn [33], followed by post-clustering curation with LULU [34] to merge ASVs likely representing the same biological sequence, thereby mitigating potential overestimation of diversity due to sequencing artifacts.
Prior to statistical analysis, the dataset was refined by removing singletons, ASVs with a mean relative abundance less than 1e-5, and sequences assigned to the Chloroplast order, or the Mitochondria family. The Phyloseq [35] and vegan [36] packages were employed for data transformation and calculation of ecological indices.
After quality control, 71 samples were retained for downstream analysis. Alpha diversity, measured by Shannon index and observed ASVs, was compared across dietary pistachio shell powder (PSP) inclusion levels within fish meal and plant meal groups using one-way ANOVA.
Rare taxa, defined as those with abundance below 2 in at least 11% of samples, were filtered out before beta diversity analysis. Cumulative sum scaling (CSS) normalized count data was used for beta diversity assessment via Principal Coordinate Analysis (PCoA) based on Bray-Curtis distances. Permutational Multivariate Analysis of Variance (PERMANOVA) with 9999 permutations (‘adonis2’ function) was used to identify significant differences in community composition between fish meal and plant meal groups, followed by pairwise adonis [37] comparisons with Benjamini-Hochberg correction. Additionally, beta dispersion was assessed (‘betadisper’ function) for group homogeneity, with ANOVA and pairwise permutation tests to detect dispersion differences.
The microbial community differences between dietary protein sources (fish meal vs. plant meal) and increasing levels of pistachio shell powder (PSP) inclusion (0%, 0.5%, 1%, 2%) were assessed using Analysis of Composition of Microbiomes (ANCOM-BC2) [38]. The analysis was performed on genus-level aggregated data, with taxa prevalence filtered to include only genera present in at least 20% of samples. ANCOM-BC2 [38] was conducted with default parameters, including Benjamini-Hochberg correction for multiple comparisons. Both global tests for overall differences in community composition and pairwise comparisons between PSP inclusion levels were performed.
2.8. RNA Extraction and Real-Time qPCR
The distal intestines of 72 fish samples were rinsed with PBS, snap-frozen in liquid nitrogen, and immediately transferred to a -80°C freezer. Total RNA was extracted from the frozen distal intestinal samples using the Direct-zol RNA Miniprep kit (Zymo Research). Samples were transferred to 2 mL lysis tubes containing 2 mm bashing beads (ZR BashingBeads, Zymo Research) and 1 mL of Trizol reagent, and homogenized in a tissuelyzer (Mixer Mill 200, Retsch GmbH, Haan, Germany). The resulting lysate was then processed according to the manufacturer’s protocol. After extraction, the quality of the RNA was assessed using a Nanodrop 2000 spectrophotometer (Thermo Fisher Scientific). To ensure high purity (260/280 and 260/230 ratios of ≥ 1.8), RNA samples were purified using a one-step PCR inhibitor removal Kit (Zymo Research).
1 μg of total RNA was taken from each sample, and DNase treatment followed by cDNA synthesis was performed using the iScript™ cDNA Synthesis kit (BioRad, Hercules, CA) according to the manufacturer’s protocol. Real-time quantitative PCR was performed on a CFX96 Real-Time System (BioRad) in 10 μL total volume reactions. Two different supermixes were used: SsoAdvanced Universal Probes Supermix (BioRad) with 500 nmol primers and 300 nmol probes, and SsoAdvanced Universal SYBR Green Supermix (BioRad) with 500 nmol primers, following the manufacturer’s protocol. Each sample was run in duplicate for every fish. PCR cycling conditions for all genes included an initial denaturation step at 95°C for 3 minutes, followed by 40 cycles of denaturation at 95°C for 5 seconds, and an annealing step at gene-specific temperatures (as detailed in Table 2). Two reference genes, elongation factor 1α (Ef1-α) and β-actin, were used to calculate the geometric mean of their expression for normalization purposes. Relative expressions of genes involved in oxidative stress response (NRF-2α, CAT, SOD, and GPX-1) and inflammatory response (TNF-α and S100) were determined using primers designed from rainbow trout sequences in the NCBI database (Table 2).
Primer PCR efficiency was determined using six serial dilutions of a standard pooled from representative samples across all experimental groups. On-plate primer efficiencies were used to correct Ct values for each individual run. Following quality control, where one sample failed to amplify, 71 samples were retained for downstream analysis. Technical duplicates of samples had a coefficient of variation below 7%. Normalized data were analyzed using the relative quantification method established by Vandesompele et al. [39] as detailed below:
2.9. Proximate Analysis
Proximate composition of the practical diets (Table 1), and whole-body content of the initial and final fish were analyzed. Moisture levels were determined by drying feed and fish samples to a constant weight at 105°C for 12 hours. The dried samples were finely ground using a blender (magic bullet MBR-1101) and kept for subsequent crude protein and crude lipid composition analyses. Crude protein content (calculated as total nitrogen content (N) x 6.25) was analyzed using the combustion method with a nitrogen determinator (Elementar Rapid N Analyzer, Ronkonkoma, NY). The crude lipid content was quantified using an ANKOM XT15 Extraction System (ANKOM Technology, Macedon, NY). Samples were extracted with petroleum ether at 90°C for 60 minutes. Following extraction, samples were dried at 102°C for 30 minutes, cooled to room temperature in a desiccator, and weighed to determine the crude lipid content. Ash content was determined by incinerating samples at 600°C for four hours in a muffle furnace. The caloric content of the samples was measured using an isoperibol bomb calorimeter (Parr 6300, Parr Instrument Company Inc., Moline, IL).
2.10. Histology
Distal intestinal tissues, initially preserved in 10% neutral buffered formalin at 4°C for 18 h, before rinsing in 2x PBS and transferred to 70% ethanol for long-term storage at 4°C. Histological samples were processed at the Washington Animal Disease Diagnostic Lab (WADDL; Washington State University, Pullman, WA 99164). Following standard histological procedures, the tissues underwent graded dehydration, xylene clearing, and paraffin embedding. Five-micrometer sections were obtained and stained with hematoxylin and eosin (H&E) for morphological assessment. Digitized slide images were subsequently analyzed using QuPath software [42] to quantify and evaluate intestinal morphology. Intestinal morphometric parameters, including villus length and width were measured in seven replicate sections per fish. Following measurement, morphometric data from each fish were averaged within their respective tanks. For each dietary treatment group, four replicate measurements were randomly selected for subsequent histological analysis.
2.11. Data Wrangling and Statistical Analysis
In this study, a comprehensive suite of R packages was utilized to transform, wrangle, and analyze the data. High-resolution sample inference from amplicon data was achieved with DADA2 [30], while data manipulation and visualization were facilitated by the tidyverse [43] collection of packages. Phyloseq [35] was employed for comprehensive microbiome analysis, lulu [34] for resolving OTU clusters, and msa [44] and Biostrings [45] for multiple sequence alignment and string manipulation. Multi-panel figures were assembled using patchwork [46] and cowplot [47].
For multiple comparison procedures, multcomp [48] and multcompView [49] were utilized to assess the statistical significance of observed differences. Phylogenetic analysis was conducted using ape [50], while forcats [51] streamlined categorical data manipulation. The vegan package [36] provided a suite of tools for ecological data analysis, and broom [52] was employed to convert statistical analysis objects into tidy data structures.
Differential abundance testing was performed using ANCOMBC [38], a specialized package for microbiome analysis. Heatmaps for visualizing differential abundance were generated using pheatmap [53]. Additionally, DESeq2 [54] was utilized for cumulative sum scaling transformation prior to beta diversity analysis.
Univariate statistical tests were conducted separately for the fish meal and plant-based groups using one-way ANOVA. This was followed by Welch’s t-tests to assess the impact of each treatment group (0.5%, 1%, and 2% PSP) relative to the control group (0% PSP) within each dietary category. One-way ANOVA was selected as the appropriate method for this study, given its focus on assessing the potential improvements PSP inclusion might offer in either a conventional fishmeal based-diet or an ultramodern plant meal based-diet, independently, rather than investigating the interactive effects between PSP dosage and protein source. This approach was appropriate given that the diets were formulated to be isonitrogenous and isolipidic within each base formulation but varied slightly between formulations.
3. Results
3.1. Growth Performance and Whole-Body Proximate Analysis
At the conclusion of the feeding trial, the rainbow trout exhibited a substantial growth increase, approximately 1100%, with the mean initial weight of around 19 grams increasing to a mean final weight of approximately 230 grams. Detailed metrics on growth performance and nutrient utilization efficiency across the experimental diets are presented in Table 3 and Table 4 respectively. In plant meal-based diets, there were no significant differences in all growth and nutrient utilization efficiencies by PSP dose. However, for fish meal-based diets, there were significant differences in AWG, SGR and DGI. With fish fed a fish meal diet at 1% PSP inclusion (FM3) having the highest AWG, SGR, and DGI while having the least FCR. Whole-body proximate analysis showed no significant differences in moisture, protein, ash, or energy content among the dietary treatments for both FM and PM diets. Similarly, protein efficiency ratio (PER), protein retention, and energy retention remained unaffected by PSP inclusion.
3.2. Intestinal Gene Expression
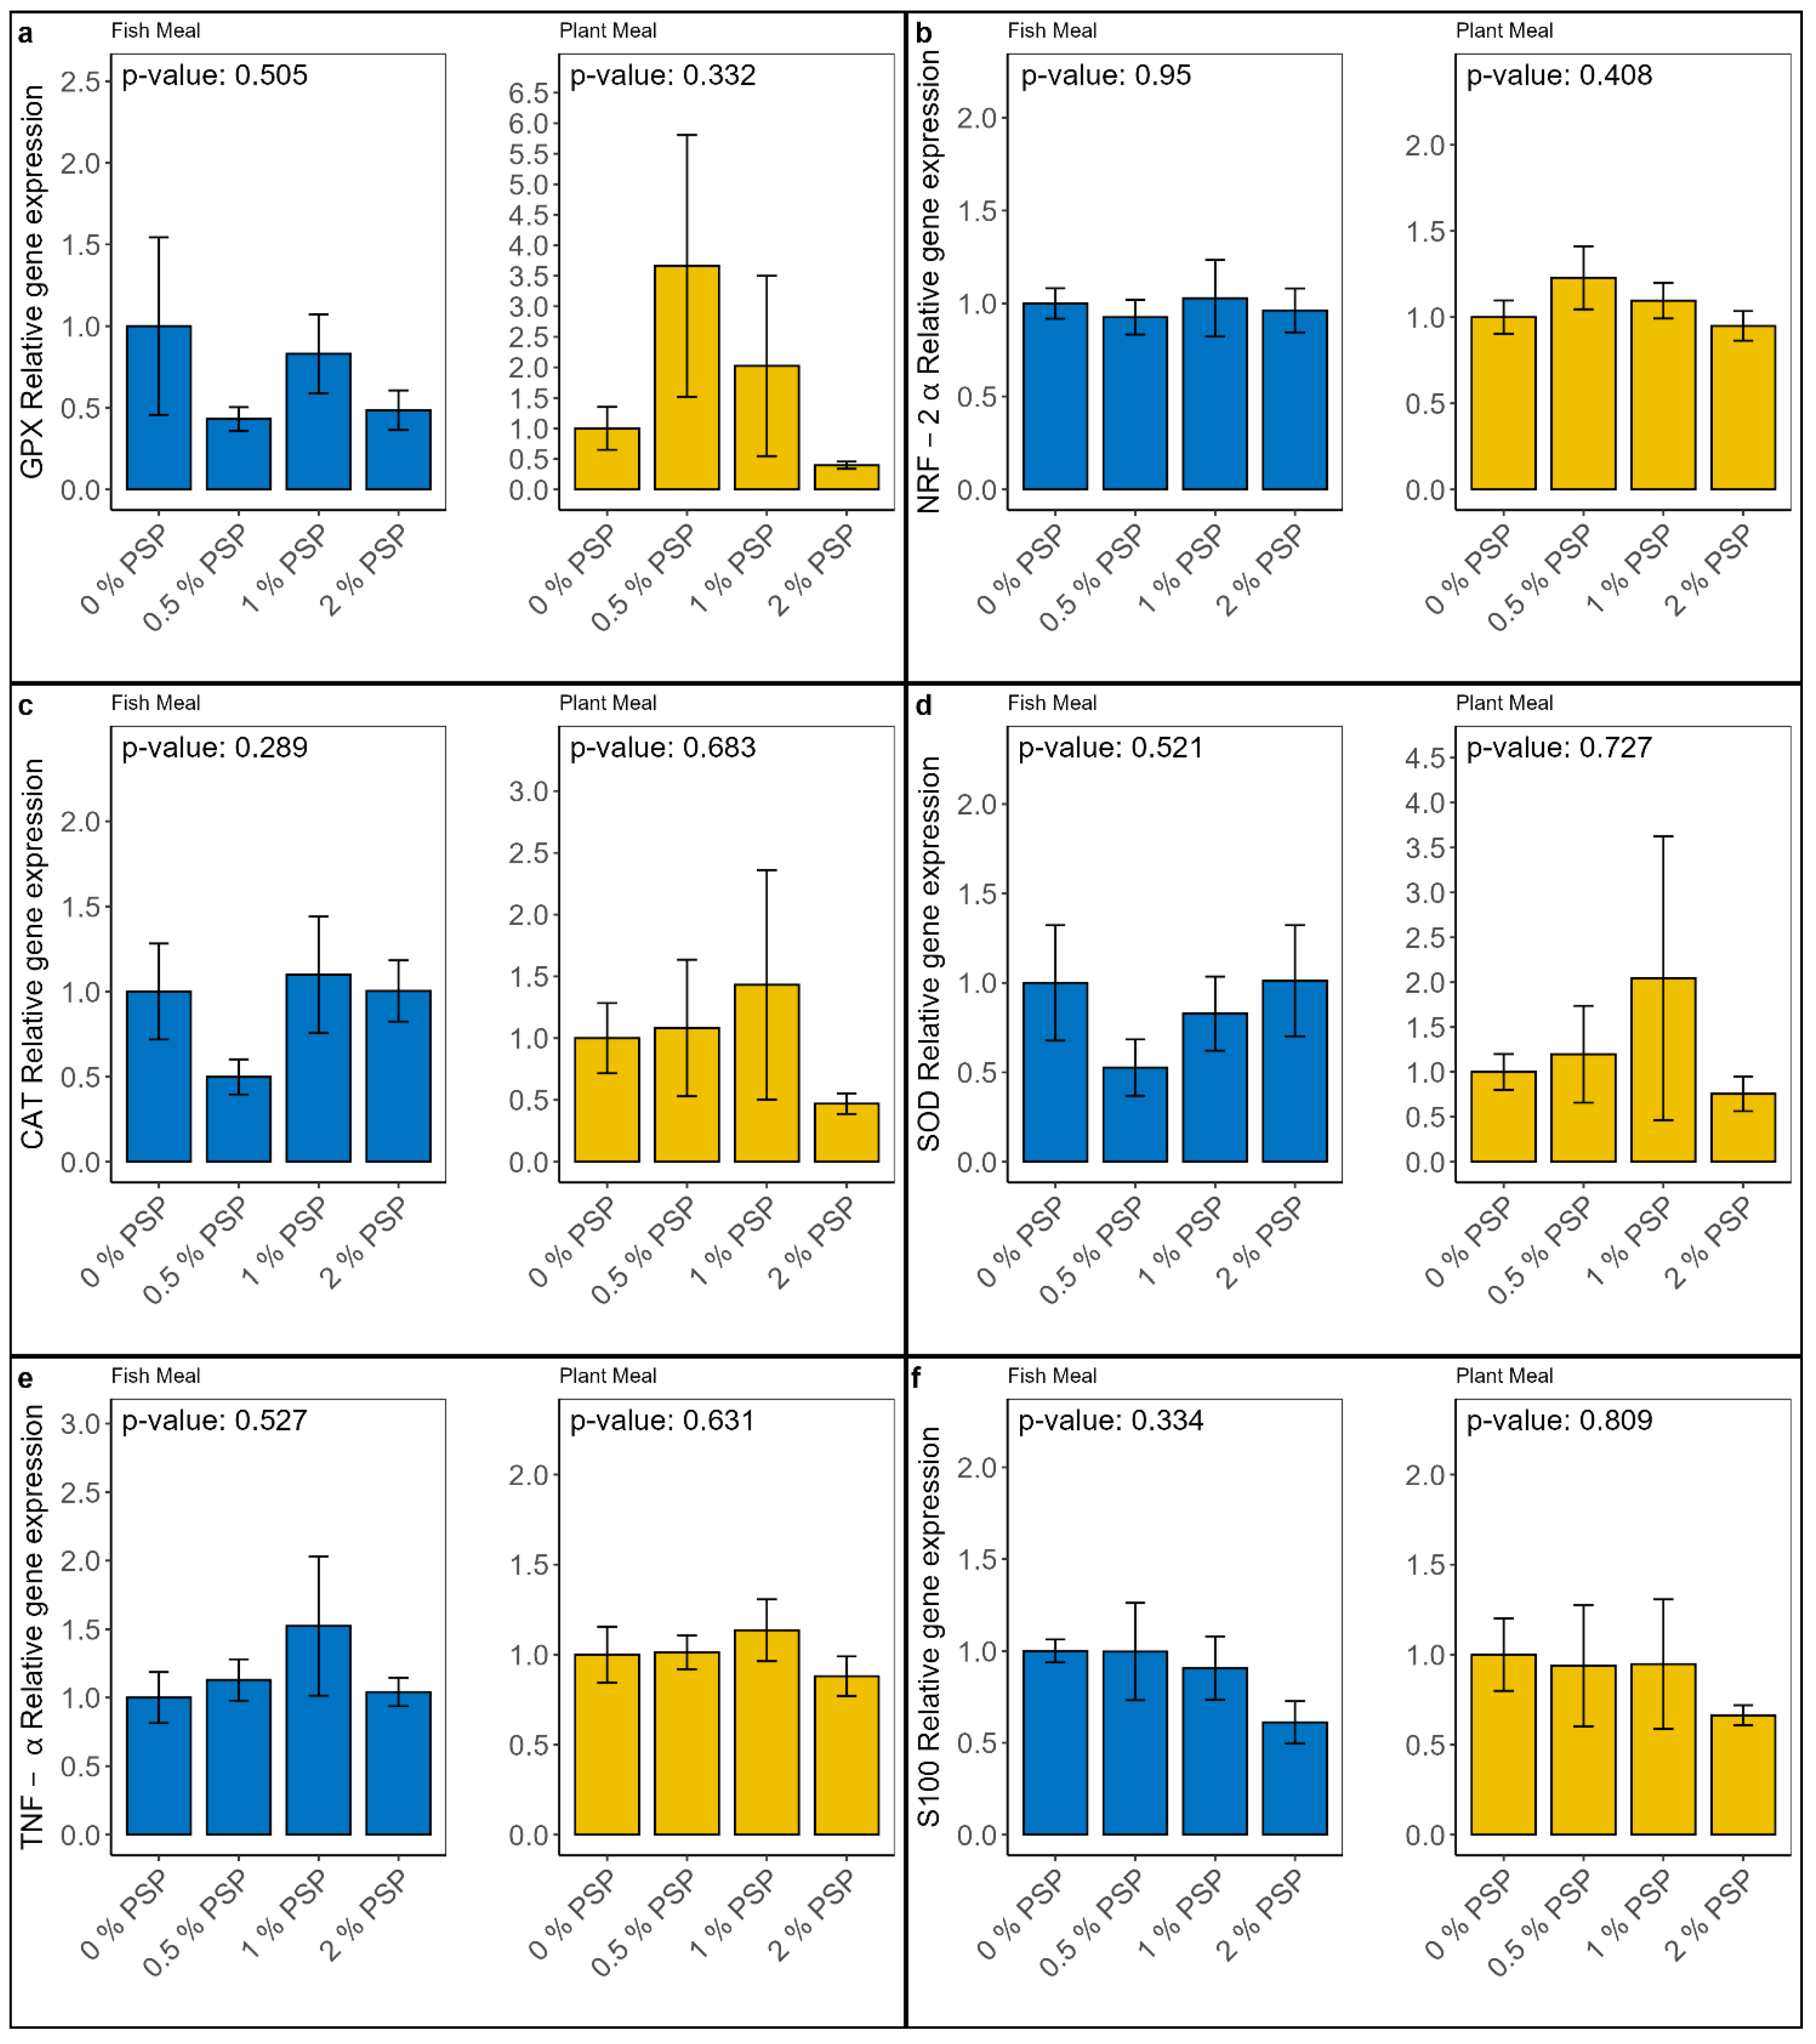
Dietary inclusion of pistachio shell powder (PSP) did not significantly affect (P > 0.05) the relative mRNA expression of genes involved in oxidative stress (GPX-1, NRF-2α, CAT, SOD; Figure 1a - d) and inflammatory response (TNF-α, S100; Figure 1e &1f) in the distal intestine of rainbow trout. However, a trend towards down-regulation of genes involved in inflammatory response was observed at the highest PSP inclusion level (2%) in the plant-based diet group.
Figure 1.
Relative mRNA expression of genes involved in oxidative stress: GPX, NRF-2α, CAT, SOD (a, b, c, & d, respectively) and inflammatory response TNF-α, S100 (e & f respectively) in the distal intestine of rainbow trout fed fish meal or plant-based meal diets with varying levels of pistachio shell powder (PSP) inclusion (0%, 0.5%, 1%, 2%). P-values indicate the significance of differences between PSP inclusion levels within each diet type (One-way ANOVA). Y-axis represents fold-change in expression.
3.3. TAC and TPC Analyses
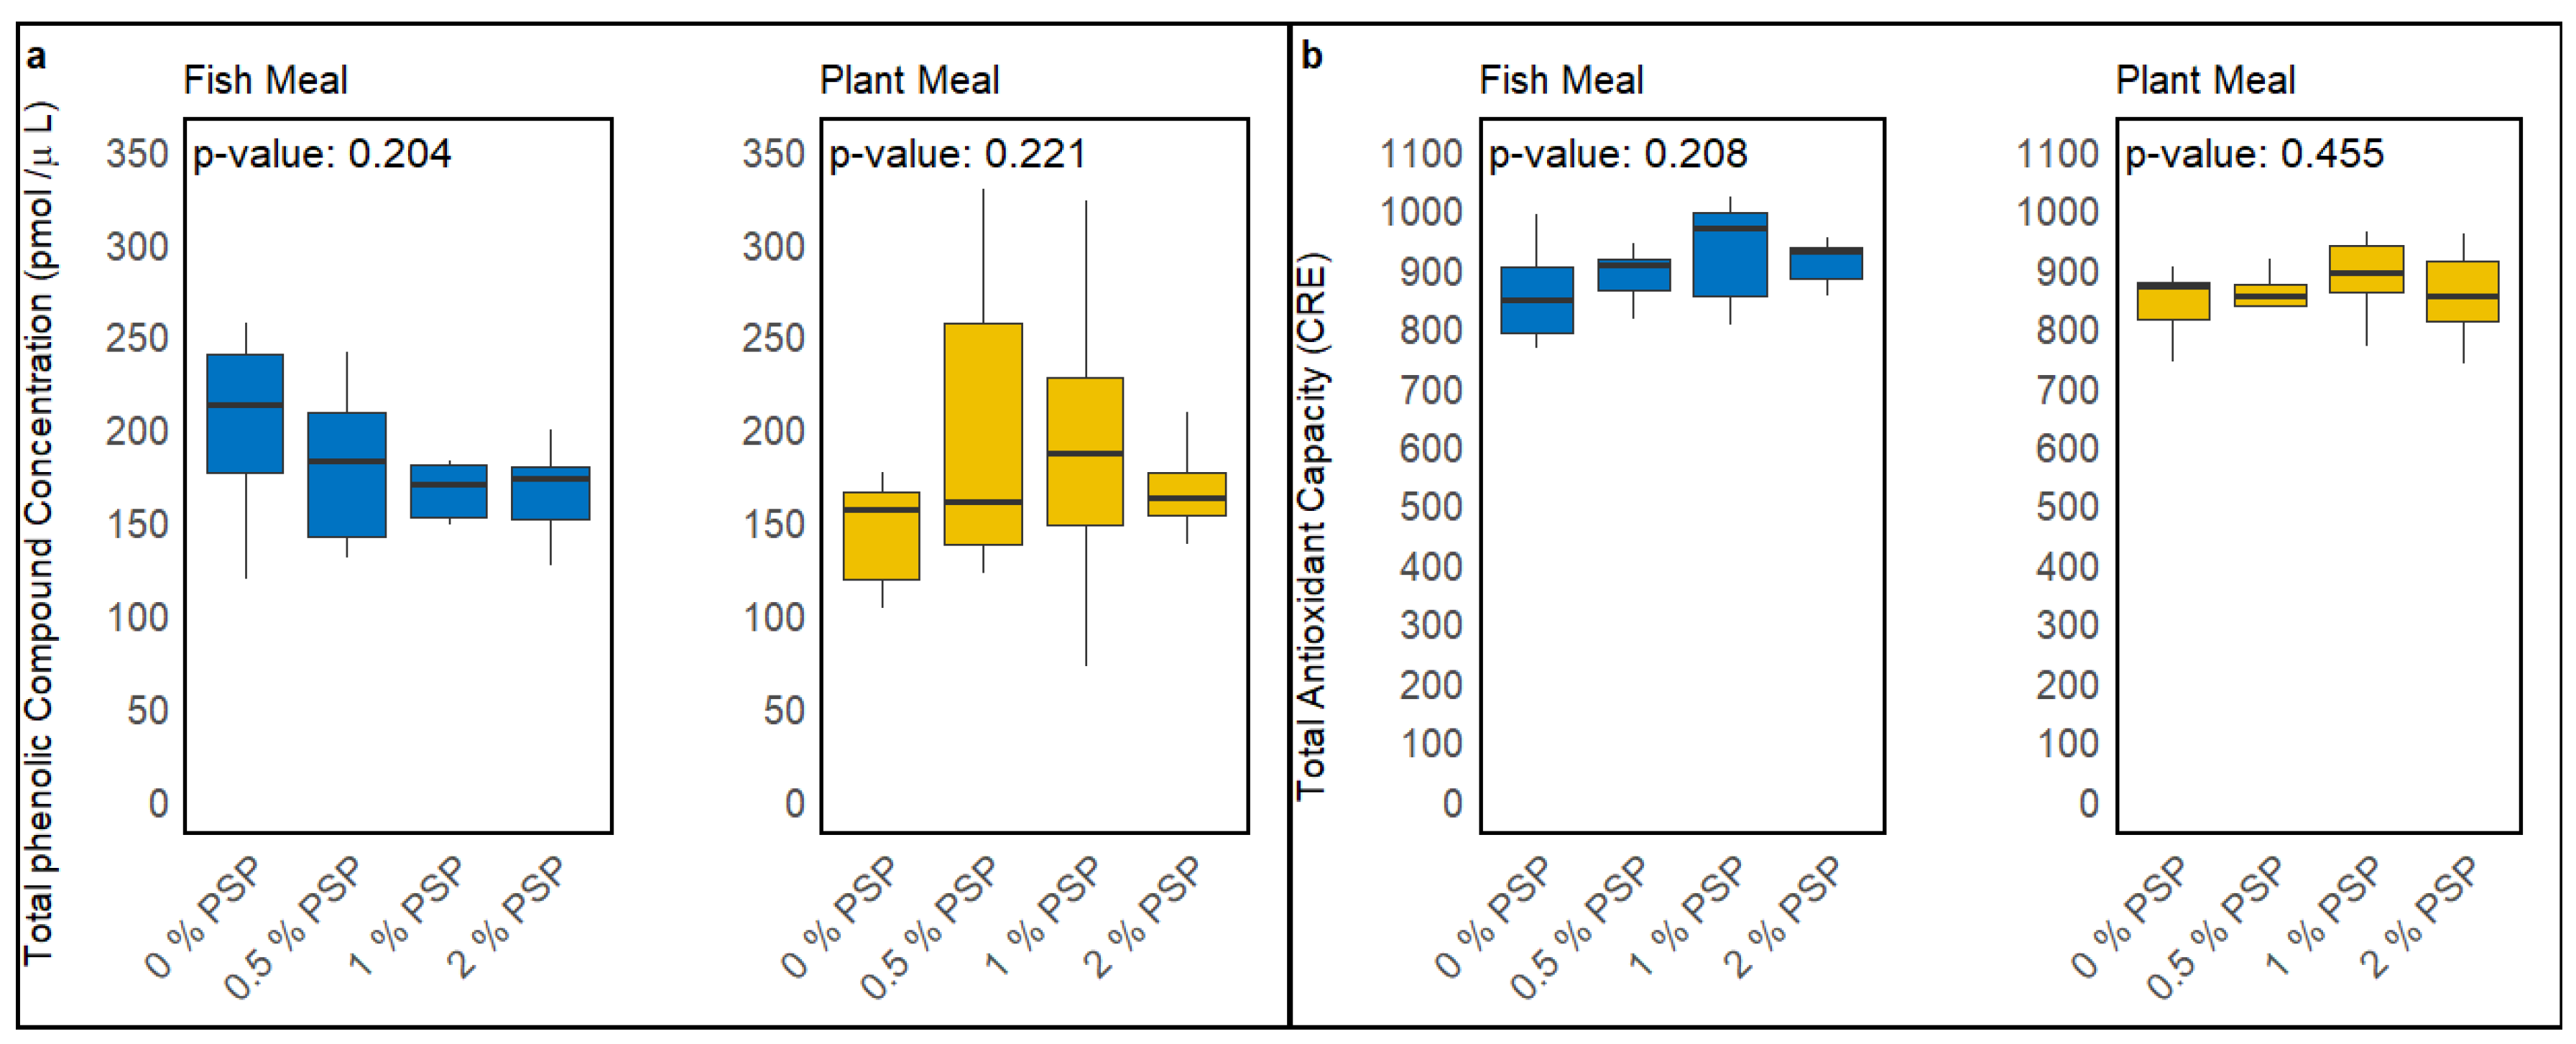
Dietary inclusion of pistachio shell powder (PSP) did not significantly alter the total phenolic compound concentration (TPC) or total antioxidant capacity (TAC) in the serum of rainbow trout fed either fish meal-based or plant-based diets. In fish fed fish meal diets, a slight decrease in TPC and a slight increase in TAC were observed with increasing PSP inclusion levels; however, these trends were not statistically significant (p = 0.204 for TPC, p = 0.208 for TAC; Figure 2a & 2b) Similarly, in the serum of fish fed plant-based diets, increasing PSP inclusion levels resulted in a minor increase in both TPC and TAC, although these effects were also not statistically significant (p = 0.221 for TPC, p = 0.455 for TAC ; Figure 2a & 2b).
Figure 1.
Effect of dietary pistachio shell powder (PSP) inclusion on total phenolic compound (TPC) concentration (a) and total antioxidant capacity (TAC) (b) in the serum of rainbow trout fed fish meal or plant-based meal diets at PSP inclusion levels (0%, 0.5%, 1%, 2%). P-values indicate the significance of differences between PSP inclusion levels within each diet type (One-way ANOVA). CRE is the μM copper reducing equivalents, which is proportional to TAC.
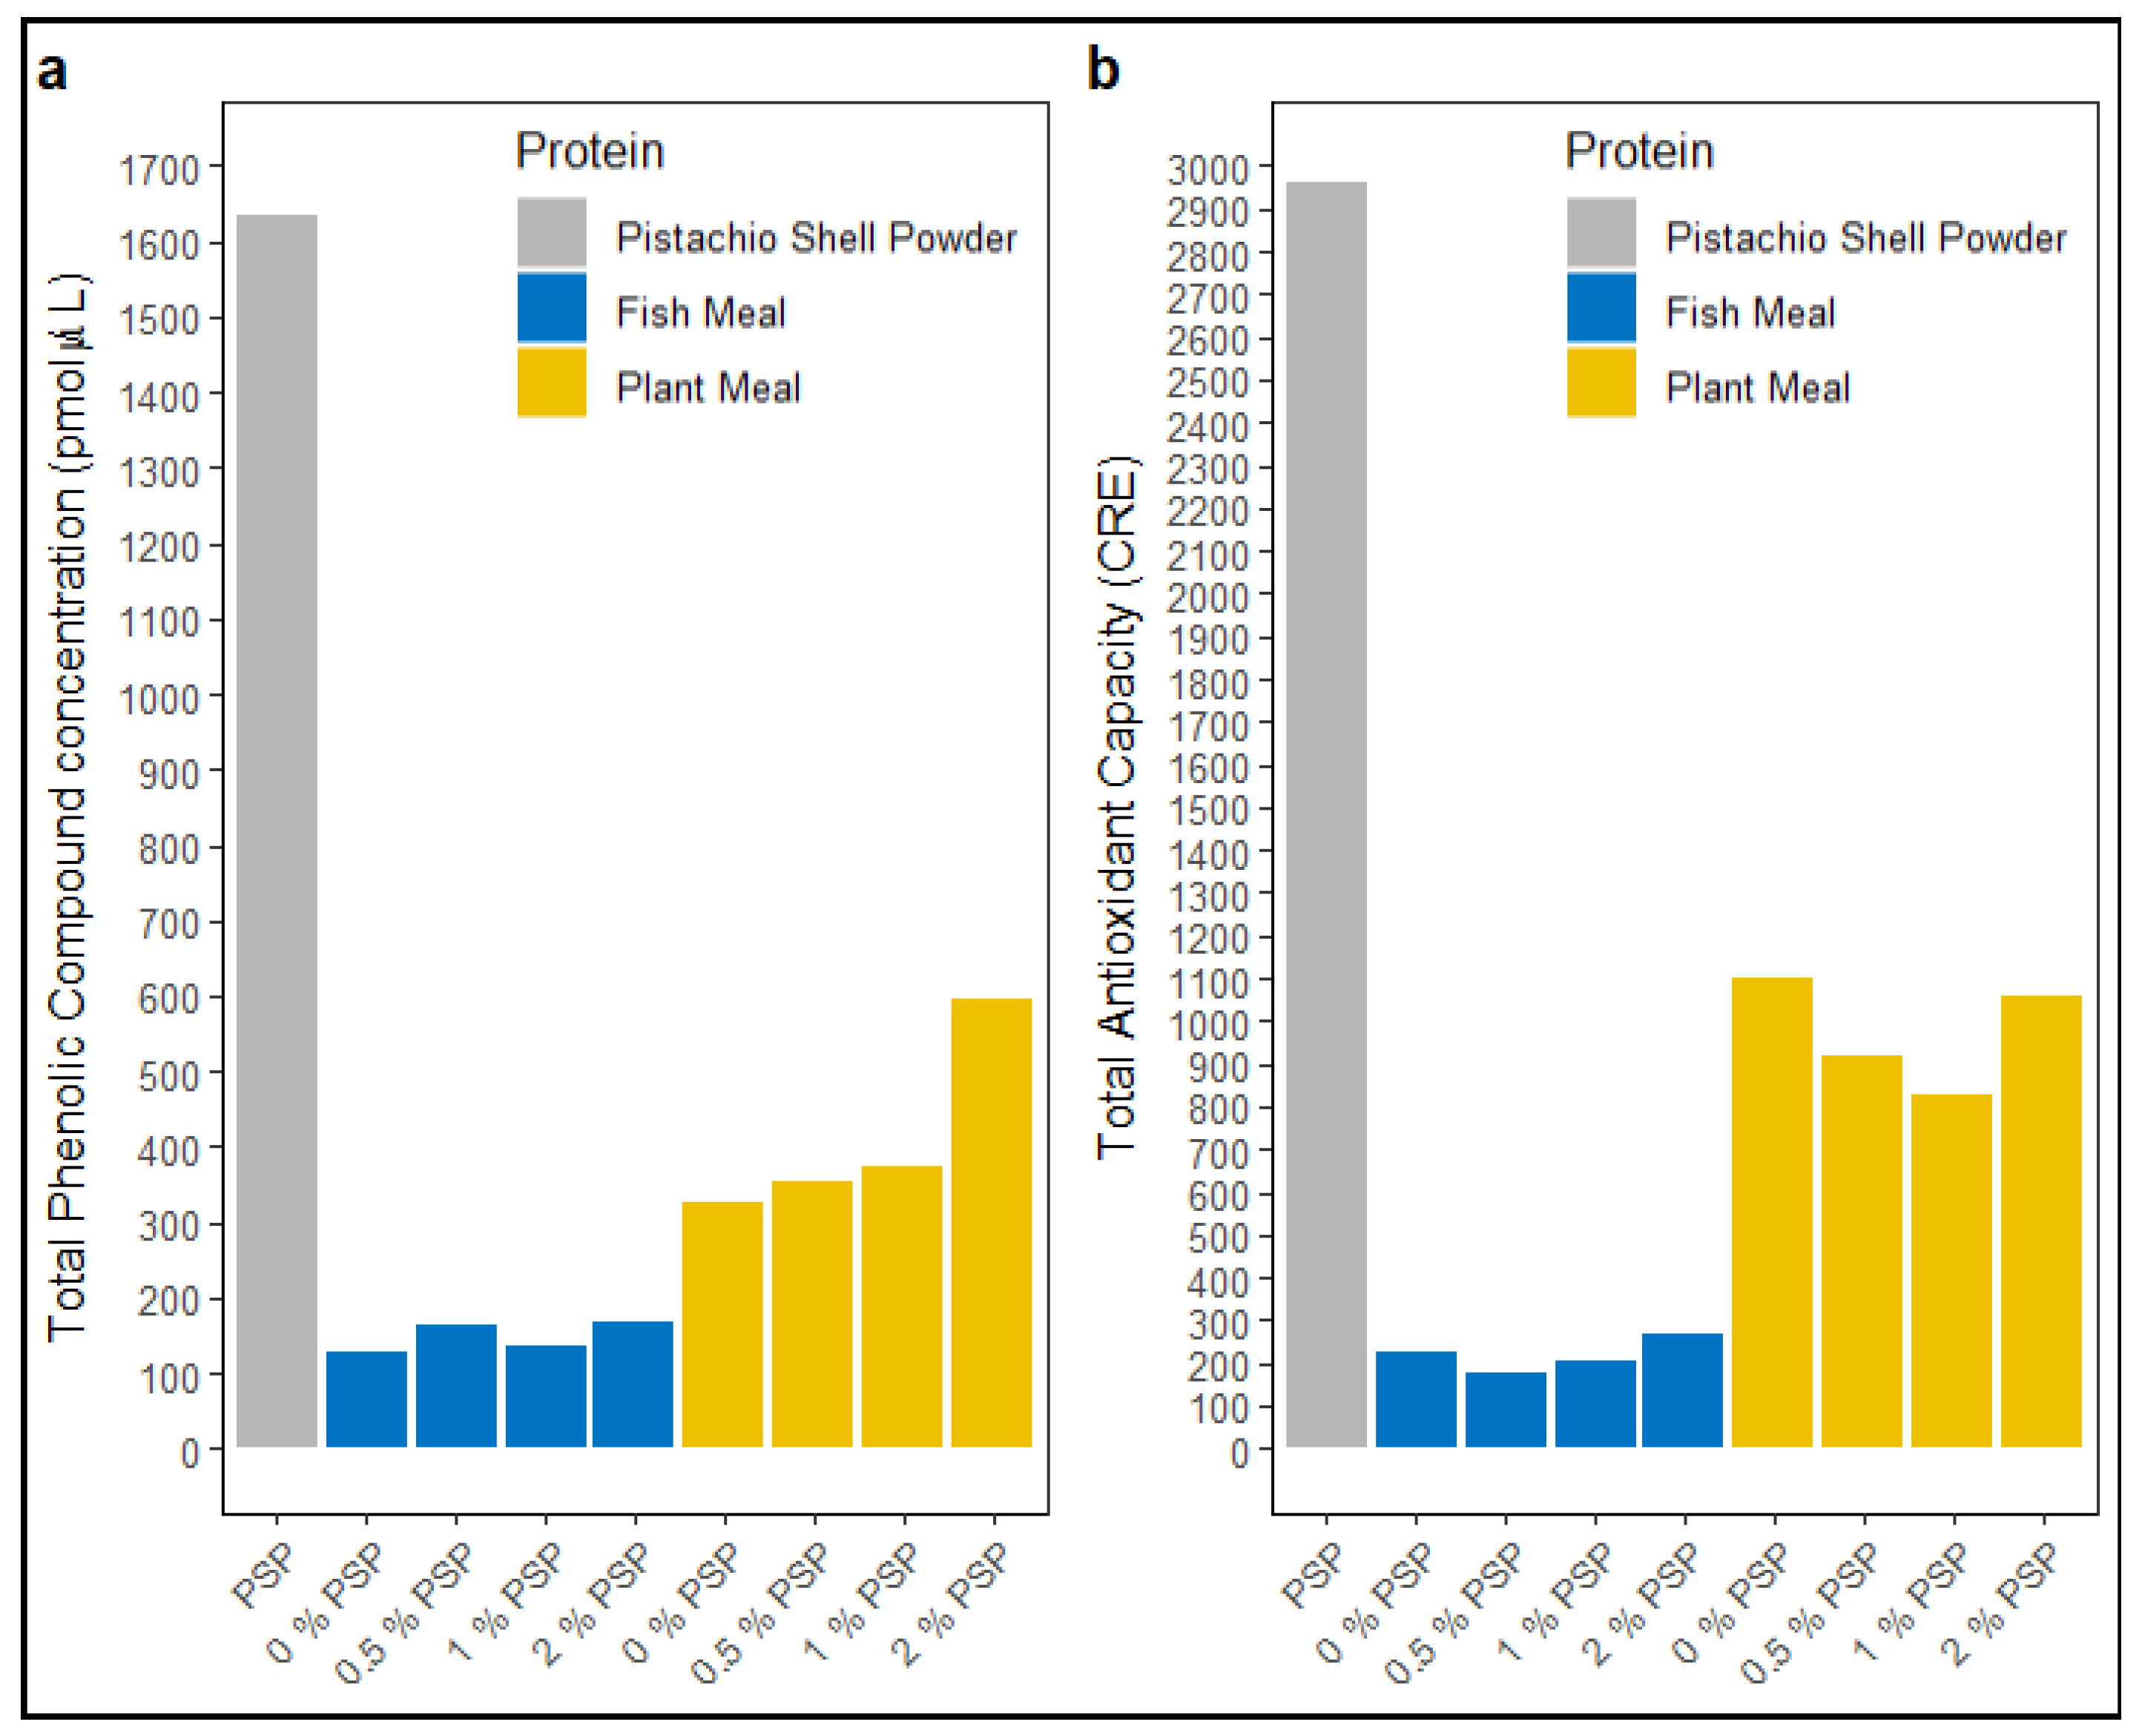
Dietary pistachio shell powder (PSP) showed a total phenolic compound concentration (TPC) of ~1635 pmol/μL (Figure 3a) and a total antioxidant capacity (TAC) of ~2964 CRE (Figure 3b). The inclusion of PSP in fish meal diets did not affect TPC or TAC levels (Figure 3a & b). However, in plant-based meal diets, TPC levels increased with increasing PSP inclusion (Figure 3a).
Figure 2.
Total phenolic compound (TPC) concentration (a) and total antioxidant capacity (TAC) (b) in pistachio shell powder (PSP), fish meal, and plant meal diets at PSP inclusion levels (0%, 0.5%, 1%, 2%).
Figure 2.
Total phenolic compound (TPC) concentration (a) and total antioxidant capacity (TAC) (b) in pistachio shell powder (PSP), fish meal, and plant meal diets at PSP inclusion levels (0%, 0.5%, 1%, 2%).
3.4. Alpha Diversity
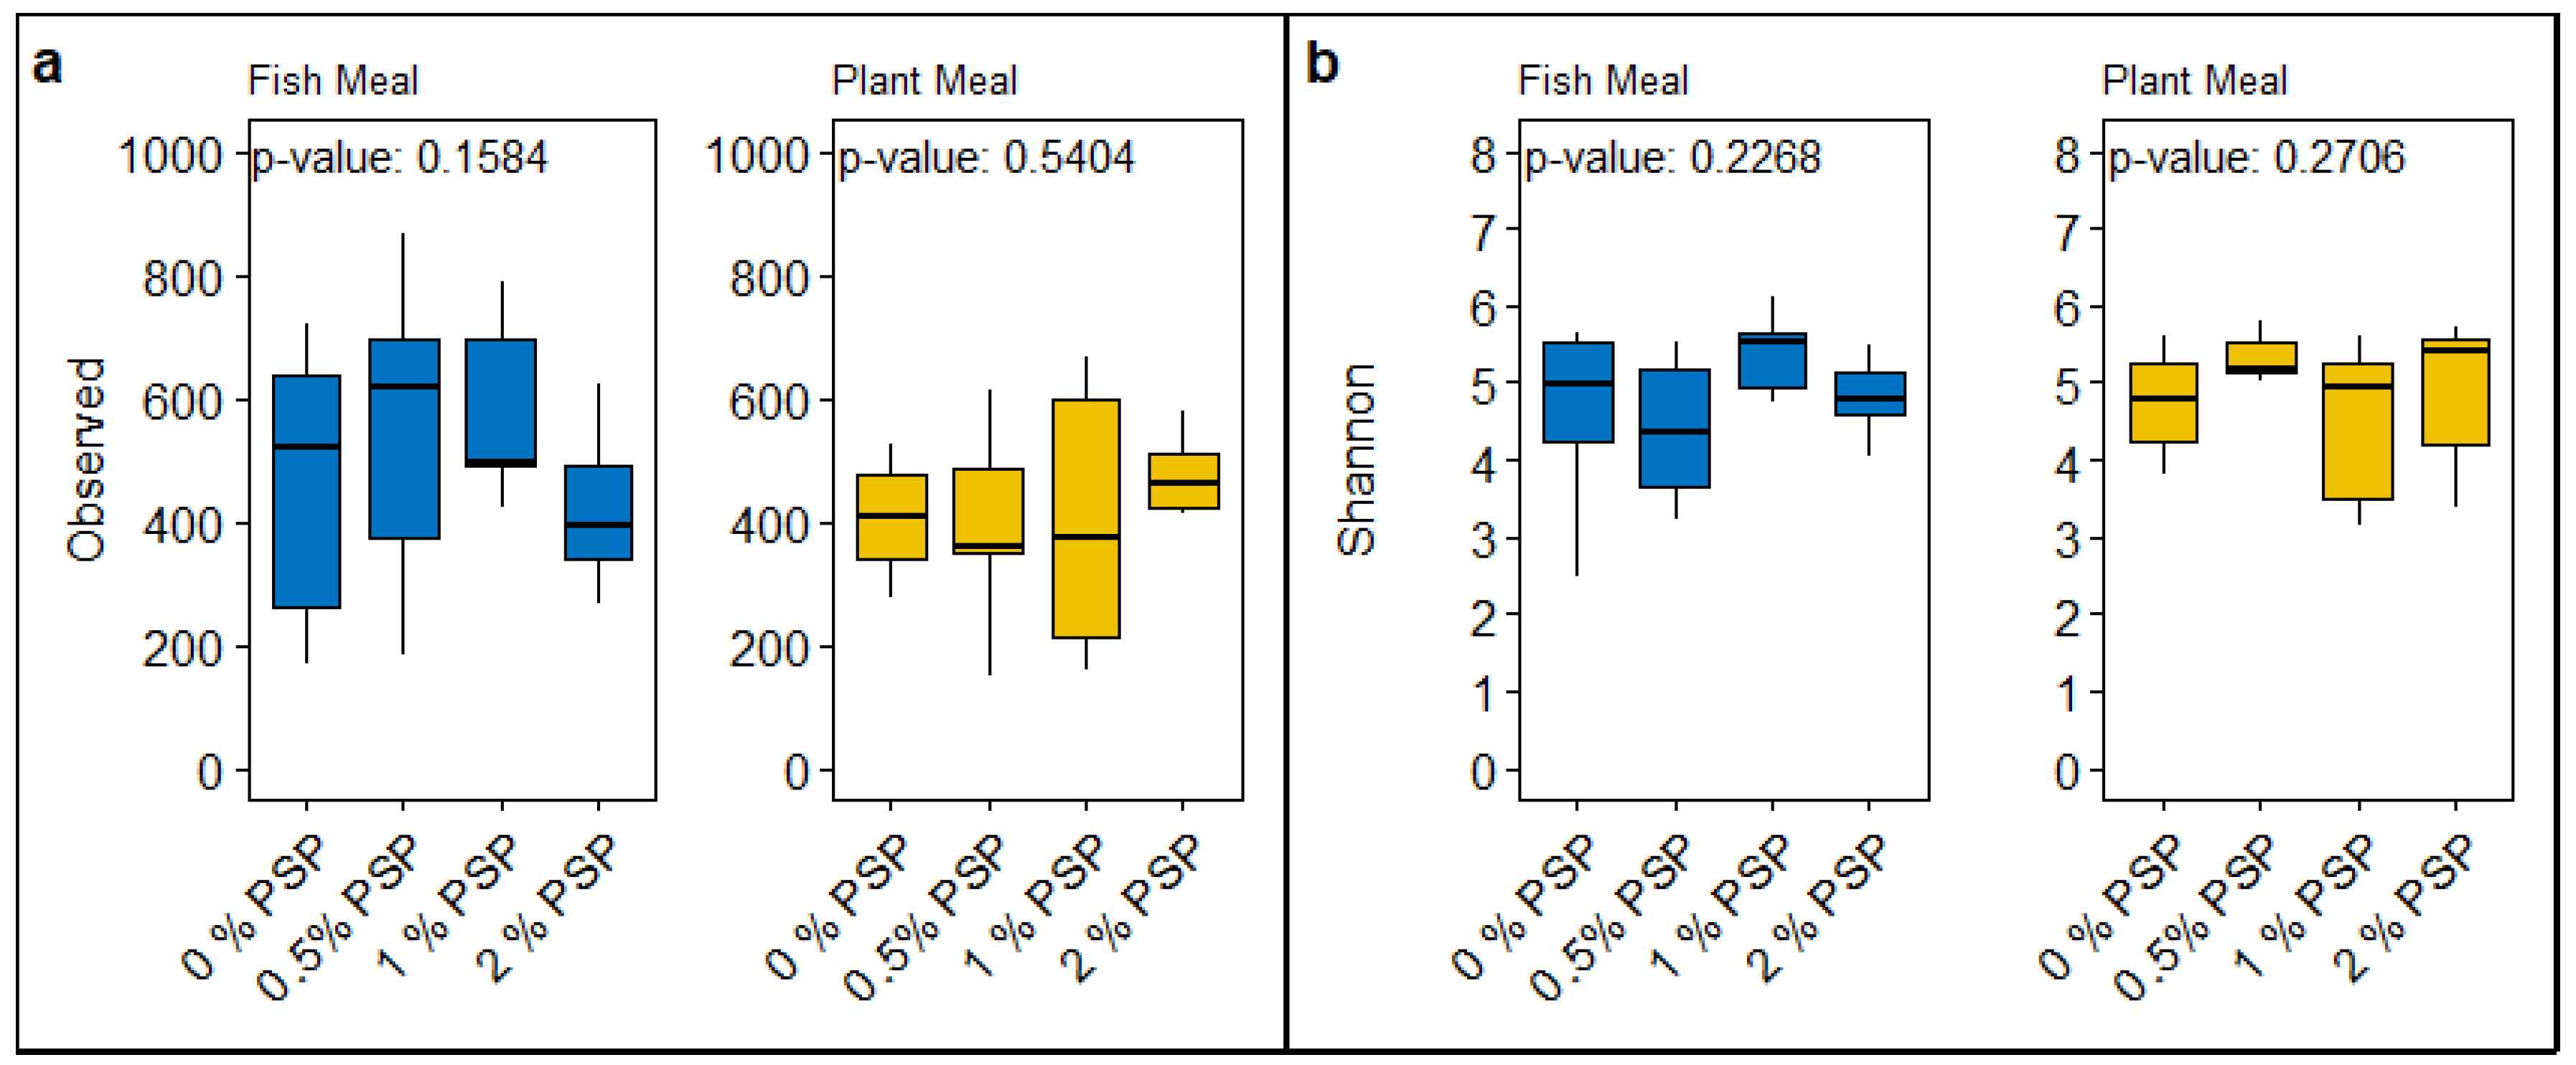
The inclusion of pistachio shell powder (PSP) in both fish meal and plant-based meal diets did not significantly affect the alpha diversity of the gut microbiota in rainbow trout, as measured by observed ASVs (Amplicon Sequence Variants) and Shannon diversity index. In fish meal diets, there were no significant differences in either observed ASVs (p = 0.1584; Figure 4a) or Shannon diversity (p = 0.2268; Figure 4b) across varying levels of PSP inclusion (0%, 0.5%, 1%, 2%). This suggests that PSP did not substantially alter the richness or evenness of bacterial species in the gut of fish fed with fish meal. Similarly, in plant-based meal diets, the inclusion of PSP did not significantly influence observed ASVs (p = 0.5404; Figure 4a) or Shannon diversity (p = 0.2706; Figure 4b).
Overall, these results suggest that PSP inclusion, up to 2%, does not have a major impact on the alpha diversity of gut microbiota in rainbow trout, regardless of whether the basal diet is fish meal or plant based.
Figure 3.
A comparative analysis of microbial alpha diversity indices across different dietary treatments containing either fish meal or plant meal, each supplemented with varying levels of pistachio shell powder (PSP) inclusion (0%, 0.5%, 1%, 2%, and 4%). Panel (a) displays box plots representing the “Observed” species richness within the gut microbiomes of the sampled groups. Panel (b) illustrates the “Shannon” diversity index, a measure of both the richness and evenness of species present within the microbiomes.
3.5. Beta Diversity
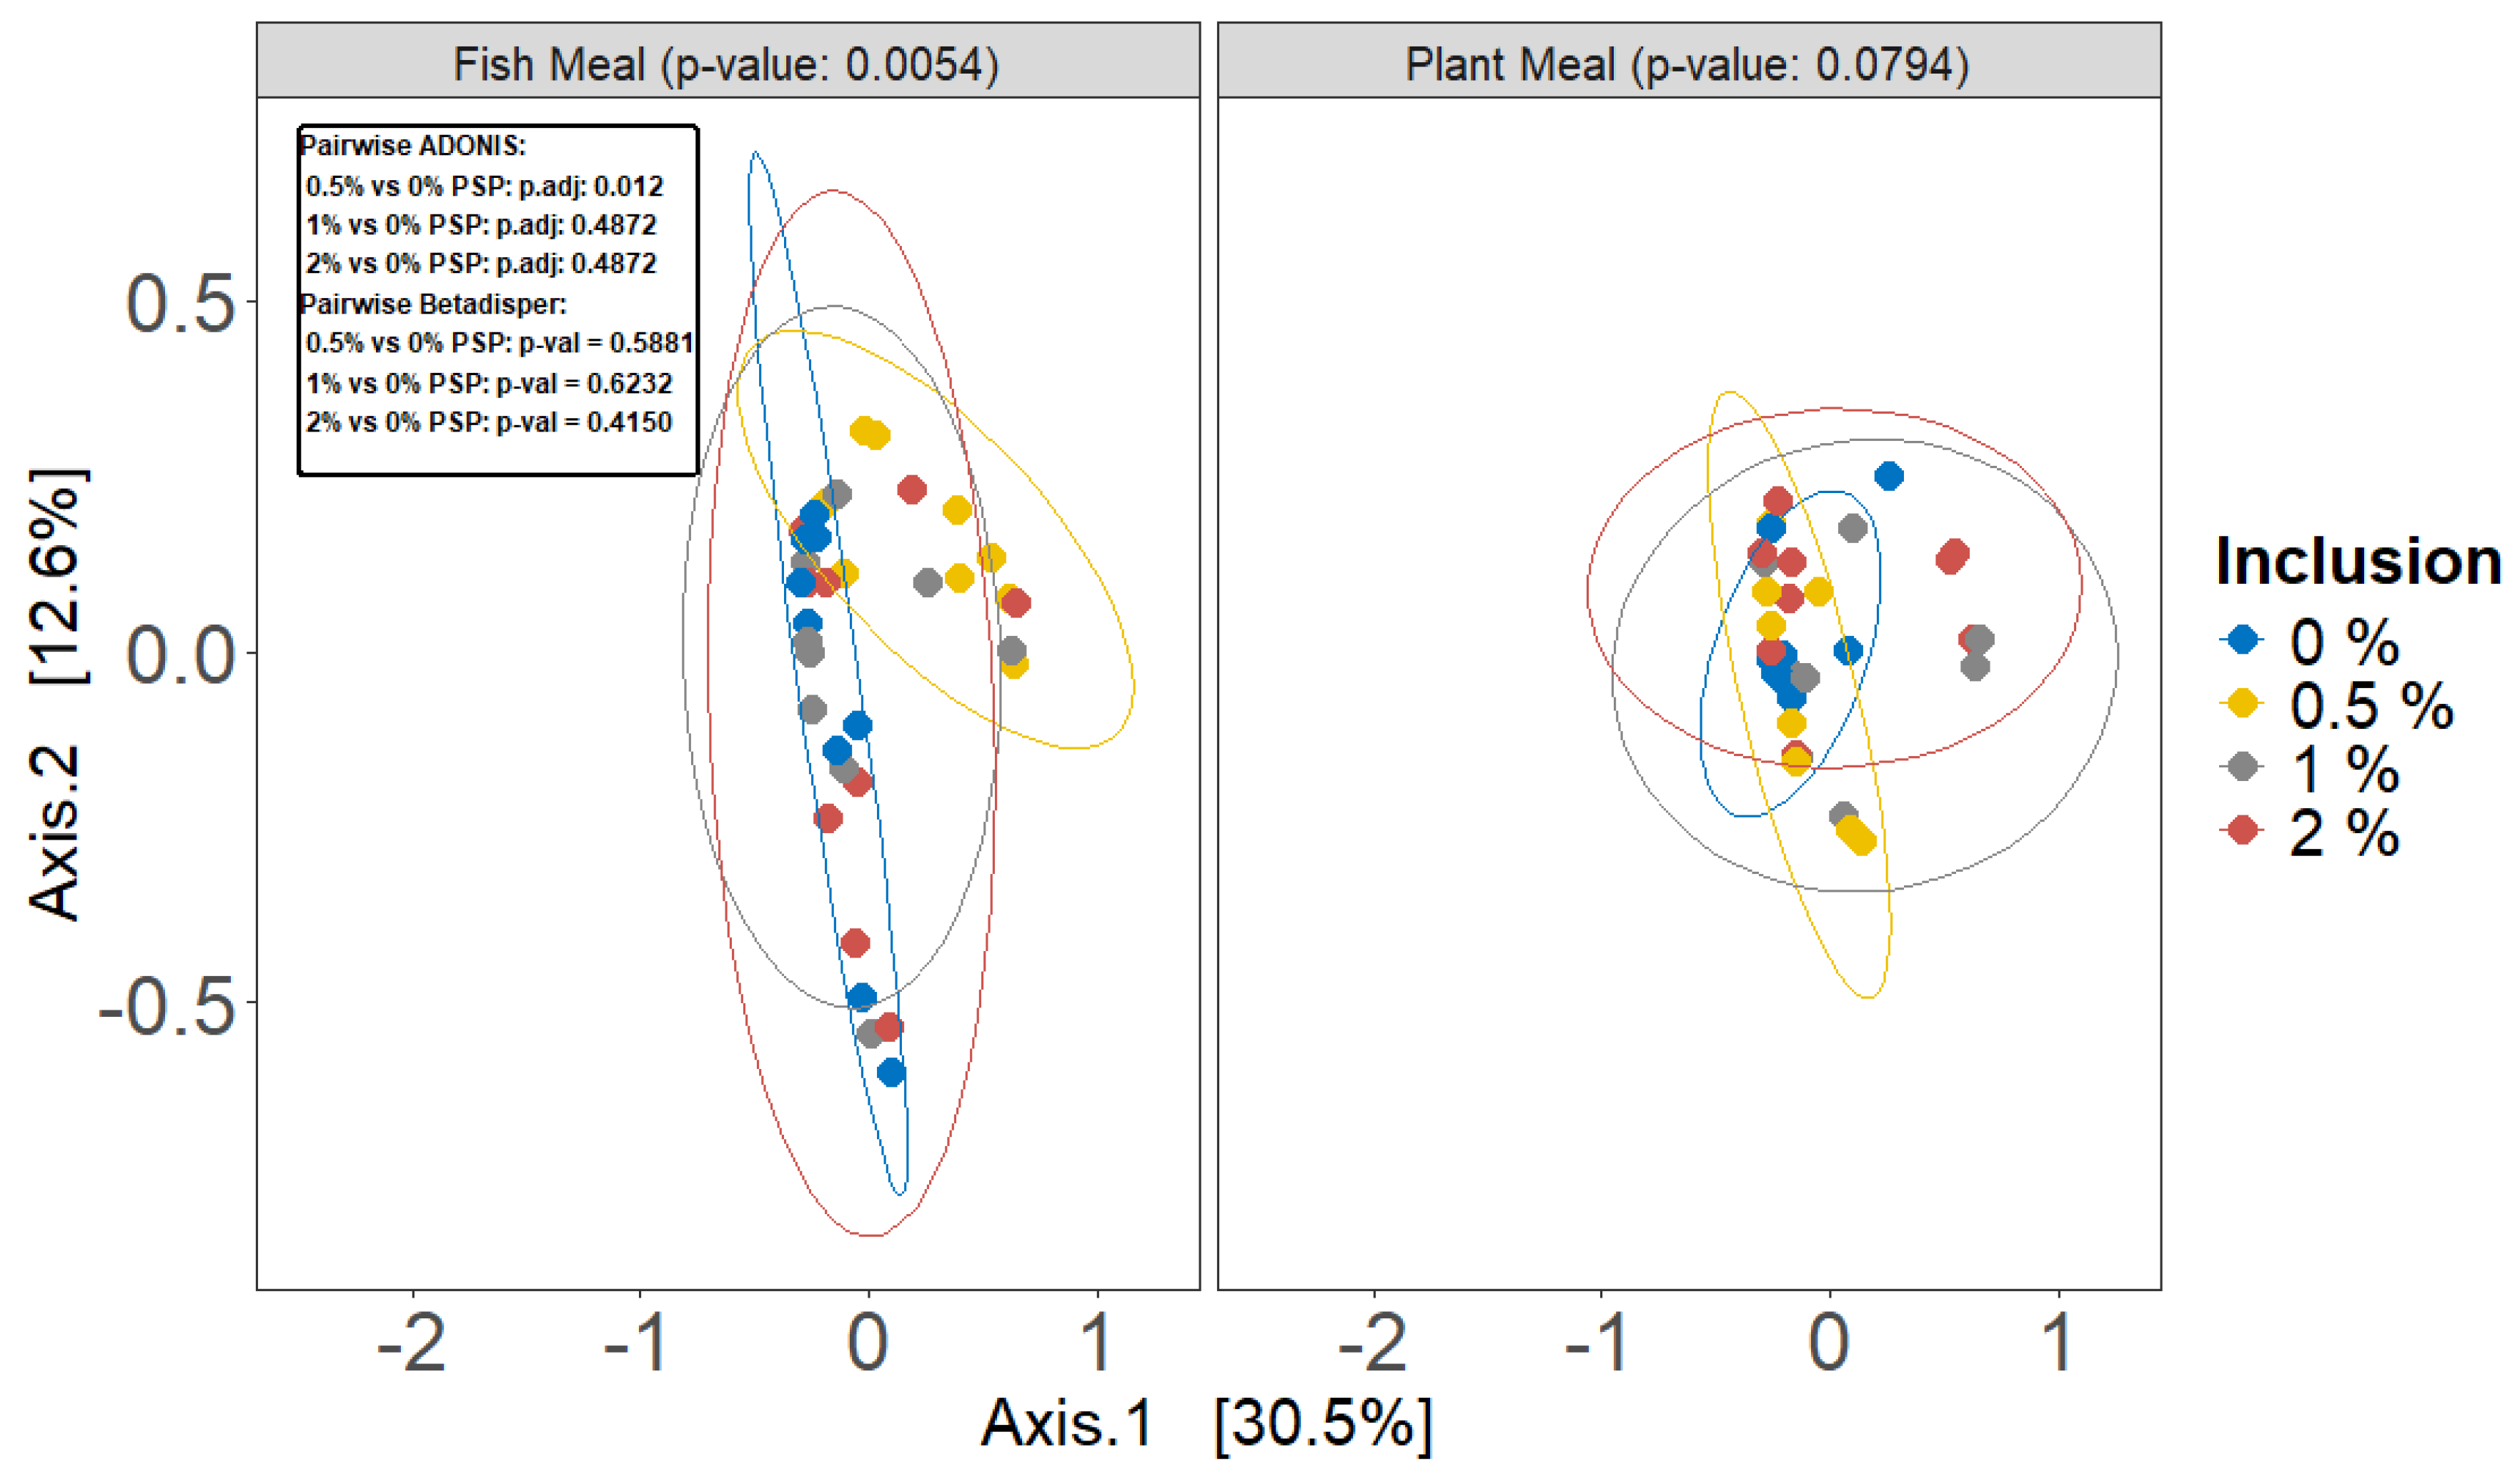
Pistachio shell powder (PSP) inclusion significantly altered the beta diversity of gut microbiota in rainbow trout fed fish meal diets (ADONIS, p = 0.0054; Figure 5), with the 0.5% inclusion level differing significantly from the control (pairwise ADONIS, q = 0.012; Figure 5). However, no significant differences were observed between the control group and other groups. Conversely, in fish fed plant-based meals, PSP inclusion did not significantly affect beta diversity (ADONIS, p = 0.0794; Figure 5), although a visual separation in the PCoA plot suggests potential subtle shifts in community composition. The dispersion of data points among PSP inclusion levels was homogeneous in both diet types (betadisper, p > 0.05; Figure 5).
Figure 4.
Beta diversity of gut microbiota as influenced by different dietary protein sources and levels of pistachio shell powder (PSP) inclusion, assessed using Bray-Curtis dissimilarity metrics with ADONIS test. The analysis is presented in two principal coordinate analysis (PCoA) plots, one for Fish Meal (left), one for Plant Meal (right). Individual sample beta diversity is represented by points, colored by the dietary PSP inclusion level (0%, 0.5%, 1%, or 2%) being received by that individual.
3.6. Differential Abundance
In rainbow trout fed a fishmeal-based diet, the inclusion of pistachio shell powder (PSP) induced significant alterations in the relative abundance of several gut bacterial genera. Specifically, Candidatus arthromitus showed a marked increase in abundance at all levels of PSP inclusion (0.5%, 1%, and 2%) compared to the control group (0% PSP). In contrast, Mycoplasma was significantly depleted with increasing PSP levels, while Hafnia-Obesumbacterium was significantly depleted at the 0.5% PSP inclusion level but enriched at the 1% and 2% inclusion levels. The magnitude and direction of these changes were dependent on PSP concentration. For instance, Thermus and Comamonas exhibited a consistent decrease at all PSP inclusion levels, whereas Bacillus increased only at the highest PSP inclusion level (2%). Additionally, Sphingomonas and Aeromonas demonstrated a positive correlation with PSP inclusion, increasing in abundance as PSP levels increased.
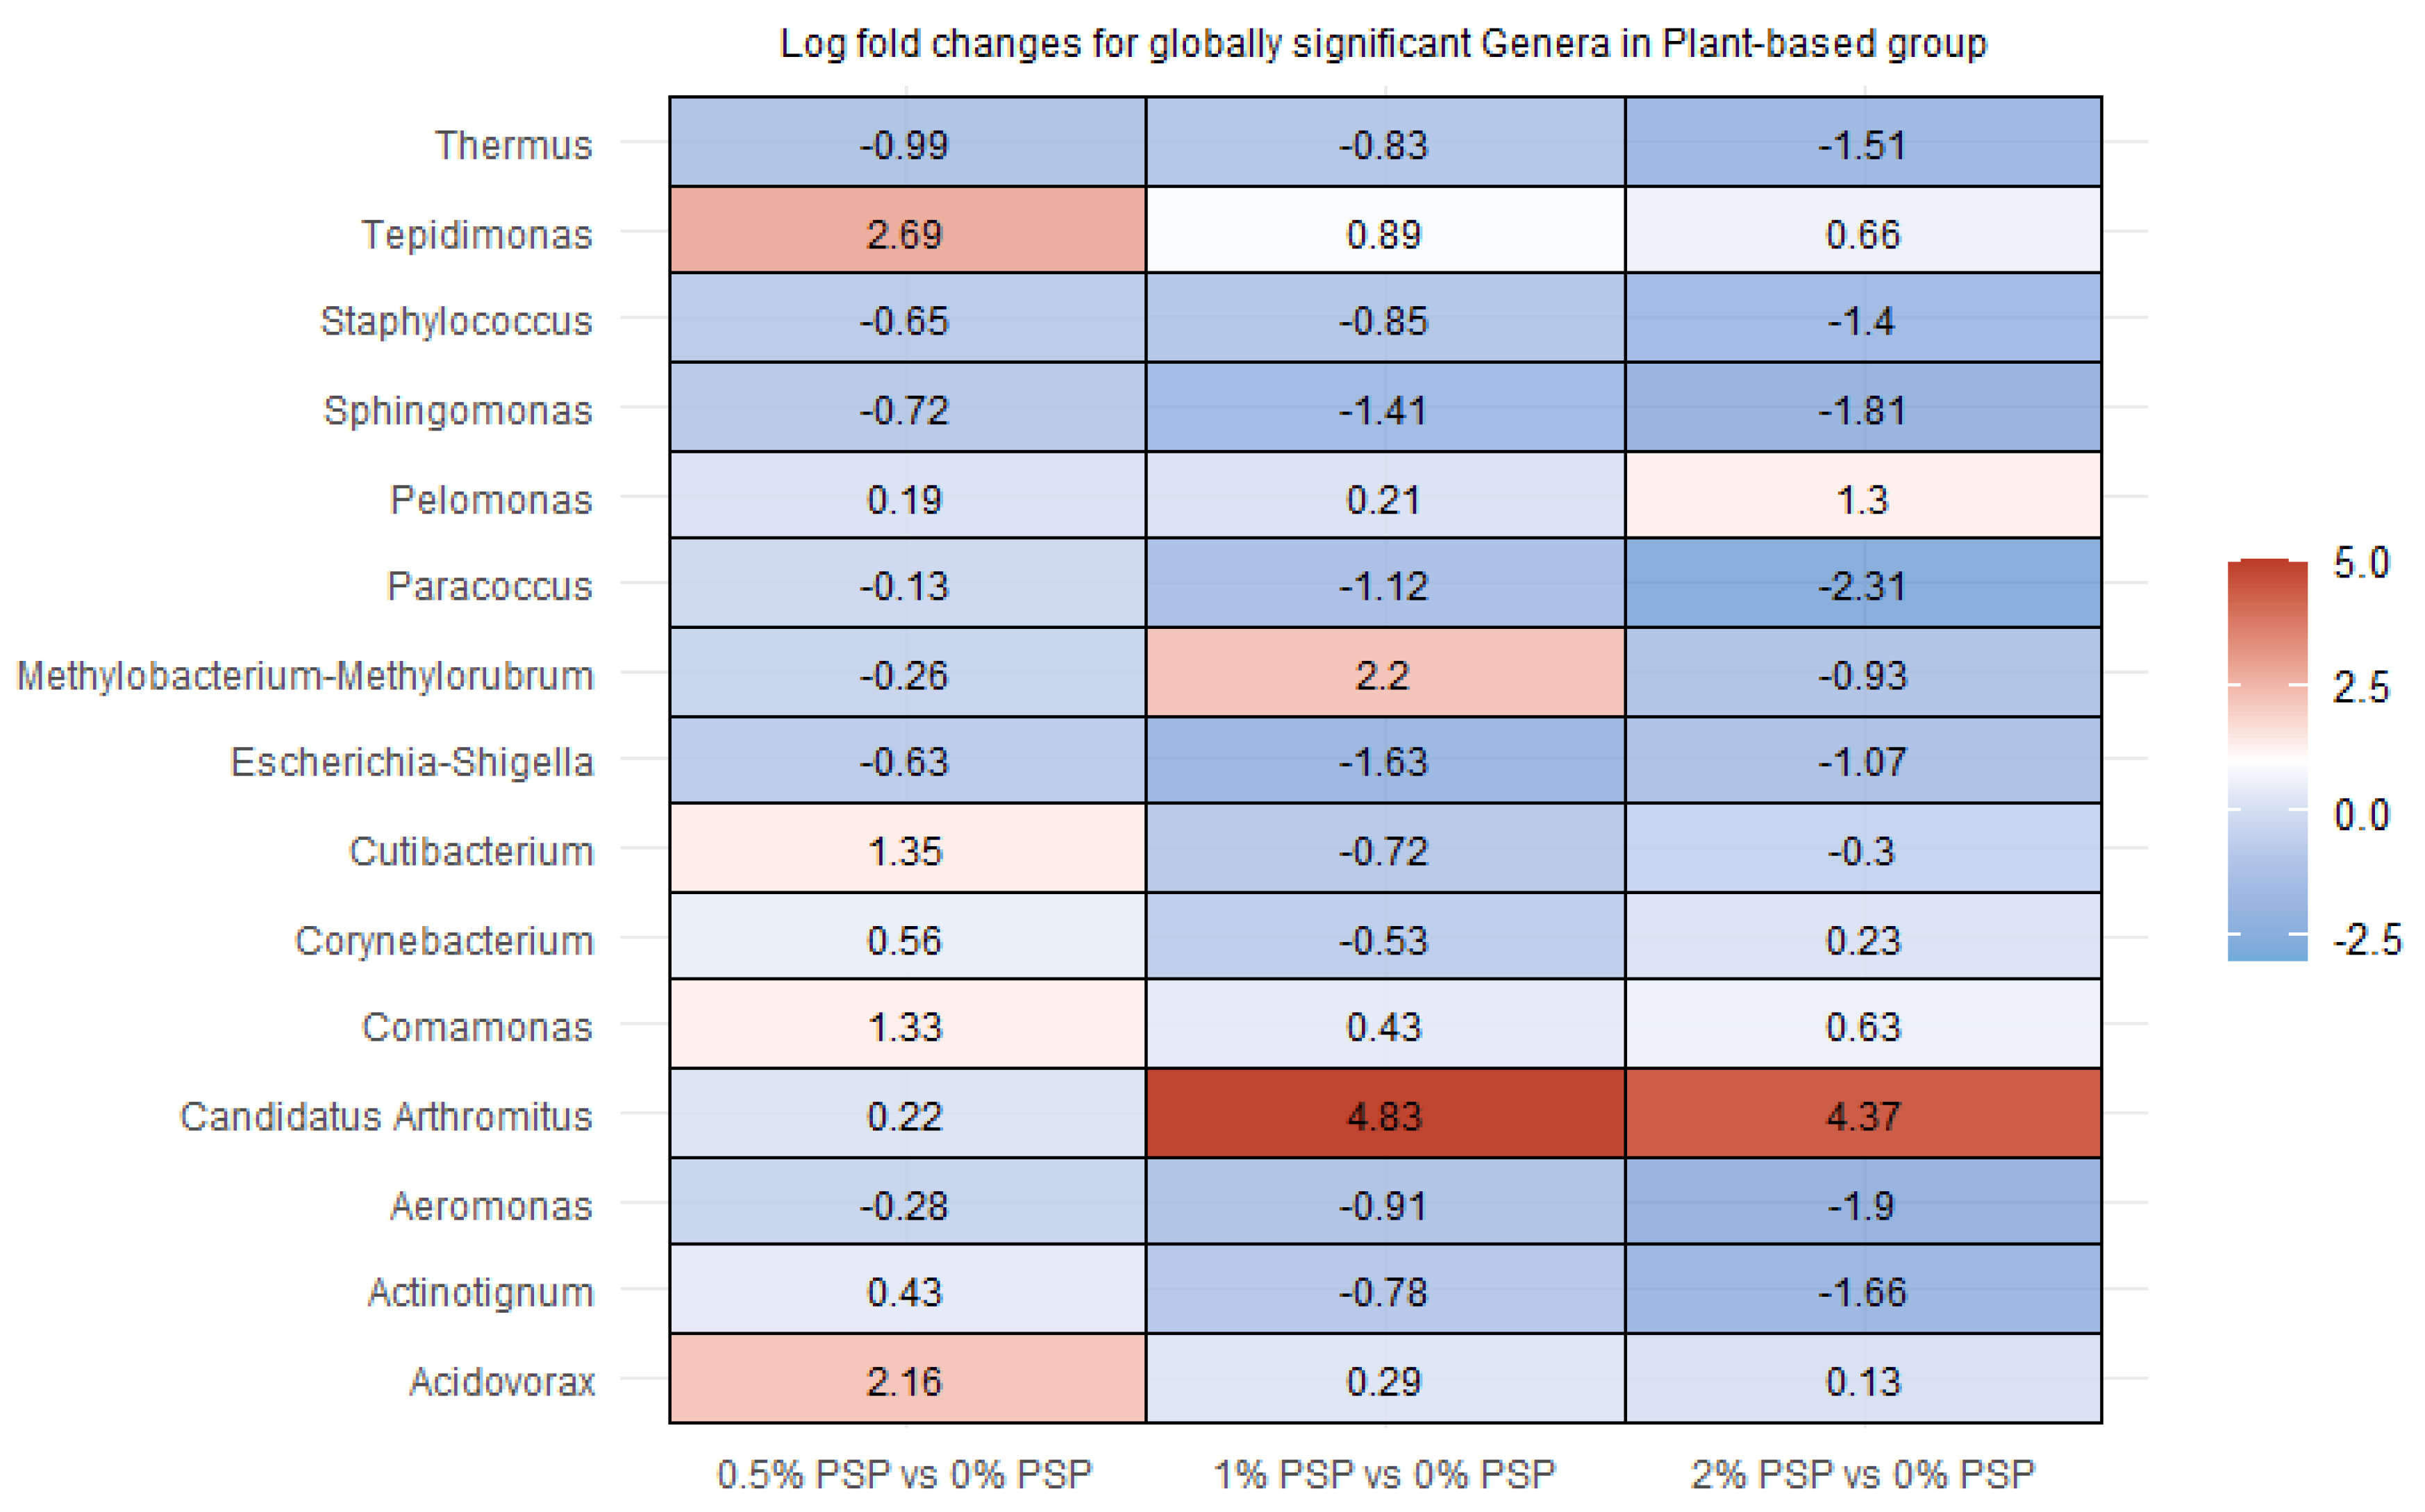
In rainbow trout fed a plant-based diet, pistachio shell powder (PSP) inclusion resulted in significant alterations in the relative abundance of several gut bacterial genera. Tepidimonas and Candidatus arthromitus showed notable increases with PSP inclusion, particularly at 1% and 2% PSP, respectively. In contrast, Paracoccus and Sphingomonas displayed significant decreases at all PSP inclusion levels. Other genera, such as Thermus, Staphylococcus, and Aeromonas, showed mixed responses, with decreases at certain PSP concentrations and increases or no change at others.
Figure 5.
Differential abundance of bacterial genera in the distal intestines of fish fed fishmeal-based diets with varying levels of pistachio shell powder (PSP) inclusion.
Figure 5.
Differential abundance of bacterial genera in the distal intestines of fish fed fishmeal-based diets with varying levels of pistachio shell powder (PSP) inclusion.
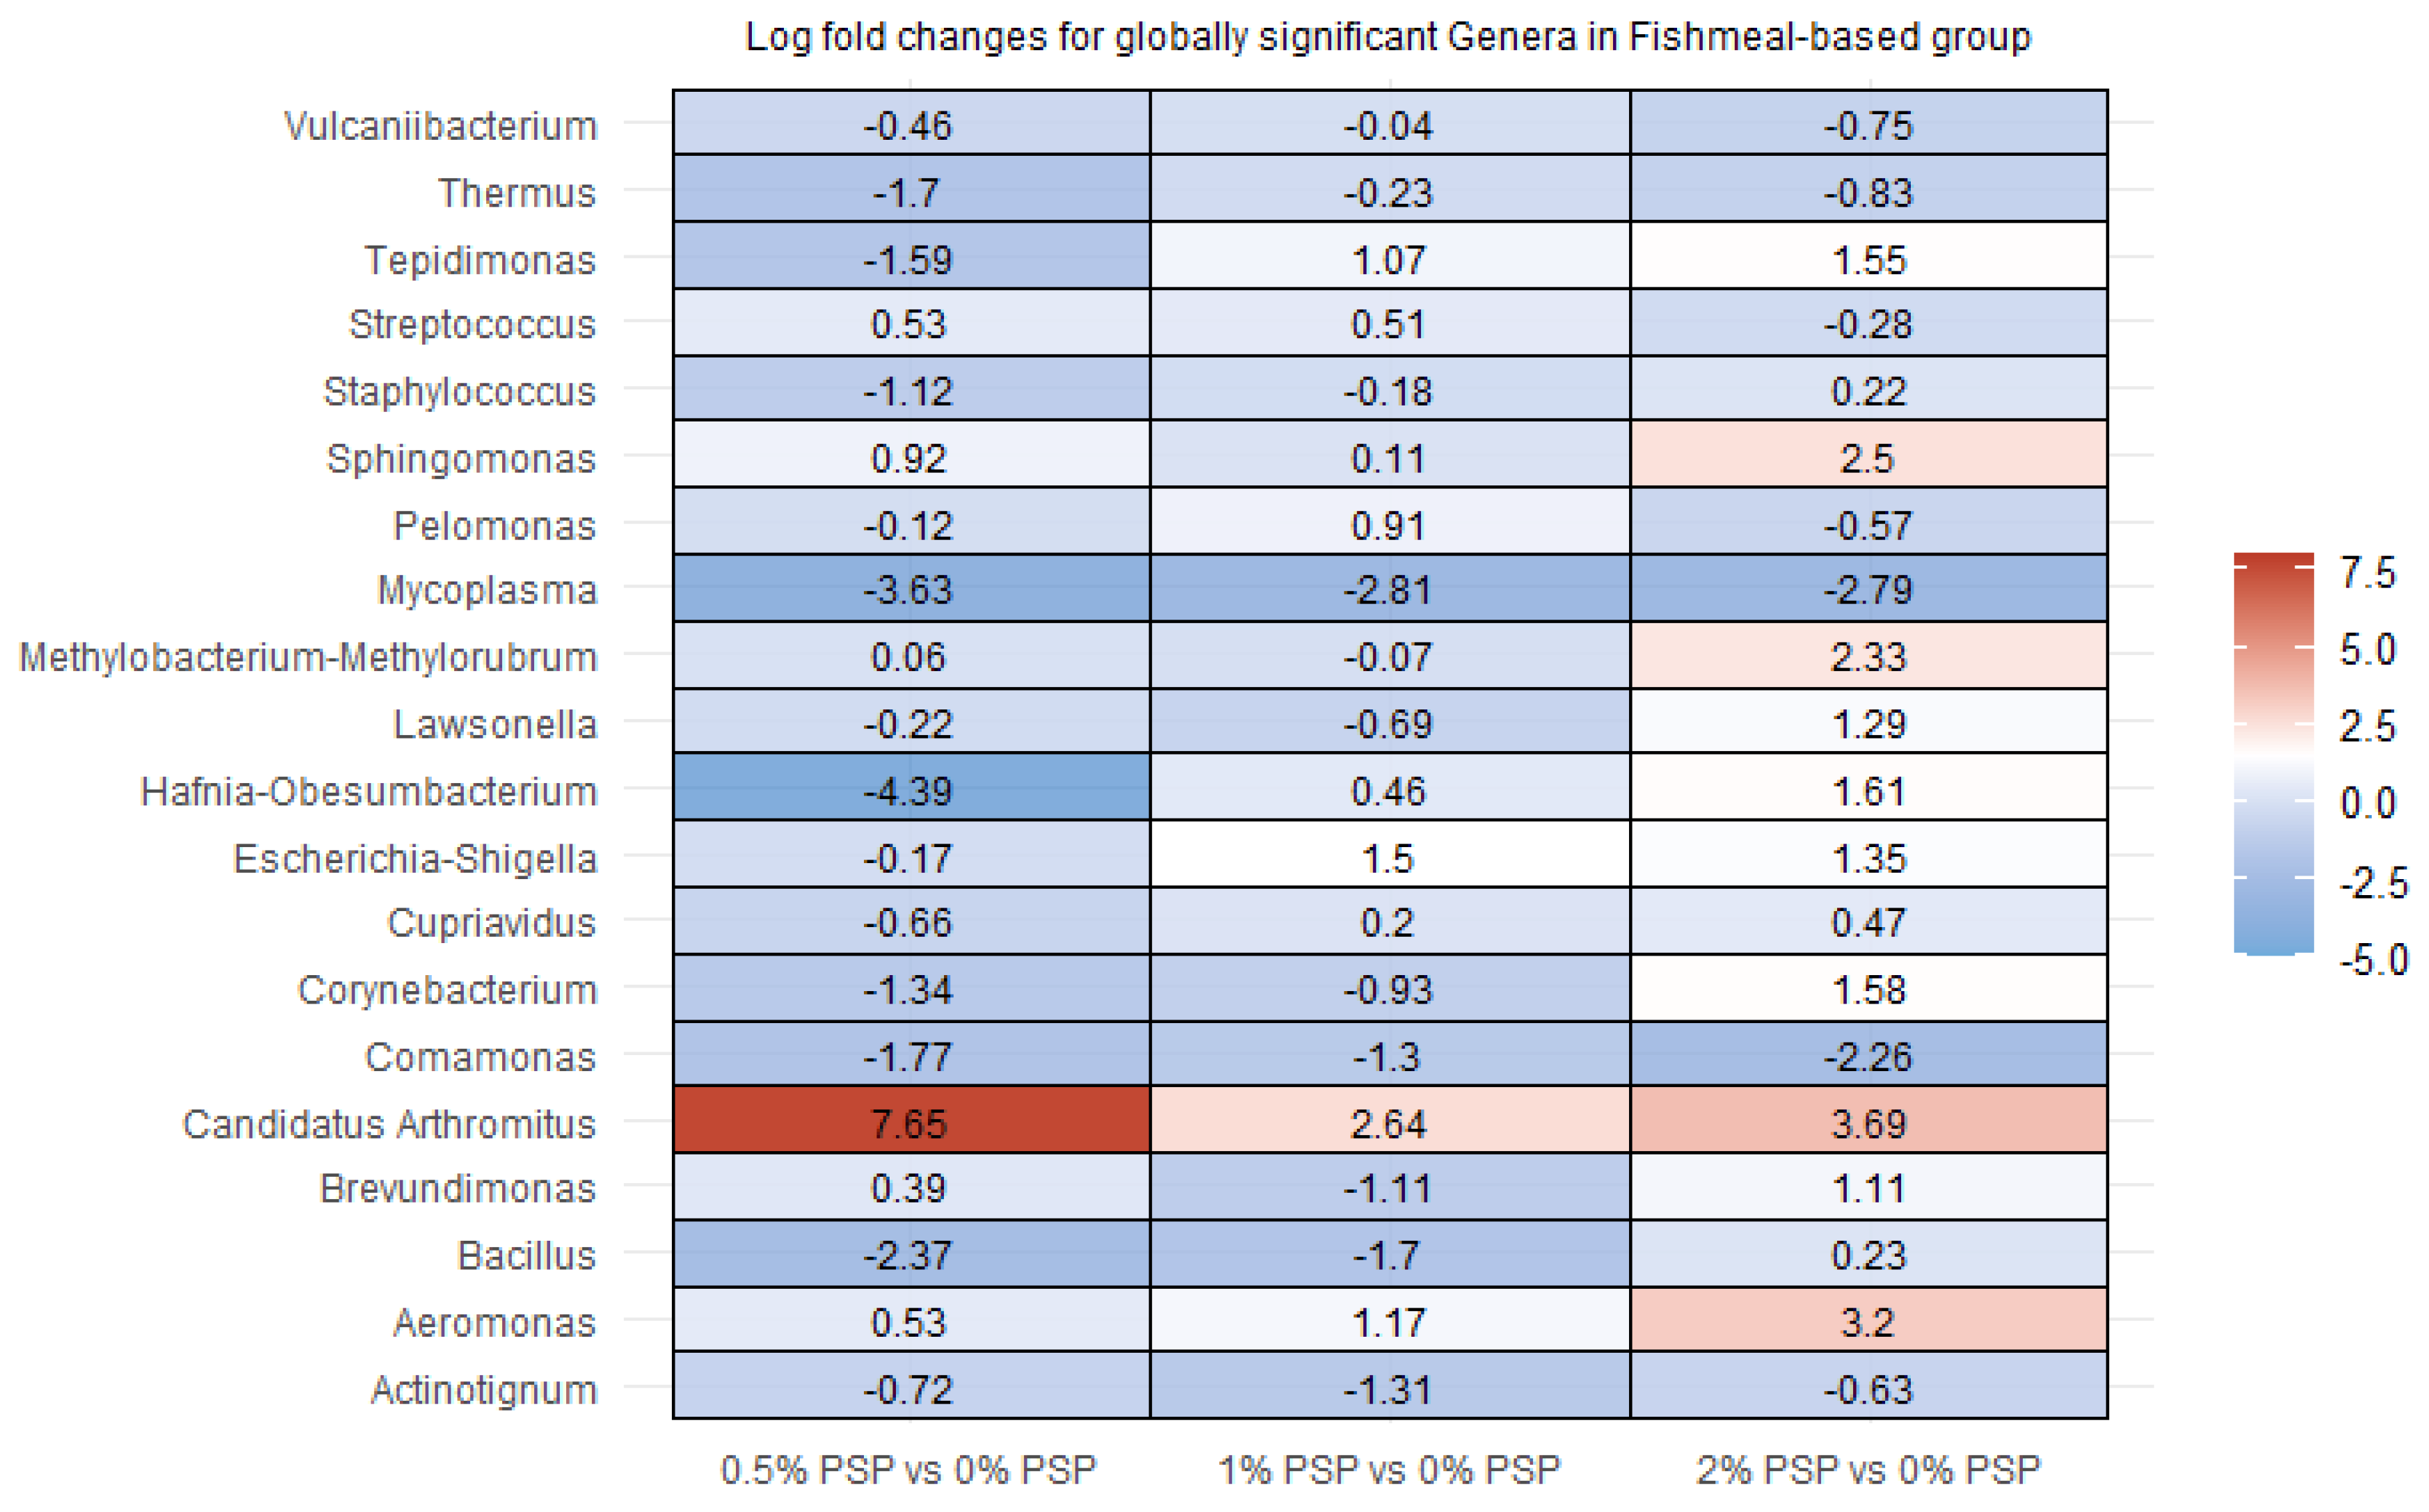
Figure 7.
Differential abundance of bacterial genera in the distal intestines of fish fed plant meal-based diets with varying levels of pistachio shell powder (PSP) inclusion.
Figure 7.
Differential abundance of bacterial genera in the distal intestines of fish fed plant meal-based diets with varying levels of pistachio shell powder (PSP) inclusion.
3.7. Histology
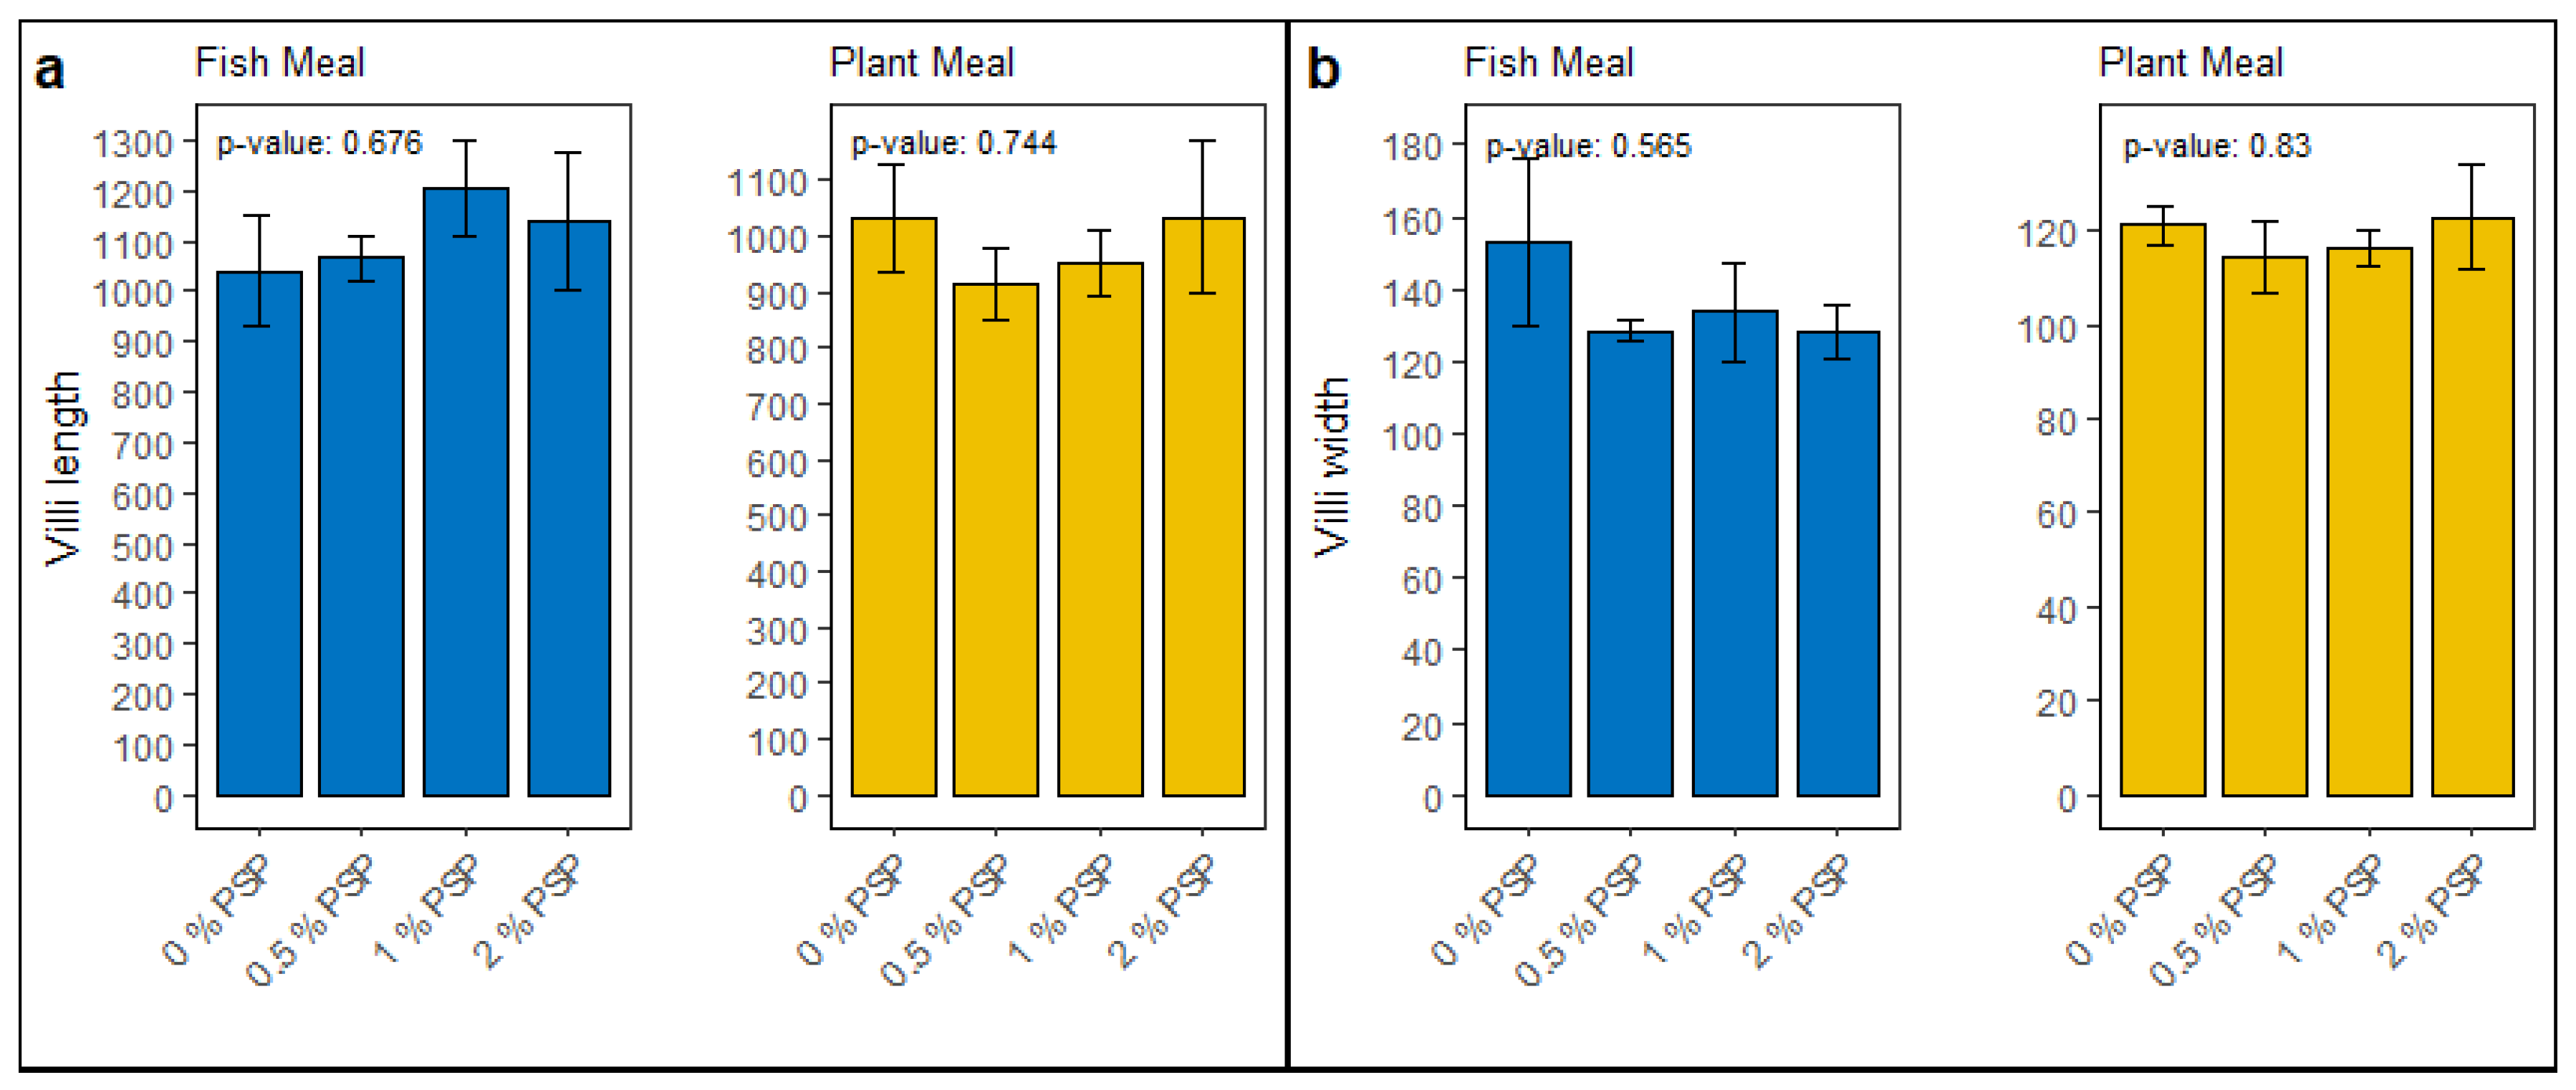
The inclusion of pistachio shell powder (PSP) in the diet did not significantly affect the intestinal morphology of rainbow trout. In fish fed fish meal diets, no significant differences (p > 0.05) were observed in villi length (Figure 8a) or villi width (Figure 8b) across varying levels of PSP inclusion (0%, 0.5%, 1%, and 2%). Similarly, in fish fed plant-based meals, PSP inclusion did not significantly influence villi length (Figure 8a) or villi width (Figure 8b).
Figure 6.
Morphometric analysis of intestinal villi in fish subjected to different dietary treatments with comparisons made across diets containing fish meal and plant meal, supplemented with 0%, 0.5%, 1%, and 2% pistachio shell powder (PSP). Panel (a) depicts the villi length, and panel (b) illustrates the villi width.
4. Discussion
The pursuit of sustainable aquaculture has driven the exploration of alternative protein sources for fish diets. While these alternatives, primarily plant-based meals, offer economic benefits, they can also lead to adverse health effects in carnivorous fish species such as rainbow trout. To address this, pistachio shell powder (PSP), a readily available by-product rich in antioxidants and prebiotic fiber, has emerged as a potential functional feed ingredient. Although some studies have evaluated the effects of other pistachio by-products on rainbow trout [55] and some herbivorous fish species [27,56,57], this study is the first to comprehensively evaluate the dose-dependent effects of PSP inclusion on growth performance, intestinal health, and gut microbiota modulation in rainbow trout fed either traditional fish meal (FM) or plant-based meal (PM) diets. By examining these parameters across varying PSP concentrations within each dietary regimen, this research illustrates effects of PSP supplementation in rainbow trout culture, contributing to the overall development of sustainable aquafeeds.
4.1. Growth Performance and Whole-Body Proximate Analysis
PSP supplementation at 1% inclusion significantly improved weight gain and growth rate in fish fed a fish meal diet. This could be attributed to the presence of beneficial bioactive compounds in PSP, such as antioxidants and prebiotic fibers, potentially enhancing nutrient absorption and utilization. However, the lack of growth-promoting effects in fish fed a plant-based diet suggests that the protein source may modulate the response to PSP. The plant-based diets, rich in fiber, polyphenols, and antioxidants, as demonstrated by their high TPC and TAC content, may potentially mask or interact with the effects of PSP. Considering this, the inclusion of PSP likely provided no additional benefits in the plant meal-based diets as they were already well-fortified with sufficient nutrients, rendering the supplementary effects of PSP redundant. Findings from this study align with some studies carried out in other animals. For instance, when Holstein calves were fed a ration supplemented with 6% pistachio by-products silage (PBPS), average daily weight gain and FCR were significantly improved, without affecting dry matter intake, suggesting PBPS improved feed conversion efficiency [58]. In Kermanian male lambs, the inclusion of pistachio by-products (PBP) — comprising soft hulls, twigs, leaves, hard shells, and green kernels — up to 20% had no significant effect on growth performance. However, when PBP levels exceeded 20%, a significant decline in growth performance metrics was observed [59]. In gestating sows, pistachio inclusion of up to 20% did not have negative effects on the health of the sows, and gestating sows showed higher gross energy digestibility for PSP (60.9%) due to the extended digestive transient time compared to lactating sows with at GE ATTD of only 34.59% [60]. In Nile tilapia, an omnivorous fish species with a longer gut retention time, pistachio-hull derived polysaccharides (PHDP) inclusion at 0.5% and 1% was shown to significantly improve growth performance and nutrient utilization efficiency [28].
In the present study, PSP inclusion improved growth performance in fish fed the FM diets, however, no significant differences were observed in whole-body proximate analysis in both FM and PM groups. Although, similar to the trend seen in growth performance, fish fed fishmeal diets containing 1% PSP inclusion had the best protein and energy retention efficiency ratios, albeit not statistically significant. Results from this study aligns with previous studies investigating the effects of antioxidant inclusion in rainbow trout diets where the inclusion of antioxidants did not significantly affect proximate composition [61,62], and protein efficiency ratios.
4.2. Intestinal Gene Expression and Histology
PSP did not significantly alter the expression of oxidative stress or inflammatory genes in either the fishmeal-based diets or the plant meal-based diets. However, there was a trend toward downregulation of inflammatory-related genes (TNF-α and S100) at 2% PSP inclusion in both FM and PM groups, and a trend toward upregulation of antioxidant-related genes (SOD and CAT) at 1% PSP inclusion in the PM groups, suggesting potential anti-inflammatory or antioxidant effects. While there are limited studies highlighting the effects of pistachio by-products on immune-related genes, our findings show similar trends to the few related studies. For instance, in a study evaluating the effects of pistachio oil (PO) on a mouse macrophage cell line, PO at a maximum dosage of 5.5 mg/mL in the media was found to possess anti-inflammatory effects by reducing the expression of lfit-2, TNF-α, IL-6 and IL-1β as PO dose increased [63]. The same trend was observed in another study investigating the effects of pistachio hull polysaccharide (PHP) on inflammatory and immune response in Nile tilapia, where the relative gene expression of TNF-α, IL-1β, TLR2, Myd8 and NF-κB in the liver were downregulated as PHP inclusion level increased [27].
All distal intestinal tissue had similar appearances, with no major differences observed across groups. There were no significant differences observed in villi height and villi width across plant-based and fishmeal-based groups. This could be attributed to the growing incorporation of plant proteins in commercial aquafeeds, potentially boosting the tolerance of commercial trout to plant-based diets as observed in some selected lines of rainbow trout [7,64]. As a result, symptoms of soybean meal-induced enteritis (SBME) and other adverse effects linked to plant-based ingredients may not appear in the distal intestine until after prolonged exposure. Consequently, the 12-week trial utilized in this study may be insufficient to detect these changes, and future studies should focus on evaluating these effects in long-term feeding trials.
4.3. TAC and TPC Analyses
The investigation into the effects of pistachio shell powder (PSP) inclusion on the total phenolic compound concentration and antioxidant capacity in serum of fish fed either a fishmeal-based diet or a plant meal-based diet showed no significant impact at the tested inclusion levels (0%, 0.5%, 1%, 2%). Interestingly, these findings contrast with those observed in a study involving dietary supplementation of polyphenols in common carp diets, where antioxidant activity significantly improved with increased inclusion of polyphenols [65]. In another study, supplementation of cello-oligosaccharides (COS) – a dietary fiber source improved antioxidant capacity in rainbow trout as observed in serum [66]. Some other studies also demonstrate that supplementation of trout diets with dietary antioxidants improve antioxidant capacity in serum [67,68,69].
These discrepancies may be attributed to several factors, including differences in the types of dietary supplements used, the bioavailability of the antioxidants and polyphenols, overall diet composition, concentration of reactive oxygen species in the diet, and the species or strain of fish used in the studies. While PSP contains bioavailable antioxidants and polyphenols, it also has a high content of non-nutritive fiber, which may interfere with the absorption of these beneficial compounds in the gut [70] unlike studies where pure, extracted antioxidants were used and the effects in the serum were more pronounced. Although there was an increase in dietary antioxidant and phenolic compound content with higher PSP inclusion in both FM and PM based-diets, the presence of fiber and other non-active components in PSP could potentially reduce the efficacy of the antioxidants and polyphenols, thereby explaining the lack of significant improvements in serum phenolic content and antioxidant capacity observed in this study.
4.4. Microbiome Analyses
Some studies evaluating the effects of antioxidants, dietary fibers, and other agricultural by-products on the gut microbiome of rainbow trout, report increased microbial interactions which led to positive effects in the overall fish health [66,69,71]. However, our findings that PSP did not significantly alter the alpha diversity of gut microbiota align with the notion that carnivorous fish like rainbow trout may have limited microbial fermentation capabilities, which could reduce the impact of dietary fibers on gut microbial diversity [72]. Nevertheless, with the inclusion of PSP, the significant changes in beta diversity and the relative abundance of specific microbial taxa, such as Candidatus arthromitus, in FM diets indicate that PSP can influence gut microbial community structure in a diet-specific manner.
The observed presence of Candidatus arthromitus within the gut microbiota is an interesting finding. Candidatus arthromitus is a segmented filamentous bacterium (SFB) known for its role in the immune system development of vertebrates [73]. In mammals, this bacterium adheres to the gut epithelium and can stimulate the host’s immune responses, including the production of IgA and the maturation of gut-associated lymphoid tissue (GALT) [74,75]. Although the modulation of Candidatus arthromitus in rainbow trout has not been extensively studied, existing literature on its role in mammals could suggest similar functions in fish. Future shotgun metagenomic studies could provide deeper insights into the functional roles of this bacterium and other components of the microbiota in rainbow trout fed varying levels of PSP.
The observed reduction of the Paracoccus genus as PSP levels in PM-diets reduced is another interesting discovery, as Paracoccus, a genus of soil microbes that has been previously isolated from carp [76], Paracoccus has been observed to be absent or present in very low abundance in the gut of healthy humans [77], but found to be unusually abundant during diarrhea [78] and Vibrio cholera infection in humans [79]. In most studies involving humans or murine models, Paracoccus has been positively correlated with dysbiosis in the gut [80,81]. Given the limited studies on the function of Paracoccus in rainbow trout gut, their potential function is not clear. However, our observations indicate a significant decrease in the differential abundance of Paracoccus as the inclusion levels of pistachio shell powder (PSP) increased up to 2% in fish fed plant-based diets. Since increased abundance of Paracoccus has been associated with dysbiosis in other animal models, it can be hypothesized that the inclusion of PSP in the diet may promote gut normobiosis in rainbow trout, as evidenced by the reduced abundance of Paracoccus. Further research should be carried out to better understand the functions of key microbes in the gut of rainbow trout fed a PSP-based diet.
5. Conclusions
This study demonstrates that pistachio shell powder (PSP) inclusion in fish and plant meal diets up to 2% does not significantly affect serum antioxidant capacity or phenolic compound concentration in rainbow trout. While PSP at 1% inclusion improved growth performance in fish meal diets, no similar effect was observed in plant meal diets, suggesting a potential modulation by dietary protein source or at least overall dietary formulation. PSP inclusion did not significantly alter intestinal morphology or gene expression related to oxidative stress and inflammation, although trends toward anti-inflammatory and antioxidant effects were noted. Additionally, PSP inclusion influenced gut microbiota composition, particularly in fish meal diets, highlighting its potential role in modulating gut health. These findings suggest that while PSP can be a safe dietary supplement, its benefits may be limited by its high fiber content and the overall diet composition, particularly in carnivorous fish species such as salmonids. Future research should focus on optimizing PSP inclusion levels and exploring its long-term effects in different fish species, especially herbivores, to fully realize its potential in sustainable aquafeed production.
Supplementary Materials
Data analysis code used in this study are available at: https://github.com/LordBanik/Pistachio-shell-powder-in-trout-diets
Author Contributions
Conceptualization, M.B.S, A.R.C.M, and J.W.B; Methodology, M.F.A. and J.W.B; Formal analysis, M.F.A., J.H., and J.W.B.; Resources, M.B.S., W.M.S., and J.W.B; Data curation, M.F.A. and J.W.B.; Writing – Original Draft Preparation, M.F.A; Writing – Review & Editing, M.F.A, M.B.S., A.R.C.M., J.H., W.M.S. and J.W.B.; Visualization, M.F.A.; Supervision, J.W.B; Project Administration, M.B.S., A.R.C.M, and J.W.B; Funding acquisition, M.B.S., A.R.C.M, and J.W.B.
Funding
This research was funded by the University of Kansas’ Wonderful Institute for Sustainable Engineering and conducted at the University of Idaho.
Institutional Review Board Statement
Fish husbandry was performed following the procedures established by the Institutional Animal Care and Use Committee (IACUC), and was approved by the University of Idaho (IACUC- 2022-41)
Data Availability Statement
Demultiplexed sample-specific 16S rRNA V3V4 gene amplicon data presented in the study are openly available in NCBI in BioProject PRJNA1146053 and data are available in the Sequence Read Archive at https://www.ncbi.nlm.nih.gov/bioproject/PRJNA1146053
Acknowledgments
The authors would like to recognize The Wonderful Company (Los Angeles, CA, USA) for providing the pistachio shells and funding for this study. We also acknowledge the support from the USDA ARS Hagerman facility, which supplied the Illumina MiSeq used for sequencing. Special thanks to Carol Hoffman for her assistance with the proximate analysis. We are grateful to Tim Boyle, Julianna Browning, the late Sharla Smith, and Ben Randle for their contributions to animal husbandry and fish sampling.
Conflicts of Interest
The authors declare no conflicts of interest.
List of Abbreviations
| Abbreviation | Description |
| PSP | Pistachio Shell Powder |
| FM | Fish Meal |
| PM | Plant Meal |
| TAC | Total Antioxidant Capacity |
| TPC | Total Phenolic Compounds |
| Ef1-α | Elongation factor 1α |
| β-actin | Beta actin |
| NRF-2α | Nuclear Factor erythroid 2-related factor 2a |
| CAT | Catalase |
| SOD | Superoxide dismutase |
| GPX-1 | Glutathione peroxidase 1 |
| TNF-α | Tumor Necrosis Factor – alpha |
| S100 | Ictacalcin S10012 |
| AWG | Average Weight Gain |
| ROS | Reactive Oxygen Species |
| PER | Protein Efficiency Ratio |
| SGR | Specific Growth Rate |
| SBME | Soybean Meal-Induced Enteritis |
| FCR | Feed Conversion Ratio |
| IACUC | Institutional Animal Care and Use Committee |
| DO | Dissolved Oxygen |
| PCR | Polymerase Chain Reaction |
| qPCR | Quantitative PCR |
| NGS | Next-Generation Sequencing |
| RQ | Relative Quantification |
| ASV | Amplicon Sequence Variant |
| DNA | Deoxyribonucleic Acid |
| RNA | Ribonucleic Acid |
| cDNA | Complementary DNA |
| PBS | Phosphate-Buffered Saline |
| ANOVA | Analysis of Variance |
| PERMANOVA | Permutational Multivariate Analysis of Variance |
| PCoA | Principal Coordinate Analysis |
| CSS | Cumulative Sum Scaling |
| ANCOM-BC: | Analysis of Composition of Microbiomes with Bias Correction |
| H&E | Hematoxylin and Eosin |
References
- Halwart, M. Aquaculture in SOFIA 2022. FAO Aquaculture Newsletter 2022, 7–8. [Google Scholar]
- Baeverfjord, G.; Krogdahl, Å. Development and regression of soybean meal induced enteritis in Atlantic salmon, Salmo salar L., distal intestine: a comparison with the intestines of fasted fish. Journal of Fish Diseases 1996, 19, 375–387. [Google Scholar] [CrossRef]
- Venold, F.F.; Penn, M.H.; Krogdahl, Å.; Overturf, K. Severity of soybean meal induced distal intestinal inflammation, enterocyte proliferation rate, and fatty acid binding protein (Fabp2) level differ between strains of rainbow trout (Oncorhynchus mykiss). Aquaculture 2012, 364, 281–292. [Google Scholar] [CrossRef]
- Blaufuss, P.C.; Gaylord, T.G.; Sealey, W.M.; Powell, M.S. Effects of high-soy diet on S100 gene expression in liver and intestine of rainbow trout (Oncorhynchus mykiss). Fish & shellfish immunology 2019, 86, 764–771. [Google Scholar]
- Kiron, V.; Thawonsuwan, J.; Panigrahi, A.; Scharsack, J.; Satoh, S. Antioxidant and immune defences of rainbow trout (Oncorhynchus mykiss) offered plant oils differing in fatty acid profiles from early stages. Aquaculture Nutrition 2011, 17, 130–140. [Google Scholar] [CrossRef]
- Callet, T.; Médale, F.; Larroquet, L.; Surget, A.; Aguirre, P.; Kerneis, T.; Labbé, L.; Quillet, E.; Geurden, I.; Skiba-Cassy, S. Successful selection of rainbow trout (Oncorhynchus mykiss) on their ability to grow with a diet completely devoid of fishmeal and fish oil, and correlated changes in nutritional traits. PLoS One 2017, 12, e0186705. [Google Scholar] [CrossRef]
- Abernathy, J.; Brezas, A.; Snekvik, K.R.; Hardy, R.W.; Overturf, K. Integrative functional analyses using rainbow trout selected for tolerance to plant diets reveal nutrigenomic signatures for soy utilization without the concurrence of enteritis. PLoS one 2017, 12, e0180972. [Google Scholar] [CrossRef] [PubMed]
- Dalsgaard, J.; Verlhac, V.; Hjermitslev, N.; Ekmann, K.S.; Fischer, M.; Klausen, M.; Pedersen, P.B. Effects of exogenous enzymes on apparent nutrient digestibility in rainbow trout (Oncorhynchus mykiss) fed diets with high inclusion of plant-based protein. Animal feed science and technology 2012, 171, 181–191. [Google Scholar] [CrossRef]
- Javaherdoust, S.; Yeganeh, S.; Amirkolaie, A.K. Effects of dietary visceral protein hydrolysate of rainbow trout on growth performance, carcass composition, digestibility and antioxidant enzyme in juvenile Oncorhynchus mykiss. Aquaculture nutrition 2020, 26, 134–144. [Google Scholar] [CrossRef]
- Torrecillas, S.; Montero, D.; Caballero, M.J.; Pittman, K.A.; Custódio, M.; Campo, A.; Sweetman, J.; Izquierdo, M. Dietary mannan oligosaccharides: counteracting the side effects of soybean meal oil inclusion on European sea bass (Dicentrarchus labrax) gut health and skin mucosa mucus production? Frontiers in Immunology 2015, 6, 397. [Google Scholar] [CrossRef]
- Refstie, S.; Baeverfjord, G.; Seim, R.R.; Elvebø, O. Effects of dietary yeast cell wall β-glucans and MOS on performance, gut health, and salmon lice resistance in Atlantic salmon (Salmo salar) fed sunflower and soybean meal. Aquaculture 2010, 305, 109–116. [Google Scholar] [CrossRef]
- Hussain, S.M.; Aslam, N.; Javid, A.; Liaquat, S.; Shahzad, M.M.; Arsalan, M.Z.-u.-H.; Khalid, M.A. Efficacy of probiotics supplementation on mineral digestibility, haematological parameters and carcass composition of Oreochromis niloticus fingerlings fed canola meal based diets. Pakistan Journal of Zoology 2018, 50. [Google Scholar] [CrossRef]
- Mandalari, G.; Barreca, D.; Gervasi, T.; Roussell, M.A.; Klein, B.; Feeney, M.J.; Carughi, A. Pistachio nuts (Pistacia vera L.): Production, nutrients, bioactives and novel health effects. Plants 2021, 11, 18. [Google Scholar] [CrossRef] [PubMed]
- Cardullo, N.; Leanza, M.; Muccilli, V.; Tringali, C. Valorization of agri-food waste from pistachio hard shells: Extraction of polyphenols as natural antioxidants. Resources 2021, 10, 45. [Google Scholar] [CrossRef]
- Akbari-Alavijeh, S.; Soleimanian-Zad, S.; Sheikh-Zeinoddin, M.; Hashmi, S. Pistachio hull water-soluble polysaccharides as a novel prebiotic agent. International journal of biological macromolecules 2018, 107, 808–816. [Google Scholar] [CrossRef]
- Göncü, B.; Gülşen, H. Enzymatic conversion of pistachio (pistacia vera L.) shells for fermentable sugar production. Energy Sources, Part A: Recovery, Utilization, and Environmental Effects 2021, 43, 1444–1455. [Google Scholar] [CrossRef]
- Ukhanova, M.; Wang, X.; Baer, D.J.; Novotny, J.A.; Fredborg, M.; Mai, V. Effects of almond and pistachio consumption on gut microbiota composition in a randomised cross-over human feeding study. British Journal of Nutrition 2014, 111, 2146–2152. [Google Scholar] [CrossRef]
- Yanni, A.E.; Mitropoulou, G.; Prapa, I.; Agrogiannis, G.; Kostomitsopoulos, N.; Bezirtzoglou, E.; Kourkoutas, Y.; Karathanos, V.T. Functional modulation of gut microbiota in diabetic rats following dietary intervention with pistachio nuts (Pistacia vera L.). Metabolism open 2020, 7, 100040. [Google Scholar] [CrossRef] [PubMed]
- Gonçalves, B.; Pinto, T.; Aires, A.; Morais, M.C.; Bacelar, E.; Anjos, R.; Ferreira-Cardoso, J.; Oliveira, I.; Vilela, A.; Cosme, F. Composition of nuts and their potential health benefits—An overview. Foods 2023, 12, 942. [Google Scholar] [CrossRef]
- Ballal, S.A.; Veiga, P.; Fenn, K.; Michaud, M.; Kim, J.H.; Gallini, C.A.; Glickman, J.N.; Quéré, G.; Garault, P.; Béal, C. Host lysozyme-mediated lysis of Lactococcus lactis facilitates delivery of colitis-attenuating superoxide dismutase to inflamed colons. Proceedings of the National Academy of Sciences 2015, 112, 7803–7808. [Google Scholar] [CrossRef]
- Liu, J.; Wang, Y.; Heelan, W.J.; Chen, Y.; Li, Z.; Hu, Q. Mucoadhesive probiotic backpacks with ROS nanoscavengers enhance the bacteriotherapy for inflammatory bowel diseases. Science advances 2022, 8, eabp8798. [Google Scholar] [CrossRef] [PubMed]
- Yang, F.; Su, Y.; Yan, C.; Chen, T.; Cheung, P.C.K. Attenuation of inflammatory bowel disease by oral administration of mucoadhesive polydopamine-coated yeast β-glucan via ROS scavenging and gut microbiota regulation. Journal of Nanobiotechnology 2024, 22, 166. [Google Scholar] [CrossRef]
- Pérez-Pascual, D.; Pérez-Cobas, A.E.; Rigaudeau, D.; Rochat, T.; Bernardet, J.-F.; Skiba-Cassy, S.; Marchand, Y.; Duchaud, E.; Ghigo, J.-M. Sustainable plant-based diets promote rainbow trout gut microbiota richness and do not alter resistance to bacterial infection. Animal microbiome 2021, 3, 1–13. [Google Scholar] [CrossRef]
- Gajardo, K.; Jaramillo-Torres, A.; Kortner, T.M.; Merrifield, D.L.; Tinsley, J.; Bakke, A.M.; Krogdahl, Å. Alternative protein sources in the diet modulate microbiota and functionality in the distal intestine of Atlantic salmon (Salmo salar). Applied and environmental microbiology 2017, 83, e02615–02616. [Google Scholar] [CrossRef] [PubMed]
- Terova, G.; Rimoldi, S.; Ascione, C.; Gini, E.; Ceccotti, C.; Gasco, L. Rainbow trout (Oncorhynchus mykiss) gut microbiota is modulated by insect meal from Hermetia illucens prepupae in the diet. Reviews in Fish Biology and Fisheries 2019, 29, 465–486. [Google Scholar] [CrossRef]
- Mohammadi, G.; Hafezieh, M.; Karimi, A.A.; Azra, M.N.; Van Doan, H.; Tapingkae, W.; Abdelrahman, H.A.; Dawood, M.A. The synergistic effects of plant polysaccharide and Pediococcus acidilactici as a synbiotic additive on growth, antioxidant status, immune response, and resistance of Nile tilapia (Oreochromis niloticus) against Aeromonas hydrophila. Fish & shellfish immunology 2022, 120, 304–313. [Google Scholar]
- Mohammadi, G.; Karimi, A.A.; Hafezieh, M.; Dawood, M.A.; Abo-Al-Ela, H.G. Pistachio hull polysaccharide protects Nile tilapia against LPS-induced excessive inflammatory responses and oxidative stress, possibly via TLR2 and Nrf2 signaling pathways. Fish & Shellfish Immunology 2022, 121, 276–284. [Google Scholar]
- Mohammadi, G.; Rafiee, G.; El Basuini, M.F.; Abdel-Latif, H.M.; Dawood, M.A. The growth performance, antioxidant capacity, immunological responses, and the resistance against Aeromonas hydrophila in Nile tilapia (Oreochromis niloticus) fed Pistacia vera hulls derived polysaccharide. Fish & Shellfish Immunology 2020, 106, 36–43. [Google Scholar]
- Weinstein, M.M.; Prem, A.; Jin, M.; Tang, S.; Bhasin, J.M. FIGARO: An efficient and objective tool for optimizing microbiome rRNA gene trimming parameters. BioRxiv 2019, 610394. [Google Scholar]
- Callahan, B.J.; McMurdie, P.J.; Rosen, M.J.; Han, A.W.; Johnson, A.J.A.; Holmes, S.P. DADA2: High-resolution sample inference from Illumina amplicon data. Nature methods 2016, 13, 581–583. [Google Scholar] [CrossRef]
- R Core Team, R. R: A language and environment for statistical computing. 2013.
- Quast, C.; Pruesse, E.; Yilmaz, P.; Gerken, J.; Schweer, T.; Yarza, P.; Peplies, J.; Glöckner, F.O. The SILVA ribosomal RNA gene database project: improved data processing and web-based tools. Nucleic acids research 2012, 41, D590–D596. [Google Scholar] [CrossRef] [PubMed]
- Camacho, C.; Coulouris, G.; Avagyan, V.; Ma, N.; Papadopoulos, J.; Bealer, K.; Madden, T.L. BLAST+: architecture and applications. BMC bioinformatics 2009, 10, 1–9. [Google Scholar] [CrossRef]
- Frøslev, T.G.; Kjøller, R.; Bruun, H.H.; Ejrnæs, R.; Brunbjerg, A.K.; Pietroni, C.; Hansen, A.J. Algorithm for post-clustering curation of DNA amplicon data yields reliable biodiversity estimates. Nature communications 2017, 8, 1188. [Google Scholar] [CrossRef] [PubMed]
- McMurdie, P.J.; Holmes, S. phyloseq: an R package for reproducible interactive analysis and graphics of microbiome census data. PloS one 2013, 8, e61217. [Google Scholar] [CrossRef] [PubMed]
- Oksanen, J. Vegan: community ecology package. http://vegan. r-forge. r-project. org/ 2010.
- Arbizu, P.M. pairwiseAdonis: pairwise multilevel comparison using adonis. 2017. R package version 00 2019, 1. [Google Scholar]
- Lin, H.; Peddada, S.D. Multigroup analysis of compositions of microbiomes with covariate adjustments and repeated measures. Nature Methods 2024, 21, 83–91. [Google Scholar] [CrossRef]
- Vandesompele, J.; De Preter, K.; Pattyn, F.; Poppe, B.; Van Roy, N.; De Paepe, A.; Speleman, F. Accurate normalization of real-time quantitative RT-PCR data by geometric averaging of multiple internal control genes. Genome biology 2002, 3, 1–12. [Google Scholar] [CrossRef]
- Welker, T.L.; Overturf, K.; Abernathy, J. Effect of Water Source and Trout Strain on Expression of Stress-Affected Genes in a Commercial Setting. North American Journal of Aquaculture 2018, 80, 249–262. [Google Scholar] [CrossRef]
- Villasante, A.; Powell, M.S.; Moutou, K.; Murdoch, G.K.; Overturf, K.; Wacyk, J.; Hardy, R.W. Effects of anthocyanidins on myogenic differentiation and antioxidant defense in primary myogenic cells isolated from rainbow trout (Oncorhynchus mykiss). Aquaculture 2016, 454, 81–89. [Google Scholar] [CrossRef]
- Bankhead, P.; Loughrey, M.B.; Fernández, J.A.; Dombrowski, Y.; McArt, D.G.; Dunne, P.D.; McQuaid, S.; Gray, R.T.; Murray, L.J.; Coleman, H.G. QuPath: Open source software for digital pathology image analysis. Scientific reports 2017, 7, 1–7. [Google Scholar] [CrossRef]
- Wickham, H.; Averick, M.; Bryan, J.; Chang, W.; McGowan, L.D.A.; François, R.; Grolemund, G.; Hayes, A.; Henry, L.; Hester, J. Welcome to the Tidyverse. Journal of open source software 2019, 4, 1686. [Google Scholar] [CrossRef]
- Bodenhofer, U.; Bonatesta, E.; Horejš-Kainrath, C.; Hochreiter, S. msa: an R package for multiple sequence alignment. Bioinformatics 2015, 31, 3997–3999. [Google Scholar] [CrossRef] [PubMed]
- Pages, H.; Aboyoun, P.; Gentleman, R.; DebRoy, S.; Pages, M.H.; DataImport, D.; BSgenome, S.; XStringSet-class, R.; MaskedXString-class, R.; XStringSet-io, R. Package ‘Biostrings’. Bioconductor 2013, 18129. [Google Scholar]
- Pedersen, T.L. Package ‘patchwork’. R package http://CRAN. R-project. org/package= patchwork. Cran 2019.
- Wilke, C.O.; Wickham, H.; Wilke, M.C.O. Package ‘cowplot’. Streamlined plot theme and plot annotations for ‘ggplot2 2019, 1. [Google Scholar]
- Hothorn, T.; Bretz, F.; Westfall, P.; Heiberger, R.M.; Schuetzenmeister, A.; Scheibe, S.; Hothorn, M.T. Package ‘multcomp’. Simultaneous inference in general parametric models. Project for Statistical Computing, Vienna, Austria 2016, 1-36.
- Graves, S.; Piepho, H.-P.; Selzer, M.L. Package ‘multcompView’. Visualizations of paired comparisons 2015. [Google Scholar]
- Paradis, E.; Schliep, K. ape 5.0: an environment for modern phylogenetics and evolutionary analyses in R. Bioinformatics 2019, 35, 526–528. [Google Scholar] [CrossRef]
- Wickham, H.; Wickham, M.H. Package ‘forcats’. 2021.
- Robinson, D. broom: An R package for converting statistical analysis objects into tidy data frames. arXiv preprint arXiv:1412.3565 2014. arXiv:1412.3565 2014.
- Kolde, R.; Kolde, M.R. Package ‘pheatmap’. R package 2015, 1, 790. [Google Scholar]
- Love, M.I.; Huber, W.; Anders, S. Moderated estimation of fold change and dispersion for RNA-seq data with DESeq2. Genome biology 2014, 15, 1–21. [Google Scholar] [CrossRef]
- Motamedi, J.; Shafiei Hasanabadi, F. Effect of different levels pistachio hull (Pistacia vera) on the growth and some biochemical and hematological properties of rainbow trout (Oncorhynchus mykiss). Fisheries Science and Technology 2014, 3, 13–24. [Google Scholar]
- Motamedi-Tehrani, J.; Ebrahimi-Dorcheh, E.; Goli, S. Effect of pistachio (Pistacia vera) hull extract on growth performance, body composition, total phenolic compound and fillets peroxide value of common carp, Cyprinus carpio. Aquaculture Nutrition 2016, 22, 479–484. [Google Scholar] [CrossRef]
- Motamedi-Tehrani, J.; Ebrahimi-Dorcheh, E.; Malekpouri, P.; Goli, S. Liver alteration and hematological and serum biochemical responses of common carp, Cyprinus carpio Linnaeus, 1758, following long-term feeding of pistachio (Pistacia vera) green hull extract as a source of natural phenol. Journal of Applied Ichthyology 2016, 32, 906–912. [Google Scholar] [CrossRef]
- Shakeri, P.; Riasi, A.; Alikhani, M.; Fazaeli, H.; Ghorbani, G. Effects of feeding pistachio by-products silage on growth performance, serum metabolites and urine characteristics in Holstein male calves. Journal of Animal Physiology and Animal Nutrition 2013, 97, 1022–1029. [Google Scholar] [CrossRef]
- Shakeri, P. Pistachio by-product as an alternative forage source for male lambs: Effects on performance, blood metabolites, and urine characteristics. Animal Feed Science and Technology 2016, 211, 92–99. [Google Scholar] [CrossRef]
- Yeonwoo Kim, S.A.L., and Hans H. Stein. Effects on energy and fiber digestibility and on diet digestible energy of including pistachio 4 shell powder or soybean hulls in diets for gestating or lactating sows. In print - pending 2024.
- Teimouri, M.; Yeganeh, S.; Amirkolaie, A. The effects of Spirulina platensis meal on proximate composition, fatty acid profile and lipid peroxidation of rainbow trout (Oncorhynchus mykiss) muscle. Aquaculture nutrition 2016, 22, 559–566. [Google Scholar] [CrossRef]
- Rahman, M.M.; Khosravi, S.; Chang, K.H.; Lee, S.-M. Effects of dietary inclusion of astaxanthin on growth, muscle pigmentation and antioxidant capacity of juvenile rainbow trout (Oncorhynchus mykiss). Preventive nutrition and food science 2016, 21, 281. [Google Scholar] [CrossRef] [PubMed]
- Zhang, J.; Kris-Etherton, P.M.; Thompson, J.T.; Vanden Heuvel, J.P. Effect of pistachio oil on gene expression of IFN-induced protein with tetratricopeptide repeats 2: a biomarker of inflammatory response. Molecular nutrition & food research 2010, 54, S83–S92. [Google Scholar]
- Palma, M.; Bledsoe, J.W.; Tavares, L.C.; Romano, N.; Small, B.C.; Viegas, I.; Overturf, K. Digesta and plasma metabolomics of rainbow trout strains with varied tolerance of plant-based diets highlights potential for non-lethal assessments of enteritis development. Metabolites 2021, 11, 590. [Google Scholar] [CrossRef]
- Jahazi, M.A.; Hoseinifar, S.H.; Jafari, V.; Hajimoradloo, A.; Van Doan, H.; Paolucci, M. Dietary supplementation of polyphenols positively affects the innate immune response, oxidative status, and growth performance of common carp, Cyprinus carpio L. Aquaculture 2020, 517, 734709. [Google Scholar] [CrossRef]
- Singh, A.; Vidakovic, A.; Hjertner, B.; Krikigianni, E.; Karnaouri, A.; Christakopoulos, P.; Rova, U.; Dicksved, J.; Baruah, K.; Lundh, T. Effects of dietary supplementation of lignocellulose-derived cello-oligosaccharides on growth performance, antioxidant capacity, immune response, and intestinal microbiota in rainbow trout (Oncorhynchus mykiss). Aquaculture 2024, 578, 740002. [Google Scholar] [CrossRef]
- Giannenas, I.; Triantafillou, E.; Stavrakakis, S.; Margaroni, M.; Mavridis, S.; Steiner, T.; Karagouni, E. Assessment of dietary supplementation with carvacrol or thymol containing feed additives on performance, intestinal microbiota and antioxidant status of rainbow trout (Oncorhynchus mykiss). Aquaculture 2012, 350, 26–32. [Google Scholar] [CrossRef]
- Wang, C.a.; Su, B.; Lu, S.; Han, S.; Jiang, H.; Li, Z.; Liu, Y.; Liu, H.; Yang, Y. Effects of glutathione on growth, intestinal antioxidant capacity, histology, gene expression, and microbiota of juvenile triploid Oncorhynchus mykiss. Frontiers in Physiology 2021, 12, 784852. [Google Scholar] [CrossRef] [PubMed]
- Ma, F.; Ma, R.; Zou, Y.; Zhao, L. Effect of astaxanthin on the antioxidant capacity and intestinal microbiota of tsinling lenok trout (Brachymystax lenok tsinlingensis). Marine Biotechnology 2022, 24, 1125–1137. [Google Scholar] [CrossRef]
- Palafox-Carlos, H.; Ayala-Zavala, J.F.; González-Aguilar, G.A. The role of dietary fiber in the bioaccessibility and bioavailability of fruit and vegetable antioxidants. Journal of food science 2011, 76, R6–R15. [Google Scholar] [CrossRef] [PubMed]
- Pulgar, R.; Mandakovic, D.; Salgado, P.; Venegas, L.; Ortiz, D.; Peña-Neira, Á.; Wacyk, J. Micro-encapsulated grape pomace extract (MGPE) as a feed additive improves growth performance, antioxidant capacity, and shifts the gut microbiome of rainbow trout. Aquaculture 2021, 544, 737129. [Google Scholar] [CrossRef]
- Wong, S.; Rawls, J.F. Intestinal microbiota composition in fishes is influenced by host ecology and environment. Wiley Online Library: 2012.
- Talham, G.L.; Jiang, H.-Q.; Bos, N.A.; Cebra, J.J. Segmented filamentous bacteria are potent stimuli of a physiologically normal state of the murine gut mucosal immune system. Infection and immunity 1999, 67, 1992–2000. [Google Scholar] [CrossRef]
- Rhee, K.-J.; Sethupathi, P.; Driks, A.; Lanning, D.K.; Knight, K.L. Role of commensal bacteria in development of gut-associated lymphoid tissues and preimmune antibody repertoire. The Journal of Immunology 2004, 172, 1118–1124. [Google Scholar] [CrossRef] [PubMed]
- Ivanov, I.I.; Atarashi, K.; Manel, N.; Brodie, E.L.; Shima, T.; Karaoz, U.; Wei, D.; Goldfarb, K.C.; Santee, C.A.; Lynch, S.V. Induction of intestinal Th17 cells by segmented filamentous bacteria. Cell 2009, 139, 485–498. [Google Scholar] [CrossRef]
- Ming, H.; Cheng, L.-J.; Ding, C.-L.; Niu, M.-M.; Zhao, Z.-L.; Ji, W.-L.; Zhang, L.-Y.; Zhang, Y.-M.; Meng, X.-L.; Nie, G.-X. Paracoccus luteus sp. nov., isolated from the intestine of grass carp. International Journal of Systematic and Evolutionary Microbiology 2020, 70, 543–549. [Google Scholar] [CrossRef]
- Yatsunenko, T.; Rey, F.E.; Manary, M.J.; Trehan, I.; Dominguez-Bello, M.G.; Contreras, M.; Magris, M.; Hidalgo, G.; Baldassano, R.N.; Anokhin, A.P. Human gut microbiome viewed across age and geography. nature 2012, 486, 222–227. [Google Scholar] [CrossRef]
- David, L.A.; Weil, A.; Ryan, E.T.; Calderwood, S.B.; Harris, J.B.; Chowdhury, F.; Begum, Y.; Qadri, F.; LaRocque, R.C.; Turnbaugh, P.J. Gut microbial succession follows acute secretory diarrhea in humans. MBio 2015, 6, 10–1128. [Google Scholar] [CrossRef]
- Barrasso, K.; Chac, D.; Debela, M.D.; Geigel, C.; Steenhaut, A.; Seda, A.R.; Dunmire, C.N.; Harris, J.B.; Larocque, R.C.; Midani, F.S. Impact of a human gut microbe on Vibrio cholerae host colonization through biofilm enhancement. Elife 2022, 11, e73010. [Google Scholar] [CrossRef] [PubMed]
- Chaiyasut, C.; Sivamaruthi, B.S.; Tansrisook, C.; Peerajan, S.; Chaiyasut, K.; Bharathi, M. Influence of Paraprobiotics-containing moisturizer on skin hydration and Microbiome: a preliminary study. Applied Sciences 2022, 12, 12483. [Google Scholar] [CrossRef]
- Huang, X.; Zhang, D.-y.; Li, D.; Lv, Y.; Chen, S.; Bai, F. Human gastric microbiota analysis of refractory H. pylori infection. Scientific Reports 2024, 14, 15619. [Google Scholar] [CrossRef] [PubMed]

Table 1.
Dietary formulation and proximate composition of diets included in the twelve-week rainbow trout feeding trial.
Table 1.
Dietary formulation and proximate composition of diets included in the twelve-week rainbow trout feeding trial.
| Ingredient (%) | PM | FM | ||||||
|---|---|---|---|---|---|---|---|---|
| 0% | 0.5% | 1% | 2% | 0% | 0.5% | 1% | 2% | |
| Pistachio Shell Powder | 0 | 0.5 | 1 | 2 | 0 | 0.5 | 1 | 2 |
| Soybean meal a | 25 | 25 | 25 | 25 | -- | -- | -- | -- |
| Soy protein concentrate b | 23.43 | 23.43 | 23.43 | 23.43 | -- | -- | -- | -- |
| Corn protein concentrate c | 10.23 | 10.23 | 10.23 | 10.23 | -- | -- | -- | -- |
| Fish meal d | -- | -- | -- | -- | 28.2 | 28.2 | 28.2 | 28.2 |
| Poultry by-product meal e | -- | -- | -- | -- | 21.52 | 21.52 | 21.52 | 21.52 |
| Blood meal f | -- | -- | -- | -- | 4.3 | 4.3 | 4.3 | 4.3 |
| Wheat flour g | 13.3 | 12.8 | 12.3 | 11.3 | 27.56 | 27.06 | 26.56 | 25.56 |
| Wheat gluten meal | 2.24 | 2.24 | 2.24 | 2.24 | -- | -- | -- | -- |
| Fish oil h | 17 | 17 | 17 | 17 | 14.4 | 14.4 | 14.4 | 14.4 |
| Lysine HCl | 1.85 | 1.85 | 1.85 | 1.85 | 1.12 | 1.12 | 1.12 | 1.12 |
| Methionine | 0.59 | 0.59 | 0.59 | 0.59 | 0.42 | 0.42 | 0.42 | 0.42 |
| Threonine | 0.32 | 0.32 | 0.32 | 0.32 | 0.58 | 0.58 | 0.58 | 0.58 |
| Taurine i | 0.5 | 0.5 | 0.5 | 0.5 | -- | -- | -- | -- |
| Dicalcium phosphate | 2.75 | 2.75 | 2.75 | 2.75 | -- | -- | -- | -- |
| Vitamin premix j | 1 | 1 | 1 | 1 | 1 | 1 | 1 | 1 |
| Choline CL | 0.6 | 0.6 | 0.6 | 0.6 | 0.6 | 0.6 | 0.6 | 0.6 |
| Vitamin C k | 0.2 | 0.2 | 0.2 | 0.2 | 0.2 | 0.2 | 0.2 | 0.2 |
| Trace min premix l | 0.1 | 0.1 | 0.1 | 0.1 | 0.1 | 0.1 | 0.1 | 0.1 |
| Potassium chloride m | 0.56 | 0.56 | 0.56 | 0.56 | -- | -- | -- | -- |
| Sodium Chloride | 0.28 | 0.28 | 0.28 | 0.28 | -- | -- | -- | -- |
| Magnesium oxide m | 0.05 | 0.05 | 0.05 | 0.05 | -- | -- | -- | -- |
| Proximate composition | ||||||||
| Moisture (%) | 6.36 | 4.39 | 3.77 | 2.78 | 3.45 | 2.02 | 1.22 | 2.28 |
| Lipid – Dry weight (%) | 15.37 | 16.95 | 16.14 | 14.74 | 19.61 | 19.48 | 18.78 | 18.84 |
| Protein – Dry weight (%) | 47.11 | 45.43 | 46.37 | 47.53 | 53.57 | 54.17 | 53.85 | 54.29 |
| Ash – Dry weight (%) | 6.54 | 6.66 | 6.81 | 7.28 | 3.21 | 3.21 | 3.37 | 3.17 |
a Archer Daniels Midland Company, 472 g/kg protein; b Solae, Pro-Fine VF, 693 g/kg crude protein; c Cargill, Empyreal 75, 756 g/kg crude protein; d Menhaden Special Select, Omega Proteins Corp, 610 g/kg crude protein; e IDF Inc., 832 g/kg protein; f Wilbur-Ellis, 892 g/kg crude protein; g Manildra Milling, 120 g/kg protein; h Omega Proteins Inc., Virginia Prime menhaden oil ; i NB Group Co. LTD.; j DSM Nutritional Products, ARS 702, per kg diet; vitamin A 9650 IU; vitamin D 6600 IU; vitamin E 132 IU; vitamin K3 1.1 gm: thiamin mononitrate 9.1 mg; riboflavin 9.6 mg; pyridoxine hydrochloride 13.7 mg; pantothenate DL-calcium 46.5 mg; cyanocobalamin 0.03 mg; nicotinic acid 21.8 mg; biotin 0.34 mg; folic acid 2.5 mg; inositol 600 mg.; k Stay-C, 35%, DSM Nutritional Products; l Sigma-Aldrich Company, ARS 640, contributed in mg/kg of diet; manganese 13; iodine 5; copper 9; zinc 40.; m Sigma-Aldrich Company.
Table 2.
RT-qPCR gene expression targets. Gene targets are listed with the corresponding NCBI accession used to design assays for the target, along with the primer and probe sequences used and the resulting efficiency (Primer Eff.) from each run.
Table 2.
RT-qPCR gene expression targets. Gene targets are listed with the corresponding NCBI accession used to design assays for the target, along with the primer and probe sequences used and the resulting efficiency (Primer Eff.) from each run.
| Gene | Primer/probe sequence (5’ – 3’) | Primer Eff. (%) |
|---|---|---|
| Ef1-α NM_001124339.1 |
F: GTGAGTTTGAGGCTGGTATCT R: GCTCAGTAGAGTCCATCTTGTT P: /FAM/TGGGAGTGA/ZEN/AACAGCTCATTGTTGGA/3IABkFQ |
Run 1: 95.95 Run 2: 105.27 |
| β-actin NM_001124235.1 |
F: CTTCTCTCTCCACCTTCCAAC R: GGGATGGGTACAGTCTGTTTAG P: /FAM/CCTCCATCG/ZEN/TCCACCGTAAATGCT/3IABkFQ |
Run 1: 104.63 Run 2: 104.11 |
| NM_001124357.1 | F: CTGGGCTCTTCTTCGTTTACA R: GAGTCCGAATAGCGCCAAATA P: /FAM/AGGCTTCGT/ZEN/TTAGGGTCAAGTGCA/3IABkFQ |
Run 1: 105.46 Run 2: 106.68 |
| NRF-2α XM_036959401.1 |
F: GCAAGCTCATACTCTAGCTCTC R: CAGGGTTACTGTCCATCTCATC P: /FAM/TCCTTTGGT/ZEN/GGCTACAGCGATTCA/3IABkFQ |
Run 1: 94.17 Run 2: 95.91 |
| Ictalacin S100I2 XM_036967731.1 |
F: GCTTGGAGAGATCATGGGGAAAA R: TCCACACTGCCATCTGCATTAG P: /FAM/ACACTGACC/ZEN/AGGCAAAGGTTGACA/3IABkFQ |
Run 1: 102.58 Run 2: 107.31 |
| SOD BT074393 [40] |
F: CCACGGAGGACCCACTG R: CAGCTCCTGCAGTCACGTT P: /FAM/ACGTGCCGAACAGCAT/NFQ |
Run 1: 99.67 Run 2: 106.18 |
| CAT XM_021564310 [40] |
F: GGACCTTACTGGCAACAACAC R: CGCTTCTGAGAGTGGATAAAGGAT P: /FAM/ACAGCATGGCGTCCCT/NFQ |
Run 1: 95.23 Run 2: 99.44 |
| GPX-1 NM_001124525.1 [41] |
F: CGCCCACCCACTGTTTGT R: GCTCGTCGCTTGGGAATG |
Run 1: 112.31 Run 2: 100.68 |
Table 3.
Summary of the growth performance of rainbow trout fed either fishmeal (FM) or plant-meal (PM) based diets, supplemented with graded levels of pistachio shell powder (PSP: 0, 0.5, 1, 2%) for 12 weeks.
Table 3.
Summary of the growth performance of rainbow trout fed either fishmeal (FM) or plant-meal (PM) based diets, supplemented with graded levels of pistachio shell powder (PSP: 0, 0.5, 1, 2%) for 12 weeks.
| Diet | PSP Level | Initial Weight (g) | Average Weight Gain (g) | FCR | SGR | DGI | Survival | TGC |
|---|---|---|---|---|---|---|---|---|
| FM | 0% | 19.1 ± 0.26 | 186 ± 3.46 | 0.66 ± 0.02 | 3.01 ± 0.04 | 4.08 ± 0.05 | 100 ± 0.0 | 0.26 ± 0.01 |
| FM | 0.5% | 19.07 ± 0.4 | 173.33 ± 1.53* | 0.71 ± 0.04 | 2.92 ± 0.03 | 3.92 ± 0.03 | 98.97 ± 1.79 | 0.26 ± 0.01 |
| FM | 1% | 19.23 ± 0.32 | 190.33 ± 4.93* | 0.65 ± 0.02 | 3.02 ± 0.04 | 4.12 ± 0.06* | 95.87 ± 3.58 | 0.27 ± 0.01 |
| FM | 2% | 19.17 ± 0.25 | 182.67 ± 3.21 | 0.72 ± 0.11 | 2.98 ± 0.02 | 4.04 ± 0.04 | 96.9 ± 0.0 | 0.26 ± 0.0 |
| PM | 0% | 19.33 ± 0.23 | 236.33 ± 15.37 | 0.84 ± 0.1 | 3.27 ± 0.06 | 4.63 ± 0.15 | 97.93 ± 1.79 | 0.3 ± 0.01 |
| PM | 0.5% | 19.3 ± 0.17 | 243.33 ± 12.66 | 0.8 ± 0.06 | 3.3 ± 0.06 | 4.71 ± 0.13 | 100 ± 0.0 | 0.31 ± 0.01 |
| PM | 1% | 18.93 ± 0.25 | 240 ± 21.66 | 0.86 ± 0.03 | 3.31 ± 0.09 | 4.69 ± 0.21 | 98.97 ± 1.79 | 0.3 ± 0.02 |
| PM | 2% | 19.1 ± 0.2 | 238 ± 17.35 | 0.83 ± 0.07 | 3.29 ± 0.08 | 4.66 ± 0.18 | 100 ± 0.0 | 0.3 ± 0.01 |
| One-way ANOVA | FM: PSP Level | 0.918 | 0.002 | 0.434 | 0.022 | 0.003 | 0.119 | 0.163 |
| PM: PSP Level | 0.161 | 0.962 | 0.759 | 0.893 | 0.956 | 0.219 | 0.908 |
Data for each experimental group are reported as mean ± standard deviation from triplicate tanks. Results were subjected to a one-way ANOVA to specifically evaluate PSP inclusion within each diet type. Significant differences (p < 0.05) are indicated by bold, italicized p-values. FCR – feed conversion ratio; SGR – specific growth rate; DGI – daily growth index; TGC – Thermal growth coefficient. Bold asterisks (*) represent significant differences from Welch’s T-Test conducted between pistachio-shell-powder (PSP) inclusion levels (0.5, 1, 2%) and the control (0%), within fishmeal (FM) or plant-meal (PM) diets.
Table 4.
Summary of the whole-body proximate analysis of rainbow trout feed either fishmeal (FM) or plant-meal (PM) based diets, supplemented with graded levels of pistachio shell powder (PSP: 0, 0.5, 1, 2%) for 12 weeks.
Table 4.
Summary of the whole-body proximate analysis of rainbow trout feed either fishmeal (FM) or plant-meal (PM) based diets, supplemented with graded levels of pistachio shell powder (PSP: 0, 0.5, 1, 2%) for 12 weeks.
| Diet | PSP Level | Whole Body Moisture | Whole Body Protein | Whole Body Ash | Whole Body Energy (cal) | Protein Efficiency | Protein Retention (%) | Energy Retention (%) |
|---|---|---|---|---|---|---|---|---|
| FM | 0% | 67.47 ± 0.59 | 15.6 ± 0.72 | 1.47 ± 0.07 | 2300.7 ± 34.26 | 3.09 ± 0.06 | 48.73 ± 2.9 | 65 ± 1.03 |
| FM | 0.5% | 68 ± 0.36 | 15.97 ± 0.63 | 1.68 ± 0.13 | 2230.33 ± 40.21 | 2.86 ± 0.18 | 46.18 ± 1.14 | 58.87 ± 4.87 |
| FM | 1% | 66.97 ± 0.54 | 15.72 ± 0.67 | 1.58 ± 0.11 | 2265.87 ± 111.28 | 3.2 ± 0.09 | 50.79 ± 1.53 | 65.39 ± 5.2 |
| FM | 2% | 67.25 ± 0.74 | 15.75 ± 0.16 | 1.59 ± 0.11 | 2301.22 ± 127.79 | 2.85 ± 0.4 | 45.42 ± 6.43 | 59.78 ± 7.22 |
| PM | 0% | 68.25 ± 0.63 | 16.19 ± 0.38 | 1.91 ± 0.03 | 2164.52 ± 74.12 | 2.87 ± 0.33 | 47.01 ± 6.22 | 57.06 ± 8.45 |
| PM | 0.5% | 68.05 ± 0.51 | 16.68 ± 0.26 | 1.97 ± 0.09 | 2181.62 ± 30.68 | 3.04 ± 0.24 | 51.48 ± 4.77 | 56.43 ± 4.57 |
| PM | 1% | 68.08 ± 0.81 | 16.68 ± 0.2 | 1.85 ± 0.31 | 2174 ± 63.31 | 2.75 ± 0.09 | 46.43 ± 1.69 | 51.94 ± 3.28 |
| PM | 2% | 68.81 ± 1.36 | 16.76 ± 0.32 | 2.12 ± 0.21 | 2091.8 ± 91.13 | 2.79 ± 0.27 | 47.37 ± 5.16 | 50.5 ± 4.77 |
| One-way ANOVA | FM: PSP Level | 0.239 | 0.888 | 0.200 | 0.734 | 0.235 | 0.323 | 0.327 |
| PM: PSP Level | 0.711 | 0.159 | 0.406 | 0.405 | 0.504 | 0.578 | 0.437 |
Data for each experimental group are reported as mean ± standard deviation from triplicate tanks. Results were subjected to a one-way ANOVA to specifically evaluate PSP inclusion within each diet type. Significant differences (p < 0.05) are indicated by bold, italicized p-values.
Disclaimer/Publisher’s Note: The statements, opinions and data contained in all publications are solely those of the individual author(s) and contributor(s) and not of MDPI and/or the editor(s). MDPI and/or the editor(s) disclaim responsibility for any injury to people or property resulting from any ideas, methods, instructions or products referred to in the content. |
© 2024 by the authors. Licensee MDPI, Basel, Switzerland. This article is an open access article distributed under the terms and conditions of the Creative Commons Attribution (CC BY) license (http://creativecommons.org/licenses/by/4.0/).
Copyright: This open access article is published under a Creative Commons CC BY 4.0 license, which permit the free download, distribution, and reuse, provided that the author and preprint are cited in any reuse.


