
Submitted:
04 November 2023
Posted:
07 November 2023
You are already at the latest version
Abstract
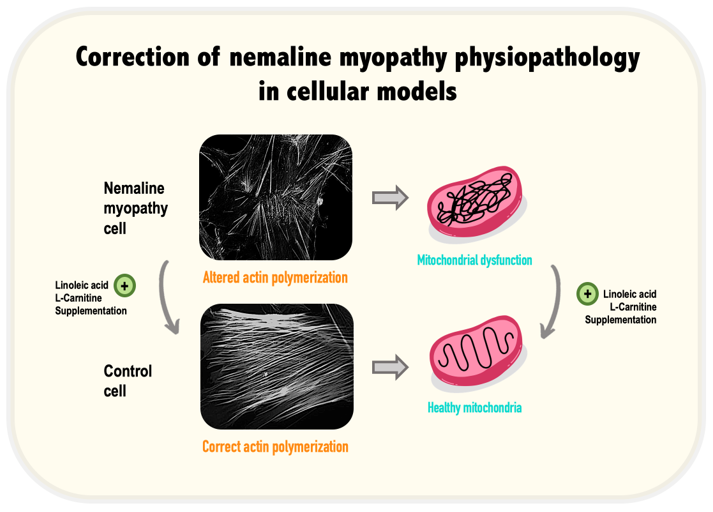
Nemaline myopathy (NM) is one of the most common forms of congenital myopathy and it is identified by the presence of "nemaline bodies" (rods) in muscle fibers by histopathological exam-ination. The most common forms of NM are caused by mutations in the ACTA1 (Actin Alpha 1) and NEB (Nebulin) genes. Clinical features include hypotonia and muscle weakness. Unfortunate-ly, there is no curative treatment and the pathogenetic mechanisms remains unclear. In this man-uscript, we examined the pathophysiological alterations in NM using dermal fibroblasts derived from patients with mutations in ACTA1 and NEB genes. Patients’ fibroblasts were stained with rhodamine phalloidin to analyze the polymerization of actin filaments by fluorescence microsco-py. We found that patients' fibroblasts showed incorrect actin filament polymerization compared to control fibroblasts. Actin filament polymerization defects was associated with mitochondrial dysfunction. Furthermore, we identified two mitochondrial boosting compounds, linoleic acid (LA) and L-carnitine (LCAR), that improved the formation of actin filaments in mutant fibro-blasts and corrected mitochondrial bioenergetics. Our results indicate that cellular models can be useful to study the pathophysiological mechanisms involved in NM and to find new potential therapies. Furthermore, targeting mitochondrial dysfunction with LA and LCAR can revert the pathological alterations in NM cellular models.
Keywords:
Nemaline myopathy
; actin polymerization
; mitochondria
; linoleic acid
; L-carnitine
1. Introduction
Congenital myopathies are a group of genetic muscle diseases that are classified based on the histopathological features observed on muscle biopsy [1]. Among these disorders nemaline myopathy (NM) was first described as a non-progressive congenital musculoskeletal disorder, characterized by the presence of inclusions in muscle fibers called "nemaline rods" [2]. This pathology contains a wide genetic heterogeneity, since multiple mutations in different genes that produce a similar phenotype have been identified [3]. Its incidence is approximately 1 in 50,000 live births.
The International European Neuromuscular Group classifies NM into six clinical subtypes based on the severity, age of onset, and degree of muscle weakness: severe congenital (neonatal), Amish, intermediate congenital, typical congenital, childhood onset, and adult-onset [4]; Of these, the most common subtype corresponds to the typical congenital subtype [5]. The most common clinical presentation is characterized by an onset in early infancy or childhood with hypotonia or generalized weakness predominantly in facial, axial, and proximal limb muscles. Additional features include skeletal deformities, dysmorphic fascia, arched high palate, and respiratory distress with respiratory tract infections [1]. The natural history of the disease is usually static or very slowly progressive and many of the patients can lead normal lives. Serious clinical complications are almost always secondary to respiratory deficiency and sometimes to cardiological problems. In most cases, cardiomyopathy develops in adulthood, while rarely occurs in childhood [6].
There are 14 known causative genes of NM [7]. Mutations in the ACTA1 and NEB genes, which code for actin 1 alpha (ACTA1) and nebulin (NEB) proteins, respectively, critical components of the sarcomeric thin filament, result in the most prevalent types of NM. More specifically, it is predicted that mutations in the NEB gene account for over 50% of cases of NM, whereas mutations in the ACTA1 gene account for between 15%-25% of cases [8]. NEB, known as the giant actin-binding protein because it has a molecular weight of between 600-800 kDa, plays a very important role in stabilizing and regulating the length of the actin filament [9]. ACTA1 is the actin isoform predominantly found in the thin filaments of skeletal muscles and essential, along with myosin, for muscle contraction [10].
The diagnosis is established from the clinical suspicion, since paraclinical studies such as creatinine kinase levels may be normal or slightly elevated and electromyography may show nonspecific myopathic changes. The diagnosis is confirmed histopathologically by muscle biopsy analysis, in which characteristic rod bodies (nemaline bodies) are found in the sarcoplasm, evidenced by modified Gomori stain [1]. Increasingly the diagnosis is made or confirmed by molecular genetic testing for mutations in the genes known to cause NM.
The etiology of the disease remains unclear. The accumulation of nemaline bodies by itself does not explain the muscle weakness characteristic of the disease and could be only a secondary phenomenon of the main pathogenic process. In fact, no correlation has been observed between the severity of the disease and the degree of accumulation of nemaline bodies [11]. In addition to nemaline bodies, pathological defects have been also observed in skeletal muscle fibers both in mouse models and in patients with NM: abundant, unevenly spaced, and with irregular morphology nuclei; interrupted nuclear envelope; impaired chromatin arrangement; and cytoskeletal disorganization [12]. Due to the important role of the nuclear form and the envelope in the regulation of gene expression, and of the cytoskeleton in maintaining the integrity of the muscle fiber, it is likely that these alterations are responsible for some distinctive features of the disease, such as the disorder of the contractile filaments and the altered mechanical properties.
The disease has also been associated with mitochondrial dysfunction, specifically, with complex I dysfunction or deficiency [13]. One hypothesis proposes that by disrupting the integrity of the thin filaments and, consequently, disrupting normal muscle function, less energy is used and there is a "down-regulation" of complex I activity and, therefore, adenosine triphosphate (ATP) production [13]. In addition, regarding the formation of nemaline rods, numerous rods were observed in some patients with complex I deficiency [14]. It has been seen that the formation of these can be induced in muscle and non-muscle cells in vitro by several different cellular stressors [15]. These data suggest that metabolic alterations during the formation and turnover of sarcomeres may induce the formation of nemaline rods. However, it is still unclear how these two pathological phenomena are related. Furthermore, interactions between mitochondria and the actin cytoskeleton have been linked to essential functions of this organelle [16]. Thus, actin filaments primarily modulate mitochondrial dynamics [17,18], trafficking and autophagy [19], but also mitochondrial biogenesis and metabolism [20]. Therefore, it is reasonable to deduce that the actin polymerization defects in NM such as ACTA1 and NEB mutations may affect mitochondrial function.
Animal and cell models are needed to better understand the mechanisms involved in the development of the disease. Currently, animal, and in vitro models of NM are being explored, specifically mouse and zebrafish models [21]. Respect to cellular models, in addition to in vitro contraction studies of muscle fibers [22], functional studies have been conducted in specific genetic mutations and their proteins in several cell lines, such as NIH3T3 fibroblasts, C2C12 myoblasts or Sol 8 myogenic cells that differentiate into myotubes [23,24]. Most patient mutations studied by cell transfection reveal cellular defects typical of the disease, such as actin aggregates and the formation of nemaline bodies seen in patients' muscle biopsies. On the other hand, regarding human cell lines of the disease, recently, two isogenic lines of induced pluripotent stem cells (iPSC) derived from a patient with severe nemaline myopathy with a dominant heterozygous mutation in the ACTA1 gene have been achieved [25]. Alternatively, patient-derived skin fibroblasts can be easily obtained by small biopsies of the skin in a non-invasive way, have a great capacity for division and harbor the specific mutations of the patients [26].
In this manuscript, we have evaluated whether fibroblasts derived from NM patients carrying ACTA1 and NEB mutations can be useful cellular models for studying disease pathophysiology. The work is based on the hypothesis that both affected proteins, ACTA1 and NEB, may participate in the formation and stabilization of actin filaments, and therefore, alterations of actin polymerization can be visualized in patient-derived fibroblasts. In addition, we examined the consequences of actin polymerization defects on mitochondrial function. Finally, we also evaluated the correction of all pathological alterations by mitochondrial targeting compounds such as linoleic acid (LA) and L-carnitine (LCAR).
2. Materials and Methods
2.1. Reagents
The subsequence antibodies were acquired from Abcam (Cambridge, United Kingdom): Alpha Skeletal Muscle Actin (ab28052), Alpha tubulin (ab7291), NADH:Ubiquinone oxidoreductase subunit A9 (NDUFA9) (ab14713), cytochrome c oxidase subunit IV (COXIV) (ab14744), ATP synthase F1 subunit alpha (ATP5F1A) (ab1478), Voltage-depebdent anion channel 1 (VDAC1) (ab14734) and Superoxide Dismutase 2 (SOD2) (ab68155). The next antibodies were purchased from Invitrogen (Thermo Fisher Scientific (Whaltham, MA, United States)): Rho (A, B, C) (PAI-338), Rho-associated protein kinase 1 (ROCK1) (PA5-22262), Phospho-ROCK1 (PA5-36763) and NADH:Ubiquinone oxidoreductase core subunit S1 (NDUFS1) (PA5-22309). RhoA (8789S), Vimentin (D21H3) and Glutathione Peroxidase 4 (GPX4) (52455S) were purchased from Cell Signaling (Danvers, MA, United States). Antibodies for beta actin (MBS448085) and Mitochondrially Encoded NADH:Ubiquinone oxidoreductase core subunit 1 (Mt-ND1) (6888S) were purchased from MyBioSource (San Diego, CA, United States). Cytochrome b-c1 complex subunit 2 (UQCR2) was supplied from US Biological (Salem, MA, United States). The following antibodies were acquired from Santa Cruz Biotechnology (Santa Cruz, CA, United States): dynamin-related protein 1 (DRP1) (sc-32898), succinate dehydrogenase complex iron-sulfur subunit B (SDHB) (sc-271548) and Superoxide Dismutase 1 (SOD1) (sc-101523). Optic atrophy type 1 (OPA1) (HPA036926) was acquired from Sigma-Aldrich (San Luis, MO, United States). Novus Biologicals (Centennial, CO, United States) provided Mitochondrially Encoded cytochrome c oxidase subunit 2 (Mt-CO2) (NBP1-778220). Trypsin, Dimethyl Sulfoxide (DMSO), Saponin, Tris-Base, 4ʹ,6-Diamidino-2-phenylindole (DAPI), tetramethylethylenediamine (TEMED), Dulbecco's Modified Eagle Medium (DMEM) 4.5 g/l and 1 g/l glucose, L-glutamine, Pyruvate (Gibco), Penicillin:Streptomycin 10,000:10,000 (Gibco), Fetal Bovine Serum (FBS) (Gibco), Mowiol 4-88 Mw (Sigma Chemical Co. (St. Louis, MO, United States)). Bovine Serum Albumin (BSA) (Santa Cruz Biotechnology (Santa Cruz, CA, United States)). PierceTM BCA Protein Assay Kit (Fisher Scientific, Waltham, MA, USA). Rho Activation Assay Kit (Rf. 8820) (Cell Signaling Technology (Massachusetts, United States)). Rhodamine Phalloidin Reagent (Abcam (Cambridge, United Kingdom)). Acrylamide 37.5:1 solution, Clarity TM Western ECL substrate, electrophoresis buffer (TGS), sodium dodecyl sulfate (SDS), Triton X-100, blot buffer (TG), Tween-20, DC Protein Assay Reagent A, B, S, (Bio-Rad Laboratories Inc. (Hercules, CA, USA)). 2-Isopropanol, Ethanol, Methanol, Sodium Chloride (NaCl), Ammonium Persulfate (APS), Glacial Acetic Acid, Potassium Hydroxide (KOH), Potassium Chloride (KCL) (Panreac (Barcelona, Spain)), Protease Inhibitor Cocktail (Roche (F. Hoffmann-La Roche Ltd, Basel, Switzerland). L-carnitine (sc-205727), Y27632 (sc-3536) and Paraformaldehyde (PFA) (sc-25326B) were purchased from Santa Cruz Biotechnology (Santa Cruz, CA, United States). Sigma-Aldrich (San Luis, MO, United States) supplied Linoleic acid (L1376).
2.2. Patients and cell culture
Four lines of fibroblasts derived from patient skin biopsies from the Pediatric Department of Hospital Universitario Virgen del Rocío, Sevilla, Spain were used. Two controls lines of primary human skin fibroblasts were purchased from ATCC. Patient 1 (P1) presents a heterozygous pathogenic variant c.133G>T (p.Val45Phe) in ACTA1 that causes a missense variant. The second patient (P2) is also heterozygous carrying changes in position c.760A>T (p.Asn254Tyr) in ACTA1. The third patient (P3) presents heterozygous pathogenic variants c.10321A>C (p.Thr3441Pro) and c.13669C>T (pArg4557*) in NEB. The fourth patient (P4) presents heterozygous pathogenic variants c.24407_24410dup (p.Leu8137Phefs*18) c.8425C>T (p.Arg2809*) in NEB.
Control values were represented as mean±SD of three control lines. Fibroblasts were grown in Dulbecco's modified Eagle's medium DMEM (Gibco™, ThermoFisher Scientific, Waltham, MA, USA) supplemented with 10% FBS (Gibco™, ThermoFisher Scientific, Waltham, MA, USA), and 100 mg/ml penicillin/streptomycin. Fibroblasts were cultured at 37°C and 5% CO2. Experiments were performed with less than 12 passage fibroblasts cultures.
2.3. Immunoblotting
Western blotting was performed using standard methods. After protein transfer, the membrane was incubated with various primary antibodies diluted 1:1000 and then with the corresponding secondary antibody coupled to horseradish peroxidase (HRP) at a 1:10000 dilution. The Immun-Star HRP substrate kit (Biorad Laboratories Inc., Hercules, CA, USA) was used to identify particular proteins.
2.4. Real-time quantitative PCR (qPCR)
ACTA1 and NEB gene expression in fibroblasts was analysed by qPCR using mRNA extracts. Using TrizolTM (Invitrogen, Carlsbad, CA, USA), mRNA was extracted in accordance with the manufacturer's instructions. To obtain complementary DNA (cDNA), RNA was retrotranscribed using the Iscript cDNA synthesis Kit (Bio-Rad, Hercules, CA, United States). TB GreenTM Premix Ex TaqTM (Takara Bio Europe S.A.S., Saint-Germain-en-Laye, France) was used for qPCR. CFX Connect Real-Time PCR Detection System (Bio-Rad, Hercules, CA, USA) was used to detect accurate quantification of gene expression. ACTA1 primers were 5’-CCATTTATGAGGGCTACGCG-3’ (Forward primer) and 5’- CAGCTTCTCCTTGATGTCGC-3’ (Reverse primer) amplifying a sequence of 158 nucleotides. NEB primers were 5’- GAAACCAGACCACAGCCTTG-3’ (Forward primer) and 5’-TAGGGCATCTTTCACCGTGT-3’ (Reverse primer) amplifying a sequence of 224 nucleotides. Human α Tubulin was used as a housekeeping control gene and the primers were 5’-GCAGCATTTGTAGCAGGTGA-3’ (Forward primer) and 3’- GCATTGCCAATCTGGACAC -5’ (reverse primer). All primer pairs were previously validated by PCR, followed by gel electrophoresis, confirming correct product amplification.
2.5. Active RhoA assay
Fibroblasts were grown on 75 cm2 flasks in DMEM containing 10% FBS. According to the manufacturer’s recommendations, media were removed, and cells were washed twice using ice-cold PBS 1X and the cell lysate was collected using Lysis/Binding/Wash buffer supplemented 1X protease inhibitor cocktail provided by the Active Rho Detection Kit (Cell Signaling Technology, Danvers, MA, USA, Cat. 8820). After centrifuging at 16000 g at 4°C for 15 min, lysate protein concentration was determined using BCA Protein Assay Kit and a 1 mg/ml lysate in 1X Lysis/Binding/Wash buffer was prepared. After making the cell lysate stock, protein then was incubated with GST Rhotekin-RBD affinity beads at 4°C for 1 h with gentle rocking. Bound proteins (Active RhoA form) were washed and prepared with SDS Sample Buffer and then, Western blotting analysis was carried out according to the previously mentioned protocol.
2.6. Immunofluorescence microscopy
Fibroblasts were grown on 1 mm width (Goldseal No. 1) glass coverslips for 24–48h in DMEM containing 20% FBS. Cells were rinsed once with PBS 1X, fixed in 4% PFA for 5 min at room temperature and permeabilized in 0.1% saponin for 5 min. Then, cells were blocked with blocking solution (1% BSA in PBS 1X). For immunostaining, glass coverslips were incubated with primary antibodies diluted 1:100 in blocking solution, overnight at 4°C. Unbound antibodies were removed by washing the coverslips with PBS 1X (three times, 5 min). The secondary antibody, a FITC-labelled goat anti-mouse antibody, or a tetramethyl rhodamine goat anti-rabbit (Molecular Probes), diluted 1:400 in blocking solution, were added and incubated for 2h at room temperature. Coverslips were then rinsed with PBS 1X for 5 min, incubated for 1 min with PBS 1X containing DAPI (1 μg/ml), and washed with PBS (three 5-min washes). Finally, the coverslips were mounted onto microscope slides using Mowiol aqueous mounting medium and analysed using a DeltaVision system (Applied Precision; Issaquah, WA) with an Olympus IX-71 microscope (Olympus Corporation, Shinjuku, Tokyo, Japan) as well as the colocalization.
2.7. Immunofluorescence staining of cytoskeletal F-actin
Briefly, fibroblasts were seeded on 1 mm coverslips (Goldseal No. 1) for 24–48 h in DMEM containing 10% FBS. Next day after reaching to 50% confluency, cells were fixed with 4% PFA for 10 minutes at room temperature and permeabilized with 0.1% Saponin for 15 minutes. Then, cells were washed with PBS 1X twice and incubated with Rhodamine-Phalloidin, a high affinity F-actin probe conjugated to red-orange fluorescent dye, at 1 μg/ml for 30 minutes. After incubation, cells were washed with PBS 1X three times and incubated with DAPI at 1 μg/ml for 5 min to nuclei staining. Subsequently, cells were washed three times with PBS 1X for 5 minutes. Finally, the coverslips were mounted on microscope slides with Mowiol aqueous mounting medium. After staining, images were taken by a DeltaVision system with an Olympus IX-71 fluorescence microscope with a 40× oil objective. Images were analysed by Fiji-ImageJ software.
In order to evaluate the state of actin filaments, the percentage of cells with correct actin polymerization and the length of actin filaments present in each cell were examined. To estimate the percentage of cells with correct actin polymerization for each patient, three counts of 100 cells per sample were performed; the values of these counts were compared among themselves and between the different samples. Cells with correct actin polymerization were considered those cells that presented actin filaments similar to those presented by control cells. The length of actin filaments present in each cell were measured by Fiji-ImageJ software. To execute this, the filaments of 30 cells of each cell line were measured in triplicate. The actin filament length values represented in the figures are expressed as the average of the measured filament lengths.
2.8. Bioenergetics and Oxidative Stress Analysis
Mitochondrial respiratory function of control and NM fibroblasts were measured using mito-stress test assay by XF24 extracellular flux analyzer (Seahorse Bioscience, Billerica, MA). Cells were seeded at a density of 15000 cells/well in XF24 cell culture plates in 150 μl growth medium (DMEM medium containing 20% FBS) and placed in 37°C incubator with 5% CO2. After 24h incubation, growth medium from each well was removed, leaving 50 μl of media. Then, cells were washed twice with 1 ml of pre-warmed assay medium (XF base medium supplemented with 10-mM glucose, 1-mM glutamine, and 1-mM sodium pyruvate; pH 7.4) and 450 μl of assay medium (500 μl final) was added. Cells were incubated in 37°C incubator without CO2 for 1h to allow pre-equilibrating with the assay medium. Mitochondrial functionality was evaluated by sequential injection of four compounds that affect bioenergetics. The final concentrations of injections were 1 μM oligomycin, 2 μM FCCP (carbonyl cyanide-4-trifluoromethoxy-phenylhydrazone), and 2.5 μM rotenone/antimycin A. The best concentration of each inhibitor and uncoupler, as well as the optimal cells seeding density, were determined in preliminary assays. A minimum of five wells per treatment were utilized in any given experiment. This assay allowed for an estimation of basal respiration, ATP production, maximal respiration, and spare respiratory capacity parameters.
2.9. Mitotracker staining. Analysis of Mitochondrial Network
Cells were stained with MitoTracker Red CMXRos (100 nM, 45 min, 37°C), a mitochondrial potential-dependent dye, and examined by fluorescence microscopy. The amount of mitochondrial fragmentation was evaluated using the Fiji software. For each experimental condition, a total of 100 cells collected in three different experiments were used to calculate the number of small, rounded mitochondria per cell. Length or ratio between the major and minor axis of the mitochondrion, degree of circularity and percentage of rounded/tubular mitochondria were considered.
2.10. Measurement of intracellular reactive oxygen species (ROS) generation
Following the manufacturer’s instructions, fibroblasts mitochondrial superoxide generation was measured using 5 μM MitoSOX™ Red. Previously, cells were seeded and grown on coverslips until reaching 80% of confluency. Mitochondrial localization of MitoSOX™ Red signal was confirmed in combination with MitoTracker™ Deep Red FM staining (100 nM, 45 min, 37°C), an in vivo mitochondrial membrane potential-independent probe. Cells' nuclei were stained with 1 μg/ml DAPI. After staining, images were taken by a DeltaVision system with an Olympus IX-71 fluorescence microscope with a 40× oil objective. Images were analysed by Fiji-ImageJ software.
2.11. Statistics
Statistical analysis was conducted in accordance with our research group's previous description [27]. In situations where there were few events (n<30), we employed non-parametric statistics that do not make any distributional assumptions [28]. In these cases, multiple groups were compared using a Kruskal-Wallis test. We used parametric tests when the number of events was greater (n>30). In these instances, a one-way ANOVA was used to compare multiple groups. Statistical analysis were conducted using the GraphPad Prism 9.0 (GraphPad Software, San Diego, CA). The information is presented as the mean±SD values or as an example from three independent experiments. p-values of less than 0.05 were considered significant.
3. Results
3.1. NM fibroblasts present alterations in actin alpha1 (ACTA1) and nebulin (NEB) expression levels.
First, we analysed ACTA1 and NEB protein expression levels in control and NM patients derived fibroblasts (P1 and P2 harboring ACTA1 mutations; and P3 and P4 carrying NEB mutations). As shown by immunofluorescence microscopy in Figure 1A,B, ACTA1 expression levels were markedly reduced in P1 and P2 cells, while NEB (Figure 2A,B) expression levels were reduced in P3 and P4. Interestingly, ACTA1 immunostaining colocalized with actin filaments in control cells but not in mutant cells.
Reduced expression levels of ACTA1 were confirmed by Western blotting analysis (Figure 3A,B). Low protein expression levels of mutant proteins were associated with a reduction in ACTA1 transcript levels in P1 and P2 mutant fibroblasts (Figure 3C). Moreover, NEB transcripts levels in P3 and P4 were confirmed suggesting a decrease of gene expression of affected genes or an increase of mutant transcripts degradation in NM cells (Figure 3C,D).
3.2. NM patient-derived fibroblasts show defects in actin filament polymerization.
Cell staining with Rhodamine-Phalloidin showed that fibroblasts derived from NM patients have marked defects in the polymerization of actin filaments. Thus, mutant fibroblasts P1 and P2 harboring ACTA1 mutations and P3 and P4 harboring NEB mutations displayed unstructured actin filaments of shorter length than control fibroblasts (Figure 4A,B). In addition, the analysis revealed that the percentage of NM fibroblasts with correct actin filament polymerization was much lower than in control cells (Figure 4C). P1 fibroblasts showed the more severe defect in actin filament polymerization (only 7% of P1 fibroblasts showed a correct actin polymerization). Interestingly, expression levels of β-actin (component of microfilaments) were up-regulated both in ACTA1 and NEB mutant fibroblasts (Supplementary Figure S1A,B).
NM patient-derived fibroblasts did not show alterations in the level of expression of other cytoskeletal proteins. Thus, the analysis of expression of vimentin (component of the intermediate filaments), and α-tubulin (component of microtubules) did not reveal significant differences in mutant fibroblasts compared to control fibroblasts (Supplementary Figure S1A,B).
3.3. RhoA/ROCK pathway is overactivated in NM fibroblasts
As the RhoA/ROCK pathway plays an essential role in actin polymerization [27,28], we next examined the expression levels of Rho A, Active RhoA, ROCK1 and phosphorylated ROCK1. NM mutant cells P1, P2, P3 and P4 showed increased activation of active RhoA and phosphorylated ROCK1 indicating overactivation of the RhoA/ROCK pathway (Figure 5A,B). Interestingly, control cells treated with Y-27632, a ROCK inhibitor, mimicked the actin polymerization defects found in NM cells (Supplementary Figure S2A,B), suggesting that RhoA/ROCK pathway overactivation is a compensatory mechanism to increase actin polymerization in ACTA1 and NEB mutations.
3.4. NM fibroblasts display alterations in mitochondrial bioenergetics and network morphology.
Since actin cytoskeleton and the correct actin filament polymerization is essential for mitochondria function [16], we further investigated mitochondrial bioenergetics in NM fibroblasts. For that purpose, mitochondrial bioenergetics parameters were examined in control and NM fibroblasts (Figure 6). Fibroblasts derived from patient P1, P2, P3 and P4 showed reduced basal, maximal, and spare respiration, and decreased mitochondrial ATP production compared to the control cells. This reduced respiratory ability is consistent with the presence of a marked mitochondrial dysfunction.
After labeling mitochondria with MitotrackerTM Red CMXRos and examining them using fluorescence microscopy, we proceeded to investigate the morphology of the mitochondrial network. Representative images of mitochondrial morphology are shown in Figure 7A. A total of 100 cells were quantified for each condition (Figure 7B). The mitochondrial network of NM fibroblast P1, P2, P3 and P4 showed the presence of depolarized and fragmented mitochondria. Mitochondrial fragmentation was evaluated calculating the percentage of rounded and tubular mitochondria. We observed a marked reduction in tubular mitochondria of NM cells compared to control cells (Figure 7C). As positive control of mitochondrial membrane potential depolarization, control cells were treated with 100 µM CCCP (carbonyl cyanide m-chlorophenylhydrazone) for 4 hour as positive control.
As the actin cytoskeleton plays an essential role in the regulation of mitochondrial dynamics [16], we next evaluated the expression levels of DRP1 and OPA1, the main proteins involved in mitochondrial fission and fusion processes, respectively. NM mutant cells P1, P2, P3 and P4 showed increased expression levels of DRP1 and reduced levels of OPA1 in comparison with control cells, indicating an imbalance between mitochondrial fission and fusion processes (Figure 7D,E). These results agree with the fragmented mitochondrial network (Figure 7A) and the reduced percentages of tubular mitochondria and increased percentages of rounded mitochondria (Figure 7C) presented by NM cells compared to control cells.
Mitochondrial dysfunction in NM cells was also confirmed by evaluating the expression levels of mitochondrial proteins (Figure 8A). Thus, expression levels of mitochondrial protein subunits NDUFA9 (Complex I), NDUFS4 (Complex I), mtND1(Complex I), SDHB (Complex II), UQCRC2 (Complex III), mtCOX2 (Complex IV), COX4 (Complex IV), ATP5A (Complex V) and VDAC1 were significantly downregulated in NM mutant cells respect to control cells.
3.5. NM patient- derived fibroblast present increased ROS and alterations in antioxidant enzymes expression levels
As mitochondrial dysfunction is related to an increase in oxidative stress and reactive oxygen species (ROS) production, we also studied the mitochondrial ROS generation by MitoSOX™ and the protein expression levels of antioxidants enzymes. Thus, NM cells showed a significative mitochondrial ROS overproduction compared to control cells (Figure 9A,B). Furthermore, the protein expression levels of cytoplasmic superoxide dismutase (SOD1), mitochondrial superoxide dismutase (SOD2) and glutathione peroxidases (GPX4) were also reduced in NM fibroblasts, suggesting that the enzymatic antioxidant system is downregulated in mutant NM cells (Figure 9C,D).
3.6. Supplementation with linoleic (LA) acid and L-carnitine (LCAR) restores actin polymerization.
After an initial pharmaceutical screening aiming to identify commercial supplements able to restore actin polymerization patterns in mutant cells, we selected two well-known mitochondrial boosting compounds: LA and LCAR. Treatment with 5 µM LA and 10 µM LCAR for 7 days significantly improved actin filaments polymerization in NM cells (Figure 10A). Thus, supplementation with both compounds separately and in combination significantly increased both the percentage of cells with correct actin polymerization and the length of the actin filaments in P1, P2, P3 and P4 fibroblasts (Figure 10B,C). LA and LCAR concentrations were chosen considering the efficiency in recovering actin polymerization in dose-response curve assays (Supplementary Figures S3–S6).
3.7. Supplementation with LA and LCAR improves mitochondrial bioenergetics.
We further examined the effect of LA and LCAR supplementation on mitochondrial function in NM fibroblasts using the bioenergetic profile provided by the Seahorse analyzer. Thus, mitochondrial bioenergetic parameters were examined in control and NM fibroblasts P1 (Figure 11A) and P3 (Figure 11B) treated and untreated with LA and LCAR. Supplementation with LA and LCAR individually or in combination were able to correct the reduced basal, maximal, and spare respiration, as well as mitochondrial ATP production in both ACTA1 (P1) and NEB (P3) mutant fibroblasts.
Improvement of mitochondrial bioenergetics in mutant cells under LA and LCAR supplementation was also accompanied by a significant restoration of mitochondrial membrane potential and mitochondrial network morphology (Figure 12A). Furthermore, supplementation also restored the reduction in the percentages of tubular mitochondria found in NM cells compared to control cells (Supplementary Figure S7).
In addition, LA and LCAR treatment notably increased mitochondrial protein expression levels (Figure 13 and Supplementary Figures S8–S11) and significantly reduced mitochondrial ROS production in NM cells (Supplementary Figure S12), thus confirming the improvement of mitochondrial function.
3.8. Supplementation with LA and LCAR corrects RhoA/ROCK pathway overactivation.
Next, to assess the effect of LA and LCAR on RhoA/ROCK pathway NM fibroblasts, we determined the expression levels of Total RhoA, active Rho A and downstream proteins (ROCK1 and pROCK1) in P1 and P3 NM fibroblast (Figure 14A,B).
Results showed that LA and LCAR individually or in combination reduced the activation of RhoA and key essential downstream proteins such as pROCK1 both in ACTA1 (P1) and NEB (P3) fibroblasts.
4. Discussion
Nemaline myopathy (NM) encompasses a large spectrum of rare genetic myopathies characterized by hypotonia, weakness and depressed or absent deep tendon reflexes. Histology examination of muscle biopsy typically shows the presence of nemaline rods. In this work, we explored the pathophysiological alterations in NM using patient-derived fibroblasts patients carrying ACTA1 and NEB mutations. Mutant fibroblasts manifest alterations in actin filament polymerization associated with mitochondrial dysfunction. In addition, we identified two compounds, linoleic acid (LA) and L-carnitine (LCAR) that restored actin polymerization and corrected bioenergetics deficiency in both ACTA1 and NEB mutant fibroblasts.
Actin is a widely distributed, highly conserved protein that plays a key role in the cytoskeleton and is involved in a variety of biological processes. In addition to providing structural support for the cell, actin plays a role in cell migration, cell division and organelle trafficking [29,30]. Actin's role was first described in muscle contraction in 1942 by A. Szent-Györgyi [31]. Actin is found in two different forms: G-actin, which is the globular monomeric actin that polymerizes to form filamentous F-actin [32].
Six different actin isoforms are expressed in a higher mammal [33]. A group of structurally related genes with highly homologous nucleotide sequences that share a common precursor code for different isoforms of actin [34]. Actin isoforms differ by four amino acid residues localized at positions 1, 2, 3, and 9 of the N-terminus [33]. Six human actin genes - α-skeletal (ACTA1), α-cardiac (ACTC1), α-smooth muscle (ACTA2), γ-smooth muscle (ACTG2), β-cytoplasmic (ACTB), γ-cytoplasmic (ACTG1) - are localized on the different chromosomes [35]. The seventh actin isoform, β-actin-like protein 2 (ACTBL2), has been recently identified. It is a member of the non-muscle actin class, along with γ- and β-cytoplasmic actins, but its expression is extremely low [36]. Cytoplasmic actins are expressed in mammalian cells in various proportions [37].
Conversely, nebulin (NEB) is a very large filamentous protein ranging in size from 600 to 900 kDa that is a crucial part of the thin filament in skeletal muscle. Because of its size and the difficulty in obtaining nebulin in its native state from muscle, its functions are still largely unknown [38].
In our work, we have demonstrated for the first time that both actin 1 alpha (ACTA1) and nebulin (NEB) are expressed in dermal fibroblasts allowing the investigation of pathological alterations induced by mutant proteins in an easy-to-use cellular model. In addition, both proteins indeed participate in actin filament polymerization in dermal fibroblasts since both mutant proteins ACTA1 and NEB caused defects in actin polymerization in NM cells.
One interesting finding in our work is that NM patient-derived fibroblasts exhibited alterations in mitochondrial network morphology associated with down-regulation of the expression levels of mitochondrial proteins and deficient mitochondrial bioenergetics suggesting a marked mitochondrial dysfunction. Mitochondria are organelles that undergo dynamic changes through fission (division into two or more independent organelles) and fusion (formation of a single structure) events, biogenesis, and mitophagy (clearance of damaged organelles) [39,40]. These processes regulate mitochondrial morphology, number, and turnover, respectively, referred to as mitochondrial quality control [41]. Mitochondrial fusion and fission cycles are adaptive changes controlled by dynamin-related protein 1 (DRP1), mitofusin 1 (MFN1), mitofusin 2 (MFN2), and optic atrophy protein 1 (OPA1) in mammalian cells [42]. Mitochondrial fusion increases mitochondrial metabolism, while mitochondrial fission contributes to mitochondrial apoptosis and is considered a prerequisite for mitophagy [43]. Mitophagy removes selectively old or dysfunctional mitochondria through its sequestration and engulfment for the subsequent lysosomal degradation [44]. Different stresses, such as oxidative damage, hypoxia, mitochondrial depolarization or mitochondrial DNA damage enhance mitophagy [45,46]. Accumulating evidence reveals that mitophagy is required to maintain skeletal muscle plasticity by controlling mitochondrial biogenesis turnover, and mitochondrial proteostasis [47,48], in order to increase mitochondrial activity and remodeling during early myogenic differentiation [49,50,51].
Cytoskeletal components, particularly microtubules and F-actin, work collaboratively to regulate mitochondrial processes of fission/fusion, mitophagy and morphology in response to extracellular stressors [52]. Mitochondrial motility is also dependent on the coordinated action of cytoskeletal elements, especially microtubules and F-actin, which distribute and anchor the organelles to the proper locations within the cell [53]. Specifically, it has been suggested that alterations to the cytoskeleton can affect mitochondria, resulting in functional modifications in the organelle. The primary role of mitochondria in cells is energy production, which is closely correlated with the regulation of their morphology, organization, and distribution by the cytoskeleton [54]. Thus, cytoskeletal abnormalities of actin polymerization in NM can subsequently lead to impairments in mitochondrial respiration, thereby accelerating disease progression.
The process of mitochondrial fission involves the formation of ring-shaped DRP1 oligomers on the outer membrane of the mitochondria, which are then constricted by hydrolysis [55]. In order to facilitate the subsequent recruitment of dynamin-2, which coordinates membrane scission, DRP1 rings tighten and constrict mitochondria. [56]. Nevertheless, in order to reduce their cross-sectional diameter, mitochondria must first go through a pre-constriction step because they are frequently thicker than DRP1 rings. Endoplasmic reticulum (ER) tubules are wrapped and tightened around mitochondria to produce this pre-constriction. Growing evidence points to actin polymerization as the primary force behind the ER's bending around the mitochondria [57,58].
In addition, F-actin at Mito/ER contacts may prime DRP1 to form functional oligomers on the outer membrane of the mitochondria [59]. In vitro GTPase assays show that DRP1 activity is greatly enhanced in the presence of actin filaments [59]. Taken together, these observations suggest that filamentous actin acts as an important regulator of inner and outer mitochondrial membrane fission.
Moreover, the actin cytoskeleton controls the movement of mitochondria in simple eukaryotes like budding yeast [60] and is necessary for the accurate inheritance of mitochondria during cytokinesis [61]. Microtubules in metazoans are responsible for coordinating long-distance mitochondrial movement, but the actin cytoskeleton is also involved in regulating mitochondrial distribution, coordinating anchoring, and coordinating short-distance mitochondrial motility [52].
In addition, actin cytoskeleton plays an important role on mtDNA expression and maintenance [62]. The mammalian mitochondrial DNA genome (mtDNA) contains 37 genes organized in compact DNA:protein complexes called nucleoids [63,64], whose expression requires a high degree of coordination with the nuclear genome [65]. In yeast, the ERMES (ER-mitochondria encounter structure) complex regulates the stability and organization of mtDNA in nucleoids in an actin-dependent manner [66]; in mammals, MERCs (Mitochondria Endoplasmic Reticulum Contact Sites) are spatially-linked to mitochondrial nucleoids, regulating their distribution, division and active transportation by the microtubules [67]. Furthermore, recent super-resolution microscopy-based studies probed the presence of β-actin-containing structures inside the mitochondrial matrix [68].
Furthermore, β-actin-deficient human cells were more susceptible to stress brought on by a decrease in mitochondrial membrane potential (ΔΨ), as well as altered mtDNA mass and nucleoid organization [69], indicating a regulatory function in mtDNA transcription and quality control. In addition to actin, myosin II has been linked to isolated mitochondrial nucleoids, and its silencing results in mtDNA alterations [62]. These evidences support the role of actin and actin-binding proteins in mitochondrial nucleoid segregation and mtDNA transcription and maintenance, likely through formation of a “mitoskeleton” network supporting mtDNA inheritance.
Additionally, the complete activation of metabolic pathways that subsequently control mitochondrial function depends on actin filaments. For example, direct binding of glycolytic enzymes like glyceraldehyde phosphate dehydrogenase or aldolase to F-actin can activate them [70]. Interestingly, in brain mitochondria actin regulates the retention of cytochrome c between respiratory chain complexes III and IV by its direct association with both complexes, and inhibition of actin polymerization with cytochalasin b enhanced mitochondrial respiration through increased complex IV activity [71]. Recently, proteomic analysis using NEB [72] and ACTA1 [73] mice models revealed perturbations in several cellular processes, including mitochondrial dysfunction and changes in energetic metabolism and stress-related pathways. Abnormal mitochondrial distribution, reduced mitochondrial respiratory function, increased mitochondrial membrane potential, and abnormally low ATP content were all revealed by structural and functional studies.
In our work we have also identified two compounds, LA and LCAR, that improving mitochondrial bioenergetics were able to restore actin polymerization.
LA is a carboxylic acid composed of 18 carbon atoms and three cis double bonds (18:2ω6), and is an essential fatty acid indispensable to the human body and therefore, it must be ingested through diet [74,75]. Pharmacological studies have shown that LA has a wide range of pharmacological effects such as anti-metabolic syndrome, antiinflammatory, anticancer, antioxidize, neuroprotection, and the regulation of the intestinal flora [76,77,78]. LA is a major component of cardiolipin (CL), which is a specific inner-mitochondrial membrane phospholipid that is important for optimal mitochondrial function including respiration and energy production [79]. Furthermore, this phospholipid participates in morphology and stability of mitochondrial cristae, fission and fusion-mediated mitochondrial quality control and dynamics, mitophagy, mitochondrial biogenesis and protein import, and multiple mitochondrial steps of the apoptotic process [79]. Due to its high content of unsaturated fatty acids and its location in the IMM near to electron transport chain (ETC) complexes, the main sites of reactive oxygen species (ROS) production, CL is particularly prone to peroxidation, an event that may affect many CL-dependent reactions and processes [80,81,82]. In addition, the accumulation of oxidized CL in the OMM serves as important signaling platform during the apoptotic process, resulting in the opening of the mitochondrial permeability transition pore (mPTP) and in the release of cytochrome c (cyt c) from mitochondria to the cytosol [83,84].
Specifically, CL and its LA content are known to be positively associated with cytochrome c oxidase (COX) activity [85] thereby making this lipid molecule an essential factor related to mitochondrial health and function. Structural studies have shown that CL is important for stabilization (i.e., the assembly of complex subunits) of mitochondrial oxidative phosphorylation (OXPHOS) complex I (CI), complex II (CII), complex III (CIII), and complex IV (CIV) [86,87,88,89]. On the other hand, a decrease in CL levels by low dietary intake of LA promotes the disassembly of these mitochondrial OXPHOS complexes [90]. In contrast, LA-enriched diet increased mitochondrial CL, and OXPHOS protein levels [91]. Additionally, it was recently discovered that cardiolipin is necessary for the respiratory chain to organize into supramolecular assemblies [92]. Furthermore, incubation of cells with different concentrations of LA led to a dose- and time-dependent increase of cardiolipin levels [93].
It is conceivable that LA supplementation by increasing cardiolipin levels may positively impact the activity of a variety of mitochondrial proteins and enzymes, including the electron transport chain (ETC) and oxidative phosphorylation (OXPHOS) complexes, thus increasing mitochondrial function and dynamics. Furthermore, LA stimulates mitochondrial biogenesis signaling by the upregulation of PPARγ coactivator 1α (PGC-1α) in C2C12 cells [94].
In addition of its cardiolipin dependent actions, LA also promotes an increase of fascin expression, an actin crosslinker globular protein that generates actin bundles built of parallel actin filaments, which mediate formation and stability of cellular protrusions including microspikes, stress fibers, membrane ruffes, and filopodia [95]. In this respect, LA is found to induce membrane ruffling and phagocytic cup formation along with cytoskeletal rearrangement in microglia [96]. Furthermore, LA has many effects on cytoskeleton proteins in general and actin filaments in particular. For instance, it has been reported that LA enhances cell migration by altering the dynamics of microtubules and the remodeling of the actin cytoskeleton at the leading edge [97]. Moreover, LA may activate the RhoA/ROCK pathway and therefore, may facilitate actin polymerization. Thus, it has been shown that LA increased Intercellular Adhesion Molecule 1 (ICAM-1) expression and phosphorylation of ROCK and Myosin Phosphatase Target Subunit 1 (MYPT-1), a distal signal of ROCK [98].
On the other hand, LCAR, a well-known dietary supplement which is needed for the translocation of fatty acids into the mitochondrial compartment for β-oxidation [99,100] and has a role in carbohydrate metabolism possesses this potential to raise the mitochondrial biogenesis, increasing various mitochondrial components’ gene expression and maintains their function via supplying their respective substrates and protecting them against insults including the toxic products’ or reactive radicals’ accumulation [101,102]. Therefore, LCAR as natural compounds that can enhance cellular energy transduction may have therapeutical potential in NM. Studies in recent years have demonstrated the protective effects of LCAR treatment on mitochondrial functions [102]. Consistent with this hypothesis, a premature boy with a congenital form of nemaline myopathy due to mutation in the ACTA1-gene showed decreased LCAR levels in the eighth week of life. After sufficient oral LCAR substitution he improved gradually [103]. Furthermore, LCAR ameliorates congenital myopathy in a tropomyosin 3 de novo mutation transgenic zebrafish [104]. Furthermore, LCAR significantly reduced statin-induced myopathy [105] and skeletal muscle atrophy in rats [106]. In addition, LCAR improved exercise performance in human patients with mitochondrial myopathy [107] and may prevent age-associated muscle protein degradation and regulate mitochondrial homeostasis [108].
As actin polymerization is dependent of ATP levels. During cycles of actin assembly and disassembly, actin monomers polymerize into filaments in an adenosine triphosphate (ATP)-bound state, and the polymerization of actin is followed by the irreversible hydrolysis of ATP to adenosine diphosphate (ADP) and phosphate (6).
Thus, in eukaryotic cells, the actin cytoskeleton's turnover between its monomeric and filamentous forms is a significant energy drain. It is not surprising that lower ATP levels slow actin polymerization since ATP is essential for actin polymerization. Reduced ATP levels most likely cause an abundance of ADP-G-actin versus ATP-G-actin. The lower actin polymerization rate observed in the ATP-deficient cells may be explained by the fact that ADP-G-actin polymerizes at a substantially slower rate than ATP-G-actin [109,110]. Actin filament assembly and dynamic behavior are mediated in large part by binding with ATP and ATP hydrolysis.
In addition, RhoA activity which regulates actin polymerization decreased in parallel with the concentration of ATP and GTP during depletion by mitochondrial inhibitors recovered rapidly when cells were returned to normal culture conditions [111], suggesting that ATP and GTP levels modulate RhoA activation.
In this regard, mitochondrial dysfunction in NM cells may cause ATP deficiency and aggravate the impairment of actin polymerization. LCAR and/or LA supplementation may boost mitochondrial ATP formation and consequently may facilitate actin filament formation by increasing actin monomers bound to ATP and RhoA activation by increasing GTP levels.
5. Conclusions
In conclusion, our findings demonstrate that fibroblasts derived from patients with NM are useful cellular models to study the disease and allow evaluating the effectiveness of pharmacological compounds. Furthermore, we confirm the close relationship between actin cytoskeleton and mitochondria function. Supplementation with LA or/and LCAR was able to restore actin polymerization and correct mitochondrial dysfunction in NM cells. Further studies are required to assess the benefit of both compounds in sarcomere organization and skeletal muscle contraction. Patient-derived cellular models may complement ACTA1 and NEB mouse and zebrafish models and enable the evaluation of genomic or pharmacological therapies.
Supplementary Materials
The following supporting information can be downloaded at the website of this paper posted on Preprints.org. Figure S1: Expression level of cytoskeletal components of NM cells; Figure S2: RhoA/ROCK pathway inhibition aggravated the state of actin polymerization in control and NM cells; Figure S3: Dose-response curve of the effect of LA and LCAR on actin polymerization in patient P1 cells; Figure S4: Dose-response curve of the effect of LA and LCAR on actin polymerization in patient P2 cells; Figure S5: Dose-response curve of the effect of LA and LCAR on actin polymerization in patient P3 cells; Figure S6: Dose-response curve of the effect of LA and LCAR on actin polymerization in patient P4 cells; Figure S7: Quantification of tubular and rounded percentage of mitochondria in control and NM fibroblasts; Figure S8: Densitometry of the Western blotting of patient P1 corresponding to figure 13A; Figure S9: Densitometry of the Western blotting of patient P2 corresponding to figure 13A; Figure S10: Densitometry of the Western blotting of patient P3 corresponding to figure 13B; Figure S11: Densitometry of the Western blotting of patient P4 corresponding to figure 13B; Figure S12: Measurement of mitochondrial reactive oxygen species (ROS) generation in treated and untreated Control and NM cells (P1 and P3).
Author Contributions
Conceptualization, J.A. Sánchez-Alcázar, R. Piñero-Pérez and A. López-Cabrera; methodology, A. López-Cabrera, M. Álvarez-Córdoba, M. Talaverón-Rey, D. Gómez-Fernández, P. Cilleros-Holgado, JM. Romero-Domínguez, A. Romero-González, D. Reche-López, and R. Piñero-Pérez; formal analysis, A. Suárez-Carrillo, and M. Munuera-Cabeza; writing-original draft preparation, R. Piñero-Pérez, A. López-Cabrera and M. Álvarez-Córdoba; writing-review and editing, J. A. Sánchez-Alcázar, R. Piñero-Pérez and A. López-Cabrera; funding acquisition, J.A. Sánchez-Alcázar. All authors have read and agreed to the published version of the manuscript.
Funding
This work was supported by the patient association “Yo Nemalínica”, FIS PI16/00786 and PI19/00377 grants, Instituto de Salud Carlos III, Spain and Fondo Europeo de Desarrollo Regional (FEDER-Unión Europea), Proyectos de Investigación de Excelencia de la Junta de Andalucía CTS-5725 and PY18-850, and UPO-FEDER 2018 (UPO-1380614).
Institutional Review Board Statement
The study was conducted in accordance with the Declaration of Helsinki, and approved by Coordinating Committee of Ethics of Biomedical Research of Andalusia (protocol code MYO-CURE 3, July 11, 2019).
Informed Consent Statement
Not applicable.
Data Availability Statement
Data and material are available under request.
Acknowledgments
We acknowledge the support of families and patients involved in this study, FEDER (Federación Española de Enfermedades Raras) and Fundación MERK Salud.
Conflicts of Interest
The authors declare that they have no competing interests.
References
- North KN, Wang CH, Clarke N, Jungbluth H, Vainzof M, Dowling JJ, Amburgey K, Quijano-Roy S, Beggs AH, Sewry C, Laing NG, Bonnemann CG, International Standard of Care Committee for Congenital M (2014) Approach to the diagnosis of congenital myopathies. Neuromuscular disorders: NMD 24 (2):97-116. [CrossRef]
- Shy GM, Engel WK, Somers JE, Wanko T (1963) Nemaline Myopathy. A New Congenital Myopathy. Brain: a journal of neurology 86:793-810.
- Sanoudou D, Beggs AH (2001) Clinical and genetic heterogeneity in nemaline myopathy--a disease of skeletal muscle thin filaments. Trends in molecular medicine 7 (8):362-368. [CrossRef]
- Wallgren-Pettersson C, Beggs AH, Laing NG (1998) 51st ENMC International Workshop: Nemaline Myopathy. 13-15 June 1997, Naarden, The Netherlands. Neuromuscular disorders: NMD 8 (1):53-56.
- Ryan MM, Schnell C, Strickland CD, Shield LK, Morgan G, Iannaccone ST, Laing NG, Beggs AH, North KN (2001) Nemaline myopathy: a clinical study of 143 cases. Annals of neurology 50 (3):312-320.
- Gatayama R, Ueno K, Nakamura H, Yanagi S, Ueda H, Yamagishi H, Yasui S (2013) Nemaline myopathy with dilated cardiomyopathy in childhood. Pediatrics 131 (6):e1986-1990. [CrossRef]
- Ogasawara M, Nishino I (2023) A review of major causative genes in congenital myopathies. Journal of human genetics 68 (3):215-225. [CrossRef]
- Romero NB, Sandaradura SA, Clarke NF (2013) Recent advances in nemaline myopathy. Current opinion in neurology 26 (5):519-526. [CrossRef]
- Pappas CT, Bliss KT, Zieseniss A, Gregorio CC (2011) The Nebulin family: an actin support group. Trends Cell Biol 21 (1):29-37. [CrossRef]
- Laing NG, Dye DE, Wallgren-Pettersson C, Richard G, Monnier N, Lillis S, Winder TL, Lochmuller H, Graziano C, Mitrani-Rosenbaum S, Twomey D, Sparrow JC, Beggs AH, Nowak KJ (2009) Mutations and polymorphisms of the skeletal muscle alpha-actin gene (ACTA1). Human mutation 30 (9):1267-1277. [CrossRef]
- Costa CF, Rommelaere H, Waterschoot D, Sethi KK, Nowak KJ, Laing NG, Ampe C, Machesky LM (2004) Myopathy mutations in alpha-skeletal-muscle actin cause a range of molecular defects. Journal of cell science 117 (Pt 15):3367-3377. [CrossRef]
- Ross JA, Levy Y, Ripolone M, Kolb JS, Turmaine M, Holt M, Lindqvist J, Claeys KG, Weis J, Monforte M, Tasca G, Moggio M, Figeac N, Zammit PS, Jungbluth H, Fiorillo C, Vissing J, Witting N, Granzier H, Zanoteli E, Hardeman EC, Wallgren-Pettersson C, Ochala J (2019) Impairments in contractility and cytoskeletal organisation cause nuclear defects in nemaline myopathy. Acta neuropathologica 138 (3):477-495. [CrossRef]
- Pula S, Urankar K, Norman A, Pierre G, Langton-Hewer S, Selby V, Mason F, Vijayakumar K, McFarland R, Taylor RW, Majumdar A (2020) A novel de novo ACTA1 variant in a patient with nemaline myopathy and mitochondrial Complex I deficiency. Neuromuscular disorders: NMD 30 (2):159-164. [CrossRef]
- Lamont PJ, Thorburn DR, Fabian V, Vajsar J, Hawkins C, Saada Reisch A, Durling H, Laing NG, Nevo Y (2004) Nemaline rods and complex I deficiency in three infants with hypotonia, motor delay and failure to thrive. Neuropediatrics 35 (5):302-306. [CrossRef]
- Vandebrouck A, Domazetovska A, Mokbel N, Cooper ST, Ilkovski B, North KN (2010) In vitro analysis of rod composition and actin dynamics in inherited myopathies. Journal of neuropathology and experimental neurology 69 (5):429-441. [CrossRef]
- Illescas M, Penas A, Arenas J, Martin MA, Ugalde C (2021) Regulation of Mitochondrial Function by the Actin Cytoskeleton. Front Cell Dev Biol 9:795838. [CrossRef]
- Moore AS, Wong YC, Simpson CL, Holzbaur EL (2016) Dynamic actin cycling through mitochondrial subpopulations locally regulates the fission-fusion balance within mitochondrial networks. Nature communications 7:12886. [CrossRef]
- Tilokani L, Nagashima S, Paupe V, Prudent J (2018) Mitochondrial dynamics: overview of molecular mechanisms. Essays Biochem 62 (3):341-360. [CrossRef]
- Kast DJ, Dominguez R (2017) The Cytoskeleton-Autophagy Connection. Curr Biol 27 (8):R318-R326. [CrossRef]
- Fernie AR, Zhang Y, Sampathkumar A (2020) Cytoskeleton Architecture Regulates Glycolysis Coupling Cellular Metabolism to Mechanical Cues. Trends Biochem Sci 45 (8):637-638. [CrossRef]
- Sewry CA, Laitila JM, Wallgren-Pettersson C (2019) Nemaline myopathies: a current view. Journal of muscle research and cell motility 40 (2):111-126. [CrossRef]
- Marston S, Memo M, Messer A, Papadaki M, Nowak K, McNamara E, Ong R, El-Mezgueldi M, Li X, Lehman W (2013) Mutations in repeating structural motifs of tropomyosin cause gain of function in skeletal muscle myopathy patients. Human molecular genetics 22 (24):4978-4987. [CrossRef]
- Ilkovski B, Nowak KJ, Domazetovska A, Maxwell AL, Clement S, Davies KE, Laing NG, North KN, Cooper ST (2004) Evidence for a dominant-negative effect in ACTA1 nemaline myopathy caused by abnormal folding, aggregation and altered polymerization of mutant actin isoforms. Human molecular genetics 13 (16):1727-1743. [CrossRef]
- Vandamme D, Lambert E, Waterschoot D, Tondeleir D, Vandekerckhove J, Machesky LM, Constantin B, Rommelaere H, Ampe C (2009) Phenotypes induced by NM causing alpha-skeletal muscle actin mutants in fibroblasts, Sol 8 myoblasts and myotubes. BMC Res Notes 2:40. [CrossRef]
- Clayton JS, Scriba CK, Romero NB, Malfatti E, Saker S, Larmonier T, Nowak KJ, Ravenscroft G, Laing NG, Taylor RL (2021) Generation of two isogenic induced pluripotent stem cell lines from a 4-month-old severe nemaline myopathy patient with a heterozygous dominant c.553C > A (p.Arg183Ser) variant in the ACTA1 gene. Stem Cell Res 53:102273. [CrossRef]
- Villalon-Garcia I, Alvarez-Cordoba M, Suarez-Rivero JM, Povea-Cabello S, Talaveron-Rey M, Suarez-Carrillo A, Munuera-Cabeza M, Sanchez-Alcazar JA (2020) Precision Medicine in Rare Diseases. Diseases 8 (4). [CrossRef]
- Katoh K, Kano Y, Amano M, Kaibuchi K, Fujiwara K (2001) Stress fiber organization regulated by MLCK and Rho-kinase in cultured human fibroblasts. American journal of physiology Cell physiology 280 (6):C1669-1679. [CrossRef]
- Ridley AJ (2006) Rho GTPases and actin dynamics in membrane protrusions and vesicle trafficking. Trends Cell Biol 16 (10):522-529. [CrossRef]
- Tang DD, Gerlach BD (2017) The roles and regulation of the actin cytoskeleton, intermediate filaments and microtubules in smooth muscle cell migration. Respir Res 18 (1):54. [CrossRef]
- Venkatesh K, Mathew A, Koushika SP (2020) Role of actin in organelle trafficking in neurons. Cytoskeleton (Hoboken) 77 (3-4):97-109. [CrossRef]
- Szent-Gyorgyi AG (2004) The early history of the biochemistry of muscle contraction. J Gen Physiol 123 (6):631-641. [CrossRef]
- Dominguez R, Holmes KC (2011) Actin structure and function. Annu Rev Biophys 40:169-186. [CrossRef]
- Vandekerckhove J, Weber K (1978) At least six different actins are expressed in a higher mammal: an analysis based on the amino acid sequence of the amino-terminal tryptic peptide. Journal of molecular biology 126 (4):783-802. [CrossRef]
- Hightower RC, Meagher RB (1986) The molecular evolution of actin. Genetics 114 (1):315-332. [CrossRef]
- Gunning P, Ponte P, Kedes L, Eddy R, Shows T (1984) Chromosomal location of the co-expressed human skeletal and cardiac actin genes. Proceedings of the National Academy of Sciences of the United States of America 81 (6):1813-1817. [CrossRef]
- Malek N, Michrowska A, Mazurkiewicz E, Mrowczynska E, Mackiewicz P, Mazur AJ (2021) The origin of the expressed retrotransposed gene ACTBL2 and its influence on human melanoma cells' motility and focal adhesion formation. Scientific reports 11 (1):3329. [CrossRef]
- Ampe C, Van Troys M (2017) Mammalian Actins: Isoform-Specific Functions and Diseases. Handb Exp Pharmacol 235:1-37. [CrossRef]
- Labeit S, Ottenheijm CA, Granzier H (2011) Nebulin, a major player in muscle health and disease. FASEB journal: official publication of the Federation of American Societies for Experimental Biology 25 (3):822-829. [CrossRef]
- Ni HM, Williams JA, Ding WX (2015) Mitochondrial dynamics and mitochondrial quality control. Redox Biol 4:6-13. [CrossRef]
- van der Bliek AM, Sedensky MM, Morgan PG (2017) Cell Biology of the Mitochondrion. Genetics 207 (3):843-871. [CrossRef]
- Anderson AJ, Jackson TD, Stroud DA, Stojanovski D (2019) Mitochondria-hubs for regulating cellular biochemistry: emerging concepts and networks. Open Biol 9 (8):190126. [CrossRef]
- Chang CR, Blackstone C (2010) Dynamic regulation of mitochondrial fission through modification of the dynamin-related protein Drp1. Ann N Y Acad Sci 1201:34-39. [CrossRef]
- Wai T, Langer T (2016) Mitochondrial Dynamics and Metabolic Regulation. Trends Endocrinol Metab 27 (2):105-117. [CrossRef]
- Onishi M, Okamoto K (2021) Mitochondrial clearance: mechanisms and roles in cellular fitness. FEBS letters 595 (8):1239-1263. [CrossRef]
- Choubey V, Zeb A, Kaasik A (2021) Molecular Mechanisms and Regulation of Mammalian Mitophagy. Cells 11 (1). [CrossRef]
- Onishi M, Yamano K, Sato M, Matsuda N, Okamoto K (2021) Molecular mechanisms and physiological functions of mitophagy. EMBO J 40 (3):e104705. [CrossRef]
- Hood DA, Memme JM, Oliveira AN, Triolo M (2019) Maintenance of Skeletal Muscle Mitochondria in Health, Exercise, and Aging. Annu Rev Physiol 81:19-41. [CrossRef]
- Romanello V, Sandri M (2015) Mitochondrial Quality Control and Muscle Mass Maintenance. Front Physiol 6:422. [CrossRef]
- Baechler BL, Bloemberg D, Quadrilatero J (2019) Mitophagy regulates mitochondrial network signaling, oxidative stress, and apoptosis during myoblast differentiation. Autophagy 15 (9):1606-1619. [CrossRef]
- McMillan EM, Quadrilatero J (2014) Autophagy is required and protects against apoptosis during myoblast differentiation. The Biochemical journal 462 (2):267-277. [CrossRef]
- Sin J, Andres AM, Taylor DJ, Weston T, Hiraumi Y, Stotland A, Kim BJ, Huang C, Doran KS, Gottlieb RA (2016) Mitophagy is required for mitochondrial biogenesis and myogenic differentiation of C2C12 myoblasts. Autophagy 12 (2):369-380. [CrossRef]
- Moore AS, Holzbaur ELF (2018) Mitochondrial-cytoskeletal interactions: dynamic associations that facilitate network function and remodeling. Curr Opin Physiol 3:94-100. [CrossRef]
- Leung MR, Zenezini Chiozzi R, Roelofs MC, Hevler JF, Ravi RT, Maitan P, Zhang M, Henning H, Bromfield EG, Howes SC, Gadella BM, Heck AJR, Zeev-Ben-Mordehai T (2021) In-cell structures of conserved supramolecular protein arrays at the mitochondria-cytoskeleton interface in mammalian sperm. Proceedings of the National Academy of Sciences of the United States of America 118 (45). [CrossRef]
- Solomon T, Rajendran M, Rostovtseva T, Hool L (2022) How cytoskeletal proteins regulate mitochondrial energetics in cell physiology and diseases. Philos Trans R Soc Lond B Biol Sci 377 (1864):20210324. [CrossRef]
- Smirnova E, Griparic L, Shurland DL, van der Bliek AM (2001) Dynamin-related protein Drp1 is required for mitochondrial division in mammalian cells. Molecular biology of the cell 12 (8):2245-2256. [CrossRef]
- Lee JE, Westrate LM, Wu H, Page C, Voeltz GK (2016) Multiple dynamin family members collaborate to drive mitochondrial division. Nature 540 (7631):139-143. [CrossRef]
- Korobova F, Ramabhadran V, Higgs HN (2013) An actin-dependent step in mitochondrial fission mediated by the ER-associated formin INF2. Science 339 (6118):464-467. [CrossRef]
- Manor U, Bartholomew S, Golani G, Christenson E, Kozlov M, Higgs H, Spudich J, Lippincott-Schwartz J (2015) A mitochondria-anchored isoform of the actin-nucleating spire protein regulates mitochondrial division. Elife 4. [CrossRef]
- Ji WK, Hatch AL, Merrill RA, Strack S, Higgs HN (2015) Actin filaments target the oligomeric maturation of the dynamin GTPase Drp1 to mitochondrial fission sites. Elife 4:e11553. [CrossRef]
- Simon VR, Swayne TC, Pon LA (1995) Actin-dependent mitochondrial motility in mitotic yeast and cell-free systems: identification of a motor activity on the mitochondrial surface. J Cell Biol 130 (2):345-354. [CrossRef]
- Boldogh IR, Yang HC, Nowakowski WD, Karmon SL, Hays LG, Yates JR, 3rd, Pon LA (2001) Arp2/3 complex and actin dynamics are required for actin-based mitochondrial motility in yeast. Proceedings of the National Academy of Sciences of the United States of America 98 (6):3162-3167. [CrossRef]
- Reyes A, He J, Mao CC, Bailey LJ, Di Re M, Sembongi H, Kazak L, Dzionek K, Holmes JB, Cluett TJ, Harbour ME, Fearnley IM, Crouch RJ, Conti MA, Adelstein RS, Walker JE, Holt IJ (2011) Actin and myosin contribute to mammalian mitochondrial DNA maintenance. Nucleic Acids Res 39 (12):5098-5108. [CrossRef]
- Clayton DA (1991) Replication and transcription of vertebrate mitochondrial DNA. Annu Rev Cell Biol 7:453-478. [CrossRef]
- Spelbrink JN (2010) Functional organization of mammalian mitochondrial DNA in nucleoids: history, recent developments, and future challenges. IUBMB Life 62 (1):19-32. [CrossRef]
- Rampelt H, Pfanner N (2016) Coordination of Two Genomes by Mitochondrial Translational Plasticity. Cell 167 (2):308-310. [CrossRef]
- Boldogh IR, Pon LA (2006) Interactions of mitochondria with the actin cytoskeleton. Biochimica et biophysica acta 1763 (5-6):450-462. [CrossRef]
- Lewis SC, Uchiyama LF, Nunnari J (2016) ER-mitochondria contacts couple mtDNA synthesis with mitochondrial division in human cells. Science 353 (6296):aaf5549. [CrossRef]
- Dadsena S, King LE, Garcia-Saez AJ (2021) Apoptosis regulation at the mitochondria membrane level. Biochim Biophys Acta Biomembr 1863 (12):183716. [CrossRef]
- Xie X, Venit T, Drou N, Percipalle P (2018) In Mitochondria ?-Actin Regulates mtDNA Transcription and Is Required for Mitochondrial Quality Control. iScience 3:226-237. [CrossRef]
- Arnold H, Pette D (1968) Binding of glycolytic enzymes to structure proteins of the muscle. European journal of biochemistry 6 (2):163-171. [CrossRef]
- Takahashi K, Miura Y, Ohsawa I, Shirasawa T, Takahashi M (2018) In vitro rejuvenation of brain mitochondria by the inhibition of actin polymerization. Scientific reports 8 (1):15585. [CrossRef]
- Slick RA, Tinklenberg JA, Sutton J, Zhang L, Meng H, Beatka M, Avond MV, Prom MJ, Ott E, Montanaro F, Heisner J, Toro R, Granzier H, Geurts AM, Stowe D, Hill RB, Lawlor MW (2023) Aberrations in Energetic Metabolism and Stress-Related Pathways Contribute to Pathophysiology in the Neb Conditional Knockout Mouse Model of Nemaline Myopathy. The American journal of pathology. [CrossRef]
- Tinklenberg JA, Slick RA, Sutton J, Zhang L, Meng H, Beatka MJ, Avond MV, Prom MJ, Ott E, Montanaro F, Heisner J, Toro R, Hardeman EC, Geurts AM, Stowe D, Hill RB, Lawlor MW (2023) Different Mouse Models of Nemaline Myopathy Harboring Acta1 Mutations Display Differing Abnormalities Related to Mitochondrial Biology. The American journal of pathology. [CrossRef]
- Sandri J, Viala J (1995) Direct Preparation of (Z,Z)-1,4-Dienic Units with a New C6 Homologating Agent: Synthesis of α-Linolenic Acid. Synthesis 1995 (03):271-275. [CrossRef]
- Yuan Q, Xie F, Huang W, Hu M, Yan Q, Chen Z, Zheng Y, Liu L (2022) The review of alpha-linolenic acid: Sources, metabolism, and pharmacology. Phytother Res 36 (1):164-188. [CrossRef]
- Egert S, Baxheinrich A, Lee-Barkey YH, Tschoepe D, Stehle P, Stratmann B, Wahrburg U (2018) Effects of a hypoenergetic diet rich in alpha-linolenic acid on fatty acid composition of serum phospholipids in overweight and obese patients with metabolic syndrome. Nutrition 49:74-80. [CrossRef]
- Lee AY, Lee MH, Lee S, Cho EJ (2017) Alpha-Linolenic Acid from Perilla frutescens var. japonica Oil Protects Abeta-Induced Cognitive Impairment through Regulation of APP Processing and Abeta Degradation. J Agric Food Chem 65 (49):10719-10729. [CrossRef]
- Litwiniuk A, Domanska A, Chmielowska M, Martynska L, Bik W, Kalisz M (2020) The Effects of Alpha-Linolenic Acid on the Secretory Activity of Astrocytes and beta Amyloid-Associated Neurodegeneration in Differentiated SH-SY5Y Cells: Alpha-Linolenic Acid Protects the SH-SY5Y cells against beta Amyloid Toxicity. Oxid Med Cell Longev 2020:8908901. [CrossRef]
- Paradies G, Paradies V, Ruggiero FM, Petrosillo G (2019) Role of Cardiolipin in Mitochondrial Function and Dynamics in Health and Disease: Molecular and Pharmacological Aspects. Cells 8 (7). [CrossRef]
- Kagan VE, Chu CT, Tyurina YY, Cheikhi A, Bayir H (2014) Cardiolipin asymmetry, oxidation and signaling. Chem Phys Lipids 179:64-69. [CrossRef]
- Kagan VE, Tyurina YY, Tyurin VA, Mohammadyani D, Angeli JP, Baranov SV, Klein-Seetharaman J, Friedlander RM, Mallampalli RK, Conrad M, Bayir H (2015) Cardiolipin signaling mechanisms: collapse of asymmetry and oxidation. Antioxid Redox Signal 22 (18):1667-1680. [CrossRef]
- Paradies G, Paradies V, Ruggiero FM, Petrosillo G (2014) Cardiolipin and mitochondrial function in health and disease. Antioxid Redox Signal 20 (12):1925-1953. [CrossRef]
- Jalmar O, Francois-Moutal L, Garcia-Saez AJ, Perry M, Granjon T, Gonzalvez F, Gottlieb E, Ayala-Sanmartin J, Klosgen B, Schwille P, Petit PX (2013) Caspase-8 binding to cardiolipin in giant unilamellar vesicles provides a functional docking platform for bid. PloS one 8 (2):e55250. [CrossRef]
- Petrosillo G, Casanova G, Matera M, Ruggiero FM, Paradies G (2006) Interaction of peroxidized cardiolipin with rat-heart mitochondrial membranes: induction of permeability transition and cytochrome c release. FEBS letters 580 (27):6311-6316. [CrossRef]
- Fajardo VA, McMeekin L, Saint C, LeBlanc PJ (2015) Cardiolipin linoleic acid content and mitochondrial cytochrome c oxidase activity are associated in rat skeletal muscle. Chem Phys Lipids 187:50-55. [CrossRef]
- Bazan S, Mileykovskaya E, Mallampalli VK, Heacock P, Sparagna GC, Dowhan W (2013) Cardiolipin-dependent reconstitution of respiratory supercomplexes from purified Saccharomyces cerevisiae complexes III and IV. The Journal of biological chemistry 288 (1):401-411. [CrossRef]
- Fiedorczuk K, Letts JA, Degliesposti G, Kaszuba K, Skehel M, Sazanov LA (2016) Atomic structure of the entire mammalian mitochondrial complex I. Nature 538 (7625):406-410. [CrossRef]
- Mileykovskaya E, Dowhan W (2014) Cardiolipin-dependent formation of mitochondrial respiratory supercomplexes. Chem Phys Lipids 179:42-48. [CrossRef]
- Schwall CT, Greenwood VL, Alder NN (2012) The stability and activity of respiratory Complex II is cardiolipin-dependent. Biochimica et biophysica acta 1817 (9):1588-1596. [CrossRef]
- Maekawa S, Takada S, Nambu H, Furihata T, Kakutani N, Setoyama D, Ueyanagi Y, Kang D, Sabe H, Kinugawa S (2019) Linoleic acid improves assembly of the CII subunit and CIII2/CIV complex of the mitochondrial oxidative phosphorylation system in heart failure. Cell Commun Signal 17 (1):128. [CrossRef]
- Snoke DB, Mahler CA, Angelotti A, Cole RM, Sparagna GC, Baskin KK, Belury MA (2022) Linoleic Acid-Enriched Diet Increases Mitochondrial Tetralinoleoyl Cardiolipin, OXPHOS Protein Levels, and Uncoupling in Interscapular Brown Adipose Tissue during Diet-Induced Weight Gain. Biology (Basel) 12 (1). [CrossRef]
- Zhang M, Mileykovskaya E, Dowhan W (2002) Gluing the respiratory chain together. Cardiolipin is required for supercomplex formation in the inner mitochondrial membrane. The Journal of biological chemistry 277 (46):43553-43556. [CrossRef]
- Valianpour F, Wanders RJ, Overmars H, Vaz FM, Barth PG, van Gennip AH (2003) Linoleic acid supplementation of Barth syndrome fibroblasts restores cardiolipin levels: implications for treatment. J Lipid Res 44 (3):560-566. [CrossRef]
- Kim Y, Park Y (2015) Conjugated linoleic acid (CLA) stimulates mitochondrial biogenesis signaling by the upregulation of PPARgamma coactivator 1alpha (PGC-1alpha) in C2C12 cells. Lipids 50 (4):329-338. [CrossRef]
- Gonzalez-Reyes C, Marcial-Medina C, Cervantes-Anaya N, Cortes-Reynosa P, Salazar EP (2018) Migration and invasion induced by linoleic acid are mediated through fascin in MDA-MB-231 breast cancer cells. Mol Cell Biochem 443 (1-2):1-10. [CrossRef]
- Desale SE, Chinnathambi S (2021) alpha-Linolenic acid induces clearance of Tau seeds via Actin-remodeling in Microglia. Mol Biomed 2 (1):4. [CrossRef]
- Masner M, Lujea N, Bisbal M, Acosta C, Kunda P (2021) Linoleic and oleic acids enhance cell migration by altering the dynamics of microtubules and the remodeling of the actin cytoskeleton at the leading edge. Scientific reports 11 (1):14984. [CrossRef]
- Jung CH, Lee WJ, Hwang JY, Seol SM, Kim YM, Lee YL, Ahn JH, Park JY (2012) The role of Rho/Rho-kinase pathway in the expression of ICAM-1 by linoleic acid in human aortic endothelial cells. Inflammation 35 (3):1041-1048. [CrossRef]
- Bremer J (1983) Carnitine--metabolism and functions. Physiol Rev 63 (4):1420-1480. [CrossRef]
- Tragni V, Primiano G, Tummolo A, Cafferati Beltrame L, La Piana G, Sgobba MN, Cavalluzzi MM, Paterno G, Gorgoglione R, Volpicella M, Guerra L, Marzulli D, Servidei S, De Grassi A, Petrosillo G, Lentini G, Pierri CL (2022) Personalized Medicine in Mitochondrial Health and Disease: Molecular Basis of Therapeutic Approaches Based on Nutritional Supplements and Their Analogs. Molecules 27 (11). [CrossRef]
- Liufu T, Wang Z (2020) Treatment for mitochondrial diseases. Reviews in the neurosciences. [CrossRef]
- Modanloo M, Shokrzadeh M (2019) Analyzing Mitochondrial Dysfunction, Oxidative Stress, and Apoptosis: Potential Role of L-carnitine. Iranian journal of kidney diseases 13 (2):74-86.
- Cabello A, Martinez-Martin P, Gutierrez-Rivas E, Madero S (1990) Myopathy with nemaline structures associated with HIV infection. Journal of neurology 237 (1):64-65.
- Hsu PJ, Wang HD, Tseng YC, Pan SW, Sampurna BP, Jong YJ, Yuh CH (2021) L-Carnitine ameliorates congenital myopathy in a tropomyosin 3 de novo mutation transgenic zebrafish. J Biomed Sci 28 (1):8. [CrossRef]
- Niedbalska-Tarnowska J, Ochenkowska K, Migocka-Patrzalek M, Dubinska-Magiera M (2022) Assessment of the Preventive Effect of L-carnitine on Post-statin Muscle Damage in a Zebrafish Model. Cells 11 (8). [CrossRef]
- Jang J, Park J, Chang H, Lim K (2016) l-Carnitine supplement reduces skeletal muscle atrophy induced by prolonged hindlimb suspension in rats. Appl Physiol Nutr Metab 41 (12):1240-1247. [CrossRef]
- Gimenes AC, Bravo DM, Napolis LM, Mello MT, Oliveira AS, Neder JA, Nery LE (2015) Effect of L-carnitine on exercise performance in patients with mitochondrial myopathy. Braz J Med Biol Res 48 (4):354-362. [CrossRef]
- Ochi H, Westerfield M (2007) Signaling networks that regulate muscle development: lessons from zebrafish. Dev Growth Differ 49 (1):1-11. [CrossRef]
- Fujiwara I, Vavylonis D, Pollard TD (2007) Polymerization kinetics of ADP- and ADP-Pi-actin determined by fluorescence microscopy. Proceedings of the National Academy of Sciences of the United States of America 104 (21):8827-8832. [CrossRef]
- Pollard TD (1986) Rate constants for the reactions of ATP- and ADP-actin with the ends of actin filaments. J Cell Biol 103 (6 Pt 2):2747-2754. [CrossRef]
- Hallett MA, Dagher PC, Atkinson SJ (2003) Rho GTPases show differential sensitivity to nucleotide triphosphate depletion in a model of ischemic cell injury. American journal of physiology Cell physiology 285 (1):C129-138. [CrossRef]
Figure 1.
ACTA1 expression levels by immunofluorescence microscopy in control and NM cells. (A) Control (C1) and NM cells (P1, P2, P3 and P4) were immunostained against ACTA1 and visualized under fluorescence microscope. Nuclei were revealed by DAPI staining. The colocalization between ACTA1 signal and F-actin staining by Rhodamine-Phalloidin was analysed by Pearson correlation coefficient. Pearson correlation coefficient was calculated with DeltaVision system. A positive correlation was considered when Pearson coefficient > 0.75. (B) Quantification of ACTA1 signal. Images were taken using the 60x lens and processed by the ImageJ software. ***p<0.001 between NM and control cells. Scale bars=20 µm.
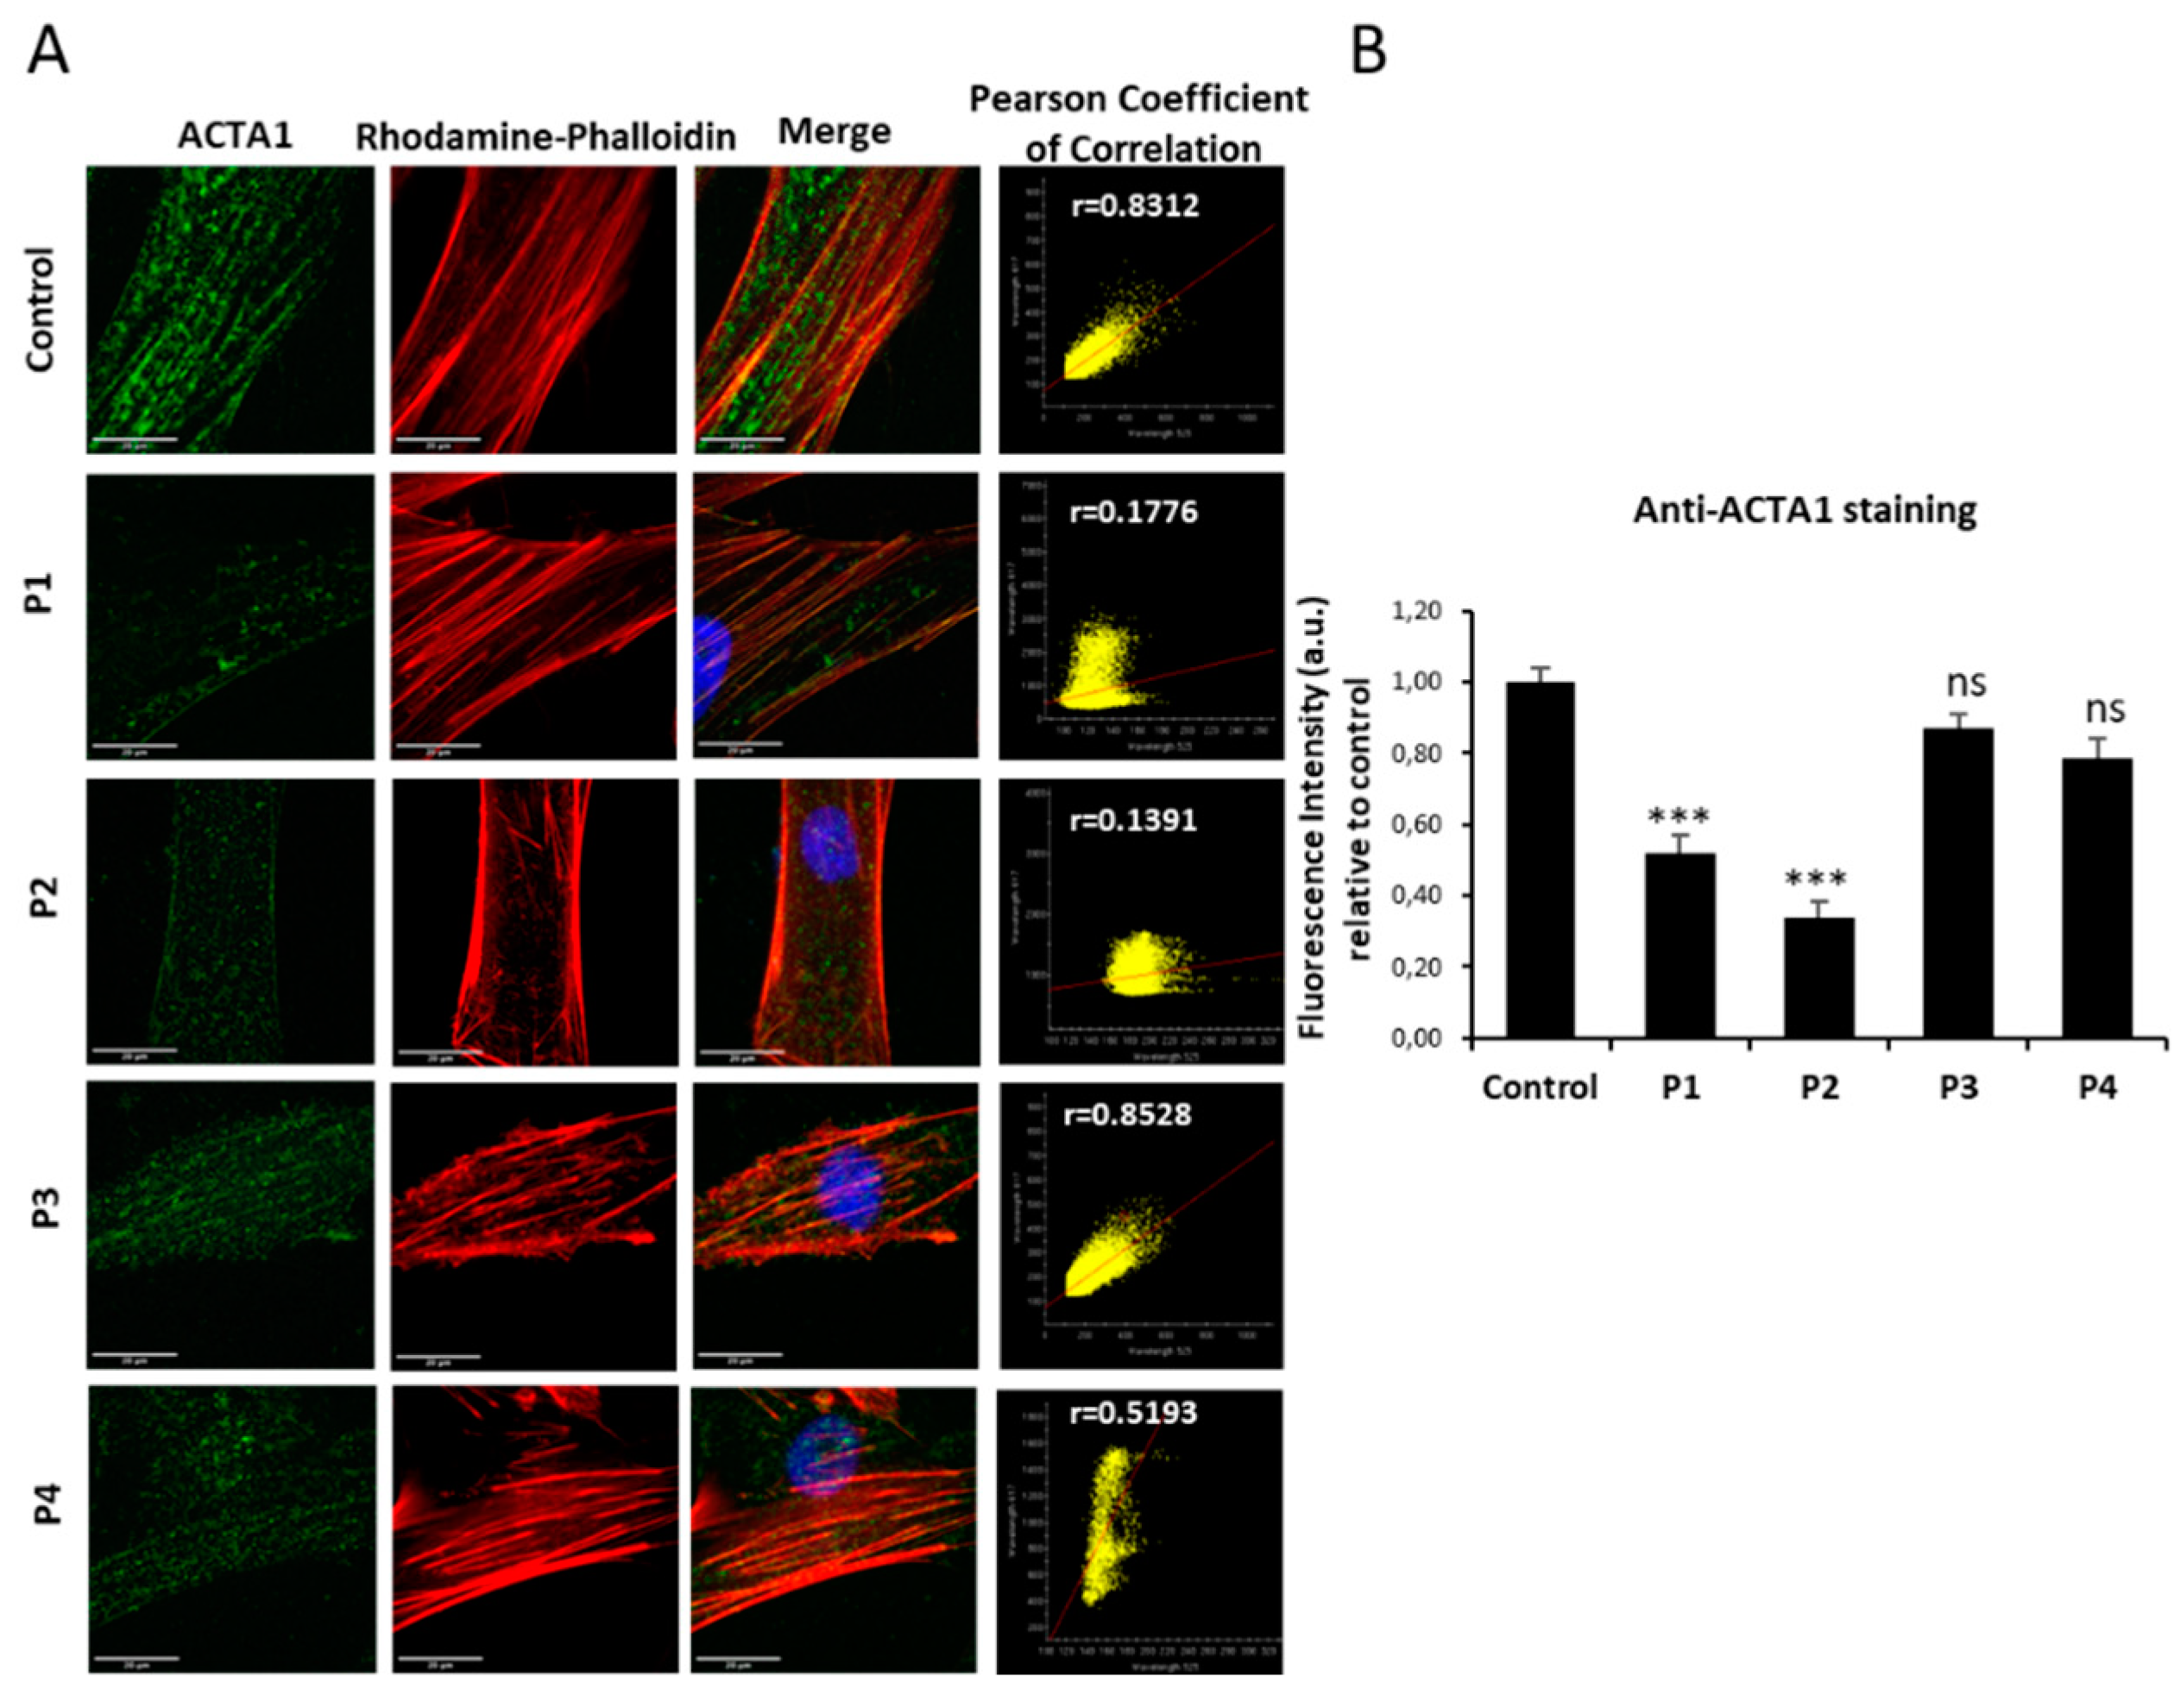
Figure 2.
NEB expression levels by immnunofluorescence microscopy in control and NM cells. (A) Control (C1) and NM cells (P1, P2, P3 and P4) were immunostained against NEB and visualized under widefield fluorescence microscope. Nuclei were revealed by DAPI staining. (B) Quantification of NEB signal. Images were taken using the 40x lens and processed by the ImageJ software. ***p<0.001 between NM and controls cells. Scale bars=20 µm.
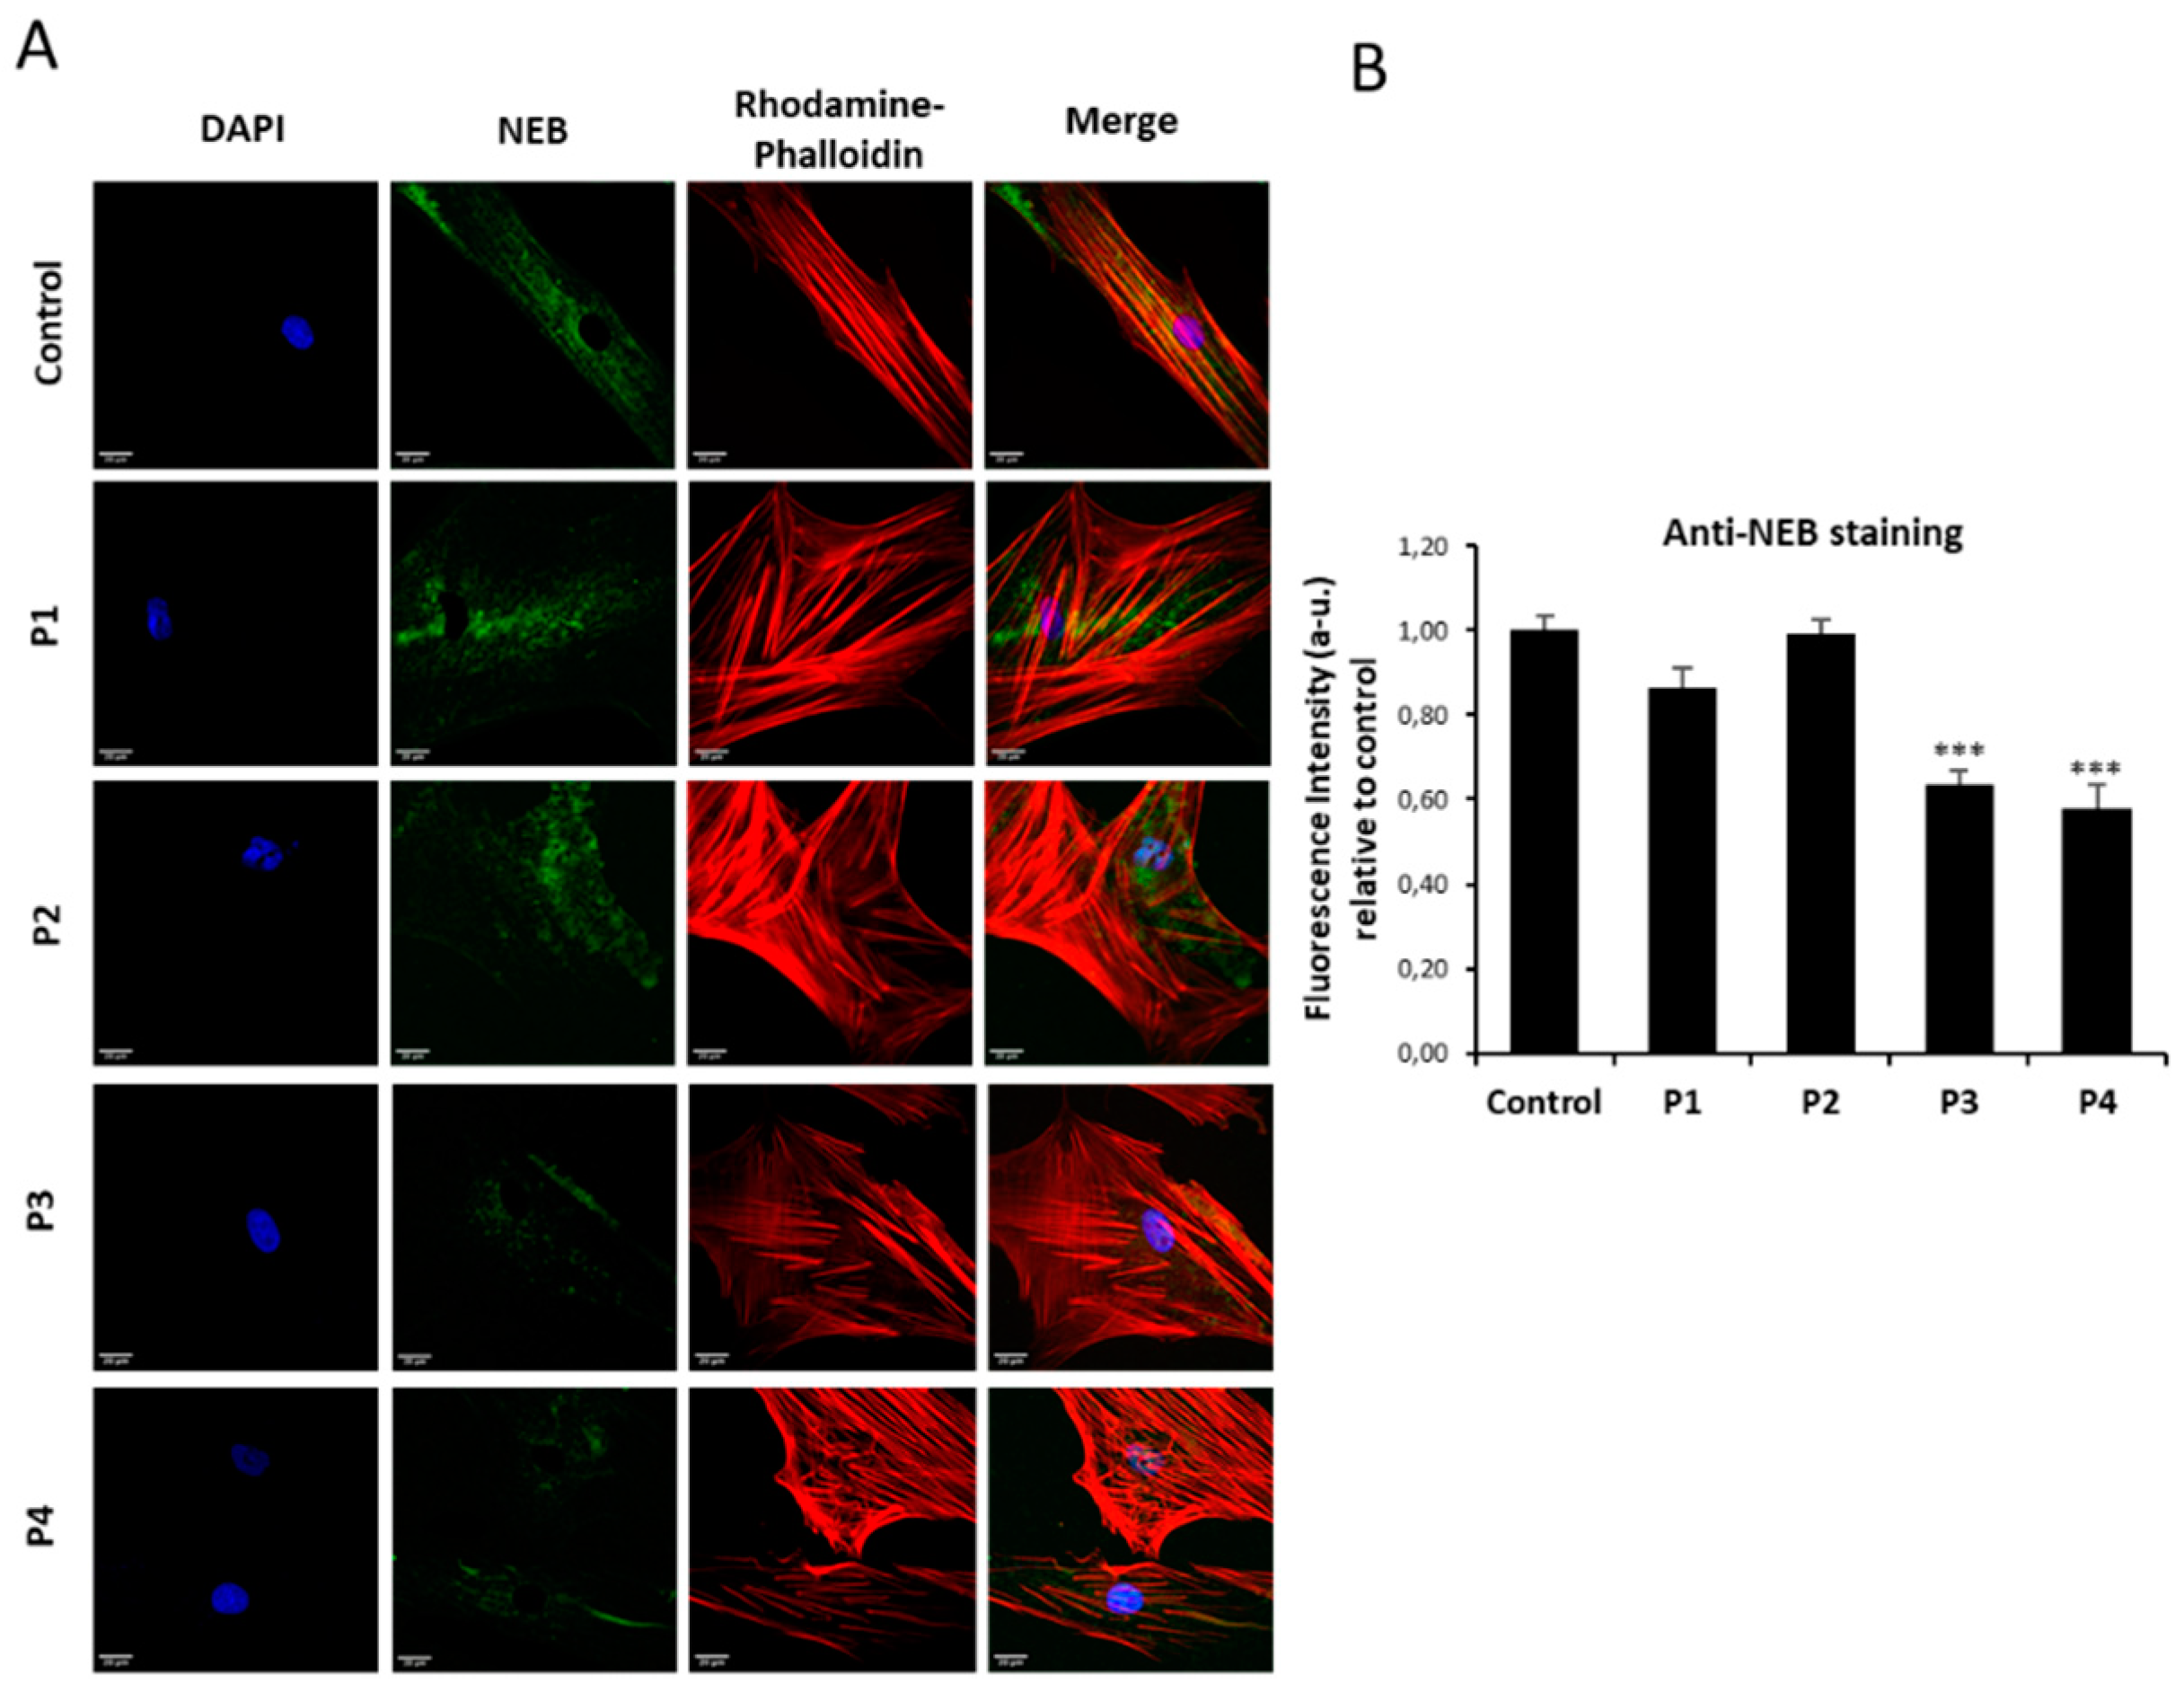
Figure 3.
ACTA1 and NEB expression levels in control and NM cells. (A) Immunoblotting analysis of cellular extracts from controls (C1 and C2) and NM patient cell lines P1, P2, P3 and P4. Protein extracts (50 μg) were separated on a SDS polyacrylamide gel and immunostained with antibodies against ACTA1 and α Tubulin, which was used as a loading control. (B) Densitometry of the Western blotting. (C) ACTA1 gene expression quantified by RT-PCR. Results were normalized to α Tubulin gene expression. (D) NEB gene expression quantified by RT-PCR. Results were normalized to α Tubulin gene expression. Data represent the mean±SD of three separate experiments. *p<0.05, **p<0.01, ***p<0.001 between NM cells and controls. a.u., arbitrary units.
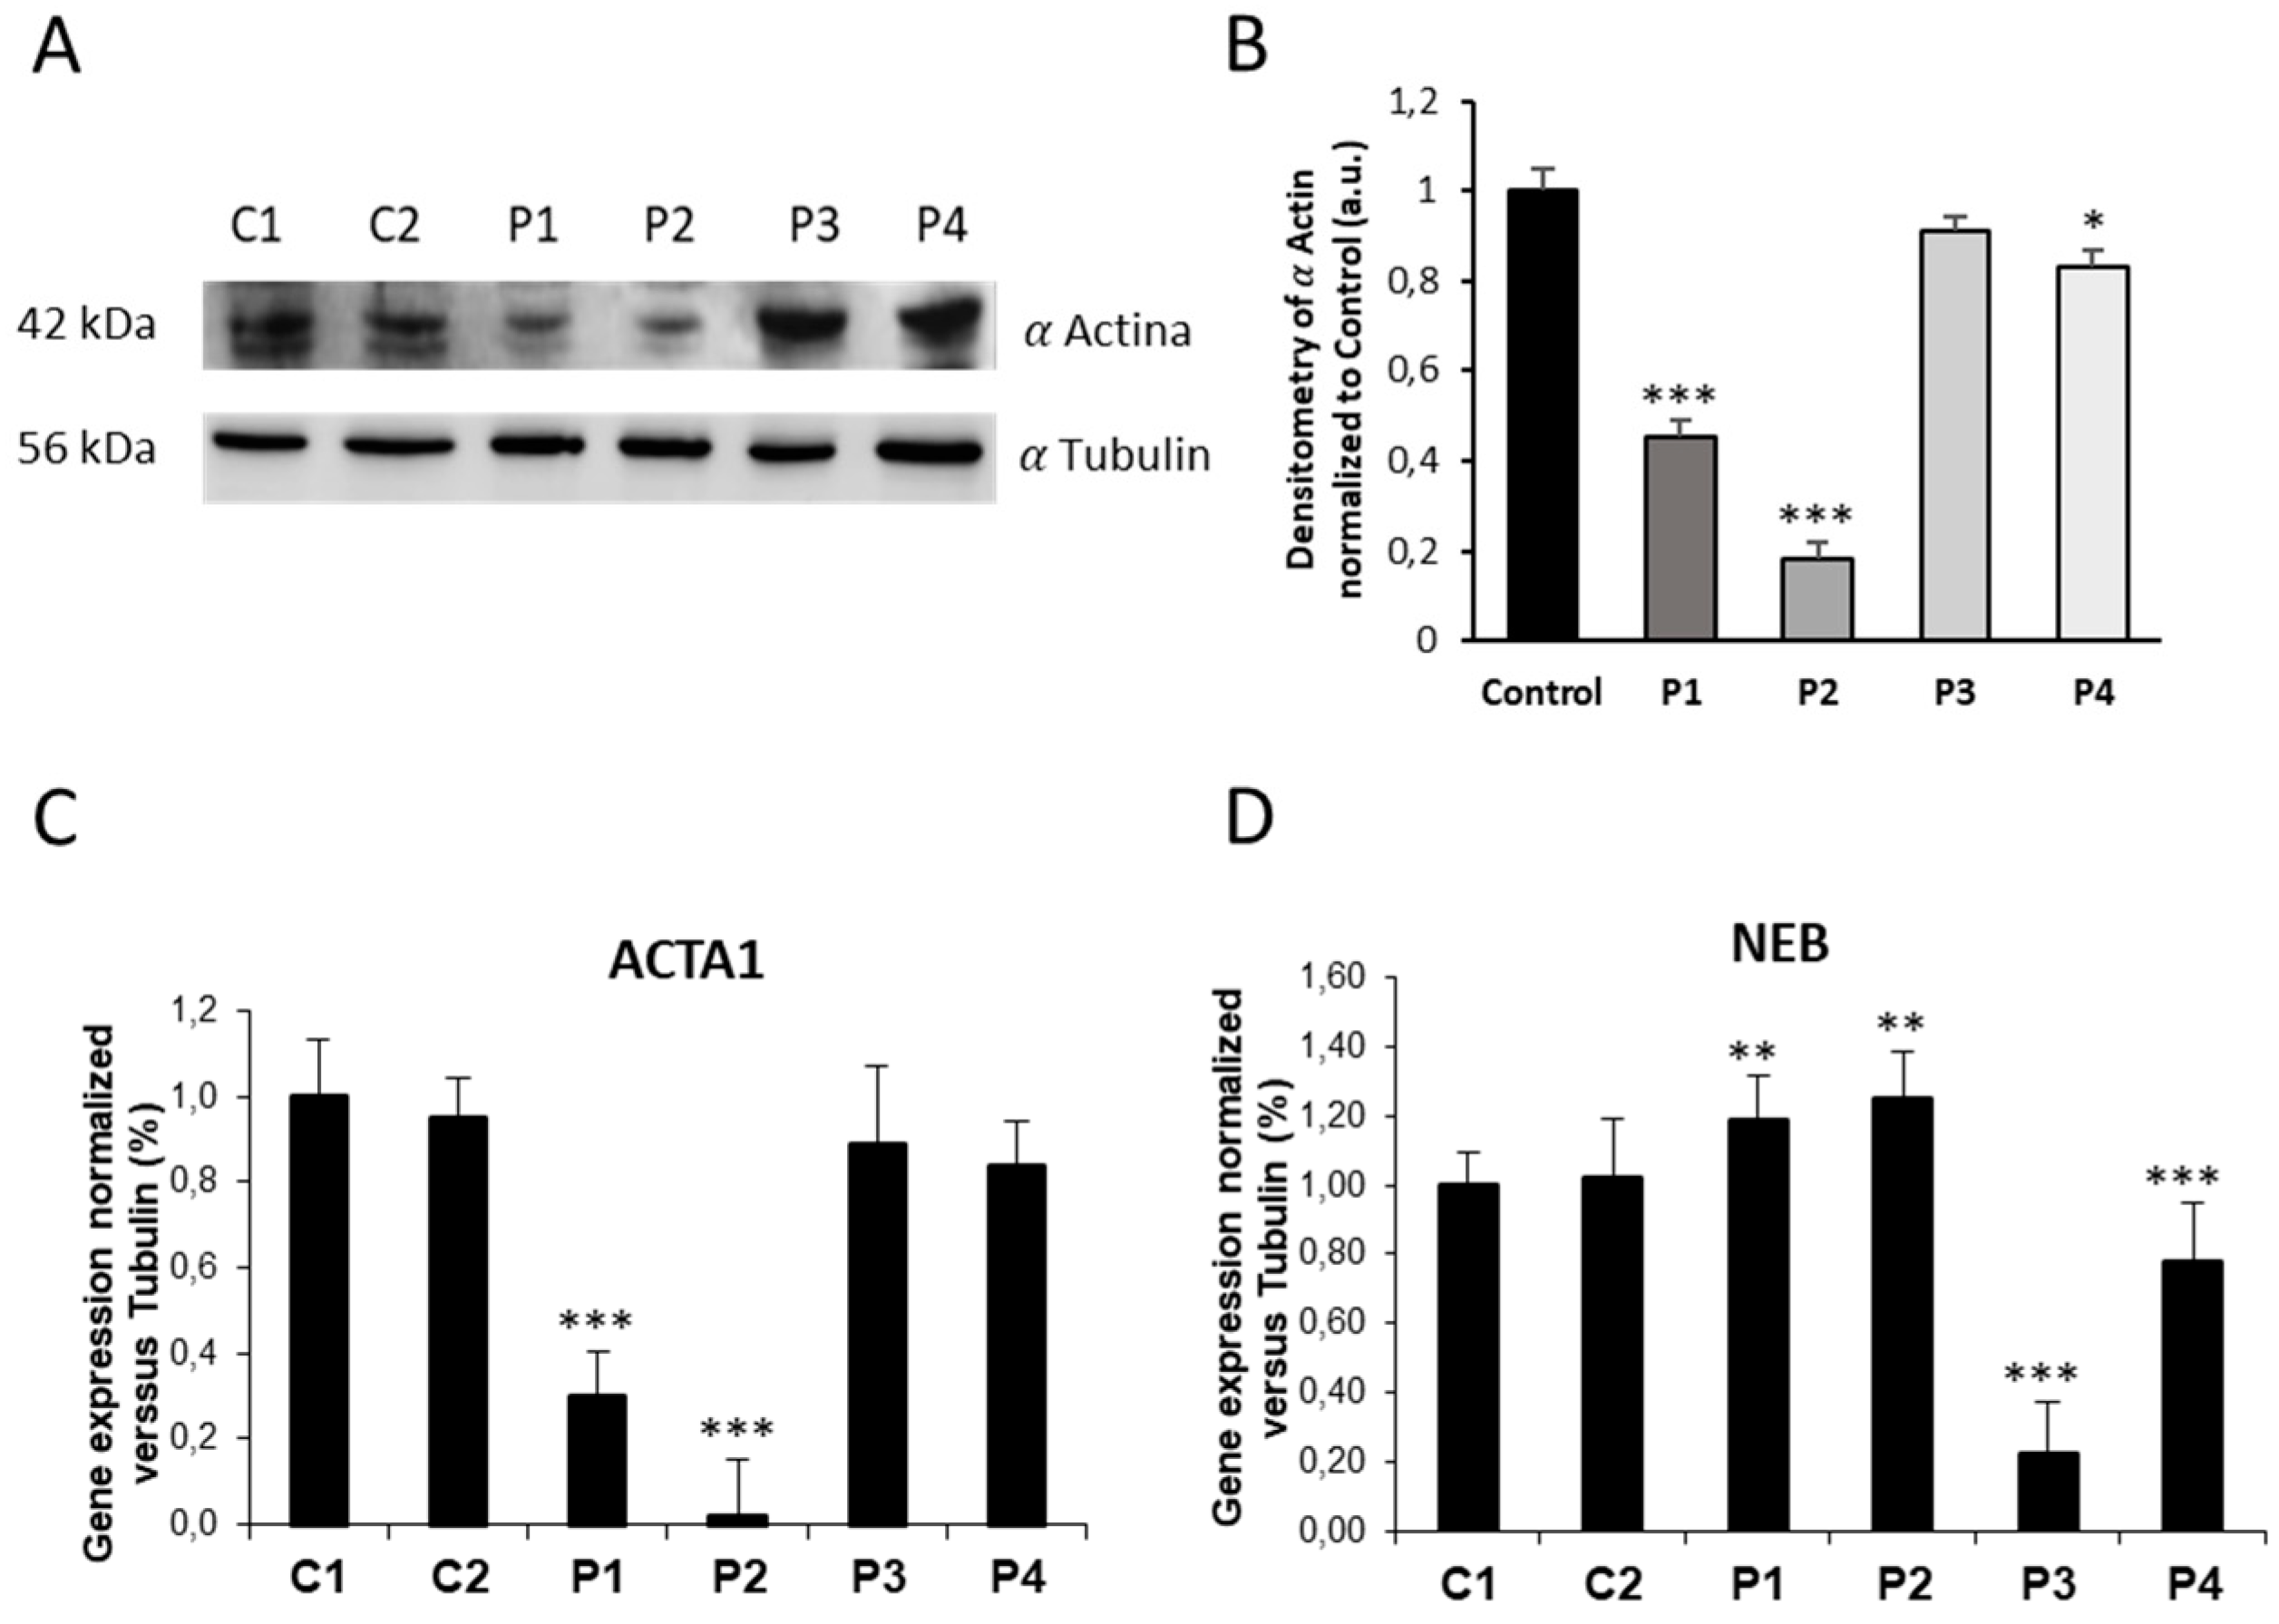
Figure 4.
Actin staining by Rhodamine-Phalloidin of Control and NM fibroblasts. (A) Control and NM fibroblasts, P1 and P2 (mutation in ACTA1) and P3 and P4 (mutation in NEB) were stained with Rhodamine-Phalloidin and visualized under widefield fluorescence microscope. Nuclei were revealed by DAPI staining. NM fibroblasts (P1, P2, P3 and P4) presented smaller and unstructured actin filaments compared to control fibroblasts. Images were taken using the 40x lens and processed by the ImageJ software. (B) Measurement of the length of actin filaments (𝜇m). The length of the actin filaments was measured in triplicate with the ImageJ software in 30 images. (C) Percentage of cells with correct actin polymerization. Three counts of 100 cells per sample were performed. *p<0.05, **p<0.01, ***p<0.001 between NM and controls cells. Scale bar = 20 µm.
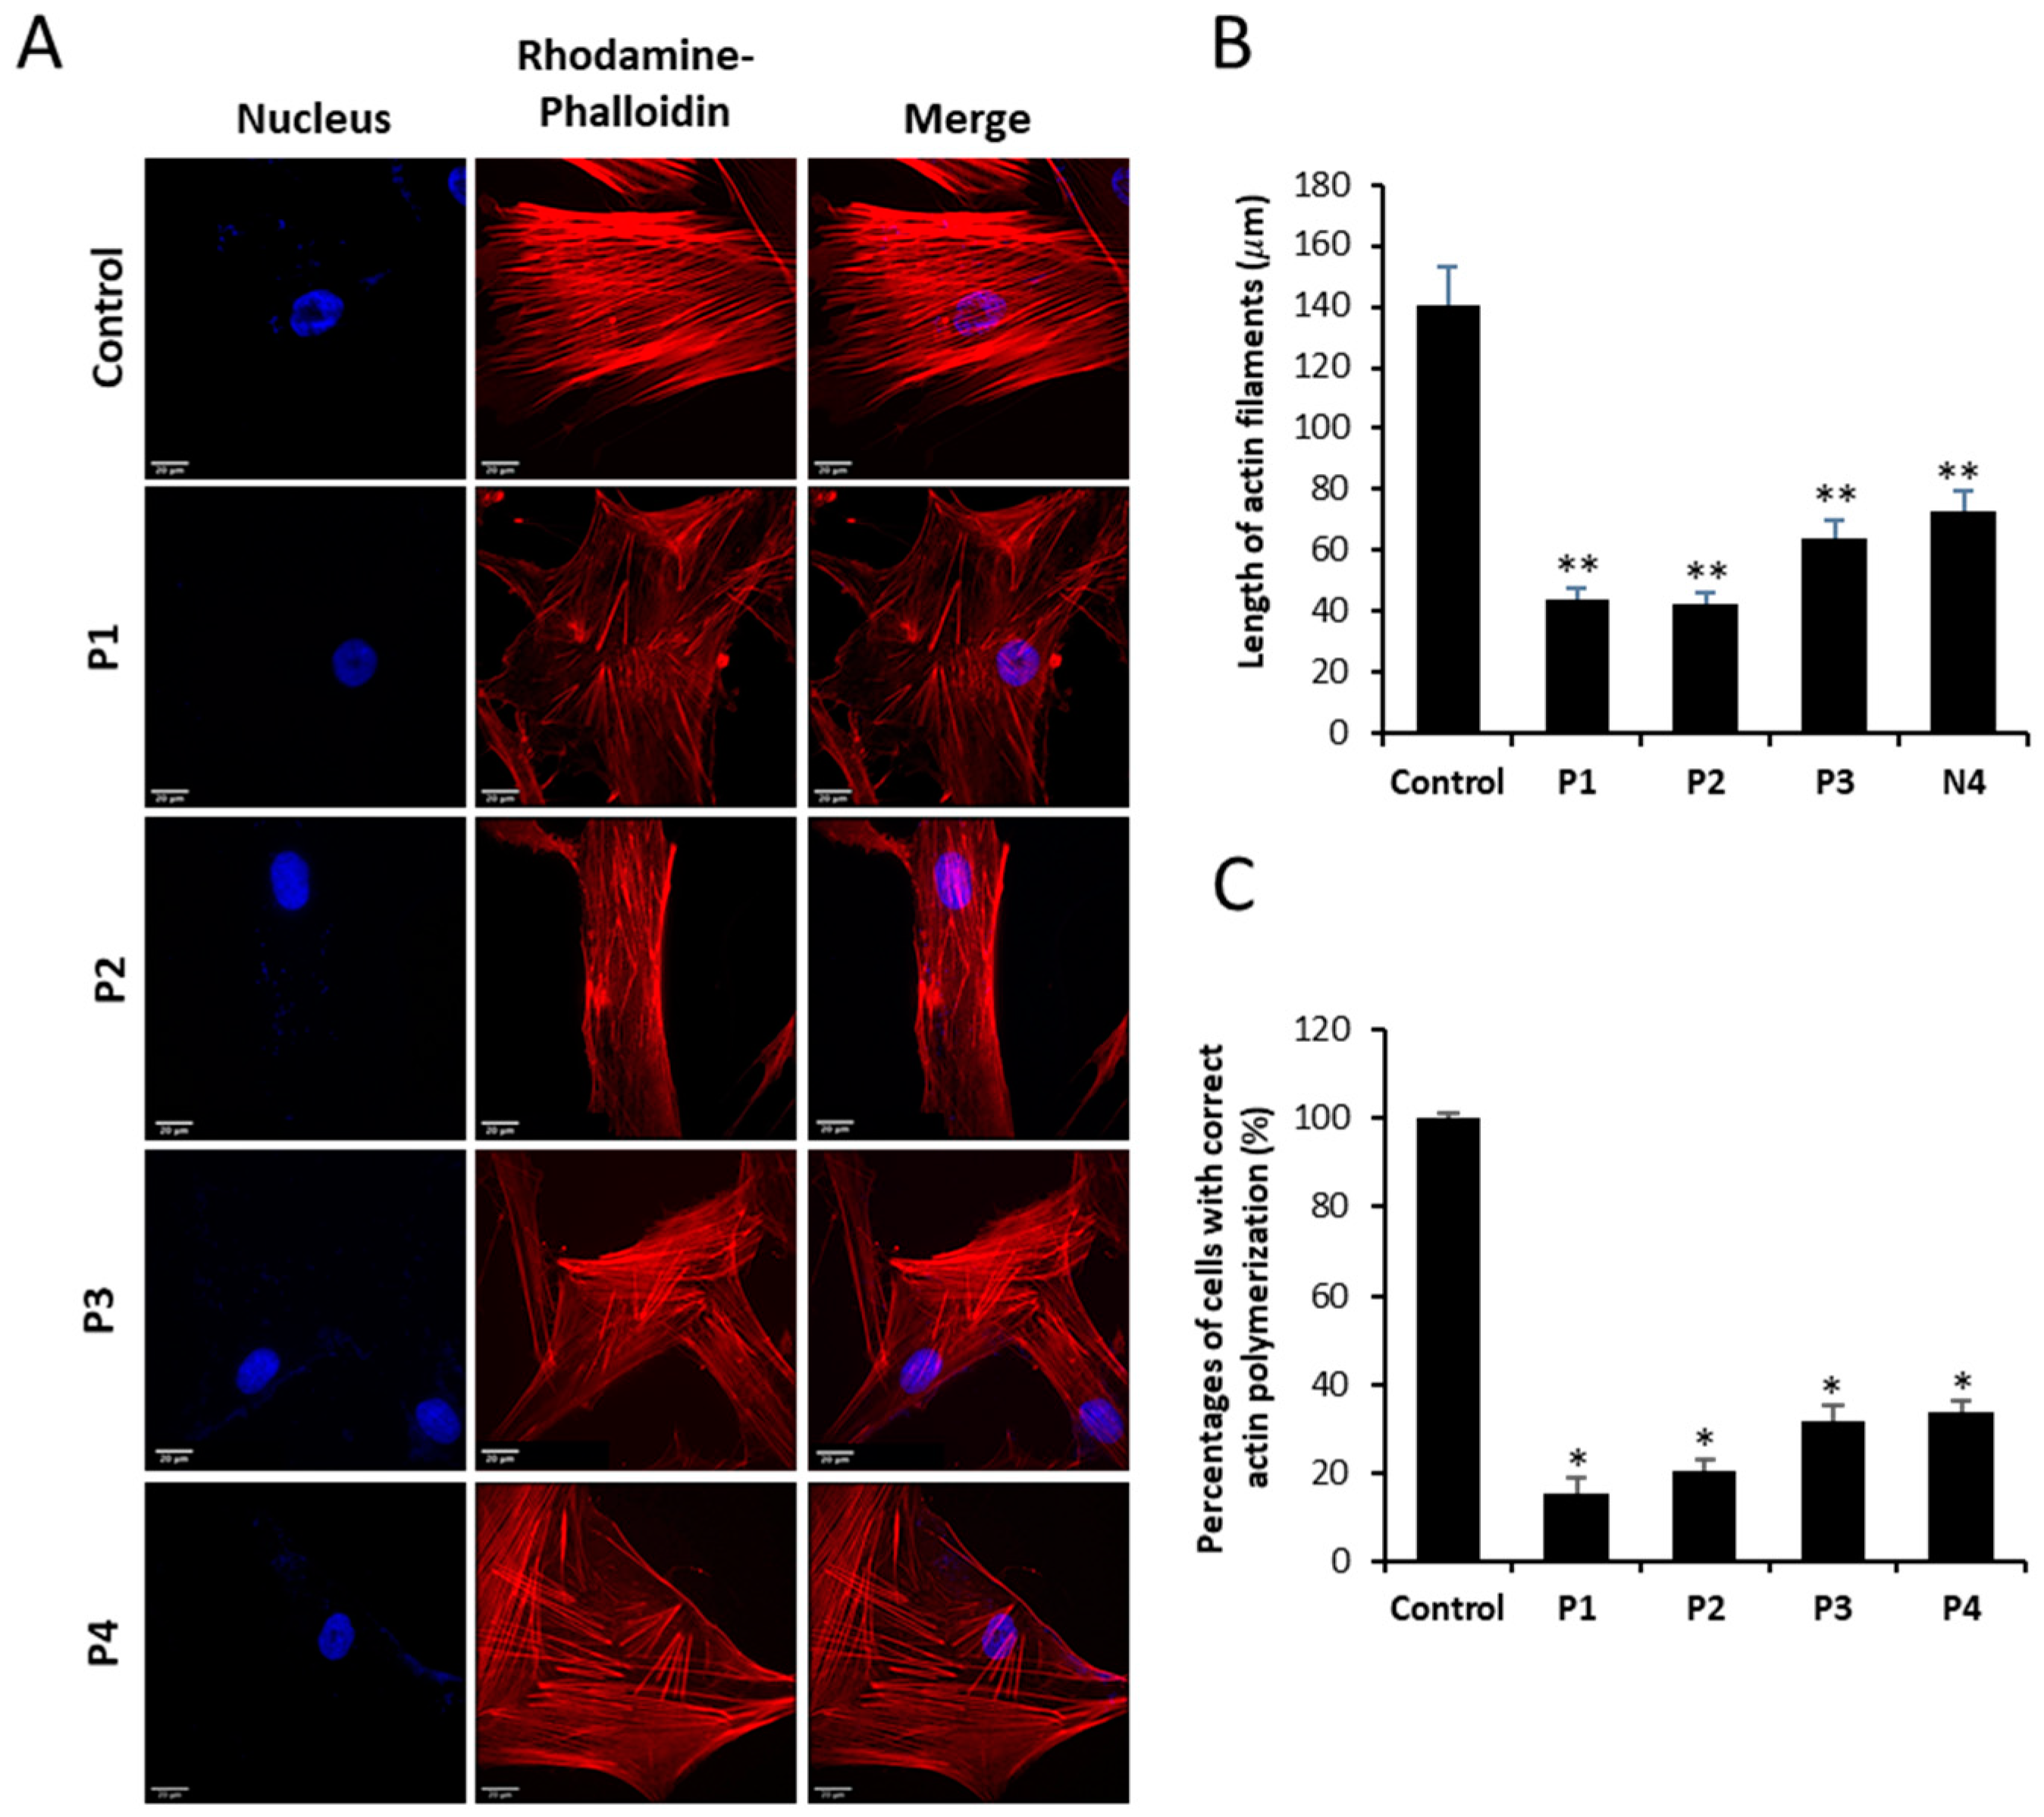
Figure 5.
Expression level of RhoA/ROCK pathway in NM cells. (A) Immunoblotting analysis of cellular extracts from controls (C1 and C2) and NM patient cell lines P1, P2, P3 and P4. Protein extracts (50 μg) were separated on a SDS polyacrylamide gel and immunostained with antibodies against Rho (A, B, C), RhoA, Active RhoA purified by Active Rho Detection Kit as described in Material and Methods, ROCK1, phospho-ROCK1 and α Tubulin, which was used as a loading control. (B) Densitometry of the Western blotting. For controls cells (C1 and C2), data are the mean±SD of the two control cell lines. Data represent the mean±SD of three separate experiments. *p<0.05, **p<0.01, ***p<0.001 between NM and controls cells. A.U., arbitrary units.
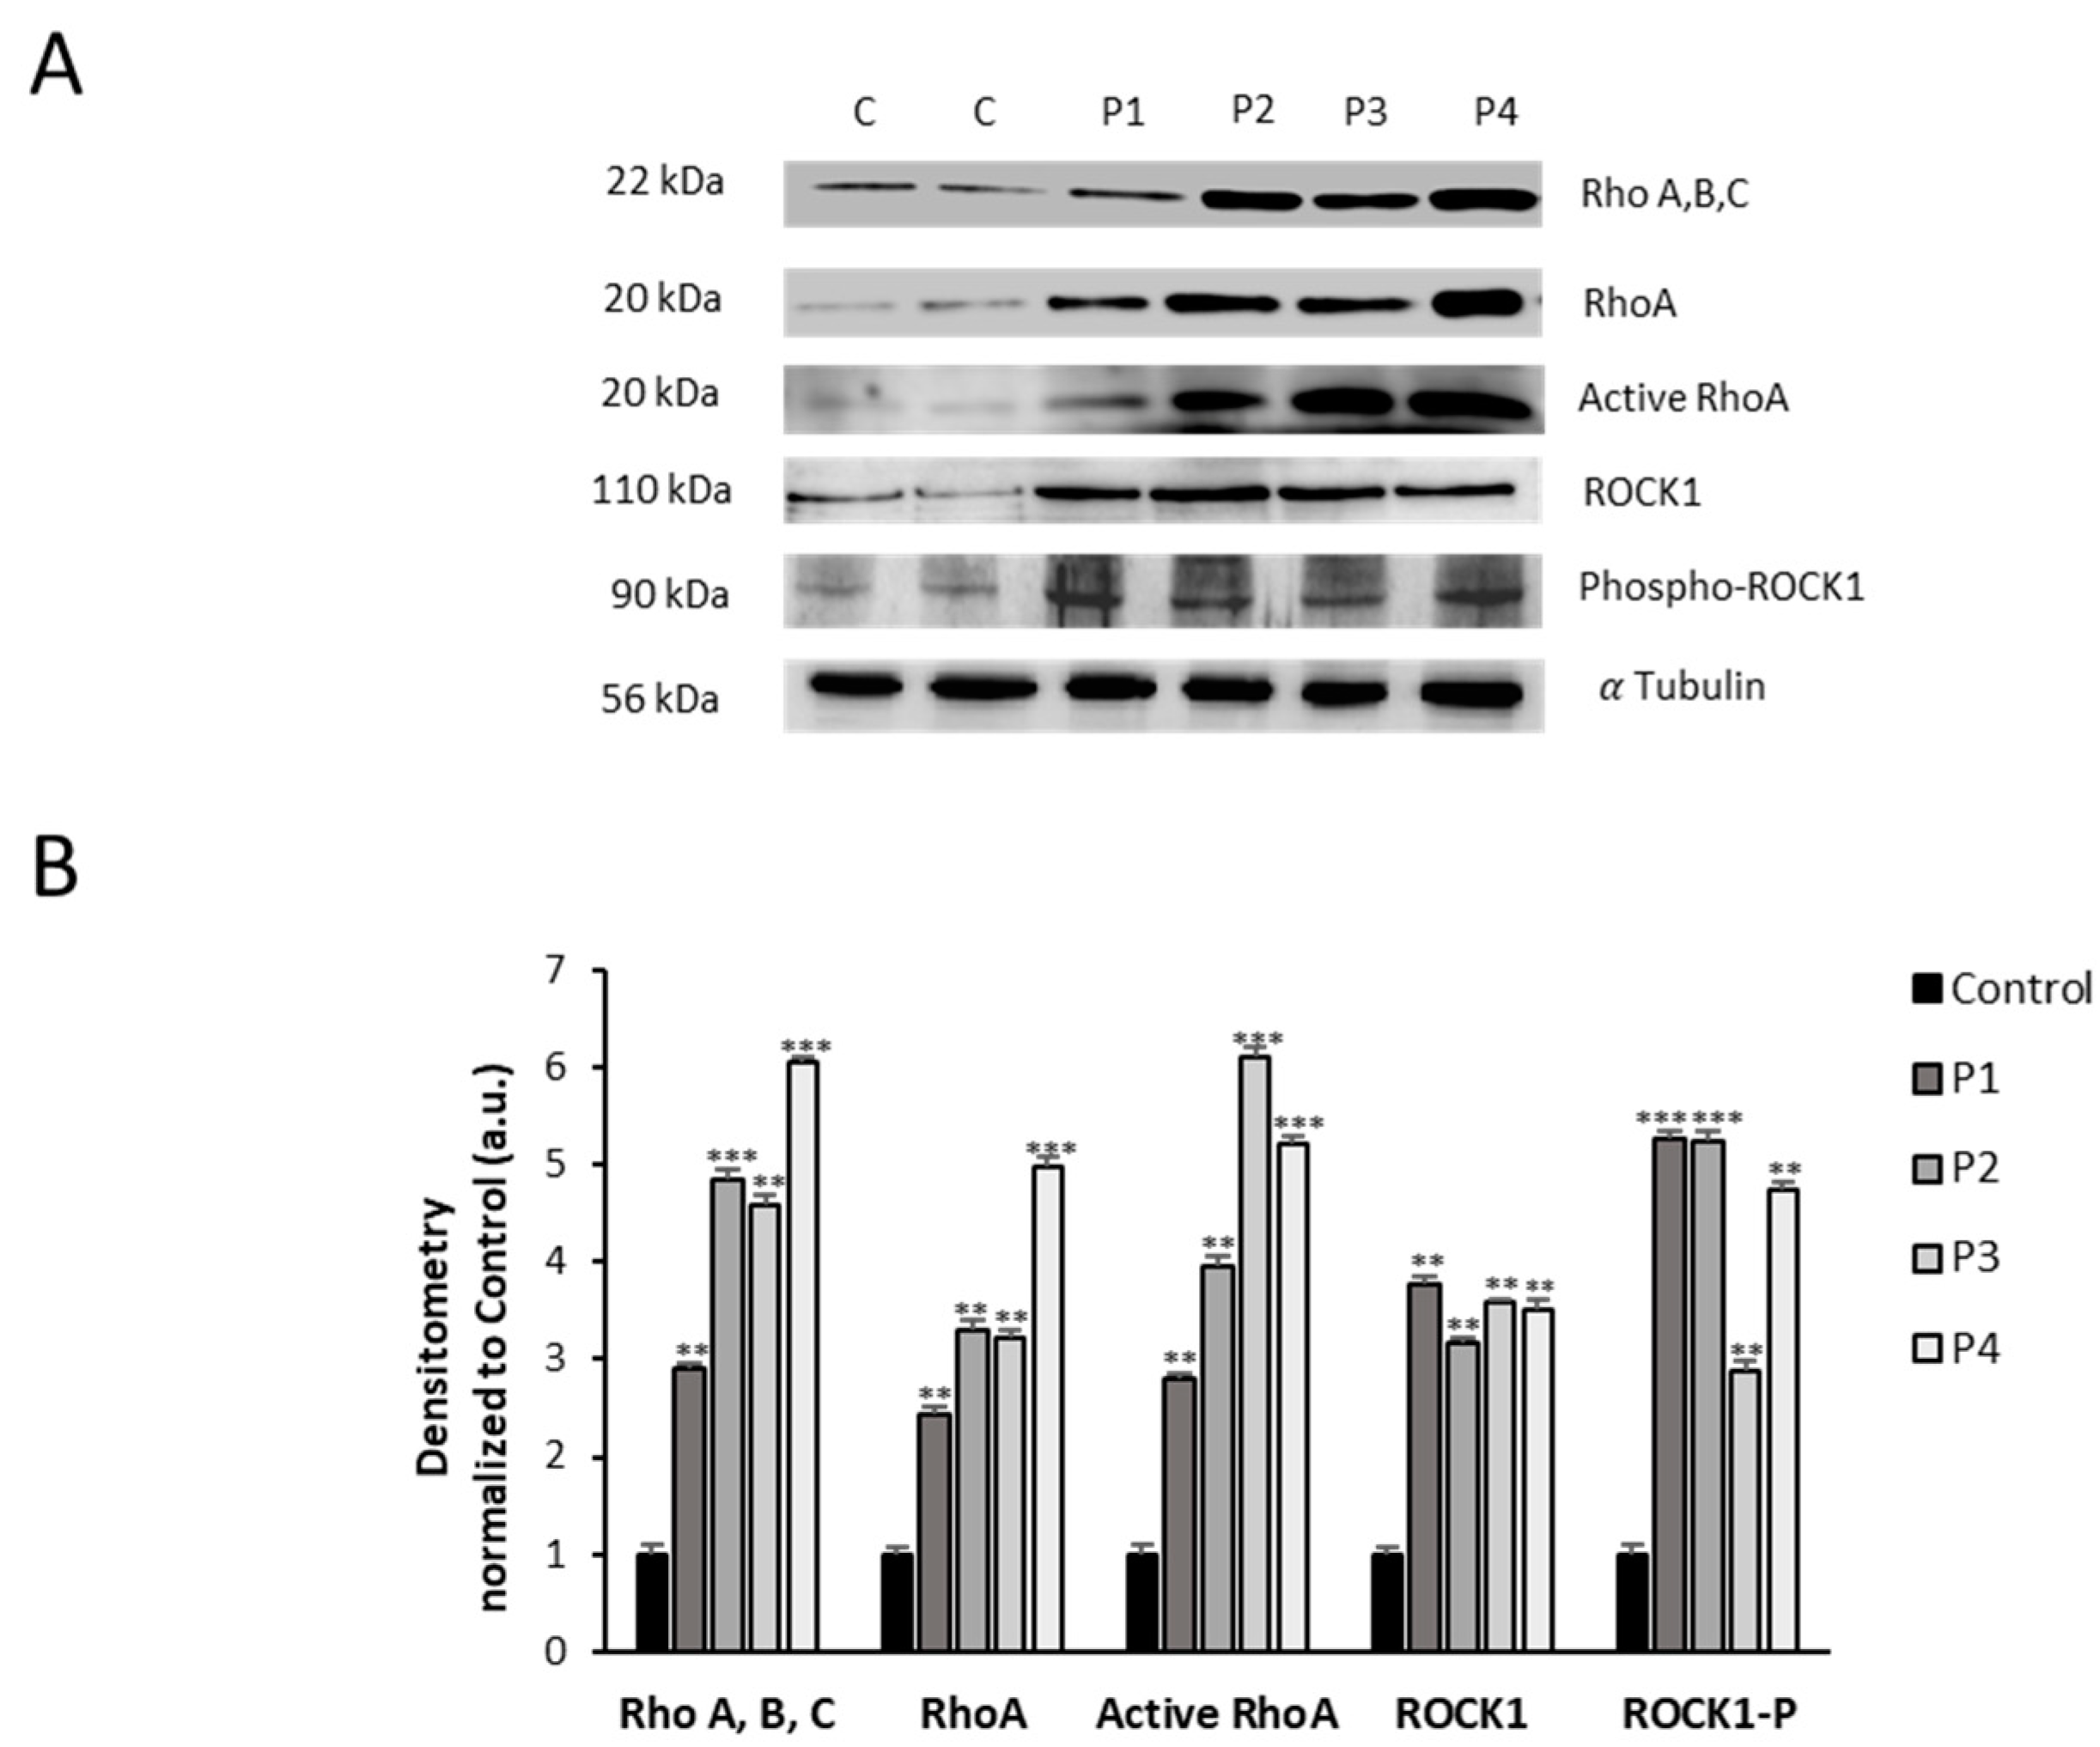
Figure 6.
Bioenergetics analysis of control and NM fibroblasts. Basal and maximal respiration, Mitochondrial ATP production and Spare Respiratory capacity were determined in controls (C1 and C2) and NM fibroblasts (P1, P2, P3 and P4) by using the Seahorse analyzer as described in Material and Methods. *p<0.05, **p<0.01, ***p<0.001 between NM and controls cells.
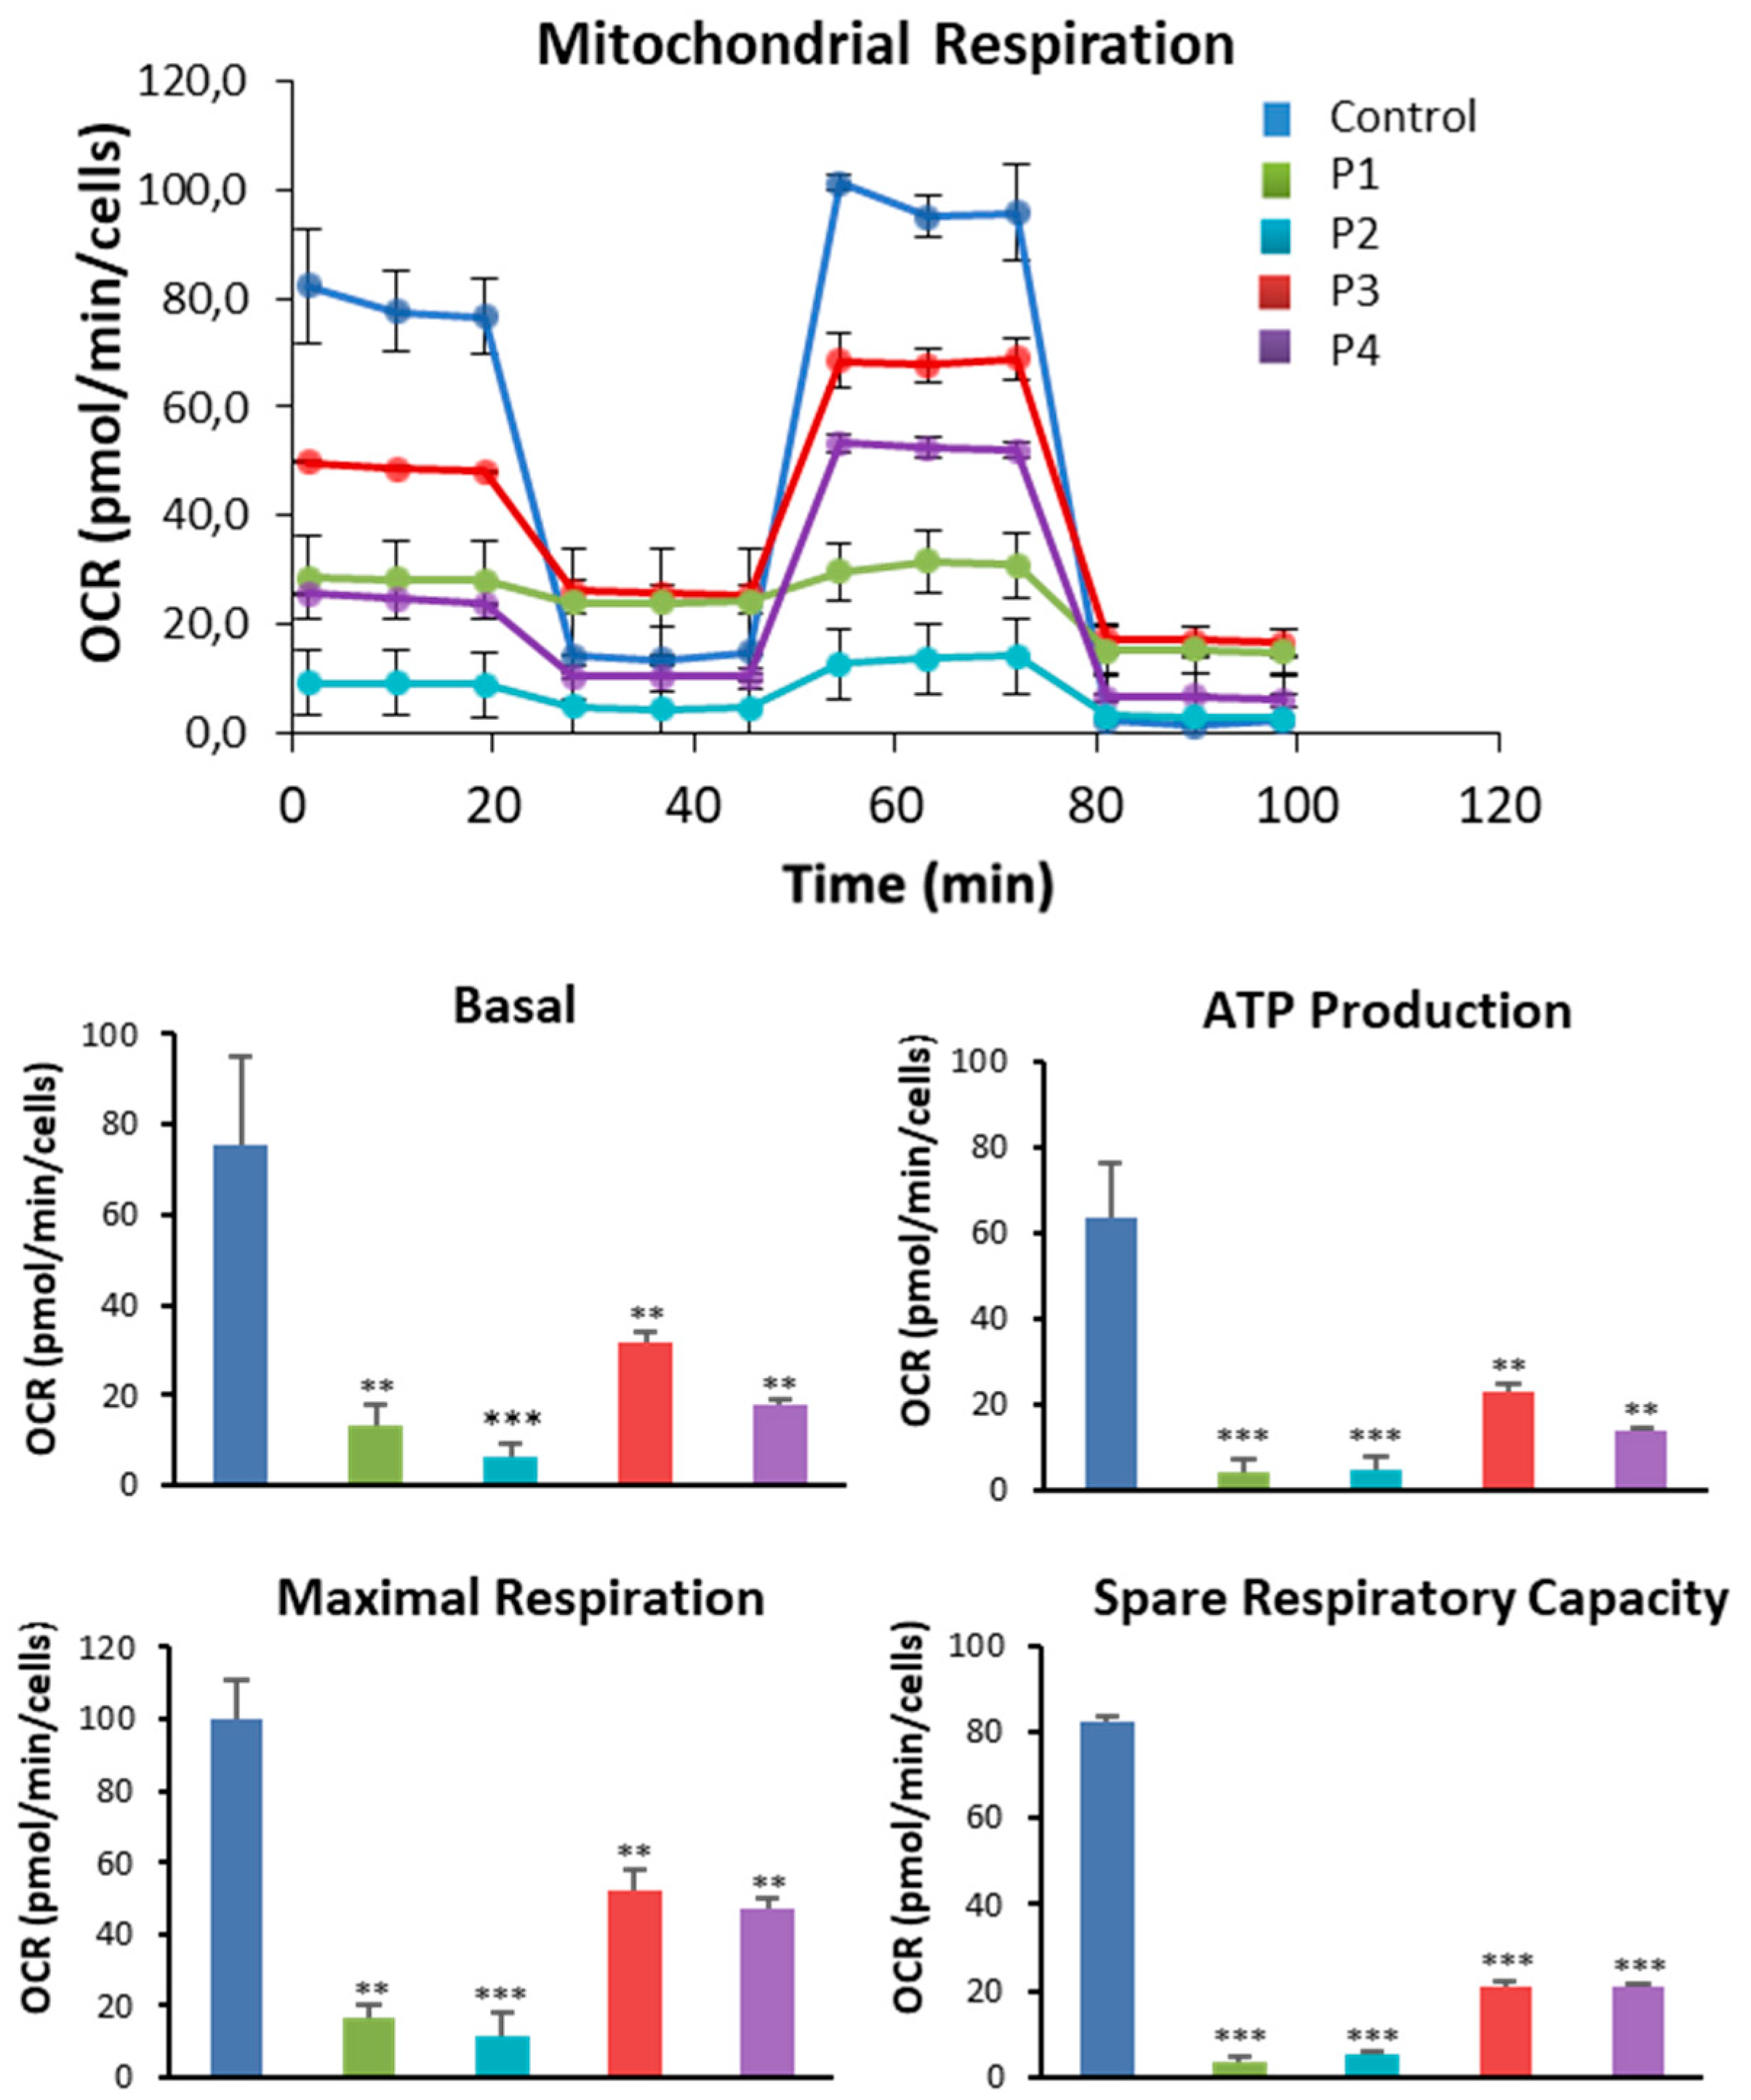
Figure 7.
Mitochondrial polarization and network in control and NM cells. (A) Representative images of control (C1) and NM fibroblasts (P1, P2, P3 and P4) stained with MitoTrackerTM Red CMXRos and visualized under widefield fluorescence microscope. Nuclei were revealed by DAPI staining. As a positive control of membrane depolarization, we used 100 µM CCCP for 4 h in control cells. Images were taken using the 100x lens and processed by the ImageJ software. Scale bar = 20 µm. (B) Fluorescence quantification of MitoTracker signal. Data represent the mean ± SD of three separate experiments (at least 100 cells for each condition and experiment were analysed). (C) Quantification of tubular and rounded percentage of mitochondria in control and NM fibroblasts. Data represent the mean ± SD of three separate experiments (at least 100 cells for each condition and experiment were analysed). (D) Immunoblotting analysis of cellular extracts from controls (C1 and C2) and NM patient cell lines P1, P2, P3 and P4. Protein extracts (50 μg) were separated on a SDS polyacrylamide gel and immunostained with antibodies against DRP1, OPA1 and α Tubulin, which was used as a loading control. (E) Densitometry of the Western blotting. For controls cells (C1 and C2), data are the mean±SD of the two control cell lines. Data represent the mean ± SD of three separate experiments. *p<0.05, **p<0.01, ***p<0.001 between NM cells and controls; ap<0.05, aap<0.01, aaap<0.001 between the presence and the absence of CCCP. A. U.: arbitrary units.
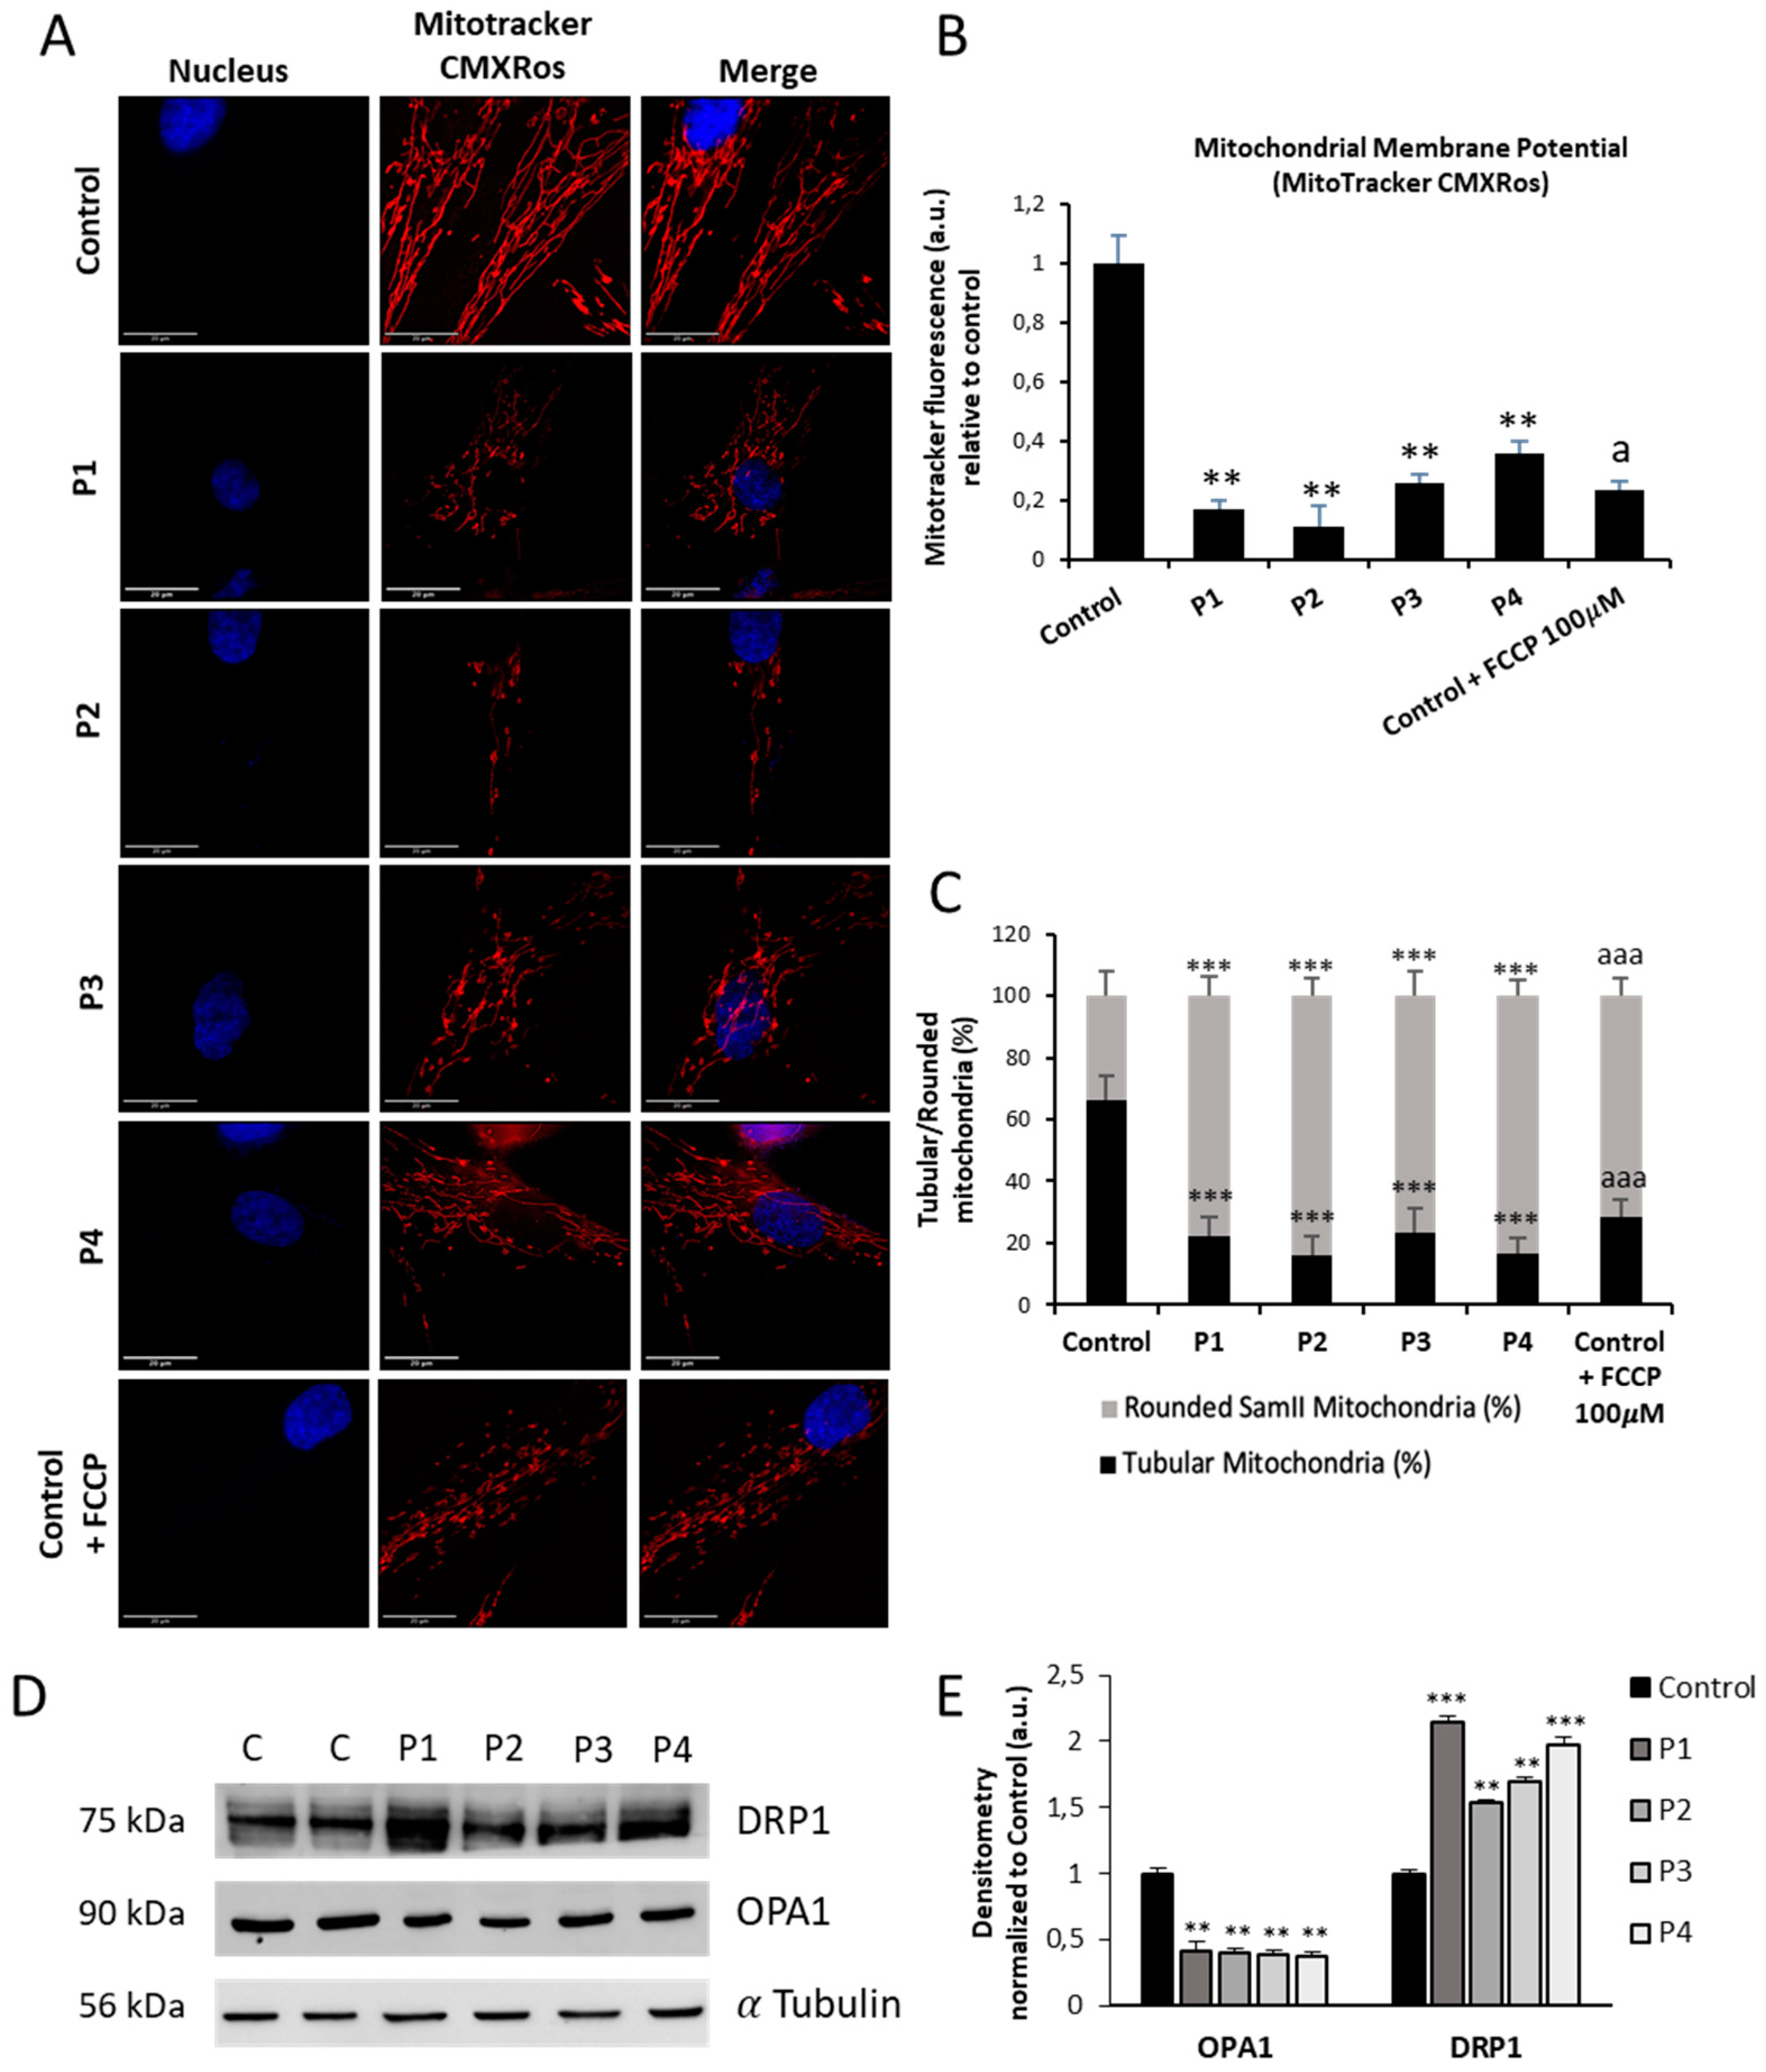
Figure 8.
Mitochondrial protein expression levels in control and NM cells. (A) Immunoblotting analysis of cellular extracts from controls (C1 and C2) and NM patient cell lines P1, P2, P3 and P4. Protein extracts (50 μg) were separated on a SDS polyacrylamide gel and immunostained with antibodies against NDUFA9 (Complex I), NDUFS4 (Complex I), mtND1(Complex I), SDHB (Complex II), UQCRC2 (Complex III), mtCO2 (Complex IV), COX4 (Complex IV), ATP5A (Complex V) and VDAC1. α Tubulin was used as a loading control. (B) Densitometry of the Western blotting. For controls cells (C1 and C2), data are the mean±SD of the two control cell lines. Data represent the mean±SD of three separate experiments. *p<0.05, **p<0.01, ***p<0.001 between NM and controls cells. A.U., arbitrary units.
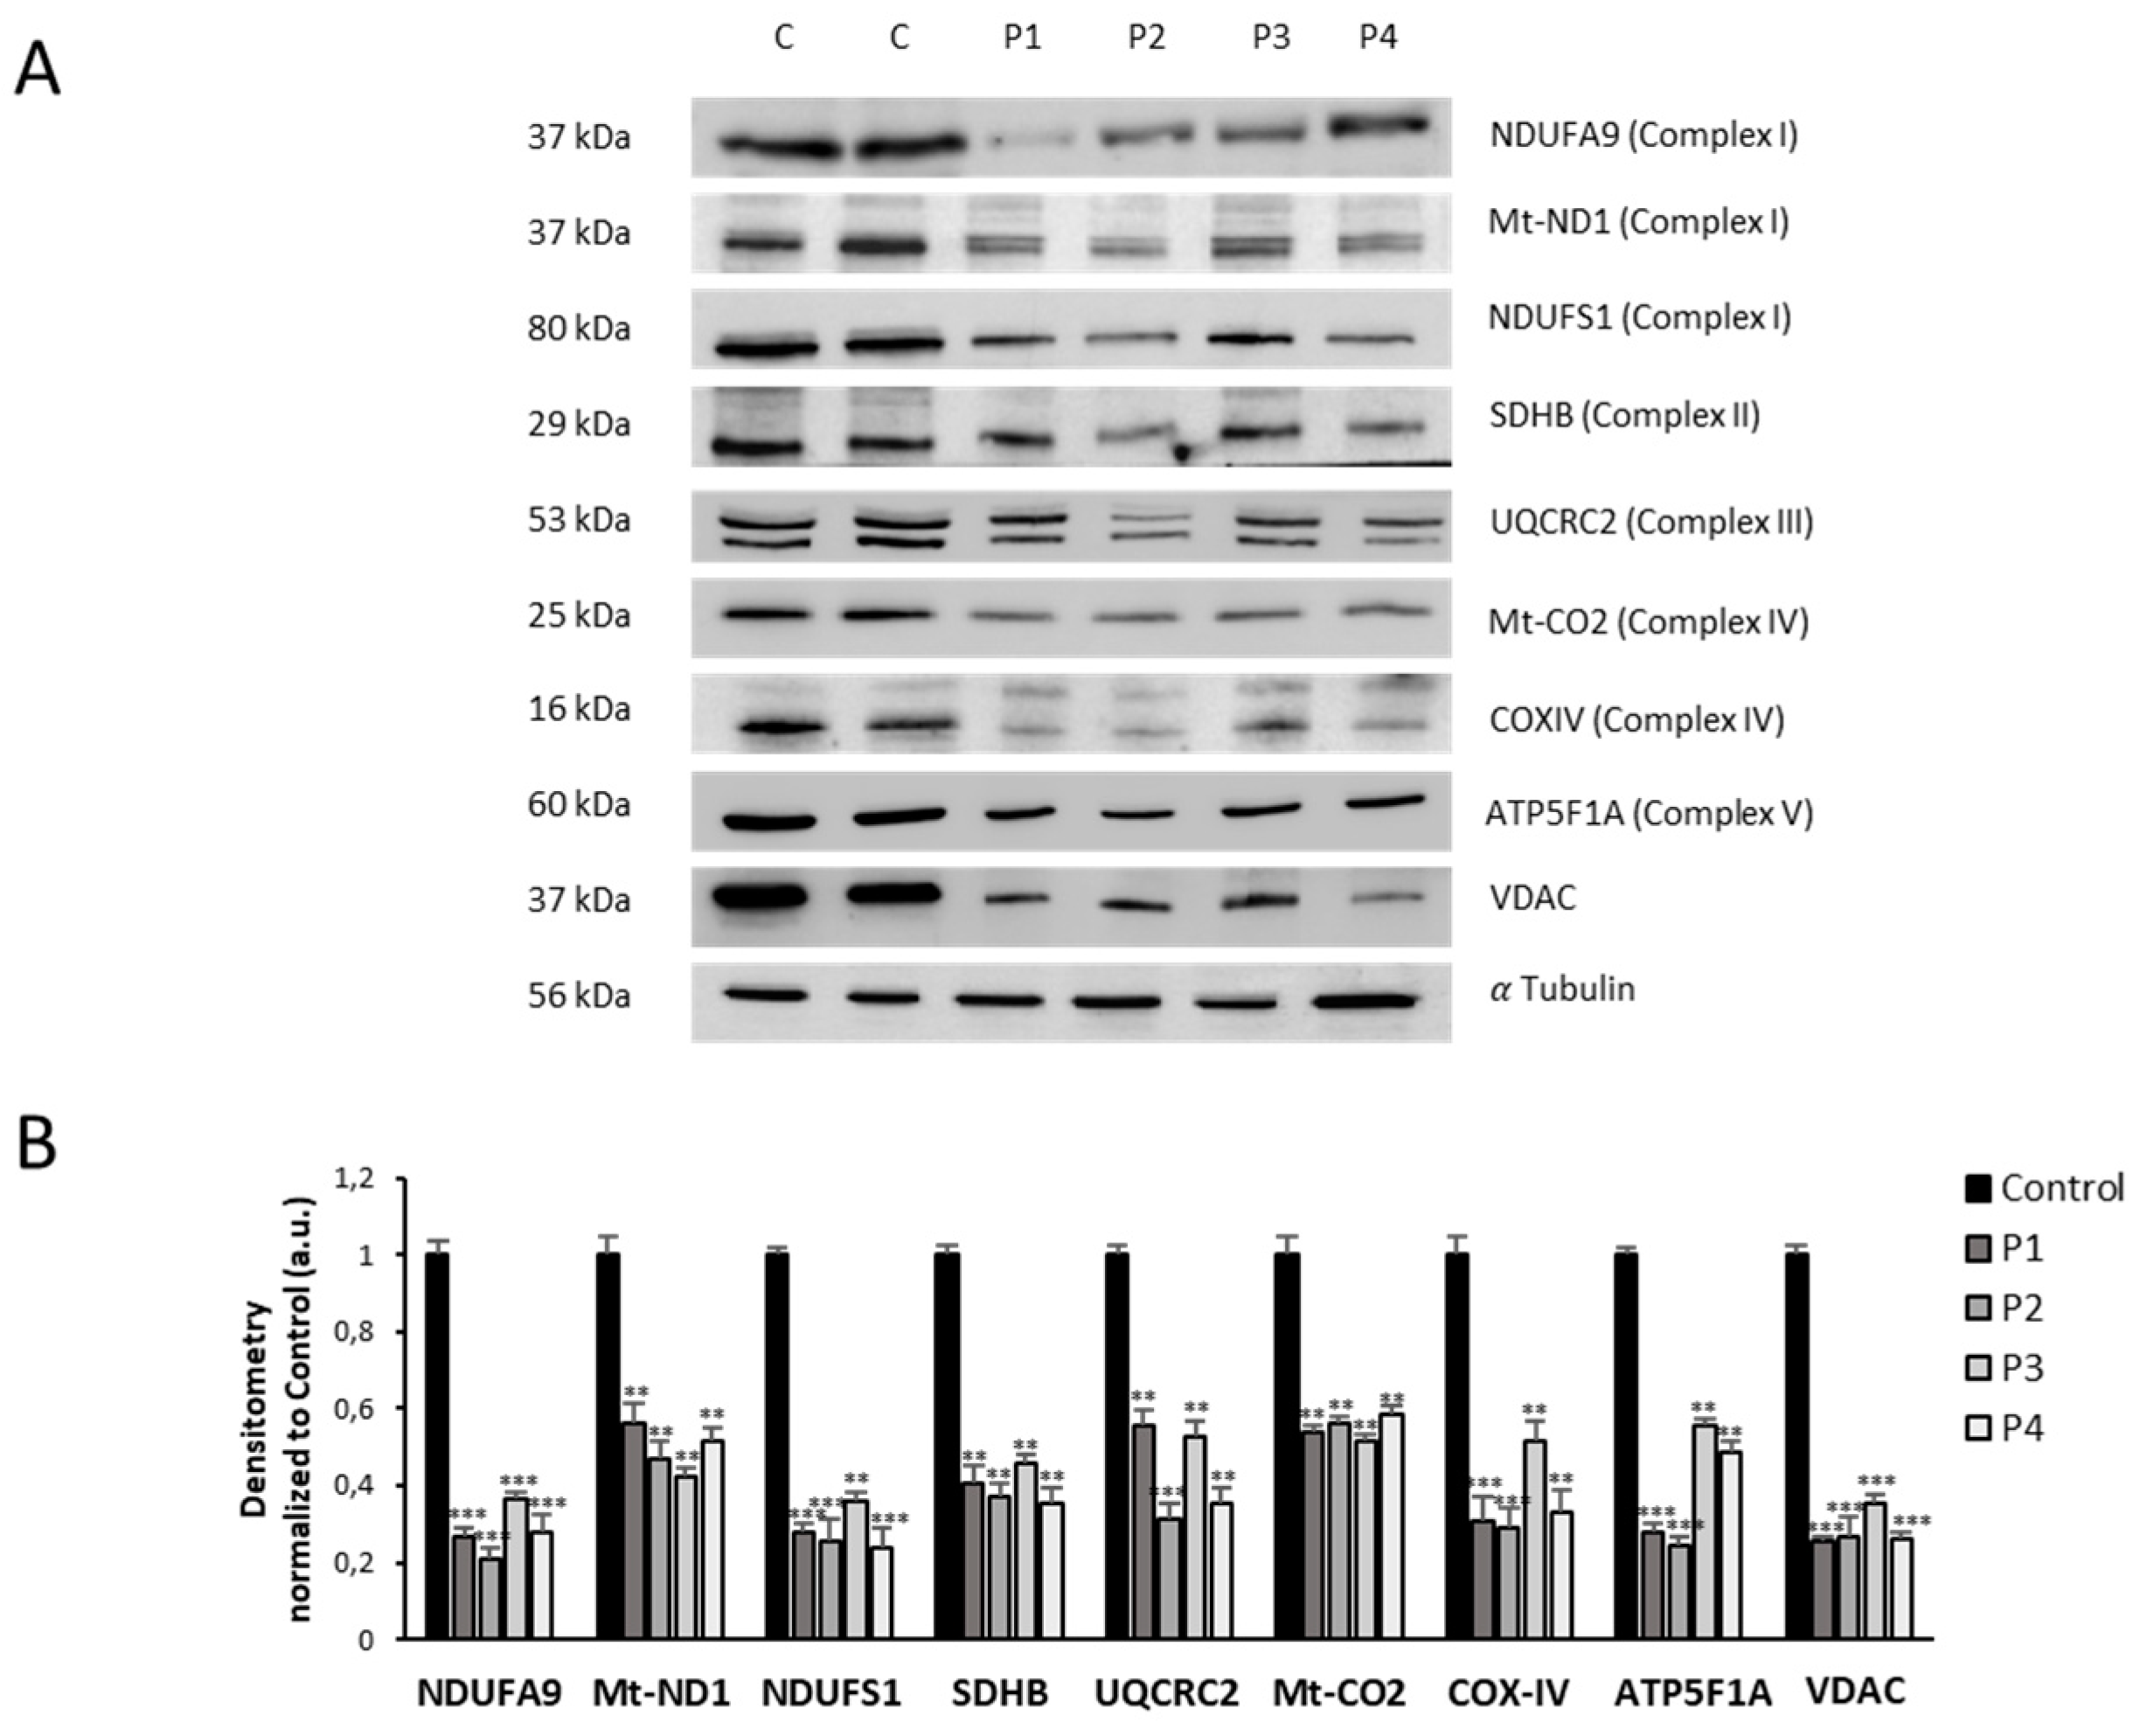
Figure 9.
Expression levels of ROS and antioxidant enzymes in NM cells. (A) Representative images of control (C1) and NM fibroblasts (P1, P2, P3 and P4) stained with MitoSOX™ Red and MitoTrackerTM DeepRed. Nuclei were revealed by DAPI staining. Images were taken under widefield fluorescence microscope using the 40x lens and processed by the ImageJ software. Scale bar = 20 µm. (B) Fluorescence quantification of MitoSOX™ Red signal. Data represent the mean ± SD of three separate experiments (at least 100 cells for each condition and experiment were analysed). (C) Immunoblotting analysis of cellular extracts from Controls (C1 and C2) and NM patient cell lines P1, P2, P3 and P4. Protein extracts (50 μg) were separated on a SDS polyacrylamide gel and immunostained with antibodies against SOD1, SOD2 and GPX4. α Tubulin was used as a loading control. (D) Densitometry of the Western blotting. For control cells (C1 and C2), data are the mean±SD of the two control cell lines. Data represent the mean±SD of three separate experiments. *p<0.05, **p<0.01, ***p<0.001 between NM and controls cells. A.U., arbitrary units.
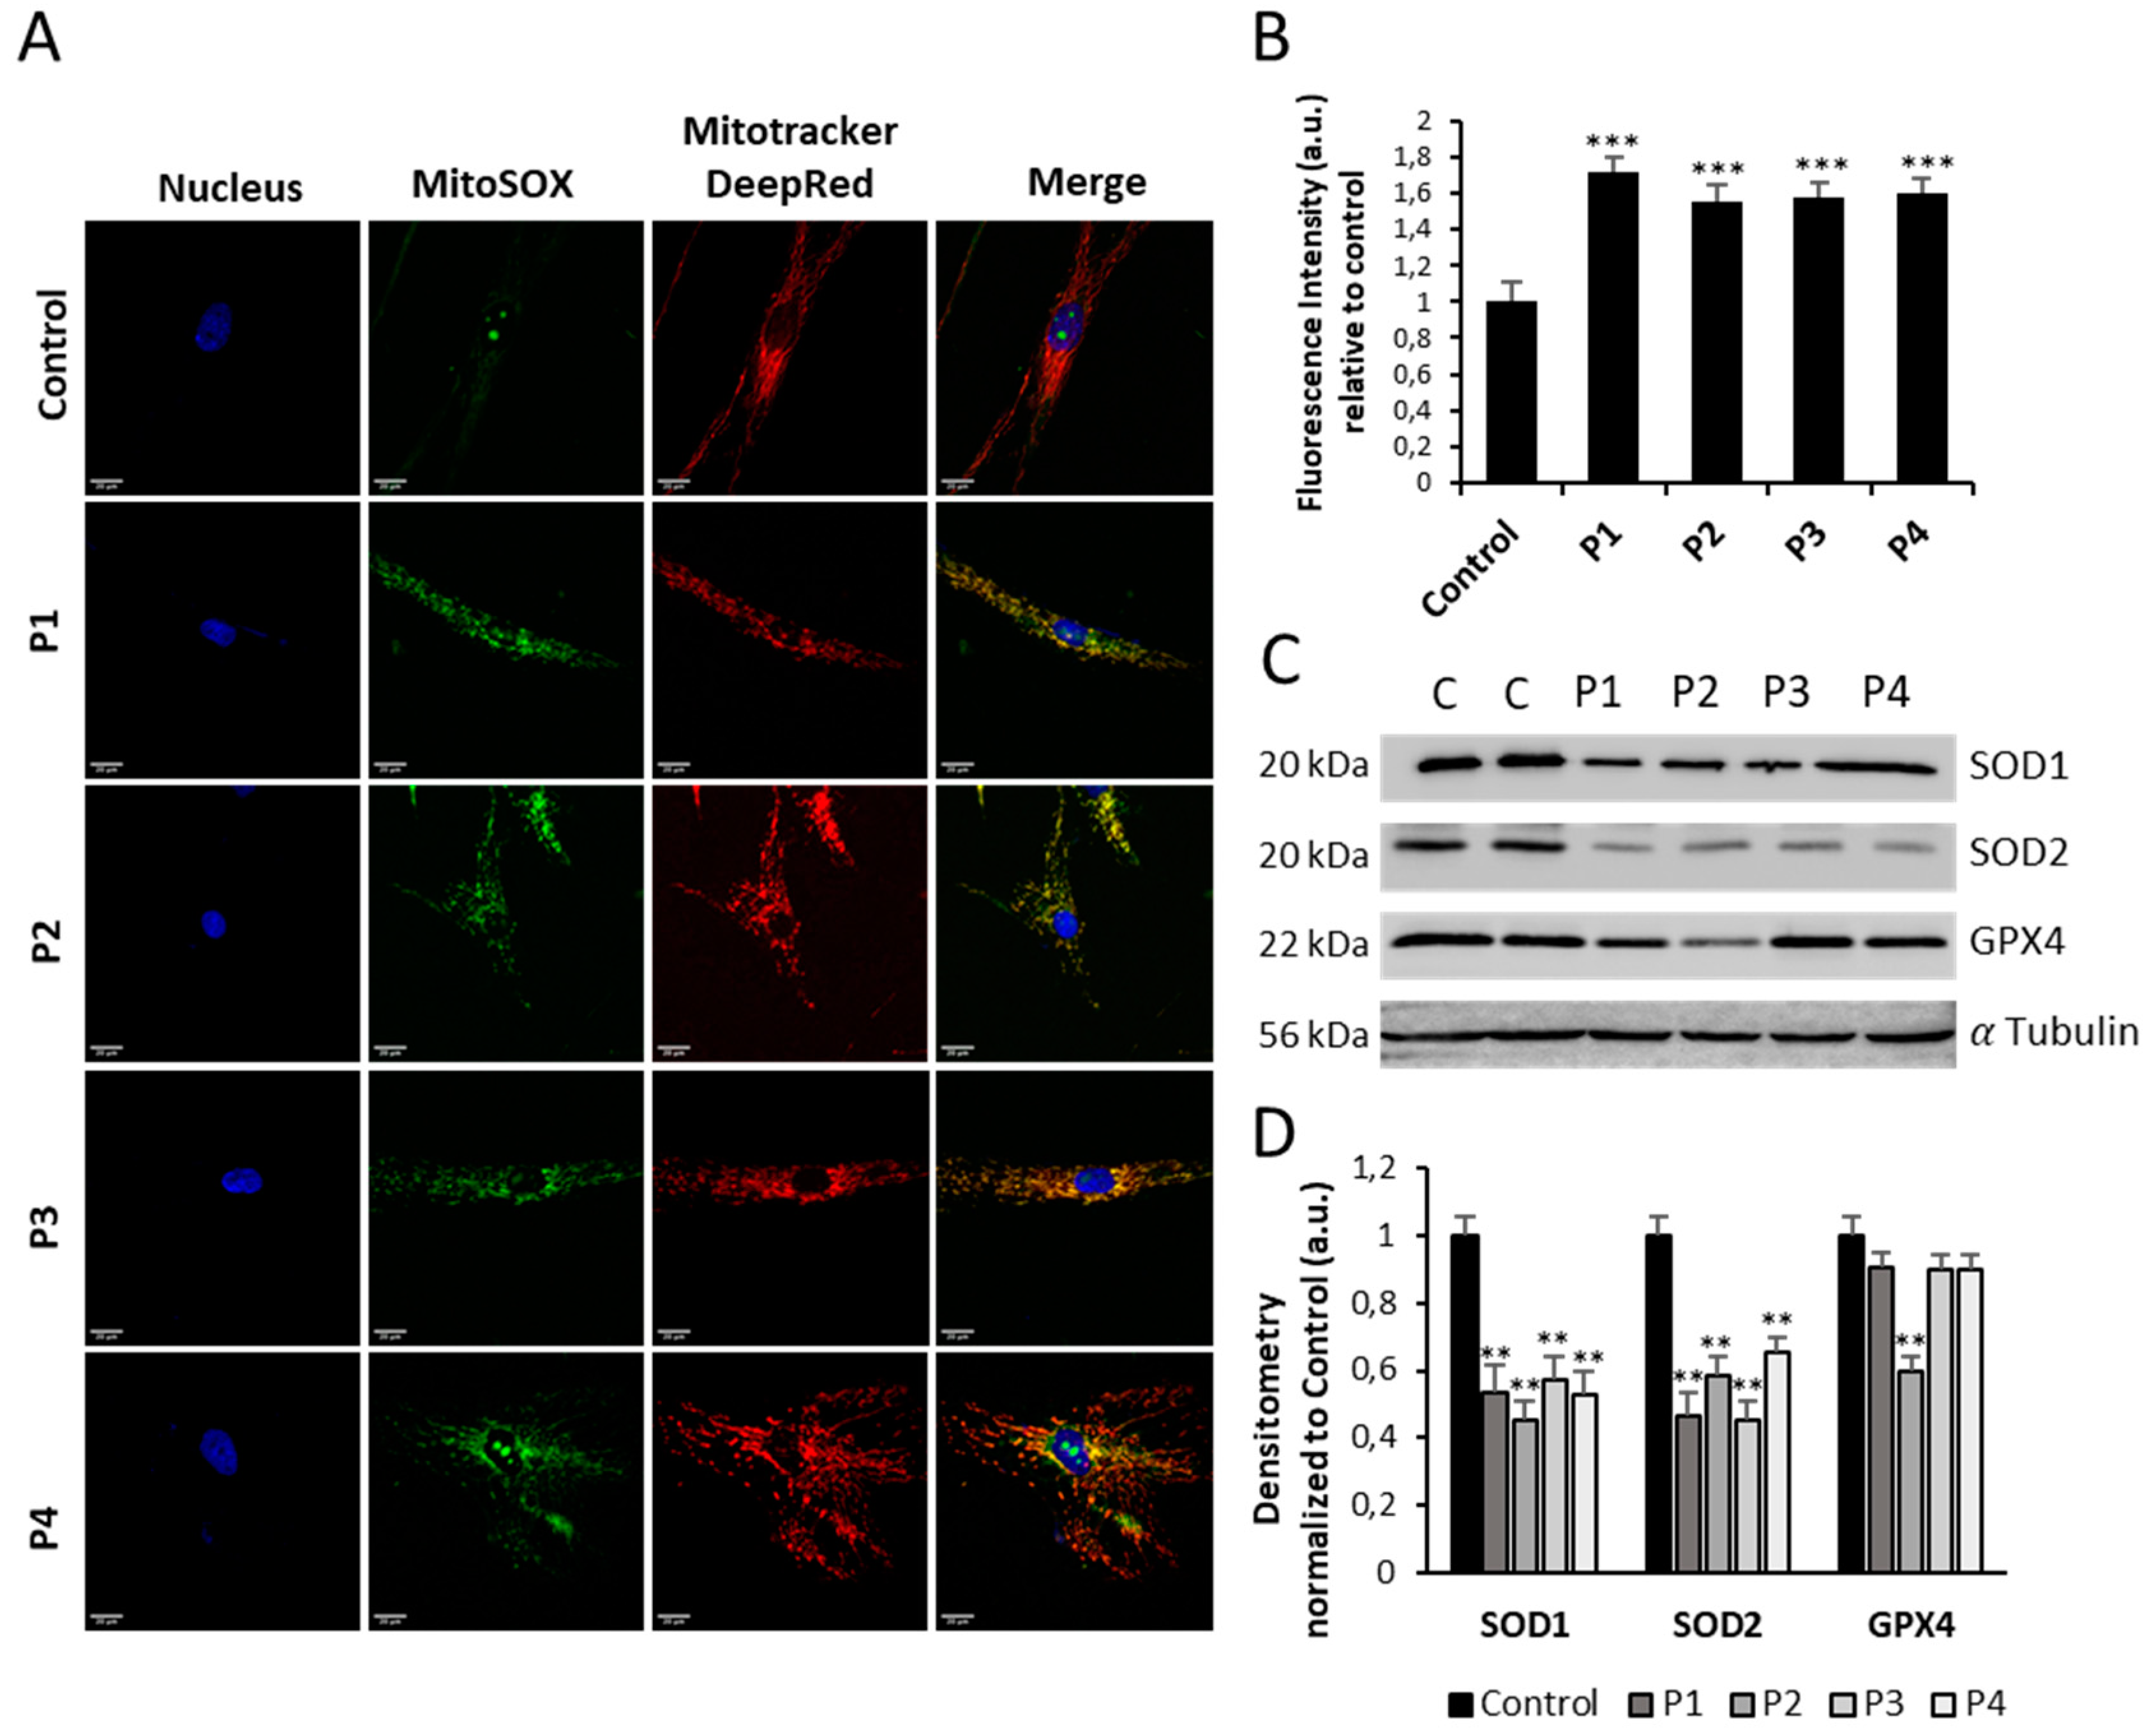
Figure 10.
Effect of LA and LCAR on actin polymerization in control and NM cells. Control and NM fibroblasts were treated with 5 mM LA and 10 mM LCAR individually or in combination (Cocktail) for 7 days. (A) Representative images of treated and untreated (-) Control and NM fibroblasts, P1 and P2 (mutation in ACTA1) and P3 and P4 (mutation in NEB) stained with Rhodamine-Phalloidin. Images were taken using the 40x lens and processed by the ImageJ software. Scale bar = 20 µm. (B) Measurements of the length of actin filaments (𝜇m). The length of the actin filaments was measured in triplicate with the ImageJ software in 30 images. (C) Percentages of cells with correct actin polymerization. Three counts of 100 cells per sample were performed. **p<0.01 between NM and controls cells; ap<0.05, aap<0.01 between untreated (-) and treated NM cells.
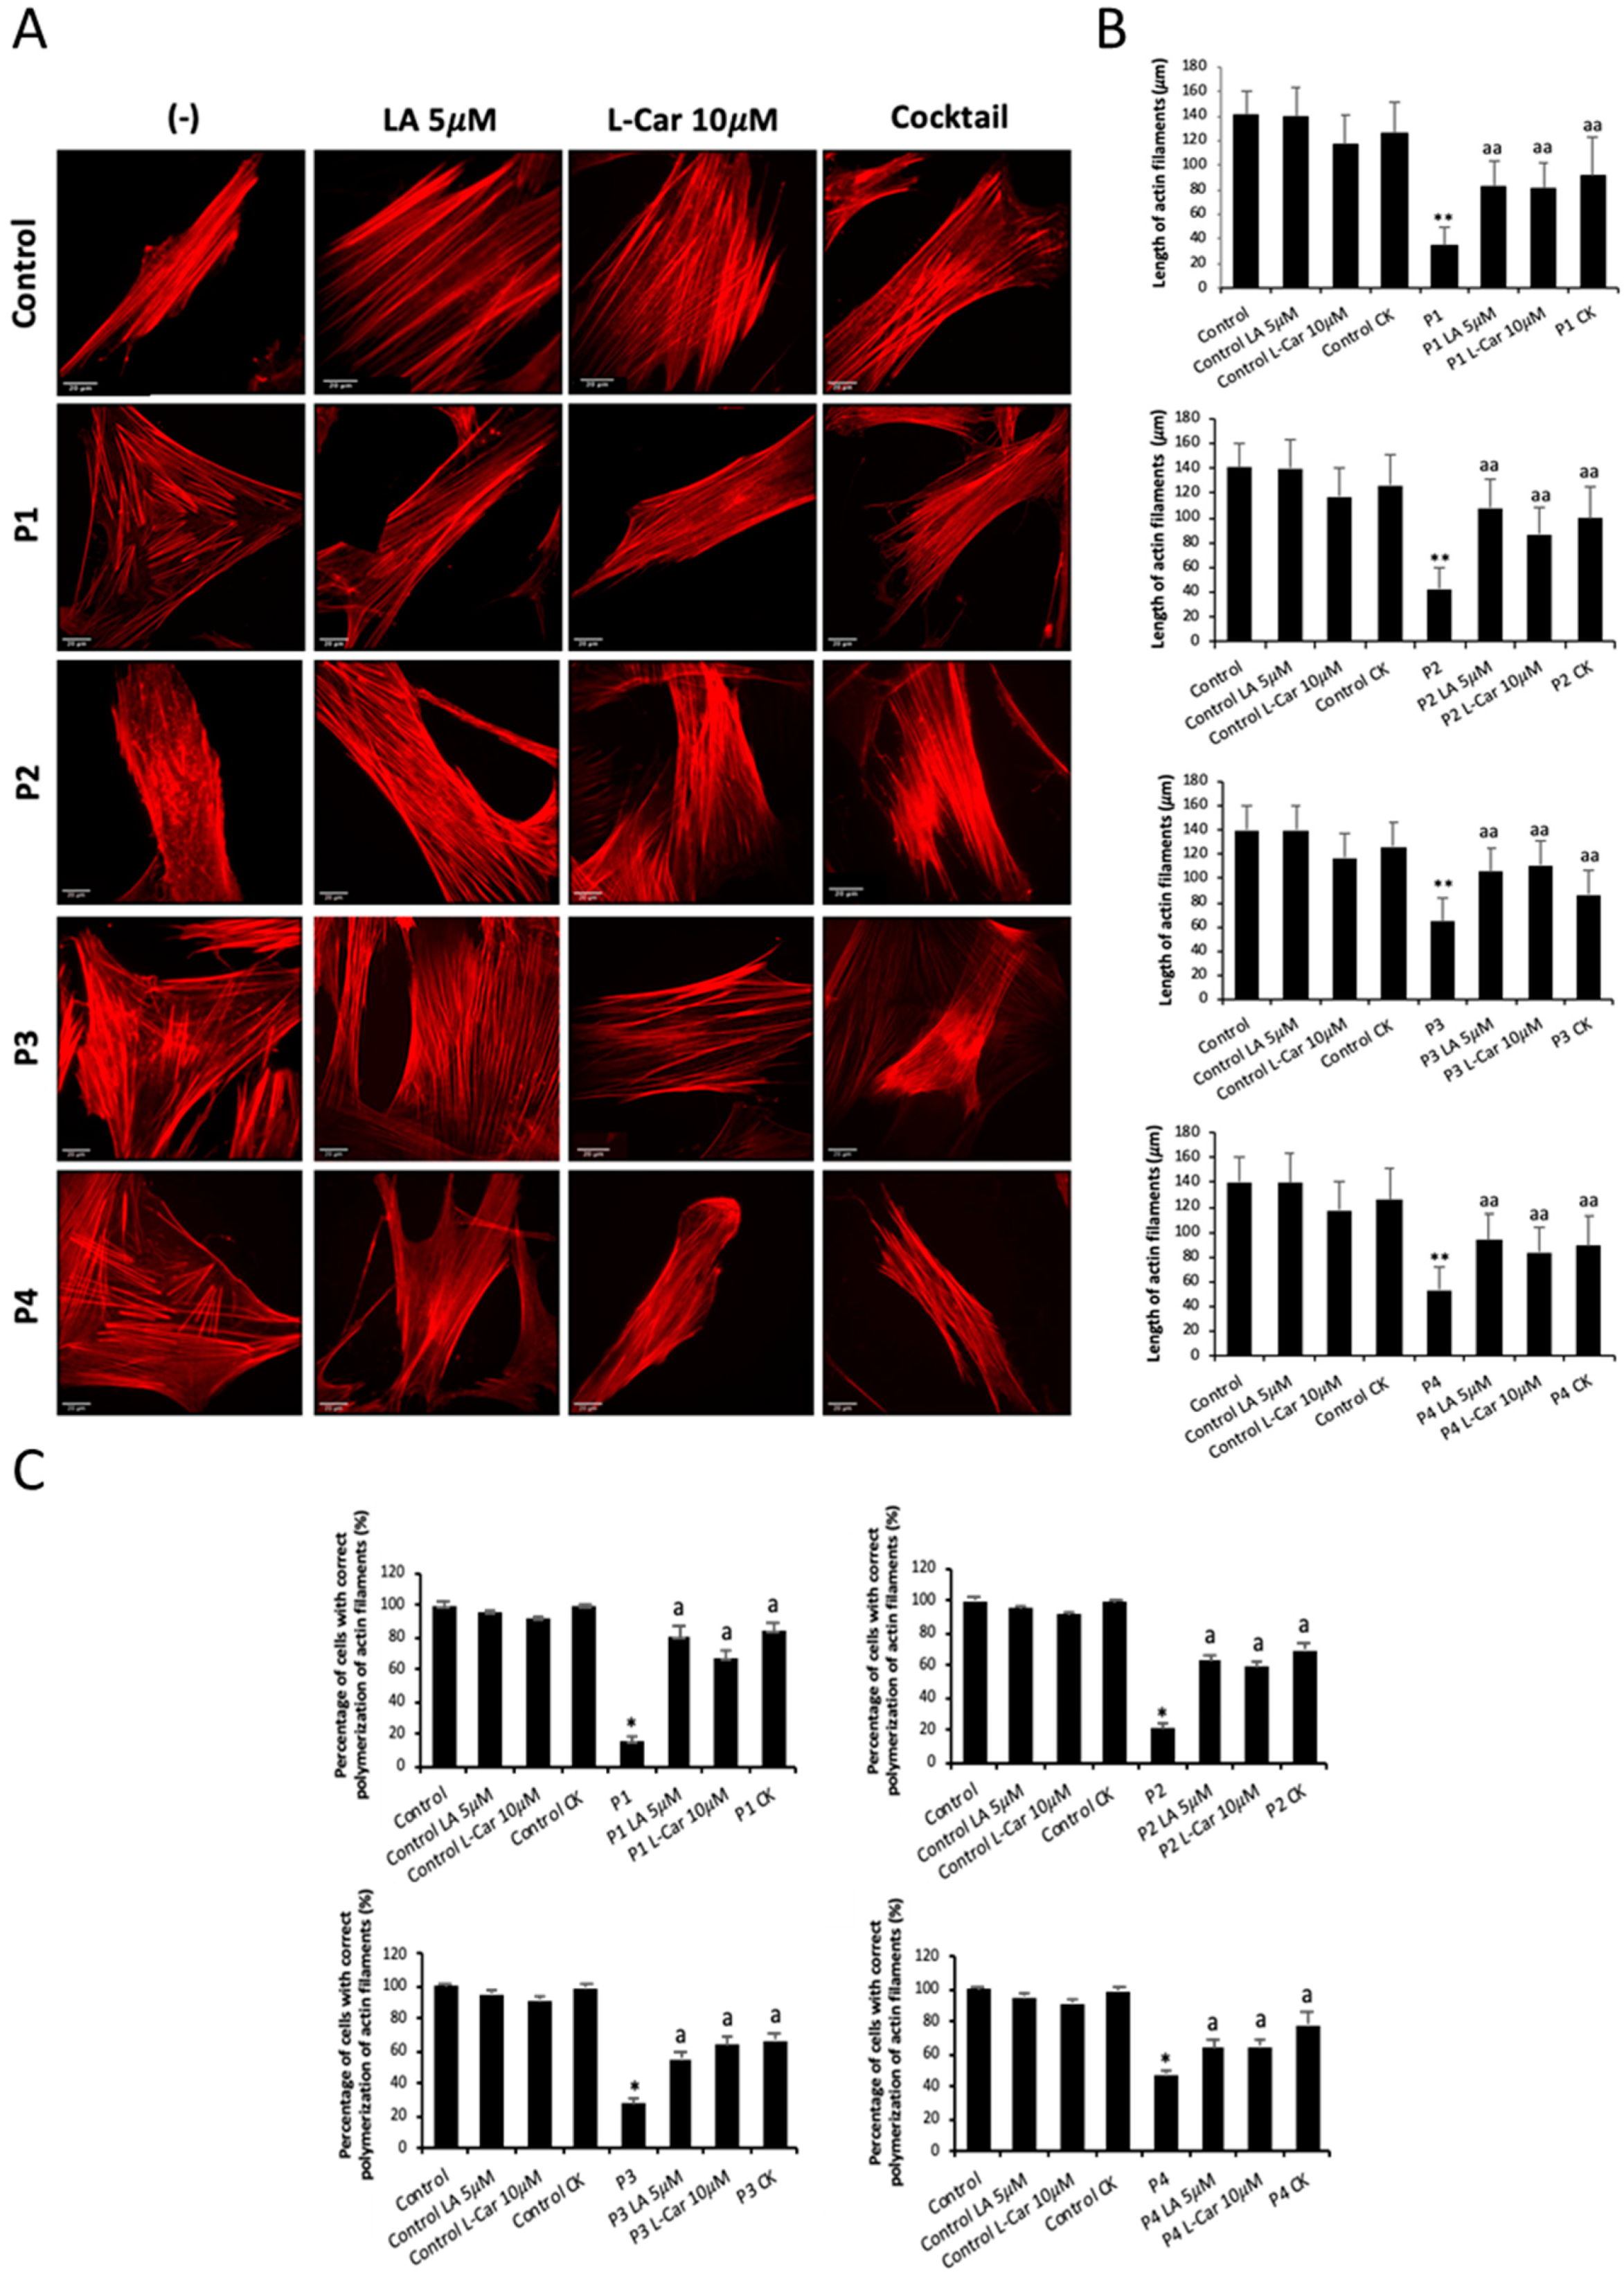
Figure 11.
Effect of LA and LCAR on bioenergetics of control and NM fibroblasts. Control (C1) and NM fibroblasts (P1 and P3) were treated (+) with 5 mM LA and 10 mM LCAR individually or in combination for 7 days. Basal and maximal respiration, Mitochondrial ATP production and Spare Respiratory capacity were determined in controls (C1 and C2) and NM fibroblasts (P1 and P3) by using the Seahorse analyzer as described in Material and Methods. (A) Corresponding with P1; (B) Corresponding with P3. Data represent the mean±SD of three separate experiments. ***p<0.001 between NM and controls cells; aap<0.01, aaap<0.001 between untreated (-) and treated NM cells.
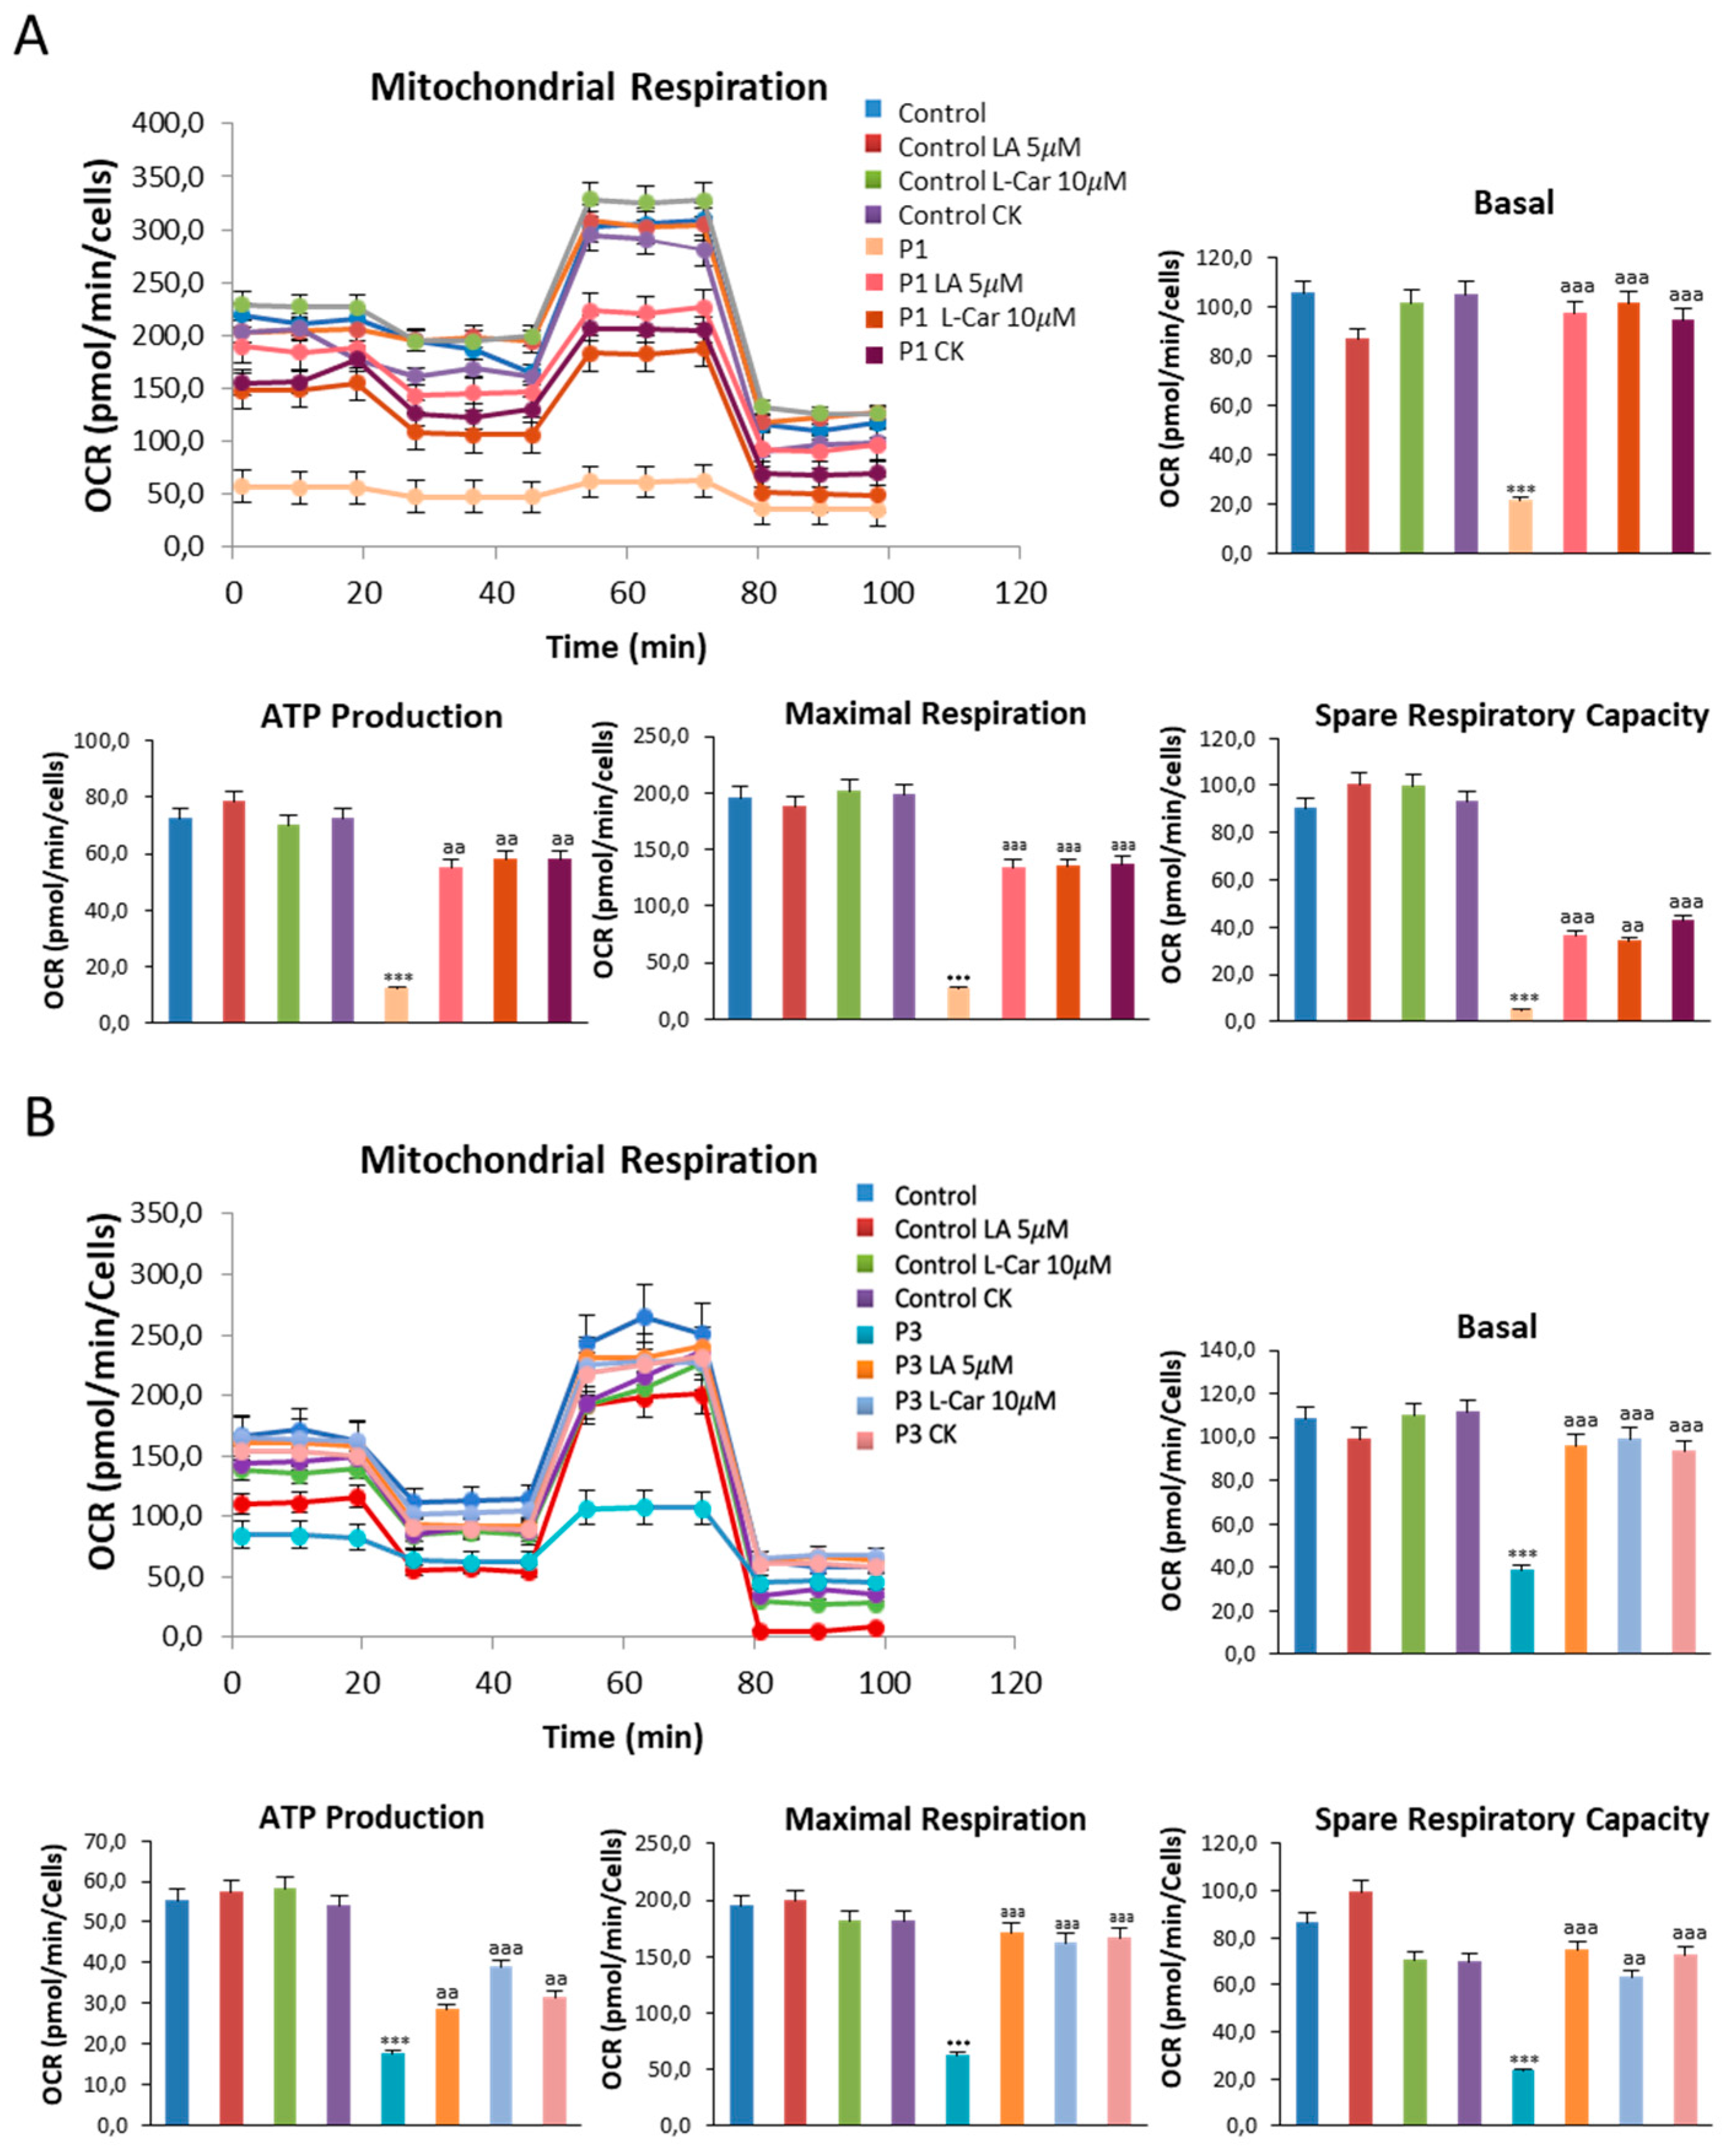
Figure 12.
Effect of LA and LCAR on mitochondrial polarization and network in control and NM cells. Control (C1) and NM fibroblasts (P1, P2, P3 and P4) were treated (+) with 5 mM LA and 10 mM LCAR individually or in combination (Cocktail) for 7 days. (A) Representative images of untreated and treated control (C1) and NM fibroblasts (P1 and P2) stained with MitoTrackerTM Red CMXRos, an in vivo mitochondrial membrane potential-dependent probe. Images were taken using the 40x lens and processed by the ImageJ software. Scale bar = 20 µm. (B) Fluorescence quantification of MitoTracker signal. Data represent the mean ± SD of three separate experiments (at least 100 cells for each condition and experiment were analysed). **p<0.01 between NM and controls cells; aap<0.01 between untreated (-) and treated NM cells. A. U.: arbitrary units.
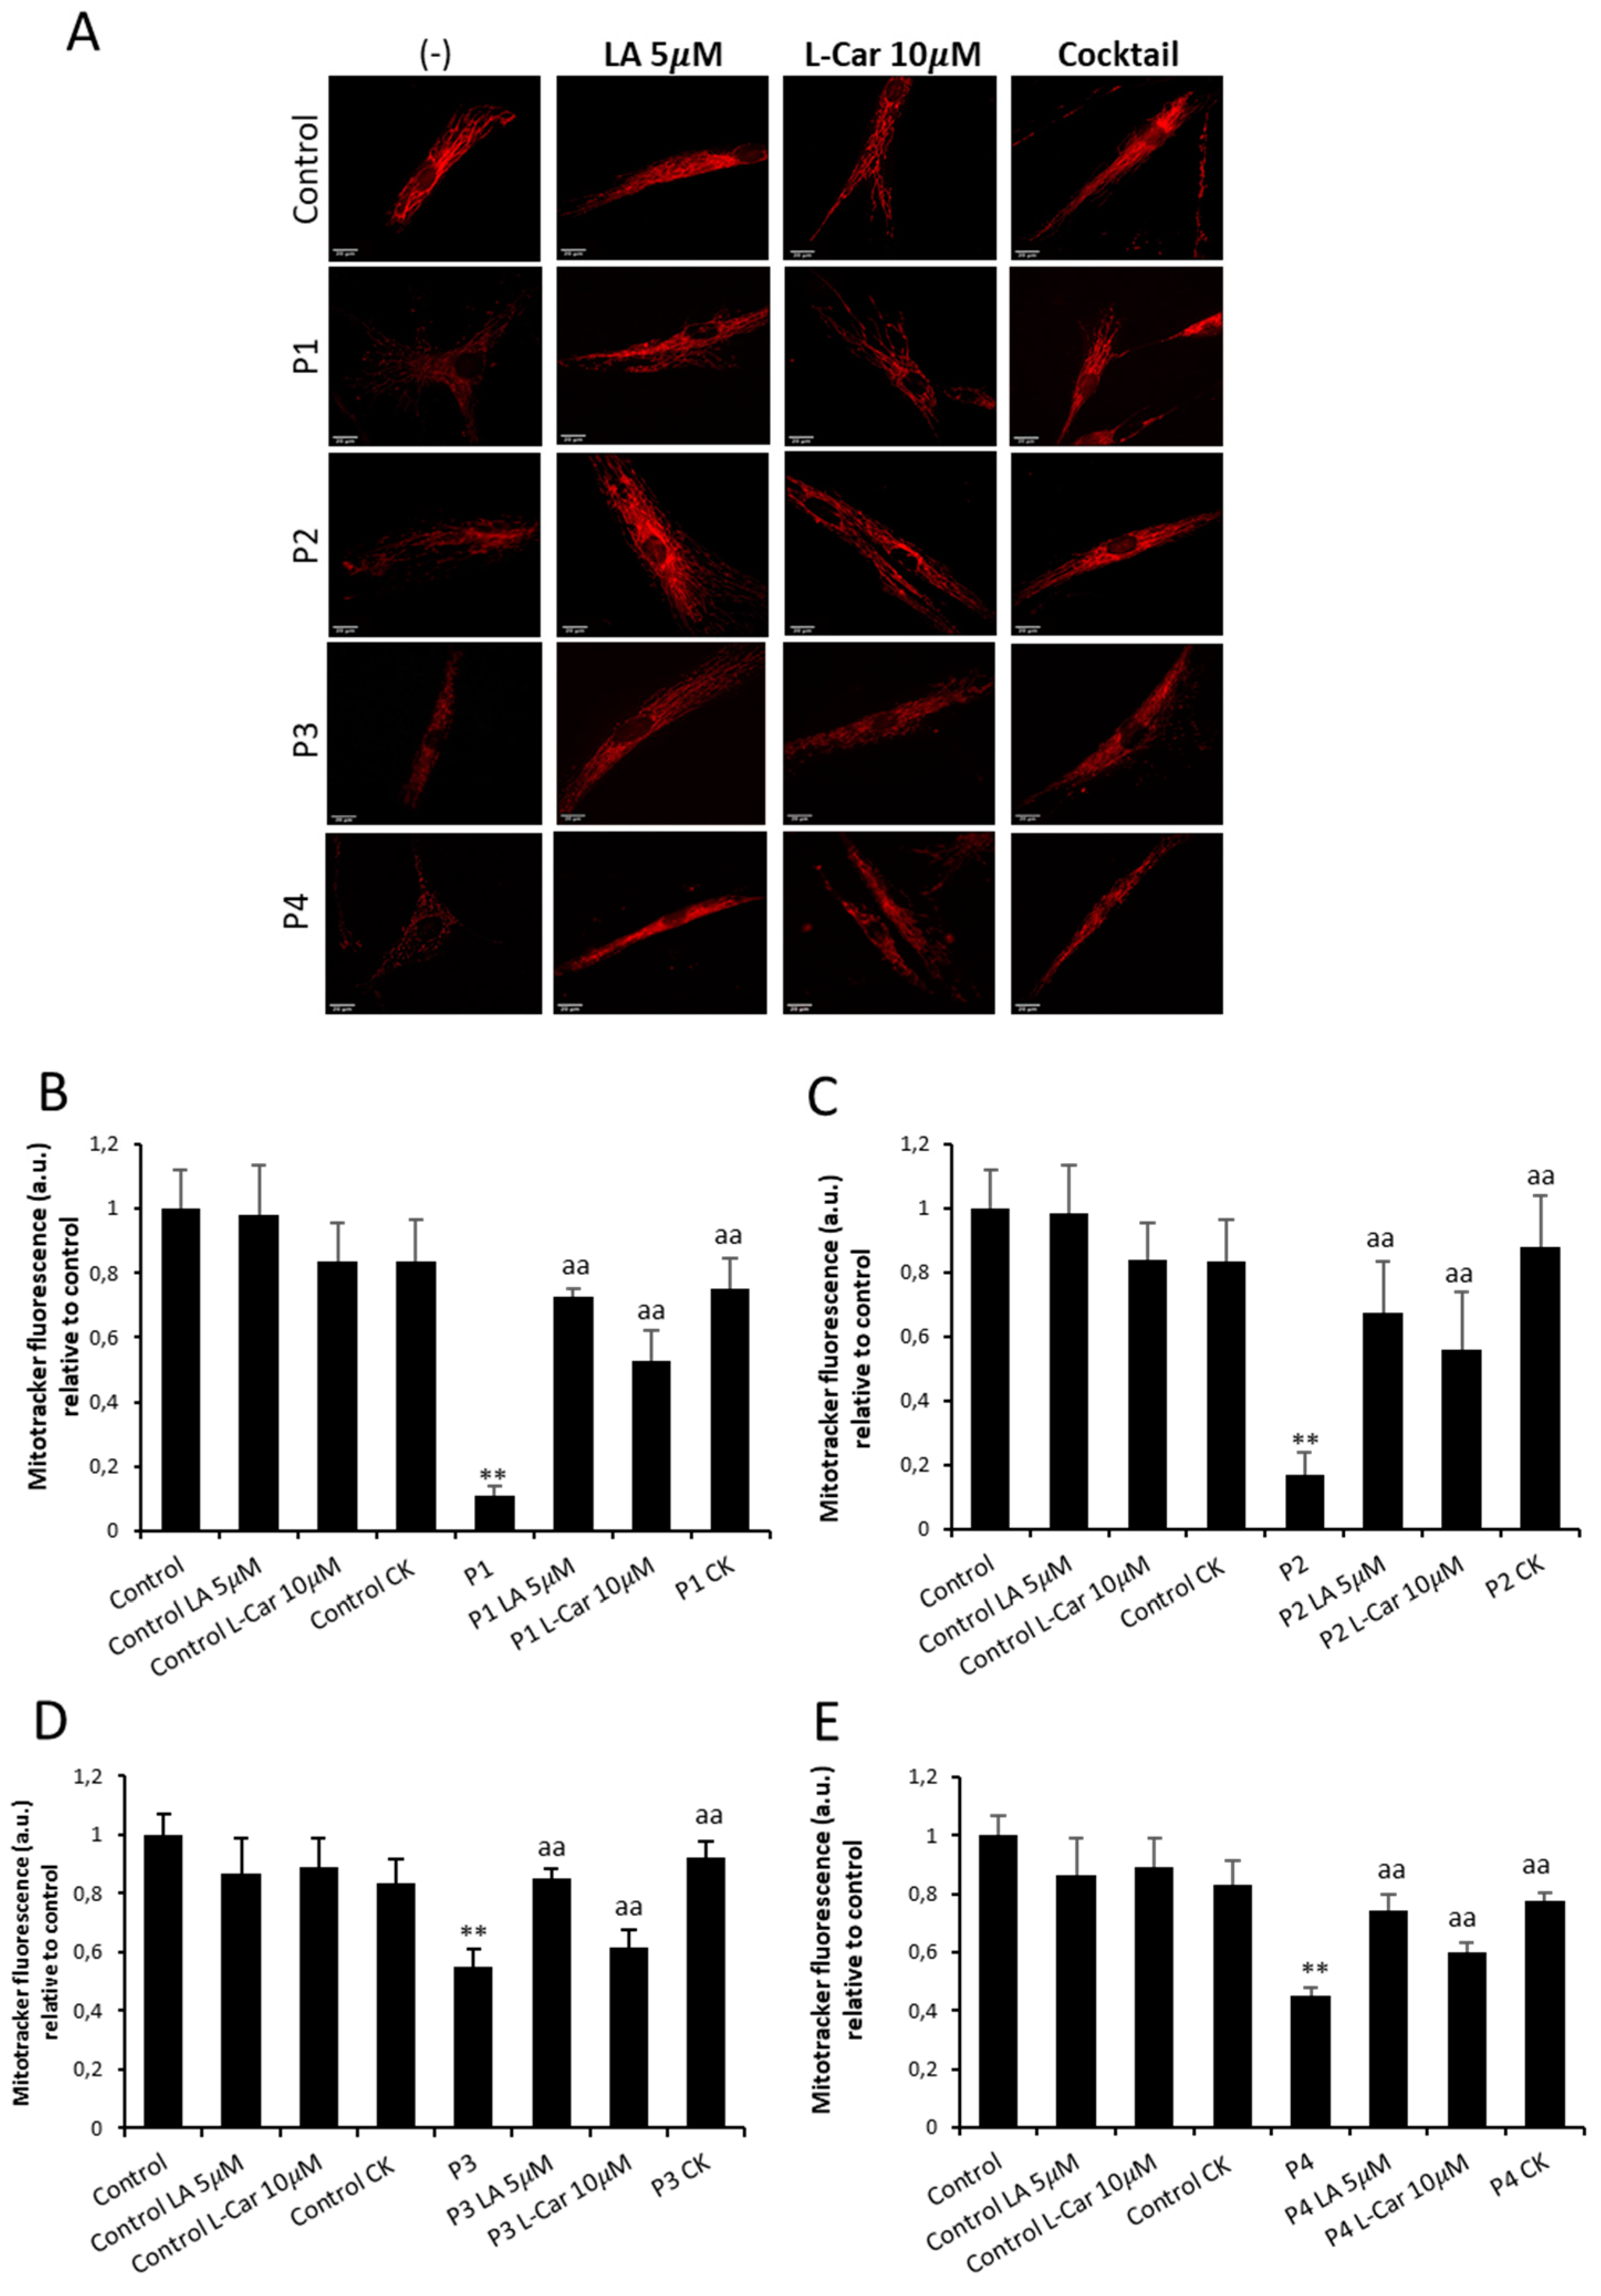
Figure 13.
Effect of LA and LCAR on mitochondrial protein expression levels in control and NM cells. Control (C1) and NM fibroblasts (P1, P2, P3 and P4) were treated with 5 µM LA and 10 µM LCAR individually or in combination (Cocktail, CK) for 7 days. (A) Immunoblotting analysis of cellular extracts from controls (C1 and C2) and NM patient cell lines P1 and P2. (B) Immunoblotting analysis of cellular extracts from controls (C1 and C2) and NM patient cell lines P3 and P4 Protein extracts (50 μg) were separated on a SDS polyacrylamide gel and immunostained with antibodies against NDUFA9, SDHB, UQCR2, Mt-CO2, ATP5F1A, VDAC, OPA1 and DRP1. α Tubulin was used as a loading control. (Densitometry of the Western blotting Supplementary Figures S8–S11).

Figure 14.
Effect of LA and LCAR on RhoA/ROCK pathway activation in Control and NM cells. Control (C1) and NM fibroblasts (P1, P2, P3 and P4) were treated with 5 µM LA and 10 µM LCAR individually or in combination for 7 days. (A) Immunoblotting analysis of cellular extracts from controls (C1 and C2) and NM patient cell lines P1 and P2. Protein extracts (50 μg) were separated on a SDS polyacrylamide gel and immunostained with antibodies against RhoA, Active RhoA purified by Active Rho Detection Kit as described in Material and Methods, ROCK1, phospho ROCK1 and α Tubulin, which was used as a loading control. (B) Densitometry of the Western blotting. For controls cells (C1 and C2), data are the mean±SD of the two control cell lines. Data represent the mean±SD of three separate experiments. *p<0.05, **p<0.01, between treated and untreated (-) cells. ap<0.05 aap<0.01 aaap<0.001 between untreated (-) and treated NM cells. A. U.: arbitrary units.
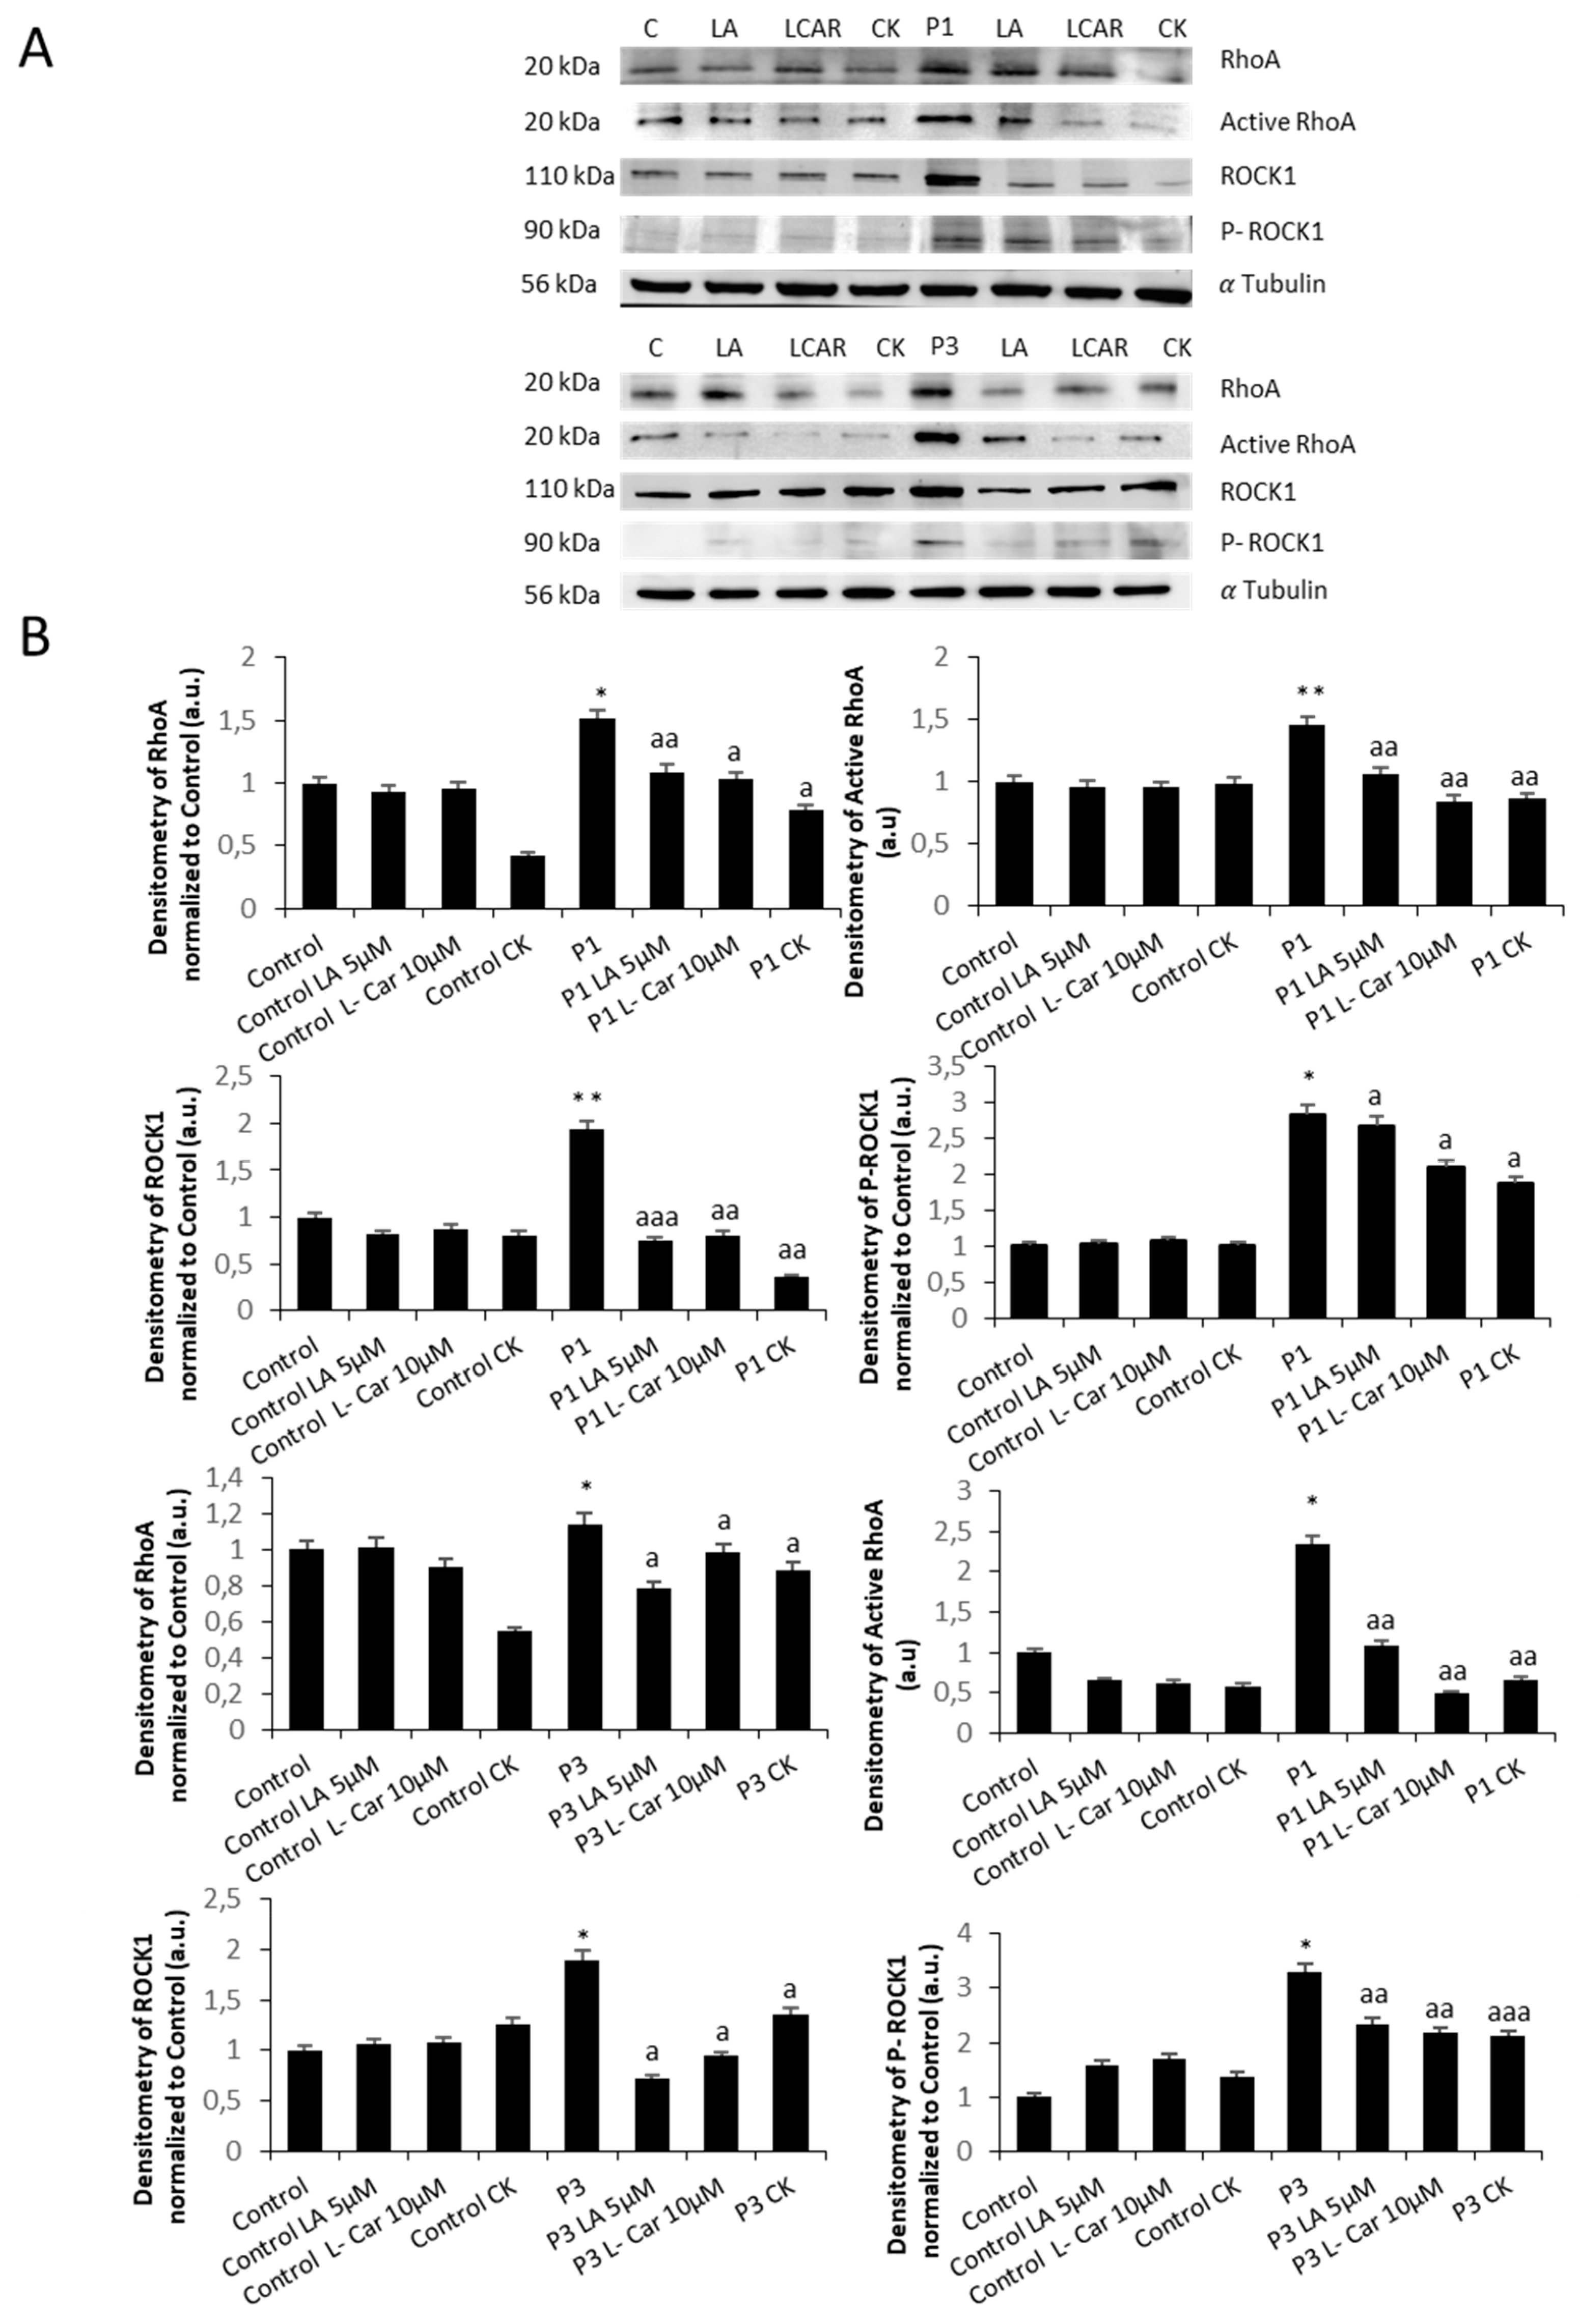
Disclaimer/Publisher’s Note: The statements, opinions and data contained in all publications are solely those of the individual author(s) and contributor(s) and not of MDPI and/or the editor(s). MDPI and/or the editor(s) disclaim responsibility for any injury to people or property resulting from any ideas, methods, instructions or products referred to in the content. |
© 2023 by the authors. Licensee MDPI, Basel, Switzerland. This article is an open access article distributed under the terms and conditions of the Creative Commons Attribution (CC BY) license (http://creativecommons.org/licenses/by/4.0/).
Copyright: This open access article is published under a Creative Commons CC BY 4.0 license, which permit the free download, distribution, and reuse, provided that the author and preprint are cited in any reuse.


