
Submitted:
20 June 2024
Posted:
21 June 2024
You are already at the latest version
Abstract
The severest form of muscular dystrophy (MD) termed Duchenne MD (DMD) remains to this day an incurable disease, hence the continued effort to further develop supportive therapies. Perturbation of autophagy, a degradative yet protective mechanism activated when tissues face severe and persistent stress, is critically involved in DMD, consequently, treatments harnessing autophagic capacities represent an amenable therapeutic strategy. We studied the effects of the protective osmolyte ectoine in the standard mouse model of DMD, the MDX, zooming in on the autophagy-related proteome. From birth, mice were treated with ectoine in the drinking water (150mg/kg) or through daily intraperitoneal injection (177mg/kg) until 5 weeks old. Hind limb muscles were dissected, performing western blotting for protein quantification and immunofluorescence to investigate tissue distribution. We report significant alterations of total levels of autophagy related 5 (ATG5), Ser366 phosphorylated sequestosome 1 (SQSTM1) and heat shock protein 70 (HSP70), and of activated microtubule-associated protein 1A/1B-light chain 3 (LC3 II) in mitochondrial fractions. Ectoine tends to restore the shifted balance between LC3 II and SQSTM1 levels observed in MDX muscle, and LC3 II upregulation was most pronounced on muscle fibers of MDX treated with ectoine in the drinking water. Findings from this explorative study support a possible beneficial effect of ectoine on the autophagic deficit in the MDX, which warrants its further exploration as a therapeutic supplement for DMD.
Keywords:
muscular dystrophy
; osmolytes
; autophagy
; mitophagy
1. Introduction
The genetic muscle disorder Duchenne Muscular Dystrophy (DMD) is characterized by progressive muscle wasting, causing patients to become wheelchair bound in their teens [1,2]. Since the condition is X-linked, it primarily affects boys, with an average-prevalence of 1 per 5,000 live births [3]. DMD is caused by gene mutations in DMD, leading to the loss of function of the scaffold protein dystrophin, which destabilizes the dystrophin associated protein complex, and results in accumulating contraction-induced damage to muscle fiber membranes [4,5,6]. Due to increased permeability of muscle cells, an uncontrolled influx of calcium occurs, further enhancing progressive myofiber degeneration, mitochondrial rupture and generation of reactive oxygen species [7,8]. In addition to chronic inflammation and cumulating oxidative stress, DMD muscle tissues suffer from dysfunctional autophagy, the latter contributing substantially to muscle weakness and wasting due to inefficient removal of damaged or unwanted cellular components [9,10]. Key stages of macro-autophagy are tightly regulated by a set of autophagy-related proteins (ATG), ensuring orchestrated process initiation, maturation and fusion with lysosomes [11,12]. The protein complex composed of ATG5-ATG12-ATG16L1 subunits represents an ubiquitin conjugation system that serves as an E3-like enzyme imperative for the expansion and formation of the autophagosomes. This ATG complex influences the lipidation of microtubule-associated protein 1A/1B-light chain 3 (LC3) and interactions with the multifunctional adaptor protein sequestosome 1 (SQSTM1), which are essential steps for autophagosome formation and fusion with lysosomes [10,11]. An important aspect is autophagic removal of damaged mitochondria, termed mitophagy, which is mediated through accumulation of PTEN-induced putative kinase 1 (PINK1) on the outer membrane of mitochondria that lost their membrane potential. PINK1 activates and recruits the E3 ubiquitin ligase parkin (PRKN) and SQSTM1, encapsulating damaged mitochondria within autophagosomes [13,14]. Mitophagy is of particular importance in DMD and a better understanding of this mechanism can offer valuable insight into disease pathogenesis [9].
Irrefutably, the use of animal models has been crucial to study DMD disease mechanisms and progression, and to test and evaluate the efficacy of new therapeutic strategies. The most commonly used model is the dystrophin-deficient mouse C57BL/10ScSn-Dmdmdx termed MDX [15]. MDX carry a nonsense C-to-T transition in exon 23 introducing a premature stop codon in dmd [15,16,17,18]. The lack of dystrophin protein in this model leads to fulminant skeletal muscle degeneration and regeneration at the earliest stage, later on stabilizing to a milder form of muscle wasting and slower progression in comparison to human disease [8,15,16,18].
Despite advancements in molecular medicine, to this date there is still no cure for DMD and the average life expectancy is reduced to the early forties [9,19]. Dystrophin gene replacement therapies and exon-skipping strategies have entered the clinic, and further molecular therapies are continuously being pursued in clinical trials [20]. Current molecular strategies cannot cure patients, yet aspire the expression of a shorter albeit partially functional dystrophin protein in patients, improving disease to phenotypical Becker Muscular Dystrophy. Additional limitations of these therapies are their mutation specificity, requiring a therapeutic design tailored to the individual patient, and the high costs [15,21]. Also, DMD patients are administered glucocorticoids to reduce inflammation-associated muscle damage, yet long-term treatment associates with numerous adverse effects. The need therefore persists to investigate novel supportive treatments aimed to ameliorate overall patient wellbeing and comfort.
Osmotic deregulation contributes to muscle damage in DMD and expression of the key regulator tonicity-responsive enhancer binding protein (TonEBP) also termed nuclear factor of activated T-cells 5 (NFAT5) is altered [22], which puts protective osmolytes forward as attractive alternative supplementary treatment for DMD. In this respect, the use of taurine has been most widely studied and beneficial effects have been observed in mouse models, however, interference with murine development has also surfaced [23], warranting the exploration of alternative compounds. In an earlier study we were the first to study ectoine in the MDX and reported improved skeletal muscle histopathology and anti-inflammatory effects [24]. Ectoine is a natural compound found in extremophiles [25]. It is a compatible solute, which means it may accumulate in cells at high concentrations without impairing cellular functions. Ectoine acts as a kosmotrope and protein stabilizer, boosting hydrophobic contacts and folding, and stabilizes cell membranes [26]. Additional beneficial effects include anti-inflammatory properties, via deactivation of the pro-inflammatory transcription factor nuclear factor kappa-light-chain-enhancer of activated B cells (NFκB), and anti-oxidant properties, through elimination of hydroxyl radicals. In this study, we explored the potential compensatory effects of ectoine on the autophagic deficit in the MDX.
2. Results
The autophagic proteome of skeletal muscle tissues from healthy control mice (BL 10) was compared to that of MDX with or without ectoine treatment, employing western blotting techniques to pick up quantitative differences, and immunofluorescent microscopy to study tissue distribution.
2.1. Changes to the Proteome in MDX Compared to Wild Type
Proteins levels of ATG5, ATG7, LC3 and PRKN were compared in extensor digitorum longus (EDL) from BL 10 and MDX mice at 26 weeks of age. The increased ratios of LC3 II over LC3 I of MDX reached statistical significance (Figure 1).
2.2. Tissue Expression Patterns of Autophagy-Related Proteins in MDX Compared to Wild Type
In soleus (SOL) and tibialis anterior (TA) muscles from BL 10, homogeneous sarcoplasmic staining for the ATG16L1 subunit of the E3-like enzyme complex ATG12–ATG5-ATG16L1 could be observed. In MDX, co-staining with neural cell adhesion molecule (NCAM) indicated reduced expression levels in regenerating muscle fibers, most particular in clusters of small fibers (Figure 2C). Staining patterns of ATG5, ATG7 and PRKN appeared similar between BL 10 and MDX, showing constitutive muscle fibers staining with accentuation at the sarcolemma (data not shown). In MDX tissues, immunostaining for heat shock protein 70 (HSP70), SQSTM1 and LC3 II was increased compared to BL 10. Strong sarcoplasmic expression of HSP70 chaperones could be observed in necrotic muscle fibers (Figure 2F), while a subset of muscle fibers stained strongly for SQSTM1, of which the majority were NCAM negative (Figure 2I).
2.3. Changes to the Skeletal Muscle Proteome of Ectoine-Treated MDX
Protein levels of ATG5, ATG7, LC3 II, SQSTM1 and PRKN were evaluated in EDL muscle from BL 10 and MDX treatment groups (Figure 3). ATG5 levels were significantly higher in MDX treated with ectoine in the drinking water (DW ECT) compared to BL 10, and between MDX treated with ectoine via intraperitoneal injection (IP ECT) and DW ECT.
The levels of HSP70, voltage dependent anion channels (VDAC), PRKN, LC3 II, SQSTM1 and Ser366 phosphorylated SQSTM1 (p-SQSTM1) were evaluated in gastrocnemius (GAS) muscle from BL 10 and MDX treated with saline or ectoine through intraperitoneal injection (Figure 4). HSP70 chaperone levels were significantly elevated in MDX IP ECT compared to BL 10. Between those groups, p-SQSTM1 levels were also significantly increased, and the increase remained significant when calculated as a ratio of phosphorylated over total SQSTM1 protein levels. VDAC levels were not significantly reduced in MDX, and were unchanged in treated mice.
2.4. Changed Tissue Expression Patterns of Autophagy-Related Proteins in Ectoine-Treated MDX
As could be expected, muscle-infiltrating inflammatory cells were much more abundant in TA from MDX compared to BL 10, however, large variations of macrophage abundance were observed between individual MDX. Nonetheless, a tendency for larger numbers of macrophages was observed in TA from MDX ECT DW (Figure 5E). TA from BL 10 was mostly LC3 II negative, except for infrequent partial staining of the sarcolemma of muscle fibers (Figure 5B). In MDX tissues, LC3 II staining on muscle fibers was discretely increased. Necrotic invaded muscle fibers were mostly LC3 II negative (Figure 5D), while subsets of small muscle fibers stained strongly (Figure 5F), with such fibers more frequently encountered in MDX ECT DW. Staining patterns of HSP70 and SQSTM1 were similar between untreated and the different MDX treatment groups (data not shown).
2.5. Changes to the Mitochondrial Proteome in Ectoine-Treated MDX
To evaluate mitophagy in ectoine-treated MDX, mitochondrial protein fractions were prepared from soleus (SOL) muscle samples and protein levels of HSP70, VDAC, PRKN and LC3 were determined (Figure 6). Significantly increased LC3 II levels were observed between MDX IP ECT and MDX DW ECT, yet the difference was no longer significant when calculated as a ratio of LC3 II over LC3 I. Our attempts to quantify SQSTM1 in mitochondrial extracts were unsuccessful, hence no comparison of SQSTM1 levels between the treatment groups could be made.
3. Discussion
In addition to boosting the levels of functional dystrophin protein, targeting other DMD-associated pathogenic mechanisms represent valuable therapeutic strategies in their own right. In this respect, immunosuppressive therapy has been proven unsurpassable. Inflammatory processes aggravate muscle tissue damage and need to be restrained, notwithstanding the reparative and myogenic functions that represent the good side of the inflammatory coin and need to be preserved. More successful treatment of DMD would therefore need to address tissue recovery deficits in a balanced and targeted way. With the current study, we looked more closely into the therapeutic potential of ectoine, an osmolyte with many characteristics beyond osmoregulation of potential benefit to DMD. In analogy with taurine [27], ectoine might also exhibit regulatory effects on autophagic processes.
When muscle tissues face severe and persistent stress, autophagic removal of damaged cell material is essential for recovery, yet dystrophin deficiency has repeatedly been linked to insufficient activation of restorative programs. In order for autophagy to be efficacious, a multitude of involved factors need to tightly work together to match the cell’s needs, and ATG proteins are critically involved. The significantly higher ATG5 protein levels in MDX treated with ectoine in the drinking water we report in this study are of potential benefit to tissue recovery. Decreases of ATG5 have been linked to ageing-associated cell damage [28] and ATG5 overexpression increases lifespan in mice [29]. In addition, in vitro studies with ATG5 siRNA showed autophagy dysregulation and interference with myogenic differentiation [30]. Skeletal muscle is a dynamic tissue and it appears expression of ATGs requires regulation during muscle tissue remodeling. We report loss of ATG16L1 expression in small regenerating muscle fibers, which further implicates ATG protein complex reorganization in myogenesis. In mice, a Atg16L1 gene defect causes muscle atrophy [31], and ATG16L1 is involved in cellular homeostasis through regulation of inflammatory repertories [32]. Complex regulation of ATG proteins in muscle remodeling is accomplished further via fine-tuning of gene expression by non-coding micro-RNAs (miRNAs). The increased levels of miR-106b observed in DMD [33] are of special interest, due to a negative impact on muscle tissue regeneration [34], hence it has been proposed as a putative therapeutic target [35]. MiR-106b interacts with multiple autophagy-related genes, thus playing an integral part in autophagy regulation, and a direct interaction with the ATG16L1 mRNA 2’UTR has been shown [36].
The dysregulation of autophagic markers in MDX is described to be complex, and age-and tissue-dependent [9]. In this respect, the young age of mice in this study is of importance, as this represents the most active disease phase in regards to skeletal muscle degeneration and regeneration. In accordance, our earlier study found significant 2.2-fold increased levels of HSP70 chaperones in TA from MDX compared to BL 10 specifically at age 4 weeks, later returning to levels of healthy controls [37]. HSP70 chaperones are important decision-making proteins that destine proteins to repair or destruction [38] and closely work together with autophagic factors. In the current study, we observed a significant increase of HSP70 protein levels in MDX treated with intraperitoneal ectoine, which could potentially be of benefit to tissue recovery. An additional protective effect of HSP70 concerns the mitochondria in particular. Tumoral cells have been described to possess elevated mitochondrial HSP70 levels, and in these cells HSP70 inhibition disturbs mitochondrial function through the accumulation of polyubiquitylated proteins [39]. Unlike the increased total HSP70 levels observed in TA, we could not show a concomitant increase of mitochondrial HSP70 levels in SOL from ectoine-treated MDX, which indicates the mitochondrial chaperone machinery might not be activated.
An important autophagy substrate selector is LC3, of which altered activation has been reported in MDX (Table 1) [40,41,42,43,44,45,46,47]. We observed significantly increased LC3II/I ratios in EDL muscle of 26-weeks-old MDX compared to age-matched healthy controls. We noted significantly increased mitochondrial LC3 II levels in SOL muscle from MDX treated with ectoine in the drinking water. Due to concomitant higher levels of LC3 I, the LC3 II/I ratio was, however, unaltered.
Altered levels of the autophagy receptor SQSTM1 have been shown in MDX muscle tissues (Table 1). Interpretation can, however, be tricky, as SQSTM1 steers its own degradation, and increased SQSTM1 levels could therefore point to dysfunctional autophagosome accumulation and impaired clearance. In addition, the autophagic deficit in DMD patients and MDX may not be reflected by concomitant decreases in gene as well as protein expression levels. Similar or significantly decreased SQSTM1 mRNA levels were consistently accompanied by significantly increased protein levels in MDX quadriceps [14], tibialis anterior [43] and diaphragm [48]. In control MDX of 5 weeks old, SQSTM1 upregulation did not reach significance in this study, but we did detect significantly increased levels of Ser366 phosphorylated SQSTM1 in GAS muscle from MDX treated with intraperitoneal ectoine. This is of interest, as, in addition to regulation by transcriptional activation, post-translational regulatory mechanisms may also influence autophagic processes. Ser366 is a major phosphorylation site for the TANK binding kinase 1 (TBK1), a kinase at the crossroads between immunity and autophagy. TBK1 is critically involved in mitophagy via its recruitment to damaged mitochondria [49], activating their selective removal through its association with autophagy adaptors including SQSTM1 [50]. Ser366 phosphorylation renders SQSTM1 more stable [51], which can be of benefit to the muscle tissue in this early stage of active disease. Of note, TBK1 defects have been associated with neurodegenerative disorders [52].
The changes of autophagy-related proteins we report here appear, in essence, an appropriate attempt to restore disease-associated tissue damage. The question remains whether the MDX skeletal muscle’s responses can lead to success or, on the contrary, are in fact counterproductive. More so than their individual levels, if appears that the autophagic proteome needs balanced activation to perform its restorative functions. Orchestrated activities of LC3 II and SQSTM1 in particular seem crucial autophagy controllers in muscle tissue repair and differentiation. In vitro experiments determined autophagic activities in myoblasts are low, accelerating upon differentiation to myotubes, mostly in the earliest phase, with increased LC3 II and decreased SQSTM1 levels. Later in the process, LC3 II decreases and SQSTM1 increased [53]. In the response to cell stress, high levels of LC3 II that co-exist with low levels of SQSTM1 are regarded an indication of proper autophagic function. Therefore, we calculated the ratio of LC3 II over SQSTM1 as relative to the ratio in healthy control mice, providing a theoretical measure of the autophagic flux in MDX muscle tissues (Figure 7). Due to the small sample of this explorative study, statistical significance could not be achieved, however, the increased ratios were conspicuous in muscle from ectoine-treated MDX. While reduced in MDX treatment controls (0.7 in EDL and 0.8 in GAS), increased ratios were noted with intraperitoneal ectoine (1.8 in EDL and 1.4 in GAS) and ectoine in drinking water (1.2 in EDL). Our results support the hypothesis that ectoine supplementation could aid to alleviate progressive muscle damage in the MDX via a compensation of the autophagic deficit, potentially improving clearance of defective cellular components.
4. Materials and Methods
4.1. Animal Care, Treatment and Muscle Sampling
C57BL/10ScSn-Dmdmdx/J (MDX) mice and C57BL/10SnJ control mice (BL 10) were bred at the central animal facility of Ghent University. Experimental procedures were performed in accordance with ARRIVE guidelines and were approved by the Animal Ethics Committee of Ghent University. All animals had access to food and water ad libitum.
MDX were divided into four groups. Control MDX aged between 4 and 26 weeks old were included that received no treatment. Treatment was initiated one week after birth by adding ectoine to the drinking water (≈150 mg/kg) for 2 weeks. A group of MDX continued to receive ectoine in drinking water (≈ 1.08 g/kg), another group from then on received daily intraperitoneal injections of ectoine (≈ 177 mg/kg). A treatment control group received daily intraperitoneal injections of saline. Both male and female mice were included in this study.
At age 5 weeks, cervical dislocation was performed. From hind limbs, gastrocnemius (GAS), tibialis anterior (TA), soleus (SOL) and extensor digitorum longus (EDL) muscles were dissected and snap-frozen for western blotting, or embedded in Tissue-Tek (Sakura) and submerged in nitrogen-cooled isopentane for immunofluorescence. All materials were stored at -80°C until used.
4.2. Protein Sample Preparation
For total protein preparations, GAS and EDL muscles were ground in a glass-glass tissue grinder in an equal volume of extraction buffer (RIPA buffer (50 mm TrisHCl, 150 mM NaCl, 2.5% NP40, 2.5% Na-deoxycholate, 0.1% sodium dodecyl sulphate pH 7.4)) supplemented with complete protease inhibitor cocktail (Merck). Samples were centrifuged at 10000g for 15min at 4ºC, supernatant was collected and protein concentration was estimated based upon 260/280nm absorbance using the Biodrop μLite device (Fisher Scientific).
For mitochondrial protein preparations, a published protocol of sequential centrifugation was employed [54], with some modifications. Briefly, SOL muscle was ground in STM buffer (250mM sucrose, 50mM tris-HCl, 5mM MgCl2 pH7.4), left on ice for 10min and centrifuged at 800g for 20min. The pellet was resuspended in STM buffer and centrifuged 10min at 11000g. The pellet was resuspended in SOL buffer (50mM tris-HCl, 1mM EDTA, 0.5% triton-X-100 pH6.8) and centrifuged for 10min at 800g. The supernatant was collected, representing the mitochondria-enriched protein fraction.
4.3. Western Blotting
Total protein samples were diluted to a protein concentration of 1500 μg/ml in lithium dodecyl sulfate buffer with reducing agent added, boiled for 2min, 20μl was loaded onto NuPAGE 10% bis-tris gels for electrophoresis in MOPS buffer, and transferred to nitrocellulose membrane via electroblotting (Thermo Fisher Scientific). The membrane was subjected to a sequential western blotting protocol, in which the protein of interest was imaged first via chemiluminescent detection, and housekeeping protein glyceraldehyde-3-phosphate dehydrogenase (GAPDH) second using chromogenic detection on the same blot. For this purpose, the membrane was incubated 1h with milk blocking solution composed of tris-buffered saline with 0.1% tween20 (TBST) with 0.2% non-fat dry milk, washed with TBST, and incubated with primary antibodies in milk blocking solution overnight. The following primary antibodies and concentrations were used: 0.2µg/ml rabbit monoclonal anti-ATG5 (D5F5U), 0.03 µg/ml rabbit monoclonal anti-ATG7 (D12B11), 0.04µg/ml rabbit polyclonal anti-PRKN, 0.07µg/ml rabbit monoclonal anti-SQSTM1 (D6M5X), 0.03µg/ml rabbit polyclonal anti-p-SQSTM1, 0.1µg/ml rabbit polyclonal anti-VDAC (Cell Signaling Technologies), rabbit monoclonal anti-LC3 II (ab192890) (Abcam); 2µg/ml rabbit polyclonal anti-HSP70 (R&D Systems). Membranes were washed with TBST and incubated with 0.5µg/ml horseradish peroxidase-labeled goat anti-rabbit (Sigma Aldrich) for 1h. Protein bands were visualized with chemiluminescent ECL Pierce substrate (Thermo Fisher Scientific) using the Chemidoc Imaging System (Bio-Rad Laboratories). Subsequently, using the same blot was incubated with 0.2µg/ml rabbit polyclonal anti-GAPDH (ab9485) (Abcam) for 1h and was detected with alkaline phosphatase-linked anti-rabbit secondary antibody using the Western Breeze kit (Thermo Fisher Scientific). Density of proteins was quantified with Gene tools software (Syngene) and calculated relative to GAPDH levels to correct for protein loading differences between samples.
Mitochondrial protein samples were resolved in Laemmli buffer containing 2-mercapto-ethanol, boiled for 2 min and loaded onto 4–20% Mini-Protean TGX Stain-Free gel for electrophoresis. Proteins were transferred to ethanol-treated low fluorescent polyvinylidene membrane (Bio-Rad Laboratories) and incubated overnight with primary antibodies at the same concentrations as specified for total protein samples. Protein bands were visualized with horseradish peroxidase-conjugated secondary antibodies (Sigma Aldrich) and chemiluminescent ECL Pierce substrate (Thermo Fisher Scientific) using the Chemidoc Imaging System (Bio-Rad Laboratories). Densities were quantified with Image-Lab 6.0 software, normalized to total protein using Stain-Free technology (Bio-Rad Laboratories).
4.4. Statistical Analysis
Statistical analysis was performed with GraphPad Prism. For the comparison of two independent measurements with normal distribution, the unpaired t test was used. For three and four sets of unpaired measurements with Gaussian distribution and unequal variances, the Brown-Forsyth and Welch ANOVA test for multiple comparisons was used.
4.5. Immunofluorescent Staining
8µm frozen sections were cut from TA and SOL muscle, permeabilized for 2min in cooled acetone, and incubated in phosphate-buffered saline (PBS) with 2% bovine serum albumin, 10% heat-inactivated human and 5% donkey serum (PBS/BSA/HD) blocking solution for 30min. Primary antibodies were diluted in PBS/BSA/HD and incubated for 3h in the following concentrations: 1.1µg/ml rabbit monoclonal anti-ATG5 (D5F5U), 0.2µg/ml rabbit monoclonal anti-ATG7 (D12B11), 0.9µg/ml rabbit monoclonal anti-ATG16L1 (D6D5), 0.2µg/ml rabbit polyclonal anti-PRKN, 1µg/ml rabbit monoclonal anti-LC3 II (D11), 0.5µg/ml rabbit monoclonal anti-SQSTM1 (D6M5X) (Cell Signaling Technologies), 10µg/ml rabbit polyclonal anti-HSP70 (R&D Systems), 5µg/ml rat anti-F4/80 (Abcam) and 2.5µg/ml goat polyclonal anti-NCAM (R&D Systems). Sections were rinsed three times with PBS and incubated for 30min with secondary antibodies: 0.25µg/ml donkey anti-rabbit AlexaFluor 488 conjugated (Thermo Fisher Scientific) and 0.25µg/ml donkey anti-goat CY3 conjugated (Jackson Laboratories) diluted in PBS. Sections were rinsed three times with PBS and mounted with Fluoromount G (Thermo Fisher Scientific). Staining was visualized under a fluorescent microscope (Carl Zeiss) and imaged using Cell F Software (Olympus Life Science).
5. Conclusions
Adding to ectoine’s anti-inflammatory and anti-oxidative capacities, we here report potentially beneficial alterations to the autophagy-related proteome of MDX skeletal muscle in an explorative study with short-term treatment starting from birth. Caution is, however, due when interpreting the dynamic process of autophagy through interpretation of results obtained through static snapshots. Nonetheless, our results warrant further exploration of the osmolyte ectoine as a therapeutic supplement for DMD, envisioning autophagic activity might be boosted to sufficient levels for improving clearance of defective cellular components. As autophagic deficits are regarded complicators of tissue recovery in various neuromuscular disorders [55], including also muscular dystrophies due to COL6 [56] and DYSF [57] deficiencies, our findings allow expansion beyond DMD treatment.
Supplementary Materials
Author Contributions
Conceptualization; methodology; formal analysis, B.D.P.; investigation; validation, E.G.A., H.D.S., B.D.P.; data curation, B.D.P.; writing—original draft preparation, E.G.A., B.D.P.; writing—review and editing, B.D.P., J.D.B.; visualization, B.D.P.; project administration, B.D.P.; supervision, J.D.B. All authors have read and agreed to the published version of the manuscript.
Funding
The Association Belge contre les Maladies neuroMusculaires (ABMM) granted funding to this study.
Institutional Review Board Statement
The animal study protocol was approved by the Ethics Committee of Ghent University (ECD 19/77 and 19/110) and performed in accordance with European guidelines (Directive 2010/63/EU) and ARRIVE guidelines.
Informed Consent Statement
Not applicable.
Data Availability Statement
The raw data presented in this study are available from the corresponding author on reasonable request.
Acknowledgements
Jan De Bleecker participates to the European Reference Network for Neuromuscular Disease (ERN EURO-NMD). Boel De Paepe coordinates the international consortium OSMYO ‘What osmolytes can do for muscle health’. Part of this study was presented at the 9th Neurological Disorders Summit, held from May 06-08 in Barcelona, Spain, organized by the United Scientific Group, and obtained third place for poster presentations. We thank Sophie D’hose for skillful technical assistance.
Conflicts of Interest
The authors declare no conflict of interest.
References
- Aartsma-Rus, A.; Ginjaar, I.B.; Bushby, K. The importance of genetic diagnosis for Duchenne muscular dystrophy. J Med Gen 2016, 53, 145–51. [Google Scholar] [CrossRef] [PubMed]
- Andrews, J.G.; Wahl, R.A. Duchenne and Becker muscular dystrophy in adolescents: current perspectives. Adolescent Health, Medicine and Therapeutics 2018, 9, 53–63. [Google Scholar] [CrossRef] [PubMed]
- Suthar, R.; Sankhyan, N. Duchenne Muscular Dystrophy: A Practice Update. The Indian Journal of Pediatrics 2018, 85, 276–81. [Google Scholar] [CrossRef] [PubMed]
- Constantin, B. Dystrophin complex functions as a scaffold for signalling proteins. Biochimica et Biophysica Acta (BBA) - Biomembranes 2014, 1838, 635–42. [Google Scholar] [CrossRef] [PubMed]
- Soblechero-Martín, P.; Albiasu-Arteta, E.; Anton-Martinez, A.; de la Puente-Ovejero, L.; Garcia-Jimenez, I.; González-Iglesias, G.; Larrañaga-Aiestaran, I.; López-Martínez, A.; Poyatos-García, J.; Ruiz-Del-Yerro, E.; Gonzalez, F.; Arechavala-Gomeza, V. Duchenne muscular dystrophy cell culture models created by CRISPR/Cas9 gene editing and their application in drug screening. Scientific Reports 2021, 11, 18188. [Google Scholar] [CrossRef] [PubMed]
- Grounds, M.D.; Terrill, JR.; Al-Mshhdani, B.A.; Duong, M.N.; Radley-Crabb, H.G.; Arthur, P.G. Biomarkers for Duchenne muscular dystrophy: myonecrosis, inflammation and oxidative stress. Disease Models & Mechanisms 2020, 13, dmm043638. [Google Scholar] [CrossRef]
- Wu, M.; Li, H.; He, J.; Liang, J.; Liu, Y.; Zhang, W. TRIM72 Alleviates Muscle Inflammation in mdx Mice via Promoting Mitophagy-Mediated NLRP3 Inflammasome Inactivation. Oxidative Medicine and Cellular Longevity 2023, 2023, 8408574. [Google Scholar] [CrossRef]
- Van Putten, M.; Putker, K.; Overzier, M.; Adamzek, W.A.; Pasteuning-Vuhman, S.; Plomp, J.J.; Aartsma-Rus, A. Natural disease history of the D2-mdx mouse model for Duchenne muscular dystrophy. FASEB J 2019, 33, 8110–8124. [Google Scholar] [CrossRef] [PubMed]
- Mucha, O.; Kaziród, K.; Podkalicka, P.; Rusin, K.; Dulak, J.; Łoboda, A. Dysregulated Autophagy and Mitophagy in a Mouse Model of Duchenne Muscular Dystrophy Remain Unchanged Following Heme Oxygenase-1 Knockout. Int J Mol Sci 2021, 23, 470. [Google Scholar] [CrossRef]
- Frudd, K.; Burgoyne, T.; Burgoyne, J.R. Oxidation of Atg3 and Atg7 mediates inhibition of autophagy. Nature Communications 2018, 9, 95. [Google Scholar] [CrossRef]
- Collier, J.J.; Suomi, F.; Oláhová, M.; McWilliams, T.G.; Taylor, R.W. Emerging roles of ATG7 in human health and disease. EMBO Molecular Medicine 2021, 13, e14824. [Google Scholar] [CrossRef] [PubMed]
- Gammoh, N. The multifaceted functions of ATG16L1 in autophagy and related processes. Journal of Cell Science 2020, 133, jcs249227. [Google Scholar] [CrossRef] [PubMed]
- McWilliams, T.G.; Barini, E.; Pohjolan-Pirhonen, R.; Brooks, S.P.; Singh, F.; Burel, S.; Balk, K.; Kumar, A.; Montava-Garriga, L.; Prescott, A.R.; Hassoun, S.M.; Mouton-Liger, F.; Ball, G.; Hills, R.; Knebel, A.; Ulusoy, A.; Di Monte, D.A.; Tamjar, J.; Antico, O.; Fears, K.; Smith, L.; Brambilla, R.; Palin, E.; Valori, M.; Eerola-Rautio, J.; Tienari, P.; Corti, O.; Dunnett, S.B.; Ganley, I.G.; Suomalainen, A.; Muqit, M.M.K. Phosphorylation of Parkin at serine 65 is essential for its activation in vivo. Open Biology 2018, 8, 180108. [Google Scholar] [CrossRef]
- Sebori, R.; Kuno, A.; Hosoda, R.; Hayashi, T.; Horio, Y. Resveratrol Decreases Oxidative Stress by Restoring Mitophagy and Improves the Pathophysiology of Dystrophin-Deficient mdx Mice. Oxidative Medicine and Cellular Longevity 2018, 2018, 9179270. [Google Scholar] [CrossRef] [PubMed]
- McGreevy, J.W.; Hakim, C.H.; McIntosh, M.A.; Duan, D. Animal models of Duchenne muscular dystrophy: from basic mechanisms to gene therapy. Disease Models & Mechanisms 2015, 8, 195–213. [Google Scholar] [CrossRef]
- Willmann, R.; Possekel, S.; Dubach-Powell, J.; Meier, T.; Ruegg, M.A. Mammalian animal models for Duchenne muscular dystrophy. Neuromuscular Disorders 2009, 19, 241–9. [Google Scholar] [CrossRef]
- Wells, D.J. Tracking progress: an update on animal models for Duchenne muscular dystrophy. Disease Models & Mechanisms 2018, 11, dmm035774. [Google Scholar] [CrossRef]
- Grounds, M.D.; Radley, H.G.; Lynch, G.S.; Nagaraju, K.; De Luca, A. Towards developing standard operating procedures for pre-clinical testing in the mdx mouse model of Duchenne muscular dystrophy. Neurobiology of Disease 2008, 31, 1–19. [Google Scholar] [CrossRef]
- Panza, E.; Vellecco, V.; Iannotti, F.A.; Paris, D.; Manzo, O.L.; Smimmo, M.; Mitilini, N.; Boscaino, A.; de Dominicis, G.; Bucci, M.; Di Lorenzo, A.; Cirino, G. Duchenne's muscular dystrophy involves a defective transsulfuration pathway activity. Redox Biology 2021, 45, 102040. [Google Scholar] [CrossRef] [PubMed]
- Markati, T.; Oskoui, M.; Farrar, M.A.; Duong, T.; Goemans, N.; Servais, L. Emerging therapies for Duchenne muscular dystrophy. The Lancet Neurology 2022, 21, 814–829. [Google Scholar] [CrossRef]
- Reid, A.L.; Alexander, M.S. The Interplay of Mitophagy and Inflammation in Duchenne Muscular Dystrophy. Life (Basel) 2021, 11, 648. [Google Scholar] [CrossRef] [PubMed]
- Herbelet, S.; De Paepe, B.; De Bleecker, J.L. Abnormal NFAT5 Physiology in Duchenne Muscular Dystrophy Fibroblasts as a Putative Explanation for the Permanent Fibrosis Formation in Duchenne Muscular Dystrophy. International Journal of Molecular Sciences 2020, 21, 7888. [Google Scholar] [CrossRef] [PubMed]
- Merckx, C.; De Paepe, B. The Role of Taurine in Skeletal Muscle Functioning and Its Potential as a Supportive Treatment for Duchenne Muscular Dystrophy. Metabolites 2022, 12, 193. [Google Scholar] [CrossRef]
- Merckx, C.; Zschüntzsch, J.; Meyer, S.; Raedt, R.; Verschuere, H.; Schmidt, J.; De Paepe, B.; De Bleecker, J.L. Exploring the Therapeutic Potential of Ectoine in Duchenne Muscular Dystrophy: Comparison with Taurine, a Supplement with Known Beneficial Effects in the mdx Mouse. International Journal of Molecular Sciences 2022, 23, 9567. [Google Scholar] [CrossRef] [PubMed]
- Czech, L.; Hermann, L.; Stöveken, N.; Richter, A.A.; Höppner, A.; Smits, S.H.J.; Heider, J.; Bremer, E. Role of the Extremolytes Ectoine and Hydroxyectoine as Stress Protectants and Nutrients: Genetics, Phylogenomics, Biochemistry, and Structural Analysis. Genes (Basel) 2018, 9, 177. [Google Scholar] [CrossRef] [PubMed]
- Bownik, A.; Stępniewska, Z. Ectoine as a promising protective agent in humans and animals. Arh Hig Rada Toksikol 2016, 67, 260–265. [Google Scholar] [CrossRef] [PubMed]
- Barbiera, A.; Sorrentino, S.; Lepore, E.; Carfì, A.; Sica, G.; Dobrowolny, G.; Scicchitano, B.M. Taurine Attenuates Catabolic Processes Related to the Onset of Sarcopenia. International journal of molecular sciences 2020, 21, 8865–5. [Google Scholar] [CrossRef] [PubMed]
- Rouschop, K.M.; van den Beucken, T.; Dubois, L.; Niessen, H.; Bussink, J.; Savelkouls. K.; Keulers, T.; Mujcic, H.; Landuyt, W.; Voncken. J.W.; Lambin, P.; van der Kogel, A.J.; Koritzinsky, M.; Wouters, B.G. The unfolded protein response protects human tumor cells during hypoxia through regulation of the autophagy genes MAP1LC3B and ATG5. The Journal of clinical investigation 2010, 120, 127–41. [Google Scholar] [CrossRef] [PubMed]
- Pyo, J.O.; Yoo, S.M.; Ahn, H.H.; Nah, J.; Hong, S.H.; Kam, T.I.; Jung, S.; Jung, Y.K. Overexpression of Atg5 in mice activates autophagy and extends lifespan. Nature Communication 2013, 4, 2300. [Google Scholar] [CrossRef]
- Sin, J.; Andres, A.M.; Taylor, D.J.R.; Weston, T.; Hiraumi, Y.; Stotland, A.; Kim, B.J.; Huang, C.; Doran, K.S.; Gottlieb, R.A. Mitophagy is required for mitochondrial biogenesis and myogenic differentiation of C2C12 myoblasts. Autophagy 2016, 12, 369–380. [Google Scholar] [CrossRef]
- Paolini, A.; Omairi, S.; Mitchell, R.; Vaughan, D.; Matsakas, A.; Vaiyapuri, S.; Ricketts, T.; Rubinsztein, D.C.; Patel, K. Attenuation of autophagy impacts on muscle fibre development, starvation induced stress and fibre regeneration following acute injury. Scientific Reports 2018, 8, 9062. [Google Scholar] [CrossRef] [PubMed]
- Hamaoui, D.; Subtil, A. ATG16L1 functions in cell homeostasis beyond autophagy. FEBS J 2022, 289, 1779–1800. [Google Scholar] [CrossRef] [PubMed]
- Rodriguez-Outeiriño, L.; Hernandez-Torres, F.; Ramirez de Acuña, F.; Rastrojo, A.; Creus, C.; Carvajal, A.; Salmeron, L.; Montolio, M.; Soblechero-Martin, P.; Arechavala-Gomeza, V.; Franco, D.; Aranega, A.E. miR-106b is a novel target to promote muscle regeneration and restore satellite stem cell function in injured Duchenne dystrophic muscle. Molecular Therapy Nucleic Acids 2022, 29, 769–786. [Google Scholar] [CrossRef] [PubMed]
- Lozano-Velasco, E.; Vallejo, D. , Esteban. FJ.; Doherty, C.; Hernández-Torres, F.; Franco, D.; Aránega, A.E. A Pitx2-MicroRNA Pathway Modulates Cell Proliferation in Myoblasts and Skeletal-Muscle Satellite Cells and Promotes Their Commitment to a Myogenic Cell Fate. Molecular Cell Biology 2015, 35, 2892–909. [Google Scholar] [CrossRef]
- Aránega, A.E.; Lozano-Velasco, E.; Rodriguez-Outeiriño, L.; Ramírez de Acuña, F.; Franco, D.; Hernández-Torres, F. MiRNAs and Muscle Regeneration: Therapeutic Targets in Duchenne Muscular Dystrophy. International Journal of Molecular Sciences 2021, 22, 4236. [Google Scholar] [CrossRef] [PubMed]
- Zhai, Z.; Wu, F.; Chuang, A.Y.; Kwon, J.H. miR-106b fine tunes ATG16L1 expression and autophagic activity in intestinal epithelial HCT116 cells. Inflammatory Bowel Diseases 2013, 19, 2295–301. [Google Scholar] [CrossRef] [PubMed]
- Cosemans, G.; Merckx, C.; De Bleecker, J.L.; De Paepe, B. Inducible Heat Shock Protein 70 Levels in Patients and the mdx Mouse Affirm Regulation during Skeletal Muscle Regeneration in Muscular Dystrophy. Frontiers in Bioscience-Scholar 2022, 14, 19. [Google Scholar] [CrossRef] [PubMed]
- Fernández-Fernández, M.R.; Valpuesta, J.M. Hsp70 chaperone: a master player in protein homeostasis. F1000Res 2018, 7, F1000. [Google Scholar] [CrossRef]
- Leu, J.I.; Barnoud, T.; Zhang, G.; Tian, T.; Wei, Z.; Herlyn, M.; Murphy, M.E.; George, D.L. Inhibition of stress-inducible HSP70 impairs mitochondrial proteostasis and function. Oncotarget 2017, 8, 45656–45669. [Google Scholar] [CrossRef]
- Krishna,S. ; Spaulding, H.R.; Quindry, T.S.; Hudson, M.B.; Quindry, J.C.; Selsby, J.T. Indices of Defective Autophagy in Whole Muscle and Lysosome Enriched Fractions From Aged D2-mdx Mice. Front Physiol 2021, 12, 691245. [Google Scholar] [CrossRef]
- Spaulding, H.R.; Ballmann, C.; Quindry, J.C.; Hudson, M.B.; Selsby, J.T. Autophagy in the heart is enhanced and independent of disease progression in mus musculus dystrophinopathy models. JRSM Cardiovasc Dis 2019, 8, 2048004019879581. [Google Scholar] [CrossRef]
- Kuno, A.; Hosoda, R.; Sebori, R.; Hayashi, T.; Sakuragi, H.; Tanabe, M.; Horio, Y. Resveratrol Ameliorates Mitophagy Disturbance and Improves Cardiac Pathophysiology of Dystrophin-deficient mdx Mice. Scientific Reports 2018, 8, 15555. [Google Scholar] [CrossRef] [PubMed]
- Nakashima, R.; Hosoda, R.; Tatekoshi, Y.; Iwahara, N.; Saga, Y.; Kuno, A. Transcriptional dysregulation of autophagy in the muscle of a mouse model of Duchenne muscular dystrophy. Scientific Reports 2024, 14, 1365. [Google Scholar] [CrossRef]
- Kang, C.; Badr, M.A.; Kyrychenko, V.; Eskelinen, E.L.; Shirokova, N. Deficit in PINK1/PARKIN-mediated mitochondrial autophagy at late stages of dystrophic cardiomyopathy. Cardiovasc Res 2018, 114, 90–102. [Google Scholar] [CrossRef] [PubMed]
- De Palma, C.; Morisi, F.; Cheli, S.; Pambianco, S.; Cappello, V.; Vezzoli, M.; Rovere-Querini, P.; Moggio, M.; Ripolone, M.; Francolini, M.; Sandri, M.; Clementi, E. Autophagy as a new therapeutic target in Duchenne muscular dystrophy. Cell Death Discovery 2012, 3, e418. [Google Scholar] [CrossRef]
- Zhou, S.; Lei, S.; She, Y.; Shi, H.; Li, Y.; Zhou, X.; Chen, R. Running improves muscle mass by activating autophagic flux and inhibiting ubiquitination degradation in mdx mice. Gene 2024, 899, 148136. [Google Scholar] [CrossRef]
- Mucha, O.; Myszka, M.; Podkalicka, P.; Świderska, B.; Malinowska, A.; Dulak, J.; Łoboda, A. Proteome Profiling of the Dystrophic mdx Mice Diaphragm. Biomolecules 2023, 13, 1648. [Google Scholar] [CrossRef] [PubMed]
- Spaulding, H.R.; Kelly, E.M.; Quindry, J.C.; Sheffield, J.B.; Hudson, M.B.; Selsby, J.T. Autophagic dysfunction and autophagosome escape in the mdx mus musculus model of Duchenne muscular dystrophy. Acta Physiol (Oxf) 2018, 222. [Google Scholar] [CrossRef]
- Herhaus, L. TBK1 (TANK-binding kinase 1)-mediated regulation of autophagy in health and disease. Matrix Biology 2021, 100-101, 84–98. [Google Scholar] [CrossRef]
- Heo, J.M.; Ordureau, A.; Paulo, J.A.; Rinehart, J.; Harper, J.W. The PINK1-PARKIN Mitochondrial Ubiquitylation Pathway Drives a Program of OPTN/NDP52 Recruitment and TBK1 Activation to Promote Mitophagy. Molecular Cell 2015, 60, 7–20. [Google Scholar] [CrossRef]
- Hu, L.; Xie, H.; Liu, X.; Potjewyd, F.; James, L.I.; Wilkerson, E.M.; Herring, L.E.; Xie, L.; Chen, X.; Cabrera, J.C.; Hong, K.; Liao, C.; Tan, X.; Baldwin, A.S.; Gong, K.; Zhang, Q. TBK1 Is a Synthetic Lethal Target in Cancer with VHL Loss. Cancer Discovery 2020, 10, 460–475. [Google Scholar] [CrossRef] [PubMed]
- Ahmad, L.; Zhang, S.Y.; Casanova, J.L.; Sancho-Shimizu, V. Human TBK1: A Gatekeeper of Neuroinflammation. Trends in Molecular Medicine 2016, 22, 511–527. [Google Scholar] [CrossRef] [PubMed]
- Pizon, V.; Rybina, S.; Gerbal, F.; Delort, F.; Vicart, P.; Baldacci, G.; Karsenti, E. MURF2B, a novel LC3-binding protein, participates with MURF2A in the switch between autophagy and ubiquitin proteasome system during differentiation of C2C12 muscle cells. PLoS One 2013, 8, e76140. [Google Scholar] [CrossRef] [PubMed]
- Dimauro, I.; Pearson, T.; Caporossi, D.; Jackson, M.J. A simple protocol for the subcellular fractionation of skeletal muscle cells and tissue. BMC Research Notes 2012, 5, 513. [Google Scholar] [CrossRef] [PubMed]
- Castets, P.; Frank, S.; Sinnreich, M.; Rüegg, M.A. "Get the Balance Right": Pathological Significance of Autophagy Perturbation in Neuromuscular Disorders. Journal of Neuromuscular Diseases 2016, 3, 127–155. [Google Scholar] [CrossRef]
- Grumati, P.; Coletto, L.; Sabatelli, P.; Cescon, M.; Angelin, A.; Bertaggia, E.; Blaauw, B.; Urciuolo, A.; Tiepolo, T.; Merlini, L.; Maraldi, N.M.; Bernardi, P.; Sandri, M.; Bonaldo, P. Autophagy is defective in collagen VI muscular dystrophies, and its reactivation rescues myofiber degeneration. Nature Medicine 2010, 16, 1313–20. [Google Scholar] [CrossRef]
- Fanin, M.; Nascimbeni, A.C.; Angelini, C. Muscle atrophy, ubiquitin-proteasome, and autophagic pathways in dysferlinopathy. Muscle Nerve 2014, 50, 340–347. [Google Scholar] [CrossRef]
Figure 1.
Protein levels in extensor digitorum longus muscle of 26-weeks-old mice. Four total protein samples were prepared from individual healthy controls (BL 10) and MDX mice. (A) Proteins bands for autophagy related 5 (ATG5), autophagy related 7 (ATG7), Microtubule-associated protein 1A/1B-light chain 3 (LC3) and parkin (PRKN) are shown. (B) Graphic representation of protein levels reported as relative values to glyceraldehyde-3-phosphate dehydrogenase (GAPDH). Significant difference was observed in the ratio of phosphatidylethanolamine conjugated LC3 (LC3 II) over unconjugated LC3 (LC3 I), p=0.03 (*) between the BL 10 and MDX group, tested with unpaired t test. Other protein levels were not significantly different (ns). Graphs and statistical analyses were generated with GraphPad Prism. Full blots and GAPDH blots are provided as a supplement.

Figure 2.
Immunofluorescent staining in soleus muscle of 4-weeks-old (A-C) and tibialis anterior muscle of 12-weeks old (D-I) MDX. (A) Sarcoplasmic staining for autophagy related 16 like 1 (ATG16L1; AlexaFluor 488, green) is observed in most muscle fibers (B) Strong staining for neural cell adhesion molecule (NCAM; CY3, red) is present in a cluster of small perifascicular muscle fibers (C), and in these muscle fibers ATG16L1 is absent (D). Strong sarcoplasmic heat shock protein 70 (HSP70) staining (CY3, red) in a necrotic muscle fiber. (E) Macrophages are identified as F4-80 positive (AlexaFluor 488, green) (F) Double staining shows HSP70 positivity in the muscle fiber’s sarcoplasm and in part of the macrophages. (G) The sarcoplasm of a muscle fiber stains strongly for SQSTM1 (AlexaFluor 488, green). Several NCAM positive (CY3, red) muscle fibers can be observed in the vicinity (H), while the SQSTM1 positive muscle fiber is NCAM negative (I). Scale bars=100µM (A-C) 50µm (D-I).
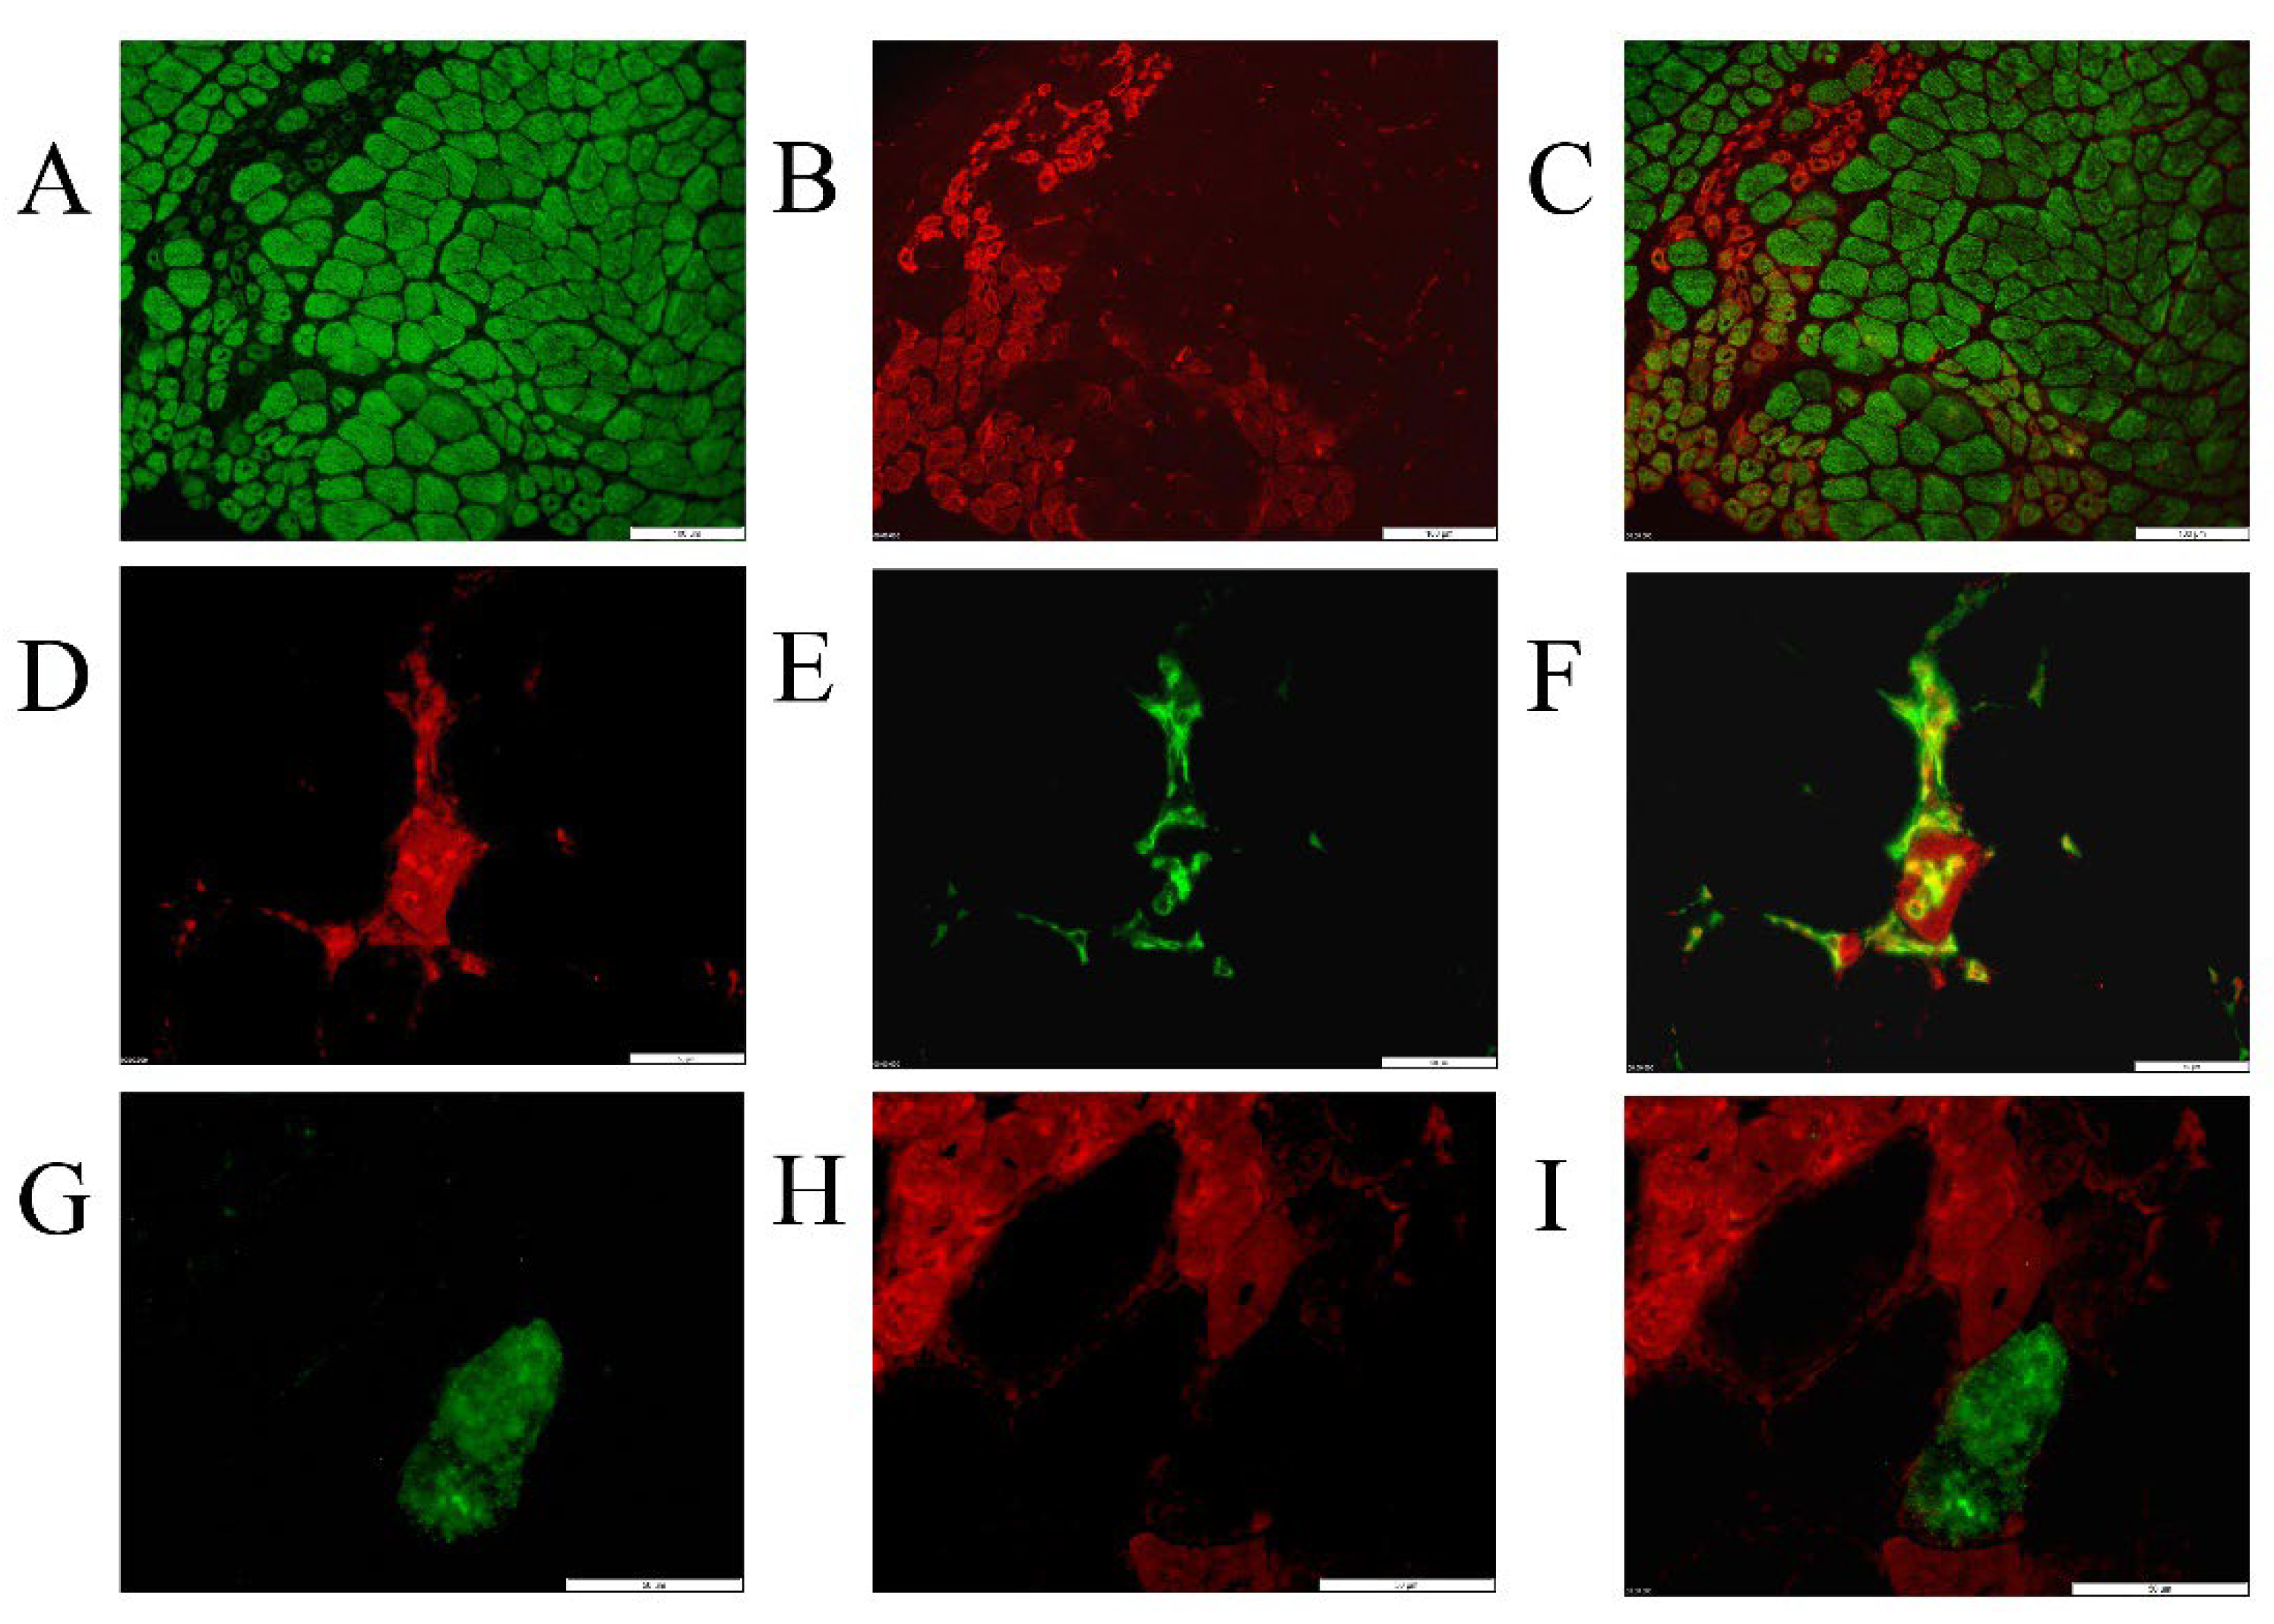
Figure 3.
Protein levels in extensor digitorum longus muscle of untreated and ectoine-treated mice. Two total protein samples were prepared per group by pooling muscles from two individual mice. (A) Protein bands for autophagy related 5 (ATG5), autophagy related 7 (ATG7), Microtubule-associated protein 1A/1B-light chain 3 conjugated to phosphatidylethanolamine (LC3 II), sequestosome 1 (SQSTM1) and parkin (PRKN) are shown in control black 10 mice (BL 10), MDX treated with ectoine in the drinking water (ECT DW), ectoine administered via intraperitoneal injection (ECT IP), and intraperitoneal saline (SAL IP) serving as a treatment control. (B) Graphic representation of protein levels reported as values relative to glyceraldehyde-3-phosphate dehydrogenase (GAPDH). Significant changes were observed for ATG5 levels, with adjusted p=0.02 between BL 10 and MDX DW ECT (*), and p=0.04 between MDX IP ECT and MDX DW ECT (*), tested with Brown-Forsyth and Welch ANOVA for multiple comparisons. Graphs and statistical analyses were generated with GraphPad Prism. Full blots and GAPDH blots are provided as a supplement.
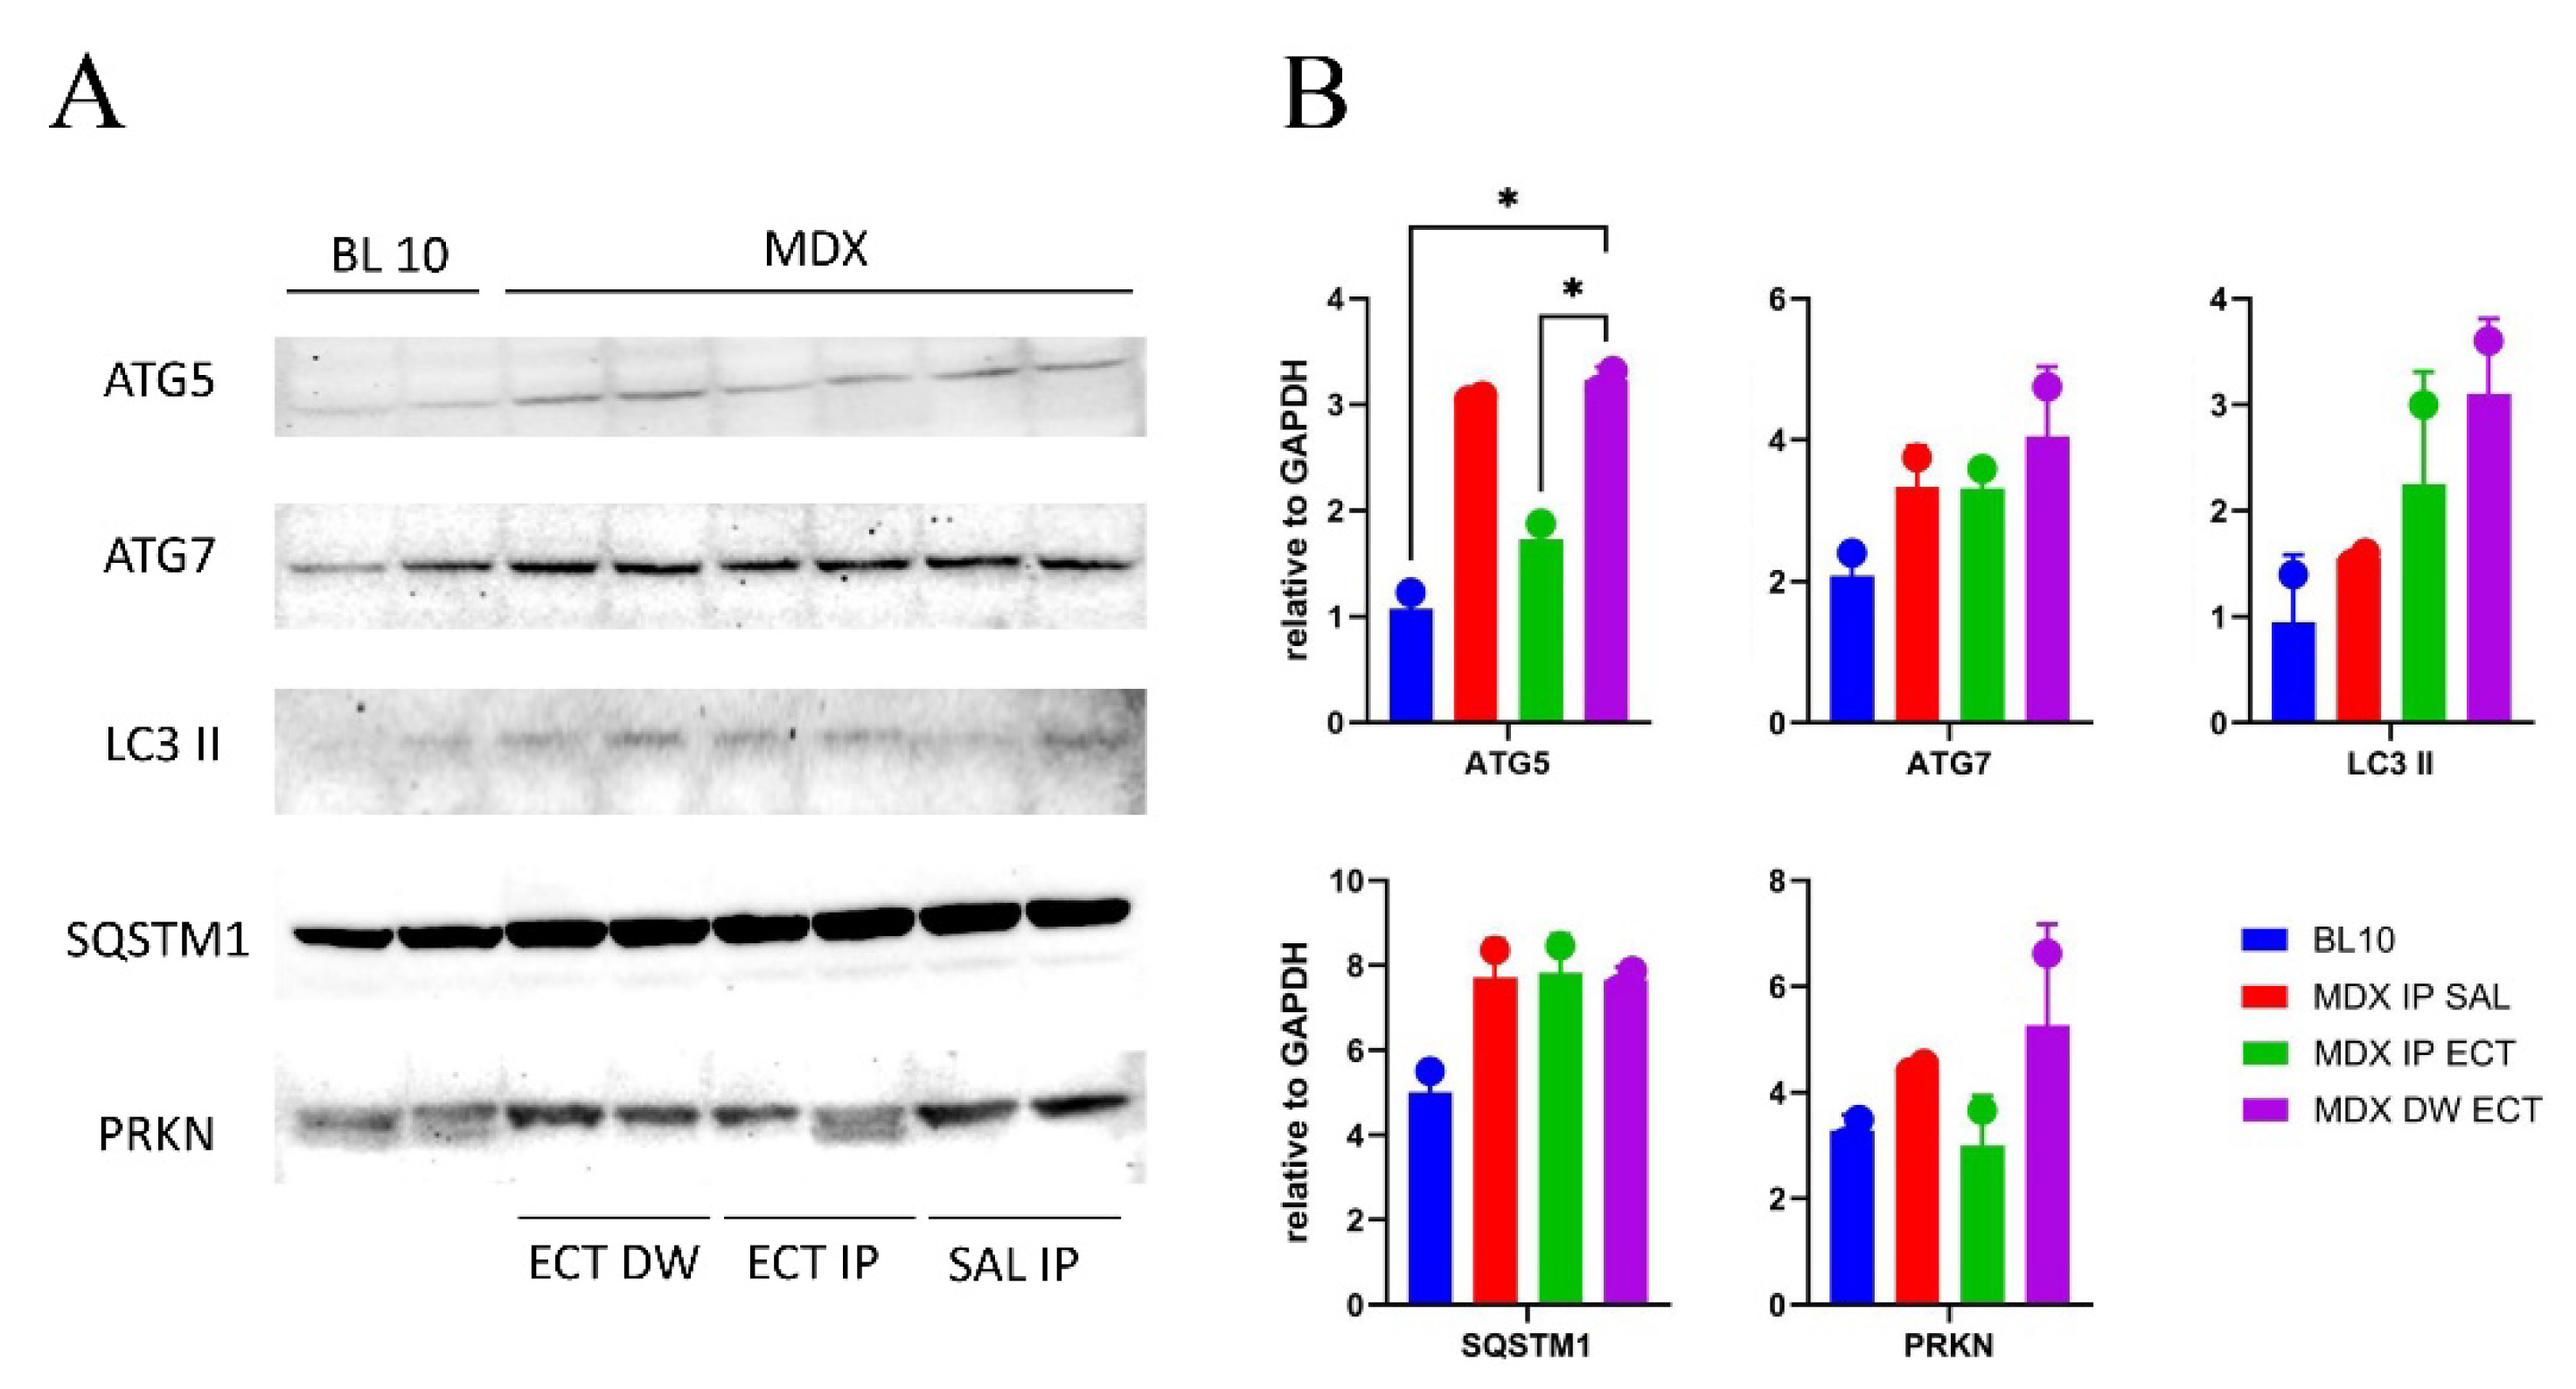
Figure 4.
Protein levels in gastrocnemius muscle of untreated and ectoine-treated mice. Total protein samples were prepared from three individual mice per group. (A) Protein bands for heat shock protein 70 (HSP70), voltage dependent anion channels (VDAC), parkin (PRKN), Microtubule-associated protein 1A/1B-light chain 3 conjugated to phosphatidylethanolamine (LC3 II), sequestosome 1 (SQSTM1) and SQSTM1 phosphorylated on its Ser366 residue (p-SQSTM1) are shown in control black 10 mice (BL 10) and in MDX administered saline (SAL) or ectoine (ECT) intraperitoneally (IP). (B) Graphic representation of protein levels reported as relative values to glyceraldehyde-3-phosphate dehydrogenase (GAPDH). Significant changes were observed for HSP70, between BL 10 and MDX IP ECT, with adjusted p=0.009 (**). p-SQSTM1 levels were also significantly increased, with adjusted p=0.003 between BL 10 and MDX IP ECT (**), which remained significant when calculated as a ratio of phosphorylated over total SQSTM1 protein levels, with p=0.006 (**). Graphs and statistical analyses with Brown-Forsyth and Welch ANOVA for multiple comparisons were generated with GraphPad Prism. Full blots and GAPDH blots are provided as a supplement.
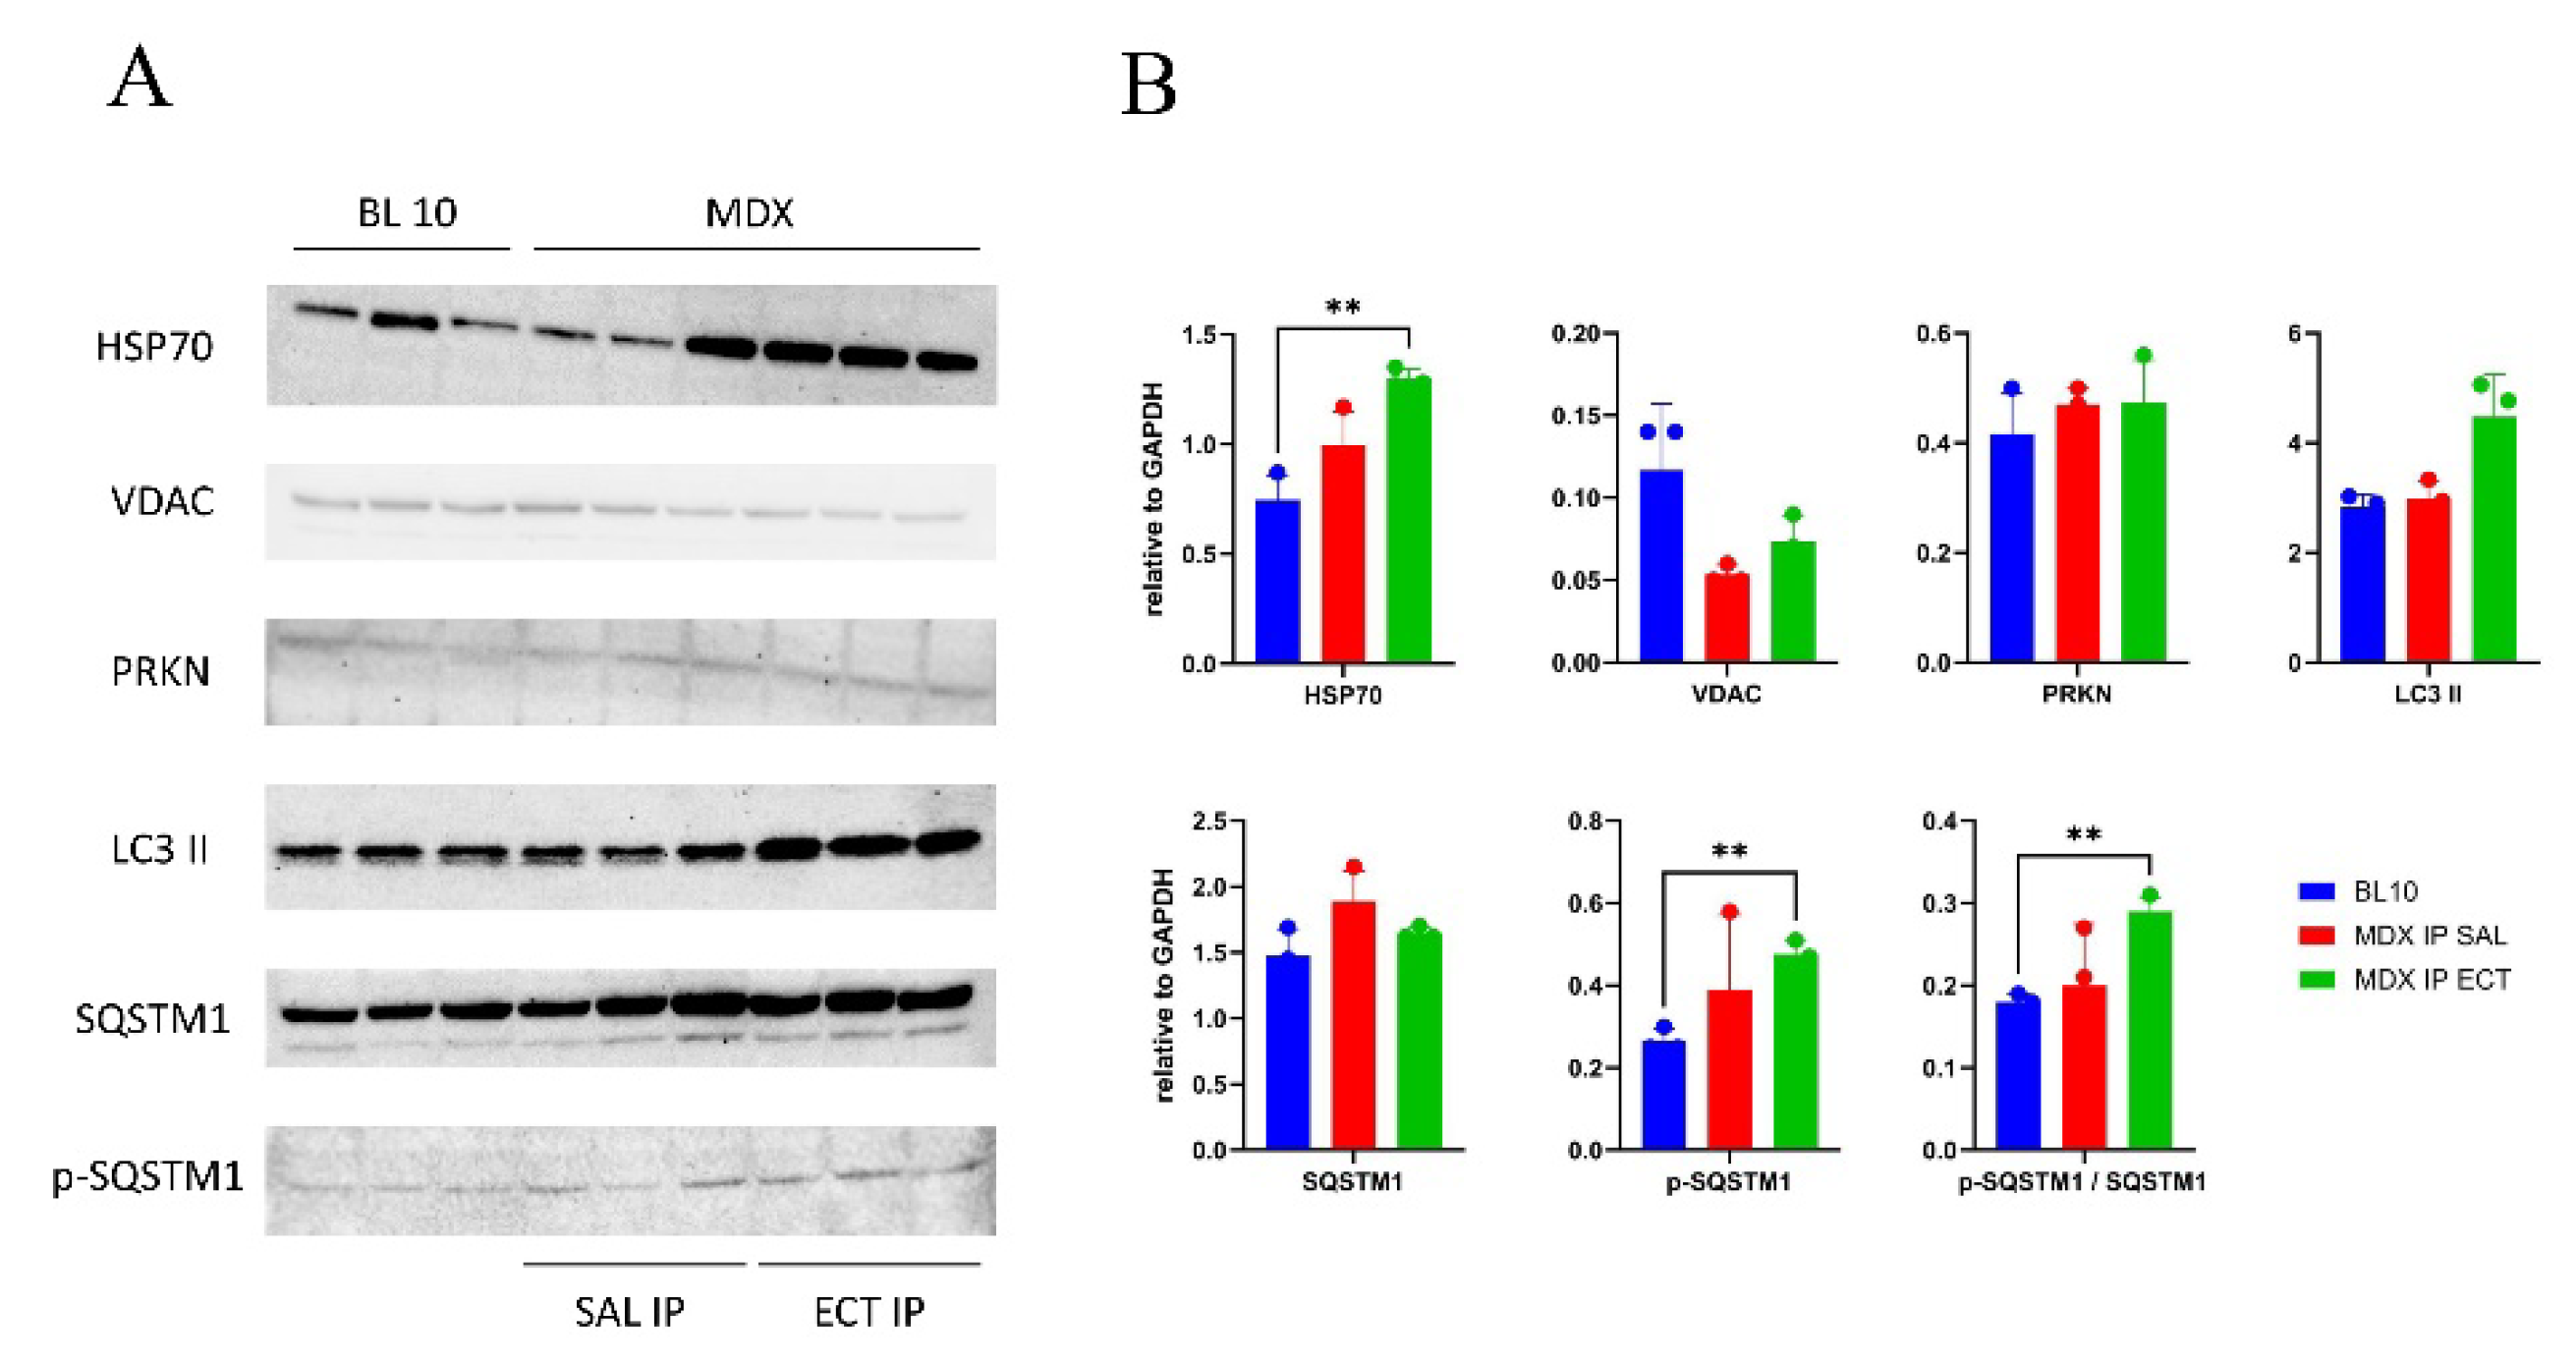
Figure 5.
Immunofluorescent staining for LC3 II in tibialis anterior muscle of healthy controls (BL 10) (A-B) and ectoine-treated MDX (C-F). Macrophages (AlexaFluor 488, green) were co-stained for 1A/1B-light chain 3 conjugated to phosphatidylethanolamine LC3 II (CY3, red). Low numbers of endomysial macrophages in a BL 10 tissue (A), with infrequent partial sarcolemmal LC3 II staining on some muscle fibers (B). In an MDX treated with intraperitoneal ectoine, macrophage staining localizes a necrotic invaded muscle fiber (C), which is LC3 II negative (D) (asterisk). In an MDX treated with ectoine in the drinking water, macrophages are abundant (E) A small muscle fiber surrounded by an inflammatory infiltrate is strongly LC 3 II positive (F) (arrow). Scale bars=50µm.
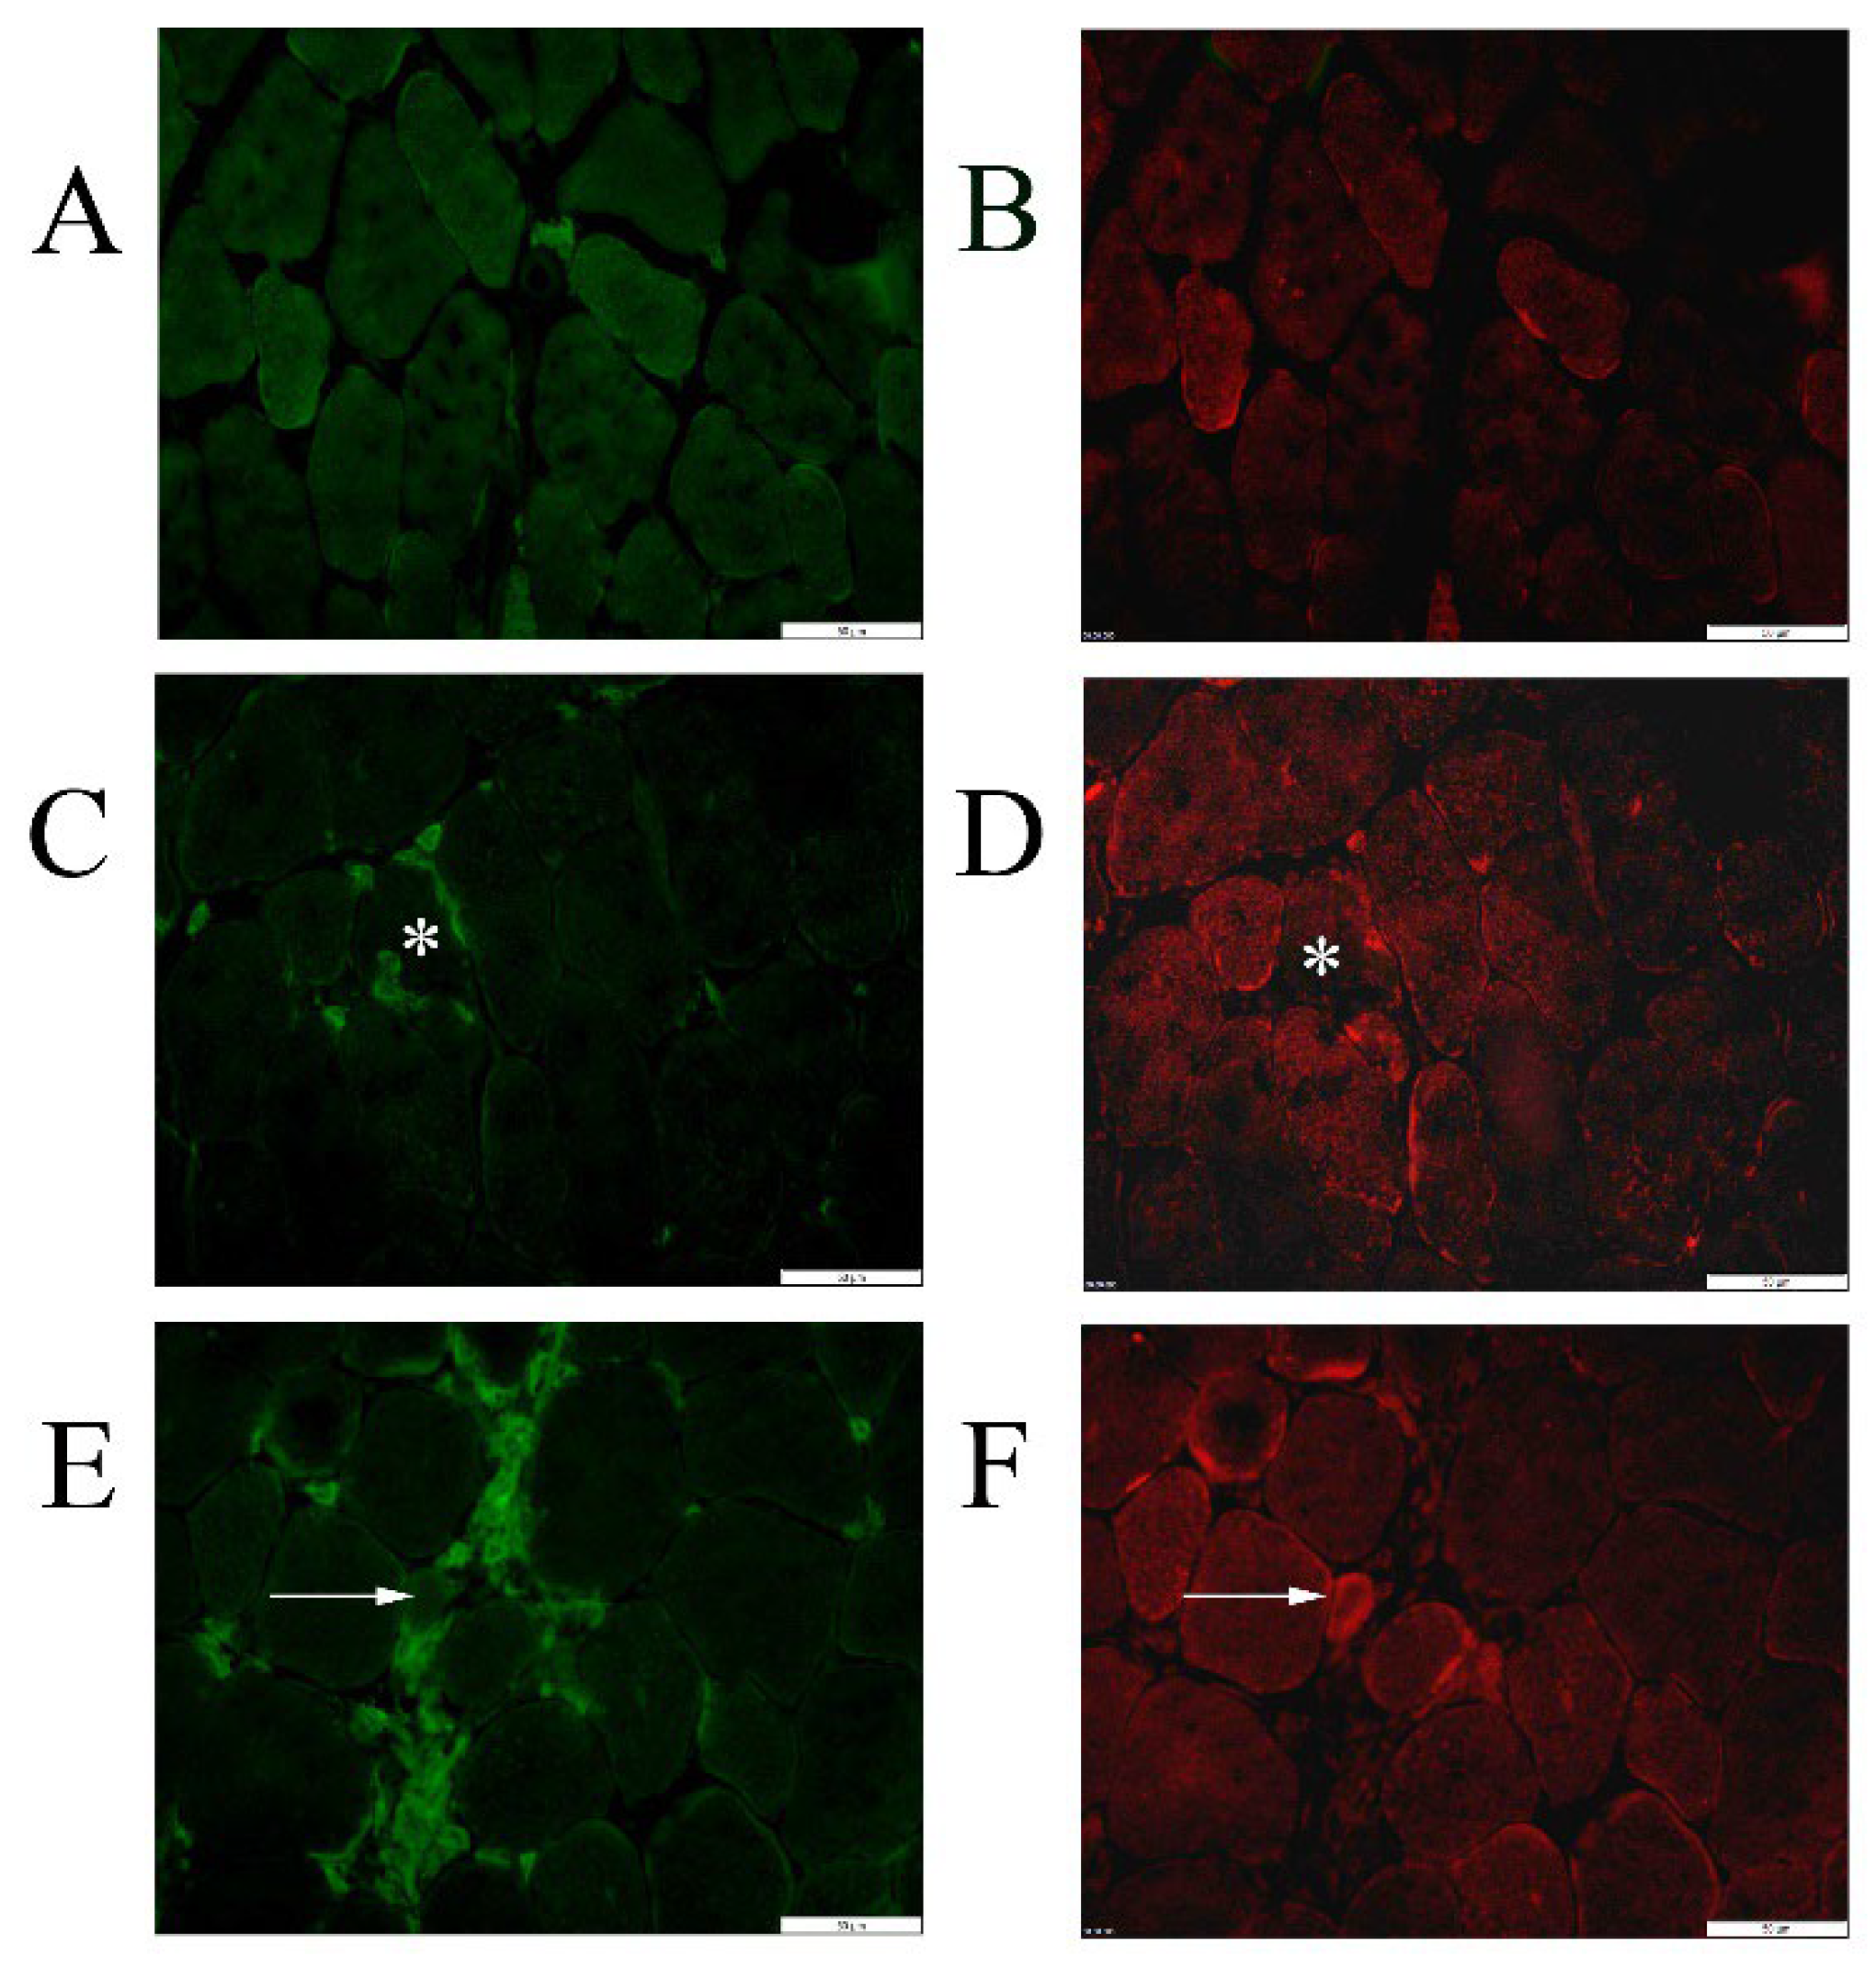
Figure 6.
Mitochondrial protein levels in soleus muscle of untreated and ectoine-treated mice. Two mitochondria-enriched protein samples were prepared per group by pooling soleus muscle from four individual mice (except for the second BL 10 sample which was prepared from three mice). (A) Protein bands for heat shock protein 70 (HSP70), voltage dependent anion channels (VDAC), parkin (PRKN), Microtubule-associated protein 1A/1B-light chain 3 (LC3) are shown in control black 10 mice (BL 10) and in MDX administered saline (SAL), or ectoine (ECT) intraperitoneally (IP) or in the drinking water (DW). (B) Graphic representation of protein levels reported as relative values normalized to total protein content. Significant changes were observed for LC3 II levels, with adjusted p=0.01 between MDX IP ECT and MDX DW ECT (*), significance did not remain when calculated as a ratio of LC3 II over I. Graphs and statistical analyses with Brown-Forsyth and Welch ANOVA for multiple comparisons were generated with GraphPad Prism. Full blots are provided as a supplement.
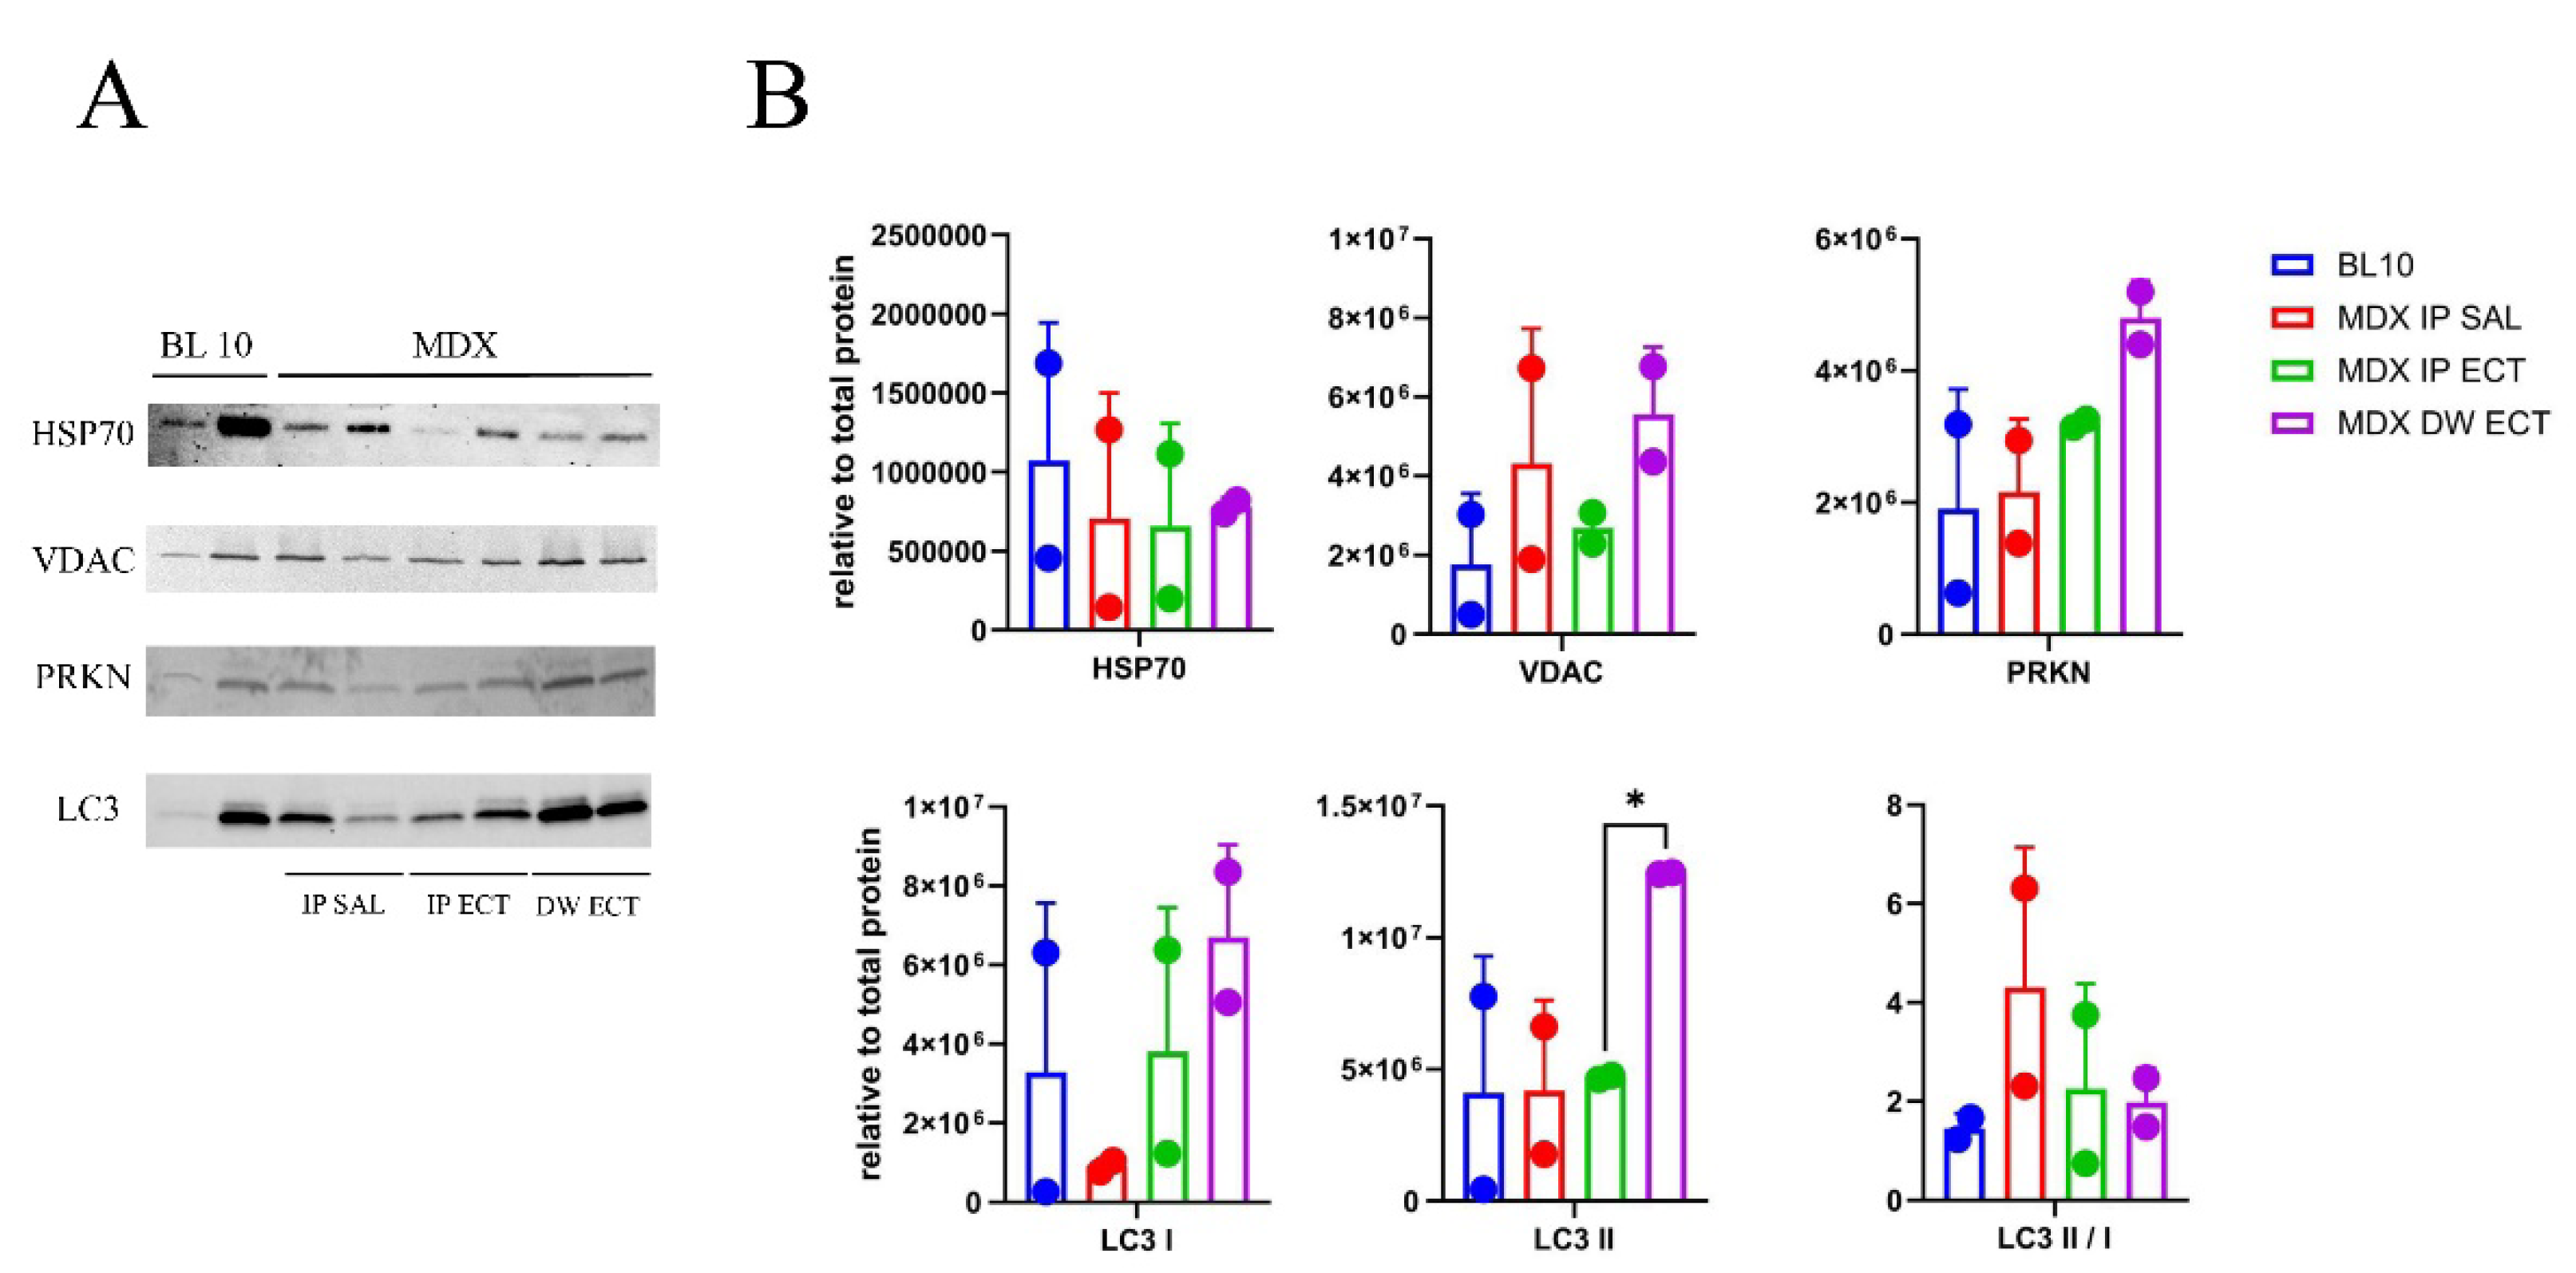
Figure 7.
Autophagic flux in MDX and response to ectoine treatment. Theoretical autophagic flux calculated as the ratio of microtubule-associated protein 1A/1B-light chain 3 conjugated to phosphatidylethanolamine (LC3 II) over sequestosome 1 (SQSTM1), presented as relative to the ratio in healthy control mice set to 1.0. Autophagic flux is diminished in gastrocnemius (GAS) and extensor digitorum longus (EDL) muscle of MDX administered saline (SAL), but is increased in MDX treated with ectoine (ECT) intraperitoneally (IP) or in the drinking water (DW). Graphs were generated with GraphPad Prism.
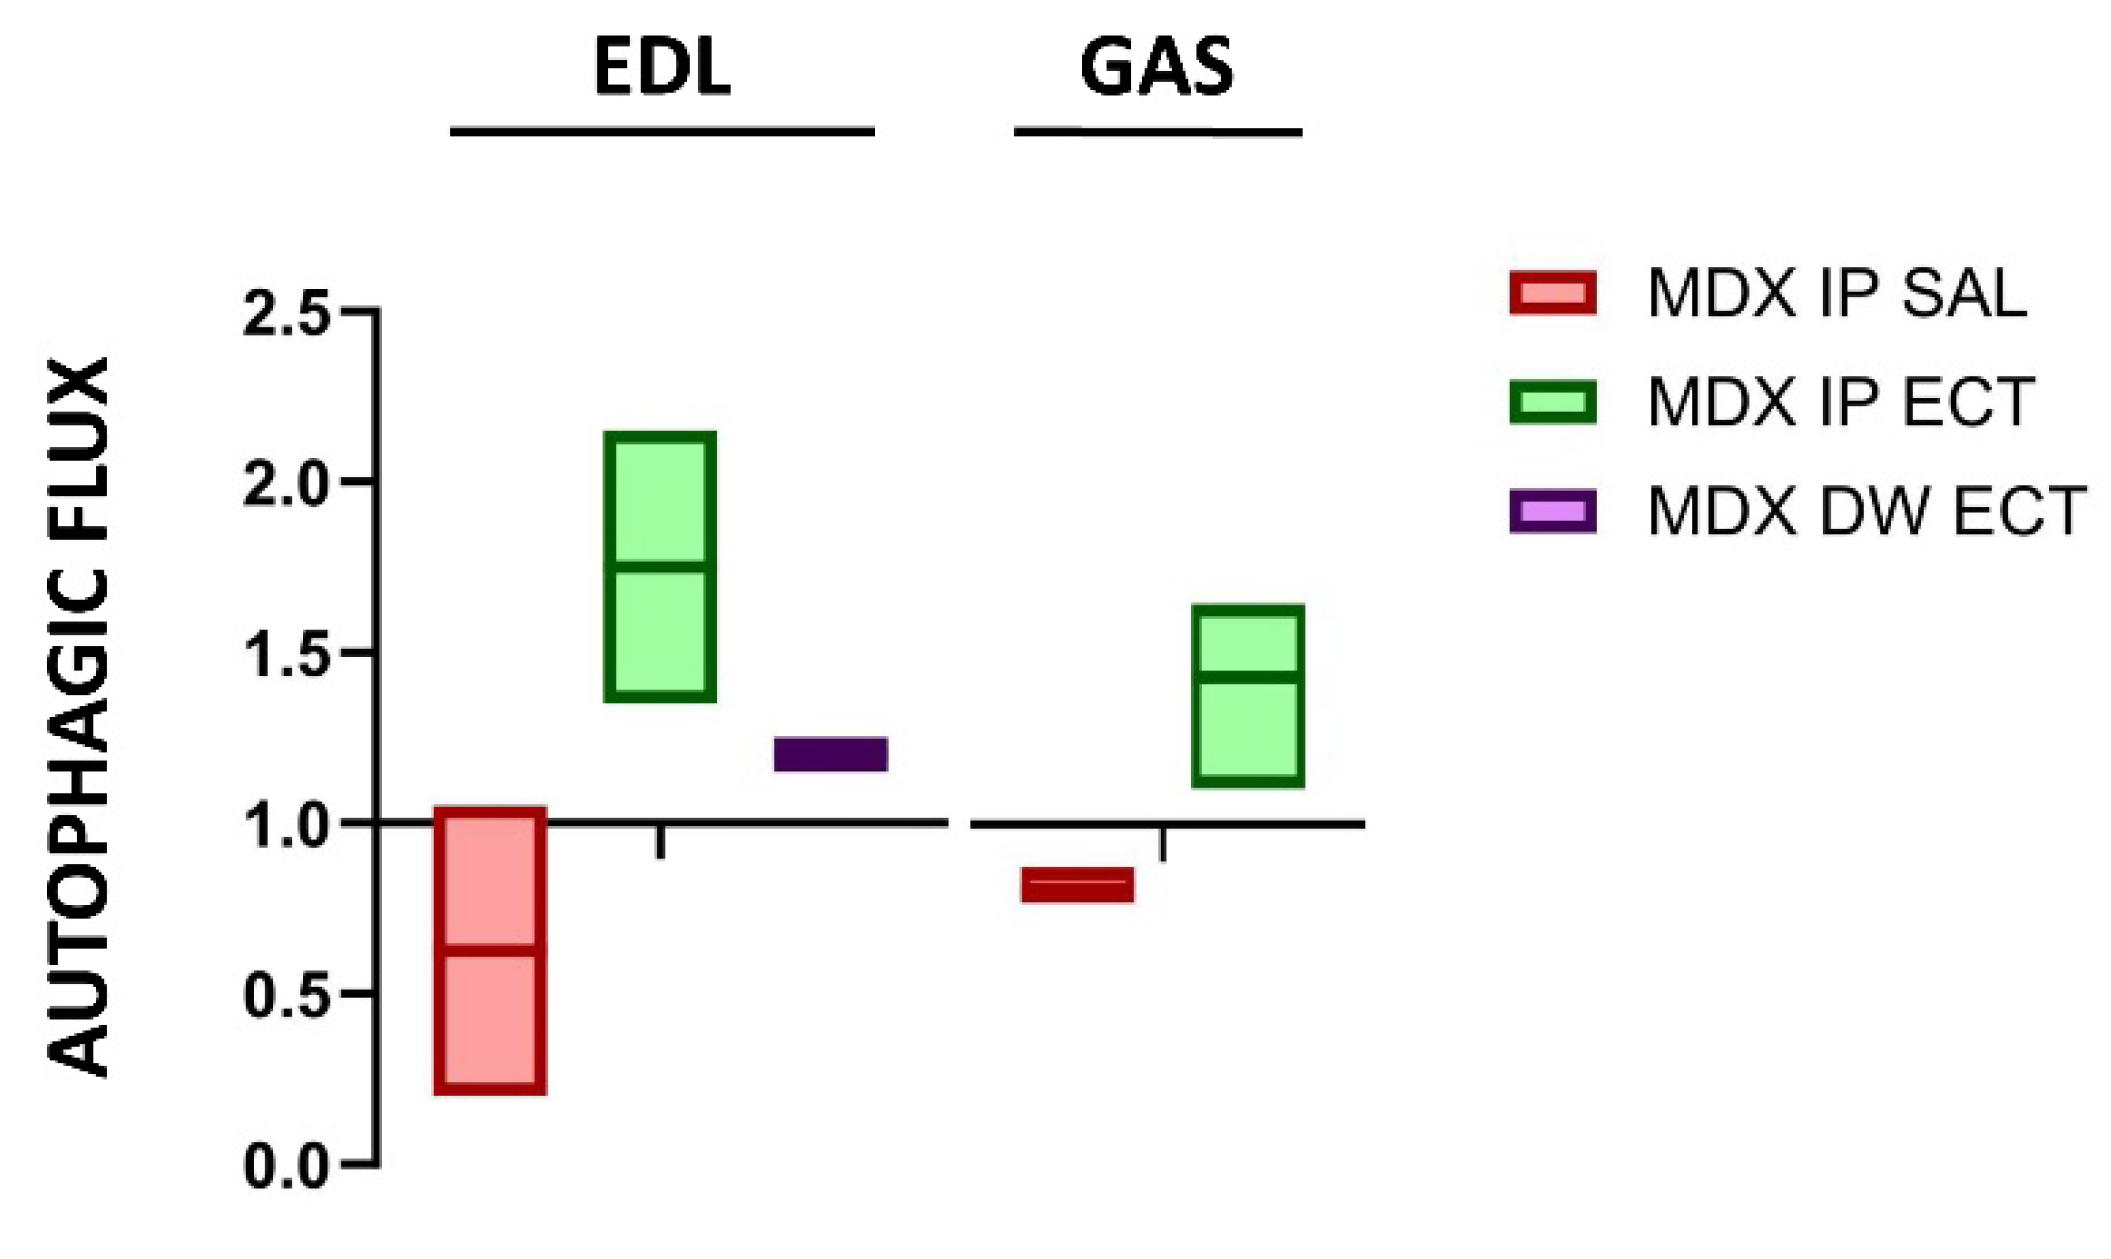

Table 1.
Comparison of microtubule-associated protein 1A/1B-light chain 3 and sequestosome 1 protein levels between healthy mice (BL 10) and MDX.
Table 1.
Comparison of microtubule-associated protein 1A/1B-light chain 3 and sequestosome 1 protein levels between healthy mice (BL 10) and MDX.
| Marker | Muscle | Age | Regulation | Reference |
|---|---|---|---|---|
| LC3 I | gastrocnemius | 11 months | D2-MDX > BL 10 | [40] |
| diaphragm | 11 months | D2-MDX > BL 10 | [40] | |
| heart | 7 weeks | MDX ≅ BL 10 | [41] | |
| heart | 5.5 months | MDX > BL 10 | [42] | |
| heart | 14 months | MDX ≅ BL 10 | [41] | |
| heart | 17 months | MDX ≅ BL 10 | [41] | |
| LC3 II | tibialis anterior | 5.5 months | MDX > BL 10 | [43] |
| extensor digitorum longus | 5 weeks | MDX*≅ BL 10 | this study | |
| gastrocnemius | 5 weeks | MDX*≅BL 10 | this study | |
| gastrocnemius | 11 months | D2-MDX ≅ BL 10 | [40] | |
| diaphragm | 11 months | D2-MDX ≅ BL 10 | [40] | |
| heart | 7 weeks | MDX ≅ BL 10 | [41] | |
| heart | 5.5 months | MDX > BL 10 | [42] | |
| heart | 12 months | MDX > BL 10 | [44] | |
| heart | 14 months | MDX < BL 10 | [41] | |
| heart | 17 months | MDX < BL 10 | [41] | |
| LC3 II/I | quadriceps | 5.5 months | MDX > BL 10 | [14] |
| tibialis anterior | 4 months | MDX > BL 10 | [45] | |
| extensor digitorum longus | 6.5 months | MDX > BL 10 | this study | |
| gastrocnemius | 11 months | D2-MDX ≅ BL 10 | [40] | |
| soleus | 3.5 months | MDX < BL 10 | [46] | |
| diaphragm | 6 weeks | MDX > BL 10 | [47] | |
| diaphragm | 3 months | MDX > BL 10 | [47] | |
| diaphragm | 4 months | MDX > BL 10 | [45] | |
| diaphragm | 11 months | D2-MDX ≅ BL 10 | [40] | |
| heart | 14 months | MDX ≅ BL 10 | [41] | |
| SQSTM1 | quadriceps | 5.5 months | MDX > BL 10 | [14] |
| tibialis anterior | 4 months | MDX > BL 10 | [45] | |
| tibialis anterior | 5.5 months | MDX > BL 10 | [43] | |
| extensor digitorum longus | 5 weeks | MDX*≅ BL 10 | this study | |
| gastrocnemius | 5 weeks | MDX*≅ BL 10 | this study | |
| gastrocnemius | 11 months | D2-MDX < BL 10 | [40] | |
| soleus | 3.5 months | MDX > BL 10 | [46] | |
| diaphragm | 4 months | MDX > BL 10 | [45] | |
| diaphragm | 11 months | D2-MDX > BL 10 | [40] | |
| heart | 7 weeks | MDX ≅ BL 10 | [41] | |
| heart | 5.5 months | MDX > BL 10 | [42] | |
| heart | 12 months | MDX > BL 10 | [44] | |
| heart | 14 months | MDX ≅ BL 10 | [41] | |
| heart | 17 months | MDX ≅ BL 10 | [41] |
1 Abbreviations: microtubule-associated protein 1A/1B-light chain 3 unconjugated (LC3 I) and conjugated to phosphatidylethanolamine (LC3 II), sequestosome 1 (SQSTM1). MDX crossed into the DBA/2J genetic background (D2-MDX). MDX treated with intraperitoneal saline (MDX*).
Disclaimer/Publisher’s Note: The statements, opinions and data contained in all publications are solely those of the individual author(s) and contributor(s) and not of MDPI and/or the editor(s). MDPI and/or the editor(s) disclaim responsibility for any injury to people or property resulting from any ideas, methods, instructions or products referred to in the content. |
© 2024 by the authors. Licensee MDPI, Basel, Switzerland. This article is an open access article distributed under the terms and conditions of the Creative Commons Attribution (CC BY) license (http://creativecommons.org/licenses/by/4.0/).
Copyright: This open access article is published under a Creative Commons CC BY 4.0 license, which permit the free download, distribution, and reuse, provided that the author and preprint are cited in any reuse.


