
Submitted:
06 November 2023
Posted:
07 November 2023
You are already at the latest version
Abstract
Treatment of various diseases, in particular cancer, usually needs targeting biologically active molecules at a selected subcellular compartment. We modified our previously developed modular nanotransporters (MNTs) for targeting mitochondria. The new MNTs are capable of binding to the protein predominantly localized on the outer mitochondrial membrane, Keap1. These MNTs possessing antiKeap1 monobody co-localize with mitochondria upon addition to the cells. They efficiently interact with Keap1 both in solution and within living cells. A conjugate of the MNT with a photosensitizer, chlorin e6, demonstrates significantly higher photocytotoxicity than chlorine e6 alone. We assume that MNTs of this kind can improve efficiency of therapeutic photosensitizers and radionuclides emitting short-range particles.
Keywords:
modular nanotransporters
; Keap1
; intracellular delivery
; CETSA
; FLIM-FRET
; FLIM
; thermophoresis
; chlorine e6
; targeting to mitochondria
1. Introduction
Protein-protein interactions (PPI) are the focus of substantial scientific efforts over the past decades. These efforts have resulted in the identification and evaluation of many proteins, including intracellular ones, as potential therapeutic targets [1,2]. Current strategies to modulate intracellular proteins encompass mainly two modalities: macromolecules and small molecules. Although small-molecule inhibitors are highly amenable for some targets, practically speaking, they are mostly restricted to targets with suitable binding pockets, such as enzymes, receptors, and ion channels, leaving a large fraction of cellular proteins out of the scope of their regulation. The specificity problem and unknown mechanism of some small molecules also limit their applicability [3,4]. Macromolecules, for instance, antibodies or antibody-like scaffolds, have addressed some of these concerns, as they could bind large areas on the protein surfaces, undruggable by small molecules. In fact, antibody therapeutics became the standard of care for different diseases, and nearly one hundred and fifty antibodies have been approved for clinical use [5,6]. Remarkably, the majority of clinically used antibodies are limited to transmembrane and secreted protein targets [7,8], excluding intracellular targets, whose overall number is estimated to be two-thirds of the whole cellular proteome [9]. Thereby, the delivery issue has mostly constrained the development of antibody-like molecules as mighty binding tools for intracellular proteins in living cells.
To explore this issue, a spectrum of approaches has been proposed. Transfection-based methods are the mainstay of intracellular antibody delivery [10,11]. However, efficient and safe transfection technologies are yet to be developed, sparking interest in alternative delivery opportunities, such as fusion with cell penetrating peptides (CPP), different types of nanocarriers, lipids, and polymers [12,13,14,15]. In this spirit, we have expanded our modular nanotransporters (MNT) platform to deliver intracellular protein binder inside cells [16,17]. MNT is a technological platform that is designed for targeted intracellular delivery of cytotoxic agents, such as photosensitizers [18,19,20], therapeutic radionuclides (for review, see [17]), and regulatory proteins [21,22,23]. MNTs impart cell specificity to a delivering cargo due to its modules providing "recognition" of the desired target cells and receptor-mediated endocytosis with the subsequent targeted intracellular transport into the desired cellular compartment. An endosomal escape (a necessary step to prevent MNT with cargo from degradation in lysosomes) is mediated via the MNT endosomolytic module. To date, we have successfully implemented MNT-mediated delivery of locally acting agents into the cell nucleus on various animal models, including experimentally induced melanoma, human epidermoid carcinoma, bladder and cervical cancers (reviewed in [16]). Mitochondria are another intracellular target which attracts attention of many investigators dealing with development of anti-cancer medicines, especially because their damage causes apoptotic death of cancer cells [24,25,26].
As an intracellular target, we chose the Keap1 protein localized on the outer mitochondrial membrane, which is involved in the regulation of several cellular functions: normoxia maintenance, proteostasis, cytoskeleton regulation, and some others [27]. Its close proximity to the outer mitochondrial membrane may be exploited for the delivery of membrane-disrupting agents such as photosensitizers or radionuclides emitting particles with high linear energy transfer. In this article, we leveraged the benefits of cell-specific MNT technology to deliver regulatory proteins inside cells and tested the feasibility of this approach to transport the anti-Keap1 monobody to its target. We demonstrated efficient intracellular delivery of the anti-Keap1 monobody with several assays, such as fluorescence-lifetime imaging microscopy (FLIM), FLIM-FRET, and cellular thermal shift assay (CETSA). Finally, we confirmed that the photocytotoxicity of photosensitizer conjugated to the studied MNT was enhanced when compared to either free chlorin or chlorin delivered by control MNT lacking an anti-Keap1 monobody. This study is part of our attempts to interfere with Keap1 functions and highlights the importance of protein delivery method development as a direct tool to regulate target proteins in the target cell. To investigate whether this phenomenon may be leveraged to develop anti-cancer drugs, cells expressing epidermal growth factor receptor (EGFR) were employed.
2. Materials and Methods
2.1. Cell Lines
The human epidermoid carcinoma A431 and murine hepatocyte AML-12 cell lines were obtained from the American Type Culture Collection (ATCC, Manassas, VA, USA) and maintained according to the ATCC specifications.
2.2. Modular Nanotransportsrs (MNT) Used in the Work
A DNA fragment coding for the antiKeap1 monobody was synthesized by General Biosystems (Morrisville, NC, USA) based on a published amino acid sequence [28] and subcloned into the affibody(EGFR)-DTox-HMP-NLS plasmid [29]. To obtain MNT1, NLS module was deleted using the QuickChange™ site-directed mutagenesis kit (Agilent Technologies, США). The plasmids encoding MNT1 were verified by sequencing and retransformed in E. coli BL21(DE3) cells.
E. coli BL21(DE3) cells were grown on LB Broth Miller (Amresco) with ampicillin (100 μg/ml) to A600 = 0.8 at 37°C. MNTs were expressed in E. coli by the addition of isopropyl-β-d-1-thiogalactopyranoside to a final concentration of 0.5 mM at 18°C overnight. The suspension was centrifuged at 9,000 rpm with the JA-10 rotor (Beckman Coulter, USA) at 4°C for 30 min, and the pellets were lysed in ice-cold 50 mM sodium phosphate, 300 mM NaCl, pH 8.0, 1 mM phenylmethylsulfonyl fluoride, 10 mg/ml lysozyme, and 0.5% Triton X-100. The lysate was clarified by centrifugation at 19,000 rpm with the JA-20 rotor at 4°C for 30 min. Then the supernatant was loaded onto an Ni Sepharose 6 Fast Flow prepacked column (Cytiva, Marlborough, MA, USA), washed with 50 mM sodium phosphate, 300 mM NaCl, 20 mM imidazole, 0.5% Triton X-100, and 1% glycerol, pH 8.0, followed by 50 mM sodium phosphate, 300 mM NaCl, and 20 mM imidazole, pH 8.0. The MNT was eluted with 50 mM sodium phosphate, 300 mM NaCl, 700 mM imidazole, pH 8.0, and dialyzed against 10 mM sodium phosphate, and 150 mM NaCl, pH 7.4.
As a control MNT, we used MNT similar to MNT1 but lacking an antiKeap1 monobody fragment (MNT0).
2.3. Flow Cytometry
Flow cytometry was used to study the ability of MNT1 to bind to EGFR receptors on the surface of A431 cells. The MNT1 was labeled with the AF488 fluorescent dye. To do this, an 8-fold molar excess of the activated AF488-N-hydroxysuccinimide ester (Lumiprobe, Moscow, Russia) was added to the MNT1 in 65 mM carbonate buffer (pH 8.5), and the mixture was incubated for 1h at room temperature with constant stirring. The MNT1 with the attached AF488 was separated from the free dye using a PD10 chromatographic column (GE Healthcare). As a result, an average of 3.3 AF488 molecules are attached to one MNT1 molecule. A431 cells seeded in a 24-well plate were incubated with 500 nM MNT1 for a given time, then washed twice with Versene solution, then removed with a 0.25% trypsin solution in Versene, and then transferred to Hanks solution. The amount of MNT1-AF488 bound to cells was determined using a CytoFLEX S flow cytometer (Beckman Coulter, Inc., USA) in the fluorescence channel of 500-550 nm. Fluorescence was excited by a laser with a wavelength of 488 nm. The average fluorescence value per cell was determined from 7-13 replicates at different incubation times with MNT1-AF488. Large cell aggregates were excluded from consideration.
2.4. Liposome Leakage Assay
The ability of MNT1 to provide liposome leakage was demonstrated on unilamellar phosphatidylcholine (Sigma, USA) liposomes loaded with the fluorescent dye calcein (Fluka, Germany) as described previously (Khramtsov et al., 2008). In brief, the unilamellar liposomes loaded with fluorescent calcein up to the concentration of fluorescence quenching (100 mM) were prepared by sonicating fresh lipid suspension in 20 mM HEPES, 20 mM MES, 20 mM citrate, and 150 mM NaCl, pH 7.4 (liposome buffer) until clear, using a W-181-T sonicator (Finnsonik, Finland; 40 kHz, 90 W, 0°C, 30 min), and passed 10 times through Durapore filters with 0.22 µm pore diameter (Millipore, Burlington, MA, USA) for size standardization. The liposomes were stored under an argon atmosphere at 4°C for several months. Freshly PD-10-purified liposomes were incubated with 100 nM MNT1 for 30 min in liposome buffer at the indicated pH at room temperature in triplicate. After that, samples were diluted tenfold in liposome buffer pH 7.5, and the fluorescence of leaked calcein was measured at 520 nm at the excitation wavelength of 490 nm. As a positive control (100% calcein leakage), a 0.5% Triton X-100-containing sample was used. Parallel probes where MNT1 was omitted served to assess background calcein leakage.
2.5. Thermophoresis
The interaction between MNTs and Keap1 was measured on a Monolith NT.115 instrument (NanoTemper Technologies, Germany) in phosphate buffer (25 mM NaH2PO4, 150 mM NaCl, pH 8.0). Keap1 was labeled with the fluorescent dye Cy3. To do this, a 10-fold molar excess of Cy3 hydroxysuccinimide ester (Lumiprobe) was added to Keap1 in 65 mM carbonate buffer (pH 8.5), and the mixture was incubated for 1 hour at room temperature with constant stirring. Keap1 with attached Cy3 was separated from free Cy3 on a PD10 column. As a result, a modification ratio of 3.9 Cy3 molecules per one Keap1 molecule was reached. Thermophoretic curves were obtained at a fixed concentration of Keap1-Cy3 (40 nM). The obtained dissociation constants for the MNT complex with Keap1, Kd, were averaged over 8–16 curves.
2.6. FLIM-FRET
To study the interaction of MNT1 with Keap1 in the target cell, MNT1 was labeled with the N-hydroxysuccinimide ester of the fluorescent dye AF568 (Lumiprobe) by incubation with a 4-fold molar excess of the fluorophore in sodium carbonate buffer, pH 8.6, for 1 hour at room temperature. Purification of labeled MNT1 with simultaneous buffer exchange to PBS, pH 7.5, was performed by gel filtration on columns with Sephadex G-25 (PD-10). The degree of modification of MNT1 by the fluorophore, estimated spectrophotometrically, was 1.3 AF568 molecules per one MNT1 molecule.
The interaction of MNT1 with Keap1 in the cell was demonstrated using fluorescence lifetime-based Fluorescence Resonance Energy Transfer (FLIM-FRET) [30,31]. The AML-12 cells transiently transfected with Keap1 protein fused to the fluorescent protein hrGFP were used as target cells (hrGFP-Keap1, Addgene plasmid # 28025). The cells were seeded into Poc-mini microscopy chambers at a cell density of 100 thousand per chamber in 1 ml of DMEM medium with 10% fetal bovine serum. hrGFP-Keap1 was transfected into AML12 cells according to the instructions of K2® Transfection System (Biontex, Germany). 2 days after transfection, the medium was changed to serum-free medium with 0.2% BSA, and AF568-labeled MNT1 was added to a final concentration of 500 nM, followed by incubation for 15 minutes or 1 hour. At the end of the incubation, the medium was changed to the Hanks solution with 0.2% BSA. In the control, no MNT1 was added to the cells.
FLIM-FRET experiments were performed on a multiphoton confocal laser scanning microscope LSM-510 META NLO (Carl Zeiss, Oberkochen, Germany), equipped with a Mai Tai Broadband femtosecond laser (SpectraPhysics) and a Time-Correlated Single-Photon Counting system (TCSPC from Becker&Hickl, Berlin, Germany) with a 63x lens, NA 1.4. hrGFP fluorescence was excited with a femtosecond laser using two-photon excitation at 800 nm. Fluorescence recording was carried out at wavelengths of 500-550 nm for hrGFP.
2.7. Cellular Thermal Shift Assay (CETSA)
The cellular thermal shift assay (CETSA) [32] was conducted as follows. Cells from 25 cm2 cultural flask were harvested via trypsin treatment and centrifugation (200 × g, 5 min). Then, cells were suspended in a buffer (pH 8,0) containing 25 mM NaH2PO4, 150 mM NaCl, 1,5 μg/mL aprotinin, 0.174 mg/mL phenylmethylsulfonyl fluoride, and 5 mM EDTA. The cells were quantified using a MACSQuant Analyzer flow cytometer (Miltenyi Biotec GmbH, Paris, France). Melting curves of the studied proteins were obtained both in intact cells and in cell lysates. In the first case, the cell suspensions were heated to set temperatures in the range of 40–50 °C for 3 min, while one sample remained unheated. Then, the cells were cooled down to room temperature and lysed by four freezing–thawing cycles. Freezing was performed in liquid nitrogen. In the second case, the cells were first lysed by four freezing–thawing cycles, and then the cell lysates were heated to set temperatures in the range of 40–50 °C for 3 min. Then, for both settings, the cell lysates were centrifuged (8000 × g, 60 min, 4 °C). The supernatants of the cell lysates were applied to denaturing electrophoresis followed by Western blot staining by anti-Keap1 (ab139729, Abcam) mAb. Sample electrophoresis was performed using standard 10% SDS-PAGE. Given the frequent inhomogeneous coloration of samples obtained using Western blot, all samples were loaded on the gel in triplicate. This enables excluding random outliers of individual bands from the analysis and obtaining more reliable averaged data. Samples were transferred from the gel to a supported nitrocellulose membrane (0.22 μm) using the Trans-Blot Turbo Transfer System (Bio-RAD). For each sample, the band intensity in the selected area and the background area were measured, and they were subtracted from each other. For each studied cell line, the obtained band intensity was averaged for three identical samples and normalized to the band intensity of the sample not subjected to heating treatment for CETSA. The resulting curve was interpolated by sigmoid function in the Origin 6.0 software. For each cell line and staining with the selected antibodies, Western blots were performed in n = 3–9 replicates.
2.8. Labeling of Epidermal Growth Factor and MNT with 125I
Human epidermal growth factor (EGF, Sigma Chemicals, St. Louis, MO, United States) was labeled with 125I (Khlopin Radium Institute, Russia) using Iodogen (1,3,4,6-tetrachloro-3α,6α-diphenylglycoluril, Sigma, USA), as was previously described [33]. For labeling, 10 µg of the EGF and 20 MBq of 125I sodium iodide in 0.05 M sodium borate buffer (pH 8.5) were incubated for 15 min at room temperature in glass vials coated with 10 µg of Iodogen. Labeled EGF was purified by gel filtration through a PD-10 column and was eluted with phosphate-buffered saline (pH 7.5). Labeling and purification of MNT1 was accomplished in similar manner.
2.9. Binding and Internalization Studies
The affinity of MNT1 to EGFR was estimated by binding 125I-iodoEGF to EGFR-expressing A431 cells. To examine the competitive binding of EGF and MNT1 to cells, 1 nM of 125I-iodoEGF and various concentrations of MNT1 were incubated overnight at 4°C in 48-well plates in 200 µl of sodium carbonate-free DMEM supplemented with 10 mg/ml of bovine serum albumin (BSA) and 20 mM 4-(2-hydroxyethyl)-1-piperazineethanesulfonic acid (HEPES, Sigma), pH 7.5. After the incubation, wells were quickly washed four times with ice-cold Hank’s solution and lysed in 1 M NaOH for 30 min. The radioactivity associated with the cell lysates was measured using the RiaGamma 1271 counter (LKB, Sweden). The dissociation constants (Kd) of the MNT1-receptor complexes were calculated according to the competitive model of the binding of ligands to receptors as described earlier [34]. The experiments were carried out in triplicate, with error bars on graphs representing the SEM.
A study of the internalization of 125I-iodo MNT1 was carried out on A431 cells. Cells were grown in DMEM supplemented with 10% FBS and 50 μg/ml gentamicin at 37°C and 5% CO2. Cells were seeded into 24-well culture plates, 500 thousand cells per well. Two days later, the medium was changed to DMEM without bicarbonate, supplemented with 10 mg/ml bovine serum albumin and 15 mM HEPES, pH 7.3. Radiolabeled MNT1 was added to the wells to a final concentration of 50 nM and incubated at 37°C. At the end of incubation, the cells were washed on ice 4 times with a cold Hanks solution, incubated at 4°C for 1 hour with a 0.25% trypsin in Versene solution to remove bound MNT1 from the cell surface, and washed additionally with the same solution. Under these conditions, 90% of the radioactivity associated with the cell surface detached while the cell remained attached to the well. Experiments were carried out 3-4 times each.
2.10. Intracellular Localization
To study localization in the target cell, MNT1 was labeled with the N-hydroxysuccinimide ester of the fluorescent dye AF488 (Lumiprobe) by incubation with an 8-fold molar excess of the fluorophore in sodium carbonate buffer, pH 8.6, for 2.5 hours at room temperature. Purification of labeled MNT1 with simultaneous buffer exchange to PBS, pH 7.5, was performed by gel filtration on PD-10 columns. The degree of modification of MNT1 by the fluorophore, estimated spectrophotometrically, was 2.3 AF488 residues per MNT1 molecule.
A431 cells expressing EGFR were used as target cells to study the intracellular localization of MNT1. The cells were seeded into Poc-mini microscopy chambers at a cell density of 100 thousand per chamber in 1 ml of DMEM medium with 10% fetal bovine serum. Two days after the medium was changed to serum-free medium with 0.2% BSA, and AF488 labeled MNT1 was added to a final concentration of 500 nM, followed by incubation for 1 hour. Fifteen minutes before the end of incubation, the mitochondria-specific dye MitoTracker Deep Red FM (Invitrogen) was added to the chambers at a final concentration of 100 nM to visualize these organelles. At the end of the incubation, the medium was changed to the Hanks solution with 0.2% BSA.
The intracellular distribution of MNT1 was studied using fluorescence lifetime imaging microscopy (FLIM) [30,31]. The advantage of this approach is that in a given area of the sample, not only the magnitude of the fluorescent signal in the selected spectral range is recorded, but also the fluorescence lifetime, which makes it possible to separate the signal from dyes with similar spectral properties. Experiments were performed on a multiphoton confocal laser scanning microscope LSM-510 META NLO (Carl Zeiss), equipped with a Mai Tai Broadband femtosecond laser (SpectraPhysics) and a Time-Correlated Single-Photon Counting system (TCSPC from Becker&Hickl GmbH) with a 63x lens, NA 1.4. AF488 fluorescence was excited with a femtosecond laser using two-photon excitation at 800 nm, and MitoTracker RED FM fluorescence was excited at 890 nm. Fluorescence recording was carried out at wavelengths of 500-550 nm and 575-640 nm for MNT1-AF488 and MitoTracker RED FM, respectively.
2.11. Photocytotoxicity
Photosensitizer chlorin e6 was obtained from Frontier Scientific, Philadelphia, PA, USA. Chlorin was coupled to MNT using 1-ethyl-3-(3-dimethylaminopropyl)-carbodiimide and N-hydroxysuccinimide (Sigma, USA). Conjugates were purified by affinity chromatography on Ni-NTA Sepharose (Cytiva, Marlborough, MA, USA). The A431 cells were seeded into 96-well plates (1000 cells/well). The next day, the medium was changed to DMEM with 10 mg/ml bovine serum albumin, and various concentrations of MNT-chlorin e6 or free chlorin e6 were added to cells. After 20-hour incubation, cells were washed two times with Hanks’ solution and illuminated for 10 minutes (irradiation power 0.0276 W/cm2) with a slide projector (100% cell survival without free chlorin e6 or MNT-chlorin e6) in Hanks’ solution. Then Hanks’ solution was replaced with fresh media supplemented with 10% fetal bovine serum and grown for 4-5 days. Cell viability was determined using 3-(4,5-dimethylthiazol-2-yl)-2,5- diphenyltetrazolium bromide (MTT).
3. Results
Flow cytometry was used to study the interaction of MNT1 with EGFR-expressing cells. EGRR-positive AML-12 cells were incubated for various times with 500 nM MNT1 labeled with the fluorescent dye AF488. According to this study, just 15-minute incubation of MNT1-AF488 with cells increased the average fluorescence significantly (p < 0.05, Mann-Whitney test) over the fluorescence of control cells, where MNT1 was omitted (Figure 1). MNT1 possesses an affibody for the EGFR. To study whether the MNT1 interaction is EGFR-specific, a control where MNT1-AF488 was incubated for one hour with an excess of EGF (2 μM) was also measured. The presence of an excess of EGF led to significant (p < 0.05, Mann Whitney test) reduction of the average fluorescence compared to the cells incubated with MNT1-AF488 alone (Figure 1). Thus, affibody in MNT1 retains its ability to interact with EGFR-positive cells in an EGFR-specific manner.
The ability of MNT1 to make membrane pores was tested, assessing calcein leakage from model phosphatidylcholine liposomes at various pHs. MNT1 did not possess any liposome disturbing activity at neutral pH (Figure 2), while led to significant liposome leakage in a slightly acidic medium (pH 5 – 5,5).
As we showed earlier using the thermophoresis method in solution, the equilibrium dissociation constant of the MNT1 complex with Keap1, Kd, is equal to 7.9 ± 3.3 nM [35]. Thus, the preservation of the functional activity of the monobody module within the MNT1 molecule has already been confirmed. Using thermophoresis, we found that for the complex of MNT0 with Keap1, Kd = 93 ± 15 nM (Figure S1a). It was also shown that both the free affibody (Figure S1b) and the free translocation domain of diphtheria toxin, DTox (Figure S1c), bind to Keap1 with Kd > 1 µM, i.e., for them both only low-affinity nonspecific binding is observed. On the contrary, for an MNT consisting of two modules – DTox and a carrier module, HMP, Kd is 93 ± 11 nM (Figure S1d). Thus, in addition to monobody, the HMP carrier module can also interact with Keap1.
The interaction of MNT1 with Keap1 in the cell was demonstrated using fluorescence lifetime-based fluorescence resonance energy transfer (FLIM-FRET) [30,31]. To do this, AML-12 cells were transiently transfected with Keap1 protein fused to the green fluorescent protein hrGFP. MNT1 was labeled with the fluorescent dye AF568. In the case of FRET between these dyes, the fluorescence lifetime of the hrGFP donor should decrease [30,31]. In addition, in this case, a single exponential curve should no longer adequately fit the decrease in hrGFP fluorescence. In other words, the standard deviation, χ2, of the observed fluorescence drop from the single-exponential dependence should increase greatly. Incubation of AML-12 cells expressing Keap1-hrGFP with 500 nM MNT1-AF568 demonstrates both a decrease in the average hrGFP lifetime and a noticeable increase in χ2 of some areas of the studied cells (Figure 3). This indicates the presence of FRET between Keap1-hrGFP and MNT1-AF568 in these regions, and hence the interaction between Keap1 and MNT1. The average lifetime of hrGFP significantly decreases (p < 0.05, ANOVA test) after 15 minutes of incubation of AML-12 cells with MNT1-AF568. In contrast, incubation of AML-12 cells with 500 nM MNT0 for 1 hour does not significantly reduce the fluorescence lifetime of Keap1-hrGFP (Figure 3e). When AML-12 cells expressing Keap1-hrGFP were incubated for 1 hour with 500 nM MNT1-AF568 in the presence of 2 µM EGF, the average fluorescence lifetime of Keap1-hrGFP did not significantly differ from the fluorescence of cells to which MNT1 was not added (Figure 3e), indicating EGFR-dependent accumulation of the MNT1 in these cells. These data points indicate the ability of MNT1 to interact with Keap1 in the cytosol of EGFR-positive AML-12 cells.
The interaction of MNT1 with Keap1 in AML-12 cells was also studied using Cellular Thermal Shift Assays (CETSA) [32,35]. Using this method, a Keap1 melting curve in its natural protein environment was obtained in AML-12 cells (Figure 4, blue curve). The curve corresponding to the Keap1 complex with MNT1 was obtained for the AML-12 cell lysate to which 1 µM MNT1 was added (Figure 4, red curve). The Keap1 melting curve obtained after 15-minute incubation of AML-12 cells with 500 nM MNT1 followed by subsequent washing of cells (Figure 4, black curve), coincides with the melting curve for the Keap1-MNT1 complex. In contrast, when AML-12 cells were treated with 500 nM MNT0 for 15 minutes, the Keap1 melting curve (Figure 4, green curve) corresponded to the Keap1 melting curve obtained from cells incubated without MNT. The Keap1 melting curve obtained at 4°C for AML-12 cells that were incubated for 15 minutes with 500 nM MNT1 matches the Keap1 melting curve of cells without MNT1 (Figure 4, wine curve). Thus, the CETSA method showed that after 15-minute incubation with cells, MNT1 is able to interact with Keap1 in the cytosol, while MNT0 is not. Low incubation temperatures, which suppress the process of endocytosis, inhibited MNT1 binding to Keap1 in the cytosol.
So, MNT1 is able to interact with the Keap1 protein, both in solution and in the cell. In turn, a noticeable proportion of Keap1 is located on the surface of mitochondria. To demonstrate the mitochondrial localization of MNT1, the cancer cell line A431 was used. This line also showed effective binding of MNT1 to EGFR. The dissociation constants (Kd) for the MNT1 obtained from the displacement curve (competition of the unlabeled MNT1 with 125I-EGF, Figure 5a) was 63 nM (95% confidence interval, 51–76 nM). Moreover, MNT1 not only can bind to EGFR on the surface of A431, but also be internalized into these cells. The uptake of 125I-labeled MNT1 by A431 cells is presented in Figure 5b. Thus, MNT1 enters A431 cells and can interact with Keap1 in them, which, in turn, can lead to mitochondrial localization of MNT1.
MNT1 intracellular localization studies were performed in EGFR-positive A431 cells. The presence of intracellular sites with a simultaneous signal from MNT1 and a mitochondria-specific dye (Figure 6), resulting in the appearance of orange-colored areas in the image, indicates the colocalization of dyes within the cell (Figure 6с).
To assess the extent of this colocalization, we used fluorescence-lifetime imaging microscopy (FLIM). Fluorescence decay studies showed that the fluorescence decay curves of the dyes fit well to a single exponential relationship, and the fluorescence lifetimes for AF488 and MitoTracker RED FM differ greatly. MitoTracker RED FM in A431 cells shows an average fluorescence lifetime (µ) of 1203 ps (confidence interval, CI, was 1085 – 1381 ps), while the average lifetime of the AF488 dye attached to MNT averages 2140 ps (CI 1970 – 2315 ps). The lifetime of the cell autofluorescence signal in the signal measurement channels from both AF488 and MitoTracker differed significantly in their lifetime from the dyes and were 2473 ps (CI 2108 – 2899 ps) and 2710 ps (CI 2515 – 2802 ps), respectively. The magnitude of the autofluorescent signal was significantly inferior to the magnitude of the dye signal, even under optimal conditions for autofluorescence measurement, and amounted to no more than 20 % of the AF488 signal and 2-3% of the MitoTracker RED FM signal. Such a difference in signal intensity and lifetimes of dyes and the background signal and separation of images by lifetimes makes it possible to almost completely eliminate the contribution of autofluorescence from the resulting images. Fluorescence colocalization analysis of AF488 and MitoTracker RED FM showed a strong correlation between the fluorescence from the mitochondria-specific dye and the fluorescence of the dye attached to MNT1 (Figure 7). The linear correlation coefficient (Pearson's correlation coefficient) calculated from the obtained data using the built-in Coloc 2 plugin of the ImageJ image processing program showed a significant correlation (0.77, p<0.001) between the fluorescence intensity of both dyes at their colocalization sites. Spearman's rank correlation coefficient, showing the monotonicity of the dependence of the variables, was 0.87, which confirms the presence of a relationship between the fluorescence intensity of both dyes. The data obtained indicate colocalization of AF488-MNT1 fluorescence and the dye on mitochondria.
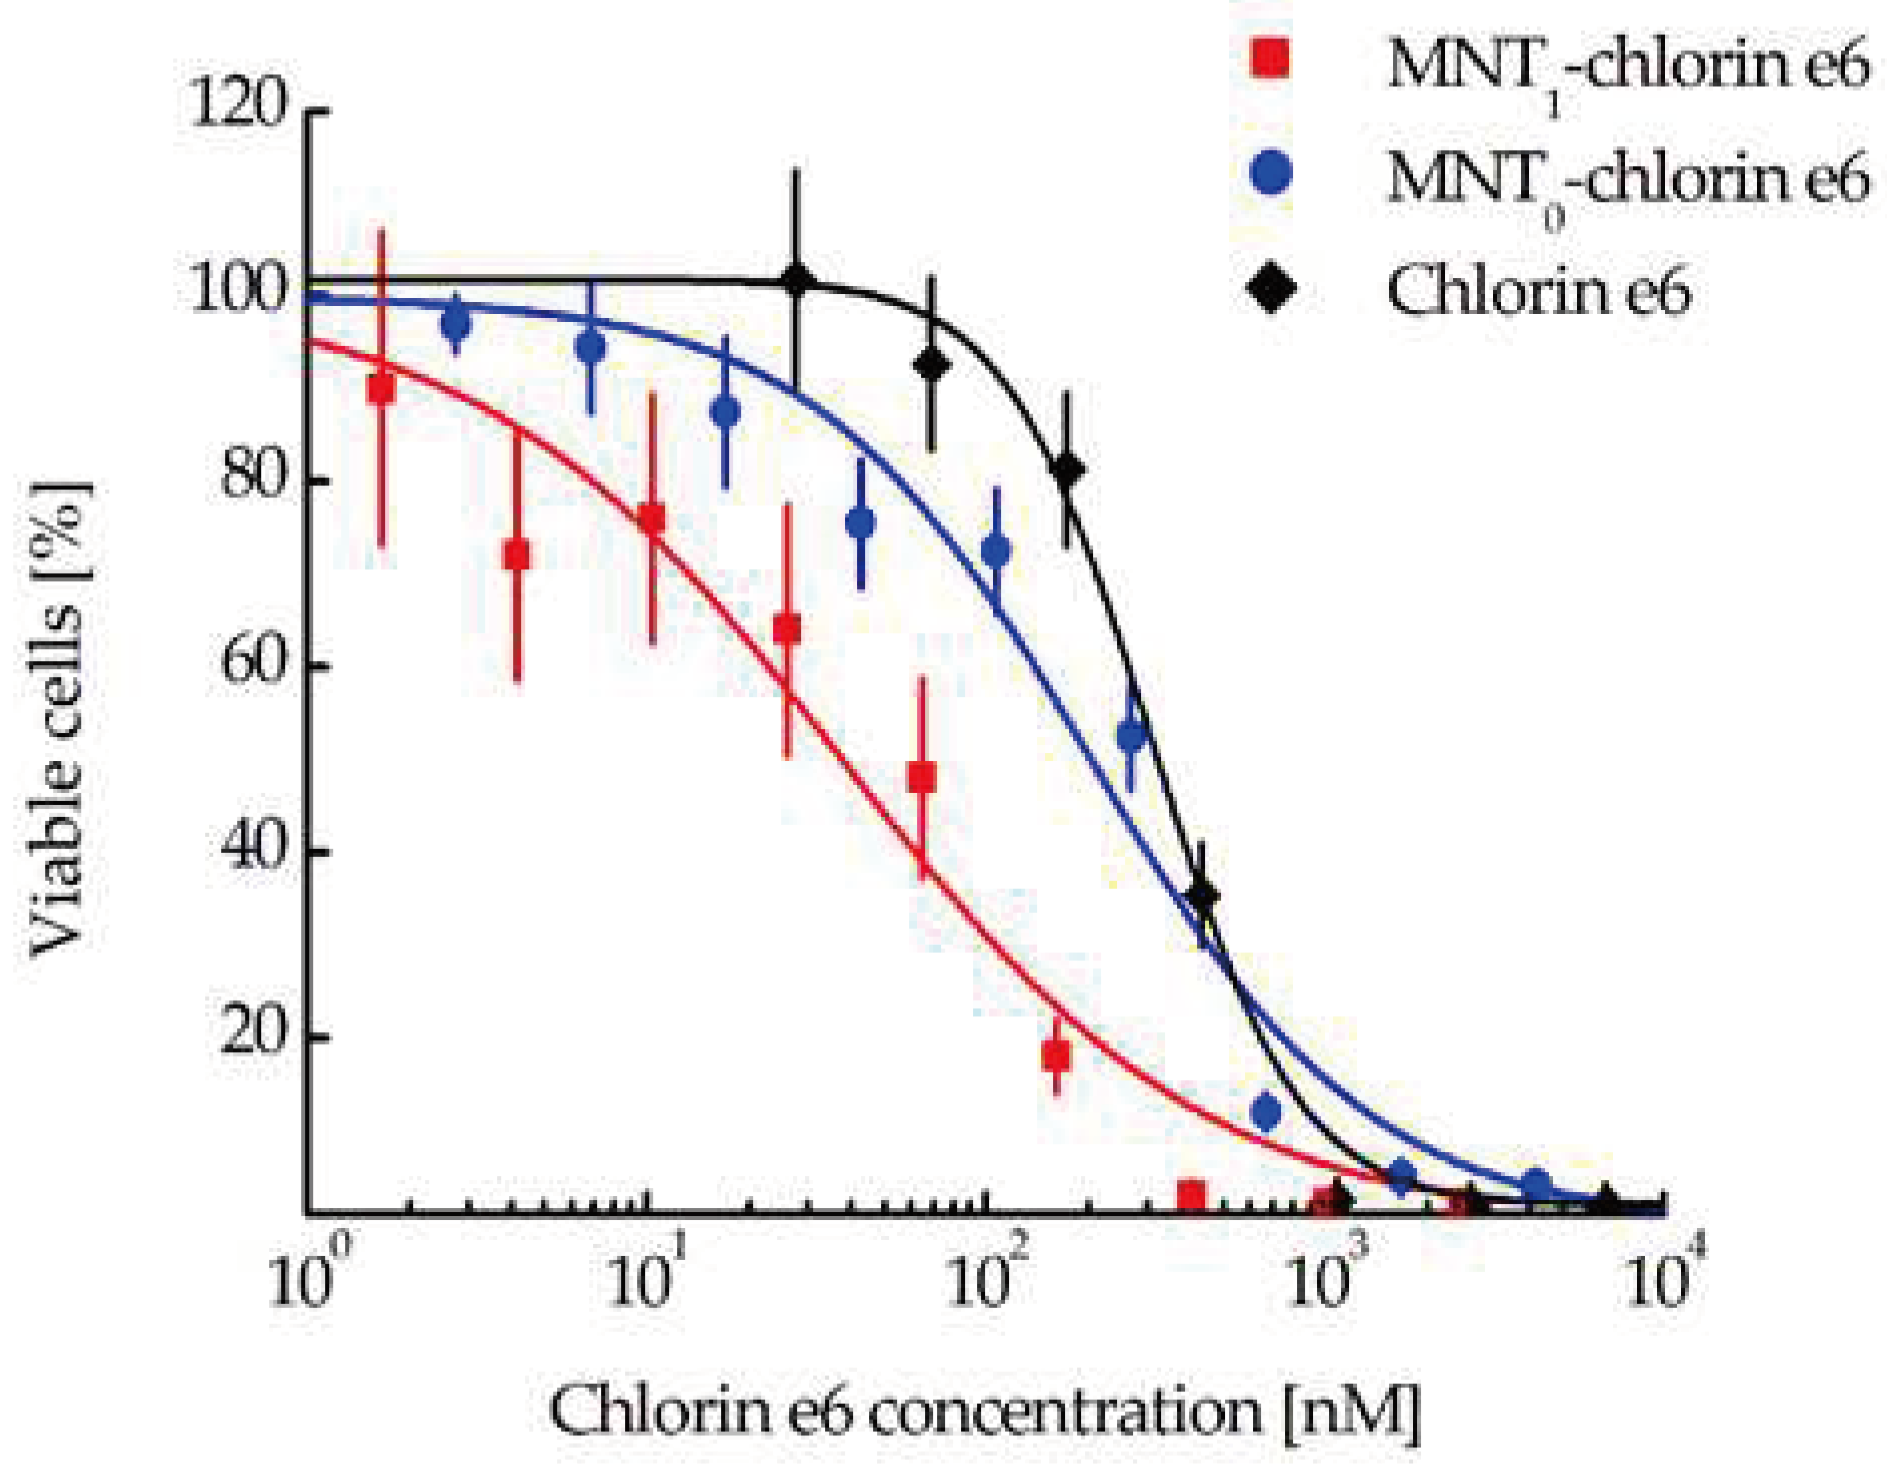
Evaluation of the photocytotoxic effect on EGFR-positive human A431 epidermoid carcinoma cells demonstrated great significant enhancement (8.6 and 5.4 times, respectively) of the efficacy of chlorine e6 attached to MNT1 (EC50 = 37.7 nM, CI 23.3-59.4 nM) when compared to either free chlorin e6 (EC50 = 324.7 nM, CI 290.1–362.4 nM) or chlorin e6 attached to control MNT0 lacking an antiKeap1 monobody fragment (EC50 = 204.1 nM, CI 137.8–300.7 nM) (Figure 8).
4. Discussion
To deliver biologically active molecules to a selected compartment of target cells, we proposed the technology of modular nanotransporters (MNTs) [16,17]. MNTs can bind to an internalized receptor on the surface of target cells through a ligand module. After internalization and entry into endosomes, due to the activity of the endosomolytic module within them, MNT can be released into the cytosol. Delivery to the selected compartment or target protein is carried out using an intracellular targeting module. The delivered molecule can be attached to a carrier module, which also links the other modules together. In this study, an antibody-like molecule, affibody, to the human EGFR [36,37] was chosen as a ligand module. E. coli hemoglobin-like protein (HMP) served as a carrier module, while the translocation domain of diphtheria toxin (DTox) was chosen as an endosomolytic module. We used the Keap1 protein, a significant portion of which is located on the surface of mitochondria [38], as a target protein. To bind to Keap1, another antibody mimetic, an anti-Keap1 monobody, was included within the MNT1 molecule [28]. The complete transporter in this work was designated MNT1, and control MNT lacking the anti-Keap1 monobody was designated MNT0.
First of all, it was necessary to test whether each module within MNT1 retained its functional properties. Flow cytometry was used to study the ability of MNT1 to interact with EGFR. For this, MNT1 was labeled with the fluorescent dye AF488. Flow cytometry experiments demonstrated that cell fluorescence significantly increases after 15 minutes of incubation of cells with MNT1-AF488 (Figure 1). To determine the contribution of nonspecific (EGFR-independent) interactions, AML-12 cells were incubated for 1 hour with an excess of EGF. In this case, cell fluorescence decreased by approximately three times (Figure 1). Consequently, the affibody in MNT1 retains its ability to interact with EGFR-positive AML-12 cells specifically in an EGFR-dependent manner. Thus, using radiolabeled MNT1 we demonstrated EGFR-specific binding and internalization of labeled MNT1 into EGFR-expressing A431 cells (Figure 5).
To test the functionality of the endosomolytic module within the MNT1 molecule, we evaluated the MNT1 ability to form defects in the model lipid membrane at pH values characteristic of endosomes. MNT1-mediated membranolytic activity peaked at pH values around 5.5-6.0 (Figure 2), which correspond to endosomal pHs. This indicates that the endosomolytic module within MNT1 retains its functional activity.
It turned out that MNT1 possesses two Keap1 binding sites, one is the anti-Keap1 monobody while the other one is located on the HMP carrier module, thus promoting MNT1 interaction with Keap1. To demonstrate that MNT1 can interact with Keap1 not only in solution, but also in the living cells, the Förster resonance energy transfer fluorophore lifetime-determined microscopy method (FLIM-FRET) was used [30,31]. To do this, AML12 cells were transiently transfected with Keap1 protein fused to the green fluorescent protein hrGFP. It acted as FRET donor molecule. The fluorescent dye AF568 attached to MNT1 and MNT0, acted as a FRET acceptor. In the presence of FRET between the donor and acceptor, i.e., when macromolecules labeled with them form a complex, the fluorescence lifetime of the donor is noticeably reduced [30,31]. Typically, the average fluorescence lifetime is determined by describing the fluorescence decline with a single exponential dependence. However, in the presence of FRET, not only the average lifetime of the donor fluorescence decreases, but also the decrease in fluorescence begins to be poorly described by a single-exponential dependence, i.e., the standard deviation, χ2, of the observed fluorescence drop approximated with the single-exponential dependence increases. When AML-12 cells containing Keap1-hrGFP were incubated with MNT1-AF568, we observed both a decrease in the average hrGFP lifetime and a noticeable increase in χ2 in a number of cell regions (Figure 3). This indicates the presence of FRET between Keap1-hrGFP and MNT1-AF568 in these regions, and hence the interaction between Keap1 and MNT1. Moreover, already 15-minute incubation of MNT1-AF568 with these cells is enough for the average lifetime of hrGFP to significantly decrease, indicating that a significant proportion of MNT1 entered the cells from the beginning of its interaction with Keap1 (Figure 3e). In contrast, incubation with MNT lacking anti-Keap1 monobody, MNT0-AF568, does not significantly reduce the fluorescence lifetime of Keap1-hrGFP (Figure 3e). If MNT1-AF568 is added to AML-12 cells in the presence of excess EGF, the average fluorescence lifetime of Keap1-hrGFP is also not significantly changed (Figure 3e). This suggests that MNT1 not only binds preferentially to EGFR, as we have shown previously, but is also internalized into cells via binding to these receptors rather than via nonspecific internalization.
If we describe the hrGFP lifetime by a two-exponential dependence, with characteristic lifetimes t1 and t2, then we can calculate the FRET efficiency, E, using the formula [30,31]:
E = 1 – t1/ t2
It is then possible to obtain histograms of the occurrence of E values in AML-12 cells transiently transformed with Keap1-hrGFP, to which MNT1-AF568 was not added (Figure S2a, black curve) and with the addition of MNT1-AF568 (Figure S2a, red curve). Presumably due to the presence of endogenous acceptors for hrGFP, a peak is also observed in the histogram of the control, where MNT1-AF568 was omitted, at E values less than 22 (Figure S2a, black curve). Therefore, only E values above 22 were used for calculations. The difference in FRET efficiency histograms for AML-12 cells incubated with MNT1-AF568 and the control allows us to highlight the contribution of real FRET efficiency due to the added MNT1-AF568 (Figure S2b). The distribution of real FRET efficiency is well described by a Gaussian curve (Figure S2b, red curve). The maximum of this curve is 59.4 ± 0.6%. It should be noted that, knowing the FRET efficiency, E, one can calculate the average distance between donor and acceptor molecules using the formula:
where r0 is the Förster radius [30,31]. For the pair of fluorophores used, hrGFP and AlexaFluor568, r0 = 5.4 nm (https://www.fpbase.org/fret/). Thus, we obtain that r = 5.07 ± 0.02 nm. The spread of this value can be estimated from the half-width of the peak presented in Figure S2b. Therefore, the average distance between the hrGFP donor and the AF488 acceptor in the MNT1-Keap1 complex is r = 5.1 ± 0.8 nm. This is smaller than the characteristic size of similar MNTs, which is 8.3–10.6 nm [39]. From the peak area in Figure S2b, the proportion of the cell region in which FRET is observed can be determined. It is 22.5 ± 0.8% and reflects the proportion of Keap1 molecules involved in the formation of a complex with MNT1.
In summary, in AML-12 cells transiently transformed with Keap1-hrGFP, MNT1 is able to interact with Keap1. In order to understand whether MNT1 is able to interact with native intracellular Keap1 Cellular Thermal Shift Assays (CETSA) were used [32,35]. Using this method, so-called protein melting curves are obtained, which depend on whether the protein forms complex with other molecules or not. The first is a melting curve of Keap1 in its natural protein environment in an AML-12 cell in the absence of MNT1 (Figure 4, blue curve). Next, AML-12 cells are lysed, and 1 μM MNT1 is added to the lysate before CETSA is performed and a melting curve is obtained. This curve will correspond to the Keap1 complex with MNT1 (Figure 4, red curve). When MNT1 is added to AML12 cells for 15 minutes with subsequent washing from unbound MNT1, the melting curve of Keap1 obtained by the CETSA method is the same as that of Keap1 in complex with MNT1 (Figure 4, black curve). When AML12 cells are also incubated with control MNT0, then the melting curve of Keap1 corresponds to cells incubated without MNT1 (Figure 4, green curve). These data allow us to suggest that MNT1 interacts with Keap1 in cells, and the main contribution to this interaction is made by the presence of the anti-Keap1 monobody within MNT1. Using FLIM-FRET, it was shown that MNT1 enters the cell an EGFR-dependent manner. In the other words, MNT1 is supposed to enter cells via EGFR-dependent endocytosis. At a low temperature of 4°C, the rate of endocytosis should drop sharply. The melting curve of Keap1 obtained at 4°C demonstrated the absence of interaction of MNT1 with Keap1 (Figure 4, wine curve). This indicates that MNT1 enters the cell via receptor-dependent endocytosis. In summary, the results obtained using CETSA suggest that MNT1 enters the cell by endocytosis and is able to exit endosomes into the cytosol and interact there with Keap1.
So, we have shown by two methods that MNT1 is capable of interacting with Keap1 in cells. It is known that Keap1 is able to bind to the PGAM5 protein, which is located in the outer membrane of mitochondria [38]. Therefore, it can be supposed that a noticeable part of MNT1 that penetrates into the cytosol will also be located on the surface of mitochondria. To test this assumption, we used FLIM microscopy; for this, we labeled the MNT1 with the fluorescent dye AF488, and stained mitochondria with MitoTracker RED FM. Unlike conventional confocal microscopy, this method allows the fluorescence of AF488 and MitoTracker RED FM to be clearly separated, both from each other and from autofluorescence. The fact is that the fluorescence lifetimes for all of them are significantly different. In addition, the magnitude of the autofluorescent signal was significantly lower than the magnitude of the dye signals. Together with separation by lifetime, this makes it possible to almost completely eliminate the contribution of autofluorescence from the resulting images and unambiguously determine the location of MNT1-AF488 and MitoTracker RED FM. The orange color in the image indicates that there is colocalization of these dyes in the same places within the cell (Figure 6). Moreover, a significant linear correlation between the fluorescence intensity of these dyes is observed (Pearson's correlation coefficient is 0.77 at p<0.001) in the places where they are recorded together (Figure 7). The Spearman rank correlation coefficient, which indicates the relationship between the fluorescence intensities of both dyes, is 0.87. The data obtained allow us to assume that MNT1 colocalizes with mitochondria in A431 cancer cells.
If MNT1 is mainly located in the mitochondrial region, then the delivery of a cytotoxic agent that can damage the mitochondrial membrane should lead to the death of target cells, presumably via apoptosis. To test this assumption, we used A431 cancer cells, which are known for their high level of EGFR expression, and in which we had already demonstrated the mitochondrial localization of MNT1. The photosensitizer chlorine e6 was chosen as a cytotoxic agent. As a result, we observed an 8.6-fold significant increase in the photocytotoxic effect of the photosensitizer attached to MNT1, compared to the free photosensitizer (Figure 8). On the contrary, attachment of the photosensitizer to MNT0 does not significantly increase its photocytotoxicity.
Thus, in this work, we proposed and studied MNT1, which is capable of interacting with the Keap1 protein located on the mitochondria inside the cells. MNT1 ability to interact with Keap1 within living cells was established. Colocalization of this MNT1 with mitochondria and a significant increase in the photocytotoxic effect of photosensitizers attached to MNT1 have been shown.
5. Conclusions
As a result of this work, modular nanotransporters, containing monobodies to the Keap1 protein, was developed. Their ability to bind to the EGFR on the surface of target cells, disrupt the integrity of the lipid membrane at pH values characteristic of endosomes, and bind with high affinity to the Keap1 protein in solution were demonstrated. Using the cellular thermal shift assay and FLIM-FRET microscopy, it was shown that the proposed MNTs interacted with the Keap1 protein not only in solution but also in living cells. Using FLIM microscopy, a noticeable co-localization of these MNTs with mitochondria was demonstrated. It has been shown that the photosensitizer chlorin e6 acquired an 8.8-fold higher photocytotoxicity when it was coupled to the MNT and thus delivered to mitochondria. We assume that the proposed modular nanotransporters delivering biologically active molecules to a selected intracellular protein can open a new way to increase therapeutic effectiveness of chemo- and radiotherapy of malignant tumors.
Supplementary Materials
Figure S1: Thermophoretic curves for MNT0 (a), Affibody (b), DTox (c) and DTox-HMP (d) and Keap1. Fluorescence before the start of thermophoresis was taken as 100%. Fluorescence values 20 seconds after the start of thermophoresis are shown. Figure S2: (a) Frequency of occurrence of FRET efficiency, E, of AML12 cells transiently transfected with Keap1-hrGFP that were incubated for 1 hour with 500 nM MNT1-AF568. The black curve shows the histogram for the control, in which MNT was not added to AML12 cells. (b) Difference in FRET efficiency histograms for AML12 cells supplemented with MNT1-AF568 and control. The red curve shows the interpolation of the experimental data from the Gaussian curve. All histograms were obtained by averaging data over 10-14 cells.
Author Contributions
Conceptualization, Y.V.K., A.S.S., A.A.R. and T.A.S.; Methodology, Y.V.K., A.V.U., T.A.S. and A.A.R.; Validation, Y.V.K., T.A.S. and T.N.L.; Formal Analysis, Y.V.K. and T.A.S.; Investigation, Y.V.K., T.A.S., A.A.R., A.V.U., T.N.L.; Writing—Original Draft Preparation, Y.V.K., T.A.S., A.V.U.; Writing—Review and Editing, A.A.R. and A.S.S.; Visualization, Y.V.K., T.A.S. and T.N.L.; Supervision, A.S.S. and G.P.G.; Project Administration, A.S.S. and G.P.G.; Funding Acquisition, A.S.S. All authors have read and agreed to the published version of the manuscript.
Funding
The research was supported by the grant 22-14-00094 of the Russian Science Foundation.
Institutional Review Board Statement
Not applicable.
Informed Consent Statement
Not applicable.
Data Availability Statement
Not applicable.
Acknowledgments
The authors are grateful to R. T. Alieva for her help with the liposome leakage and binding assays. Experiments were carried out with the use of equipment from the Center for Precision Genome Editing and Genetic Technologies for Biomedicine, IGB RAS. We are also grateful to the Lomonosov Moscow State University Program of Development for the use of its equipment.
Conflicts of Interest
The authors declare no conflict of interest.
References
- Scott, D.E.; Bayly, A.R.; Abell, C.; Skidmore, J. Small molecules, big targets: drug discovery faces the protein–protein interaction challenge. Nat. Rev. Drug Discov. 2016, 15, 533–550. [Google Scholar] [CrossRef] [PubMed]
- Wells, J.A.; McClendon, C.L. Reaching for high-hanging fruit in drug discovery at protein–protein interfaces. Nature 2007, 450, 1001–1009. [Google Scholar] [CrossRef] [PubMed]
- Arrowsmith, C.H.; Audia, J.E.; Austin, C.; Baell, J.; Bennett, J.; Blagg, J.; Bountra, C.; Brennan, P.E.; Brown, P.J.; Bunnage, M.E. The promise and peril of chemical probes. Nat. Chem. Biol. 2015, 11, 536–541. [Google Scholar] [CrossRef] [PubMed]
- Baell, J.; Walters, M.A. Chemistry: Chemical con artists foil drug discovery. Nature 2014, 513, 481–483. [Google Scholar] [CrossRef] [PubMed]
- Kaplon, H.; Crescioli, S.; Chenoweth, A.; Visweswaraiah, J.; Reichert, J.M. Antibodies to watch in 2023. Taylor & Francis 2023, 15, 2153410. [Google Scholar]
- Kinch, M.S.; Kraft, Z.; Schwartz, T. Monoclonal antibodies: trends in therapeutic success and commercial focus. Drug Discovery Today 2023, 28, 103415. [Google Scholar] [CrossRef] [PubMed]
- Cai, H.H.; Pandit, A. Therapeutic monoclonal antibodies approved by FDA in 2020. Clin. Res. Immunol 2021, 4, 1–2. [Google Scholar]
- Lu, R.M.; Hwang, Y.C.; Liu, I.J.; Lee, C.C.; Tsai, H.Z.; Li, H.J.; Wu, H.C. Development of therapeutic antibodies for the treatment of diseases. J. Biomed. Sci. 2020, 27, 1–30. [Google Scholar] [CrossRef] [PubMed]
- Rosenkranz, A.A.; Slastnikova, T.A. Prospects of Using Protein Engineering for Selective Drug Delivery into a Specific Compartment of Target Cells. Pharmaceutics 2023, 15, 987. [Google Scholar] [CrossRef]
- Slastnikova, T.A.; Ulasov, A.V.; Rosenkranz, A.A.; Sobolev, A.S. Targeted intracellular delivery of antibodies: the state of the art. Front. Pharmacol. 2018, 9, 1208. [Google Scholar] [CrossRef]
- Soetens, E.; Ballegeer, M.; Saelens, X. An inside job: applications of intracellular single domain antibodies. Biomolecules 2020, 10, 1663. [Google Scholar] [CrossRef] [PubMed]
- Koch, K.C.; Tew, G.N. Functional antibody delivery: Advances in cellular manipulation. Adv. Drug Delivery Rev. 2023, 192, 114586. [Google Scholar] [CrossRef] [PubMed]
- Li, Y.; Li, P.; Li, R.; Xu, Q. Intracellular antibody delivery mediated by lipids, polymers, and inorganic nanomaterials for therapeutic applications. Advanced Therapeutics 2020, 3, 2000178. [Google Scholar] [CrossRef]
- Niamsuphap, S.; Fercher, C.; Kumble, S.; Huda, P.; Mahler, S.M.; Howard, C.B. Targeting the undruggable: emerging technologies in antibody delivery against intracellular targets. Expert Opin. Drug Delivery 2020, 17, 1189–1211. [Google Scholar] [CrossRef]
- Tolmachev, V.M.; Chernov, V.I.; Deyev, S.M. Targeted nuclear medicine. Seek and destroy. Russ. Chem. Rev. 2022, 91, RCR5034. [Google Scholar] [CrossRef]
- Sobolev, A.S. The Delivery of Biologically Active Agents into the Nuclei of Target Cells for the Purposes of Translational Medicine. Acta Naturae 2020, 12, 47–56. [Google Scholar] [CrossRef] [PubMed]
- Sobolev, A.S. Modular nanotransporters for nuclear-targeted delivery of auger electron emitters. Front. Pharmacol. 2018, 9, 952. [Google Scholar] [CrossRef] [PubMed]
- Gilyazova, D.G.; Rosenkranz, A.A.; Gulak, P.V.; Lunin, V.G.; Sergienko, O.V.; Khramtsov, Y.V.; Timofeyev, K.N.; Grin, M.A.; Mironov, A.F.; Rubin, A.B. Targeting cancer cells by novel engineered modular transporters. Cancer research 2006, 66, 10534–10540. [Google Scholar] [CrossRef] [PubMed]
- Rosenkranz, A.A.; Lunin, V.G.; Gulak, P.V.; Sergienko, O.V.; Shumiantseva, M.A.; Voronina, O.L.; Gilyazova, D.G.; John, A.P.; Kofner, A.A.; Mironov, A.F. Recombinant modular transporters for cell–specific nuclear delivery of locally acting drugs enhance photosensitizer activity. The FASEB journal 2003, 17, 1121–1123. [Google Scholar] [CrossRef]
- Slastnikova, T.A.; Rosenkranz, A.A.; Gulak, P.V.; Schiffelers, R.M.; Lupanova, T.N.; Khramtsov, Y.V.; Zalutsky, M.R.; Sobolev, A.S. Modular nanotransporters: a multipurpose in vivo working platform for targeted drug delivery. Int. J. Nanomed. 2012, 467–482. [Google Scholar]
- Kamaletdinova, T.R.; Rosenkranz, A.A.; Ulasov, A.V.; Khramtsov, Y.V.; Tsvetkova, A.D.; Georgiev, G.P.; Sobolev, A.S. Modular nanotransporter with P21 fragment inhibits DNA repair after bleomycin treatment. Dokl. Biochem. Biophys. 2018, 479, 95–97. [Google Scholar] [CrossRef] [PubMed]
- Khramtsov, Y.V.; Ulasov, A.V.; Lupanova, T.N.; Georgiev, G.P.; Sobolev, A.S. Delivery of antibody-like molecules, monobodies, capable of binding with SARS-CoV-2 virus nucleocapsid protein, into target cells. Dokl. Biochem. Biophys. 2022, 506, 220–222. [Google Scholar] [CrossRef] [PubMed]
- Lupanova, T.N.; Ulasov, A.V.; Khramtsov, Y.V.; Rozenkranz, A.A.; Georgiev, G.P.; Sobolev, A.S. Intracellular Delivery of an Antibody-Like Molecule Capable of Inhibiting c-Myc. Dokl. Biochem. Biophys. 2023, 509, 70–72. [Google Scholar] [CrossRef]
- Armstrong, J.S. Mitochondria: a target for cancer therapy. Br. J. Pharmacol. 2006, 147, 239–248. [Google Scholar] [CrossRef]
- Vasan, K.; Werner, M.; Chandel, N.S. Mitochondrial metabolism as a target for cancer therapy. Cell Metab. 2020, 32, 341–352. [Google Scholar] [CrossRef]
- Zhou, Y.; Jing, S.; Liu, S.; Shen, X.; Cai, L.; Zhu, C.; Zhao, Y.; Pang, M. Double-activation of mitochondrial permeability transition pore opening via calcium overload and reactive oxygen species for cancer therapy. Journal of Nanobiotechnology 2022, 20, 1–14. [Google Scholar] [CrossRef] [PubMed]
- Kopacz, A.; Kloska, D.; Forman, H.J.; Jozkowicz, A.; Grochot-Przeczek, A. Beyond repression of Nrf2: An update on Keap1. Free Radical Biol. Med. 2020, 157, 63–74. [Google Scholar] [CrossRef]
- Guntas, G.; Lewis, S.M.; Mulvaney, K.M.; Cloer, E.W.; Tripathy, A.; Lane, T.R.; Major, M.B.; Kuhlman, B. Engineering a genetically encoded competitive inhibitor of the KEAP1–NRF2 interaction via structure-based design and phage display. Protein Eng. Des. Sel. 2016, 29, 1–9. [Google Scholar] [CrossRef]
- Karyagina, T.S.; Ulasov, A.V.; Slastnikova, T.A.; Rosenkranz, A.A.; Lupanova, T.N.; Khramtsov, Y.V.; Georgiev, G.P.; Sobolev, A.S. Targeted delivery of 111In into the nuclei of EGFR overexpressing cells via modular nanotransporters with anti-EGFR affibody. Front. Pharmacol. 2020, 11, 176. [Google Scholar] [CrossRef]
- Datta, R.; Heaster, T.M.; Sharick, J.T.; Gillette, A.A.; Skala, M.C. Fluorescence lifetime imaging microscopy: fundamentals and advances in instrumentation, analysis, and applications. J. Biomed. Opt. 2020, 25, 071203. [Google Scholar] [CrossRef]
- Suhling, K.; Hirvonen, L.M.; Levitt, J.A.; Chung, P.H.; Tregidgo, C.; Le Marois, A.; Rusakov, D.A.; Zheng, K.; Ameer-Beg, S.; Poland, S. Fluorescence lifetime imaging (FLIM): Basic concepts and some recent developments. Medical Photonics 2015, 27, 3–40. [Google Scholar] [CrossRef]
- Molina, D.M.; Jafari, R.; Ignatushchenko, M.; Seki, T.; Larsson, E.A.; Dan, C.; Sreekumar, L.; Cao, Y.; Nordlund, P. Monitoring drug target engagement in cells and tissues using the cellular thermal shift assay. Science 2013, 341, 84–87. [Google Scholar] [CrossRef] [PubMed]
- Rosenkranz, A.A.; Slastnikova, T.A.; Karmakova, T.A.; Vorontsova, M.S.; Morozova, N.B.; Petriev, V.M.; Abrosimov, A.S.; Khramtsov, Y.V.; Lupanova, T.N.; Ulasov, A.V. Antitumor activity of Auger electron emitter 111In delivered by modular nanotransporter for treatment of bladder cancer with EGFR overexpression. Front. Pharmacol. 2018, 9, 1331. [Google Scholar] [CrossRef] [PubMed]
- Zakharova, O.M.; Rosenkranz, A.A.; Sobolev, A.S. Modification of fluid lipid and mobile protein fractions of reticulocyte plasma membranes affects agonist-stimulated adenylate cyclase. Application of the percolation theory. BBA Biomembranes 1995, 1236, 177–184. [Google Scholar] [CrossRef] [PubMed]
- Khramtsov, Y.V.; Ulasov, A.V.; Rosenkranz, A.A.; Slastnikova, T.A.; Lupanova, T.N.; Georgiev, G.P.; Sobolev, A.S. An Approach to Evaluate the Effective Cytoplasmic Concentration of Bioactive Agents Interacting with a Selected Intracellular Target Protein. Pharmaceutics 2023, 15, 324. [Google Scholar] [CrossRef] [PubMed]
- Kim, D.; Yan, Y.; Valencia, C.A.; Liu, R. Heptameric targeting ligands against EGFR and HER2 with high stability and avidity. 2012, e43077. [Google Scholar] [CrossRef] [PubMed]
- Stеhl, S.; Graslund, T.; Karlstram, A.E.; Frejd, F.Y.; Nygren, P.Е.; Lofblom, J. Affibody molecules in biotechnological and medical applications. Trends Biotechnol. 2017, 35, 691–712. [Google Scholar] [CrossRef] [PubMed]
- Lo, S.C.; Hannink, M. PGAM5 tethers a ternary complex containing Keap1 and Nrf2 to mitochondria. Exp. Cell Res. 2008, 314, 1789–1803. [Google Scholar] [CrossRef]
- Khramtsov, Y.V.; Vlasova, A.D.; Vlasov, A.V.; Rosenkranz, A.A.; Ulasov, A.V.; Ryzhykau, Y.L.; Kuklin, A.I.; Orekhov, A.S.; Eydlin, I.B.; Georgiev, G.P. Low-resolution structures of modular nanotransporters shed light on their functional activity. Acta Cryst. D 2020, 76, 1270–1279. [Google Scholar] [CrossRef]
Figure 1.
Interaction of MNT1 fluorescently labeled with AF488 with AML-12 cells possessing EGFR (arbitrary units). A control group, where MNT1-AF488 was omitted, groups in which cells were incubated with 500 nM MNT1-AF488 for 15, 30, 45, and 60 minutes, and a group in which cells were incubated with 500 nM MNT1-AF488 in the presence of 2 μM EGF are shown. Bars represent mean values ± SEM (n = 9-18).
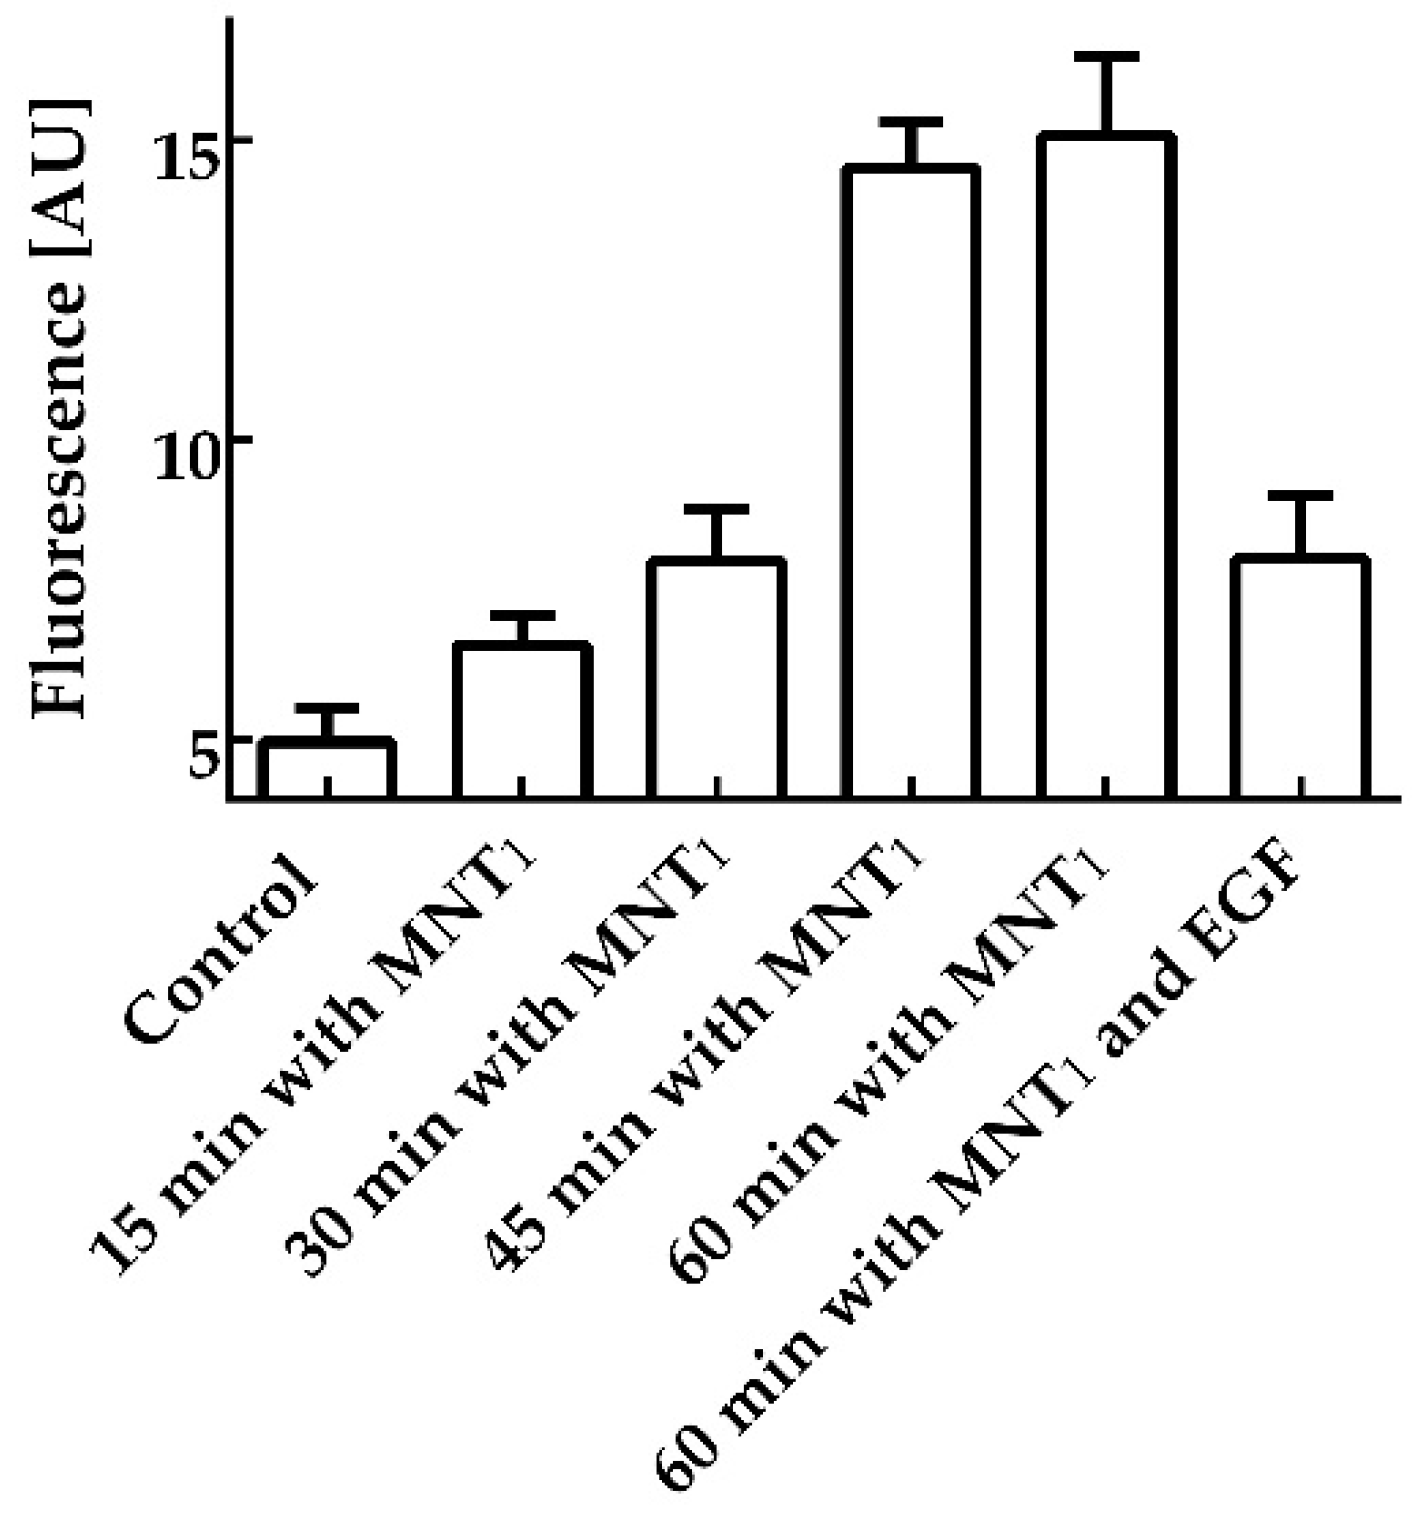
Figure 2.
MNT1-induced leakage from phosphatidylcholine liposomes loaded with the fluorescent dye calcein to the fluorescence self-quenching concentration. MNT1 concentration is 100 nM. Error bars represent SEM (n = 6).
Figure 2.
MNT1-induced leakage from phosphatidylcholine liposomes loaded with the fluorescent dye calcein to the fluorescence self-quenching concentration. MNT1 concentration is 100 nM. Error bars represent SEM (n = 6).
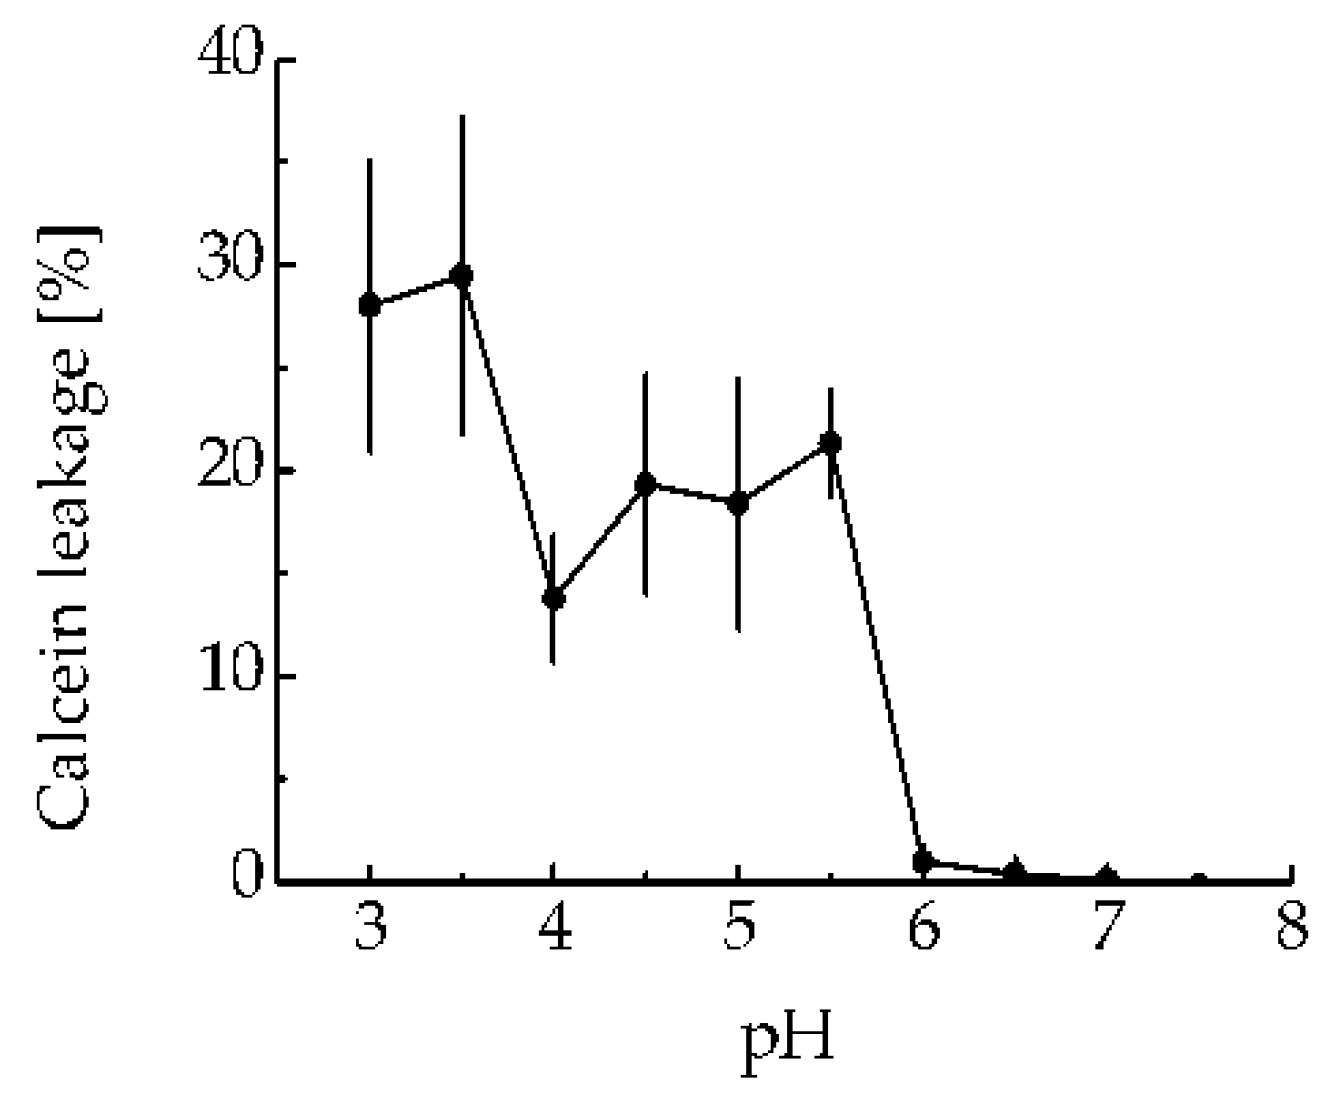
Figure 3.
Analysis of the interaction of intracellular Keap1-hrGFP with MNT1-AF568 added to AML-12 cells expressing hrGFP-Keap1. Distribution of the average lifetime of hrGFP fluorescence in a cell to which no MNT was added (a) and in a cell following 1 hour incubation with 500 nM MNT1-AF568 (c). Standard deviation, χ2, of the observed drop in hrGFP fluorescence intensity from a single-exponential dependence in a cell to which no MNT was added (b) and in a cell following 1 hour incubation with 500 nM MNT1-AF568 (d). To display only the transformed hrGFP-Keap1 cell, a mask was applied to the image. (e) Average hrGFP fluorescence lifetime for different experimental groups of Keap1-hrGFP transformed AML-12 cells. Control group without the addition of MNT1, experimental groups where the cells were incubated with 500 nM MNT1-AF568 for 15 and 60 min, a group where the cells were incubated with 500 nM MNT1-AF568 in the presence of 2 μM EGF, and a group where cells were incubated with 500 nM MNT0-AF568 for 60 min. Data are presented as average hrGFP fluorescence lifetimes in a cell ± SEM (n = 9-18).
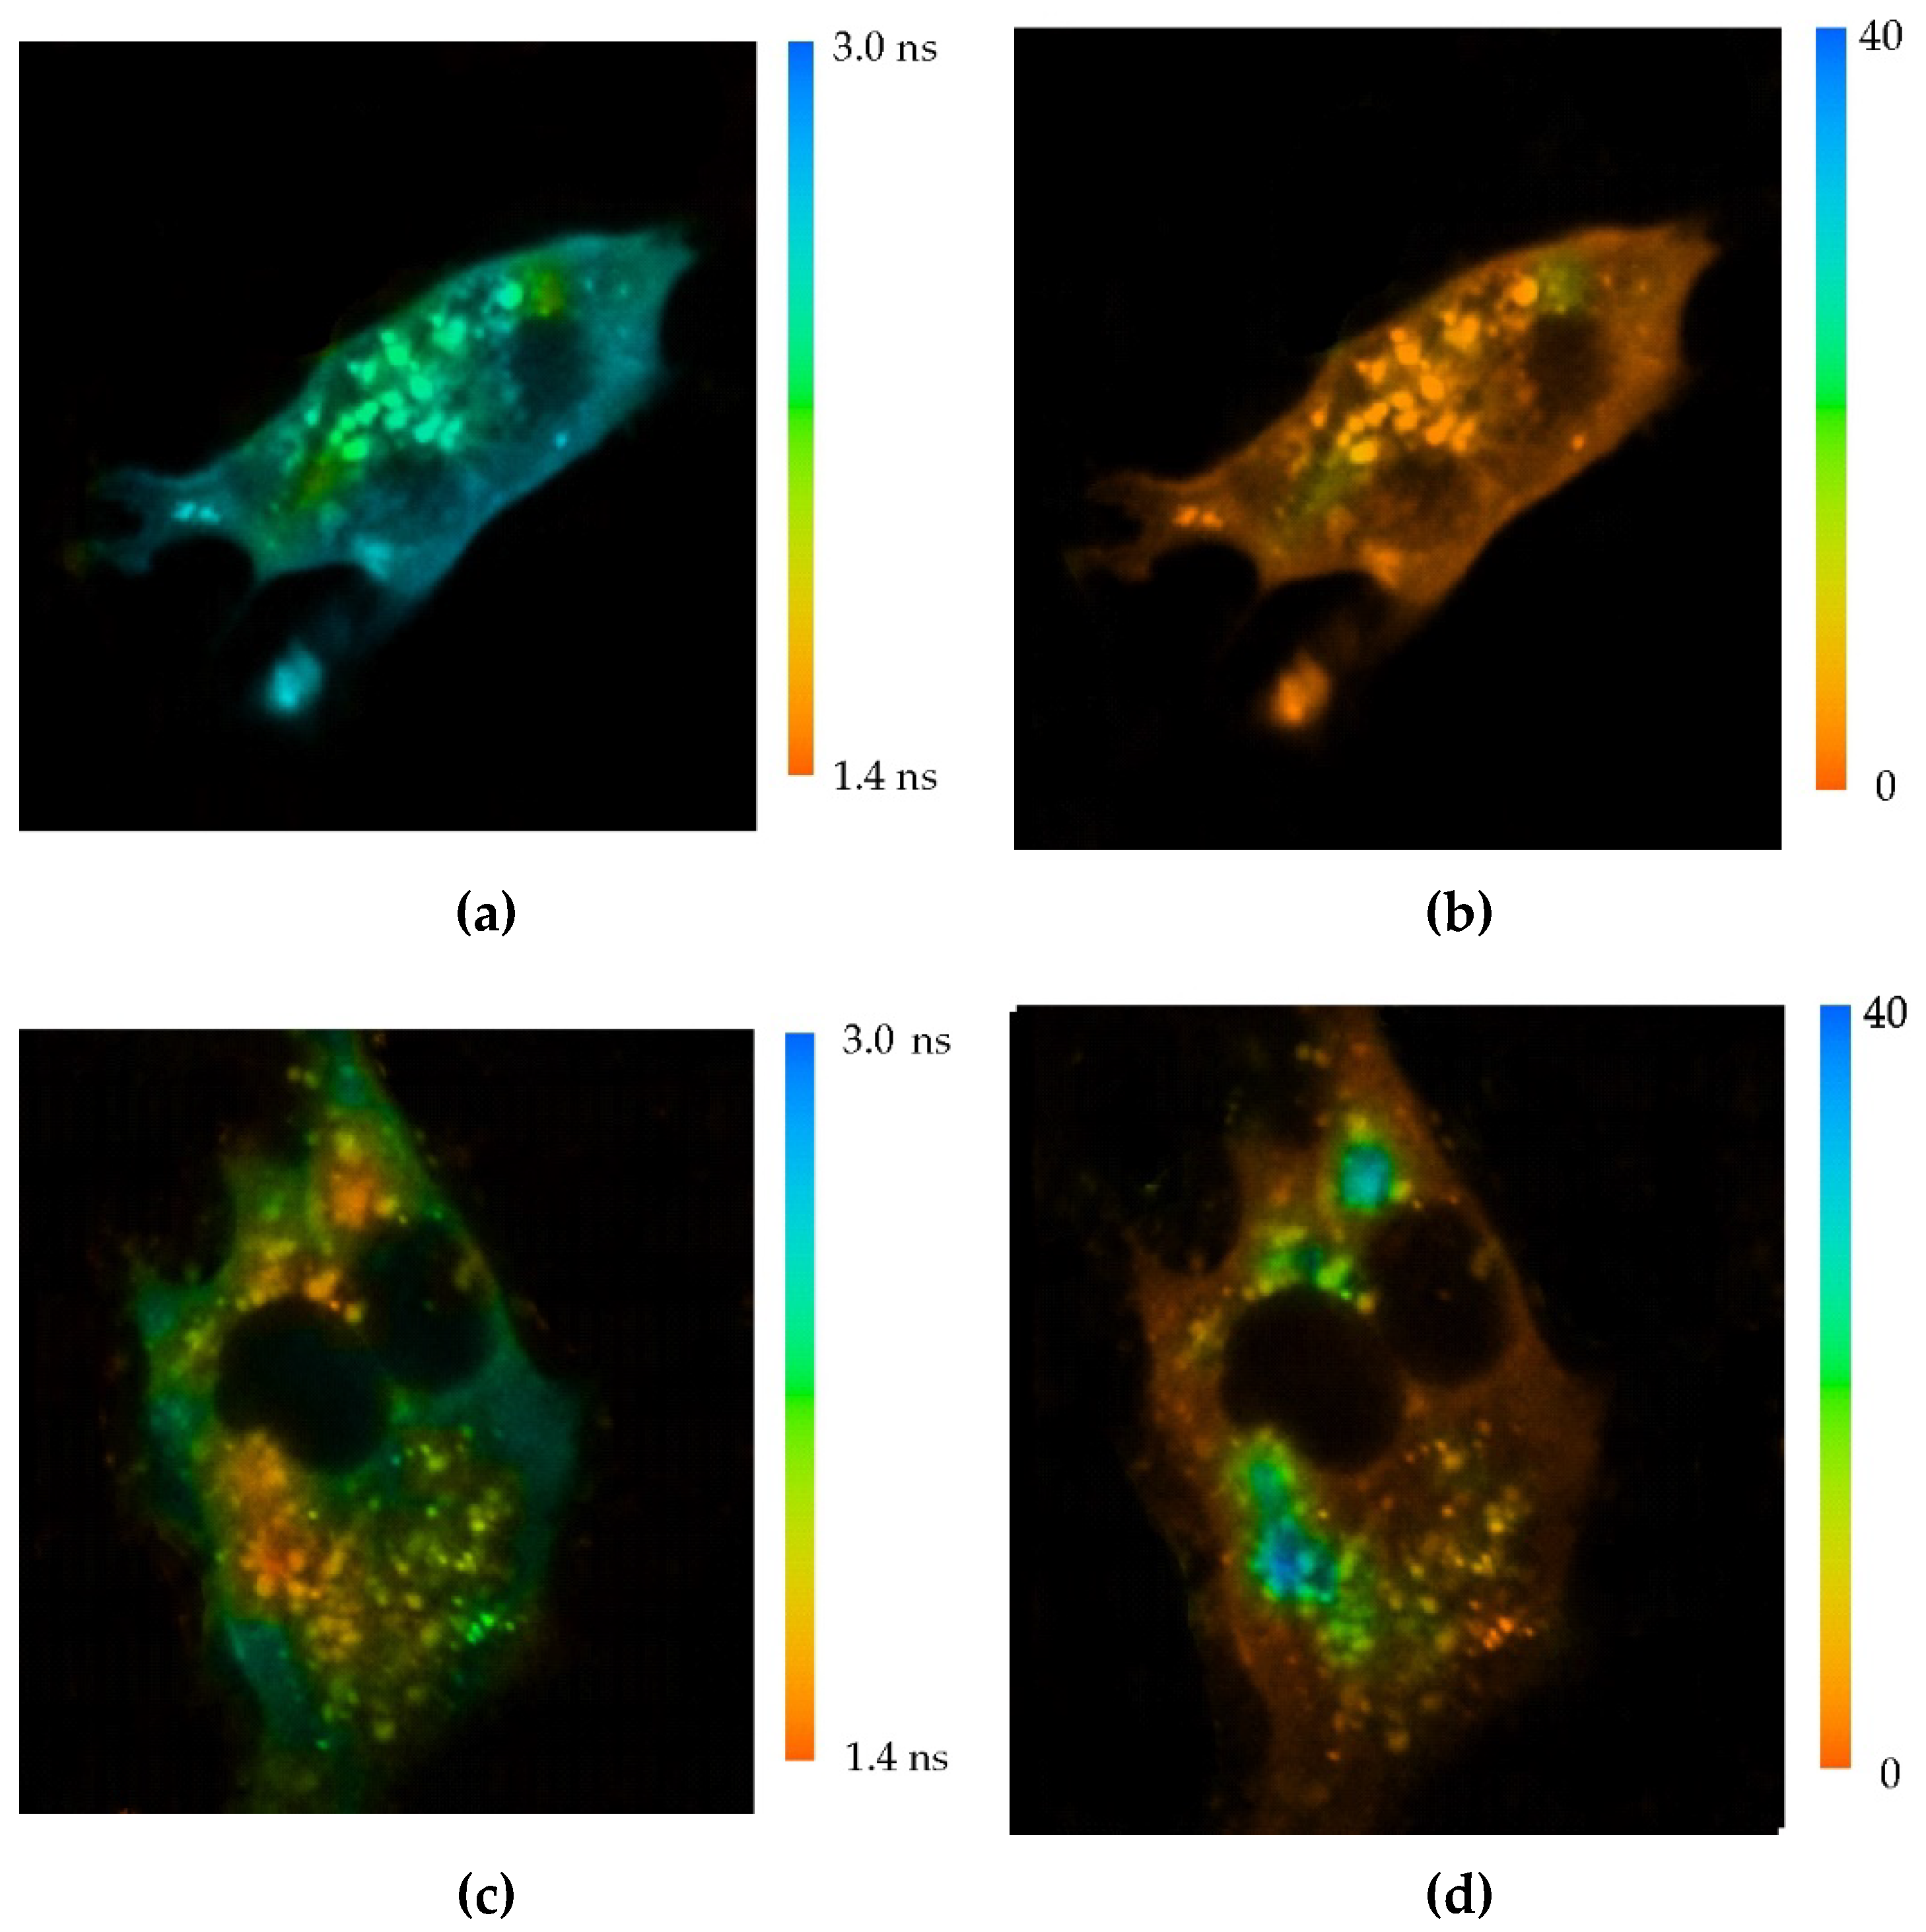
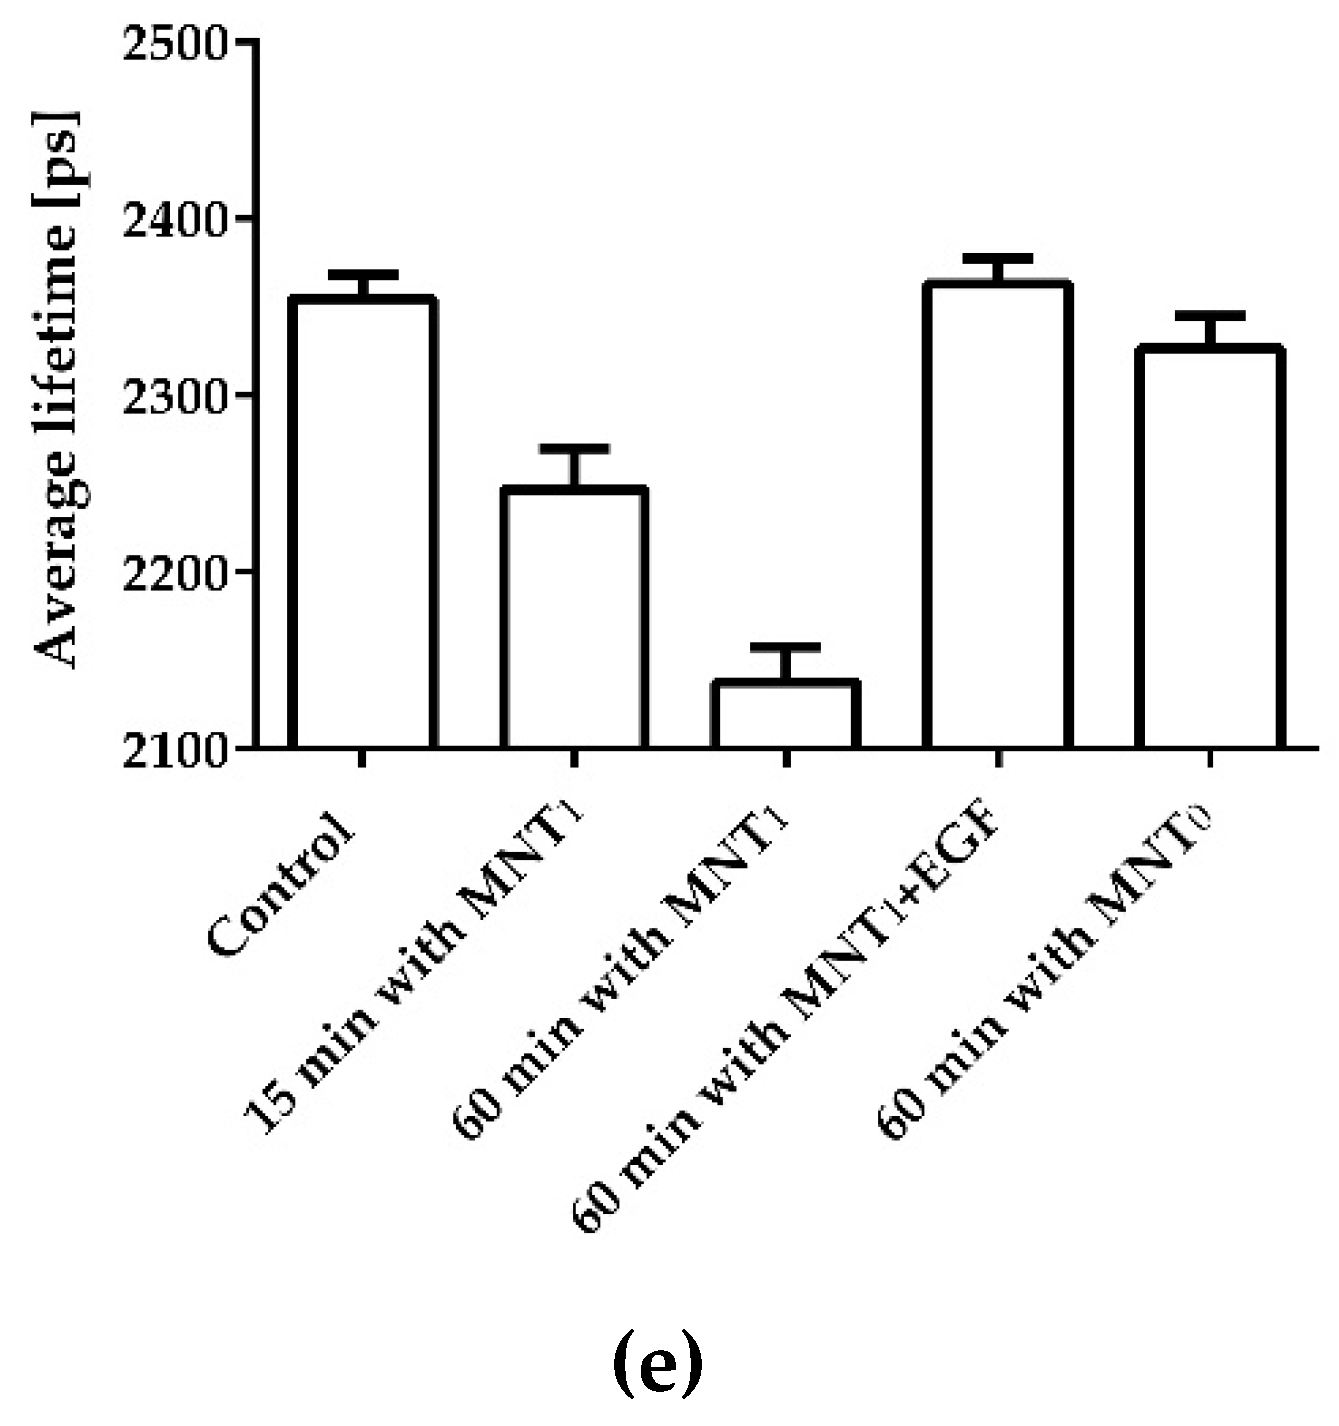
Figure 4.
Melting curves of Keap1 in its natural protein environment (blue curve), Keap1 bound to MNT1 (red curve), Keap1 after 15-minute incubation of cells with 500 nM MNT1 (black curve), Keap1 after 15-minute incubation of cells with 500 nM MNT0 (green curve), and Keap1 after 15-minute incubation of cells with 500 nM MNT1 at 4°C (wine curve) in AML-12 cells. The dependences are normalized to the band intensity at 37°C. Standard errors (SE) are shown (n = 3–9).
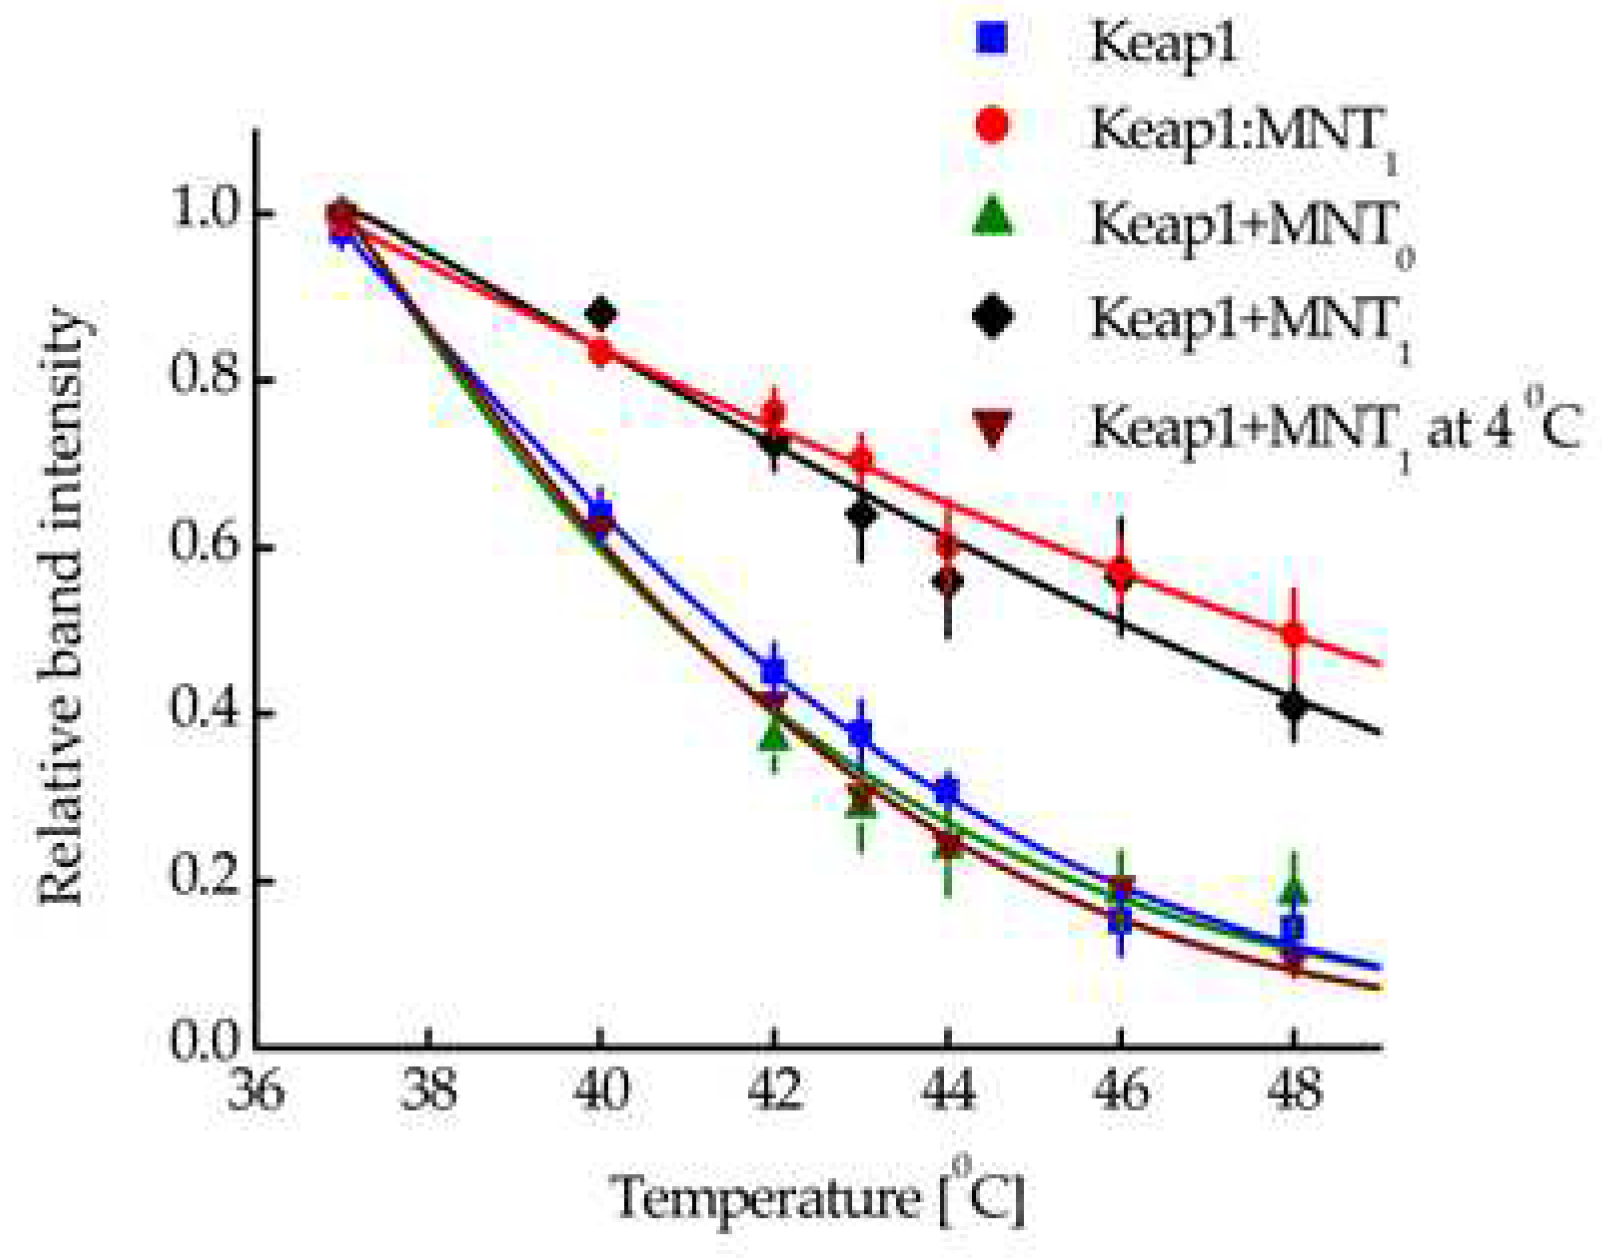
Figure 5.
(a) Competition for binding to human epidermoid carcinoma A431 cells with 125I-EGF for MNT1 (% of control). Error bars are SEM (n = 3). (b) Uptake of 125I-MNT1 by A431 cells. 125I-MNT1 was added to cells seeded in 24-well plates to a final concentration of 50 nM in DMEM medium with 10 mg/ml BSA and incubated at 37°C. At the indicated time intervals, cells were washed, treated with trypsin to remove surface-bound MNT1, and lysed by adding 1 M NaOH. Data are presented as means ± standard error (n = 3–4).
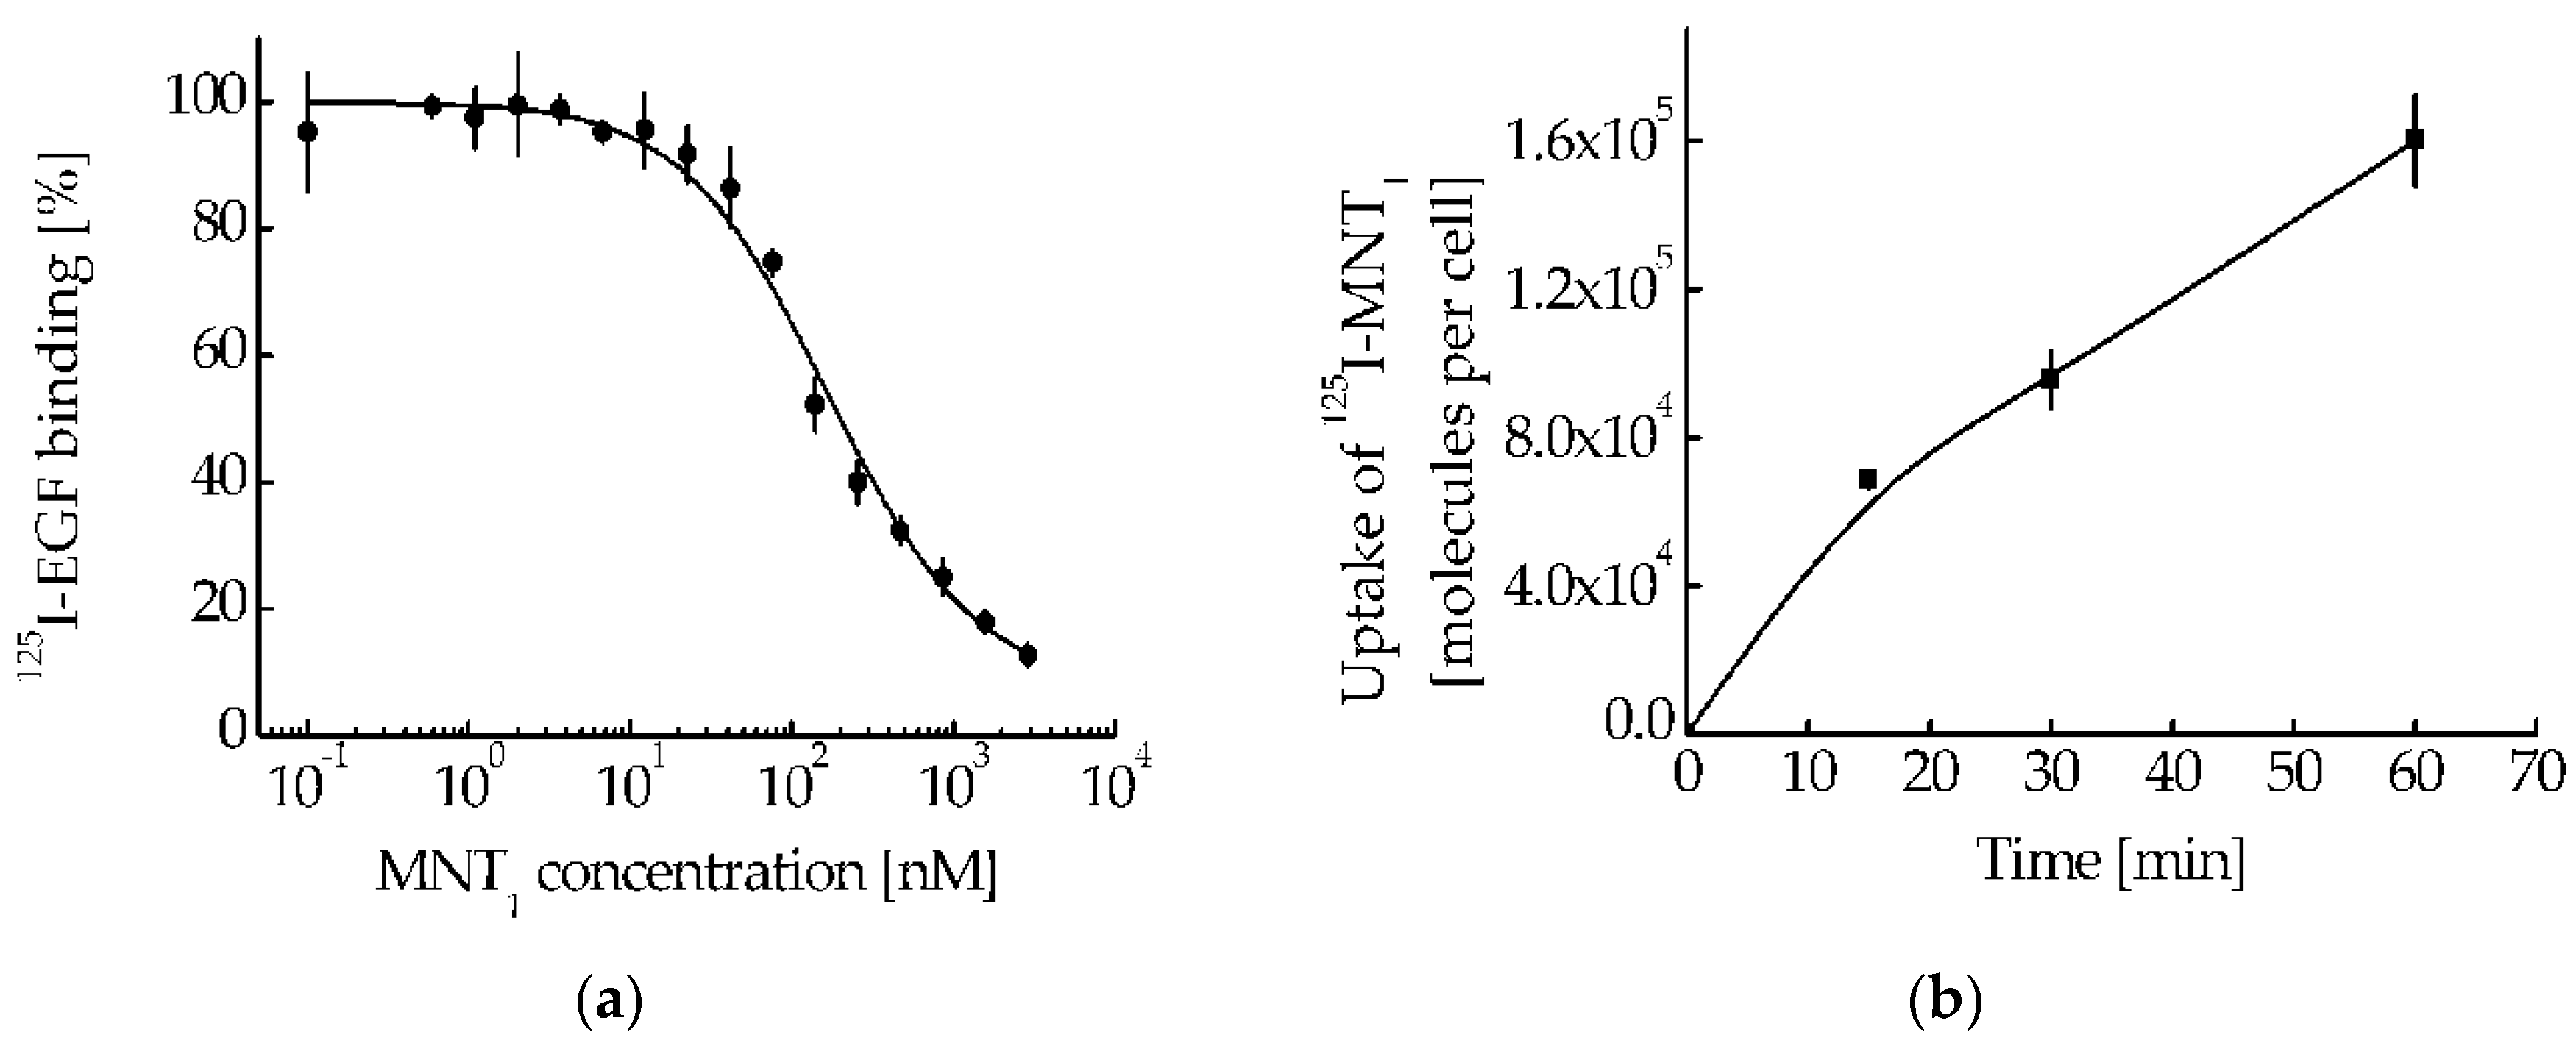
Figure 6.
The intensity of the signal recorded in A431 cells in the fluorescence channels AF488-MNT1 (A) and Mito Tracker red FM (B) upon multiphoton excitation of fluorescence at 800 nm (A) and 890 nm (B) 1 hour after incubation with AF488 labeled MNT1 and 15 minutes incubation with Mito Tracker red FM. Panel C is an overlay of panels A and B.

Figure 7.
Detection of colocalization of fluorescence of AF488 labeled MNT1 and mitochondria. (a) – image of the fluorescence intensity of the mitochondria-specific dye MitoTracker red FM (red) and MNT1 labeled with the dye AF488 (green). (b) – graph of the correlation between the fluorescence intensity of the MitoTracker red FM and AF488 dyes presented in panel (a). The correlation coefficient of the regression line shown in the graph is 0.77.
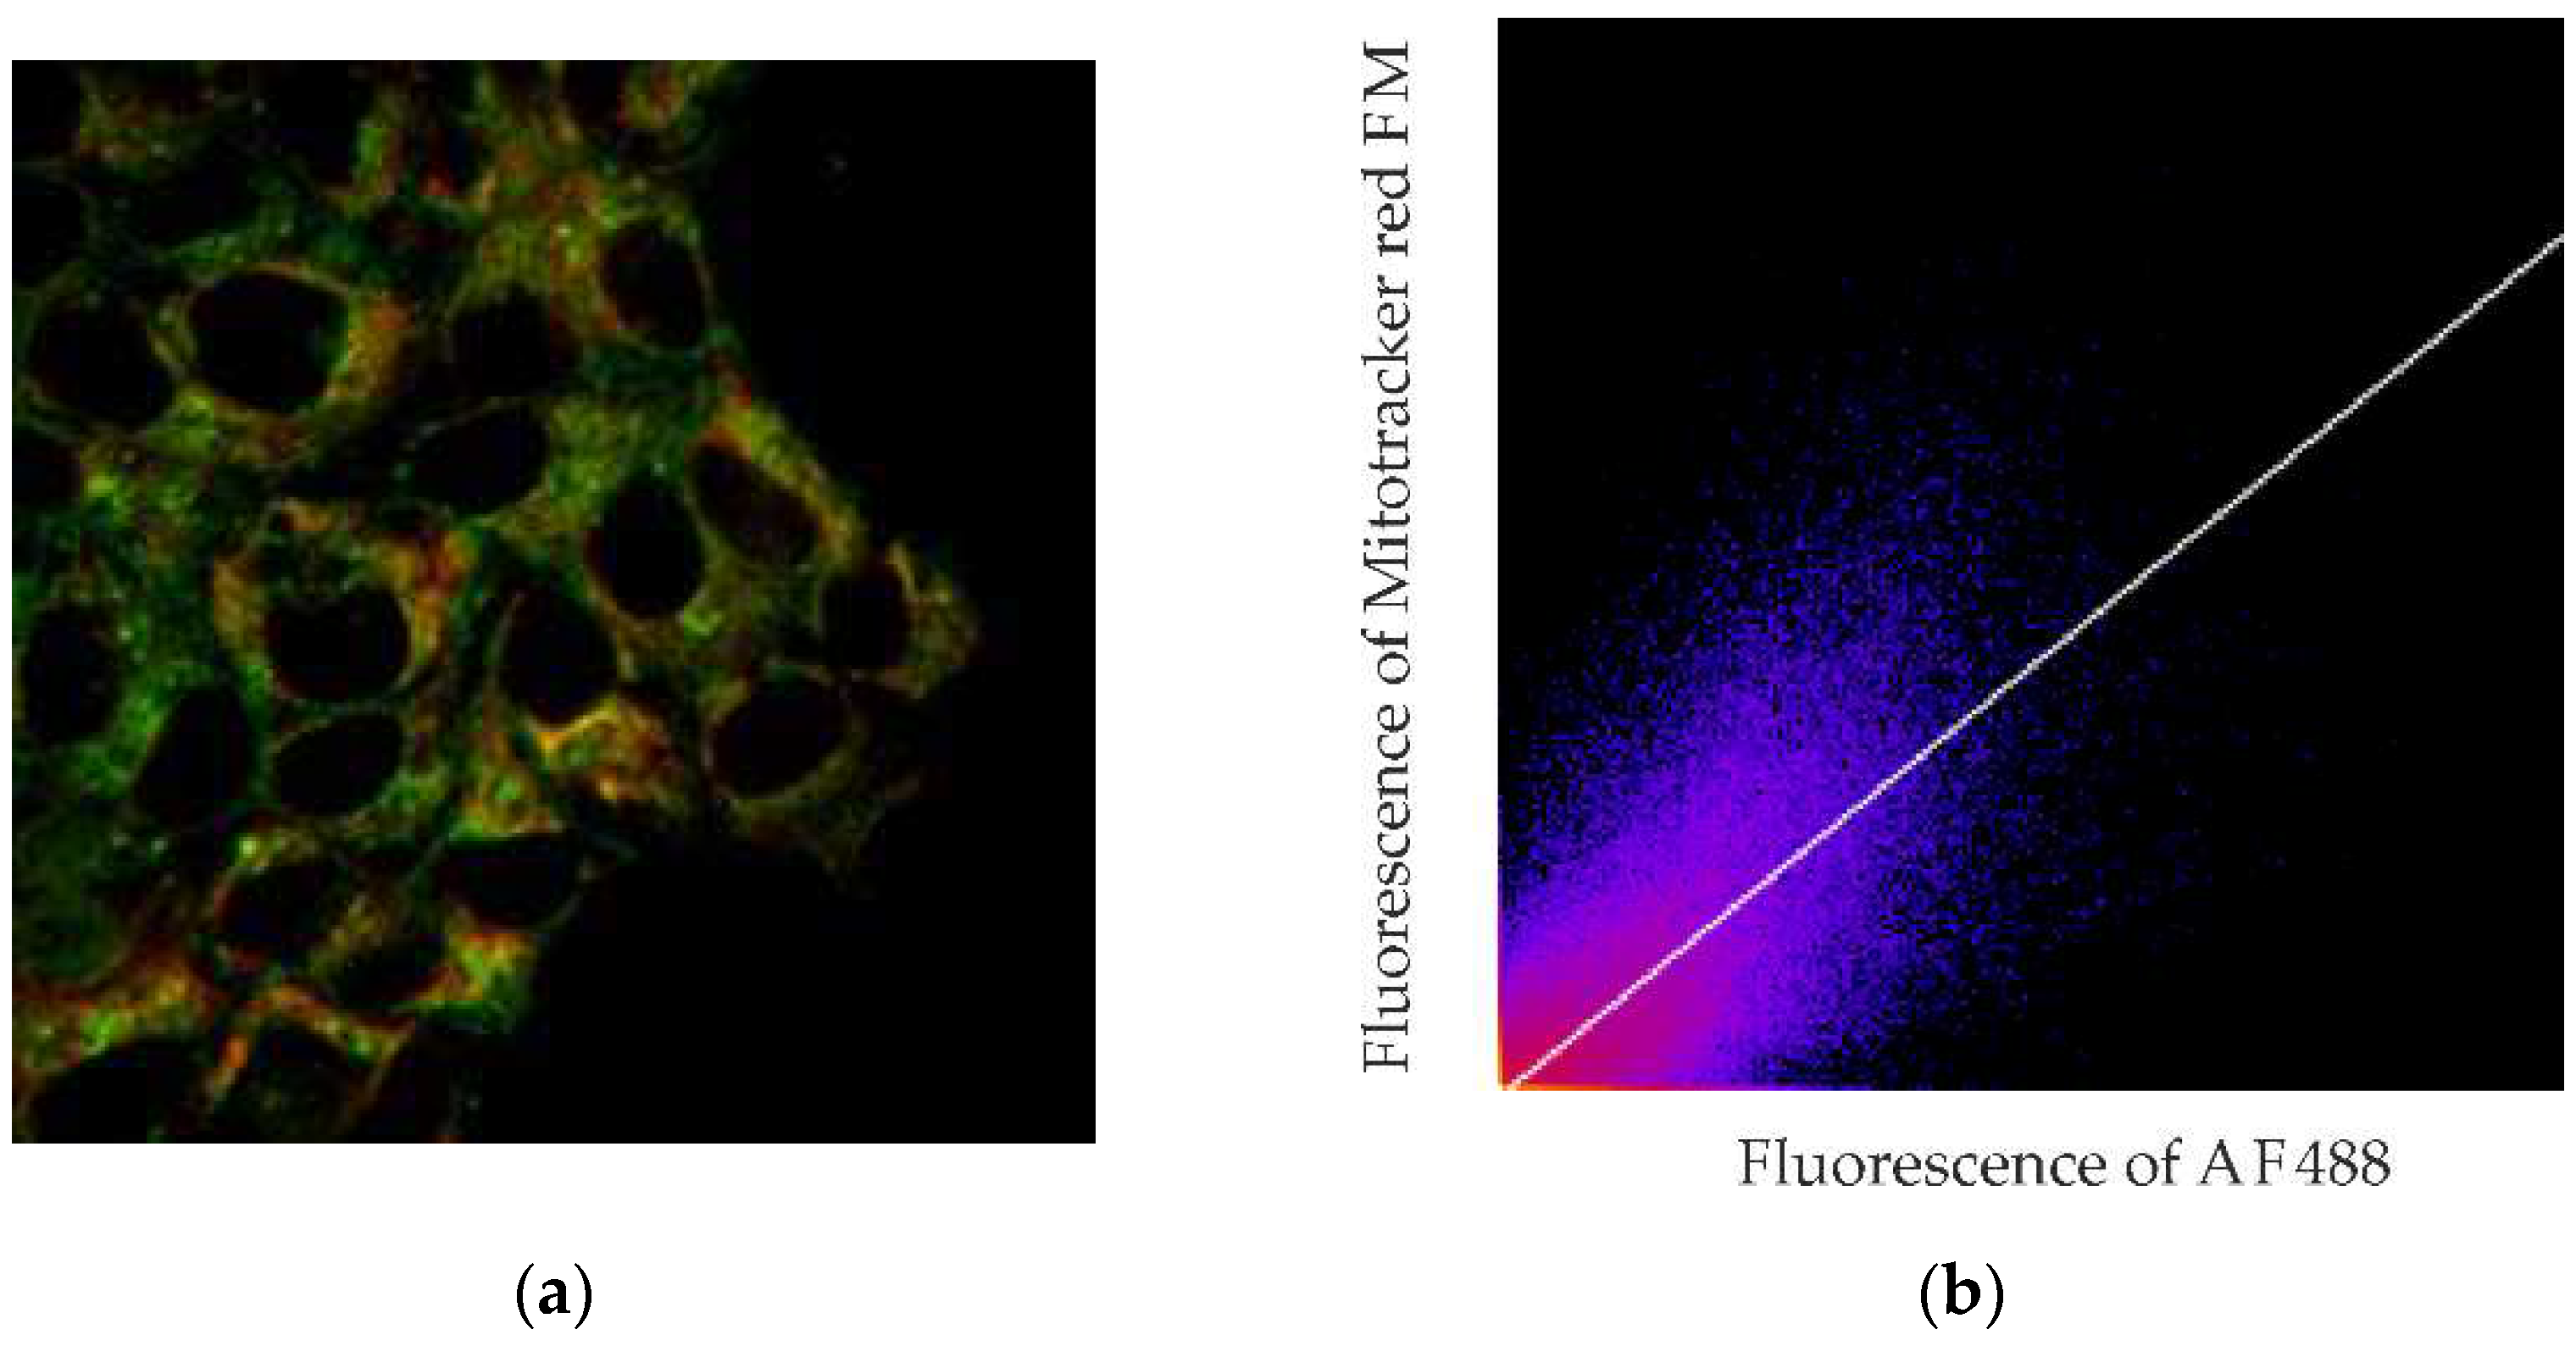
Figure 8.
Photocytotoxicity of MNT1-chlorine e6 conjugate compared to either free chlorine e6 or MNT0-chlorine e6 on A431 cells. Error bars represent SEM (n = 6-10).
Figure 8.
Photocytotoxicity of MNT1-chlorine e6 conjugate compared to either free chlorine e6 or MNT0-chlorine e6 on A431 cells. Error bars represent SEM (n = 6-10).
Disclaimer/Publisher’s Note: The statements, opinions and data contained in all publications are solely those of the individual author(s) and contributor(s) and not of MDPI and/or the editor(s). MDPI and/or the editor(s) disclaim responsibility for any injury to people or property resulting from any ideas, methods, instructions or products referred to in the content. |
© 2023 by the authors. Licensee MDPI, Basel, Switzerland. This article is an open access article distributed under the terms and conditions of the Creative Commons Attribution (CC BY) license (http://creativecommons.org/licenses/by/4.0/).
Copyright: This open access article is published under a Creative Commons CC BY 4.0 license, which permit the free download, distribution, and reuse, provided that the author and preprint are cited in any reuse.


