

Submitted:
05 November 2023
Posted:
06 November 2023
You are already at the latest version
Abstract
Human serum albumin (HSA) is multifunctional protein, known to be a natural carrier for a number of endogenous and exogenous compounds, including drugs. Formulating anticancer drugs with HSA is a clinically validated approach to improve the pharmacological properties and provide targeted delivery (passive and active) of cytotoxic payload to the tumor (such as in Abraxane). A number of receptors facilitating HSA uptake from systemic circulation have been characterized. What is interesting, such uptake may differ depending on the nature and quantity of ligands bound to HSA. Based on this, one might like to modify the HSA in a way that its distribution is more favorable for certain therapeutic purposes, thus ensuring more efficient delivery of the therapeutic cargo to disease site. E.g. Levofloxacin (LV), broad spectrum antibiotic drug, could benefit from extended systemic exposure, and stronger interaction with plasma proteins could be useful for this purpose. We have engrafted monomeric or polymeric CDs on the surface of HSA molecules to strengthen the LV adsorption (CD-LV dissociation constant is three orders of magnitude lower than that for HSA-LF). We have found that (HSA-HPolS)conj+LV exhibited the highest activity against E. coli, whereas (HSA-HPCD)conj+LV was the most effective against B. subtilis; and both HSA conjugates were more potent than LV alone or LV with HSA. Further fine-tuning of HSA could yield an improvement in biodistribution, and thus a more favorable risk/benefit ratio.
Keywords:
levofloxacin
; human serum albumin
; hydroxypropyl-β-cyclodextrin
; conjugate
; drug delivery systems
; antibacterial activity
1. Introduction
Blood contains essential drug-binding proteins such as human serum albumin (HSA) and acid glycoprotein, as well as lipoproteins and erythrocytes [1,2]. The binding of drugs to HSA and acid glycoprotein has been extensively studied over the past few decades. Human serum albumin (HSA) holds a preeminent position as one of the most abundant and compact proteins within blood plasma. HSA has eight binding sites, which can bind to both endogenous and xenobiotic compounds with varying affinities [3]. However, two major sites of HSA are primarily involved in ligand binding and exhibit a preference for acidic drugs. These two sites are also known as Sudlow site I (warfarin-azapropazone site) and Sudlow site II (indole-benzodiazepine site) [4]. Despite its large size, HSA is not limited to plasma but is distributed extravascularly, similar to acid glycoprotein [2]. HSA plays a pivotal role in transporting a wide array of metabolic compounds and therapeutic drugs. For example, HSA exhibits an intriguing ability to bind with albumin-binding proteins, particularly membrane-associated gp60 (albondin) and the secreted protein, acidic and rich in cysteine (SPARC) [5,6]. Albondin receptors, residing on the endothelial cells of tumor blood vessels, facilitate the transcytosis of albumin across continuous endothelial barriers. HSA's exceptional properties extend beyond its role as a transport protein; it has emerged as a promising candidate for gene therapy due to its remarkable ability to avoid unwanted interactions with serum components. Therefore formation of a drug-HSA complex can significantly impact the bioactivity and bioavailability of the drugs [3,7].
Levofloxacin (LV) stands out as a highly esteemed antibacterial agent with a broad spectrum of applications in the treatment of various diseases rooted in bacterial infections [8,9,10]. While LV demonstrates good efficacy, prolonged therapeutic regimens can give rise to adverse effects including bacterial resistance. Thus, it becomes imperative to devise drug delivery systems aimed at mitigating potential side effects. Cyclodextrins are widely used for this purpose [11].
Cyclodextrins (CDs), cyclic oligosaccharides, have gained widespread recognition in the field of pharmacology due to their remarkable ability to enhance the bioavailability and pharmacokinetics of inherently soluble yet lipophilic drugs [11,12,13]. Among these, Hydroxypropyl-β-cyclodextrin (HPCD) holds a prominent position as a highly soluble and easily synthesized CD. We have previously reported that LV forms a remarkably stable complex with HPCD, characterized by an association constant of (1.0 ± 0.3) × 103 M−1[14].
To achieve more substantial effects, we proposed the use of macromolecules constructed from CDs covalently linked to one another [15,16]. In this study, our focus was on investigating the complexation of LV with a polymer synthesized through the crosslinking of HPCD tori with succinic acid, denoted as LV+HPolS. Detailed descriptions of these complexes can be found in our previous publications. The LV+HPolS complex exhibits an association constant of (2.2 ± 0.4) × 105 M−1[16].
Human serum albumin (HSA) is a crucial blood plasma protein with multifaceted functions, including the maintenance of osmotic pressure, pH buffering, and the transport of diverse substances [17]. Furthermore, HSA plays a pivotal role in shaping the pharmacokinetic and biodistribution profiles of drug molecules. Hence, it is promising to devise drug delivery systems that leverage the modulatory potential of HSA in these physiological processes [3].
In our current study, we embarked on the creation of novel drug delivery systems for Levofloxacin (LV) using HSA grafted with monomeric or polymeric HPCD. These innovative developments hold great promise, primarily owing to their non-cytotoxic nature and the capacity for prolonged circulation within the bloodstream. So, we have synthesized three types of HSA-based particles: complexes of LV with (HSA−HPCD) and (HSA−HPolS) conjugates in comparison with conjugates of non-grafted HSA−LV. Here we studied the molecular details of the HSA grafting by monomeric or polymeric HPCD ((HSA−HPCD)conj and (HSA−HPolS)conj influence on the interaction of HAS with LV. We also sought to investigate how the creation of such systems would impact the physico-chemical properties and antibacterial efficacy of levofloxacin (LV) concerning both Gram-positive (Bacillus subtilis) and Gram-negative (Escherichia coli) bacterial cells.
2. Materials and Methods
2.1. Materials
Levofloxacin (LV), 2-hydroxypropyl-β-cyclodextrin (HPCD) with a hydrogen substitution degree of 1-1.3 in one D-glucopyranose link, succinic anhydride, and human serum albumin (HSA), Woodward's reagent, carbonyldiimidazole, 2-(N-morpholino)ethanesulfonic acid (MES) were acquired from Sigma-Aldrich (St. Louis, MO, USA).
2.2. Methods
2.2.1. Synthesis of HPCD-based polymer linked by succinic anhydride (HPolS)
According to [15] HPCD-based polymers linked by succinic anhydride were obtained. Concisely, the required amount of HPCD solution (C = 60 mg/mL) in the presence of NaH2PO4 incubated at 100°C. Then, we added the linker's aqueous solution (3 M of succinic anhydride) dropwise into the reaction mixture, which was stirred for 1.5 h. The molar HPCD : linker ratio was 1:15.
We purified HPolS by dialysis (cut-off molecular weight 12 kDa membrane, Serva, Heidelberg, Germany). Then the polymer was dried for 24 h at 37°C.
The concentration of CD-torus in HPolS determined by FTIR spectroscopy using the calibration dependence for the 1032 cm−1 band (C−O−C bond in CD torus).
2.2.2. Synthesis of HSA Conjugates with HPCD or HPolS
To obtain conjugates of HSA with HPCD or HPolS, at the first stage the hydroxyl groups in the ligands were activated using carbonyldiimidazole (CDI). 120 µl of ligands (0.1 M solution of HPCD or 0.065 M solution of HPolS) and 900 µl of 0.04 M CDI solution were mixed with 4.980 ml of PBS buffer. The solutions were incubated at room temperature and constantly stirred for 2 hours. Then, 2 ml of 0.4 mM solution of HSA was added to each sample and mixed at room temperature for 12 h. At the last stage, the conjugates were washed from unreacted reagents by dialysis (cut-off molecular weight 3.5 kDa membrane, Serva, Heidelberg, Germany) and lyophilized.
2.2.3. Synthesis of HSA conjugates with LV
To obtain protein conjugates with LV, the carboxyl group of the drug was previously activated with Woodward’s reagent (WRK). For this, 300 µl of LV solution (СLV = 8 mM in MES, pH = 5.0) was added to 600 µl of WRK solution (СWRK = 12 mM, pH = 3.5) and 5 ml MES buffer solution, the reaction mixture was incubated at room temperature while constantly being stirred for 2 h. The molar ratio of the components in the reaction was 1 : 3 for LV : WRK). After that, to 2 ml of the resulting solution, the HSA solution (СHSA = 0.08 mM in PBS buffer solution, pH = 7.4) was added in a volume of 2 ml and incubated at room temperature and constantly being stirred for 3 h. The mole ratios of LV : HSA were 1 : 5 and 1 : 10. Finally, both conjugates were washed from unreacted reagents by dialysis (cut-off molecular weight 3.5 kDa membrane) and lyophilized.
2.2.4. Obtaining non-covalent complexes with LV
Non-covalent conjugate complexes with LV were obtained by mixing solutions of LV and (HSA-HPCD)conjor (HSA-HPolS)conj in a molar ratio of 1 : 1 for LV : CDtori in a sodium-phosphate buffer solution and incubation at 37℃ for 40 minutes.
2.2.5. UV-Vis Spectrophotometry
UV spectra were acquired utilizing the Ultrospec 2100 Pro apparatus procured from Amersham Biosciences, San Francisco, CA, USA. Absorption spectra for LV, WRK, and their mixture were recorded using a quartz cell with an optical path length of 1 cm, sourced from Hellma Analytics, Jena, Germany, encompassing the spectral range spanning from 200 to 450 nm.
2.2.6. FTIR Spectroscopy
FTIR spectra of the sample solutions were acquired using a Bruker Tensor 27 spectrometer (Ettlingen, Germany) equipped with an attenuated total reflection cell with a ZnSe single-reflection crystal. Spectra were recorded within the wavenumber range of 2500–900 cm−1 with a 1 cm−1 resolution, averaging 3 measurements of 70 scans each. Data analysis was conducted using Opus 7.0 software.
The assessment of secondary structural components in the samples containing albumin was accomplished through an in-depth analysis of FTIR spectra within the spectral region spanning from 1700 to 1600 cm−1. The primary spectral bands were meticulously identified through the application of the second derivative technique, followed by spectrum deconvolution employing the Levenberg–Marquardt algorithm.
2.2.7. Circular Dichroism Spectroscopy
Circular dichroism (CD) spectra were recorded using the J-815 spectrometer by Jasco (Tokyo, Japan). The measurements were conducted at 25 °C in quartz cuvettes with a path length of 1 mm, spanning a wavelength range of 200–260 nm. Spectra were acquired through five scans at 1 nm intervals, with an HSA concentration of 0.02 mM. The content of secondary structures, the obtained spectra were subjected to analysis using the CDNN program, Version 2. Each experiment was repeated three times, and the results were reported with a standard deviation (SD) of 3 (n = 3).
2.2.8. Fluorescence Spectroscopy
Fluorescence measurements were performed using the Varian Cary Eclipse spectrophotometer, manufactured by Agilent Technologies (Santa Clara, CA, USA). The emission spectra of HSA were recorded under controlled conditions at 37 ± 0.1 °C. A 10 mm quartz cuvette was employed for the measurements, and the excitation wavelength was set at 280 nm. The emission scans were conducted with a 1 nm step within the wavelength range of 290–550 nm. It's noteworthy that the protein concentration was consistently maintained at 0.02 mM, using a PBD buffer solution, pH 7.4.
To assess the quenching of protein fluorescence by small molecules, we applied the Stern–Volmer Equation (1). This equation takes into account both statistical and dynamic quenching effects [18].
the equation includes 0 and , which represent the fluorescence intensities in the absence and presence of a drug form (quencher), , which is a Stern–Volmer constant, [Q]—the molar concentration of the quencher, and —the bimolecular constants of quenching rate and the lifetime of HSA’s fluorescence in the absence of the quencher, respectively. To determine the binding constant () of HSA to the drug form and the number of binding sites (n), we used Equation (2) at a controlled temperature:
We calculated thermodynamic parameters, including the Gibbs free energy change (ΔG), enthalpy change (ΔH), and entropy change (ΔS) of the reaction using the Van't Hoff equation:
where R is universal gas constant, T is the temperature.
2.2.9. Release Kinetic Studies
The release of LV was investigated using a dialysis method. Specifically, 2 mL of the sample was placed in a dialysis bag with a molecular weight cutoff (MWCO) of 3.5 kDa (Orange Scientific, Belgium). The entire system was incubated at 37°C with gentle agitation at 150 rpm, and UV or fluorescence spectra of the external solution were recorded over time.
The experiment considered 100% of LV as released when the concentration of LV inside the dialysis bag equaled the concentration of LV in the external solution, representing 50% of the initial LV's concentration.
2.2.10. Evaluation of Antibacterial Activity in Vitro Studies
In this investigation, two bacterial strains, namely Escherichia coli (ATCC 25922) and Bacillus subtilis (ATCC 6633), sourced from the National Resource Center Russian collection of industrial microorganisms at the SIC “Kurchatov Institute,” were utilized. These strains were cultured for a period of 18–20 hours at 37°C to attain a concentration of approximately 2 x 10⁸ colony-forming units per ml (CFU/mL), a quantification method based on A600 measurements, in the liquid nutrient medium Luria–Bertani (pH 7.2). It is noteworthy that E. coli cultures were cultivated without agitation, while B. subtilis cultures were stirred at 170 rpm.
For the microbiological tests, the suspensions of the bacterial cultures were standardized to a 0.5 McFarland standard, resulting in a CFU concentration of approximately 0.3 x 10⁸ (CFU) in the liquid LB nutrient medium (pH 7.2). Subsequent experiments in the liquid medium involved adding 100 µL of the test samples (the concentration of LV in each sample was 10 ng/ml or 50 ng/ml) to 5000 µL of the bacterial cultures. These samples were then incubated at 37°C for a duration of four days. At specific time points, 100 µL from each sample was extracted and diluted with PBS. Subsequently, the absorbance was measured at 600 nm, with concurrent CFU controls.
To quantitatively assess the relationship between CFU (cell viability) and the concentration of LV, 50 µL of each sample was diluted in the range of 106–108 times and plated on Petri dishes. These Petri dishes were subsequently incubated at 37°C for 24 hours, after which the number of colonies (CFU) was determined.
3. Results and Discussion
The formation of LV+HPCD or LV+HPolS complexes is advantageous in enhancing solubility and extending the duration of LV's therapeutic action. However, cyclodextrins (CDs) can partially shield LV's binding sites on HSA. To achieve more significant enhancements in LV's pharmacodynamic and pharmacokinetic attributes, in this work we developed new drug delivery system based on the HSA grafted with monomeric or polymeric HPCD.
For synthesis of the conjugates with HSA (HSA grafted by CDs), we used 2-hydroxypropyl-β-cyclodextrin (HPCD) since this substance is able to form quite stable inclusion complexes by the «guest-host» mechanism with LV (Ka (LV+HPCD) = (1.0 ± 0.3) × 103 M−1) [14]. The formation of HPCD+LV non-covalent complex affect the physico-chemical parameters of the drug [12]. Previously, we have shown that the polymers based on CDs provide more significant effect on LV’s biopharmaceutical properties, enhance its antibacterial properties, solubility and bioavailability. So, we used a polymer based on HPCD (the polymer - HPolS) which shows a number of improved properties, such as higher association constant Ka (LV+HPolS) = (1.0 ± 0.1) × 106 M−1, prolonged action and increasing the antibacterial activity. Polymer synthesis was carried out according to our previous article [15], succinic anhydride was used as a linker, since it is a biocompatible bifunctional crosslinking agent. The hydrodynamic diameter of polymer nanoparticles is 200 nm and the ζ-potential is -0.6 mV (Table 1).

Table 1.
Physicochemical properties of non-covalent complexes of LV and CDs.
| Parameter | HPCD | HPolS |
|---|---|---|
| ζ-potential, mV | 0 | -0.6± 0.02 |
| Hydrodynamic radius, nm | 0.15 | 200± 20 |
| Ka with LV, M−1 | (1.0 ± 0.3) × 103 | (1.0 ± 0.1) × 106 |
3.1. Synthesis of HAS grafted by monomeric and polymeric HPCD
The synthesis of HSA conjugates with HPCD or HPolS initiated by the activation of the hydroxyl group in the ligand using carbonyl diimidazole (CDI) (Figure 1). CDI forms highly reactive imidazolyl–carbamate intermediates upon reaction with alcohols. The imidazolyl–carbamate group is highly electrophilic and readily undergoes nucleophilic attack by a variety of nucleophiles, including amines, thiols, and carboxylic acids, leading to the formation of amides, thioesters, and esters with high yields [19,20,21]. In the second stage, the HSA was added, which reacted with the activated ligand due to the high content of lysine residues. As a result, conjugates with a covalent urethane bond were obtained (HSA-HPCD)conj and (HSA-HPolS)conj, the formation of which was monitored using FTIR.
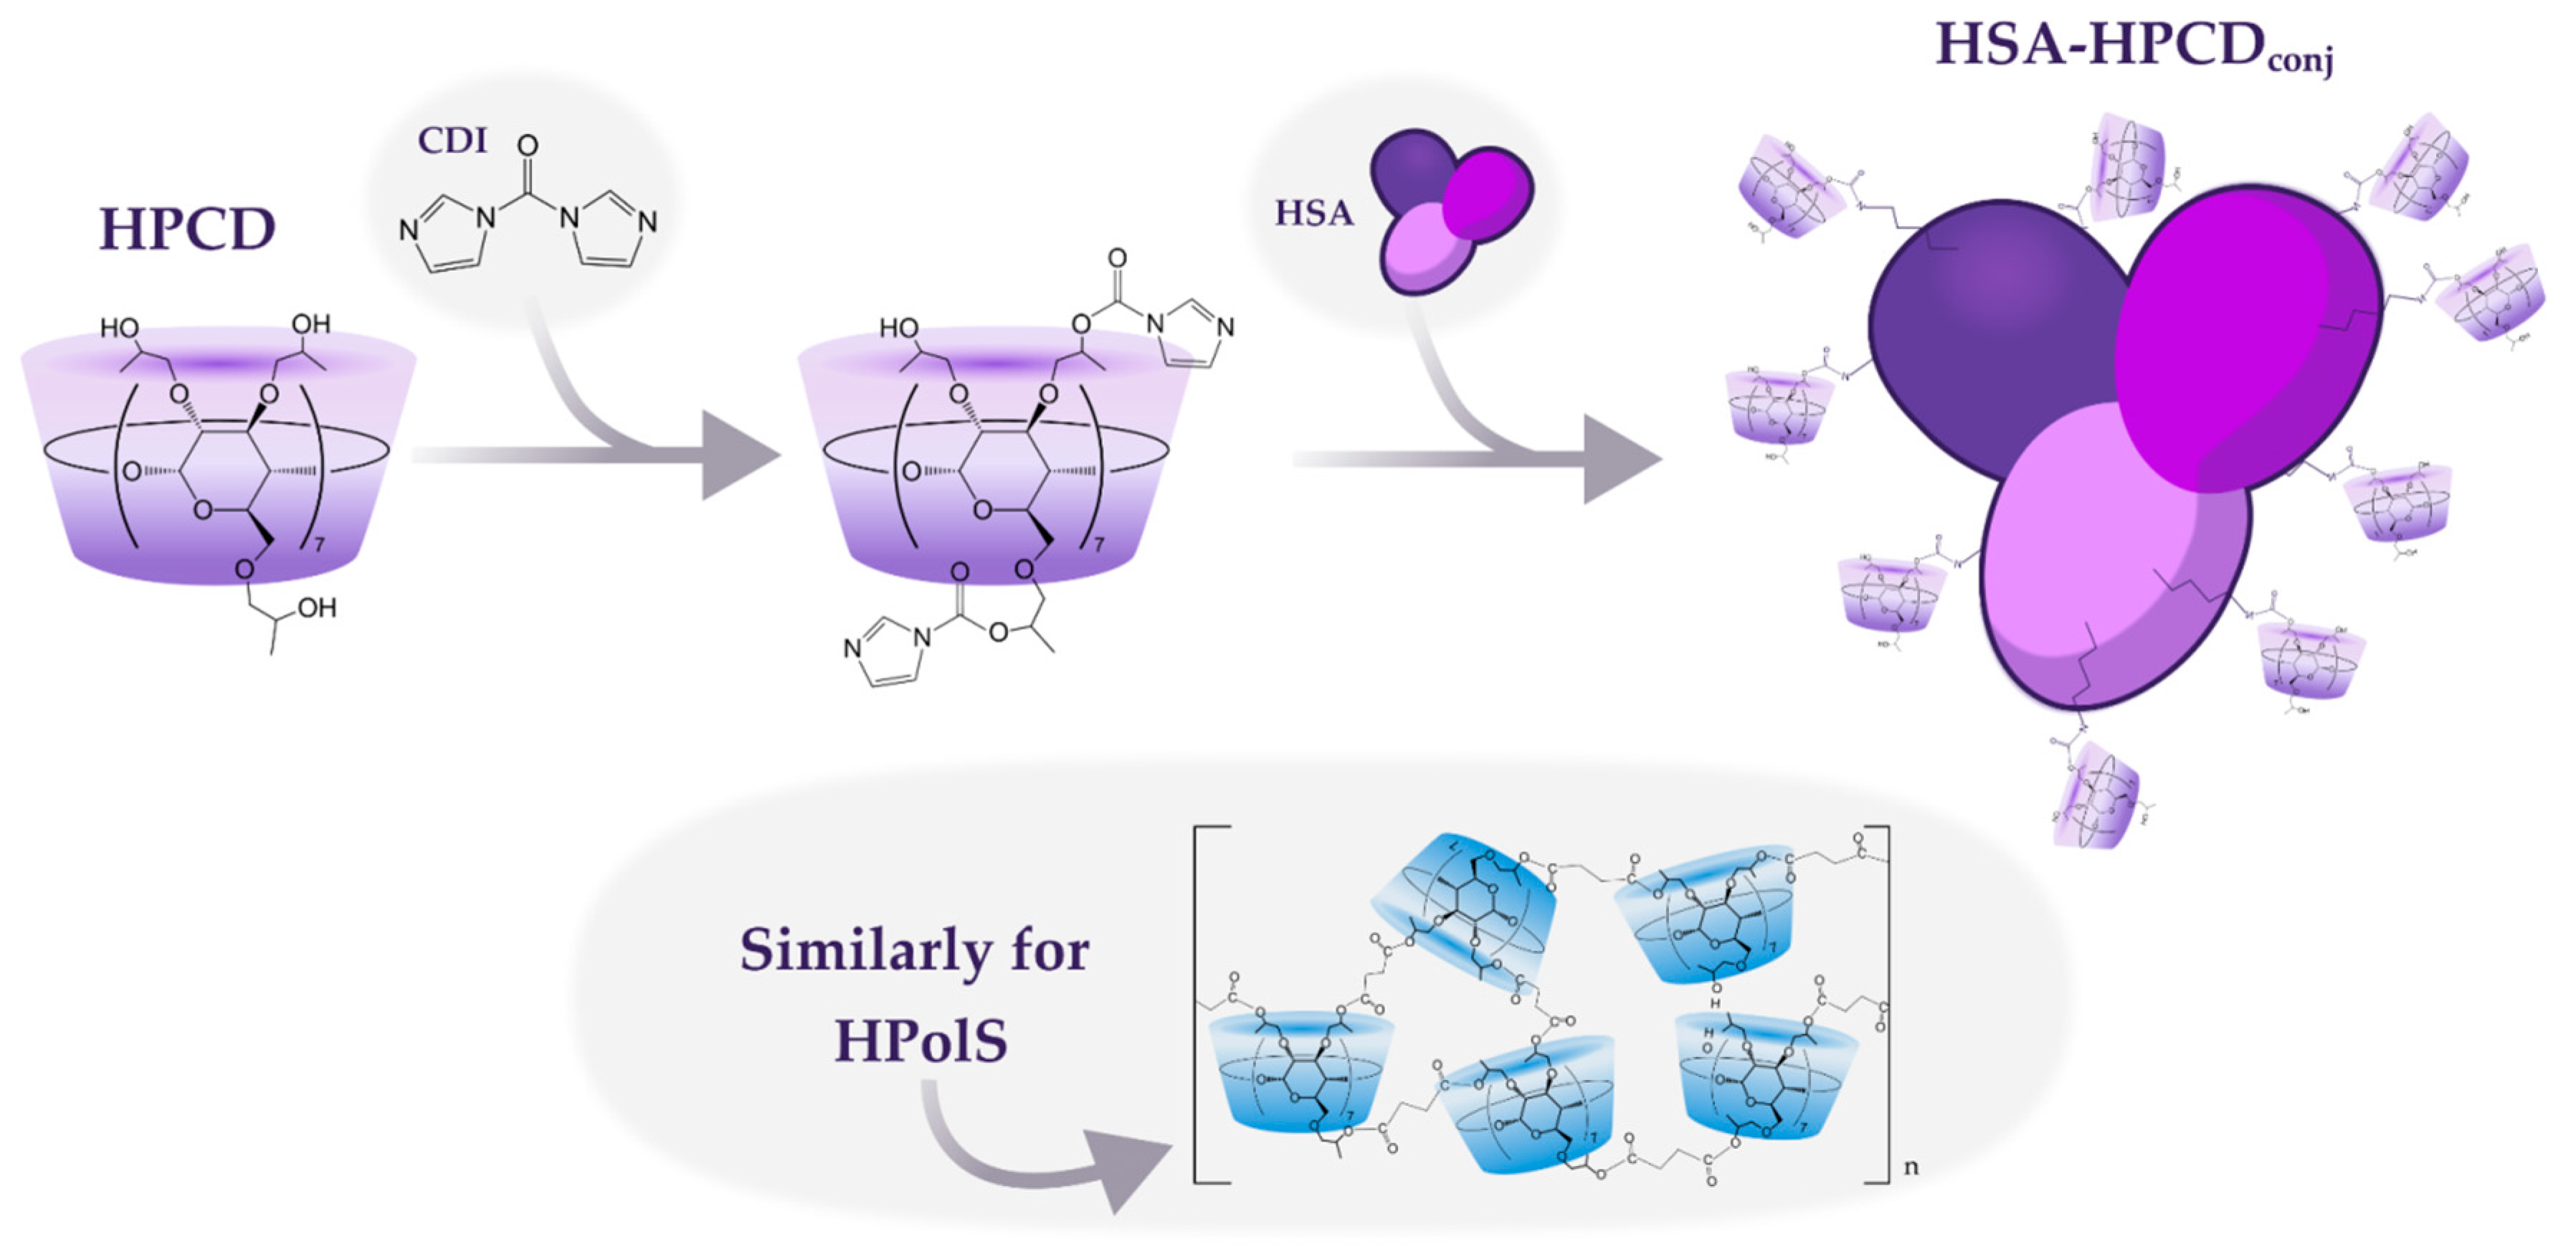
Figure 1.
The scheme of conjugates’ synthesis of 2-hydroxypropyl-β-cyclodextrin (HPCD) or polymer based on HPCD (HPolS) with human serum albumin (HSA), PBS, pH = 7.4, T = 22℃.
Figure 1.
The scheme of conjugates’ synthesis of 2-hydroxypropyl-β-cyclodextrin (HPCD) or polymer based on HPCD (HPolS) with human serum albumin (HSA), PBS, pH = 7.4, T = 22℃.
To improve the biopharmaceutical characteristics of the LV, in this study we synthesized conjugates of the LV with HSA with a high degree of drug’s inclusion. Two types of HSA conjugates with LV were obtained: with a covalent and non-covalent bond between the protein and the drug molecule. In the first case, a covalent bond was formed between the carboxyl group of LV and the amino group of lysine residues of the protein (Figure 2a). To do this, at the first stage, activation of the carboxyl group was carried out using Woodward reagent (WRK), which is an isoxazolium salt that causes a specific and rapid modification of carboxylic groups in various molecules [22]. Initially, this reagent was developed for the synthesis of peptides [23], now it is used to activate carboxyl groups in various compounds [24]. At the next stage, a HSA's solution was added to the activated LV molecule, resulting in an amide bond between the protein and LV.
Upon the reaction LV with WRK, a novel absorption peak emerged in UV spectrum around 345 nm. This spectral feature may serve as an indication of the formation of a stable enol ester bond, resulting from the modification of LV's carboxylate group by WRK [25,26]. Remarkably, this peak exhibited substantial augmentation within the initial twenty minutes of the experiment. However, beyond the 20-minute mark, no significant changes were observed in this band. So, the conjugation reaction was completed. Our scrutiny of the UV spectra over a 2-h period unveiled a gradual diminishment of the 290 nm band (assigned to WRK), indicative to the hydrolysis of WRK [27].
As the second system, non-covalent LV complexes were obtained with the conjugates HSA-HPCDconj and HSA-HPolSconj described above (Figure 2b). Сyclodextrins are able to form inclusion complexes with large binding constants ~104—106 М-1[28,29] non-covalent complexes with an antibacterial molecule. One may expect that the formation of non-covalent complexes between LV and (HSA-HPCD)conj or (HSA-HPolS)conj (Figure 2b) would exhibit high binding affinities. The binding constants for these systems were subsequently calculated through fluorescence spectroscopy analysis and are thoroughly discussed in the next section.
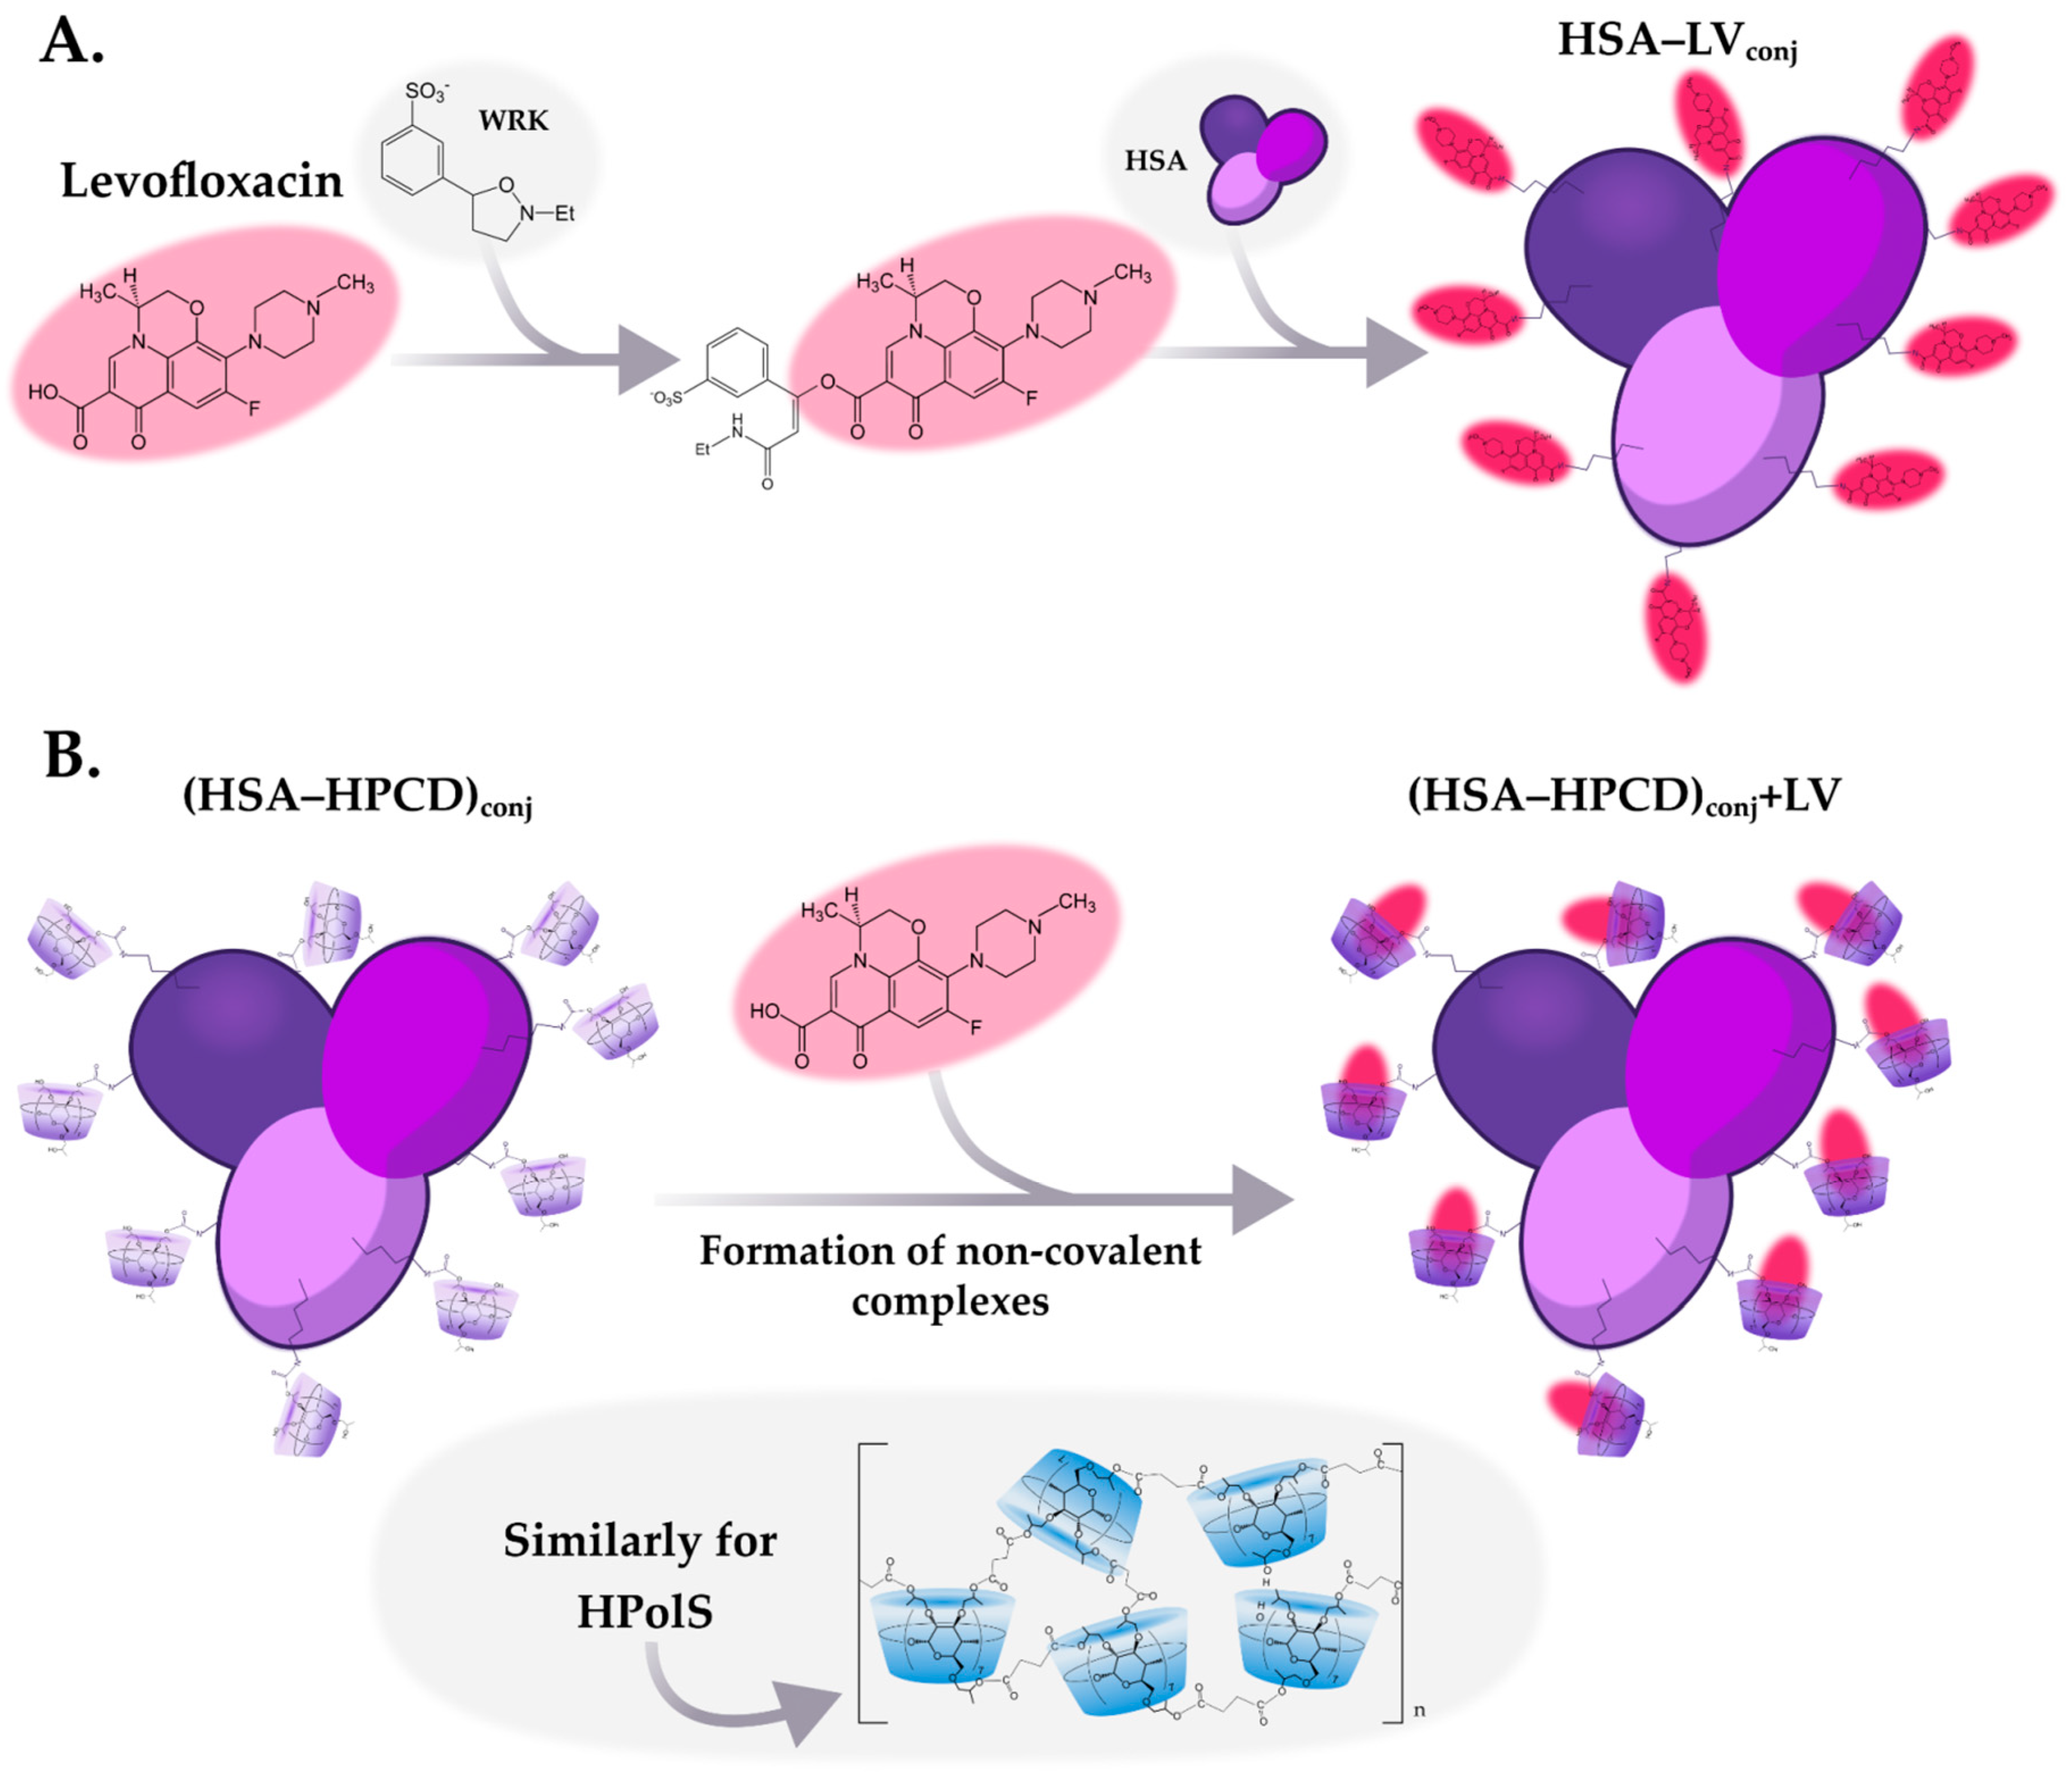
Figure 2.
(a) The scheme of conjugates’ synthesis levofloxacin (LV) with HSA; (b) The scheme of synthesis of non-covalent complexes LV with conjugates, PBS, pH = 7.4, T = 22℃.
Figure 2.
(a) The scheme of conjugates’ synthesis levofloxacin (LV) with HSA; (b) The scheme of synthesis of non-covalent complexes LV with conjugates, PBS, pH = 7.4, T = 22℃.
3.2. FTIR and structure features of synthesized molecules
Figure 3ab provides a visualization of the FTIR spectra for the conjugates HSA–HPols, HSA–HPCD in comparison with free HSA, HPCD, and HPolS. The cross-linking between HSA and HPolS or HPCD involves the formation of carbamate (urethane) bonds. These bonds appeared between Lysine (Lys) residues in HSA and hydroxyl groups within the CDs activated using CDI.
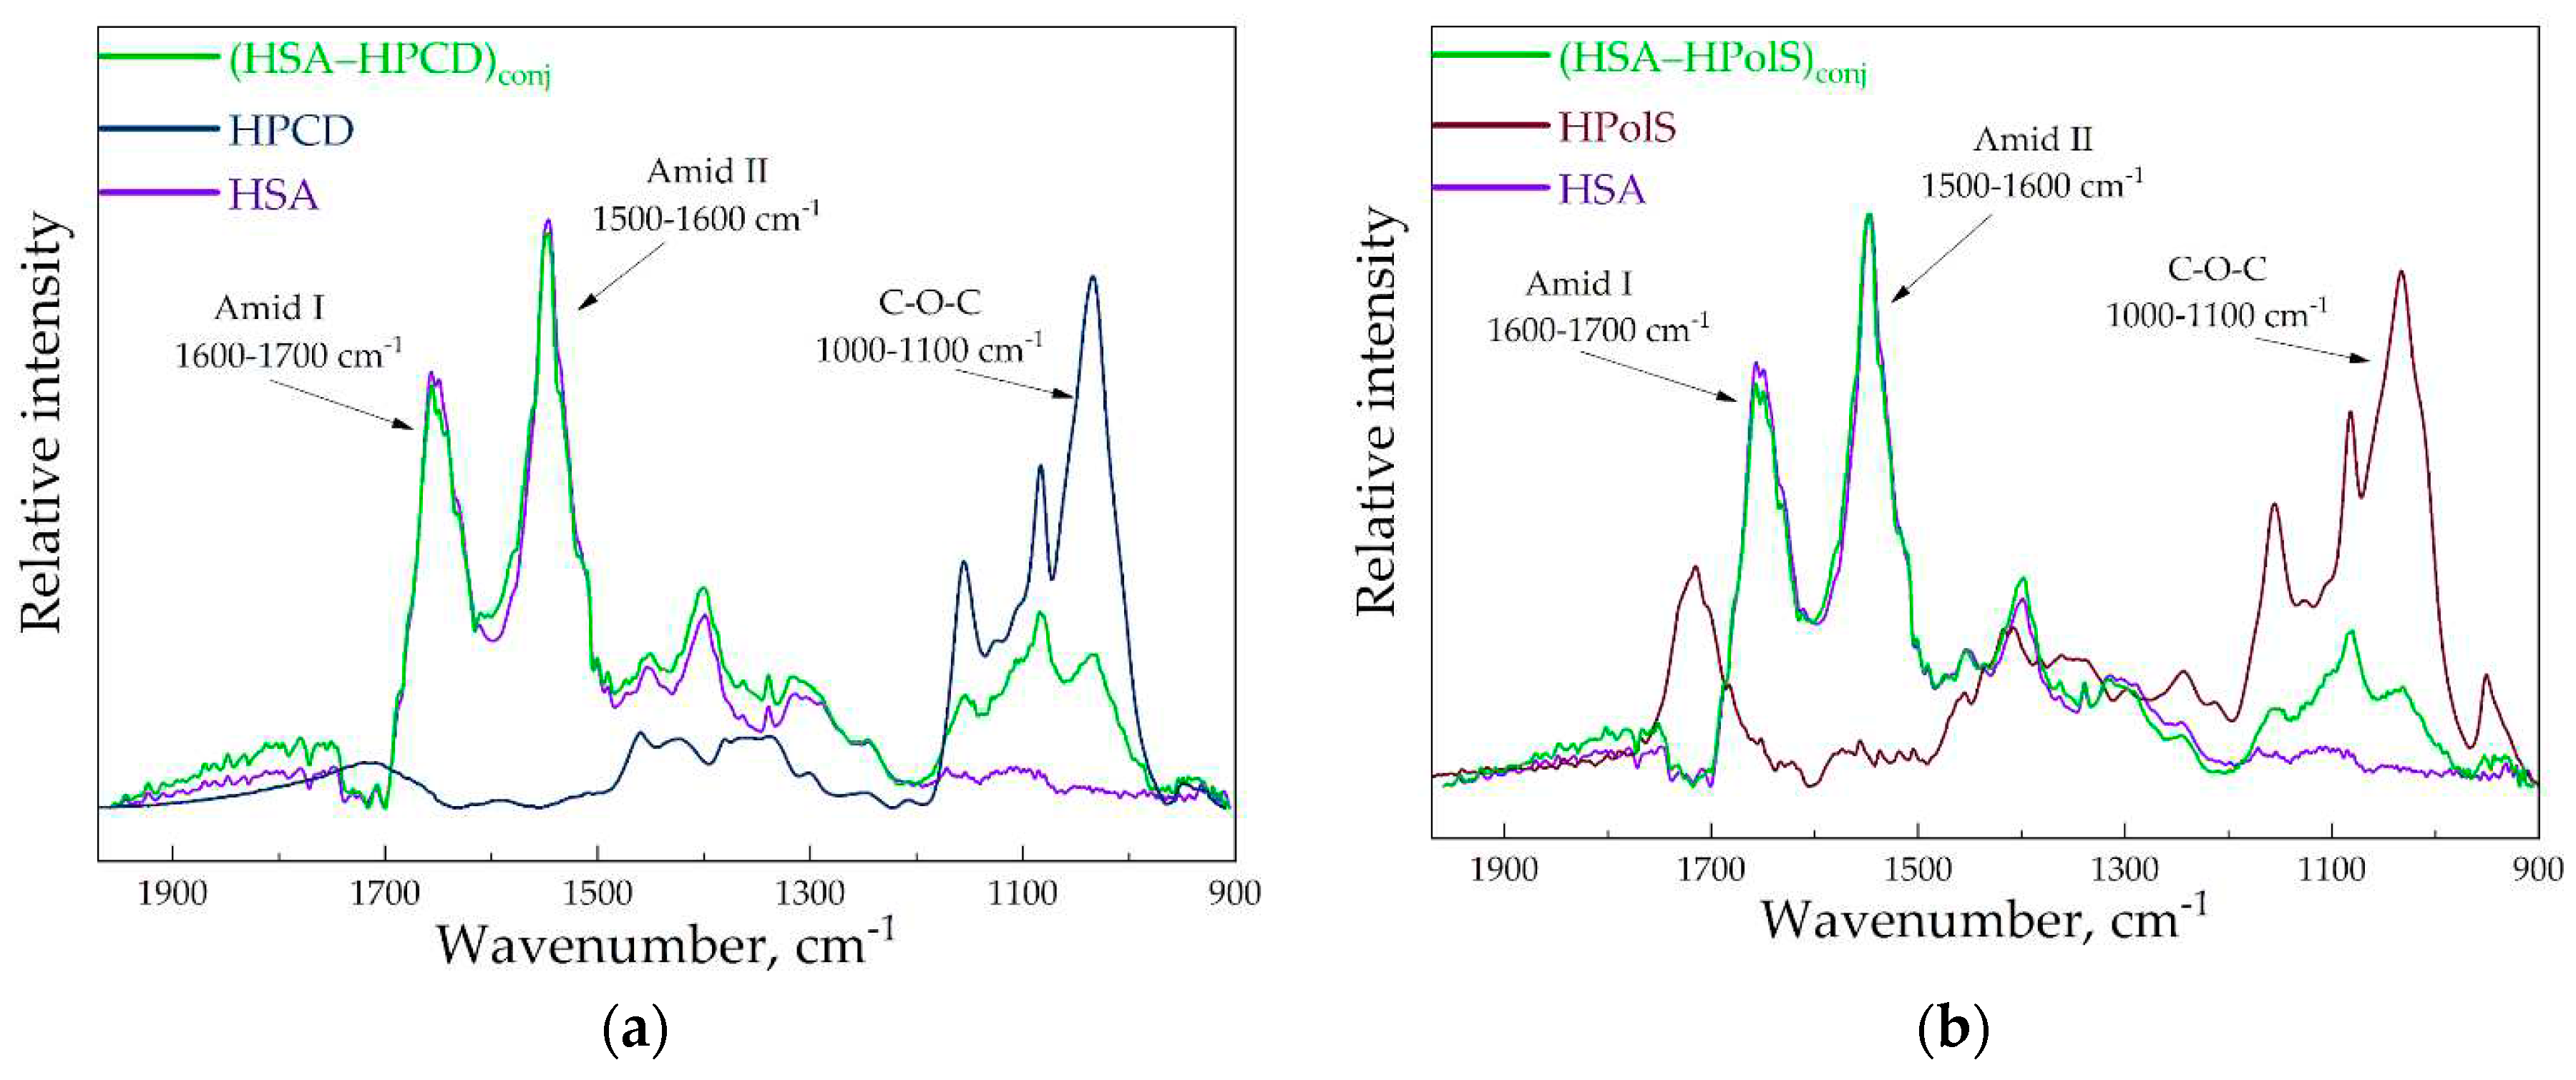
Figure 3.
(a) The FTIR spectra of HSA, (HSA–HPCD)conj, HPCD, CHSA = 0.1 mM, CHPCD = 1.5 mM H2O, pH 7.0, 22℃ (b) The FTIR spectra of HSA, (HSA–HPolS)conj, HPolS, CHSA = 0.1 mM, CHPolS = 1.5 mM H2O, pH 7.0, 22℃.
Figure 3.
(a) The FTIR spectra of HSA, (HSA–HPCD)conj, HPCD, CHSA = 0.1 mM, CHPCD = 1.5 mM H2O, pH 7.0, 22℃ (b) The FTIR spectra of HSA, (HSA–HPolS)conj, HPolS, CHSA = 0.1 mM, CHPolS = 1.5 mM H2O, pH 7.0, 22℃.
Notably, carbamate bonds manifest distinctive peaks in the FTIR spectra, specifically the C–N and C–O stretching modes, observed at 1076 cm–1 and 1024 cm–1, respectively. Additionally, the presence of a shoulder peak at 1069 cm–1 is likely attributed to the second C–N stretching mode. Furthermore, carbamate bonds are anticipated to exhibit characteristic vibration modes at 1645 cm–1 and 1600 cm–1, specifically related to N–H rocking [30,31,32].
Upon examination of the FTIR spectra for HSA–HPCD and HSA–HPolS, the emergence of novel peaks indicative of carbamate bonds suggests the formation of covalent bonds between Lysine (Lys) residues within HSA and hydroxyl groups present in the CDs during the synthesis process. In the FTIR spectra of the conjugates, we also observe distinctive peaks related to bonds within HSA. Specifically, the amide I band (1600–1700 cm–1) represents oscillations involving ν(C=O) (~80%) and ν(C–N) (~15%). Additionally, the amide II bands (1500–1600 cm–1) correspond to δ(N–H) (~60%), ν(C–N) (~20%), and (C–C) (~10%)[33,34,35]. Furthermore, bands characteristic of oligosaccharides are evident in the conjugates. We noted the most intense absorption bands in the 1100–1000 cm−1 range, corresponding to C–O–C glycoside bonds[36]. The formation the conjugate of HSA–HPolS leads to the appearance of bands at 1717 cm−1 and 1226 cm−1, signifying the presence of C=O in carboxylic and ester groups, and C−O−C in ester groups, respectively[37].
The secondary structure of proteins is intricately linked to their biological functionality, a critical factor when proteins are employed as carriers for therapeutic drugs. The preservation of a protein's biological activity is of paramount importance, particularly in the context of drug delivery, as it dictates the protein's ability to interact with its intended targets. Previous studies have extensively documented alterations in the secondary structure of albumin as a consequence of complexation with various drugs [33,38,39,40,41,42,43,44]. In this research, we harnessed the power of FTIR spectroscopy to meticulously scrutinize these structural changes in albumin stemming from the creation of HSA conjugates with either HPCD or HPolS. Our specific focus was channeled towards the examination of the Amide I and Amide II bands within the FTIR spectra, known for their heightened sensitivity to variations in the protein's secondary structure.
By deconvolution techniques of the Amide I band, we extracted quantitative insights into the shifts in α-helixes, β-structures, and random coils, shedding light on the nuanced alterations within HSA's secondary structure (Figure 4a). Our findings revealed that the covalent binding between Lys residues in HSA and hydroxyl groups in CD tori (the formation of (HSA−HPCD)conj or (HSA−HPolS)conj did not induce significant structural deviations in HSA (Table 2). This observation negates the likelihood of aggregation events. The primary deviation detected was a minor increment in the content of random coil in HSA's secondary structure. The same results we obtained through the analysis of CD-spectra of HSA, (HSA−HPCD)conj, and (HSA−HPolS)conj (Figure 4b)
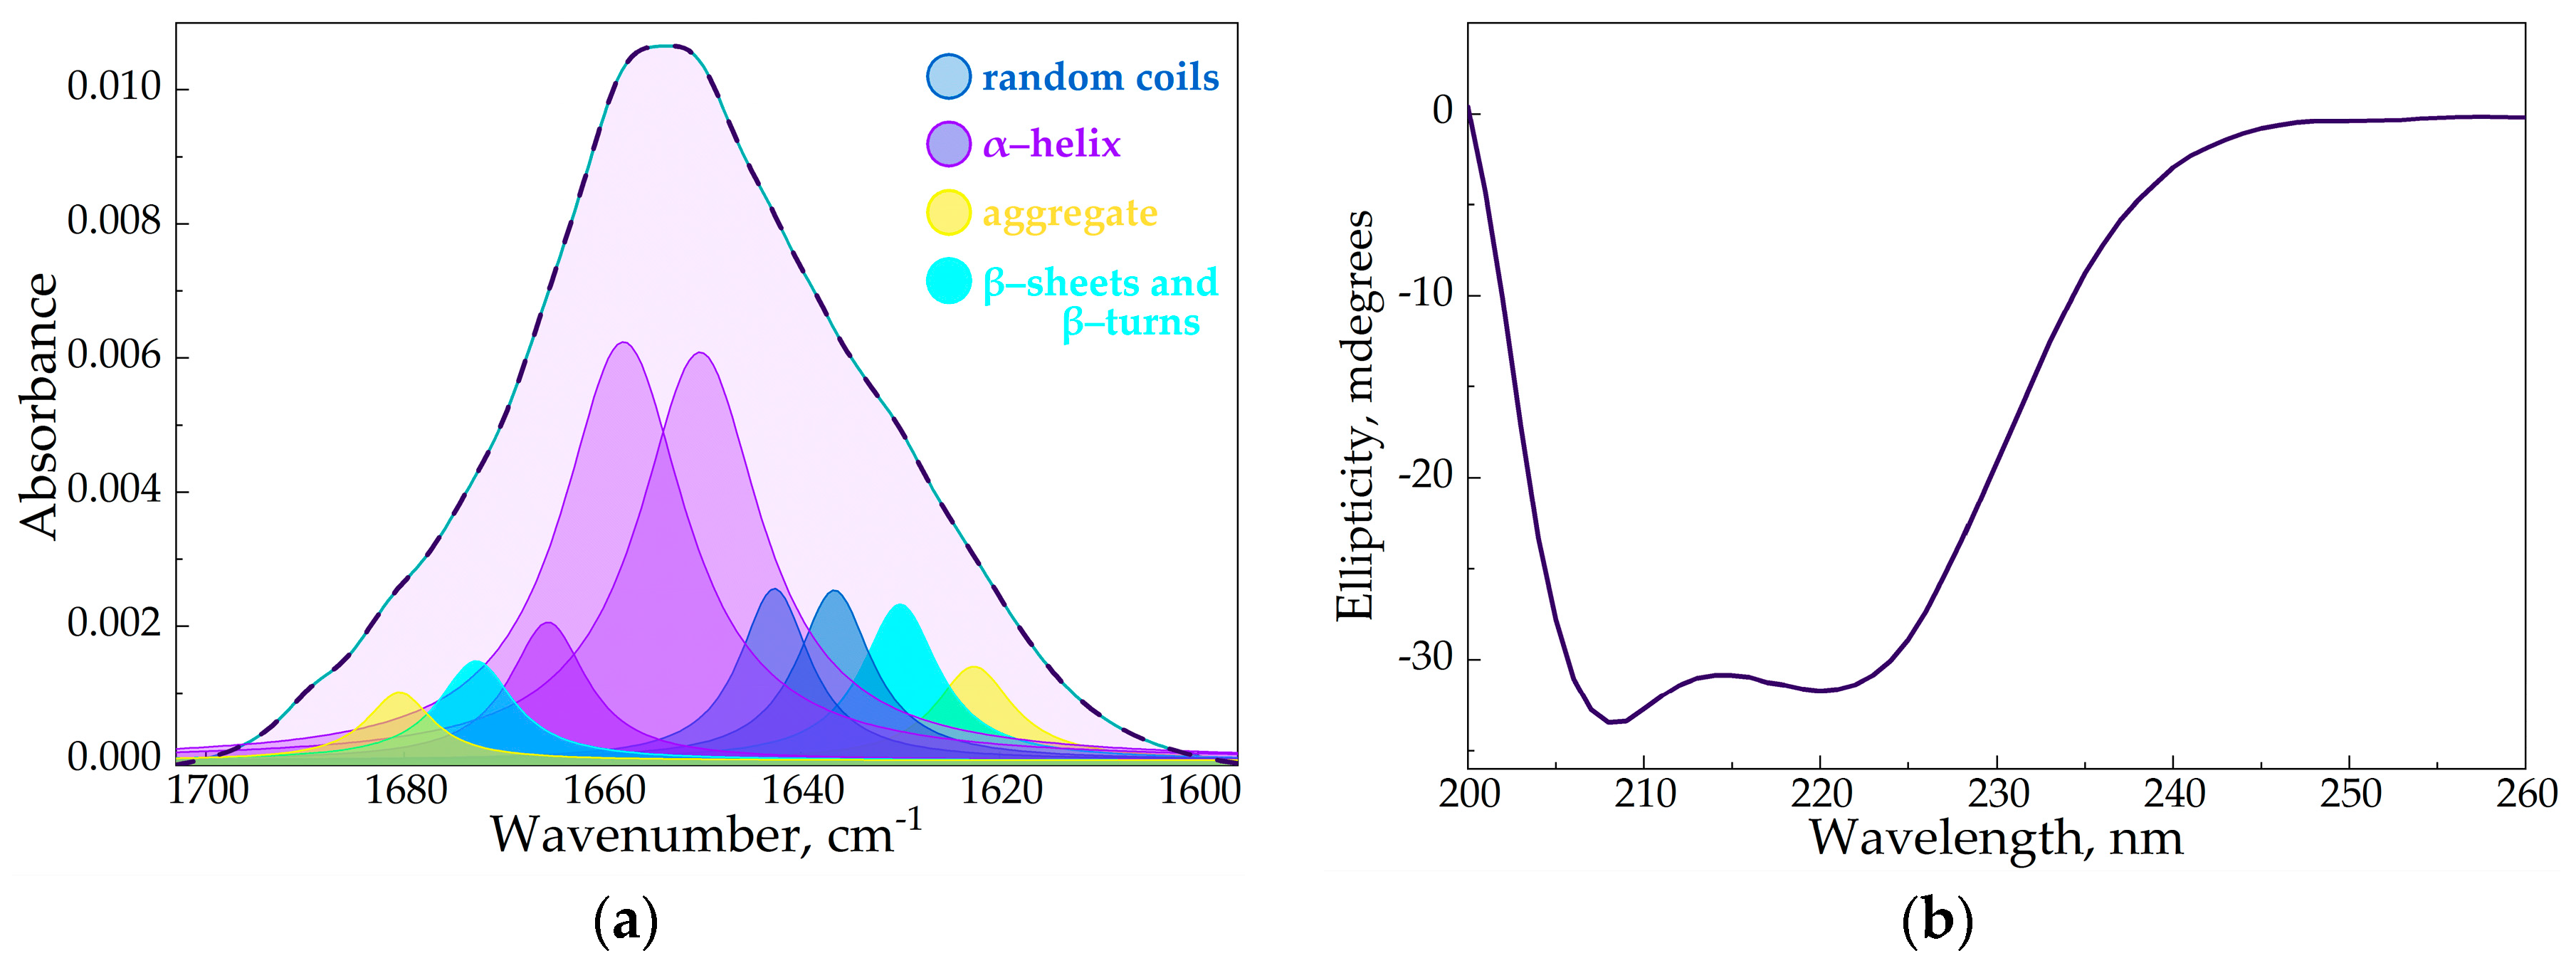
Figure 4.
(a) The deconvolution of HSA FTIR spectra, CHSA = 0.06 mM, the simulated spectra demonstrated in the dashed pink line, pH 7.4; (b) CD spectrum of HSA, CHSA = 0.02 mM, pH 7.4.
Figure 4.
(a) The deconvolution of HSA FTIR spectra, CHSA = 0.06 mM, the simulated spectra demonstrated in the dashed pink line, pH 7.4; (b) CD spectrum of HSA, CHSA = 0.02 mM, pH 7.4.
Table 2.
The content of secondary structures in HSA (from FTIR data): CHSA = 0.06 mM, pH 7.4, SD (n = 3).
Table 2.
The content of secondary structures in HSA (from FTIR data): CHSA = 0.06 mM, pH 7.4, SD (n = 3).
| α-Helix | β-Structures | Random | |
|---|---|---|---|
| HSA | 64 ± 2% | 19 ± 1% | 17 ± 1% |
| (HSA–HPCD)conj | 56 ± 2% | 20 ± 1% | 24 ± 1% |
| HSA–(HPolS)conj | 54 ± 2% | 20 ± 1% | 26 ± 1% |
Vigilantly monitoring the secondary structure of proteins within drug delivery systems is of utmost importance, as it influences protein stability, drug loading and release, biocompatibility, functionality, quality control, formulation optimization, and overall safety and efficacy.
In the second systems where we aimed to form the conjugate of HSA and LV, we observed a noteworthy increase in the intensity of the amide I and amide II bands. This observation suggests that we successfully formed amide bonds between Lys residues within HSA and the carboxylic group of the LV in the conjugates Figure 5.
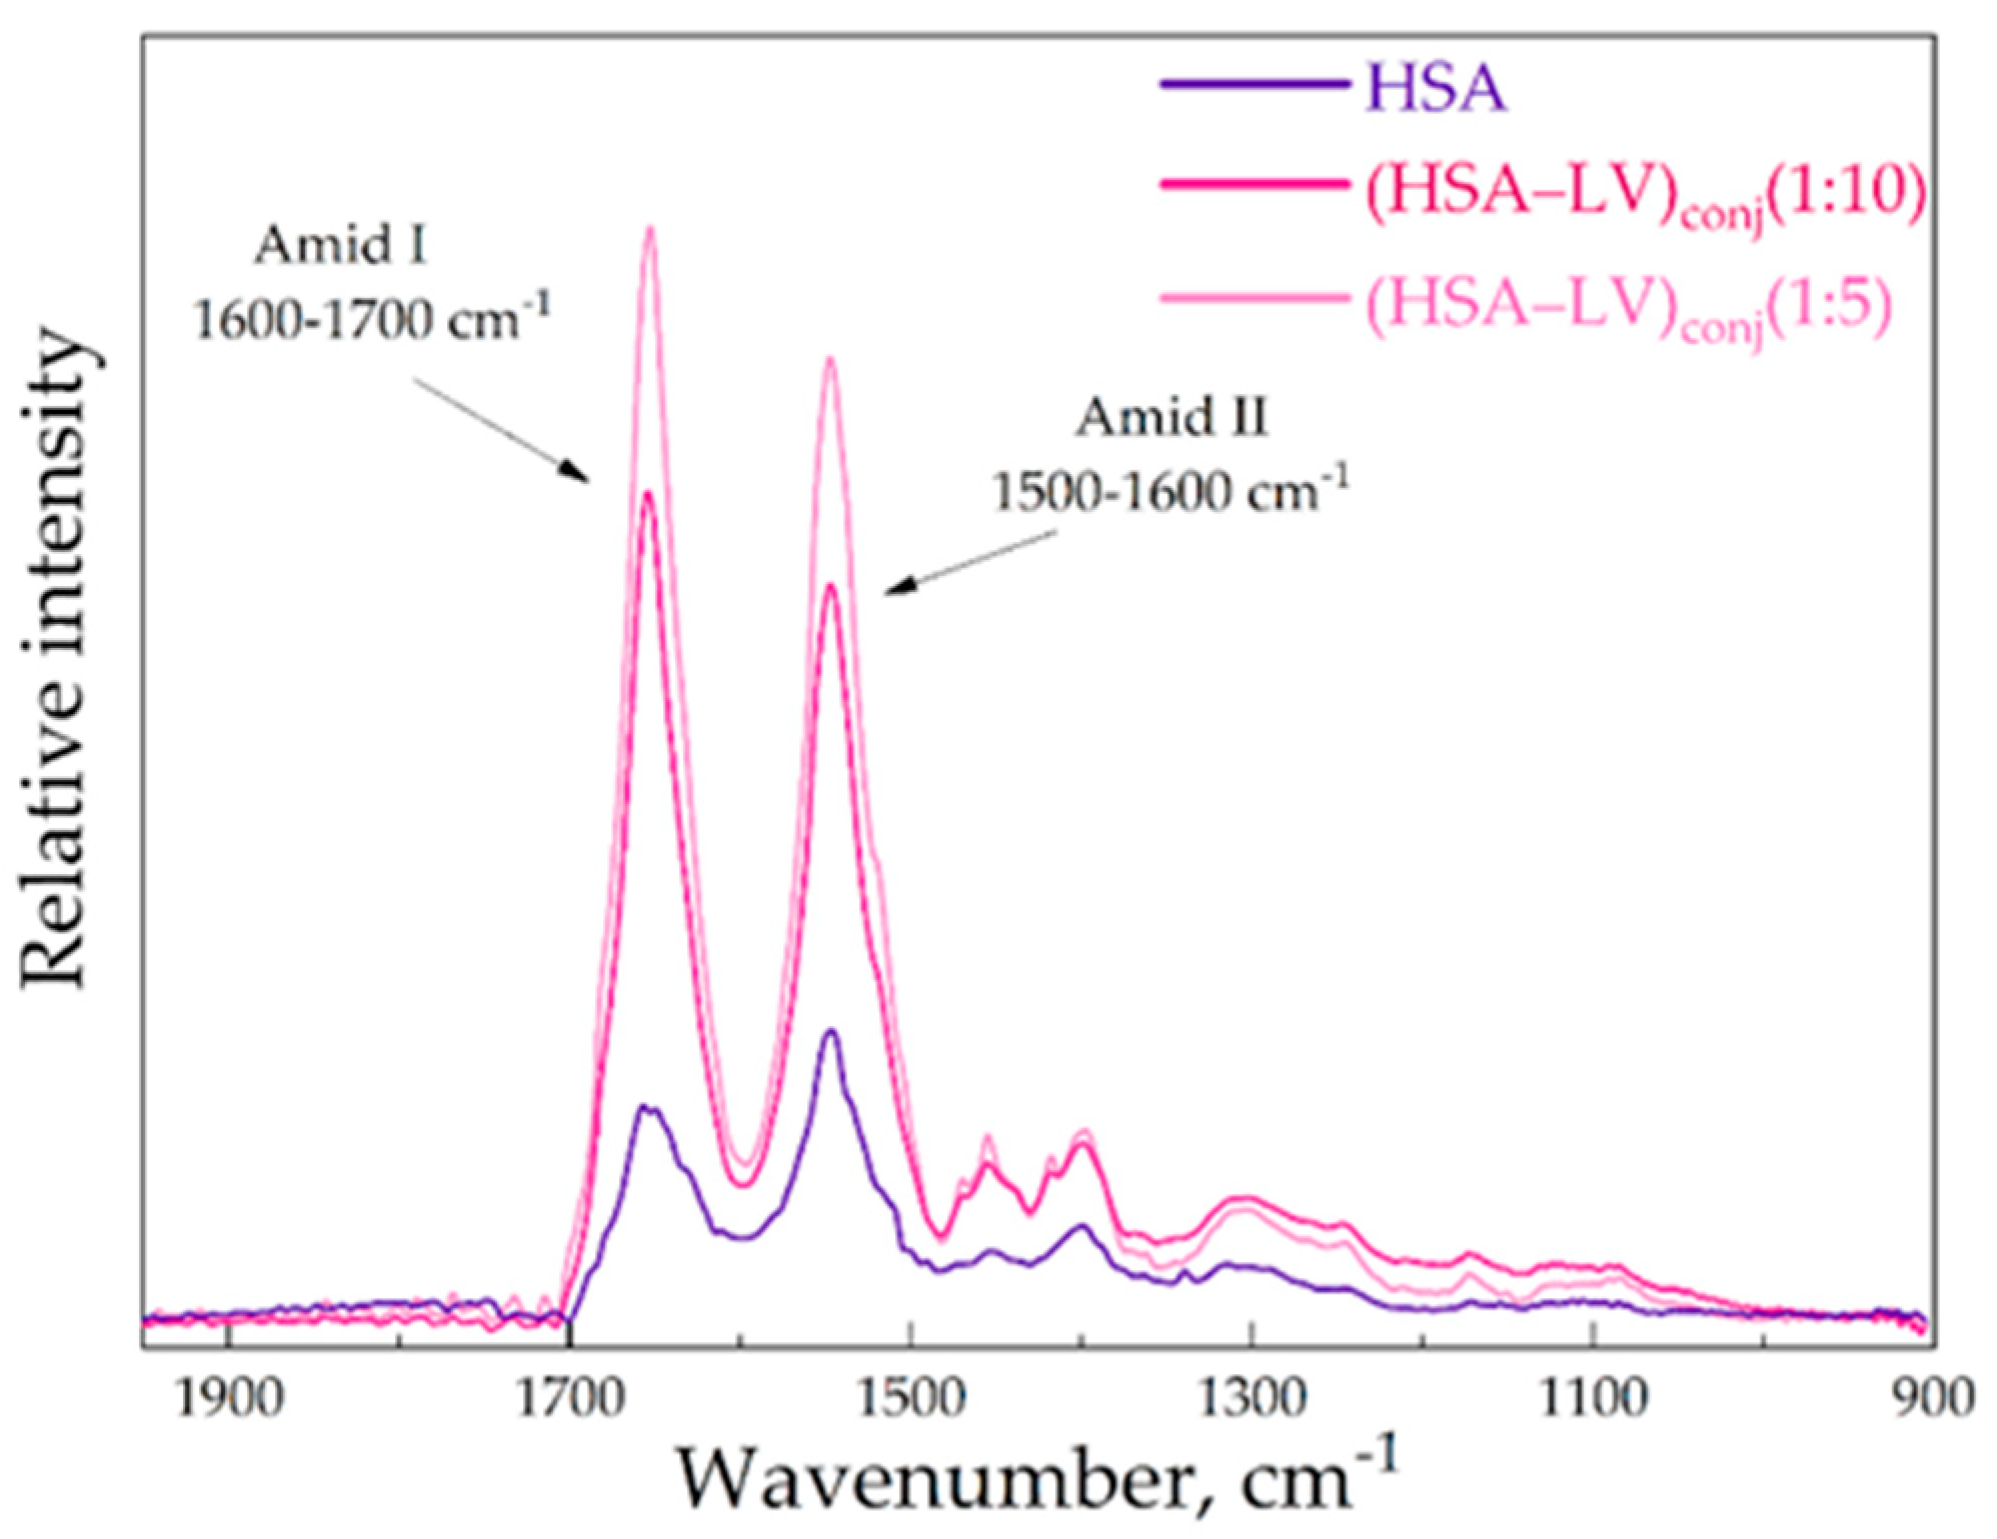
Figure 5.
The FTIR spectra of HSA, CHSA = 0.02 mM, (HSA–LV)conj1 : 10 CHSA = 0.02 mM, (HSA–LV)conj1 : 5 CHSA = 0.02 mM, PBS, pH 7.4, 22℃.
Figure 5.
The FTIR spectra of HSA, CHSA = 0.02 mM, (HSA–LV)conj1 : 10 CHSA = 0.02 mM, (HSA–LV)conj1 : 5 CHSA = 0.02 mM, PBS, pH 7.4, 22℃.
The reaction yield, as measured by HPCD/HPolS, denotes the percentage of HPCD tori in the (HSA-HPCD)conj or (HSA-HPolS)conj particles relative to the amount employed during the synthesis. HPCD's content was quantified using FTIR spectroscopy, with the intensity of the 1047 cm−1 absorption band corresponding to the oscillation of the C-O-C bond of the CD. In the case of (HSA−LV)conj, the reaction yield was determined by LV. LV's content was ascertained through FTIR spectroscopy, with the intensity of the 1490 cm−1 absorption band corresponding to the oscillation of the C−Caromatic bonds of LV. Based on the analysis of the HSA conjugates using FTIR, it was found that the entire ligands (HPCD, HPolS or LV) were sewn to the protein globule during the synthesis reaction (Table 3).
Table 3.
Physicochemical properties of conjugates of HSA and LV or CDs.
| Parameter | (HSA−LV)conj1:5 | (HSA−LV)conj1:10 | (HSA−HPCD)conj | (HSA−HPolS)conj |
|---|---|---|---|---|
| Molecular weight, kDa | 66.8 | 68.6 | 88.1 | 80.1 |
| LV ,% (w/w) | 2.7% | 5.4% | − | − |
| Molar ratio1 | 1 : 5 | 1 : 10 | 1 : 15 | 1 : 10 |
1Molar ratio of LV to HSA or CD torus to HSA.
3.3. Fluorescence Spectroscopy
For further elucidation the molecular details it is important to understand how CDs carriers would affect the binding of chemical fragments of LV with HSA. Moreover, we were interested in how covalent bound HPCD and HPolS to HSA would alter the thermodynamic parameters of HSA’s interactions with LV.
Fluorescence is a valuable approach to studying the interaction Trp-214 of HSA with different molecule types since the fluorescence of Trp residues is sensitive to the protein's microenvironment. The intrinsic fluorescence quenching measurement of proteins is widely used to elucidate the mechanism of their interaction with ligands or drug molecules [45,46,47]. The interaction between LV and HSA is well described before [18,48,49]. In our previous works, we studied ternary systems where the drug is the included in the complex with monomeric or polymeric CDs [16,29,50,51]. Here we studied the interactions of levofloxacin (LV) with HSA grafted with cyclodextrins (CDs) or CD polymers (CDPols).
3.3.1. Impact of HPCD, HPolS, and Conjugate Formation on the Fluorescence Spectra of HSA and LV
We investigated the interaction between LV and HSA, LV+HPCD and HSA, LV+HPolS and HSA, LV and (HSA-grafted -HPCD)conj, and LV and (HSA-grafted-HPolS)conj using fluorescence spectroscopy. At an excitation wavelength of 280 nm, LV and HSA demonstrated distinct emission peaks at 456 and 340 nm, respectively (Figure 6a). HPCD and HPolS had no signal under present conditions.
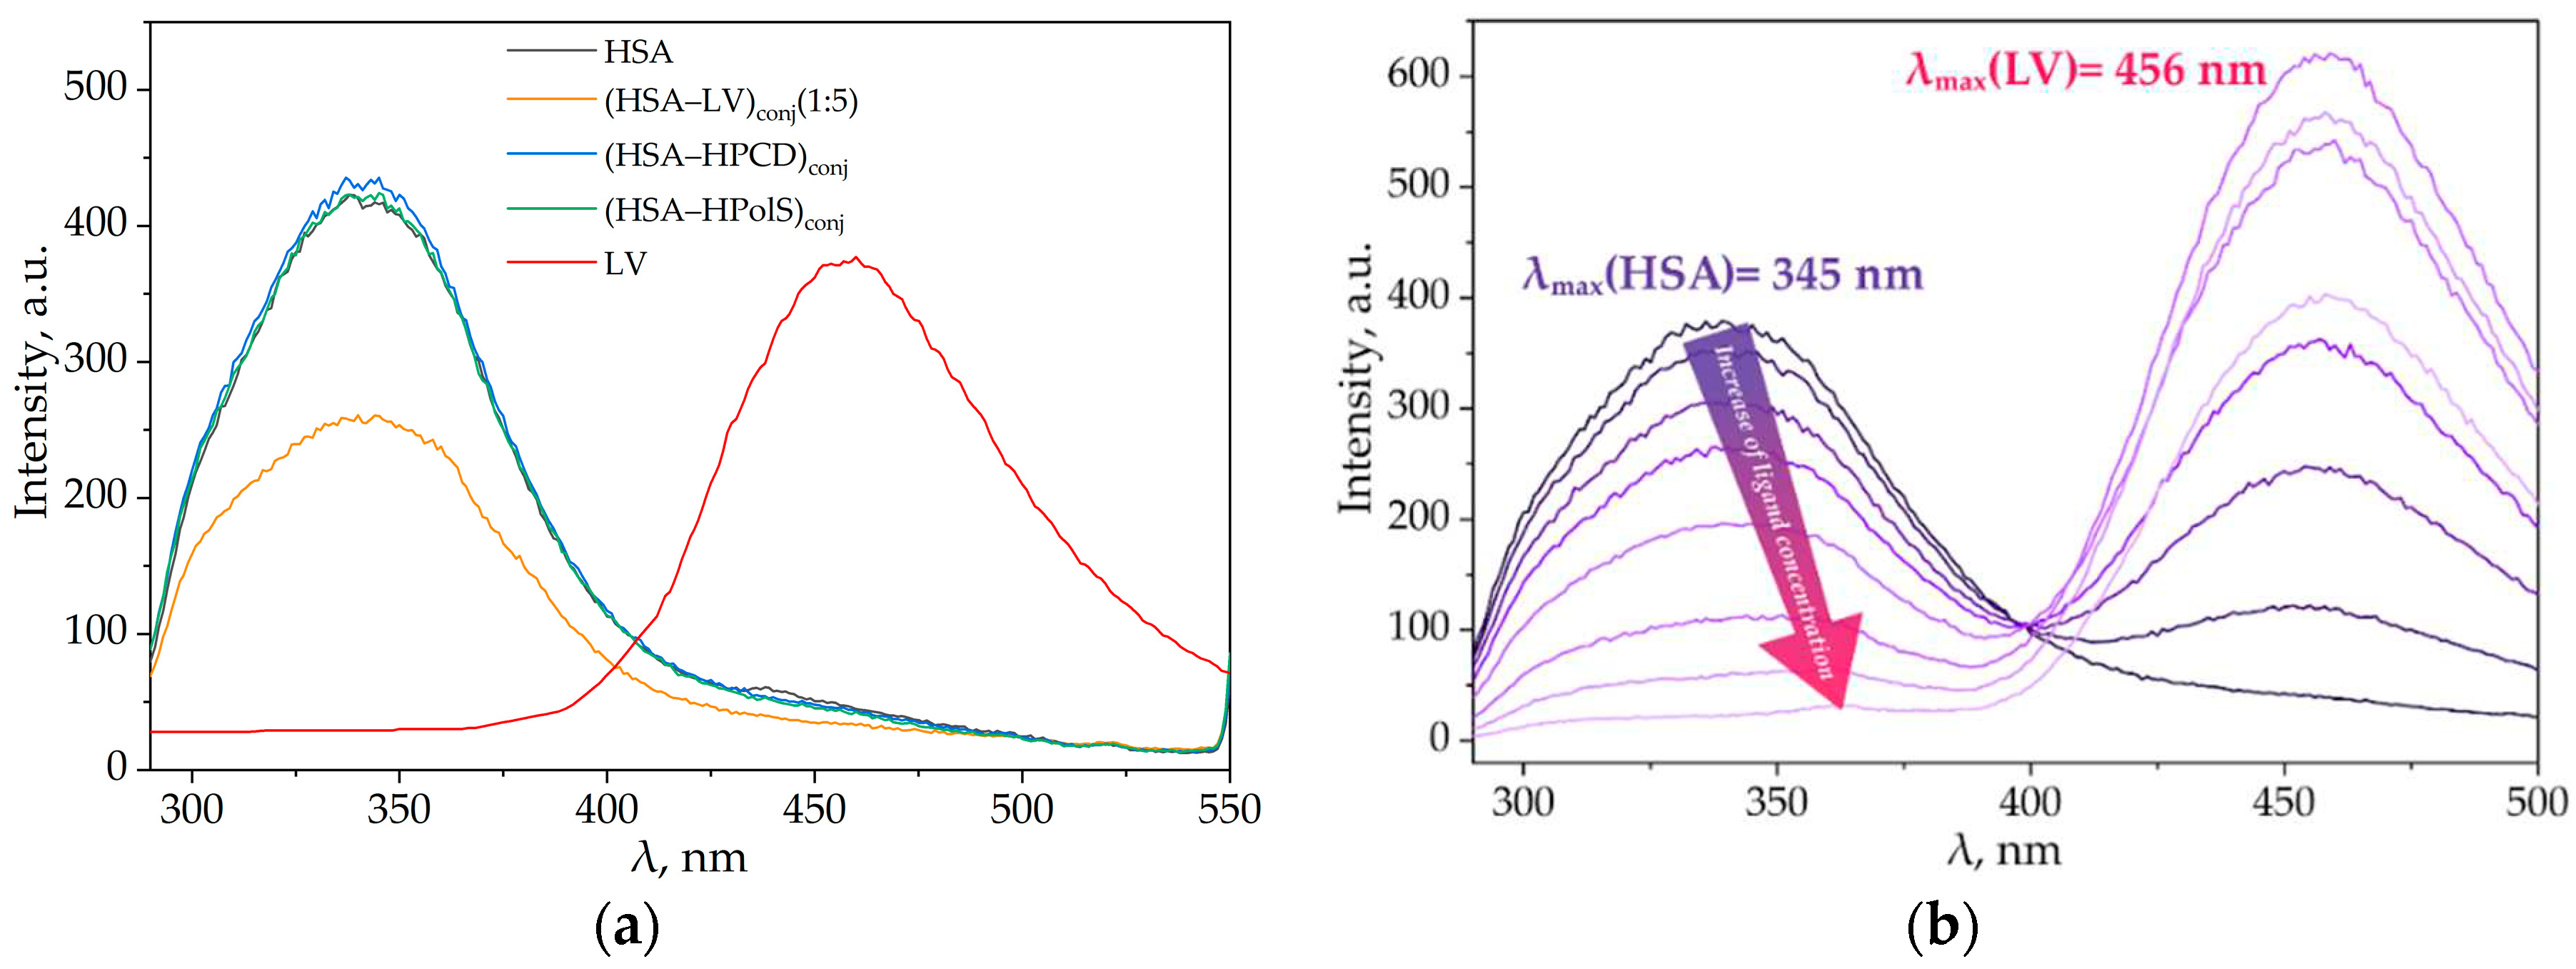
Figure 6.
(a) Emission spectra of HSA (dark purple), (HSA–LV)conj1 : 5(pink), (HSA–HPCD)conj(light purple), (HSA–HPolS)conj(green),λex = 280 nm, CHSA = 0.03 mM, 37 °C, PBS, pH 7.4; (b) Fluorescence quenching of (HSA–HPCD)conj by LV, λex = 280 nm, CHSA = 0.03 mM, 37 °C, PBS, pH 7.4.
Figure 6.
(a) Emission spectra of HSA (dark purple), (HSA–LV)conj1 : 5(pink), (HSA–HPCD)conj(light purple), (HSA–HPolS)conj(green),λex = 280 nm, CHSA = 0.03 mM, 37 °C, PBS, pH 7.4; (b) Fluorescence quenching of (HSA–HPCD)conj by LV, λex = 280 nm, CHSA = 0.03 mM, 37 °C, PBS, pH 7.4.
In our previous studies we reported that the formation of complexes between LV and HPCD, as well as the encapsulation of LV in HPolS particles, led to a slight redshift of the emission maxima of the drug by 3-5 nm [16]. This shift signifies an augmentation in the hydrophilic nature of the microenvironment surrounding the drug, concomitant with a modest increase in the intensity of LV's emission spectrum. Importantly, the presence of HPCD or HPolS, even in concentrations up to 100 mM, did not exert a significant influence on the fluorescence properties of HSA [52].
The emission spectra of (HSA-HPCD)conj and the (HSA-HPolS)conj closely mirrored the emission profile of pure HSA (Figure 6a). This conformity suggests that this polysaccharide and oligosaccharide do not instigate substantial structural alterations or modifications in the fluorophores of HSA, thereby preserving its emission characteristics.
Most intriguingly, the formation of a conjugate between HSA and LV elicited profound spectral modifications. In particular, we noted a significant (2-fold) reduction in the intensity of HSA's emission spectra (depicted in the pink curve in Figure 6a) compared to HSA alone at an equivalent concentration level (as shown by the purple curve in Figure 6a). Astonishingly, the formation of HSA-LVconj resulted in the complete quenching of LV's emission (as indicated by the absence of the LV peak in the pink curve, contrasting with the red curve representing LV alone at the same concentration). These observations offer compelling evidence of an alteration in the microenvironment surrounding LV.
We have observed that an increase in the LV concentration in the presence of (HSA−HPCD)conj or (HSA−HPolS)conj leads to a reduction in protein fluorescence, indicating a change in the microenvironment of Trp214 and the formation of a complex between LV and albumin (Figures 5b and 6a).
It is worth noting that the position of the protein emission peak shifts towards longer wavelengths, and the magnitude of this shift becomes stronger with higher concentrations of the quencher (e.g., with a molar excess of LV equal to 5, the shift is approximately 20 nm). This suggests that the Trp214 residue experiences a less hydrophobic environment [48,49,53].
The determination of Stern-Volmer constants for the interactions between LV and (HSA−HPCD)conj or (HSA−HPolS)conj provides valuable insights (Figure 7b and Table S1). The obtained data suggest that the fluorescence quenching is primarily of a static nature. In other words, the quenching of fluorescence is mostly due to the formation of stable complexes between LV and (HSA−HPCD)conj or (HSA−HPolS)conj.
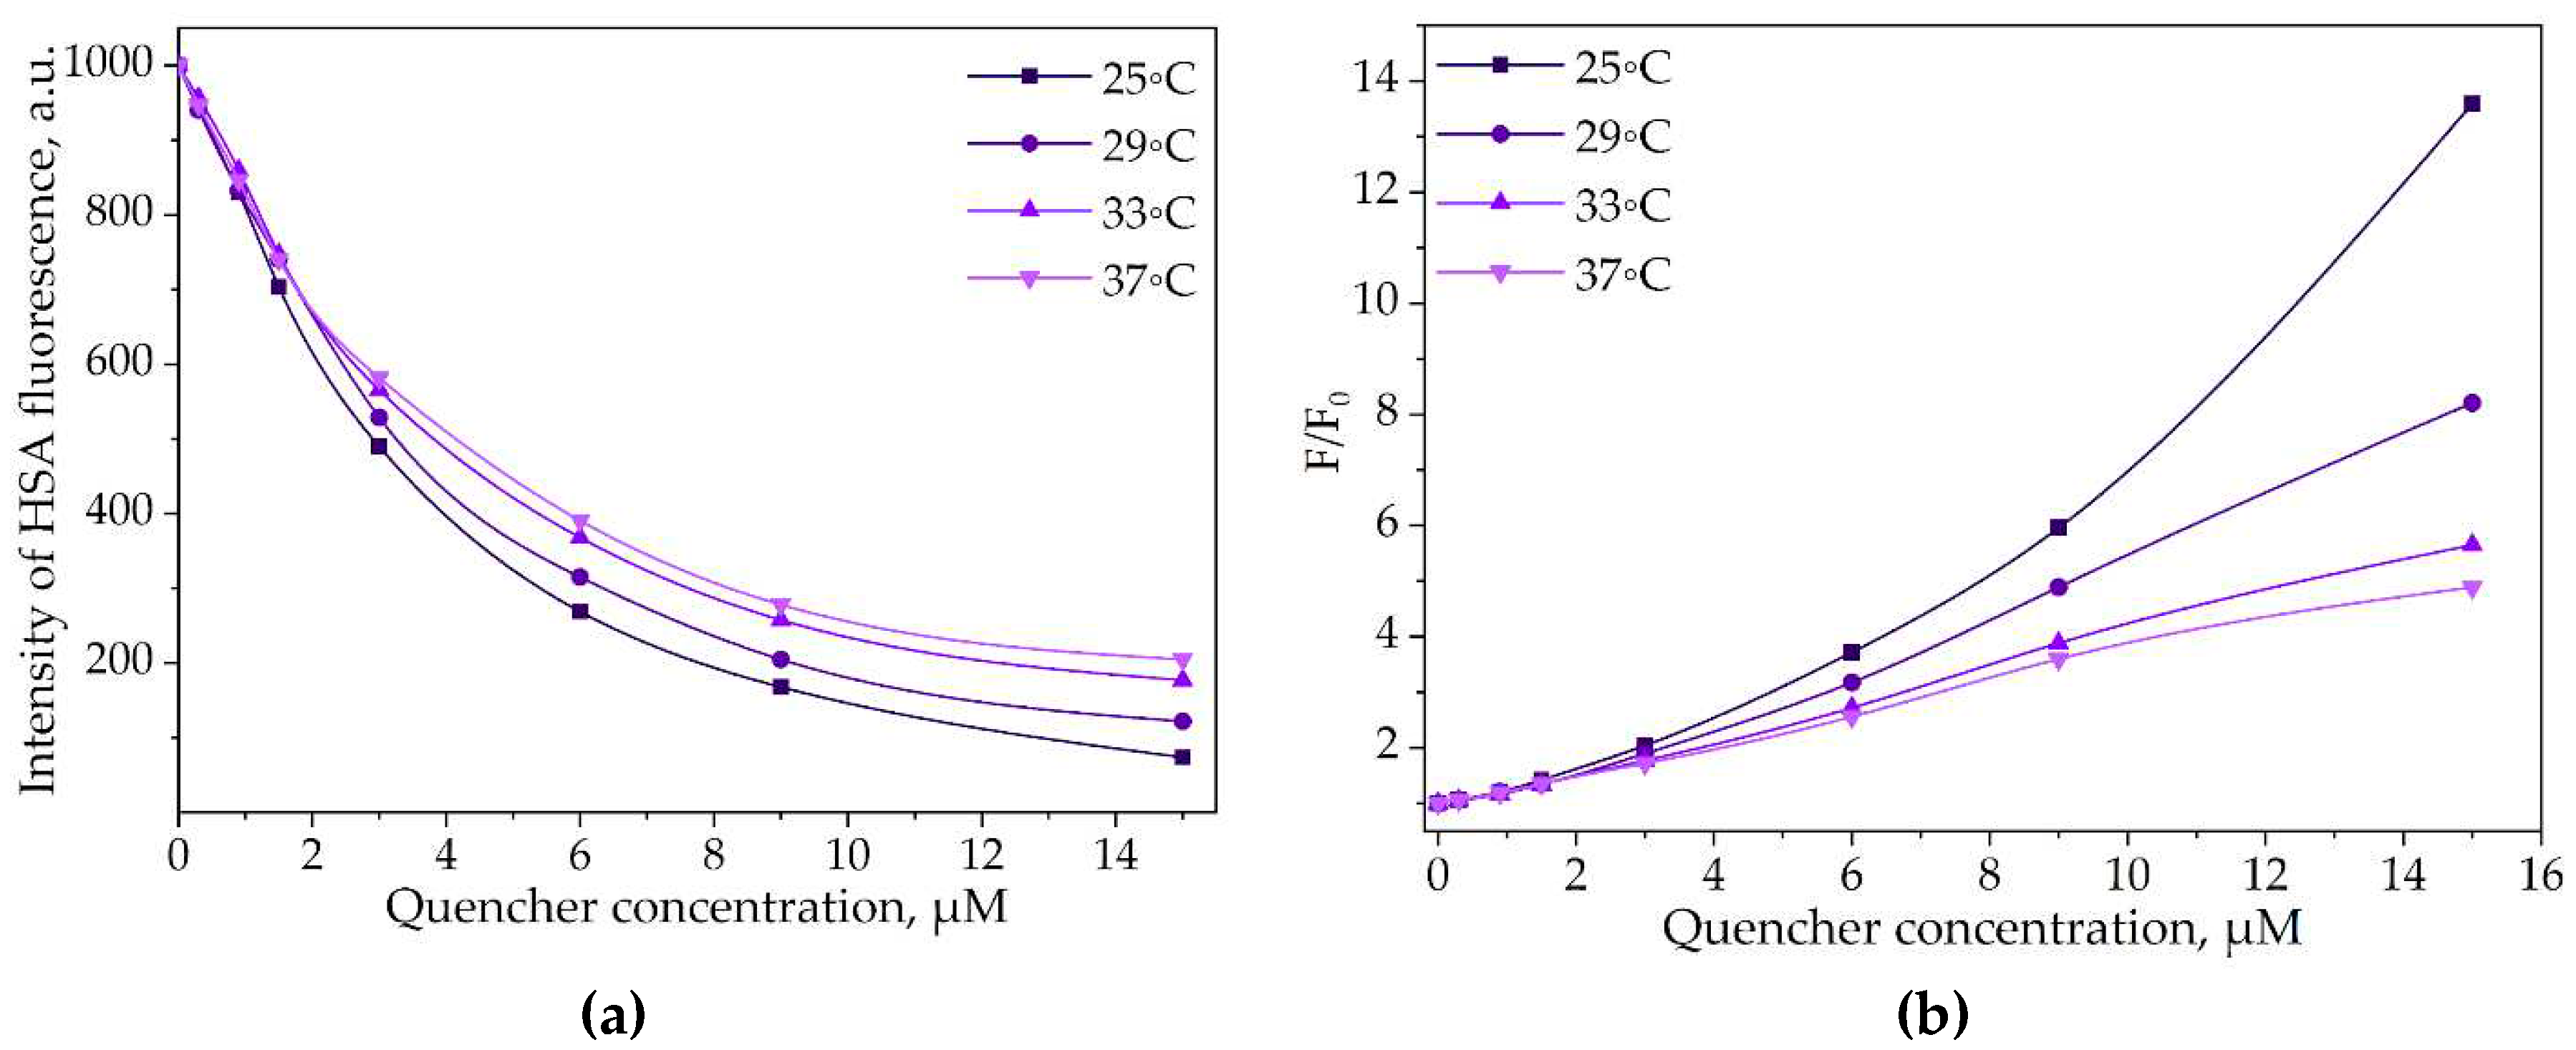
Figure 7.
(a) The intensity of (HSA–HPCD)conj’s peak via the increase of the LV’s concentration, λex = 280 nm, CHSA = 0.03 mM, 25−37°C, PBS, pH 7.4; (b) Stern−Volmer dependences expressing the effect of (HSA–HPCD)conj quenching via binding LV, λex = 280 nm, CHSA = 0.03 mM, 25−37°C, PBS, pH 7.4.
Figure 7.
(a) The intensity of (HSA–HPCD)conj’s peak via the increase of the LV’s concentration, λex = 280 nm, CHSA = 0.03 mM, 25−37°C, PBS, pH 7.4; (b) Stern−Volmer dependences expressing the effect of (HSA–HPCD)conj quenching via binding LV, λex = 280 nm, CHSA = 0.03 mM, 25−37°C, PBS, pH 7.4.
Further investigation into the static quenching phenomenon under different conditions can yield important thermodynamic parameters. These parameters offer a deeper understanding of the energetics and stability of the complex formation and shed light on the intricacies of drug-protein interactions.
3.3.2. Thermodynamic Parameters and Mechanisms of the Complex Formation of HSA and LV
Given the static nature of fluorescence quenching at low concentrations of LV, equation (1) was modified into equation (2), enabling the determination of binding constants (Ka) and stoichiometric coefficients (n). A noticeable reduction in both binding constant (Ka) and n was observed upon temperature variation. To gain a more comprehensive understanding of the overall process of complex formation between the antibacterial drug LV and (HSA−CD)conj we proceeded to determine the associated thermodynamic parameters, as summarized in Table 3.
Consequently, the thermodynamic parameters ΔH(enthalpy change), ΔS(entropy change), and ΔG (Gibbs free energy change) for the complexation reaction were determined using equations (3) - (5), and the outcomes are detailed in Table 4. The primary forces driving the process of complex formation encompass the establishment of hydrogen bonds, electrostatic interactions, hydrophobic forces, and van der Waals interactions [54]. These interactions can either positively or negatively impact the changes in enthalpy (ΔH) and entropy (ΔS) (as detailed in Table 5) [55,56].
Table 4.
Thermodynamic parameters of the interaction of human serum albumin with levofloxacin, pH 7.4 (P = 0.95, n = 4, r = 0.999).
Table 4.
Thermodynamic parameters of the interaction of human serum albumin with levofloxacin, pH 7.4 (P = 0.95, n = 4, r = 0.999).
| T, K | n | Ka, 105 М−1 | ΔG, kJ/mol | ΔH, kJ/mol | ΔS, J/mol/K | |
|---|---|---|---|---|---|---|
| HSA+LV[29] | 298 | 1.34 ± 0.07 | 23.4 ± 0.5 | −36.3 ± 0.1 | −57.7 ± 0.8 | −71 ± 2 |
| 302 | 1.33 ± 0.02 | 17.9 ± 0.3 | −36.1 ± 0.1 | |||
| 306 | 1.32 ± 0.03 | 13.1 ± 0.4 | −35.8 ± 0.1 | |||
| 310 | 1.33 ± 0.05 | 9.9 ± 0.2 | −35.6 ± 0.1 | |||
| HSA+(LV+HPCD) [29] | 298 | 1.51 ± 0.08 | 110 ± 1.2 | −40.1 ± 0.2 | −217.6 ± 1.4 | −596 ± 4 |
| 302 | 1.41 ± 0.04 | 34.0 ± 0.5 | −37.7 ± 0.4 | |||
| 306 | 1.33 ± 0.03 | 12.6 ± 0.2 | −35.7 ± 0.4 | |||
| 310 | 1.24 ± 0.03 | 3.5 ± 0.5 | −32.9 ± 0.3 | |||
| (HSA+HPCD)conj+LV | 298 | 1.37 ± 0.01 | 17 ± 3 | −35.6 ± 0.1 | −187 ± 7 | −510 ± 20 |
| 302 | 1.29 ± 0.02 | 6 ± 1 | −33.5 ± 0.1 | |||
| 306 | 1.23 ± 0.02 | 2.7 ± 0.7 | −31.8 ± 0.1 | |||
| 310 | 1.12 ± 0.01 | 0.9 ± 0.1 | -29.4 ± 0.1 | |||
| (HSA+HPolS)conj+LV | 298 | 1.21 ± 0.05 | 3.3 ± 1.9 | −31.48 ± 0.3 | −149 ± 8 | −400 ± 20 |
| 302 | 1.14 ± 0.05 | 1.4 ± 0.8 | −29.73 ± 0.3 | |||
| 306 | 1.09 ± 0.02 | 0.68 ± 0.12 | −28.33 ± 0.1 | |||
| 310 | 1.01 ± 0.04 | 0.31 ± 0.13 | −26.68 ± 0.2 |
Table 5.
The expected contribution of various types of interactions to ΔH and ΔS[55].
Table 5.
The expected contribution of various types of interactions to ΔH and ΔS[55].
| The type of interaction | ΔH | ΔS |
|---|---|---|
| Hydrophobic Interactions. | Positive | Positive |
| Van der Waals Interactions. | Negative | Negative |
| Formation of Hydrogen Bonds in a medium with low dielectric constant. | Negative | Negative |
| Ionic Interactions (charge neutralization). | Slightly negative or positive | Positive |
| Protonation. | Negative | Negative |
HSA and LV Interactions
It was ascertained that the interaction between LV and HSA occurs spontaneously within the designated temperature range, as evidenced by the negative value of ΔG. The observation of negative values for ΔH and ΔS in the HSA+LV system suggests that complex formation is primarily driven by van der Waals forces and the establishment of hydrogen bonds. This finding aligns with similar conclusions reported in other works [18,40,48]. However, it is important to note that the ΔH, ΔS, and ΔG values calculated in our study are the same order of the magnitude compared with the literature values for HSA and LV interactions (Table 6).
Table 6.
Comparison of calculated and published thermodynamic parameters for the levofloxacin-human serum albumin system.
Table 6.
Comparison of calculated and published thermodynamic parameters for the levofloxacin-human serum albumin system.
| T, K | n | Ka, 105 М−1 | ΔG, kJ/mol | ΔH, kJ/mol | ΔS, J/mol/K | |
|---|---|---|---|---|---|---|
| present study | 310 | 1.33 ± 0.05 | 9.9 ± 0.2 | −35.6 ± 0.1 | −57.7 ± 0.8 | −71 ± 2 |
| present study 1 | 298 | 1 | 0.6 ± 0.1 | −27 ± 1 | −38 ± 3 | −37 ± 10 |
| Zhang et al. 2[18] | 298 | 1.04 | 0.49 | −27.0 | −42.2 | −62.6 |
| Zhang et al. 3 [18] | −27.4 | −54.7 | −91.6 |
1 Calculation of thermodynamic parameters was made based on the equation: log(Fo−F)/F=logKa+log[Q] and equations (3)-(5) (n = 4, r = 0.987). 2 Calculation using equations (2)-(5) based on fluorescence spectroscopy data (r = 0.987). 3 Calculation based on affinity capillary electrophoresis data (r = 0.955).
Some discrepancy can be attributed to the assumption made by Zhang et al. regarding a 1:1 stoichiometry of the complex formation (i.e., n = 1 in equation 2)[18,48]. This assumption led to underestimated values of Ka and overestimated values of ΔH, ΔS, and ΔG. Notably, if these parameters are calculated with the assumption of n = 1, they fall within the range of literature values. Furthermore, Zhang L.W. et al. indicated that the values of ΔH and ΔS, derived from affinity capillary electrophoresis data, were significantly lower than those obtained through fluorescence spectroscopy, as displayed in Table 6.
HSA and LV+CD Inclusion Complex Interactions
At 25℃, the binding constant (Ka) for the ternary system involving HSA and LV+HPCD was 5-fold higher than that observed for the binary system of HSA and LV alone. This substantial increase indicates that the hydroxyl group within the HPCD substituent contributes additional hydrogen interactions with the albumin's surface, resulting in the stabilization of the HSA+(LV+HPCD) complex. Furthermore, the pronounced reduction in both ΔH (by approximately 4 times) and ΔS (by approximately 8.5 times) in comparison to the binary system underscores the heightened role of hydrogen interactions in the formation of the HSA+(LV+HPCD) complex (Figure 8).
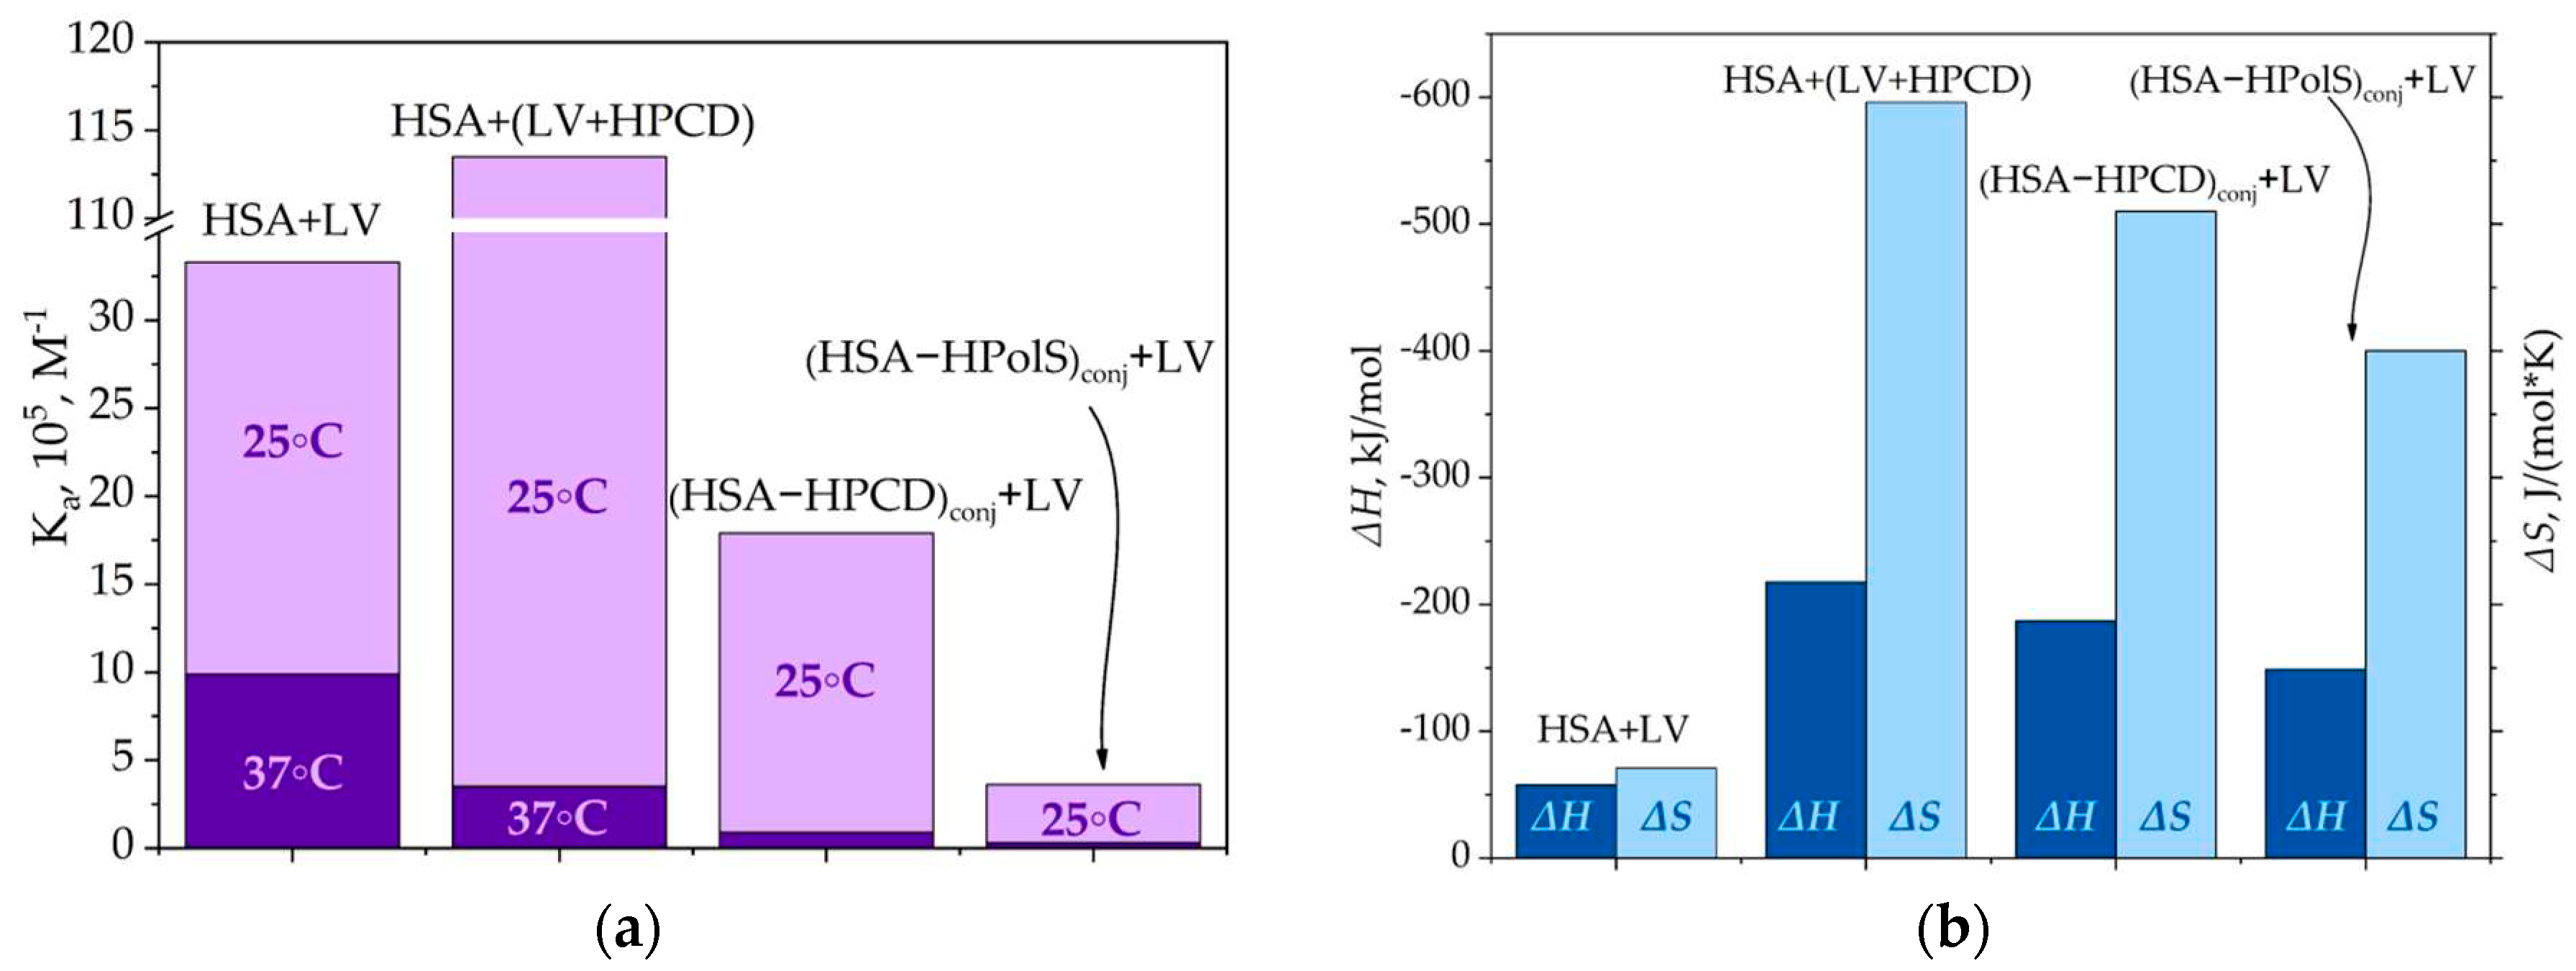
Figure 8.
a) The binding constants for HSA+LV, HSA+HPCD, (HSA–HPCD)conj+LV, (HSA–HPolS)conj+LVat 25 and 37 °C, PBS, pH 7.4; (b) The thermodynamic parameters for HSA+LV, HSA+HPCD, (HSA–HPCD)conj+LV, (HSA–HPolS)conj+LV, PBS, pH 7.4.
Figure 8.
a) The binding constants for HSA+LV, HSA+HPCD, (HSA–HPCD)conj+LV, (HSA–HPolS)conj+LVat 25 and 37 °C, PBS, pH 7.4; (b) The thermodynamic parameters for HSA+LV, HSA+HPCD, (HSA–HPCD)conj+LV, (HSA–HPolS)conj+LV, PBS, pH 7.4.
Similar to the interaction of free LV, the binding constant (Ka) decreased as the temperature rose when HSA interacted with the LV+HPCD complex. However, this effect was significantly more pronounced in the ternary system. In fact, as the temperature increased from 25 to 37℃, Ka decreased by 30 times. This outcome implies that the LV+HPCD, which possesses a larger molecular size compared to the free drug, is less capable of penetrating the hydrophobic binding pockets of HSA. Consequently, it predominantly interacts with the hydrophilic groups present on the albumin surface. Indeed, in the ternary system, the distance between the donor (HSA) and the fluorescence acceptor (LV+HPCD) increased in comparison to the binary system (Table S2).
(HSA−HPCD)conj and (HSA−HPolS)conj non-covalent Interactions with LV
In contrast to ternary systems HSA interacted with the LV+HPCD complex, for the conjugates HSA-HPCD or HPolS, the binding constants (Ka) of LV with HSA grafted with CD exhibited consistently lower values across the entire temperature range. Notably, the most significant changes were observed at 37℃.
For instance, in the case of (HSA−HPCD)conj+LV, the binding constant at 37℃ was determined to be (9 ± 1) × 104 M−1, which is ten-fold lower than that observed for the unmodified protein (Table 4). The covalent cross-linking of HSA with HPolS led to an even more pronounced reduction in the interaction constant. In the (HSA+HpolS)conj+LV system, Ka was measured at (3.1 ± 1.3) × 104 M−1, representing a 30-fold decrease compared to HSA+LV (Figure 8a and b).
Our explanation is that the toroidal structures of HPCD, anchored to the HSA surface, impede the penetration of LV into the hydrophobic binding sites of HSA, necessitating LV to predominantly interact with the modified HSA surface. Given the profusion of hydrophilic oligosaccharides adorning the HSA surface, the principal binding forces in these interactions are hydrogen bonds and van der Waals forces.
Notably, the enthalpy change (ΔH) in the cases of (HSA−HPCD)conj+LV and (HSA−HPolS)conj+LV is diminished by factors of 3.2 and 2.5, respectively, relative to HSA+LV. Furthermore, there is a marked reduction in the entropy change (ΔS) by factors of 7 and 5.5 for (HSA−HPCD)conj+LV and (HSA−HPolS)conj+LV, respectively, in comparison to HSA+LV (Figure 8). These phenomena align with the characteristics of systems where the principal driving forces for complex formation are hydrogen bonds and van der Waals forces, as previously elucidated by [55].
Of particular interest, the decline in both enthalpy change (ΔH) and entropy change (ΔS) for systems involving HSA's conjugates is not as pronounced as in the case where LV was encapsulated within the HPCD torus.
Thus, changes in enthalpy and entropy affect drug-protein interactions by influencing the spontaneity and strength of binding. A balance between these two factors determines whether an interaction is thermodynamically favorable. The surface modification of HSA results in a notable reduction in the binding constants. These findings provide valuable insights into the control and modulation of drug carrier properties.
3.4. Kinetics of Levofloxacin Release
To gain insights into the impact of complexation on drug release kinetics, we adopted the equilibrium dialysis method as a model system. This parameter is pivotal for assessing the potential for extended drug release. The formation of drug complexes with cyclodextrin (CD) carriers has been known to exert a nuanced influence on the release rate. For instance, earlier research on ciprofloxacin complexes with β-CD derivatives indicated that complexation correlated with a deceleration in drug release, aligning with the dissociation constants of these complexes [57,58].
Our initial focus was to examine the impact on the release rates within binary systems, encompassing non-covalent LV complexes with HPCD, HPolS, and HSA. As anticipated, the formation of the LV+HPCD or LV+HPolS complex led to decrease in the release rate by 10-20% compared to free LV (Figure 9 and Table 7). This behavior mirrors that of ciprofloxacin when encapsulated in a 3D-matrix system intertwined with covalent complexes of ciprofloxacin with methyl-β-CD via 1,6-hexamethylene diisocyanate [50].
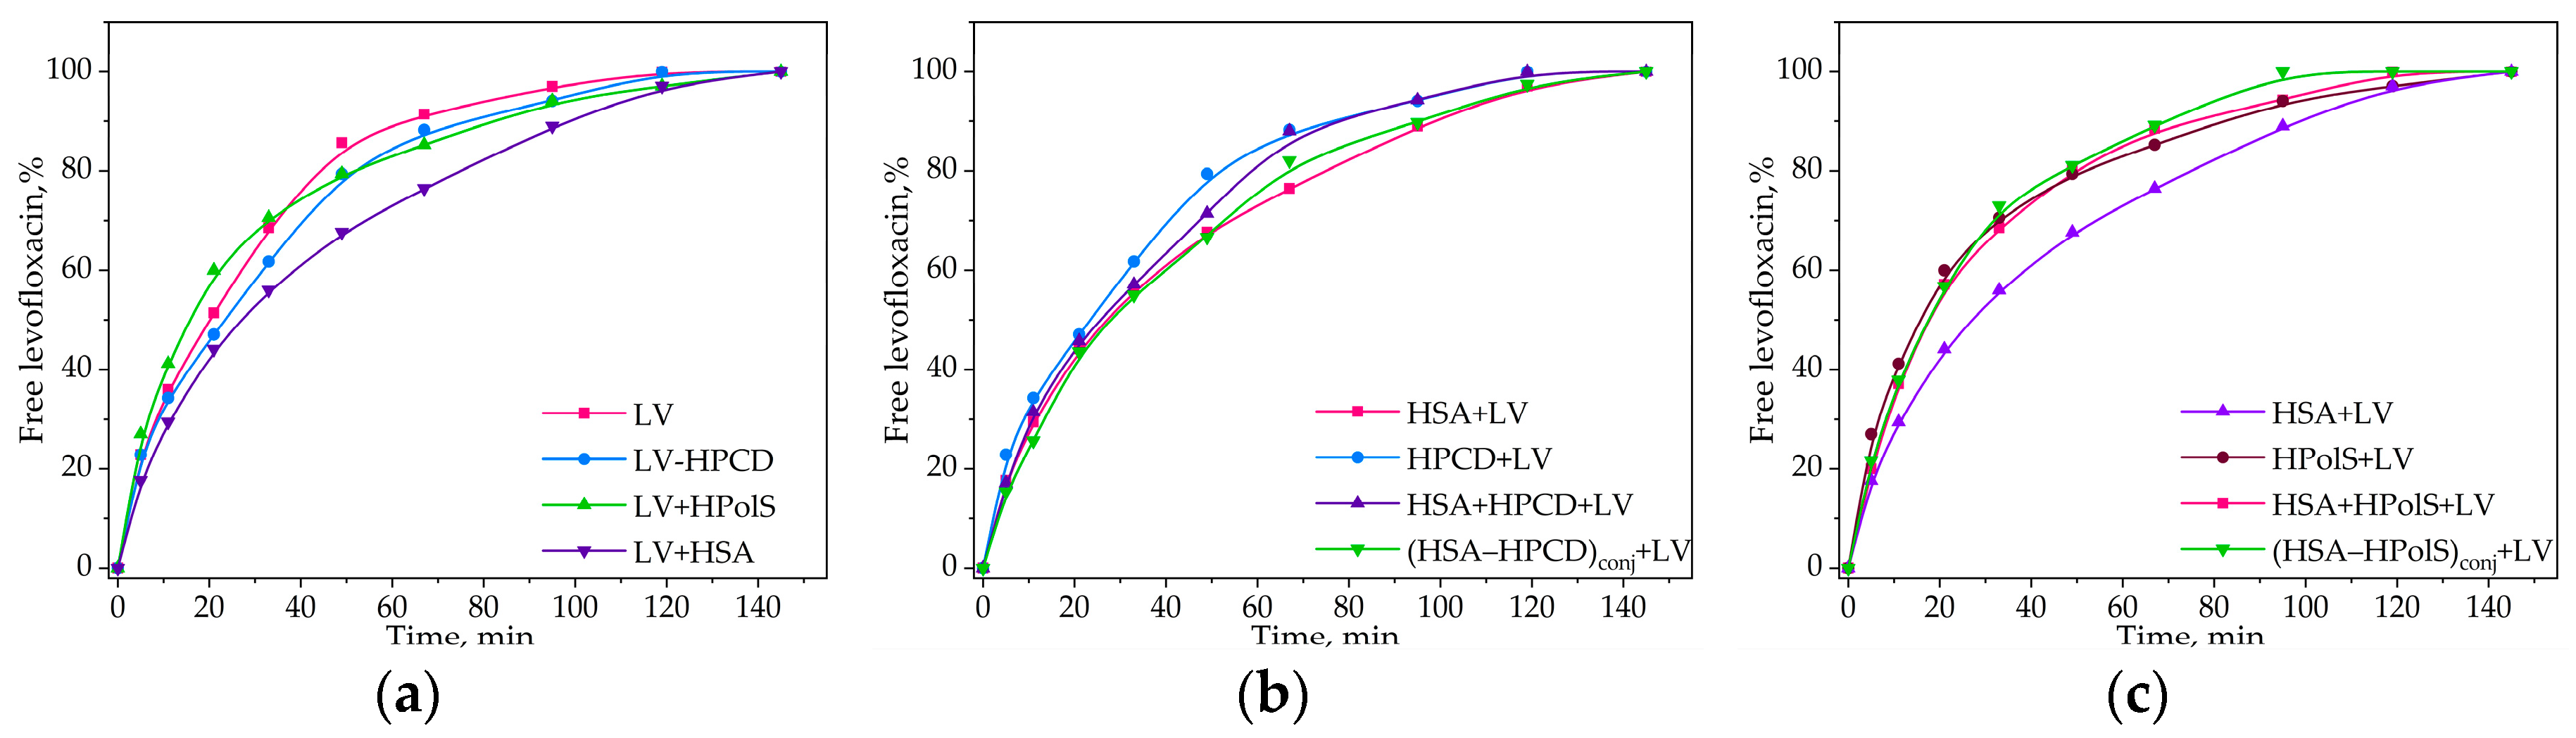
Figure 9.
(a) Free LV, LV complex with HPCD (HPCD+LV), LV complex with HpolS (HpolS+LV), and LV complex with HSA (HSA+LV) release curves;(b) HPCD+LV, HSA+LV, LV complex with (HSA−HPCD)conj, LV+HPCD complex with HSA; (c) HPolS+LV, HSA+LV, LV complex with (HSA−HPolS)conj, LV+HPolS complex with HSA, CHSA = 0.02 mM, 37 °C, PBS, pH 7.4. All data were obtained in three repetitions and calculated with errors.
Figure 9.
(a) Free LV, LV complex with HPCD (HPCD+LV), LV complex with HpolS (HpolS+LV), and LV complex with HSA (HSA+LV) release curves;(b) HPCD+LV, HSA+LV, LV complex with (HSA−HPCD)conj, LV+HPCD complex with HSA; (c) HPolS+LV, HSA+LV, LV complex with (HSA−HPolS)conj, LV+HPolS complex with HSA, CHSA = 0.02 mM, 37 °C, PBS, pH 7.4. All data were obtained in three repetitions and calculated with errors.
Table 7.
The release rate of LV or LV+CD carrier in the absence and presence of HSA, represented as slopes of the initial sections of the LV release curves (Figure 4), the relative changes in concentration per minute, pH 7.4, 37 °C.
Table 7.
The release rate of LV or LV+CD carrier in the absence and presence of HSA, represented as slopes of the initial sections of the LV release curves (Figure 4), the relative changes in concentration per minute, pH 7.4, 37 °C.
| The Presence of HSA | LV | LV+HPCD | LV+HPolS | |
|---|---|---|---|---|
| tg α1 | − | 2,4 ± 0.2 | 2,2 ± 0.2 | 2,9 ± 0.2 |
| free | 2,1 ± 0.2 | 2,2 ± 0.2 | 2,9 ± 0.2 | |
| conjugate 2 | 2,1 ± 0.2 | 2,7 ± 0.2 |
1 first 20 min; 2 in these cases (HSA− HPCD/HPols)+LV were considered.
In the presence of HSA, a discernible reduction in the release of LV by 15%, was observed as compared to free LV. This reduction is in accordance with the (Kdis) values. Indeed, LV+HPCD exhibited a Kdis of (1.0 ± 0.3) × 10−3 M, while HSA+LV featured a substantially lower Kdis of (1.0 ± 0.1) × 10−6 M. Consequently, the binding of LV to HSA is notably stronger than its interaction with HPCD, resulting in a diminished release rate for LV in the presence of HSA.
Subsequently, we investigated the influence of ternary system formation on the release rate of LV. Apparently, in systems involving HPolS, we observed a notably higher release rate compared to HSA+LV. Both (HSA−HPolS)conj+LV and HSA+HPolS+LV exhibited nearly identical release rates, both approximately 30% higher than that of HSA+LV (Figure 9c). This phenomenon can be attributed to 30-fold lower binding constant for (HSA−HPolS)conj+LV compared to HSA+LV.
Interestingly, in systems featuring HPCD, the release rate closely paralleled that of the HSA+LV system, as depicted in the figure. This observation can be attributed to the relatively modest, approximately 10-fold difference in binding constants between (HSA−HPCD)conj+LV and HSA+LV, which is not as pronounced as the difference observed in systems with HPolS (Figure 9b).
3.5. Antibacterial Activity of Conjugates
Nanoparticles constructed from HSA have garnered significant attention due to the numerous advantages associated with HSA. These include biocompatibility, biodegradability, well-established tolerability in human subjects, non-toxic and non-immunogenic attributes, and remarkable stability in various environments [6,59,60].
In this study, we investigate the impact of conjugates with HSA formatio on the antibacterial activity of LV. In the case of Escherichia coli, Gram-negative bacteria all of the studied samples containing LV exhibited a notable reduction in the rate of bacterial growth after 20 h (Figure 10a).
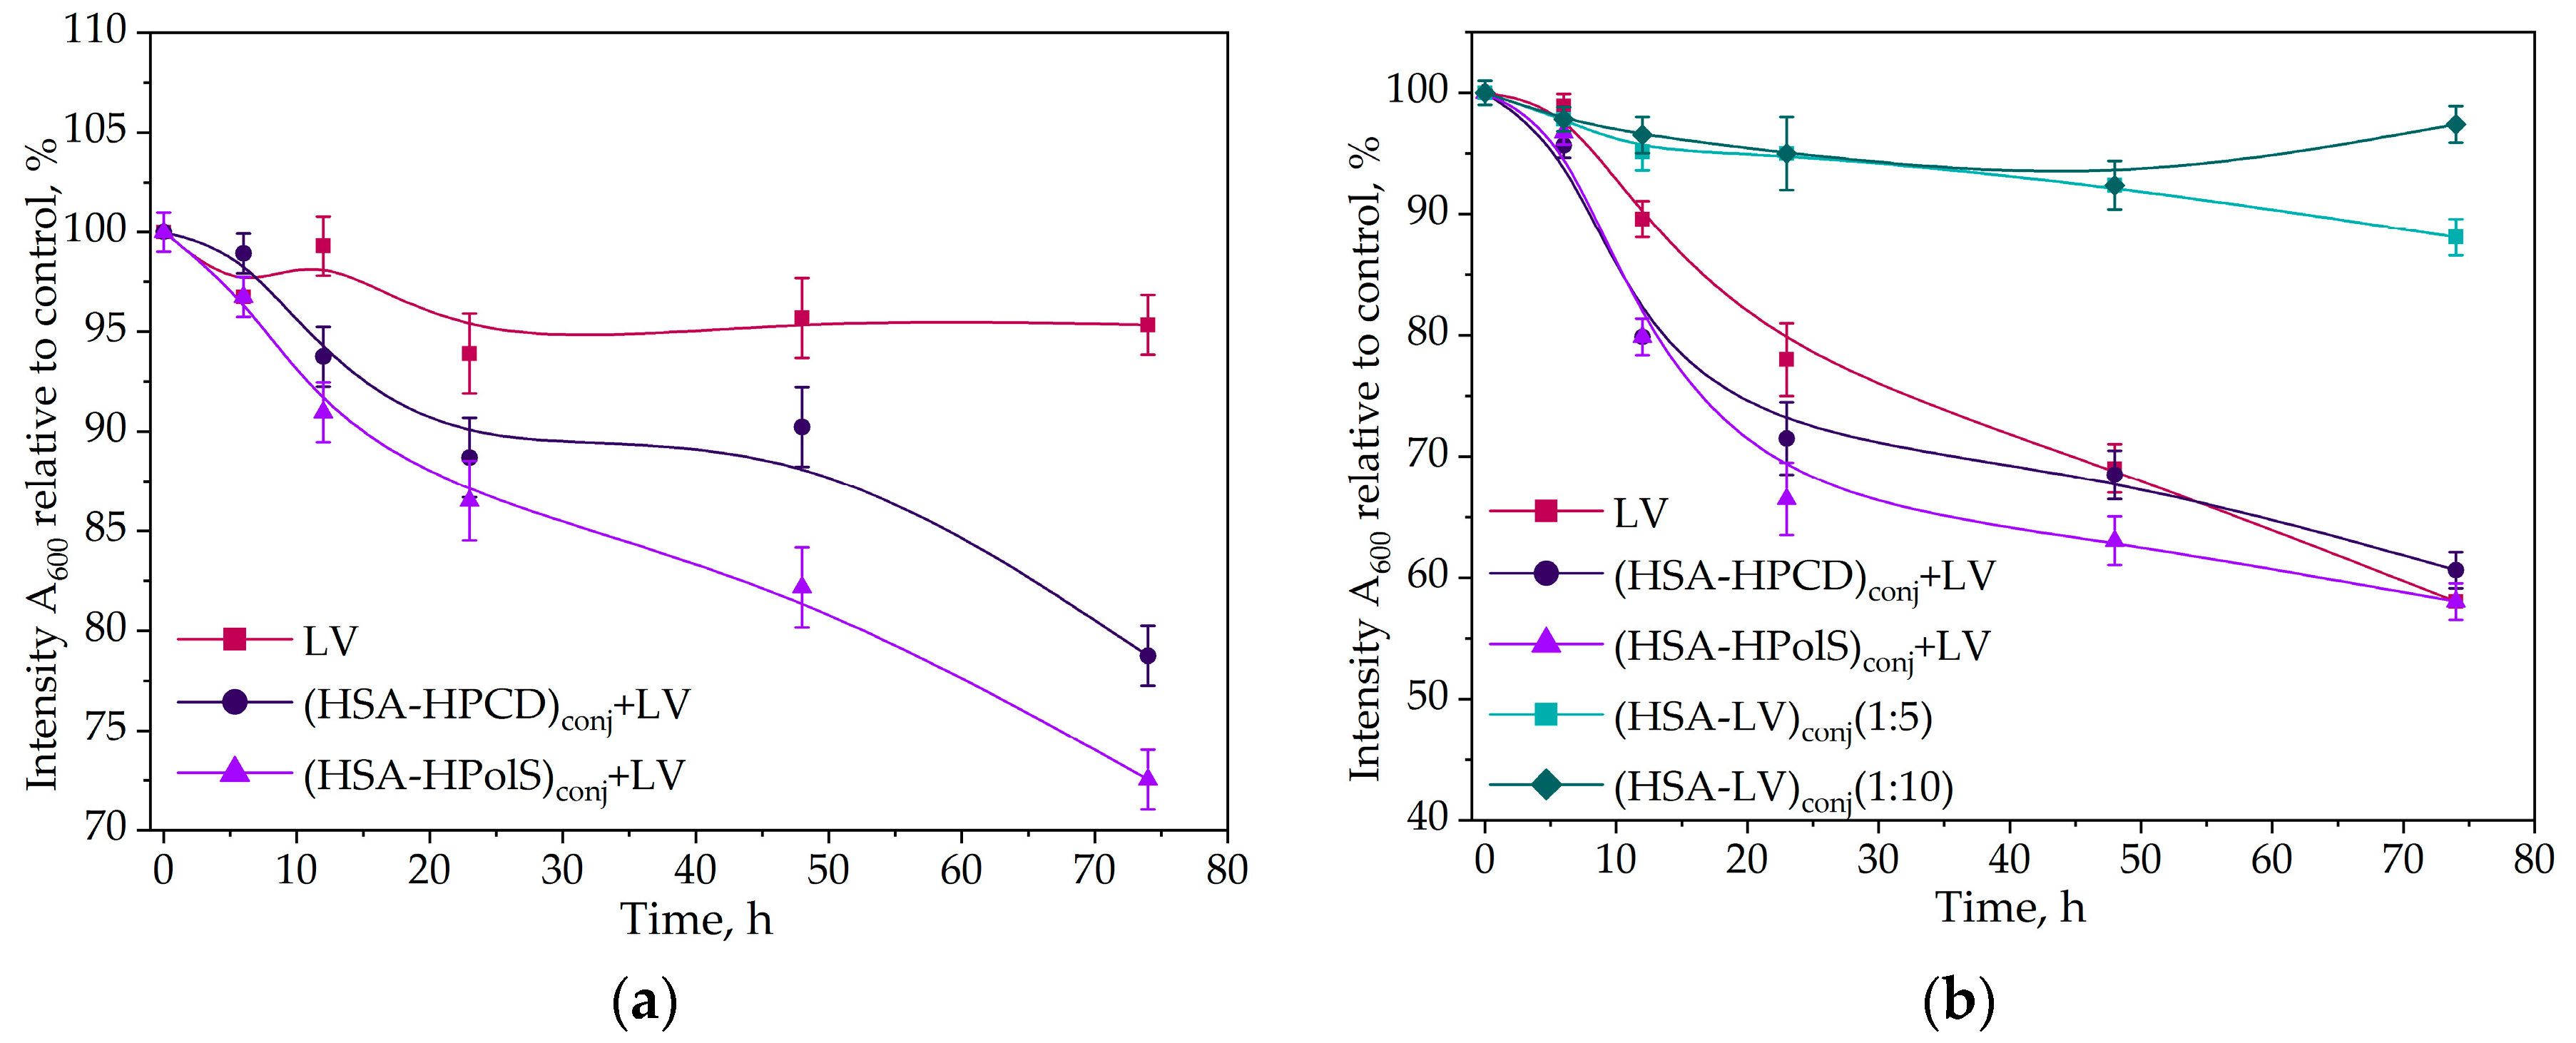
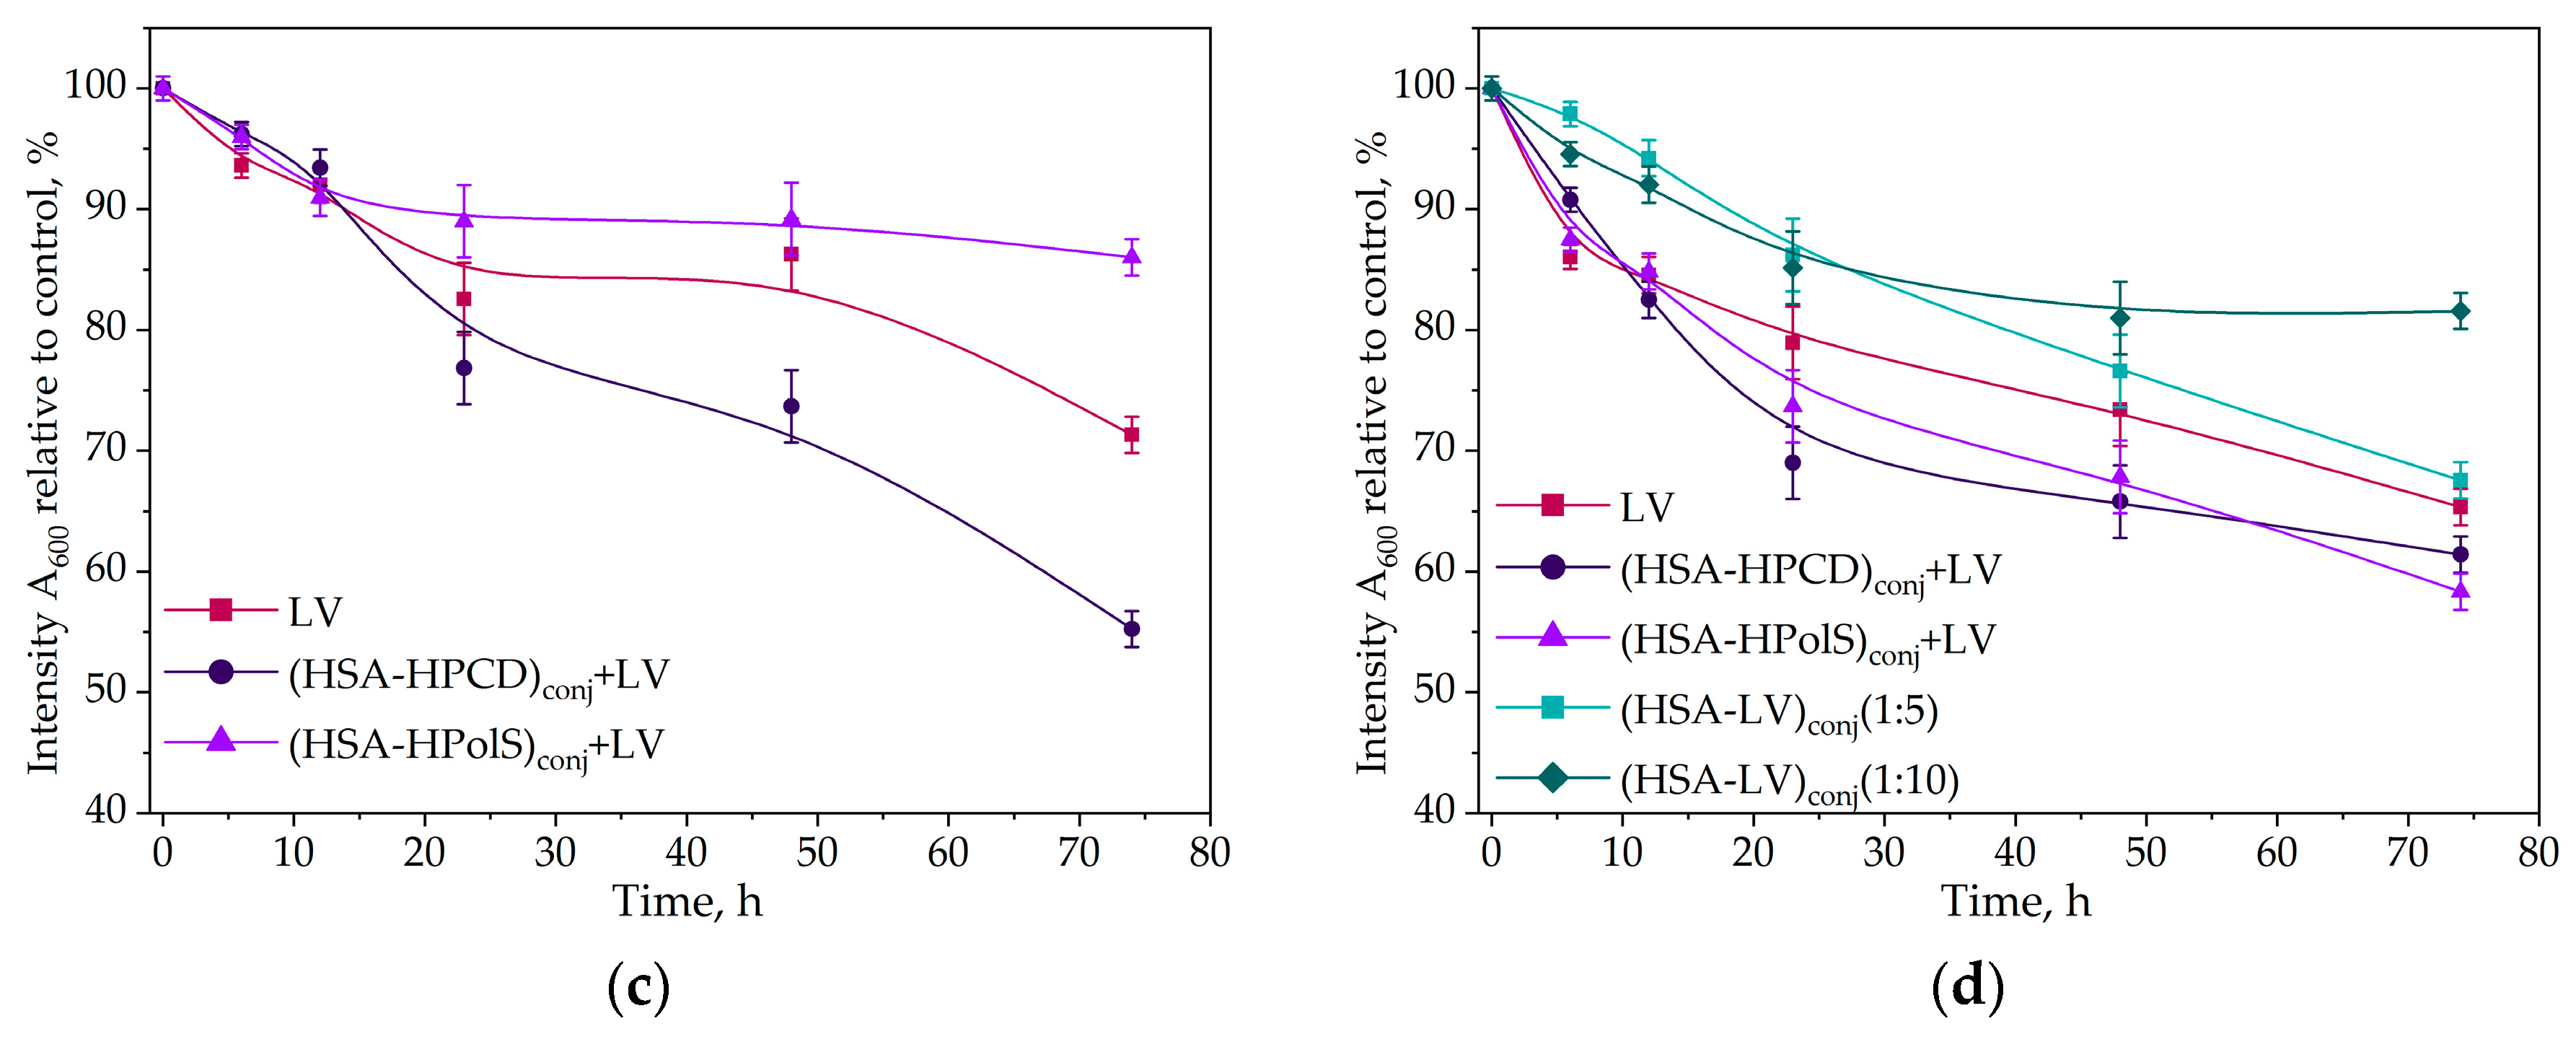
Figure 10.
Kinetic curves of the dependence of the optical absorbance at 600 nm (compared to control) at 37℃, correlating with the number of CFU, on the incubation time (0–72 h) for E. coli cells with antibacterial drugs CLV = 10 ng/ml (a) and CLV = 50 ng/ml (b) for B. subtilis cells, CLV = 10 ng/ml (c) and B. subtilis cells at CLV = 50 ng/ml , 37℃; (d). All data were obtained in three repetitions and calculated with errors.
Figure 10.
Kinetic curves of the dependence of the optical absorbance at 600 nm (compared to control) at 37℃, correlating with the number of CFU, on the incubation time (0–72 h) for E. coli cells with antibacterial drugs CLV = 10 ng/ml (a) and CLV = 50 ng/ml (b) for B. subtilis cells, CLV = 10 ng/ml (c) and B. subtilis cells at CLV = 50 ng/ml , 37℃; (d). All data were obtained in three repetitions and calculated with errors.
The most potent inhibitory effect was observed in the system featuring a non-covalent complex of LV with the HSA grafted with polymeric CD (HSA−HPolS)conj. These pronounced changes were particularly noticeable at LV concentration of 10 ng/ml. Remarkably, (HSA−HPolS)conj+LV at this concentration displayed 40% higher activity compared to free LV at the same concentration level. For monomeric CD (HSA−HPCD)conj+LV demonstrated a 30% increase in antibacterialm activity relative to free LV (Figure 10ab).
Subsequent testing of the samples at a higher LV concentration (50 ng/ml) revealed significant inhibitory effects across all formulations (Figure 11 and Table 8). The covalent conjugate HAS with LV (HSA−LV 1:10)conj and (HSA−LV 1:5)conj displayed a marginal reduction in activity, comparable to that at 10 ng/ml LV system. This observation can be attributed to the reduced availability of free LV in the HSA−LV systems in comparison to other systems where LV was not covalently linked (Figure 10b).
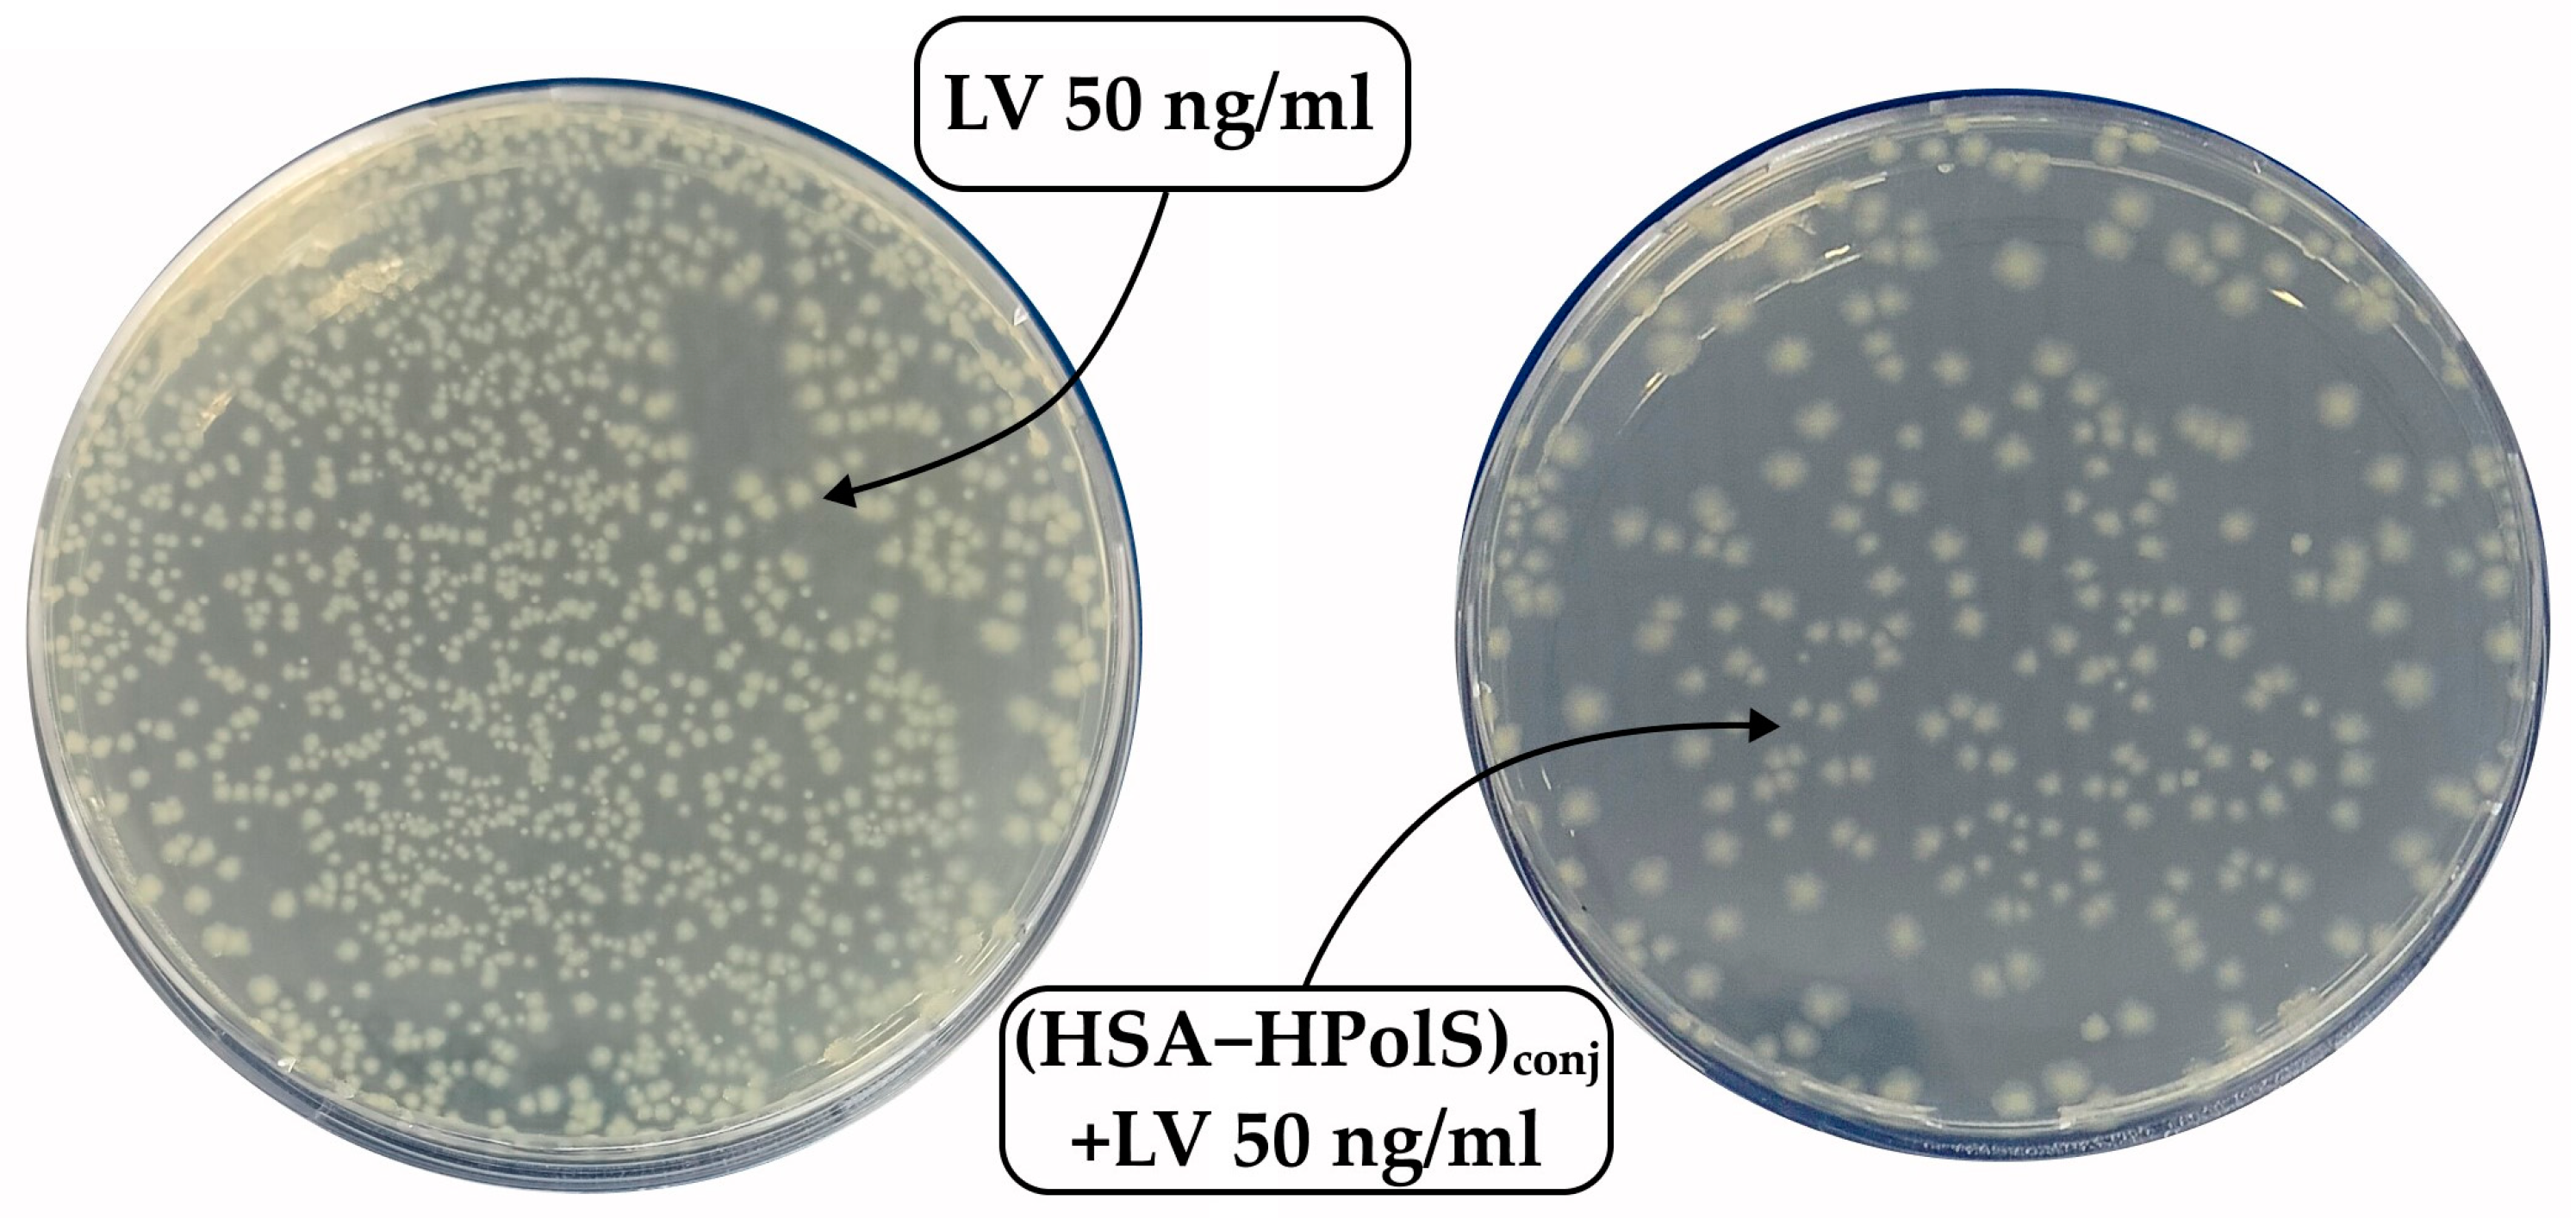
Table 8.
The number of colonies forming units (CFU) in the cells’ suspension with antibacterial agents (in all samples the LV concentration was maintained 50 ng/ml).
Table 8.
The number of colonies forming units (CFU) in the cells’ suspension with antibacterial agents (in all samples the LV concentration was maintained 50 ng/ml).
| Strain | Time, h | 109 CFU1 | ||||
|---|---|---|---|---|---|---|
| LV | (HSA−HPCD)conj+LV | (HSA−HPolS)conj+LV | HSA−LV 1 : 5 | HSA−LV 1 : 10 | ||
| E. coli | 24 | 1.6 ± 0.2 | 2.0 ± 0.2 | 0.2 ± 0.2 | 1.0 ± 0.1 | 1.1 ± 0.1 |
| 48 | 2.1 ± 0.2 | 2.3 ± 0.2 | 0.7 ± 0.1 | 1.7 ± 0.2 | 1.6 ± 0.1 | |
| B. subtilis | 24 | 0.9 ± 0.1 | 0.4 ± 0.1 | 0.8 ± 0.1 | 0.45 ± 0.05 | 1.1 ± 0.1 |
| 48 | 1.0 ± 0.1 | 0.5 ± 0.1 | 0.9 ± 0.1 | 0.51 ± 0.05 | 1.2 ± 0.1 | |
1 In this experiment, the cells were treated with antibacterial agents, and the number of CFU was determined by counting the colonies that grew on Petri dishes after incubation. The incubation was carried out at 37°C for 24-48 h. All data were obtained in three repetitions.
Figure 11.
The Petri dishes were seeded with a solution of Escherichia coli cells diluted 106 times. LV was added to one dish at a concentration of 50 ng/ml, and (HSA+HPolS)conj+LV was added to another dish at the same concentration. Incubation was carried out at 37°C for 24 hours.
Figure 11.
The Petri dishes were seeded with a solution of Escherichia coli cells diluted 106 times. LV was added to one dish at a concentration of 50 ng/ml, and (HSA+HPolS)conj+LV was added to another dish at the same concentration. Incubation was carried out at 37°C for 24 hours.
Further, we conducted similar experiments with Gram+ bacteria Bacillus Subtilis, yielding intriguing results. Firstly, we noted that HSA−LV exhibited comparable activity to (HSA−HPolS)conj+LV (Figure 10cd), in contrast to the findings with E. coli. This discrepancy is likely associated with the fact that B. subtilis forms robust biofilms, hindering the penetration of LV into bacterial cells and thereby limiting its antibacterial properties [61].
Within this context, the conjugation of LV with HSA serves as an antiadherent compound, potentially inhibiting the formation of biofilms. This, in turn, significantly contributes to the enhanced antibacterial activity of HSA−LV conjugates. Furthermore, in the case of B. subtilis, (HSA−HPCD)conj+LV emerges as the most effective drug carrier.
In the realm of antibacterial activity, the strategy of preventing biofilm formation on non-living surfaces has yielded varied outcomes [64,65,66,67]. Significantly, certain proteins have shown the ability to reduce bacterial biofilm formation on non-living surfaces, rendering these surfaces less hydrophobic [64,68,69,70]. Moreover, there is a wealth of information underscoring the advantageous influence of HSA in this context.
In addition to conjugates for antibacterial activity, conjugates with albumin are also promising for creating formulations for cytostatic drugs. So, the research of Kinoshita and colleagues has demonstrated the potential of HSA-doxorubicin conjugates in tumor treatment compared to free doxorubicin [62], where tumor cells actively utilize endogenous HSA as a source of amino acids to support their rapid proliferation, facilitated by HSA receptors such as gp60 or SPARC [63].
4. Conclusions
Human serum albumin (HSA) is multifunctional protein, known to be a natural carrier for a number of endogenous and exogenous compounds, including drugs. Formulating anticancer drugs with HSA is a clinically validated approach to improve the pharmacological properties and provide targeted delivery (passive and active) of the drugs (such as Doxorubicin or Abraxane etc). A number of receptors facilitating HSA uptake from systemic circulation have been characterized. What is important, such uptake may differ depending on the nature and quantity of ligands bound to HSA. Based on this, one might like to modify the HSA in a way that its distribution is more favorable for certain therapeutic purposes, thus ensuring more efficient delivery of the therapeutic cargo to disease site. Levofloxacin (LV), broad spectrum antibiotic drug, could benefit from extended systemic exposure, and stronger interaction with HAS plasma protein could be useful for this purpose.
Here we developed three HSA-based conjugates: HSA−LV conjugates and the non-covalent complexes of LV with HAS conjugated with Cyclodextrins (HSA−HPCD) and (HSA−HPolS) conjugates. CD(polymers)-LV association constant is two-three orders of magnitude higher than that for HSA-LF. So, we have engrafted monomeric or polymeric CDs on the surface of HSA molecules to strengthen the LV adsorption on HSA. Indeed, through fluorescence quenching experiments, we determined the binding constants (Kd) for LV+(HSA−HPCD)conj and LV+(HSA−HPolS)conj to be (9±1) × 104 M−1 and (3.1±1.3) × 104 M−1, respectively. The thermodynamic parameters, ΔH and ΔS, of the LV and (HSA−HPCD)conj/(HSA−HPolS)conj complex formation were determined, revealing that hydrogen bonds and van der Waals interactions play a significant role in complex formation. We have found that (HSA-HPolS)conj+LV exhibited the highest antibacterial activity against E. coli (show 40% higher activity compared to free LV), whereas (HSA-HPCD)conj+LV was the most effective against B. subtilis; and both HSA conjugates were more potent than LV alone or LV with HSA.
Further fine-tuning of HSA could yield an improvement in biodistribution, and thus a more favorable risk/benefit ratio.
Supplementary Materials
The following supporting information can be downloaded at the website of this paper posted on Preprints.org. Table S1. Temperature dependence of the Stern-Volmer quenching constants for the LV-HSA’s systems. Table S2. Energy transfer parameters for the interactions of the drugs with human serum albumin (25 °C, PBS, pH 7.4).
Author Contributions
Conceptualization: T.Yu.K., L.R.Y. and E.V.K.; Experimental work, data analysis and interpretation: T.Yu.K. and L.R.Y.; methodology of microbiological experiments, N.G.B.; Writing—Original draft preparation: T.Yu.K. and L.R.Y.; Writing—Review and editing: T.Yu.K., L.R.Y. and E.V.K.; Supervision: E.V.K. All authors have read and agreed to the published version of the manuscript.
Funding
This work was supported by the Russian Science Foundation grant number 22-24-00604.
Institutional Review Board Statement
Not applicable.
Informed Consent Statement
Not applicable.
Data Availability Statement
All data obtained or analyzed in the course of this study are included in this published article and its Supplementary Information.
Acknowledgments
The work was performed using equipment (FTIR spectrometer Bruker Tensor 27, Jasco J-815 CD Spectrometer, AFM microscope NTEGRA II) of the program for the development of Moscow State University.
Conflicts of Interest
The authors declare no conflict of interest.
References
- Zheng, Y.-R.; et al. Pt(IV) Prodrugs Designed to Bind Non-Covalently to Human Serum Albumin for Drug Delivery. J. Am. Chem. Soc. 2014, 136, 8790–8798. [Google Scholar] [CrossRef] [PubMed]
- Bohnert, T.; Gan, L.-S. Plasma protein binding: From discovery to development. J. Pharm. Sci. 2013, 102, 2953–2994. [Google Scholar] [CrossRef] [PubMed]
- Fanali, G.; di Masi, A.; Trezza, V.; Marino, M.; Fasano, M.; Ascenzi, P. Human serum albumin: From bench to bedside. Mol. Aspects Med. Elsevier Ltd, 2012, 33, 209–290. [Google Scholar] [CrossRef]
- Yang, F.; Zhang, Y.; Liang, H. Interactive Association of Drugs Binding to Human Serum Albumin. Int. J. Mol. Sci. 2014, 15, 3580–3595. [Google Scholar] [CrossRef] [PubMed]
- Trotta, F.; et al. Molecularly imprinted cyclodextrin nanosponges for the controlled delivery of L-DOPA: perspectives for the treatment of Parkinson’s disease. Expert Opin. Drug Deliv. 2016, 13, 1671–1680. [Google Scholar] [CrossRef] [PubMed]
- Kratz, F. Albumin as a drug carrier: Design of prodrugs, drug conjugates and nanoparticles. J. Control. Release 2008, 132, 171–183. [Google Scholar] [CrossRef]
- Kratochwil, N.A.; Huber, W.; Müller, F.; Kansy, M.; Gerber, P.R. Predicting plasma protein binding of drugs: a new approach. Biochem. Pharmacol. 2002, 64, 1355–1374. [Google Scholar] [CrossRef] [PubMed]
- Davis, R.; Bryson, H.M. Levofloxacin. Drugs 1994, 47, 677–700. [Google Scholar] [CrossRef]
- Van Bambeke, F.; Michot, J.M.; Van Eldere, J.; Tulkens, P.M. Quinolones in 2005: an update. Clin. Microbiol. Infect. 2005, 11, 256–280. [Google Scholar] [CrossRef]
- Wolfson, J.S.; Hooper, D.C. Fluoroquinolone antimicrobial agents. Clin. Microbiol. Rev. / ed. Oates J.A., Wood A.J.J. 1989, 2, 378–424. [Google Scholar] [CrossRef]
- Tiwari, G.; et al. Drug delivery systems: An updated review. Int. J. Pharm. Investig. 2012, 2, 2. [Google Scholar] [CrossRef] [PubMed]
- Davis, M.E.; Brewster, M.E. Cyclodextrin-based pharmaceutics: past, present and future. Nat. Rev. Drug Discov. 2004, 3, 1023–1035. [Google Scholar] [CrossRef] [PubMed]
- Stella, V.J.; He, Q. Cyclodextrins. Toxicol. Pathol. 2008, 36, 30–42. [Google Scholar] [CrossRef] [PubMed]
- Le-Deygen, I.M.; Skuredina, A.A.; Uporov, I. V.; Kudryashova, E. V. Thermodynamics and molecular insight in guest–host complexes of fluoroquinolones with β-cyclodextrin derivatives, as revealed by ATR-FTIR spectroscopy and molecular modeling experiments. Anal. Bioanal. Chem. Springer Verlag, 2017, 409, 6451–6462. [Google Scholar] [CrossRef]
- Yakupova, L.R.; Skuredina, A.A.; Markov, P.O.; Le-Deygen, I.M.; Kudryashova, E. V. Cyclodextrin Polymers as a Promising Drug Carriers for Stabilization of Meropenem Solutions. Appl. Sci. 2023, 13, 3608. [Google Scholar] [CrossRef]
- Skuredina, A.A.; Yakupova, L.R.; Kopnova, T.Y.; Le-Deygen, I.M.; Belogurova, N.G.; Kudryashova, E. V. Cyclodextrins and Their Polymers Affect Human Serum Albumin’s Interaction with Drugs Used in the Treatment of Pulmonary Infections. Pharmaceutics 2023, 15, 1598. [Google Scholar] [CrossRef] [PubMed]
- Varshney, A.; SEN, P.; Ahmad, E.; REHAN, M.; SUBBARAO, N.; Khan, R.H. Ligand Binding Strategies of Human Serum Albumin: How Can the Cargo be Utilized? Chirality 2010, 22, 77–87. [Google Scholar] [CrossRef] [PubMed]
- Zhang, L.-W.; Wang, K.; Zhang, X.-X. Study of the interactions between fluoroquinolones and human serum albumin by affinity capillary electrophoresis and fluorescence method. Anal. Chim. Acta 2007, 603, 101–110. [Google Scholar] [CrossRef] [PubMed]
- Hearn, M.T.W. [7] 1,1′-Carbonyldiimidazole-mediated immobilization of enzymes and affinity ligands 1987, 102–117. [CrossRef]
- Métro, T.-X.; Martinez, J.; Lamaty, F. 1,1′-Carbonyldiimidazole and Mechanochemistry: A Shining Green Combination. ACS Sustain. Chem. Eng. 2017, 5, 9599–9602. [Google Scholar] [CrossRef]
- Stöllner, D.; Scheller, F.W.; Warsinke, A. Activation of Cellulose Membranes with 1,1′-Carbonyldiimidazole or 1-Cyano-4-dimethylaminopyridinium tetrafluoroborate as a Basis for the Development of Immunosensors. Anal. Biochem. 2002, 304, 157–165. [Google Scholar] [CrossRef]
- Faridnouri, H.; Ghourchian, H.; Hashemnia, S. Direct electron transfer enhancement of covalently bound tyrosinase to glassy carbon via Woodward’s reagent K. Bioelectrochemistry 2011, 82, 1–9. [Google Scholar] [CrossRef] [PubMed]
- Puri, R.N.; Colman, R.W. A Novel Method for Chemical Modification of Functional Groups Other Than a Carboxyl Group in Proteins byN-Ethyl-5-phenylisooxazolium-3′-sulfonate (Woodward’s Reagent-K): Inhibition of ADP-Induced Platelet Responses Involves Covalent Modification of Aggreg. Anal. Biochem. 1996, 240, 251–261. [Google Scholar] [CrossRef]
- Dobryakova, N. V.; Zhdanov, D.D.; Sokolov, N.N.; Aleksandrova, S.S.; Pokrovskaya, M. V.; Kudryashova, E. V. Rhodospirillum rubrum L-Asparaginase Conjugates with Polyamines of Improved Biocatalytic Properties as a New Promising Drug for the Treatment of Leukemia. Appl. Sci. 2023, 13, 3373. [Google Scholar] [CrossRef]
- PAOLI, P.; et al. Mechanism of acylphosphatase inactivation by Woodward’s reagent K. Biochem. J. 1997, 328, 855–861. [Google Scholar] [CrossRef] [PubMed]
- Sinha, U.; Brewer, J.M. A spectrophotometric method for quantitation of carboxyl group modification of proteins using Woodward’s Reagent K. Anal. Biochem. 1985, 151, 327–333. [Google Scholar] [CrossRef]
- Dunn, B.M.; Anfinsen, C.B.; Shrager, R.I. Kinetics of Woodward’s Reagent K Hydrolysis and Reaction with Staphylococcal Nuclease. J. Biol. Chem. 1974, 249, 3717–3723. [Google Scholar] [CrossRef]
- Skuredina, A.A.; Le-Deygen, I.M.; Belogurova, N.G.; Kudryashova, E. V. Effect of cross-linking on the inclusion complex formation of derivatized β-cyclodextrins with small-molecule drug moxifloxacin. Carbohydr. Res. 2020, 498, 108183. [Google Scholar] [CrossRef]
- Yakupova, L.R.; et al. The Formation of β-Cyclodextrin Complexes with Levofloxacin and Ceftriaxone as an Approach to the Regulation of Drugs’ Pharmacokinetic. Colloid J. 2023, 85, 114–127. [Google Scholar] [CrossRef]
- Richner, G.; Puxty, G. Assessing the Chemical Speciation during CO 2 Absorption by Aqueous Amines Using in Situ FTIR. Ind. Eng. Chem. Res. 2012, 51, 14317–14324. [Google Scholar] [CrossRef]
- Furer, V.L.; et al. Vibrational spectra study of fluorescent dendrimers built from the cyclotriphosphazene core with terminal dansyl and carbamate groups. Spectrochim. Acta Part A Mol. Biomol. Spectrosc. 2011, 79, 462–470. [Google Scholar] [CrossRef]
- Lingegowda, DEEPASHREE C and Kumar, J Komal and Prasad, AD and Zarei, Mahsa and Gopal, S. FTIR spectroscopic studies on cleome gynandra-Comparative analysis of functional group before and after extraction. Rom. J. Biophys2012, 22, 137–143.
- Tretiakova, D.; Le-Deigen, I.; Onishchenko, N.; Kuntsche, J.; Kudryashova, E.; Vodovozova, E. Phosphatidylinositol Stabilizes Fluid-Phase Liposomes Loaded with a Melphalan Lipophilic Prodrug. Pharmaceutics 2021, 13, 473. [Google Scholar] [CrossRef] [PubMed]
- Dong, A.; Meyer, J.D.; Brown, J.L.; Manning, M.C.; Carpenter, J.F. Comparative Fourier Transform Infrared and Circular Dichroism Spectroscopic Analysis of α1-Proteinase Inhibitor and Ovalbumin in Aqueous Solution. Arch. Biochem. Biophys. 2000, 383, 148–155. [Google Scholar] [CrossRef] [PubMed]
- Haris, P.I.; Severcan, F. FTIR spectroscopic characterization of protein structure in aqueous and non-aqueous media. J. Mol. Catal. B Enzym. 1999, 7, 207–221. [Google Scholar] [CrossRef]
- Aleem, O.; Kuchekar, B.; Pore, Y.; Late, S. Effect of β-cyclodextrin and hydroxypropyl β-cyclodextrin complexation on physicochemical properties and antimicrobial activity of cefdinir. J. Pharm. Biomed. Anal. 2008, 47, 535–540. [Google Scholar] [CrossRef] [PubMed]
- Zhao, D.; Zhao, L.; Zhu, C.-S.; Huang, W.-Q.; Hu, J.-L. Water-insoluble β-cyclodextrin polymer crosslinked by citric acid: synthesis and adsorption properties toward phenol and methylene blue. J. Incl. Phenom. Macrocycl. Chem. 2009, 63, 195–201. [Google Scholar] [CrossRef]
- Vlasova, I.M.; Bukharova, E.M.; Kuleshova, A.A.; Saletsky, A.M. Spectroscopic investigations of interaction of fluorescent nanomarkers of fluorescein family with human serum albumin at different values of pH. Curr. Appl. Phys. Elsevier B.V, 2011, 11, 1126–1132. [Google Scholar] [CrossRef]
- Poureshghi, F.; Ghandforoushan, P.; Safarnejad, A.; Soltani, S. Interaction of an antiepileptic drug, lamotrigine with human serum albumin (HSA): Application of spectroscopic techniques and molecular modeling methods. J. Photochem. Photobiol. B Biol. Elsevier B.V., 2017, 166, 187–192. [Google Scholar] [CrossRef]
- Seedher, N.; Agarwal, P. Competitive binding of fluoroquinolone antibiotics and some other drugs to human serum albumin: a luminescence spectroscopic study. Luminescence 2013, 28, 562–568. [Google Scholar] [CrossRef] [PubMed]
- Paul, B.K.; Ghosh, N.; Mukherjee, S. Interplay of Multiple Interaction Forces: Binding of Norfloxacin to Human Serum Albumin. J. Phys. Chem. B 2015, 119, 13093–13102. [Google Scholar] [CrossRef]
- Abu, T.M.M.; Ghithan, J.; Abu-Taha, M.I.; Darwish, S.M.; Abu-hadid, M.M. Spectroscopic approach of the interaction study of ceftriaxone and human serum albumin. J. Biophys. Struct. Biol. 2014, 6, 1–12. [Google Scholar] [CrossRef]
- Yoshikawa, H.; Hirano, A.; Arakawa, T.; Shiraki, K. Effects of alcohol on the solubility and structure of native and disulfide-modified bovine serum albumin. Int. J. Biol. Macromol. Elsevier B.V., 2012, 50, 1286–1291. [Google Scholar] [CrossRef] [PubMed]
- Tatulian, S.A. Structural Characterization of Membrane Proteins and Peptides by FTIR and ATR-FTIR Spectroscopy 2013, 177–218. [CrossRef]
- Iranfar, H.; Rajabi, O.; Salari, R.; Chamani, J. Probing the Interaction of Human Serum Albumin with Ciprofloxacin in the Presence of Silver Nanoparticles of Three Sizes: Multispectroscopic and ζ Potential Investigation. J. Phys. Chem. B 2012, 116, 1951–1964. [Google Scholar] [CrossRef] [PubMed]
- Zhang, H.-M.; Wang, Y.-Q.; Jiang, M.-L. A fluorimetric study of the interaction of C.I. Solvent Red 24 with haemoglobin. Dye. Pigment. 2009, 82, 156–163. [Google Scholar] [CrossRef]
- Wei, Y.; Li, J.; Dong, C.; Shuang, S.; Liu, D.; Huie, C.W. Investigation of the association behaviors between biliverdin and bovine serum albumin by fluorescence spectroscopy. Talanta 2006, 70, 377–382. [Google Scholar] [CrossRef] [PubMed]
- Seedher, N.; Agarwal, P. Complexation of fluoroquinolone antibiotics with human serum albumin: A fluorescence quenching study. J. Lumin. North-Holland, 2010, 130, 1841–1848. [Google Scholar] [CrossRef]
- Kaur, A.; Khan, I.A.; Banipal, P.K.; Banipal, T.S. Deciphering the complexation process of a fluoroquinolone antibiotic, levofloxacin, with bovine serum albumin in the presence of additives. Spectrochim. Acta Part A Mol. Biomol. Spectrosc. Elsevier B.V., 2018, 191, 259–270. [Google Scholar] [CrossRef]
- Skuredina, A.A.; Kopnova, T.Y.; Belogurova, N.G.; Kudryashova, E. V. Encapsulation of Ciprofloxacin into a Cyclodextrin Polymer Matrix: The Complex Formation with Human Serum Albumin and In Vitro Studies. Chemistry (Easton). 2023, 5, 1942–1960. [Google Scholar] [CrossRef]
- Yakupova, L.R.; Kopnova, T.Y.; Skuredina, A.A.; Kudryashova, E. V. Effect of Methyl-β-Cyclodextrin on the Interaction of Fluoroquinolones with Human Serum Albumin. Russ. J. Bioorganic Chem. 2022, 48, 163–172. [Google Scholar] [CrossRef]
- Yakupova, L.R.; Skuredina, A.A.; Kopnova, T.Y.; Kudryashova, E. V. In Vitro Biological Properties of Cyclodextrin-Based Polymers: Interaction with Human Serum Albumin, Red Blood Cells and Bacteria. Polysaccharides 2023, 4, 343–357. [Google Scholar] [CrossRef]
- Hu, Y.J.; Ou-Yang, Y.; Zhang, Y.; Liu, Y. Affinity and specificity of ciprofloxacin-bovine serum albumin interactions: Spectroscopic approach. Protein J. 2010, 29, 234–241. [Google Scholar] [CrossRef]
- Rehman, M.T.; Shamsi, H.; Khan, A.U. Insight into the binding mechanism of imipenem to human serum albumin by spectroscopic and computational approaches. Mol. Pharm. 2014, 11, 1785–1797. [Google Scholar] [CrossRef]
- Ross, P.D.; Subramanian, S. Thermodynamics of Protein Association Reactions: Forces Contributing to Stability. Biochemistry 1981, 20, 3096–3102. [Google Scholar] [CrossRef] [PubMed]
- Tabassum, S.; Al-Asbahy, W.M.; Afzal, M.; Arjmand, F. Synthesis, characterization and interaction studies of copper based drug with Human Serum Albumin (HSA): Spectroscopic and molecular docking investigations. J. Photochem. Photobiol. B Biol.Elsevier B.V., 2012, 114, 132–139. [Google Scholar] [CrossRef]
- Skuredina, A.A.; Kopnova, T.Y.; Le-deygen, I.M.; Kudryashova, E. V. Physical and Chemical Properties of the Guest – Host Inclusion Complexes of Cyprofloxacin with β -Cyclodextrin Derivatives. Moscow Univ. Chem. Bull. 2020, 75, 218–224. [Google Scholar] [CrossRef]
- Skuredina, A.A.; et al. The New Strategy for Studying Drug-Delivery Systems with Prolonged Release: Seven-Day In Vitro Antibacterial Action. Molecules 2022, 27, 8026. [Google Scholar] [CrossRef]
- Sparreboom, A.; et al. Comparative Preclinical and Clinical Pharmacokinetics of a Cremophor-Free, Nanoparticle Albumin-Bound Paclitaxel (ABI-007) and Paclitaxel Formulated in Cremophor (Taxol). Clin. Cancer Res. 2005, 11, 4136–4143. [Google Scholar] [CrossRef] [PubMed]
- Chemmanur, A.T.; Wu, G.Y. Drug evaluation: Albuferon-alpha--an antiviral interferon-alpha/albumin fusion protein. Curr. Opin. Investig. Drugs 2006, 7, 750–758. [Google Scholar]
- Arnaouteli, S.; Bamford, N.C.; Stanley-Wall, N.R.; Kovács, Á.T. Bacillus subtilis biofilm formation and social interactions. Nat. Rev. Microbiol. 2021, 19, 600–614. [Google Scholar] [CrossRef]
- Kinoshita, R.; et al. The Therapeutic Effect of Human Serum Albumin Dimer-Doxorubicin Complex against Human Pancreatic Tumors. Pharmaceutics 2021, 13, 1209. [Google Scholar] [CrossRef]
- Desai, N.; Trieu, V.; Damascelli, B.; Soon-Shiong, P. SPARC Expression Correlates with Tumor Response to Albumin-Bound Paclitaxel in Head and Neck Cancer Patients. Transl. Oncol. 2009, 2, 59–64. [Google Scholar] [CrossRef]
- An, Y.H.; Friedman, R.J. Concise review of mechanisms of bacterial adhesion to biomaterial surfaces. J. Biomed. Mater. Res. 1998, 43, 338–348. [Google Scholar] [CrossRef]
- Bridgett, M.J.; Davies, M.C.; Denyer, S.P. Control of staphylococcal adhesion to polystyrene surfaces by polymer surface modification with surfactants. Biomaterials 1992, 13, 411–416. [Google Scholar] [CrossRef] [PubMed]
- Donlan, R.M.; Costerton, J.W. Biofilms: Survival Mechanisms of Clinically Relevant Microorganisms. Clin. Microbiol. Rev. 2002, 15, 167–193. [Google Scholar] [CrossRef] [PubMed]
- Paulsson, M.; Kober, M.; Freij-Larsson, C.; Stollenwerk, M.; Wesslén, B.; Ljungh, Å. Adhesion of staphylococci to chemically modified and native polymers, and the influence of preadsorbed fibronectin, vitronectin and fibrinogen. Biomaterials 1993, 14, 845–853. [Google Scholar] [CrossRef] [PubMed]
- Brokke, P.; Dankert, J.; Carballo, J.; Feijen, J. Adherence of Coagulase-Negative Staphylococci onto Polyethylene Catheters in vitro and in vivo: A Study on the Influence of various Plasma Proteins. J. Biomater. Appl. 1991, 5, 204–226. [Google Scholar] [CrossRef] [PubMed]
- Reynolds, E.C.; Wong, A. Effect of adsorbed protein on hydroxyapatite zeta potential and Streptococcus mutans adherence. Infect. Immun. 1983, 39, 1285–1290. [Google Scholar] [CrossRef]
- del Prado, G.; Ruiz, V.; Naves, P.; Rodríguez-Cerrato, V.; Soriano, F.; del Carmen Ponte, M. Biofilm formation by Streptococcus pneumoniae strains and effects of human serum albumin, ibuprofen, N-acetyl-l-cysteine, amoxicillin, erythromycin, and levofloxacin. Diagn. Microbiol. Infect. Dis. 2010, 67, 311–318. [Google Scholar] [CrossRef]
Disclaimer/Publisher’s Note: The statements, opinions and data contained in all publications are solely those of the individual author(s) and contributor(s) and not of MDPI and/or the editor(s). MDPI and/or the editor(s) disclaim responsibility for any injury to people or property resulting from any ideas, methods, instructions or products referred to in the content. |
© 2023 by the authors. Licensee MDPI, Basel, Switzerland. This article is an open access article distributed under the terms and conditions of the Creative Commons Attribution (CC BY) license (http://creativecommons.org/licenses/by/4.0/).
Copyright: This open access article is published under a Creative Commons CC BY 4.0 license, which permit the free download, distribution, and reuse, provided that the author and preprint are cited in any reuse.


