
Submitted:
02 November 2023
Posted:
03 November 2023
You are already at the latest version
Abstract
. Colchicine (C22H25NO6) is a substance used for inducing mutations in order to regulate important agronomic traits. The objective of this study was to investigate the effect of different concentrations (0.0, 0.04, 0.06, 0.08 and 0.1%) and treatment time (6, 12 and 24 h) of colchicine on agronomic traits of proso millet (Panicum miliaceum L.) and to assess the genetic diversity of M2 generations using inter simple sequence repeat markers (ISSR). The experiment was conducted in 2021 for the M1-generation and in 2022 for the M2-generation, from May to September. The percentage of the field germination was decreased with the increasing colchicine concentration and exposure duration. The chlorophyll-defective M1-M2 plants were obtained using various concentrations and exposure periods of colchicine. The highest amount of mutational modifications was attained at 0.08-0.1% concentrations colchicine. A total of 248 plant families with chlorophyll-defective mutations based on the research results were selected from 2214 families. The growing season of M1- and M2 plants were diminished under higher colchicine concentration (0.08-0.1%) combined with soaking time. Thus, the highest indicator of growing season (84 days) was observed at six h treatment time for PI 289324, while the fewest (78 days) was recorded at 12 and 24 h. The possibility of obtaining morphological mutations using colchicine has been confirmed. The ISSR primers amplified a total of 1333 fragments, 1281 bands were found to be polymorphic and 52 bands monomorphic. The percentage of polymorphism varied from 80 to 100 % with an average of 96.11%. Our results showed that most of the bands were found at 0.08% colchicine concentration. These positive variations are a great opportunity to use colchicine as a tool for improving agronomic traits in plant breeding.
Keywords:
proso millet
; mutagenesis
; colchicine
; chlorophyll deficient
; agronomic traits
; ISSR markers
1. Introduction
The proso millet (Panicum miliaceum L.) is known as a tetraploid cereal (2n=4×=36) and is presumed to be an allotetraploid, as it has been found that exclusive bivalent formation occurs during meiosis [1,2]. Wild tetraploid ancestors of domesticated P. miliaceum have not yet been identified. Weedy forms, which may include a wild ancestor, are found throughout Eurasia, from Northeast China to the Aral-Caspian reservoir [3], in Central Europe [4], and in North America [5]. Its cultivation began 10000 years ago in Northern China. The appearance of millet in Canada dates back to the 17th century [6]. Millet has a short growing season (60-90 days) and an exceptionally low need for water [7], andrequires an average annual rainfall less than 600 mm. For normal growth, it needs an average daily temperature above 17°C during the growing season [8]. This species shows significant morphological variability, but the variability of isozymes or microsatellite molecular markers is low [6], which likely reflects the dual bottleneck of both polyploidization and domestication. Millet is a C4 plant and can effectively fix carbon under conditions of drought, high temperatures, and limited amounts of nitrogen and carbon dioxide, and it is also one of the most resistant crops among other spring cereals in terms of drought and heat tolerance, which is a very valuable trait for drylands [9,10].
Mutation breeding is a comparatively quick method for improvement of self-pollinated crops. It has been noticed that induced mutations in locally adapted genotypes are able to enhance agronomic performance, as well as other quantitative traits in plants [11]. Some mutations could induce new features that did not exist previously, or that had been lost through long-term cultivation [12]. Chemical substances such as colchicine, nitrosomethylurea, sodium azide, and many others are widely used as mutagenic agents [13].
Colchicine effectively functions as “mitotic poison”, leading to noticeable mutagenic effects. Many studies demonstrate the mutagenic effects of colchicine on plant performance [14]. According to the studies, a wide range of colchicine concentrations is used for the induction of polyploidy in different plant species, from the lowest concentration of 0.00001% in campion (Lychnicsenno) to the extremely high concentration of 1.5% in Maule’s quince (Chaenomeles japonica) [15]. Colchicine is used not only to double the set of plant chromosomes, it can also provoke mutation in plants. Plants that have been mutated through colchicine are known as colchi-mutants [16]. Colchicine has been used to induce some useful mutations in many plants, such as Orchid (Dendrobium nobile) [17], Chaste tree (Vitexagnus castus L) [18], Calendula (Calendula officinalis) [19], Sultana (Impatiens walleriana) [20], Gladiolus (Gladiolus grandiflorus) [21] and etc. [22].
Concerning the millet, the tetraploid foxtail millet was obtained using colchicine, the seeds were treated with 0.25% colchicine with exposure for four hours for the yellow sand variety [23]. Apart from the agronomic traits of crops, the mutagenic effects can be evaluated more thoroughly thanks to molecular markers. Molecular markers have been extensively used for determining the genetic diversity among various plant species [24]. Molecular studies of the DNA polymorphism of the proso millet germplasm are mainly based on molecular markers such as RAPD, ISSR [25], AFLP [26], and SSR [27]. ISSR markers have been proven to been one of the most effective tool for genetic diversity analysis owing to low cost, simplicity, reproducibility and no required prior knowledge [28]. Due to the high degree of polymorphic nature, ISSR markers are extensively used [29]. Although colchicine-induced mutagenesis methods are applied to cultivated plants of various species all the world, in the Republic of Kazakhstan these studies have not been sufficiently conducted and have not been practically applied, especially in terms of proso millet at molecular level [30]. A genetic diversity of proso millet collection based on SSR markers in Kazakhstan was reported by Zargar et al. [31]. The purpose of the present study was: a) to investigate the effects of various colchicine concentrations and treatment period on agronomic traits of proso millet cultivated in field conditions; b) to assess the genetic diversity resulting from colchicine effect with application of ISSR markers.
2. Materials and Methods
2.1. Plant Material
Three genotypes of proso millet (Panicum miliaceum L.) were used as research material: Pavlodarskoe 4 (Kazakhstan), Quartet (RF) and PI 289324 (Hungary).
2.2. Experimental details and treatments
The seeds were treated with C22H25NO6 in laboratory conditions, according to the protocol described by Swathi et al. [32]. Commonly, an aqueous solution of colchicine is used for the treatment, but considering that it is unstable in water it is recommended to prepare a new aqueous solution each time before treatment [32]. Four different colchicine concentrations (0.04, 0.06, 0.08, and 1.0%) in combination with three seed soaking durations (6, 12, and 24 h) were tested. Seeds in the amount of 500 units were at first immersed in a 12% hydrogen peroxide solution for 15 minutes to destroy harmful microflora on the grains, after that they were washed in distilled water three times. For seeds treatment, 30 ml of 0, 0.04, 0.06, 0.08, and 1.0% colchicine aqueous solutions were put in 50 ml conical tubes for 6, 12, and 24 h at room temperature, and the seeds were soaked in them. Following the treatment, the seeds were washed in distilled water and were sown in the soil in field conditions. Field experiments for the M1-generation were carried out in the growing season of 2021 from May to September in the breeding nursery of the Baraev Scientific Production Center of Grain Farming (Shortandy village-1, Shortandy district, Akmola region, Republic of Kazakhstan) in the dry steppe zone of the Akmola region. The experiment was performed according to the All-Russian Institute of Plant Growing guidelines and the Field Experiment Methodology [33].
The total number of proso millet seeds used in the experiment was 6000 (12 treatments × 500 seeds for each treatment). Treated seeds were sown in May 2021, 250 seeds/m2 with three replications. The row spacing was 20 cm, the distance between the plants was 5 cm and the seeding depth was 3-4 cm. Ripened seeds of all selected and selfed M1-plants from each mutagenic treatment were collected. The seeds obtained from the M1-generation were replanted for the M2-generation in May 2022.
2.3. Data collection
Data for M1- and M2-generations was collected in the experimental seasons. Field germinations were counted at the early stage of ontogenesis. Plant growth and development as well as plant survival rate to harvest were phenologically observed during the growing season. Plant height, productive branches (piece), seed weight per panicle (g), 1000 seeds weight (g) and grain yield (c/ha-1) were counted to determine phenotypic differences after harvesting. The number of seeds was calculated on the “DATA Count S-25”. The 1000 seeds weight was calculated as the average of 10 replicates containing 100 seeds, multiplied by 10. The difference between the 1000 seeds weight was obtained by a counter, up to the maximum level [34].
2.4. Analysis of chlorophyll deficient mutants
To determine chlorophyll-deficient foliar mutants in each plant exposed to different treatment, the number of mutant families was computed and plants with chlorophyll-defective modifications were noted. The classification of chlorophyll mutations by Gustafsson and Khan [35] was used for characterization of foliar mutants. Plants with morphological modifications were labelled and harvested separately. The selected plants were grouped according to the changed traits modifications, and the frequency of modifications was determined. The frequency of putative foliar mutants was calculated as the ratio of the number of mutant families to their total number, according to the formula [36]:
2.5. Molecular analysis
Leaf samples of 10 randomly selected plants from each treatment (concentrations of 0.0, 0.06, 0.08, 1.0% and soaking durations of 6, 12 and 24 h) were collected for molecular analysis. DNA extraction was carried out using the modified CTAB method [37]. Concentration was calculated by measuring the absorbance of 1 µL of the sample at 260/280 nm using the NanoDrop 2000 spectrophotometer. The ISSR-PCR were performed according to the protocol described by Dvořákováa et al. [38]. PCR amplifications were performed in a total volume of 15 μL containing 8 μL 2 × Master Mix for PCR (BioRad, USA), 5.2 μL ddH2O, 10 μM 1 μL primer (Lumiprobe Corporation (Americas)) and 100-150 ng DNA template. PCR amplification was run using a VeritiPro™ Thermal Cycler (Applied Biosystems, Singapore) with the following program: denaturation at 94°C for 5 min, then 40 cycles of 30 seconds at 94°C, 30 seconds at the annealing temperature, 30 seconds at 72°C, followed by extension at 72°C for 10 min. The PCR products were loaded to a 16-capillary system of the Fragment Analyzer™ Automated CE System (Advanced Analytical Techologies, Ankeny, IA, USA), and the results were converted into digital format with PROSize 3.0 software (Advanced Analytical Technologies, Ankeny, IA, USA). The fragment analysis was laid out for allele sizes in the range from 35 bp to 5000 bp. Sixteen ISSR markers were used to estimate genetic diversity among the tested proso millet genotypes. The list of ISSR markers are presented in Table 1.
2.6. Statistical analysis
The results were analyzed using Microsoft Excel with the Student's T-Test for windows software package. All the data was denoted as Mean Standard Deviation. Statistically significant differences of agronomic traits between the various colchicine concentrations and exposures were analyzed using a one-way analysis of variance (ANOVA), with the separation of means by the least significant difference test (P< 0.05). To compute the number of different alleles (Na), the number of effective alleles (Ne), Shannon’s information index (I), the expected heterozygosity (He), the unbiased expected heterozygosity (uHe) and percentage of polymorphic loci (P), GenAlEx 6.503 package was used [39,40].
3. Results
3.1. Colchicine effect on field germination
The effects of colchicine on field germination were assessed at the early stage. The germination percent of seeds in M1 generation decreased with increasing colchicine concentration and treatment period. However, non-significant effect of treatments concentration and duration in second generation were observed. Mean performance germination (%) of M1- and M2-generations (2021-2022) of proso millet genotypes affected by different concentrations and treatment time of colchicine are given in Table 2.
Our results indicated that the germination decreased under colchicine effect. The lowest germination percentages were detected at 0.1% with 12 and 24 h exposure duration in M1- and M2 generations. The highest germination percentages were recorded at 0.04% with four h exposure duration for M1- and M2-generations. The mean germination in M2 generations was higher than in M1 under colchicine effect. In M1 generations the mean germination was 69.6% at control sample, at 0.04% of colchicine - 53.4%, at 0.06 of colchicine - 49.7%, at 0.08% of colchicine -44.4% and at 0.1% of colchicine was 29.8%, while in M2 it was 75.3, 63.5, 55.2, 49.1 and 32.7%, respectively. It was found that long-term colchicine treatment of seeds leads to a decrease in germination compared to a short-term treatment.
3.2. Identification and characterization of chlorophyll-deficient foliar mutants
The morphological analysis was conducted in 2021 for M1 plants, in 2022 for M2 plants. Seven different types of chlorophyll mutants (albina, сhlorina, viridis, lutescent, corroded, maculata and striata) were found in M1 and M2 generations when field seedlings were 10-20 days old.
Chlorophyll-deficient foliars were determined according to the main clearly expressed mutant trait in comparison with the control sample (original genotype without treatment). The results showed that the high concentration (0.08-0.1%) of colchicine induced the following types of mutations in M1 plants at germination-tillering stage: albina (white seedlings), weaker and relatively smaller seedlings compared to normal ones. With sufficient humidity and low temperature, 1-2 pairs of true white leaves managed to form. The plants wilted at the early stages of development (within two weeks) (Figure 1b); chlorina plants had yellow seedlings, the true leaves were also yellow or yellow-green, and the plant did not change color as it grew. The plants lagged far behind both in growth and development, and often wilted (Figure 1c); viridis (viridis) - light green shoots. True leaves and the whole plant were pale green and thin. There was a lag in growth (Figure 1d); (lutescent) - the first leaves were green. As they grew, the upper part of the plant was clearly distinguished by a light green with a yellow tint, while the rest of the plant remained green. The “golden tip” type was the most suitable description for the change (Figure 1e); corroded - the primary leaves were green. The real leaves were yellow-green in color and deformed, the edge of the leaf dried up and curled up, and there were necrotic spots on the leaves (Figure 1e); maculate seedlings showed whitish dots on the leaves or necrotic spots. The plants were vigorous, matured with a delay, and produced few seeds (Figure 1g); striata - the first leaves were green. The plant was green, the leaves had a longitudinal stripe: white or yellow (Figure 1h).
In M1 generations, a total of 2214 families were studied. At all the concentrations of the mutagen, except for 0.04%, chlorophyll mutations were detected. A total of 248 families with modifications were selected in M1, while in M2 generation 500 plants from each family were analyzed (Table 3).
Chlorophyll-deficient foliar were detected in M1-M2 seedlings and adult plants mostly at high concentrations of colchicine (0.08 and 0.1%). These chlorophyll-deficient foliar were found with a fairly high frequency, especially within the PI289324 genotype. In M1 plants, at colchicine concentrations of 0.06-0.1% the overall frequency of chlorophyll changes was 17.4% generally for the viridis type. There were no changes at 0.04% colchicine concentration in M1 and M2 generations. Chlorophyll mutations with a lethal outcome were revealed: white seedlings of the albina type and yellow seedlings of the chlorina type. The death of these mutants occurred at the stage of the first leaves. Some mutants survived, but they severely weakened and lagged behind in growth and development comparing to the control plants. Albina type was observed with the frequency of 8.6% at 0.08% and 0.1% colchicine concentrations in M1 plants, 0.4% at 0.1% colchicine concentration in M2. In M1 plants the lutescent "golden top" type was observed with a sufficiently high frequency only at 0.06-0.1% colchicine concentrations with a frequency of 1.4, 3.4 and 6.8, respectively. Corroded type was observed in all genotypes with a relatively high frequency, and the maximum appearance was achieved at 0.08% colchicine concentration, while in M2 this type of mutation was not detected. In maculata mutation type seedlings showed whitish dots on leaves and necrotic spots, M1-M2 plants were vigorous, matured with a delay and produced few seeds; this mutation type was attained only at higher 0.1% concentration of colchicine. Striata mutation was presented by white or yellow stripes on the leaves and observed at higher colchicine concentrations (0.08 and 0.1%) with the frequency of 3.7 and 5.9% in M1, 0.4 and 0.6% in M2 respectively.
3.3. Agronomic trait components
In total, seven agronomic traits associated with the vegetative period and yield elements were evaluated: plants survival (PS), growing season (GS), productive branches (PB), seed weight per panicle (SWP), 1000 seeds weight (TSW) and grain yield (GY). The data analysis indicated that there was a wide range of variation responses of genotypes to various colchicine treatments (Table 4).
Colchicine treatments resulted in a lower PS rate than control. The lowest PS rate was observed in case of 24 hours’ treatment at 0.08-0.1% colchicine concentration for M1- and M2 plants. Longer soaking times at the highest colchicine concentration (0.08-0.1%) had negative effects on this trait for both the M1- and M2- generations. For example, the PS rate in Quartet variety was 61 and 66% in M1-and M2 control plants, while at 0.1% with 24 h treatment time it was 24 and 16%, respectively. The greatest colchicine concentration (0.1%), combined with the longest soaking time (24 h), generated the smallest PS rate for M1 and M2 plants.
The GS in both generations varied with different mutagenic concentrations. The results obtained from the M1 and M2 generations demonstrated significant mutagen effects on GS for all genotypes. With increasing mutagen concentration, the GS decreased for 4-5 days (Figure 2a). In both the M1 and M2 generations, the GS was the lowest at 0.08-0.1% with 12 and 24 h soaking time (Figure 2b). Average mean of the GS of PI289324 genotype was lower than the ones of Pavlodarskoe 4 and Quartet cultivars. The trait values ranged from 78 to 92 days in the M1 and M2 generations.
The figure 2 indicates that the growing season of proso millet for the control plants was delayed comparing with the colchicine-treated plants. In the M1 and M2 generations, variation was observed in some agronomics traits, such as 1000 seeds weight, seed weight per panicle and productive branches. The increase in colchicine concentration led to rise in number of the PB per plant in M1 and M2 generations. The 0.08-0.1% colchicine concentration combined with exposure durations of 6, 12 and 24 h significantly increased the observed number of PB per plant, approximately by 25% to compare with the control. The highest concentration of colchicine combined at 6, 12, and 24 h exposures durations resulted in the highest number of PB.
Significant differences were detected in SWP for both the M1 and M2 generations. The maximum values of SWP were 3.3 g for M2 Quartet plants at 0.1% colchicine concentration treatment, 3.2 g for Pavlodarskoe 4 cultivar at 0.1% colchicine and 24 h exposure, 2.5 g for PI289324 variety at 0.04% colchicine, 12 h exposure. The least values of SWP were at 0.06% concentration for Quartet genotype (1.3 g) and at 0.1% concentration, 24 h exposure for PI289324 variety, and at 0.08% concentration, 6 h exposure for Pavlodarskoe 4 cultivar (1.1 g). In general, the treated M2 plants prevailed over the control for M2 Pavlodarskoye 4 genotype after 24-hour treatment and for Quartet variety at all concentrations and exposure durations, except for the 0.06% concentration, 24 h treatment. Concerning M2 PI289324, the SWP for the control variant was higher than for the treated sample.
We have evaluated the GY performance of M1 and M2 plants under various colchicine concentrations combined with soaking time. The data presented in Table 4 suggests that the GY in the M1 generations reduced with increasing colchicine dose (0.08-0.1%), whereas the opposite was observed at concentration 0.04-0.06% combined with 12 h soaking time. As for GY, the highest value was obtained in M2 of Quartet (67.6) at 0.04% concentration, in Pavlodarskoe 4 (65.8) on 0.06% concentration and in PI289324 (62.0) on 0.04% concentration at 12 h treatment time. The lowest GY value was in M2 of Quartet (15.6) on 0.1% and in Pavlodarskoe 4 (17.6) at 0.04%, 24 h treatment time, while in PI289324 (3.2) at 0.1% concentration, 12 h exposure.
There were significant differences in the TSW of M1 and M2 generations. The TSW was higher in M2 generations than M1, regardless of colchicine concentrations and exposure duration. Mean performance for the TSW (5.1-5.8 g) was slightly lower in M1 plants of PI289324 genotype than in control plants (6.0-6.7 g). The highest 1000 grain weight was observed in M1 plants of Quartet variety (7.2 g) at 0.06% colchicine treatment, 24 h exposure.
Factorial analysis of variance was performed to confirm the effect of the treatment durations and mutagen concentration for the studied agronomic traits of M1 and M2 plants. The results of ANOVA for FG, PS, GS, PB, SWP, TSW and GY traits are depicted in Table 5 and Table 6 for M1 and M2 generation respectively.
The results for FG and PS at 12 h and 24 h treatment duration in M1 plants were observed statistically significant (p<0.05). FG and PS also have significantly affected (p<0.001) by the all colchicine concentrations (0.04, 0.06, 0.08 and 0.1%) in M1 generation (Table 5). There were no significant correlations for GS and TSW and colchicine concentration and treatment duration in M1 plants. The SWP was also related to 12 and 24 h treatment time with 0.031 and 0.004, respectively (P< 0.05 and P < 0.001). There was a relationship between FG and PS and treatment durations of 12 and 24 h in M2 plants, P-value was <0.05 and <0.01-0.001, respectively. In addition, it was found that GY was also influenced by 12 and 24 h treatment duration, with P-value<0.001 and <0.01, respectively. The analysis of variance suggested that FG and PS were highly related with colchicine concentrations 0.06 (P< 0.01), 0.08 and 0.1% (P< 0.001). Concentrations 0.08 and 0.1% showed a significant relationship to GS (P< 0.05). The concentrations of 0.06, 0.08 and 0.1% were related to PB, P<0.05, P<0.001 and <0.01, respectively.
3.4. Molecular analysis
In the present study, 16 ISSR markers were tested. The total number of bands produced by ISSR markers varied from 4 to 53 with an average of 20.82 amplicons per primer. The size of the amplified fragments ranged from 39 bp and 4827 bp, as shown in Table 7.
16 ISSR primers produced in total 1333 fragments, among them 1281 were polymorphic, with a mean polymorphic percentage of 96.11%. The maximum level of polymorphism was produced by markers ISSR 811, ISSR 820 and ISSR 826 (100%); followed by ISSR 840, ISSR 816 and ISSR 807 98 (98%); the markers ISSR 808, ISSR 817, ISSR 841 and ISSR 823 (97%); the markers ISSR 809, ISSR 822 and ISSR 835 (95). The markers ISSR 810, ISSR 834 and ISSR 819 showed a lower level of polymorphism of 91, 90 and 85%, respectively. The primers ISSR 807, ISSR 810, ISSR 811, ISSR 816, ISSR 835 and ISSR 840 amplified more bands at 0.08% colchicine treatment. The polymorphism information content (PIC) of markers varied from 0.202 to 0.322 with an average of 0.241. The maximum PIC was recorded for ISSR 840 (0.322) followed by ISSR 835 (0.311), while the lowest (0.202) was for ISSR 819. The ISSR 840 marker amplification profile of capillary system is illustrated in Figure 3, as an example.
Different genetic diversity estimated for three concentrations of colchicine was calculated where the maximum Na was recorded for control (0.913±0.023), followed by 0.08% colchicine concentration (0.801±0.023), 0.04% (0.676±0.022) and 0.06% (0.499±0.020) with an average of 0.722±0.022 (Table 8).
The Ne was higher at 0.04% (1.232) and lower at 0.06% (1.169), with an average of 1.205. The I ranged from 0.145 to 0.228, with an average of 0.192. The He ranged from 0.099 to 0.147, with a mean value of 0.127. The average value of the uHe was 0.380, with values of 0.181 at 0.04%, 0.176 in control, 0.153 at 0.08% and 0.132 at 0.06%. The average percentage of polymorphic loci was lower at 0.06% concentration (23.92%) and higher at control (45.34%), with the mean 35.49%.
4. Discussion
Chemical mutagenesis plays an important role in the breeding improvement of crops. Application of chemical mutagens in plant improvement has been developed for many crops. Colchicine is highly toxic to plants, therefore, low concentrations with prolonged exposure duration are considered reliable to reduce its toxic effect and increase the polyploid production rate [41]. In our study the seed soaking in colchicine solution with various concentrations (0.04% to 0.1%) for 6, 12 and 24 hours affected the percentage of seed germination in the field conditions. All colchicine treated plants were significantly different from the control plants in terms of germination. The colchicine treatment duration positively correlated with seedling mortality in many plant species [41,42]. Our results showed that the increasing concentration of colchicine and its treatment duration significantly decreased field germination of proso millet genotypes in M1-M2 generations. Especially, the germination was reduced by more than 50% at 0.08-0.1% colchicine treatment, 12-24 hours exposures. It seems that soaking seeds in colchicine solution for 12-24 hours has inhibited the field germination. There was a decrease in percentage of seed germination with the enhance in colchicine concentration and exposure duration. Sasiree et al. [43] suggested that the reduction in germination rate with the increase in concentration of colchicine may be due to the cause of tissue necrosis when the seeds are exposed to different concentrations of colchicine. Reduced plant growth at higher colchicine concentrations might be due to sudden changes in the metabolic status of the seeds at certain levels of the mutagen, the growth inhibitor destruction, an increase in growth promoters, and the decline in the assimilation mechanism [44]. Also, some studies demonstrated the enhanced lethality of the obtained plants after treatment with high concentrations of colchicine, it was explained by the highly toxic effect of colchicine on the mitotic spindle (blocking spindle microtubules production) [45].
Chlorophyll mutations are a common test in experimental plant mutagenesis studies, mainly because they are relatively easy to observe for a large number of studied plants. The chlorophyll mutation frequency is useful for the evaluation of the potency of a mutagen, its genetic effects and for the estimation of mutational events due to simplicity of identification. However, to achieve a full characterization of the action of a mutagen, a complete analysis of all emerging mutations is required. Accounting for chlorophyll mutations is only a preliminary estimate of the intensity of the mutation process. In the case of our studies on experimental mutagenesis of proso, we have isolated some types of chlorophyll mutations. The frequency of chlorophyll mutations and their spectrum is used to assess the effectiveness and specificity of the mutagens action and the mutability of varieties [46]. Death and reduced viability might be the reasons for the poor genetic knowledge of most chlorophyll mutants [47]. Chlorophyll mutations, despite the complexity of the mechanism of manifestation, serve as an important element for assessing the activity of the mutagen and the resistance of the plant genotype to mutagenic factors. Mutants with complete or partial chlorophyll deficiency are usually determined by recessive genes: al (albina), y (yellow seedling), lu (lutescent), v (virescent), fs and z (leaf striping (zebra) or variegation).
According to the literatures, it is known that the chlorophyll mutation of the albina type is the result of point recessive mutations and is inherited monogenous [48]. Different types of chlorophyll mutations, such as albina, xantha, albo-xantha, xanthalba, alboviridis, virescence, chlorina, albescence, tigrina and maculata were identified in six varieties of Lathyrus sativus L. by Prasad and Das [49]. Moreover, the chlorophyll mutations in flax reported by researchers can be interesting from the point of view of the intensity of the mutation process, and also as a source of new marker traits. For example, the yellow seedlings of the chlorina type mutation are easily identified from the seedling stage to the plant maturation and can be of significant importance for genetic and cytogenetic studies as marker of individual chromosomes and their regions [13,50].
The results of our study showed that the maximum frequency of putative viridis mutations was attained at the mutagen concentration of 0.1%, and the minimum at 0.06%. The viridis type includes light green mutants. Chlorophyll-deficient mutants of this type had reduced viability and were slightly lacking in growth and development. Plants with this type of chlorophyll modifications were weak and low productive. In the variant with seeds soaked in 0.08 and 0.1% colchicine solution in M1 31 plant families with albina type mutation were found in total. Among all the treatments, the highest mutation frequency was found at the 0.1% colchicine concentration in M1 and M2 proso millet plants. For the M1 and M2 plants the frequency of chlorophyll-deficient foliar averaged 11.2 and 2.5%, respectively. The comparison of the chlorophyll mutations by types generally indicated that the mutation rate enhanced with an increase in concentration and exposure duration, however the frequency of chlorophyll-deficient foliar were expressed higher in the M1 population than in theM2. All identified types of chlorophyll mutants among the crops are directly related to mutations in chloroplast biosynthesis, further degradation of chlorophyll and bleaching due to deficiency of carotenoids and may be associated with their preferential action on chlorophyll development genes [51,52,53].
We observed that the number of PB rose with increasing colchicine concentration and treatment duration. Enhanced PB also has been reported with colchicine treatment by Hewawasam et al. [54]. An enhancement in productive branches provides an increase in the number of panicle and seed weight per panicle. Among treatments, the most positive results in terms of plant productive branches and early ripening were obtained at 0.08-0.1% colchicine concentrations combined with 12 and 24 h soaking duration. This study highlights a significant improvement of yield grain and obtaining early-ripening varieties as affected by colchicine treatments for future proso millet breeding process. At all colchicine concentrations and exposure periods the agronomic traits such as SWP and TSW barely differed from the control ones in M1 and M2 plants. At the higher colchicine concentrations 0.08-0.1% combined with soaking period, the GS of M1 and M2 plants were decreased. Particularly, it was shown that M1-M2 generations ripened nearly 4-7 days earlier than the control plants.
In this study we used the ISSR markers method to evaluate the genetic changes at the molecular level under colchicine treatment. The ISSR markers have proven to be suitable markers for genetic diversity analyze due to their high polymorphism and repeatability across the entire genome. For their use, no previous genomic information is required, and small amounts of DNA are needed [55,56]. The molecular data analysis, using ISSR markers, showed the existence of significant genetic diversity across proso millet exposed to various concentrations of colchicine. The number of genetic loci detected by the ISSR markers ranged from 4 to 53, with a total of 1333 loci across primers. The PIC was higher for the primer ISSR 840 (0.322) and lower for the ISSR 819 (0.202). From these 1333, 1281 loci were polymorphic with the polymorphism percentage that ranged from 80 to 100%. Our results highlight that more bands were amplified at 0.08% colchicine treatment, which means the usefulness of ISSR markers in detecting the mutagenic effects of colchicine.
Conclusion
Such agronomic characteristics as PS, GS, PB, SWP, TSW and GY were assessed for the M1-M2 generations. The effect of colchicine on the plant agronomic traits was statistically significant. At 0.06-0.08% colchicine concentration with 12and 24 h soaking duration, enhanced productive branches was observed in both studied generations. In contrast, these 0.06-0.08% colchicine concentrations and 12 and 24 h treatment durations have adverse effects on FG and PS parameters of M1 and M2 plants. The concentrations of 0.08 - 0.1% with soaking duration of 24 hours were found to be excessive, because they had a negative impact on the plants presented by inhibition of the PG and PS. The ANOVA showed that the treatment duration and the concentration of mutagen significantly affected the variation in FG, PS, GS, PB and GY traits, wherein P-value ranged <0.001- <0.05. The ISSR markers were used to confirm the existence of genetic diversity at the molecular level at the different mutagen concentrations (0.04, 0.06 and 0.08%). The effectiveness of colchicine as a mutagenic factor in the creation of new source material for proso millet breeding has been established. We identified the optimal colchicine concentration and treatment duration that positively affects the growing season longevity, the productive branches and grain yield. Obtained data revealed that the growing season length was reduced under colchicine effect. Our studies will aid to create varieties with such features as early ripening and higher yield in the proso millet breeding process.
Author Contributions
Conceptualization, A.O. and A.Z.; methodology, E.D., I.Z., L.Z, Y.H. and G.Y.; investigation, A.Z. and A.R.; formal analysis, A.Z., I.Z., L.Z and A.R.; resources, E.D., A.O. and A.R.; writing-original draft preparation, E.D., M.Z. and A.Z.; writing-review and editing, A.R., Y.H. and E.D.; supervision, A.R. and M.Z.; funding acquisition, A.R. All authors have read and agreed to the published version of the manuscript.
Funding
The work was carried out within the framework of the scientific project AP14870014 "Application of DNA technologies in breeding and genetic studies of millet culture when creating new domestic drought-resistant varieties" (2022-2024), grant funding for research work was pro-vided by the "Science Committee of the Ministry of Science and Higher Education of the Republic of Kazakhstan" State Institution.
Conflict of Interest
The authors declare that they have no competing interests.
References
- Singh, M.; Sood, S. Millets and Pseudo Cereals Genetic Resources and Breeding Advancements. A volume in Woodhead Publishing Series in Food Science, Technology and Nutrition. 2020, Book.
- Wen, Y.; Liu, J.; Meng, X.; Zhang, D.; Zhao, G. Characterization of proso millet starches from different geographical origins of China. Food Science and Biotechnology, 2014, 23, 1371-1377. [CrossRef]
- Zohary, D.; Hopf, M.; Weiss, E. Domestication of Plants in the Old World. 4th edition. Oxford: Oxford University Press, 2012, USA.
- Wang, R., H. V. Hunt, Z. Qiao, L. Wang, and Y. Han, 2016. Diversity and cultivation of broomcorn millet (Panicum miliaceum L.) in China: a review. Economic Botany, Т. 70, P. 332-342. [CrossRef]
- Jones, M.,2004. Between fertile crescents: minor grain crops and agricultural origins. na, С. 127.
- Hunt, H.V., M.G.Campana, M.C.LawesY-J, Park, M.A. Bower, C.J. Howe and M.K. Jones, 2011. Genetic diversity and phylogeography of broomcorn millet (Panicum miliaceum L.) across Eurasia. Molecular Ecology. 20:4756. [CrossRef]
- Graybosch, R. A. and D. D. Baltensperger, 2009. Evaluation of the waxy endosperm trait in proso millet (Panicum miliaceum L.). Plant breeding., Т.128, N.1, P. 70-73. [CrossRef]
- Habiyaremye, C., J.B. Matanguihan, J. D'AlpoimGuedes,J., Ganjyal, G. M., Whiteman, M. R., Kidwell, K. K., and K. M. Murphy, 2017. Proso Millet (Panicum miliaceumL.) and Its Potential for Cultivation in the Pacific Northwest. Frontiers in Plant Science. 7:1961. [CrossRef]
- Lyon, D. J., P. A.Burgener, K. L.DeBoer, R. M.Harveson, G. L. Hein, G. W. Hergert, J.M. Krall, D.C. Nielsen and M.F. Vigil, 2008. Producing and marketing proso millet in the Great Plains. University of Nebraska, Lincoln, Extension (EC137).
- Goron, T.L. and M.N. Raizada, 2015. Genetic diversity and genomic resources available for the small millet crops to accelerate a new green revolution. Front. Plant Sci.6, 157. [CrossRef]
- Dhulgande, G.S., D.S. Ghogare, D.A.Dhale, andR.A. Satpute, 2010. Mutagenic effects of gamma rays and EMS on frequency and spectrum of chlorophyll mutations in pea (Pisum sativum L.). Journal Ecobiotechnol. 2:04-7. [CrossRef]
- Kharkwal M.C. and Shu Q.Y. (2009). The role of induced mutations in world food security. In: Induced plant mutations inthe genomics era (Shu QY, ed.). Food and Agriculture Organization of the United Nations, Rome, 33-38.
- Wani, M.R., 2017. Induced chlorophyll mutations, comparative mutagenic effectiveness and efficiency of chemical mutagens in lentils (Lens culinaris Medik). Asian J. Plant Sci. 16:221-22.
- Castro CM, Oliveira A.C. and Calvaho FIF (2003). Changes in allele frequencies in colchicine treated ryegrass population assessed with APD marker. Agrociencia 9: 107-112.
- Castro, M.; Castro, S.; Loureiro, J. Production of synthetic tetraploids as a tool for polyploid research. Web Ecol. 2018, 18, 129-141. [CrossRef]
- Ari, E.; Djapo, H.; Mutlu, N.; Gurbuz, E.; Karaguzel, O. Creation of variation through gamma irradiation and polyploidization in Vitexagnus-castus L. Sci. Hortic. 2015, 195, 74–81. [CrossRef]
- Vichiato, M.R.D.M.; Vichiato, M.; Pasqual, M.; Rodrigues, F.A.; Castro, D.M.D. Morphological effects of induced polyploidy in Dendrobium nobileLindl. (Orchidaceae). Crop Breed. Appl. Biot. 2014, 14, 154–159. [CrossRef]
- Ari, E.; Djapo, H.; Mutlu, N.; Gurbuz, E.; Karaguzel, O. Creation of variation through gamma irradiation and polyploidization in Vitexagnus-castus L. Sci. Hortic. 2015, 195, 74–81. [CrossRef]
- El-Nashar, Y.I.; Ammar, M.H. Mutagenic influences of colchicine on phenological and molecular diversity of Calendula officinalis L. Genet. Mol. Biol. 2015, 15, 1–15.
- Wang, W.; He, Y.; Cao, Z.; Deng, Z. Induction of tetraploids in impatiens (Impatiens walleriana) and characterization of their changes in morphology and resistance to downy mildew. HortScience 2018, 53, 925–931. [CrossRef]
- Manzoor, A.; Ahmad, T.; Bashir, M.A.; Baig, M.M.Q.; Quresh, A.A.; Shah, M.K.N.; Hafiz, I.A. Induction and identification of colchicine induced polyploidy in Gladiolus grandiflorus ‘White Prosperity’. Folia Hortic. 2018, 30, 307–319.
- Ayesha Manzoor, Touqeer Ahmad, Muhammad Ajmal Bashir, Ishfaq Ahmad Hafiz and Cristian Silvestri Studies on Colchicine Induced Chromosome Doubling for Enhancement of Quality Traits in Ornamental Plants / Plants 2019, 8, 194. [CrossRef]
- Ahanchede A., Hamon S. P. and Darmency H. Why no tetraploid cultivar of foxtail millet? Genetic Resources and Crop Evolution, 2004, 51 227–230. [CrossRef]
- Ibrahim A. Arif, Mohammad A. Bakir, Haseeb A. Khan, Ahmad H. Al Farhan, Ali A. Al Homaidan, Ali H. Bahkali, Mohammad A. Sadoon, and Mohammad Shobrak A. Brief Review of Molecular Techniques to Assess Plant Diversity / Int J Mol Sci. 2010; 11(5): 2079–2096. [CrossRef]
- Smita Shingane, J. V. Patil, Sunil Gomasheand Dinesh Chand Assessing Genetic Diversity among Foxtail millet (Setaria italica (L.) P. Beauv.) Accessions Using RAPD and ISSR Markers // International Journal of Bio-resource and Stress Management 2018, 9(1):001-006. [CrossRef]
- Karam D, Westra P, Niessen SJ, Ward SM, Figueiredo JEF. Assessment of silver-stained AFLP markers for studying DNA polymorphism in proso millet (Panicum miliaceum L.). Rev Bras Bot. 2006; 29:609-15. [CrossRef]
- Rajput S, Plyler-Harveson T, Santra D. Development and characterization of SSR markers in proso millet based on switchgrass genomics. Am J. Plant Sci. 2014; 05:175–86.
- Jayalakshmi Venkatesan1, Vasuki Ramu, Thilaga Sethuraman, Chandrasekaran Sivagnanam and Ganesh Doss Molecular marker for characterization of traditional and hybrid derivatives of Eleusine coracana (L.) using ISSR marker / Journal of Genetic Engineering and Biotechnology (2021) 19:178. [CrossRef]
- Fakrudin B., Shashidhar H.E., Kulkarni R.S., Hittalmani S (2004) Genetic diversity assessment of finger millet, Eleusinecoracana (Gaertn.), germplasm through RAPD analysis. PGR Newslett 138:50–54 https://www.Bioversity international.org/fileadmin/PGR/article-issue_138-art_9-lang_en.html.
- Zeinullina, A.; Rysbekova, A.; Dyussibayeva, E.; Zhirnova, I.; Zhanbyrshina, N.; Zhunusbayeva, Z.; Yancheva, S. Application of sodium azide for chemical induced mutagenesis of proso millet culture (Panicum miliaceum L.) / Bulgarian Journal of Agricultural Science, 29 (No 4) 2023, 623–631.
- Zargar, M.; Dyussibayeva, E.; Orazov, A.; Zeinullina, A.; Zhirnova, I.; Yessenbekova, G.; Rysbekova, A. Microsatellite-Based Genetic Diversity Analysis and Population Structure of Proso Millet (Panicum miliaceum L.) in Kazakhstan. Agronomy, 2023, 13, 2514. [CrossRef]
- Swathi L., Babu C., IyanarK. Doubling of chromosomes of pearl millet napier hybrids and preliminary screening based on stomatal characteristics. Electronic Journal of Plant Breeding. – 2019. – Vol. 10. – P. 47-57.
- Agafonov, N.P. and A.F. Kurtseva, 1988. Study of the world collection of millet. Moscow: VIR Publishing House.
- Milivojević, M.; Vujinović, J.; Branković-Radojčić, D.V.; Vukadinović, R.; Petrović, T. Monitoring of Seed Counter in 1000 Seed Weight Testing. J. Process. Energy Agric. 2022, 26, 34–37. [CrossRef]
- Gustafsson, A., 1940. The mutation system of the chlorophyll apparatus. Lund University, Arskr, Sweden. 36:1-40.
- Sidhu G.P.S., H.P. Singh,D.R. Batish and R.K.Kohli, 2017.Alterations in photosynthetic pigments, protein, and carbohydrate metabolism in a wild plant Coronopus didymus L. (Brassicaceae) under lead stress. Acta Physiol. Plant. V. 39 (8). [CrossRef]
- Murray, M.G., and Thompson W.F. Rapid isolation of high molecular weight plant DNA. Nucleic Acids Res. 1980, 8:4321-4325. [CrossRef]
- Zdislava Dvořákováa, Petra Hlásná Čepkováa*, Dagmar Janovskáb, Iva Viehmannováa, Eva Svobodováa,1, Eloy Fernández Cusimamania, Luigi Milella Comparative analysis of genetic diversity of 8 millet genera revealed by ISSR markers /Emirates Journal of Food and Agriculture. 2015. 27(8): 617-628. [CrossRef]
- Peakall, R.; Smouse, P.E. GenAlEx 6.5: Genetic analysis in Excel. Population genetic software for teaching and research-an update. Bioinformatics 2012, 28, 2537–2539. [CrossRef]
- Bayat, M.; Zargar, M.; Chudinova, E.; Astarkhanova, T.; Pakina, E. In Vitro Evaluation of Antibacterial and Antifungal Activity of Biogenic Silver and Copper Nanoparticles: The First Report of Applying Biogenic Nanoparticles against Pilidium concavum and Pestalotia sp. Fungi. Molecules 2021, 26, 5402. [CrossRef]
- Sajjad Y., Jaskani M.J., Mehmood A., Ahmad I., Abbas H. Effect of colchicine on in vitro polyploidy induction in African marigold (Tageteserecta) Pak. J. Bot. 2013;45:1255–1258.
- Wang, L.J.; Sheng, M.Y.; Wen, P.C.; Du, J.Y. Morphological, physiological, cytological and hytochemical studies in diploid and colchicine-induced tetraploid plants of Fagopyrum tataricum (L.) Gaertn. Bot. Stud. 2017, 58, 2. [CrossRef]
- Sasiree B., T. Taychasinpitak, S. Wongchaochant, and S. Kikuchi Effect of colchicines tablets on morphology of Torenia fournieri. Int. Transaction J. of Engg. Management and Applied Sci. & Tech., 2013.4:299- 309.
- Roychowdhury R and Tah J (2011). Chemical mutagenic action on seed germination and related agro-metrical traits in M1 Dianthus generation. Curr. Bot 2: 19-23.
- Pintos, B.; Manzanera, J.A.; Bueno, M.A. antimitotic agents increase the productivity of double-haploid embryos from cork oak anther culture. J. Plant Physiol. 2007, 164, 1595–1604. [CrossRef]
- Arisha, M.H., B.K.Liang, S.M.Shah, Z.H.Gong and D.W.Li, 2014. Kill curve analysis and response of first-generation Capsicum annuum L. B12 cultivar to ethyl methane sulfonate. Genet Mol Res. 13:49-61. http://dx.doi.org/10.4238/2014.November.28.9.
- Viana, V. E., C. Pegoraro, C. Busanello, andA. Costa de Oliveira, 2019. Mutagenesis in rice: the basis for breeding a new super plant. Frontiers in plant science, Т.10, P.1326. [CrossRef]
- Lamprecht H., 1960. Über Blattfarben von Phanerogamen: Klassifikation, Terminologie und Gensymbole von Chlorophyll-und an dere Farbmutanten Weibullsholmsväxt för ädlings institut.
- Prasad, A.B. and Das A.K. (1980c). Studies of induced chlorophyll mutations in Lathyrus sativus L. Cytologia 45: 335-341. [CrossRef]
- Khan, M.H. and S.D. Tyagi, 2009. Studies on induction of chlorophyll mutations in soybean, Glycine max (L.) Merrill. Front. Agric. China, 3:253-258. [CrossRef]
- Singh, G.R, Sareen, P.K. and Sharan, RP. (2000). Induced chlorophyll and morphological mutations in mungbean. Indian J Genet. 60: 391-393.
- Lal M.G., Toms B. and Smith S. (2009). Induced Chlorophyll Mutations in Black Gram.Asian J. Agr. Sci., 1: 1-3.
- Elmenbawy, E.A.; Elateek, S.Y.; Awad, N.A.; Fahmy, E.M. Genetic improvement of Calendula officinalis L. through mutation induction using gamma irradiation and chemical mutagens. Arab. Univ. J. Agric. Sci. 2020, 82, 424–474. [CrossRef]
- Hewawasam W.D., Bandara D.C., Aberathne W.M. (2004). New Phenotypes of Crossandra infundibuliformis Var. Damica through in vitro culture and induced mutations. Trop. Agric. Res. 16: 253-270.
- Adhikari S., Saha S., Biswas A., Rana T.S., Bandyopadhyay T.K., Ghosh P. (2017): Application of molecular markers in plant genome analysis: A review. Nucleus, 60: 283-297. [CrossRef]
- Akhtar, N.; Hafiz, I.A.; Hayat, M.Q.; Potter, D.; Abbasi, N.A.; Habib, U.; Hussain, A.; Hafeez, H.; Bashir, M.A.; Malik, S.I. ISSR-Based Genetic Diversity Assessment of Genus Jasminum L. (Oleaceae) from Pakistan. Plants 2021, 10, 1270. [CrossRef]
Figure 1.
Chlorophyll-deficient foliars at 0.08-0.1% colchicine concentrations in M1 generation. a – control; b – albina; c – сhlorina; d –viridis; e –lutescent; f – corroded; g – maculate; h – striata.
Figure 1.
Chlorophyll-deficient foliars at 0.08-0.1% colchicine concentrations in M1 generation. a – control; b – albina; c – сhlorina; d –viridis; e –lutescent; f – corroded; g – maculate; h – striata.
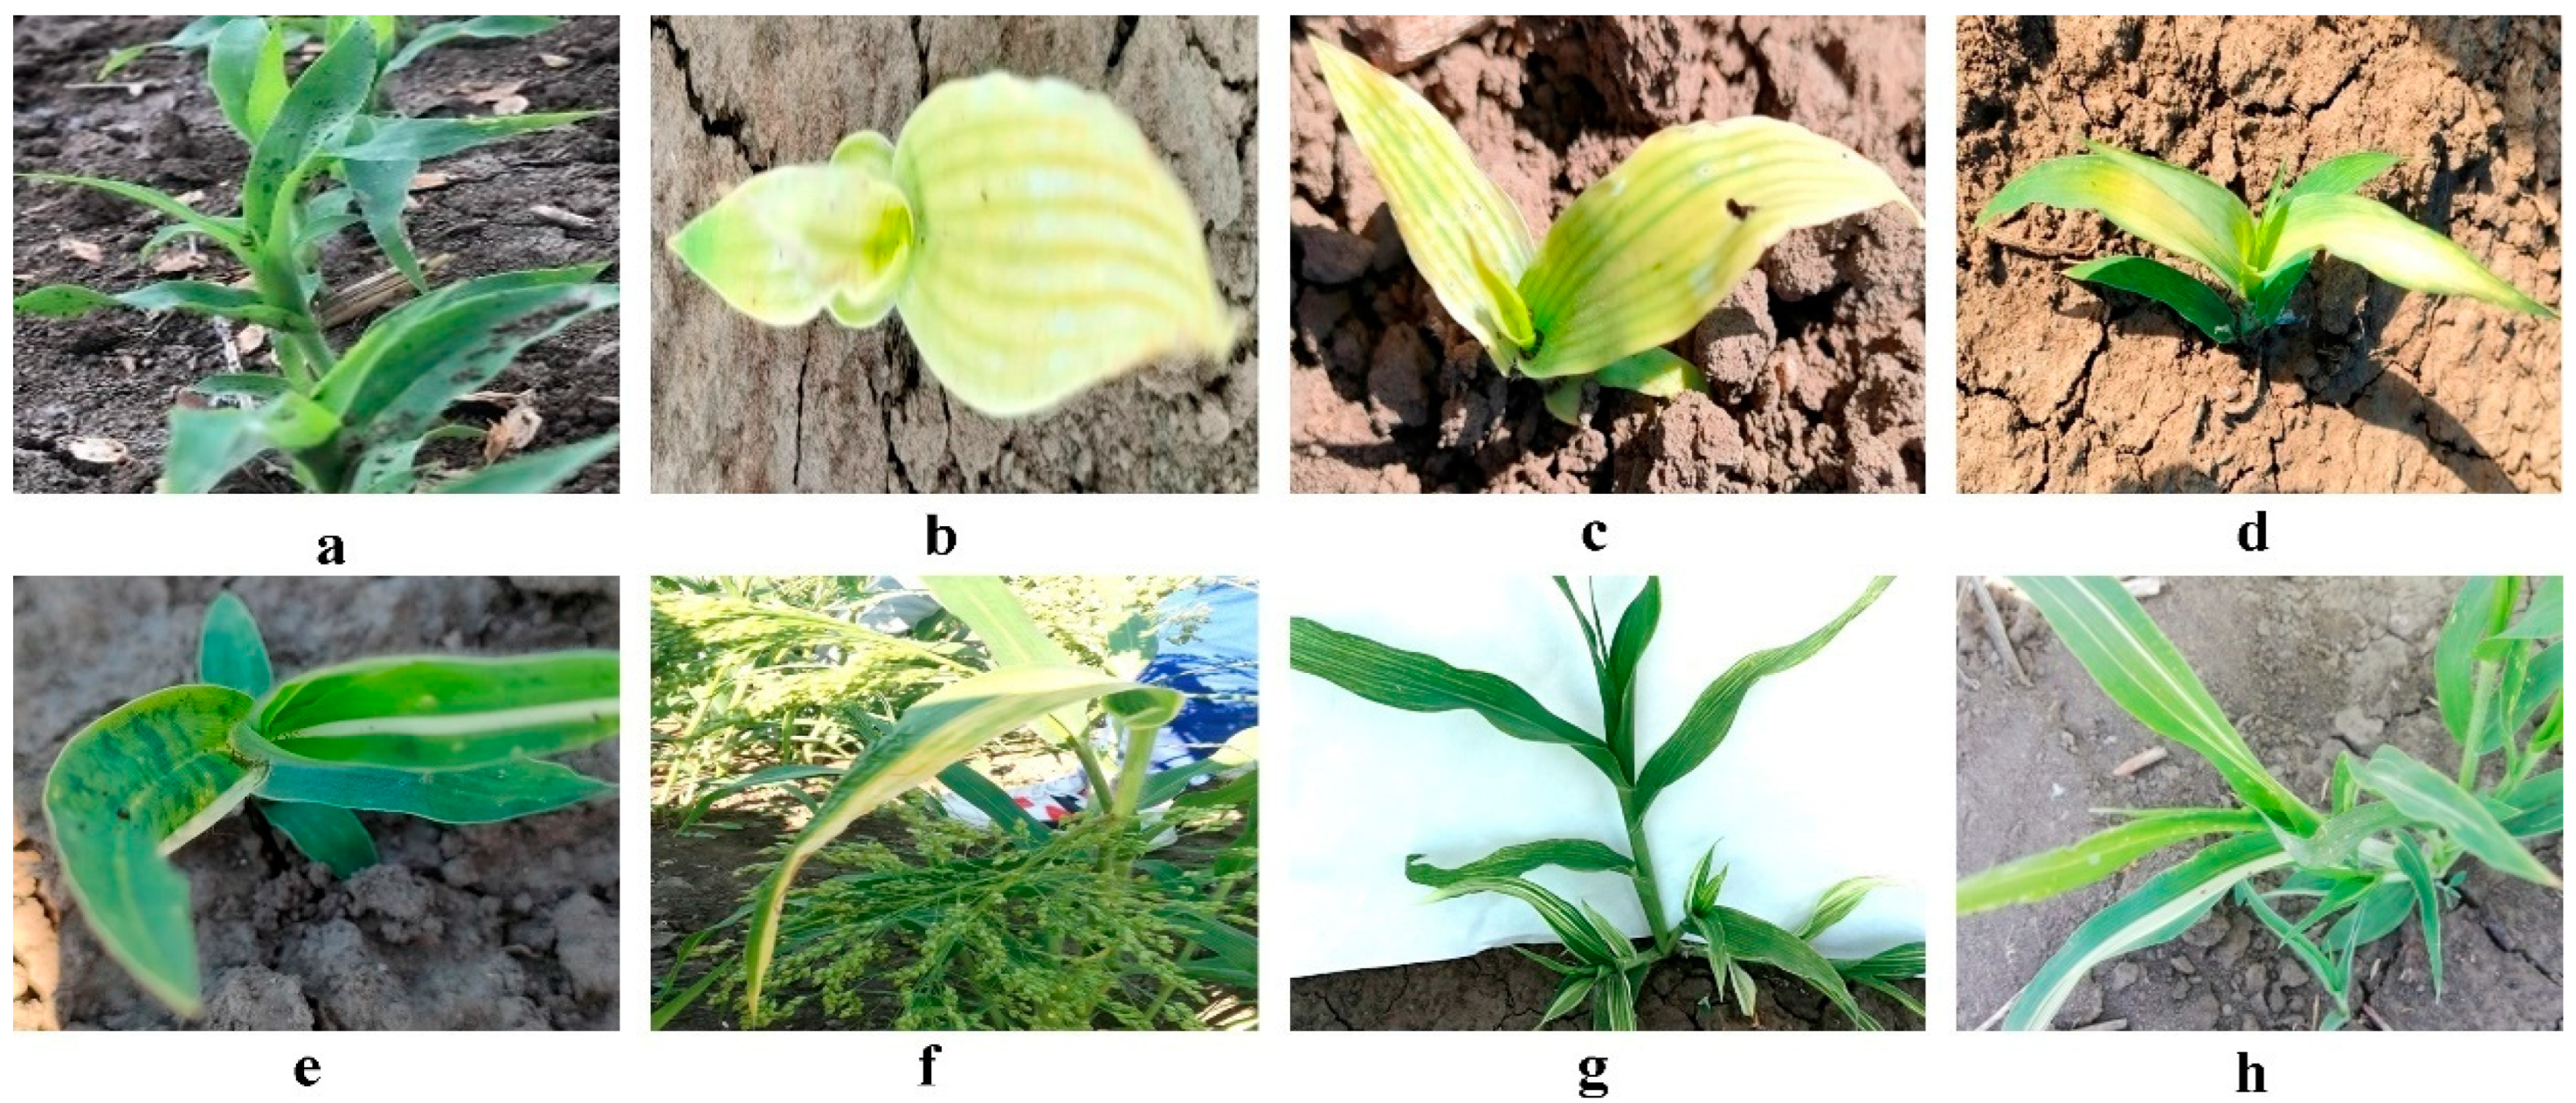
Figure 2.
Effect of colchicine concentration and treatment period on the growing season of M2 generation. a – colchicine concentrations, %; b –treatment period, hours.
Figure 2.
Effect of colchicine concentration and treatment period on the growing season of M2 generation. a – colchicine concentrations, %; b –treatment period, hours.
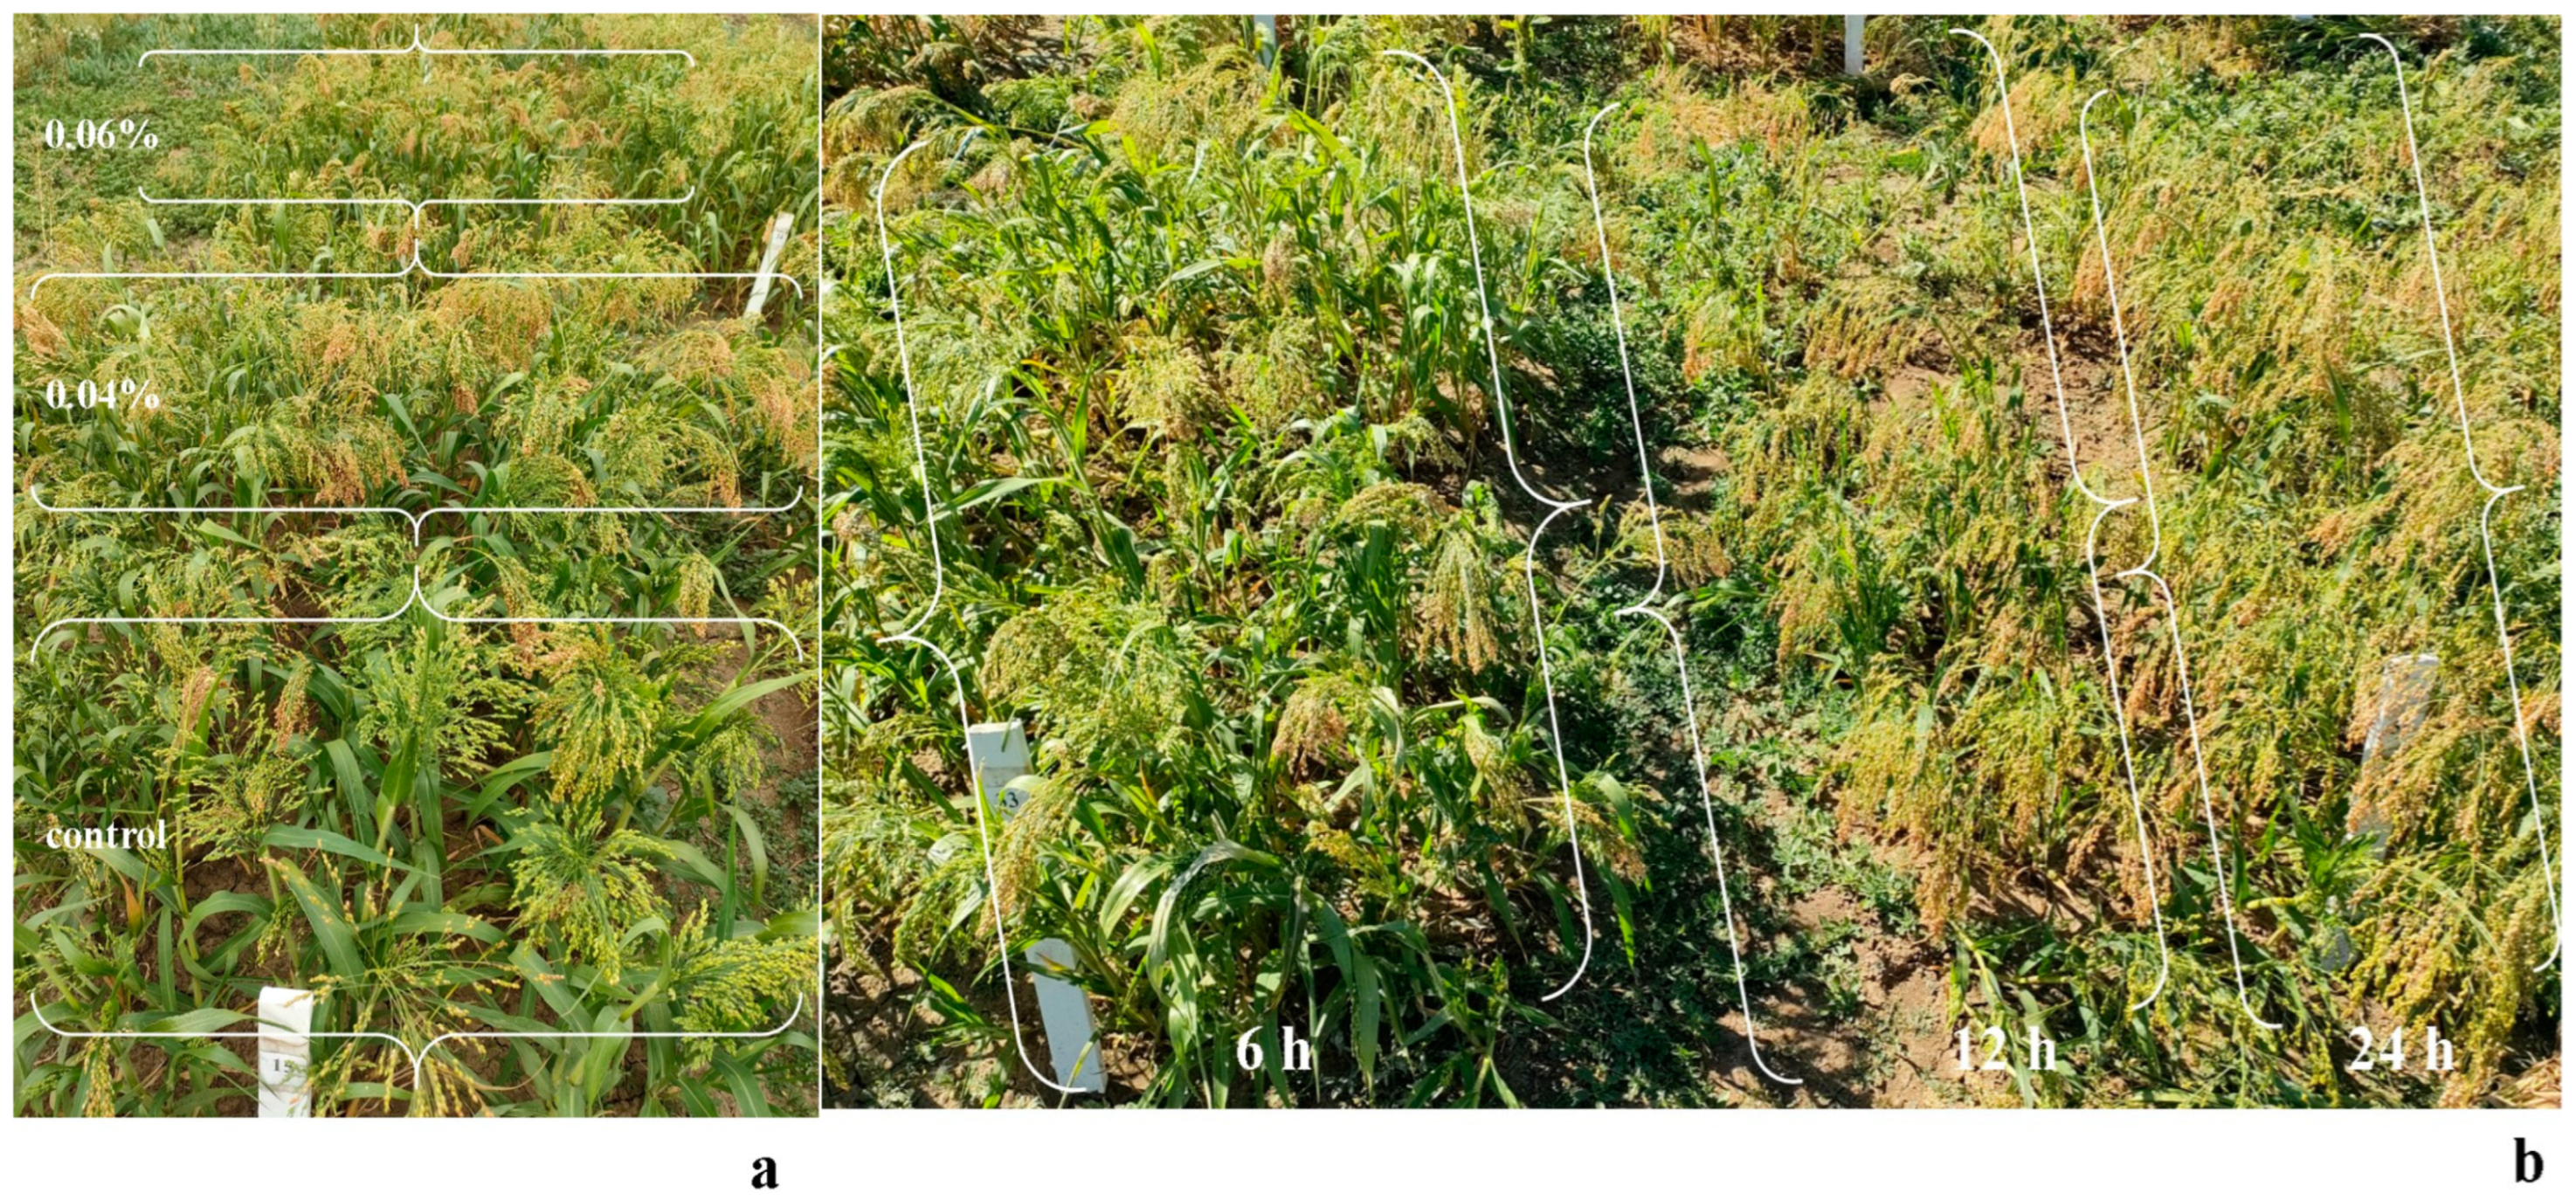
Figure 3.
Amplification profile of ISSR 840 primer.
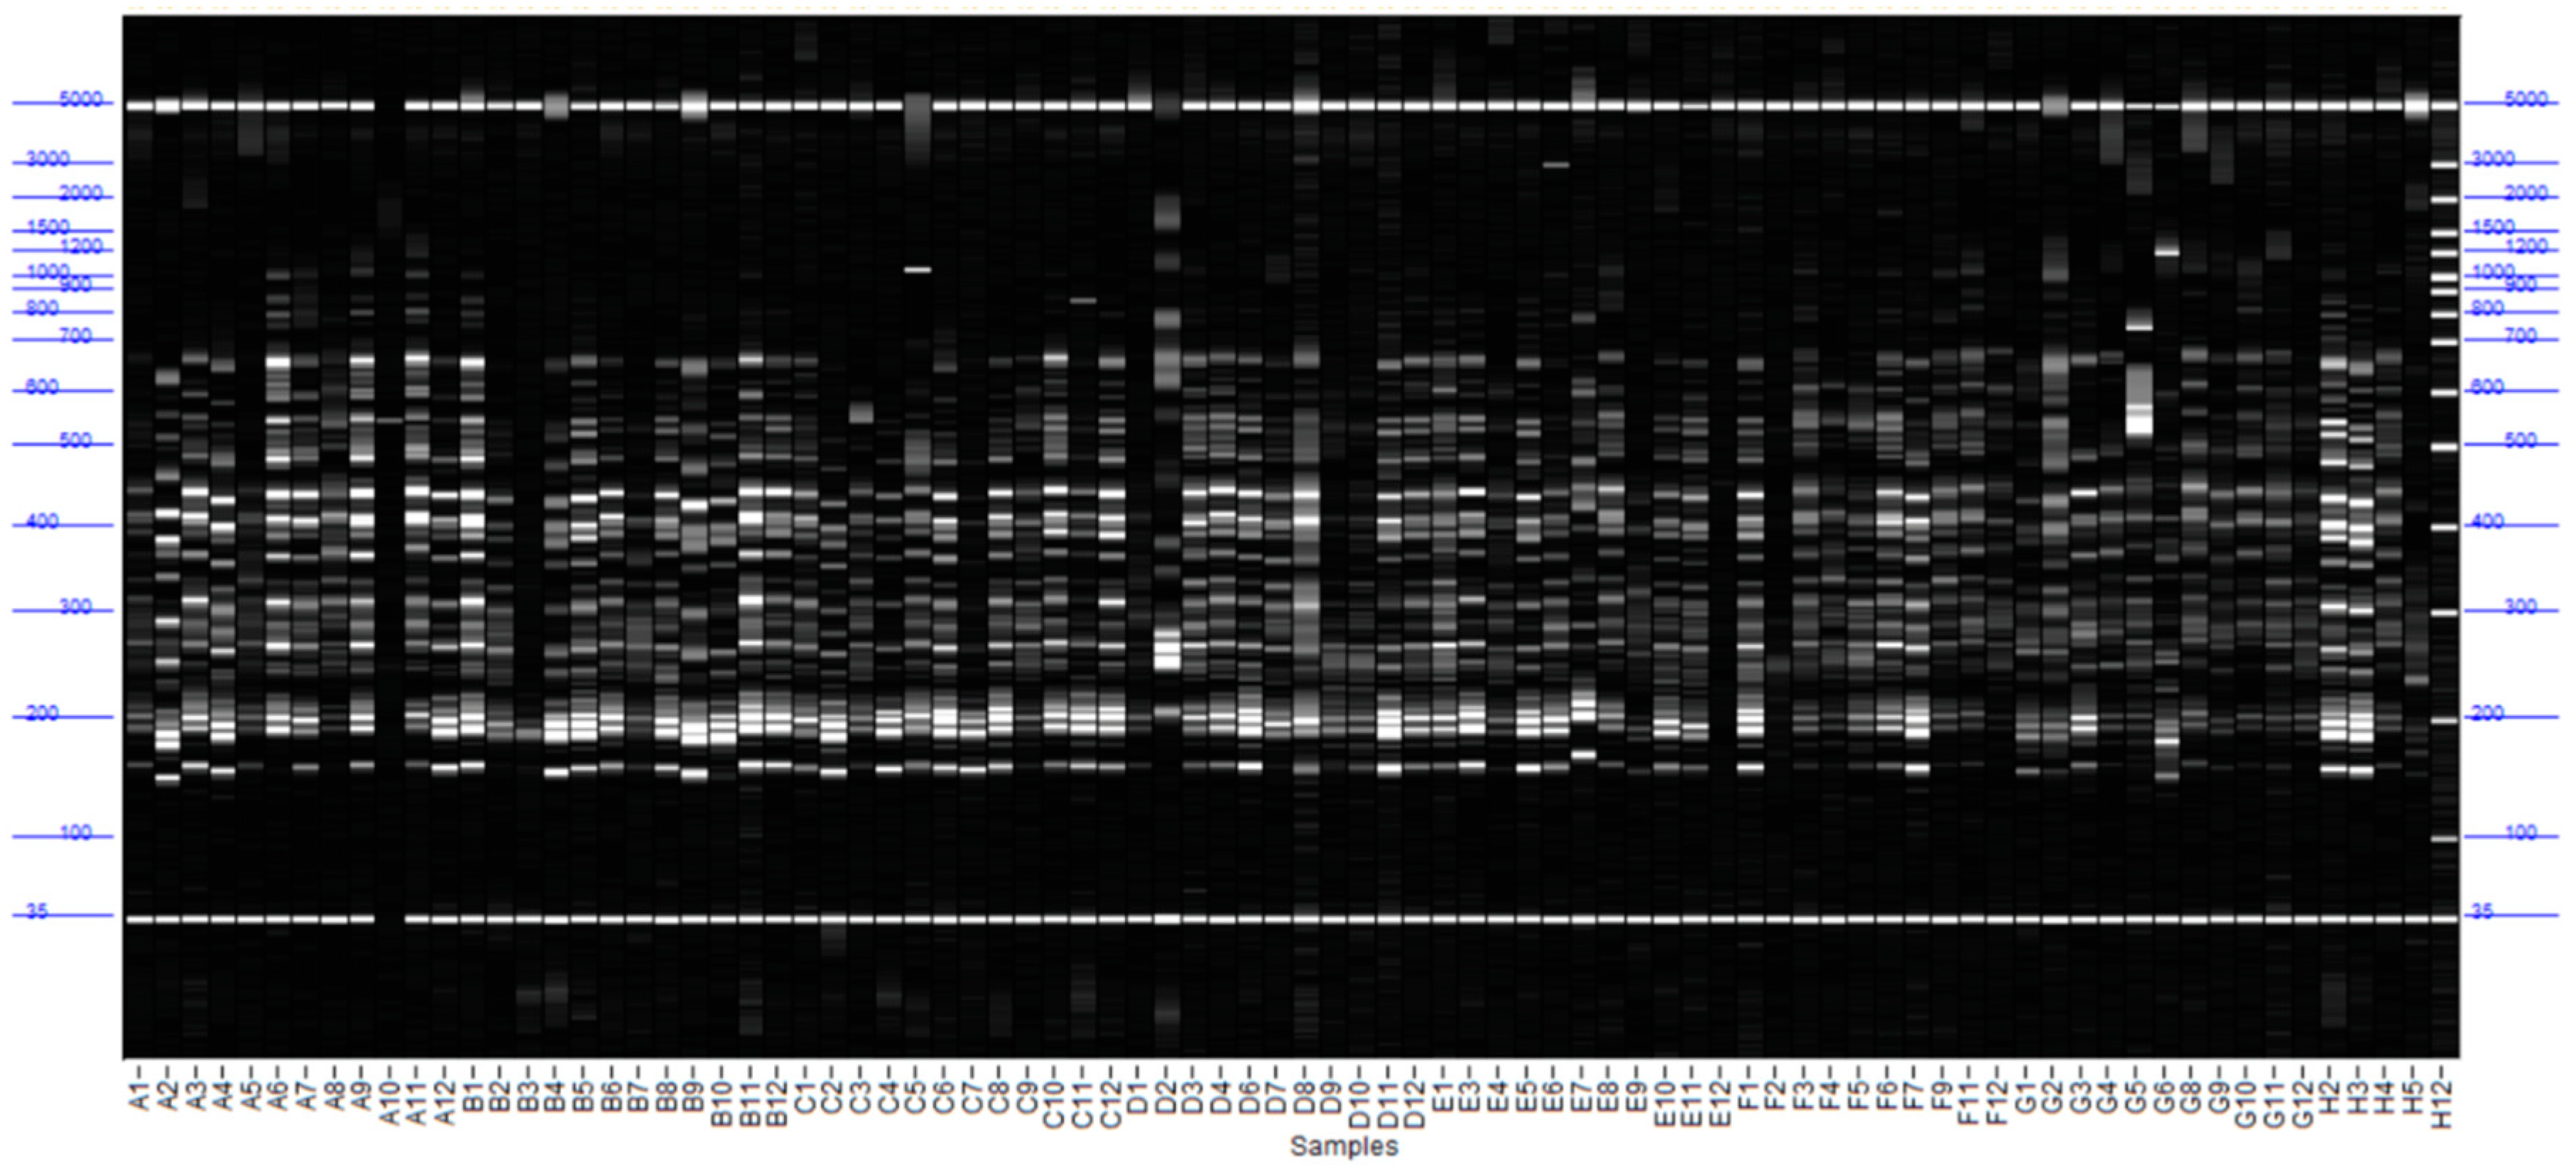

Table 1.
Details of ISSR markers used during the present study.
| Primer name | Primer code | Sequence 5' 3' | Annealing temperature, (0С) |
|---|---|---|---|
| ISSR 807 | (AG)8T | AGAGAGAGAGAGAGAGT | 42.0 |
| ISSR 808 | (AG)8C | AGAGAGAGAGAGAGAGC | 47.4 |
| ISSR 809 | (AG)8G | AGAGAGAGAGAGAGAGG | 46.3 |
| ISSR 810 | (GA)8T | GAGAGAGAGAGAGAGAT | 42.0 |
| ISSR 811 | (GA)8C | GAGAGAGAGAGAGAGAC | 43.2 |
| ISSR 816 | (CA)8T | CACACACACACACACAT | 43.2 |
| ISSR 817 | (CA)8A | CACACACACACACACAA | 53.0 |
| ISSR 819 | (GT)8A | GTGTGTGTGTGTGTGTA | 47.4 |
| ISSR 820 | (GT)8C | GTGTGTGTGTGTGTGTC | 50.1 |
| ISSR 822 | (TC)8A | TCTCTCTCTCTCTCTCA | 45.8 |
| ISSR 823 | (TC)8C | TCTCTCTCTCTCTCTCC | 47.4 |
| ISSR 826 | (AG)8C | ACACACACACACACACC | 53.0 |
| ISSR 834 | (AG)8YT | AGAGAGAGAGAGAGAGYT | 45.8 |
| ISSR 835 | (AG)8YC | AGAGAGAGAGAGAGAGYC | 45.7 |
| ISSR 840 | (GA)8YT | GAGAGAGAGAGAGAGAYT | 45.7 |
| ISSR 841 | (GA)8YC | GAGAGAGAGAGAGAGAYG | 45.8 |
Table 2.
Germination (%) of proso millet genotypes as affected by colchicine concentrations and soaking time for the M1- and M2-generations.
Table 2.
Germination (%) of proso millet genotypes as affected by colchicine concentrations and soaking time for the M1- and M2-generations.
| Pavlodarskoe 4 | |||||||||||
| Treatment time, hours | M ± SD | Colchicine concentrations, % | |||||||||
| 0 | 0.04 | 0.06 | 0.08 | 0.1 | |||||||
| M1 | M2 | M1 | M2 | M1 | M2 | M1 | M2 | M1 | M2 | ||
| 6 | Mean | 69.4 | 71.7 | 55.2 | 72.8 | 58.8 | 70.2 | 53.8 | 51.5 | 42.4 | 51.6 |
| SD | 1.8 | 2.3 | 2.0 | 1.8 | 2.3 | 1.7 | 1.7 | 1.5 | 2.0 | 2.2 | |
| 12 | Mean | 71.0 | 72.3 | 58.4 | 88.5 | 43.0 | 63.6 | 37.6 | 52.6 | 32.0 | 40.3 |
| SD | 2.2 | 1.1 | 1.6 | 1.4 | 1.8 | 2.1 | 2.8 | 2.4 | 1.7 | 1.5 | |
| 24 | Mean | 68.0 | 72.8 | 44.0 | 48.8 | 36.6 | 45.6 | 33.8 | 49.4 | 25.0 | 10.2 |
| SD | 2.1 | 2.7 | 2.2 | 2.6 | 2.0 | 2 | 2.2 | 1.7 | 2.4 | 0.9 | |
| Quartet | |||||||||||
| M ± SD | Colchicine concentrations, % | ||||||||||
| 0 | 0.04 | 0.06 | 0.08 | 0.1 | |||||||
| M1 | M2 | M1 | M2 | M1 | M2 | M1 | M2 | M1 | M2 | ||
| 6 | Mean | 70.6 | 75.1 | 53.2 | 69.6 | 50.6 | 68.4 | 43.2 | 57.2 | 20.0 | 32.0 |
| SD | 2.2 | 2.7 | 2.4 | 1.9 | 2.2 | 1.2 | 1.9 | 2.4 | 2.6 | 1.9 | |
| 12 | Mean | 69.2 | 74.0 | 58.0 | 69.6 | 59.0 | 54.0 | 43.0 | 50.7 | 26.0 | 32.6 |
| SD | 2.1 | 1.9 | 1.8 | 1.1 | 2.2 | 3.1 | 1.9 | 1.7 | 1.5 | 1.9 | |
| 24 | Mean | 69.0 | 78.0 | 43.0 | 32.3 | 35.0 | 29.4 | 30.0 | 30.3 | 30.0 | 21.6 |
| SD | 1.6 | 1.2 | 2.2 | 2.4 | 1.9 | 1.2 | 1.7 | 2.1 | 2.0 | 1.1 | |
| PI289324 | |||||||||||
| M ± SD | Colchicine concentrations, % | ||||||||||
| 0 | 0.04 | 0.06 | 0.08 | 0.1 | |||||||
| M1 | M2 | M1 | M2 | M1 | M2 | M1 | M2 | M1 | M2 | ||
| 6 | Mean | 68.8 | 78.9 | 57.0 | 70.8 | 61.0 | 68.7 | 56.2 | 64.4 | 33.4 | 52.5 |
| SD | 2.2 | 2.5 | 1.8 | 1.0 | 2.4 | 4.0 | 2.3 | 1.5 | 1.6 | 1.0 | |
| 12 | Mean | 73.0 | 81.5 | 65.6 | 70.2 | 61.0 | 64.8 | 65.4 | 52.3 | 42.0 | 27.3 |
| SD | 1.9 | 1.6 | 2.2 | 1.6 | 2.0 | 1.0 | 1.7 | 2.7 | 1.5 | 1.1 | |
| 24 | Mean | 68.0 | 73.6 | 47.0 | 49.4 | 43.0 | 32.9 | 37.0 | 34.0 | 18.0 | 27.0 |
| SD | 1.6 | 1.6 | 1.7 | 1.3 | 2.0 | 1.7 | 1.8 | 1.2 | 2.3 | 1.6 | |
Table 3.
Frequency of chlorophyll-deficient foliar in the M1 and M2 generations.
| Types of chlorophyll changes | Analyzed families in M1 | Frequency,% | Colchicine concentrations, % | Analyzed families in M2 | Frequency,% | Colchicine concentrations, % | ||||
|---|---|---|---|---|---|---|---|---|---|---|
| 0.06 | 0.08 | 0.1 | 0.06 | 0.08 | 0.1 | |||||
| albina | 360 | 8.6 | - | 8 | 23 | 500 | 1.0 | - | - | 2 |
| сhlorina | 348 | 10.0 | 5 | 12 | 18 | 500 | 1.0 | - | 1 | 1 |
| viridis | 270 | 17.4 | 6 | 14 | 27 | 500 | 5.5 | 2 | 4 | 5 |
| lutescent | 351 | 8.8 | 5 | 12 | 24 | 500 | - | - | - | - |
| corroded | 160 | 16.8 | - | 13 | 14 | 500 | - | - | - | - |
| maculata | 374 | 8.8 | - | 11 | 22 | 500 | 2.5 | - | 2 | 3 |
| striata | 351 | 9.6 | - | 13 | 21 | 500 | - | - | - | - |
Table 4.
Agronomic traits of proso millet as affected by colchicine concentrations and treatment time in the M1- and M2-generations.
Table 4.
Agronomic traits of proso millet as affected by colchicine concentrations and treatment time in the M1- and M2-generations.
| Treatment time, hours | Traits | Colchicine concentrations, % | |||||||||
|---|---|---|---|---|---|---|---|---|---|---|---|
| 0% | 0.04% | 0.06% | 0.08% | 0.1% | |||||||
| M1 | M2 | M1 | M2 | M1 | M2 | M1 | M2 | M1 | M2 | ||
| Pavlodarskoe 4 | |||||||||||
| 6 | PS (%) | 65.6±1.1 | 60.8±3.4 | 50.8±0.8 | 63.2±3.5 | 53.6±2.1 | 62.0±3.1 | 49.2±1.0 | 44.0±2.5 | 38.0±0.7 | 44.8±2.1 |
| GS (days) | 92.0±1.4 | 92.0±1.6 | 92.0±1.4 | 92.0±1.6 | 92.0±1.6 | 91.0±1.7 | 91.0±1.8 | 91.0±1.7 | 91.0±2.8 | 90.0±1.7 | |
| PB (piece) | 1.6±0.1 | 1.4±0.07 | 2.0±0.3 | 1.3±0.06 | 2.1±0.1 | 2.0±0.09 | 2.3±0.2 | 1.8±0.1 | 2.3±0.1 | 2.3±0.12 | |
| SWP (g) | 1.33±0.3 | 2.0±0.1 | 1.4±0.1 | 1.2±0.06 | 1.55±0.2 | 1.5±0.1 | 1.35±0.1 | 1.1±0.06 | 1.25±0.2 | 1.6±0.1 | |
| TSW(g) | 4.9±0.4 | 6.46±0.31 | 4.57±0.1 | 5.50±0.2 | 4.35±0.1 | 5.75±0.2 | 4.81±0.3 | 6.25±0.3 | 4.5±0.1 | 6.52±0.3 | |
| GY(c/ha) | 34.9±2.7 | 42.6±0.6 | 35.6±0.7 | 24.6±0.6 | 43.6±1.6 | 46.5±0.7 | 38.2±0.8 | 21.8±0.4 | 27.3±2.7 | 41.2±0.7 | |
| 12 | PS (%) | 64.8±2.0 | 58.4±3.5 | 54.0±1.1 | 74.8±4.1 | 41.2±1.7 | 52.0±2.8 | 32.8±2.7 | 46.4±3.0 | 28.0±2.4 | 49.6±3.1 |
| GS (days) | 92.0±1.7 | 92.0±1.8 | 89.0±2.9 | 90.0±1.7 | 88.0±3.1 | 89.0±1.7 | 88.0±2.8 | 88.0±1.6 | 88.0±2.5 | 88.0±1.6 | |
| PB (piece) | 1.3±0.1 | 1.4±0.06 | 2.0±0.2 | 1.5±0.07 | 2.3±0.1 | 2.3±0.04 | 2.4±0.3 | 1.8±0.06 | 2.4±0.1 | 2.5±0.07 | |
| SWP (g) | 2.0±0.3 | 2.4±0.09 | 1.62±0.1 | 1.6±0.06 | 1.87±0.1 | 2.2±0.07 | 2.1±0.1 | 2.8±0.1 | 2.9±0.4 | 1.8±0.06 | |
| TSW(g) | 4.76±0.4 | 5.5±0.25 | 4.28±0.1 | 5.75±0.25 | 4.65±0.1 | 5.75±0.3 | 4.7±0.3 | 6.45±0.3 | 6.49±0.3 | 7.1±0.4 | |
| GY(c/ha) | 42.1±1.6 | 49.1±0.7 | 43.7±1.8 | 44.9±0.7 | 44.3±2.3 | 65.8±1.2 | 41.3±1.6 | 58.5±1.1 | 48.7±2.1 | 55.8±1.0 | |
| 24 | PS (%) | 63.2±2.0 | 60.0±1.6 | 38.8±2.4 | 33.6±1.8 | 32.0±1.6 | 34.0±1.0 | 30.4±1.1 | 40.4±1.6 | 21.2±1.4 | 30.4±1.0 |
| GS (days) | 92.0±1.4 | 92.0±2.8 | 87.0±2.1 | 88.0±1.7 | 87.0±3.5 | 88.0±1.8 | 86.0±1.8 | 86.0±1.4 | 86.0±1.4 | 86.0±1.4 | |
| PB (piece) | 1.4±0.1 | 1.8±0.1 | 2.0±0.3 | 1.1±0.3 | 2.3±0.1 | 1.5±0.1 | 3.0±0.3 | 2.2±0.3 | 1.6±0.1 | 1.5±0.1 | |
| SWP (g) | 1.73±0.2 | 1.9±0.3 | 1.77±0.1 | 1.9±0.1 | 1.63±0.3 | 1.6±0.1 | 2.14±0.2 | 3.1±0.1 | 2.0±0.4 | 3.2±0.3 | |
| TSW(g) | 4.85±0.3 | 6.91±0.4 | 4.4±0.4 | 6.15±0.3 | 4.45±0.1 | 6.34±0.7 | 4.72±0.2 | 6.80±0.1 | 5.1±0.3 | 7.20±0.6 | |
| GY(c/ha) | 38.3±2.2 | 51.3±1.8 | 34.3±1.5 | 17.6±2.4 | 30.0±1.6 | 20.4±2.3 | 48.8±1.3 | 68.9±3.8 | 17.0±1.3 | 36.5±2.7 | |
| PI289324 | |||||||||||
| 6 | PS (%) | 62.8±1.7 | 78.4±3.4 | 52.0±2.7 | 60.8±2.8 | 55.6±3.5 | 60.4±3.3 | 49.6±2.4 | 58.4±1.7 | 29.6±1.1 | 46.0±1.7 |
| GS (days) | 81.0±1.6 | 81.0±1.4 | 79.0±2.8 | 80.0±1.4 | 78.0±1.4 | 80.0±1.6 | 78.0±1.8 | 80.0±1.8 | 78.0±1.4 | 79.0±2.8 | |
| PB (piece) | 1.5±0.1 | 1.2±0.3 | 1.6±0.3 | 1.8±0.4 | 1.8±0.06 | 1.8±0.1 | 1.7±0.1 | 2.1±0.3 | 2.4±0.2 | 2.2±0.1 | |
| SWP (g) | 1.49±0.1 | 2.5±0.3 | 1.8±0.1 | 2.0±0.1 | 1.74±0.09 | 2.3±0.3 | 1.9±0.4 | 1.9±0.3 | 2.1±0.1 | 2.4±0.1 | |
| TSW(g) | 5.36±0.1 | 6.1±0.1 | 5.29±0.3 | 5.85±0.3 | 4.88±0.25 | 6.4±0.4 | 5.04±0.3 | 5.6±0.1 | 5.23±0.1 | 5.8±0.4 | |
| GY(c/ha) | 35.1±2.3 | 58.8±1.8 | 37.4±1.6 | 54.7±2.1 | 43.5±0.7 | 62.5±2.1 | 40.1±2.1 | 58.3±2.2 | 37.3±1.8 | 60.7±3.3 | |
| 12 | PS (%) | 65.6±2.1 | 64.4±1.1 | 58.0±0.7 | 62.0±0.8 | 54.8±1.1 | 60.0±2.1 | 56.0±1.0 | 42.8±1.0 | 37.2±0.8 | 8.4±0.7 |
| GS (days) | 81.0±1.6 | 81.0±1.4 | 79.0±2.8 | 80.0±1.4 | 78.0±1.4 | 79.0±1.6 | 78.0±1.8 | 78.0±1.8 | 78.0±1.4 | 78.0±2.8 | |
| PB (piece) | 1.3±0.1 | 1.4±0.1 | 1.7±0.1 | 1.6±0.3 | 1.8±0.1 | 1.8±0.1 | 1.6±0.2 | 1.7±0.2 | 1.8±0.3 | 1.4±0.1 | |
| SWP (g) | 1.73±0.2 | 2.6±0.3 | 2.0±0.2 | 2.5±0.1 | 1.95±0.3 | 1.9±0.2 | 1.85±0.1 | 1.7±0.1 | 1.72±0.1 | 1.1±0.2 | |
| TSW(g) | 5.75±0.1 | 6.7±0.4 | 4.75±0.1 | 6.32±0.1 | 4.44±0.4 | 6.45±0.1 | 4.52±0.3 | 5.55±0.3 | 5.41±0.1 | 5.4±0.1 | |
| GY(c/ha) | 36.9±1.6 | 58.6±2.7 | 49.3±2.7 | 62.0±0.7 | 48.1±2.7 | 51.3±1.6 | 41.4±0.8 | 30.9±0.8 | 28.8±0.7 | 3.2±2.7 | |
| 24 | PS (%) | 60.8±1.1 | 64.8±3.0 | 40.4±1.8 | 37.2±2.5 | 38.0±1.0 | 23.6±3.5 | 30.0±1.0 | 24.0±3.1 | 14.8±1.6 | 18.8±2.0 |
| GS (days) | 81.0±1.8 | 81.0±1.4 | 76.0±1.7 | 78.0±2.8 | 75.0±1.4 | 78.0±1.4 | 75.0±1.8 | 75.0±1.4 | 75.0±2.8 | 75.0±2.8 | |
| PB (piece) | 1.1±0.3 | 1.5±0.3 | 1.9±0.3 | 1.6±0.1 | 1.8±0.1 | 3.2±0.3 | 2.1±0.1 | 2.0±0.1 | 2.0±0.1 | 2.0±0.3 | |
| SWP (g) | 2.2±0.2 | 2.2±0.3 | 1.8±0.1 | 0.7±0.1 | 1.92±0.3 | 1.4±0.1 | 2.46±0.1 | 1.3±0.2 | 2.2±0.3 | 0.8±0.1 | |
| TSW(g) | 5.93±0.2 | 6.0±0.3 | 6.6±0.3 | 5.9±0.1 | 5.58±0.6 | 5.15±0.3 | 5.39±0.7 | 6.0±0.4 | 5.7±0.4 | 5.5±0.1 | |
| GY(c/ha) | 36.8±1.3 | 53.5±2.3 | 34.5±2.4 | 10.4±2.3 | 32.8±2.7 | 26.4±1.6 | 38.7±2.3 | 15.6±4.5 | 16.3±1.8 | 7.5±1.6 | |
| Quartet | |||||||||||
| 6 | PS (%) | 64.0±1.3 | 69.6±2.0 | 49.6±1.1 | 56.0±2.4 | 46.4±1.1 | 48.0±1.6 | 38.8±2.0 | 52.4±1.1 | 16.8±2.1 | 25.2±1.4 |
| GS (days) | 89.0±1.8 | 89.0±1.4 | 89.0±1.4 | 89.0±2.1 | 89.0±2.3 | 89.0±3.5 | 88.0±1.8 | 88.0±1.8 | 88.0±2.0 | 87.0±1.4 | |
| PB (piece) | 1.5±0.1 | 1.4±0.1 | 2.2±0.1 | 1.6±0.3 | 2.0±0.3 | 1.9±0.1 | 2.4±0.1 | 1.8±0.3 | 2.6±0.2 | 2.0±0.1 | |
| SWP (g) | 1.2±0.3 | 2.1±0.2 | 1.35±0.1 | 2.5±0.1 | 1.32±0.1 | 2.4±0.3 | 1.0±0.3 | 2.6±0.2 | 1.28±0.4 | 2.7±0.4 | |
| TSW(g) | 4.8±0.4 | 6.2±0.3 | 4.87±0.1 | 6.41±0.4 | 4.67±0.3 | 6.6±0.1 | 4.51±0.4 | 6.2±0.2 | 4.22±0.2 | 6.15±0.3 | |
| GY(c/ha) | 28.8±1.3 | 51.2±2.2 | 36.8±2.4 | 56.0±1.5 | 30.6±2.0 | 54.7±1.6 | 23.3±1.7 | 61.3±1.3 | 14.0±.11 | 34.0±1.3 | |
| 12 | PS (%) | 62.0±2.8 | 63.2±2.0 | 53.2±3.4 | 56.0±1.1 | 52.8±1.7 | 47.2±1.7 | 38.4±3.3 | 62.4±2.7 | 22.4±1.7 | 27.2±2.4 |
| GS (days) | 89.0±2.8 | 89.0±1.7 | 88.0±1.4 | 89.0±2.9 | 88.0±3.2 | 87.0±3.1 | 86.0±1.4 | 87.0±2.8 | 86.0±2.5 | 86.0±2.5 | |
| PB (piece) | 1.6±0.4 | 1.5±0.1 | 1.9±0.3 | 2.3±0.2 | 2.1±0.3 | 1.4±0.1 | 2.1±0.1 | 2.0±0.3 | 2.3±0.1 | 2.1±0.1 | |
| SWP (g) | 1.36±0.1 | 1.8±0.3 | 1.2±0.3 | 2.1±0.1 | 1.49±0.3 | 2.4±0.1 | 1.08±0.3 | 1.8±0.1 | 2.84±0.1 | 3.3±0.4 | |
| TSW(g) | 4.77±0.3 | 6.85±0.4 | 4.41±0.1 | 6.26±0.1 | 3.48±0.1 | 5.67±0.1 | 4.1±0.4 | 6.0±0.3 | 5.21±0.4 | 6.8±0.3 | |
| GY(c/ha) | 33.7±2.1 | 42.7±1.6 | 30.3±1.8 | 67.6±1.8 | 41.3±2.2 | 39.6±2.3 | 21.8±2.1 | 56.2±1.6 | 36.6±3.3 | 47.1±2.1 | |
| 24 | PS (%) | 61.2±2.8 | 66.0±1.3 | 37.6±3.1 | 24.4±1.1 | 32.0±3.0 | 22.0±1.1 | 25.6±3.5 | 23.2±2.0 | 24.0±4.1 | 16.0±2.1 |
| GS (days) | 89.0±1.7 | 89.0±1.8 | 83.0±1.6 | 87.0±1.4 | 83.0±1.6 | 87.0±2.3 | 83.0±1.8 | 84.0±1.8 | 82.0±1.7 | 84.0±2.0 | |
| PB (piece) | 1.2±0.04 | 1.6±0.1 | 2.1±0.07 | 2.4±0.1 | 2.1±0.06 | 2.2±0.3 | 2.1±0.06 | 2.0±0.1 | 2.0±0.07 | 1.7±0.2 | |
| SWP (g) | 2.05±0.07 | 1.7±0.3 | 1.83±0.06 | 1.7±0.1 | 1.7±0.1 | 1.3±0.1 | 1.78±0.09 | 1.7±0.3 | 1.5±0.06 | 2.3±0.4 | |
| TSW(g) | 4.6±0.3 | 6.0±0.4 | 4.51±0.4 | 6.65±0.1 | 4.76±0.3 | 7.25±0.3 | 4.6±0.25 | 6.2±0.4 | 4.3±0.25 | 6.2±0.2 | |
| GY(c/ha) | 37.6±1.2 | 44.9±1.3 | 36.1±1.0 | 24.9±2.4 | 28.6±1.1 | 15.7±2.0 | 23.9±0.7 | 19.7±1.7 | 18.0±0.7 | 15.6±.11 | |
Table 5.
ANOVA test for agronomic traits of M1 generation.
| Agronomic traits | Treatment time, hours | Colchicine concentrations, % | |||||
|---|---|---|---|---|---|---|---|
| 6 | 12 | 24 | 0.04 | 0.06 | 0.08 | 0.1 | |
| FG | 0.894ns | 0.048* | 0.044* | 9.87E-06*** | 4.37E-05*** | 8.57E-06*** | 3.38E-10*** |
| PS | 0.987 ns | 0.031* | 0.036* | 2.12E-05*** | 4.39E-05*** | 3.76E-06*** | 3.90E-10*** |
| GS | 0.494 ns | 0.222 ns | 0.082 ns | 0.298ns | 0.225 ns | 0.155 ns | 0.145 ns |
| PB | 0.489 ns | 0.574 ns | 0.965 ns | 9.59E-06*** | 1.94E-06*** | 6.65E-05*** | 1.20E-05*** |
| SWP | 0.019* | 0.0001*** | 0.655 ns | 0.813 ns | 0.949 ns | 0.759ns | 0.219 ns |
| TSW | 0.940 ns | 0.225 ns | 0.322 ns | 0.444 ns | 0.058 ns | 0.083 ns | 0.867 ns |
| GY | 0.088 ns | 0.029* | 0.414 ns | 0.580 ns | 0.584 ns | 0.373ns | 0.013* |
Note: *** = Significant at 0.001 significance level; ** = Significant at 0.01 significance level; * = Significant at 0.05 significance level, ns: P>0.05.
Table 6.
ANOVA test for agronomic traits of M2 generation.
| Agronomic traits | Treatment time, hours | Colchicine concentrations, % | |||||
|---|---|---|---|---|---|---|---|
| 6 | 12 | 24 | 0.04 | 0.06 | 0.08 | 0.1 | |
| FG | 0.408ns | 0.018* | 0.001*** | 0.073 ns | 0.002** | 3.57E-06*** | 1.25E-07*** |
| PS | 0.497 ns | 0.031* | 0.004** | 0.109 ns | 0.005** | 0.0006*** | 1.46E-05*** |
| GS | 0.297 ns | 0.359 ns | 0.437 ns | 0.136 ns | 0.538 ns | 0.037* | 0.025* |
| PB | 1.000 ns | 0.595 ns | 0.599 ns | 0.403 ns | 0.029* | 0.0003*** | 0.012* |
| SWP | 0.602 ns | 0.157 ns | 0.299 ns | 0.338 ns | 0.373 ns | 0.810 ns | 0.866 ns |
| TSW | 0.814 ns | 0.550 ns | 0.352 ns | 0.297 ns | 0.609 ns | 0.148 ns | 0.422 ns |
| GY | 0.502 ns | 0.001*** | 0.007** | 0.601 ns | 0.795 ns | 0.508 ns | 0.450 ns |
Note: *** = Significant at 0.001 significance level; ** = Significant at 0.01 significance level; * = Significant at 0.05 significance level, ns: P>0.05.
Table 7.
Details of ISSR markers used during the present study.
| Primer name | Colchicine concentrations, % | Total loci | Size range (bp) | Polymorphic loci | Polymorphism, % | PIC |
|---|---|---|---|---|---|---|
| ISSR 807 | 0.00 | 12 | 229-3268 | 12 | 100 | 0.233 |
| 0.04 | 15 | 210-848 | 15 | 100 | ||
| 0.06 | 27 | 206-1301 | 25 | 92.5 | ||
| 0.08 | 33 | 172-3950 | 33 | 100 | ||
| ISSR 808 | 0.00 | 28 | 208-3778 | 28 | 100 | 0.249 |
| 0.04 | 16 | 213-1840 | 15 | 90.9 | ||
| 0.06 | 15 | 211-4689 | 15 | 100 | ||
| 0.08 | 23 | 206-1732 | 23 | 100 | ||
| ISSR 809 | 0.00 | 19 | 48-1055 | 19 | 100 | 0.217 |
| 0.04 | 16 | 218-1486 | 15 | 90.9 | ||
| 0.06 | 14 | 233-4313 | 14 | 100 | ||
| 0.08 | 25 | 214-2479 | 23 | 92.0 | ||
| ISSR 810 | 0.00 | 5 | 336-1069 | 5 | 100 | 0.219 |
| 0.04 | 8 | 170-4334 | 8 | 100 | ||
| 0.06 | 28 | 210-1400 | 26 | 92.8 | ||
| 0.08 | 21 | 218-1179 | 18 | 75.0 | ||
| ISSR 811 | 0.00 | 4 | 975-1068 | 4 | 100 | 0.228 |
| 0.04 | 5 | 457-1520 | 5 | 100 | ||
| 0.06 | 7 | 539-1724 | 7 | 100 | ||
| 0.08 | 14 | 492-1626 | 14 | 100 | ||
| ISSR 816 | 0.00 | 5 | 542-3954 | 5 | 100 | 0.226 |
| 0.04 | 4 | 3326-3466 | 4 | 100 | ||
| 0.06 | 9 | 536-4186 | 9 | 100 | ||
| 0.08 | 17 | 379-3489 | 16 | 94.1 | ||
| ISSR 817 | 0.00 | 11 | 278-3094 | 10 | 90.9 | 0.203 |
| 0.04 | 6 | 42-2769 | 6 | 100 | ||
| 0.06 | 12 | 39-3405 | 12 | 100 | ||
| 0.08 | 10 | 41-1630 | 10 | 100 | ||
| ISSR 819 | 0.00 | 11 | 224-3258 | 8 | 72.7 | 0.202 |
| 0.04 | 8 | 42-4525 | 8 | 100 | ||
| 0.06 | 8 | 42-2347 | 7 | 87.5 | ||
| 0.08 | 5 | 42-3417 | 4 | 80.0 | ||
| ISSR 820 | 0.00 | 53 | 49-2922 | 53 | 100 | 0.219 |
| 0.04 | 27 | 202-2769 | 27 | 100 | ||
| 0.06 | 6 | 205-1697 | 6 | 100 | ||
| 0.08 | 8 | 44-2014 | 8 | 100 | ||
| ISSR 822 | 0.00 | 28 | 156-3845 | 26 | 92.8 | 0.214 |
| 0.04 | 22 | 162-3415 | 22 | 100 | ||
| 0.06 | 24 | 155-4293 | 23 | 95.8 | ||
| 0.08 | 12 | 157-4449 | 11 | 91.6 | ||
| ISSR 823 | 0.00 | 21 | 248-1568 | 19 | 90.4 | 0.226 |
| 0.04 | 22 | 247-1590 | 22 | 100 | ||
| 0.06 | 19 | 252-4661 | 19 | 100 | ||
| 0.08 | 14 | 255-1568 | 14 | 100 | ||
| ISSR 826 | 0.00 | 23 | 181-1396 | 23 | 100 | 0.237 |
| 0.04 | 18 | 52-4827 | 18 | 100 | ||
| 0.06 | 18 | 52-1775 | 18 | 100 | ||
| 0.08 | 23 | 51-1884 | 23 | 100 | ||
| ISSR 834 | 0.00 | 36 | 146-4051 | 33 | 91.6 | 0.293 |
| 0.04 | 38 | 187-4798 | 38 | 100 | ||
| 0.06 | 37 | 193-2849 | 27 | 72.9 | ||
| 0.08 | 34 | 189-4091 | 33 | 97.0 | ||
| ISSR 835 | 0.00 | 38 | 108-4320 | 34 | 89.4 | 0.311 |
| 0.04 | 35 | 134-4382 | 34 | 97.1 | ||
| 0.06 | 38 | 160-4093 | 35 | 92.1 | ||
| 0.08 | 43 | 134-4279 | 43 | 100 | ||
| ISSR 840 | 0.00 | 41 | 138-4000 | 38 | 92.6 | 0.322 |
| 0.04 | 45 | 144-4625 | 45 | 100 | ||
| 0.06 | 45 | 138-4417 | 45 | 100 | ||
| 0.08 | 32 | 49-4688 | 32 | 100 | ||
| ISSR 841 | 0.00 | 24 | 141-3964 | 24 | 100 | 0.266 |
| 0.04 | 18 | 155-2164 | 18 | 100 | ||
| 0.06 | 27 | 164-4442 | 24 | 88.8 | ||
| 0.08 | 23 | 158-4061 | 23 | 100 | ||
| Mean | - | 20.82 | - | 20.01 | 96.11 | 0.241 |
Table 8.
Genetic diversity information of proso millet depending on different concentrations of colchicine provided by ISSR markers.
Table 8.
Genetic diversity information of proso millet depending on different concentrations of colchicine provided by ISSR markers.
| Colchicine concentrations, % | Mean/SE | Naa | Neb | Ic | Hed | uHee | Pf |
|---|---|---|---|---|---|---|---|
| Control | Mean | 0.913 | 1.224 | 0.228 | 0.147 | 0.176 | 45.34 |
| SE | 0.023 | 0.006 | 0.006 | 0.004 | 0.005 | 2.561 | |
| 0.04% | Mean | 0.676 | 1.232 | 0.199 | 0.136 | 0.181 | 32.85 |
| SE | 0.022 | 0.008 | 0.007 | 0.005 | 0.006 | 1.784 | |
| 0.06% | Mean | 0.499 | 1.169 | 0.145 | 0.099 | 0.132 | 23.92 |
| SE | 0.020 | 0.007 | 0.006 | 0.004 | 0.006 | 1.483 | |
| 0.08% | Mean | 0.801 | 1.194 | 0.199 | 0.128 | 0.153 | 39.84 |
| SE | 0.023 | 0.006 | 0.006 | 0.004 | 0.005 | 2.457 |
Note: anumber of different alleles; bnumber of effective alleles; cShannon's information index; dexpected heterozygosity; eunbiased expected heterozygosity; fpercentage of polymorphic loci.
Disclaimer/Publisher’s Note: The statements, opinions and data contained in all publications are solely those of the individual author(s) and contributor(s) and not of MDPI and/or the editor(s). MDPI and/or the editor(s) disclaim responsibility for any injury to people or property resulting from any ideas, methods, instructions or products referred to in the content. |
© 2023 by the authors. Licensee MDPI, Basel, Switzerland. This article is an open access article distributed under the terms and conditions of the Creative Commons Attribution (CC BY) license (http://creativecommons.org/licenses/by/4.0/).
Copyright: This open access article is published under a Creative Commons CC BY 4.0 license, which permit the free download, distribution, and reuse, provided that the author and preprint are cited in any reuse.


