
Submitted:
30 October 2023
Posted:
03 November 2023
You are already at the latest version
Abstract
In this study, we performed periodicity analyzes of selected daily solar (FI, CI), geomagnetic (Ap, Dst, Scalar B) and cosmic (CRI) activity indices for the last solar Cycle 24 (December 2008 to December 2019). To investigate the periodic variations of above selected data sets the Multi Taper Method (MTM), Morlet wavelet, Cross Wavelet Transform (XWT), and Wavelet Coherence (WTC) analysis techniques were used. In results of our analysis we found that i) the 25-33 and 2048-day periodicities exist in all data sets without any exception, while all other detected periodicities have data preferences, ii) all detected periods located around the maximum phase of the cycle (Cycle 24), iii) the phase relations between compared data sets periodicities are gradually changing from small periods to large ones; there are no phase relations between small periodicities and they show mixed phases, while they are completely in phase/antiphase for large periodicities, iv) all detected FI periodicities, except 2048 days periodicity, are common periodicities with all other data sets used in this study.
Keywords:
Solar cycles
; Solar flares
; Geomagnetic activity indices
; Cosmic rays
; Period analysis
1. Introduction
To describe the temporal and periodic changes of solar activity, different solar indices can be used such as sunspot numbers, sunspot areas, solar flare index (FI), 10.7 cm solar radio flux, etc. All these indices show very good correlation to each other and they show 11-year solar cyclic behavior, the so- called solar cycle/Schwabe Cycle, when the long term variation is taken into account. Due to the Sun rotation, all these indices show a periodicity of about 27-day without any exception. Periodic variations show some differences as depending on the used data sets, the analysis method and the solar cycle data analyzed. Approximately 155-day solar periodicity was discovered by [1] in the high energy solar flare data of solar cycle 21. Subsequently, numerous studies were performed within the various solar activity indicators, to investigate the periodicities between 27 days and 11 years, called midrange periodicities [2,3,4,5,6,7,8,9,10,11,12], and reference therein.
It is well known that solar and geomagnetic activities are strongly related with each other. When a strong solar event such as solar flare, coronal mass ejection (CME), etc., occurs on the Sun, it may have a significant impact on Earth and its near space environment. These impacts may occur in different ways including radio blackout, satellite drug, induced currents in electrical systems, etc. Similar to solar activity, the geomagnetic disturbances are measured and monitored by using various geomagnetic parameters, such as aa [13], K [14], Ap [15], Dst [16] indices, Interplanetary Magnetic Field (IMF/Scalar B), etc. The relationship between solar activity and these indices has been extensively studied in the literature [17,18,19,20,21,22]. Also, the periodic variations of both solar and geomagnetic activity indices have been studied for a long time and co-temporal periodicities reported [12,23,24,25]. However, contradictory results such as phase mixing, nonexistence of some periodicities in some data sets, variability of obtained results from cycle to cycle, etc. are still remaining.
In this study we focus on the comparison of the periodic variations detected in the selected solar and geomagnetic-activity indices measured during the exact duration of solar Cycle 24 (from December 2008 to December 2019). We describe the data and methods used in Section 2, the analysis and results are given in Section 3, and the discussion and conclusions are given in Section 4.
2. Data and Methods
2.1. The Data
We compared daily FI data with selected daily solar and geomagnetic activity parameters for exact duration of solar Cycle 24 (from December 2008 to December 2019). The used parameters are as follows:
- Flare Index (FI): Introduced by Kleczek in 1952 as an approximate measure of the total energy emitted by a flare. This index is described by the equation FI = it, in which represents the combination of intensity and area and called scale of importance and is the duration of the flare in minutes. The value of i varies between 0.5 and 4.0 from very weak flare to very strong flare, respectively. The flare index data used in this study are taken from https://www.ngdc.noaa.gov/stp/solar/solarflares.html.
- Coronal Index: [26] introduced the coronal index (CI) as an indicator of solar activity. CI represents the average daily irradiance emitted through the green coronal line into one steradian towards the Earth. CI is calculated using Fe XIV 530.3 nm coronal emission line ground-based measurements from the worldwide control stations [27]. The data are downloaded from the web page of Slovak Central Observatory in Hurbanovo http://www.suh.sk/obs/vysl/MCI.htm).
- The Disturbance Storm Time (Dst) Index: [16] proposed the Disturbance Storm Time (Dst) index to measure the size of magnetospheric currents that result in an axially symmetric disturbance field. This index tracks changes in the magnetic field brought on by ring currents that form during geomagnetic storms in the magnetosphere. The Dst index is derived using information from four observatories selected sufficiently far from the auroral and equatorial electrojet zones due to the need for high-quality data.
- Ap Index: Changes in the magnetic field’s horizontal component are quantified using the K index. However, the Kp index was developed because the K index does not directly correlate with geomagnetic activity. It is obtained from the mean standardized K index of 13 geomagnetic observatories that are situated between ±44 and ±60 degrees of the geomagnetic latitude. This planetary index is intended to gauge the solar particle radiation’s magnetic impact. The 24-hour average of the 3-hourly ap index is employed in this study [15].
- The average interplanetary magnetic field (IMF)/Scalar B: It contains solar magnetic fields that the solar wind brought into planetary space. While coronal holes, which are open magnetic-field regions on the Sun, are assumed to be the origin of the fast solar wind, the slow solar wind is supposed to come from closed magnetic regions that are connected to active regions. Understanding space weather requires an understanding of the structure and dynamics of the IMF (scalar B) [28]. Note that the Ap, Dst and Scalar B data sets are downloaded from https://omniweb.gsfc.nasa.gov/form/dx1.html.
- Cosmic Ray Intensities (CRI): Cosmic rays are high energy particles that flow into our solar system from outer space. The intensity at which cosmic rays collide with the Earth’s atmosphere varies. It changes also with latitude, because the flux is modulated by the Earth’s magnetic field. The cosmic ray flux at the equator is four times less than the flux at the poles. The corrected cosmic ray intensity data used in this study are taken from Oulu/Finland neutron monitor station (https://cosmicrays.oulu.fi/# solar).
2.2. Methods
To investigate the periodic variations in the data sets used, first, we performed Multi Taper Method (MTM) and then, Morlet wavelet analysis methods. The MTM spectral analysis method provides useful tools for spectral estimation [29] and signal reconstruction [30], especially of a time series whose spectrum includes both broadband and line components. More details about this method can be found in [31]. This method has been successfully applied to the analysis of various data sets [12,25,31,32,33,34,35]. Here, three sinusoidal tapers were utilized, and the significance tests were conducted under the presumption that the noise has a red spectrum. When the 95% confidence level is attained, a signal is regarded as having been identified. The Morlet wavelet method [36], which has been employed in numerous solar investigations [12,25,35,37,38], was used to determine the localization of the aforementioned periodicities. We assumed that the noise is also red and the edge effect is represented by the Cone Of Influence (COI) in the Morlet wavelet analysis.
As a final step of the methodology, we applied Cross Wavelet Transform (XWT) and Wavelet Coherence (WTC) analysis methods that give possible relationship (correlation and phase) between obtained periodicities from two different data sets. These two methods are also part of the biwavelet package [39]. Numerous authors [35,37,40,41,42] have also used them. Between two analyzed data sets, X and Y, they enable us to infer a nonlinear relationship and common periods. Also the phase relationship between the two time series can be obtained. The phase relations are depicted by arrows that conform to the following convention: pointing right indicates inphase; pointing left indicates antiphase; pointing straight up indicates the second series leads by 90 degrees; and straight down indicates the first series leads by 90 degrees. By calculating the cross-correlation between the two time series, the WTC spectrum shows the amount of common power between two time series as a function of time and frequency [35,43,44,45]. Here, we compared the total FI data with each of the other indices used in this study.
3. Analysis and Results
3.1. Morlet Wavelet and MTM Analysis
We begin our analysis with MTM and Morlet wavelet analysis methods of all data sets as previously described. Figure 1 and Figure 2 and Table 1 show the obtained periodicities, their existence and the confidence levels in the used data sets.
In the above plots, black contours describe the meaningful periods in each data sets with 95% confidence level; the white solid curve describe the COI for which periods located outside this curve are not acceptable, as non meaningful due to the edge effect. From these figures and Table 1, we obtained the following results; 1) the 2048 and 25-33 days periodicities exist in all data sets without any exception. The 25-33 days periodicities are seen in wavelet scalogram of all data sets especially during the maximum phase of the cycle (Cycle 24), while the 2048-day periodicity, located outside of the COI is not seen in the wavelet scalogram of CI, as a meaningful periodicity. 2) The 683-day periodicity is only seen in Dst index MTM spectrum, while it appears in the wavelet scalogram of FI, Ap, and CRI around the maximum phase of the cycle. 3) The 370-455 days periodicity is seen in the MTM spectrum of Ap and Scalar B, and it appears in the wavelet scalograms of FI, Ap, Dst and Scalar B during the maximum phase of the cycle. 4) The 292-293 days period is seen only in the MTM spectrums of FI and Scalar B and it also appears in the wavelet scalograms of these two data sets around the cycle maximum. 5) The 178-228 days periodicity is seen in all geomagnetic activity indices MTM spectrums. Thus we may speculate that the origin of this periodicity may be different from the solar activity. Note that it does not appear as a significant periodicity in the wavelet scalogram of CRI data set. 6) The 120.5-day periodicity is only seen in the MTM spectrum of Scalar B, and it seen in the wavelet scalogram of the same data set as a dark red region (below 95% confidence level) around the years 2012-2013. 7) The 52-61 days periodicity is detected in FI and CRI as a significant periodicity. But it does not exist in the MTM spectrums of other parameters. Thus we may argue that the origin of this periodicity is the solar flare activity. 8) The 44-45 day periodicity is seen as a meaningful periodicity in the MTM spectrum of CI, Dst and CRI data sets and it appears in the wavelet scalogram of FI, CI, Ap, Dst and CRI data sets during the maximum phase of the cycle. Thus, we may argue that the source of this periodicity is not the sun or it modified in the interplanetary medium.
3.2. Cross Wavelet and Wavelet Coherence Analysis
To investigate the possible phase and correlation relations between total FI and all other data sets used here, the Cross Wavelet (XWT) and Wavelet Coherence (CWT) analysis were performed (see, Figure 3). In these plots black contours describe the common periods, white arrows show the phase relation between compared parameters, the black dashed curve describe the COI that contours located outside of this curve is not acceptable as a non meaningful periodicity due to the edge effect. From these figures, following results can be listed; i) all periodicities given in Table 1 are common periods between compared data sets except the 2048 days periodicity. It appears clearly in the XWT plots of FI versus all data sets, while it only appears in the WTC plots of FI versus CRI. ii) Short term common periods do not have any phase relation that the phases are completely mixed. When it goes to the higher periodicities the phase relations start to appear: if the compared data sets show positive/negative correlation they are getting in phase/antiphase with increasing periodicity. iii) Contrary to MTM and Morlet wavelet analysis, we detected an about 128-512 day periodicity interval which appears as very prominent in the XWT and WTC plots of FI versus all other parameters. This result show that this periodicity is a common periodicity for all data sets but its confidence level is below 95% in some data sets. As a general result we therefore assume that FI and other data sets used in this study are related to each other.
4. Conclusions and Discussions
In this study, we performed periodicity analyzes of selected daily solar (FI, CI), geomagnetic (Ap, Dst, Scalar B) and cosmic (CRI) activity indices for the exact duration of the last solar cycle (Cycle 24). The MTM, Morlet wavelet, XWT, and WTC analysis techniques were used for the periodicity analyses of the investigated data sets. The results of our analysis are as following:
- The 2048 and 25-33 days periodicities exist in all data sets without any exception. The 25-33 days periodicities are seen in wavelet scalograms of all data sets especially during the maximum phase of the cycle (Cycle 24), while the 2048–day periodicity located outside of the COI and it is not seen in the wavelet scalogram of CI as a meaningful periodicity.
- All periodicities have data preference, periodicities appear in different data sets, except the two above-mentioned periodicities; the 683–day periodicity is only seen in Dst index MTM spectrum and in the wavelet scalogram of FI, Ap and CRI. The 370–455 days periodicities seen in the MTM spectrum of Ap and Scalar B and the wavelet scalograms of FI, Ap, Dst and Scalar B. The 292–293 days periods seen only in the MTM spectrums and wavelet scalograms of FI and Scalar B. The 178–228 days periodicities are seen in all geomagnetic activity indices MTM spectrums and does not appear as a significant periodicity in the wavelet scalogram of CRI data set. The 120.5–day periodicity is only seen in the MTM spectrum of Scalar B. The 52-61 days periodicities are detected in FI and CRI as a significant periodicity. The 44-45 days periodicities are seen as a meaningful periodicity in the MTM spectrums of CI, Dst and CRI data sets and it appear in the wavelet scalograms of FI, CI, Ap, Dst and CRI.
- The phase relations between compared data set periodicities are gradually changing from small periods to large ones that there are no phase relations between small periodicities and they show mixed phases. Contrary, they are completely in phase/antiphase for large periodicities.
- All detected FI periodicities, except 2048 days periodicity, are common periodicities with all other data sets used in this study. We therefore speculate that there is a link between solar and geomagnetic activity indices here used .
[46] analyzed the periodic variations of hemispheric and total solar FI data separately for the solar Cycle 24 (from 2009 to 2020) by using the same methods that we used here and periodicities of 2048, 1024, 682, 410, 293, 149, 52-62, and 27-33 days from the whole data were found. Here, we used daily data for the exact duration of cycle 24 (from December 2008 to December 2019) and found 2048, 293, 52-61 and 25-33 days periodicities from the total FI data. The 1024, 682, 410 and 149 days periodicities are also existing in the power spectrum of total FI but they are below the 95% confidence level. The differences between two analyses possible come from the data length: [46] used data from January 2009 to December 2020, while we used exactly Cycle 24 duration data (from December 2008 to December 2019). Thus we confirm most of their results and further updated the cyclic variations of solar FI for the exact duration of solar Cycle 24.
Recently, [47] investigated the cyclic behavior of solar coronal index by using Lomb-Scargle periodogram and wavelet transform for the 1939-2020 time interval and found 27.8±3.2, 161.61±21.96 day, 1.01±0.24, 2.3±0.42, 3.42±0.24 and 5.44±0.44 year periodicities. Here we analyzed CI data for only the 24th solar cycle and found periods of 2048, 178–228, 52–61, 44–45 and 25–33 days (see, Table 1). About 27–day solar rotation, 178-228 days and 5.6–year periodicities are matching with their results. Possible reasons of the differences are used different methods (Scargle vs MTM) for the analysis as well as the different length of data that they analyzed 1939-2020 time interval data, while we analyzed only Cycle 24 data.
[48] investigate the periodicities of geomagnetic Ap index and the z component of interplanetary magnetic field (IMF) by using the Lomb–Scargle periodogram and Morlet wavelet analysis methods for the time interval of 2009 January to 2013 August (ascending phase of Cycle 24). They found periodicities ∼ 26-34 days, about 44, 61, 67, 111, 129, 152, 186 and 239 days from the z component of IMF and 28-32, 41, 45, 53, 59, 123, 131 and 170 days from the Ap index data. Later, [49] investigated the periodicities of solar and geomagnetic activity parameters as well as cosmic ray intensity over the time period 1965–2018. They used sunspot number as a solar data and Bz component of IMF, geomagnetic Ap index and cosmic ray intensity as geomagnetic activity parameters. They also used Lomb-Scargle periodogram and wavelet analysis and found 28.5-day periodicity for IMF Bz, 25.3-day, 6.1 and 8.7 months, 1.3, 1.7, 2.3, 3.0, 3.6, 4.0 and 5.2 years for Ap index and 9.5-month, 1.2, 1.7, 3, 3.7 and 5 years for CRI from the Scargle period analysis. Here, we analyzed the average IMF, CRI, Ap and Dst indices and found 25-33 days solar rotation and 5.6-year periodicity for all data sets without any exception. Our results deviate from [49] findings especially for z component of IMF and CRI data sets. They found only a 28.5-day period for the IMF and 9.5-month, 1.2, 1.7, 3, 3.7 and 5 years for CRI. We found additional periods of 2048, 372-455, 292-293, 120.5 days for the average IMF and only four periods 2048, 52-61, 44-45 and 25-33 days for CRI data. Possible reasons of these differences are used different methods (Lomb–Scargle vs MTM) for the analysis, differences in data sets and the different length (1965-2018 vs 2009-2020) of data. When we compare our Morlet wavelet and MTM analysis results we may conclude that MTM results show very good agreement with wavelet results and this support accuracy of our findings.
[50] compared the Interplanetary Coronal Mass Ejection (ICME) with Dst and AE indices by using the XWT and WTC analysis methods within solar Cycle 23. They concluded that Dst and AE indices modulated by ICME during the maximum phase of solar cycle 23 and only the annual frequency component of the ICMEs is phase-locked with Dst and AE indices. Recently, [12] studied the periodic variations of the monthly FI and Ap, Dst, Scalar B, and aa geomagnetic activity indicators by using MTM, Morlet wavelet XWT and WTC analysis methods from January 1, 1975 to December 31, 2020. They concluded that FI and other parameters generally show phase mixing in the small periods (2-8 months), while all parameters are inphase and highly correlated for the 11-year solar cycle periodicity. Here, we analyzed daily data sets including/excluding some data sets (CI, CRI/aa) for only the solar Cycle 24. We found that the phase relations between compared data sets periodicities are gradually changing from small periods to large ones: There are no phase relations between small periodicities and they show strongly mixed phases, while they are completely inphase/antiphase for large periodicities. All detected FI periodicities, except 2048 days periodicity, are common periodicities with all other data sets used in this study. Thus we confirmed above findings and further conclude that there is a strong physical link between solar and used geomagnetic activity indices.
Author Contributions
All analysis performed and the draft manuscript prepared by Ali Kilcik. Atila Ozguc and Jean–Pierre Rozelot read the draft manuscript and modified it carefully.
Data Availability Statement
As mentioned in the manuscript all data sets used in this manuscript are publicly available from the corresponding web sites; FI data from https://www.ngdc.noaa.gov/stp/solar/solarflares.html., CI data from http://www.suh.sk/obs/vysl/MCI.htm., the Ap, Dst and Scalar B data from https://omniweb.gsfc.nasa.gov/form/dx1.html., and CRI data are taken from https://cosmicrays.oulu.fi/# solar, respectively.
Conflicts of Interest
The authors declare no conflict of interest.
References
- Rieger, E.; Share, G.H.; Forrest, D.J.; Kanbach, G.; Reppin, C.; Chupp, E.L. A 154-day periodicity in the occurrence of hard solar flares? nature 1984, 312, 623–625. [Google Scholar] [CrossRef]
- Bogart, R.S.; Bai, T. Confirmation of a 152 day periodicity in the occurrence of solar flares inferred from microwave data. ApJL 1985, 299, L51–L55. [Google Scholar] [CrossRef]
- Ozguc, A.; Atac, T. Periodic Behaviour of Solar Flare Index during SOLAR-CYCLE-20 and SOLAR-CYCLE-21. Solphys 1989, 123, 357–365. [Google Scholar] [CrossRef]
- Bai, T.; Cliver, E.W. A 154 Day Periodicity in the Occurrence Rate of Proton Flares. ApJ 1990, 363, 299. [Google Scholar] [CrossRef]
- Carbonell, M.; Ballester, J.L. The periodic behaviour of solar activity - The near 155-day periodicity in sunspot areas. AAP 1992, 255, 350–362. [Google Scholar]
- Bai, T. Periodicities in Solar Flare Occurrence: Analysis of Cycles 19-23. The Astrophysical Journal 2003, 591, 406–415. [Google Scholar] [CrossRef]
- Joshi, B.; Joshi, A. Intermediate-Term Periodicities in Soft X-ray Flare Index During Solar Cycles 21, 22 and 23. Solphys 2005, 226, 153–161. [Google Scholar] [CrossRef]
- Chowdhury, P.; Khan, M.; Ray, P.C. Intermediate-term periodicities in sunspot areas during solar cycles 22 and 23. MNRAS 2009, 392, 1159–1180. [Google Scholar] [CrossRef]
- Kilcik, A.; Özgüç, A.; Rozelot, J.P.; Ataç, T. Periodicities in Solar Flare Index for Cycles 21 - 23 Revisited. Solar Physics 2010, 264, 255–268. [Google Scholar] [CrossRef]
- Chowdhury, P.; Gokhale, M.H.; Singh, J.; Moon, Y.J. Mid-term quasi-periodicities in the CaII-K plage index of the Sun and their implications. APSS 2016, 361, 54. [Google Scholar] [CrossRef]
- Courtillot, V.; Lopes, F.; Le Mouël, J.L. On the Prediction of Solar Cycles. Solphys 2021, 296, 21. [Google Scholar] [CrossRef]
- Ozguc, A.; Kilcik, A.; Yurchyshyn, V. Temporal and Periodic Variations of the Solar Flare Index During the Last Four Solar Cycles and Their Association with Selected Geomagnetic-Activity Parameters. Solphys 2022, 297, 112. [Google Scholar] [CrossRef]
- Mayaud, P.N. The aa indices: A 100-year series characterizing the magnetic activity. JGR 1972, 77, 6870. [Google Scholar] [CrossRef]
- Bartels, V.J. Erdmagnetische Aktivität—V. Terrestrial Magnetism and Atmospheric Electricity (Journal of Geophysical Research) 1938, 43, 131. [Google Scholar] [CrossRef]
- Bartels, J.; Heck, N.H.; Johnston, H.F. The three-hour-range index measuring geomagnetic activity. JGR 1939, 44, 411. [Google Scholar] [CrossRef]
- Sugiura, M. Hourly values of equatorial Dst for the IGY. Ann. Int. Geophys. Yr. 1964, 35, 9. [Google Scholar]
- Snyder, C.W.; Neugebauer, M.; Rao, U.R. The Solar Wind Velocity and Its Correlation with Cosmic-Ray Variations and with Solar and Geomagnetic Activity. JGR 1963, 68, 6361. [Google Scholar] [CrossRef]
- Echer, E.; Gonzalez, W.D.; Gonzalez, A.L.C.; Prestes, A.; Vieira, L.E.A.; dal Lago, A.; Guarnieri, F.L.; Schuch, N.J. Long-term correlation between solar and geomagnetic activity. JASTP 2004, 66, 1019–1025. [Google Scholar] [CrossRef]
- Verbanac, G.; Mandea, M.; Vršnak, B.; Sentic, S. Evolution of Solar and Geomagnetic Activity Indices, and Their Relationship: 1960 - 2001. Solphys 2011, 271, 183–195. [Google Scholar] [CrossRef]
- Du, Z.L. Bimodal Structure of the Solar Cycle. ApJ 2015, 803, 15. [Google Scholar] [CrossRef]
- Kirov, B.; Asenovski, S.; Georgieva, K.; Obridko, V.N.; Maris-Muntean, G. Forecasting the sunspot maximum through an analysis of geomagnetic activity. JASTP 2018, 176, 42–50. [Google Scholar] [CrossRef]
- Sarp, V.; Kilcik, A. Solar flare and geomagnetic activity relations. TURKISH JOURNAL OF PHYSICS 2018, 42, 283–292. [Google Scholar] [CrossRef]
- Legrand, J.P.; Simon, P.A. Ten Cycles of Solar and Geomagnetic Activity. Solphys 1981, 70, 173–195. [Google Scholar] [CrossRef]
- Cadavid, A.C.; Lawrence, J.K.; McDonald, D.P.; Ruzmaikin, A. Independent Global Modes of Solar Magnetic Field Fluctuations. Solphys 2005, 226, 359–376. [Google Scholar] [CrossRef]
- Kilcik, A.; Chowdhury, P.; Sarp, V.; Yurchyshyn, V.; Donmez, B.; Rozelot, J.P.; Ozguc, A. Temporal and Periodic Variation of the MCMESI for the Last Two Solar Cycles; Comparison with the Number of Different Class X-ray Solar Flares. Solphys 2020, 295, 159. [Google Scholar] [CrossRef]
- Rybansky, M. Coronal Index of Solar Activity. I. Line 5303 A, Year 1971. Bulletin of the Astronomical Institutes of Czechoslovakia 1975, 26, 367. [Google Scholar]
- Rybanský, M.; Rušin, V.; Minarovjech, M. Coronal index of solar activity - Solar-terrestrial research. SSRv 2001, 95, 227–234. [Google Scholar] [CrossRef]
- Owens, M.J.; Forsyth, R.J. The Heliospheric Magnetic Field. Living Reviews in Solar Physics 2013, 10, 5. [Google Scholar] [CrossRef]
- Thomson, D.J. Spectrum Estimation and Harmonic Analysis. IEEE Proceedings 1982, 70, 1055–1096. [Google Scholar] [CrossRef]
- Waldenand, A.T.; Guttorp, P. (Eds.) Envelope estimation for quasi-periodic geophysical signals in noise: A multitaper approach, in Statistics in the Environmental and Earth Sciences, p:189-219; Edward Arnold: London, UK, 1992. [Google Scholar]
- Ghil, M.; Allen, M.R.; Dettinger, M.D.; Ide, K.; Kondrashov, D.; Mann, M.E.; Robertson, A.W.; Saunders, A.; Tian, Y.; Varadi, F.; et al. Advanced Spectral Methods for Climatic Time Series. Reviews of Geophysics 2002, 40, 1003. [Google Scholar] [CrossRef]
- Mufti, S.; Shah, G.N. Solar-geomagnetic activity influence on Earth’s climate. Journal of Atmospheric and Solar-Terrestrial Physics 2011, 73, 1607–1615. [Google Scholar] [CrossRef]
- Fang, K.; Gou, X.; Chen, F.; Liu, C.; Davi, N.; Li, J.; Zhao, Z.; Li, Y. Tree-ring based reconstruction of drought variability (1615-2009) in the Kongtong Mountain area, northern China. Global and Planetary Change 2012, 80, 190–197. [Google Scholar] [CrossRef]
- Kilcik, A.; Yurchyshyn, V.; Donmez, B.; Obridko, V.N.; Ozguc, A.; Rozelot, J.P. Temporal and Periodic Variations of Sunspot Counts in Flaring and Non-Flaring Active Regions. Solphys 2018, 293, 63. [Google Scholar] [CrossRef]
- Chowdhury, P.; Kilcik, A.; Yurchyshyn, V.; Obridko, V.N.; Rozelot, J.P. Analysis of the Hemispheric Sunspot Number Time Series for the Solar Cycles 18 to 24. Solphys 2019, 294, 142. [Google Scholar] [CrossRef]
- Torrence, C.; Compo, G.P. A Practical Guide to Wavelet Analysis. Bulletin of the American Meteorological Society 1998, 79, 61–78. [Google Scholar] [CrossRef]
- Guedes, M.R.G.; Pereira, E.S.; Cecatto, J.R. Wavelet analysis of CME, X-ray flare, and sunspot series. AAP 2015, 573, A64. [Google Scholar] [CrossRef]
- Oloketuyi, J.; Liu, Y.; Zhao, M. The Periodic and Temporal Behaviors of Solar X-Ray Flares in Solar Cycles 23 and 24. ApJ 2019, 874, 20. [Google Scholar] [CrossRef]
- Gouhier, T.C.; Grinsted, A.; Simko, V. R package biwavelet: Conduct Univariate and Bivariate Wavelet Analyses, 2021. (Version 0.20.21).
- Poluianov, S.; Traversi, R.; Usoskin, I. Cosmogenic production and climate contributions to nitrate record in the TALDICE Antarctic ice core. Journal of Atmospheric and Solar-Terrestrial Physics 2014, 121, 50–58. [Google Scholar] [CrossRef]
- Xiang, N.B.; Kong, D.F. What Causes the Inter-solar-cycle Variation of Total Solar Irradiance? AJ 2015, 150, 171. [Google Scholar] [CrossRef]
- Thomas, E.; Joseph, I.; Abraham, N.P. Wavelet analysis of annual rainfall over Kerala and sunspot number. New astronomy 2023, 98, 101944. [Google Scholar] [CrossRef]
- Maraun, D.; Kurths, J. Cross wavelet analysis: significance testing and pitfalls. Nonlinear Processes in Geophysics 2004, 11, 505–514. [Google Scholar] [CrossRef]
- Grinsted, A.; Moore, J.C.; Jevrejeva, S. Application of the cross wavelet transform and wavelet coherence to geophysical time series. Nonlinear Processes in Geophysics 2004, 11, 561–566. [Google Scholar] [CrossRef]
- Chang, C.; Glover, G.H. Time-frequency dynamics of resting-state brain connectivity measured with fMRI. Neuroimage 2010, 50, 81–98. [Google Scholar] [CrossRef] [PubMed]
- Ozguc, A.; Kilcik, A.; Sarp, V.; Yesilyaprak, H.; Pektas, R. Periodic Variation of Solar Flare Index for the Last Solar Cycle (Cycle 24). Advances in Astronomy 2021, 2021, 5391091. [Google Scholar] [CrossRef]
- Tang, R.; Fei, Y.; Li, C.; Liu, W.; Tian, X.; Wan, Z. Periodic Variations of Solar Corona Index during 1939–2020. Universe 2022, 8, 375. [Google Scholar] [CrossRef]
- Chowdhury, P.; Choudhary, D.P.; Gosain, S.; Moon, Y.J. Short-term periodicities in interplanetary, geomagnetic and solar phenomena during solar cycle 24. apss 2015, 356, 7–18. [Google Scholar] [CrossRef]
- Tsichla, M.; Gerontidou, M.; Mavromichalaki, H. Spectral Analysis of Solar and Geomagnetic Parameters in Relation to Cosmic-ray Intensity for the Time Period 1965 - 2018. Solphys 2019, 294, 15. [Google Scholar] [CrossRef]
- Katsavrias, C.; Hillaris, A.; Preka-Papadema, P. A wavelet based approach to Solar-Terrestrial Coupling. Advances in Space Research 2016, arXiv:physics.space-ph/1605.04005]57, 2234–2244. [Google Scholar] [CrossRef]
Figure 1.
MTM (upper panels) and Morlet wavelet (lower panels) analysis results of solar FI (left) and CI (right) panels. The white curve in the wavelet scalograms describe the COI, while dashed and dotted lines in the MTM spectrums show 95 % and 99 % confidence levels of detected periodicities.
Figure 1.
MTM (upper panels) and Morlet wavelet (lower panels) analysis results of solar FI (left) and CI (right) panels. The white curve in the wavelet scalograms describe the COI, while dashed and dotted lines in the MTM spectrums show 95 % and 99 % confidence levels of detected periodicities.
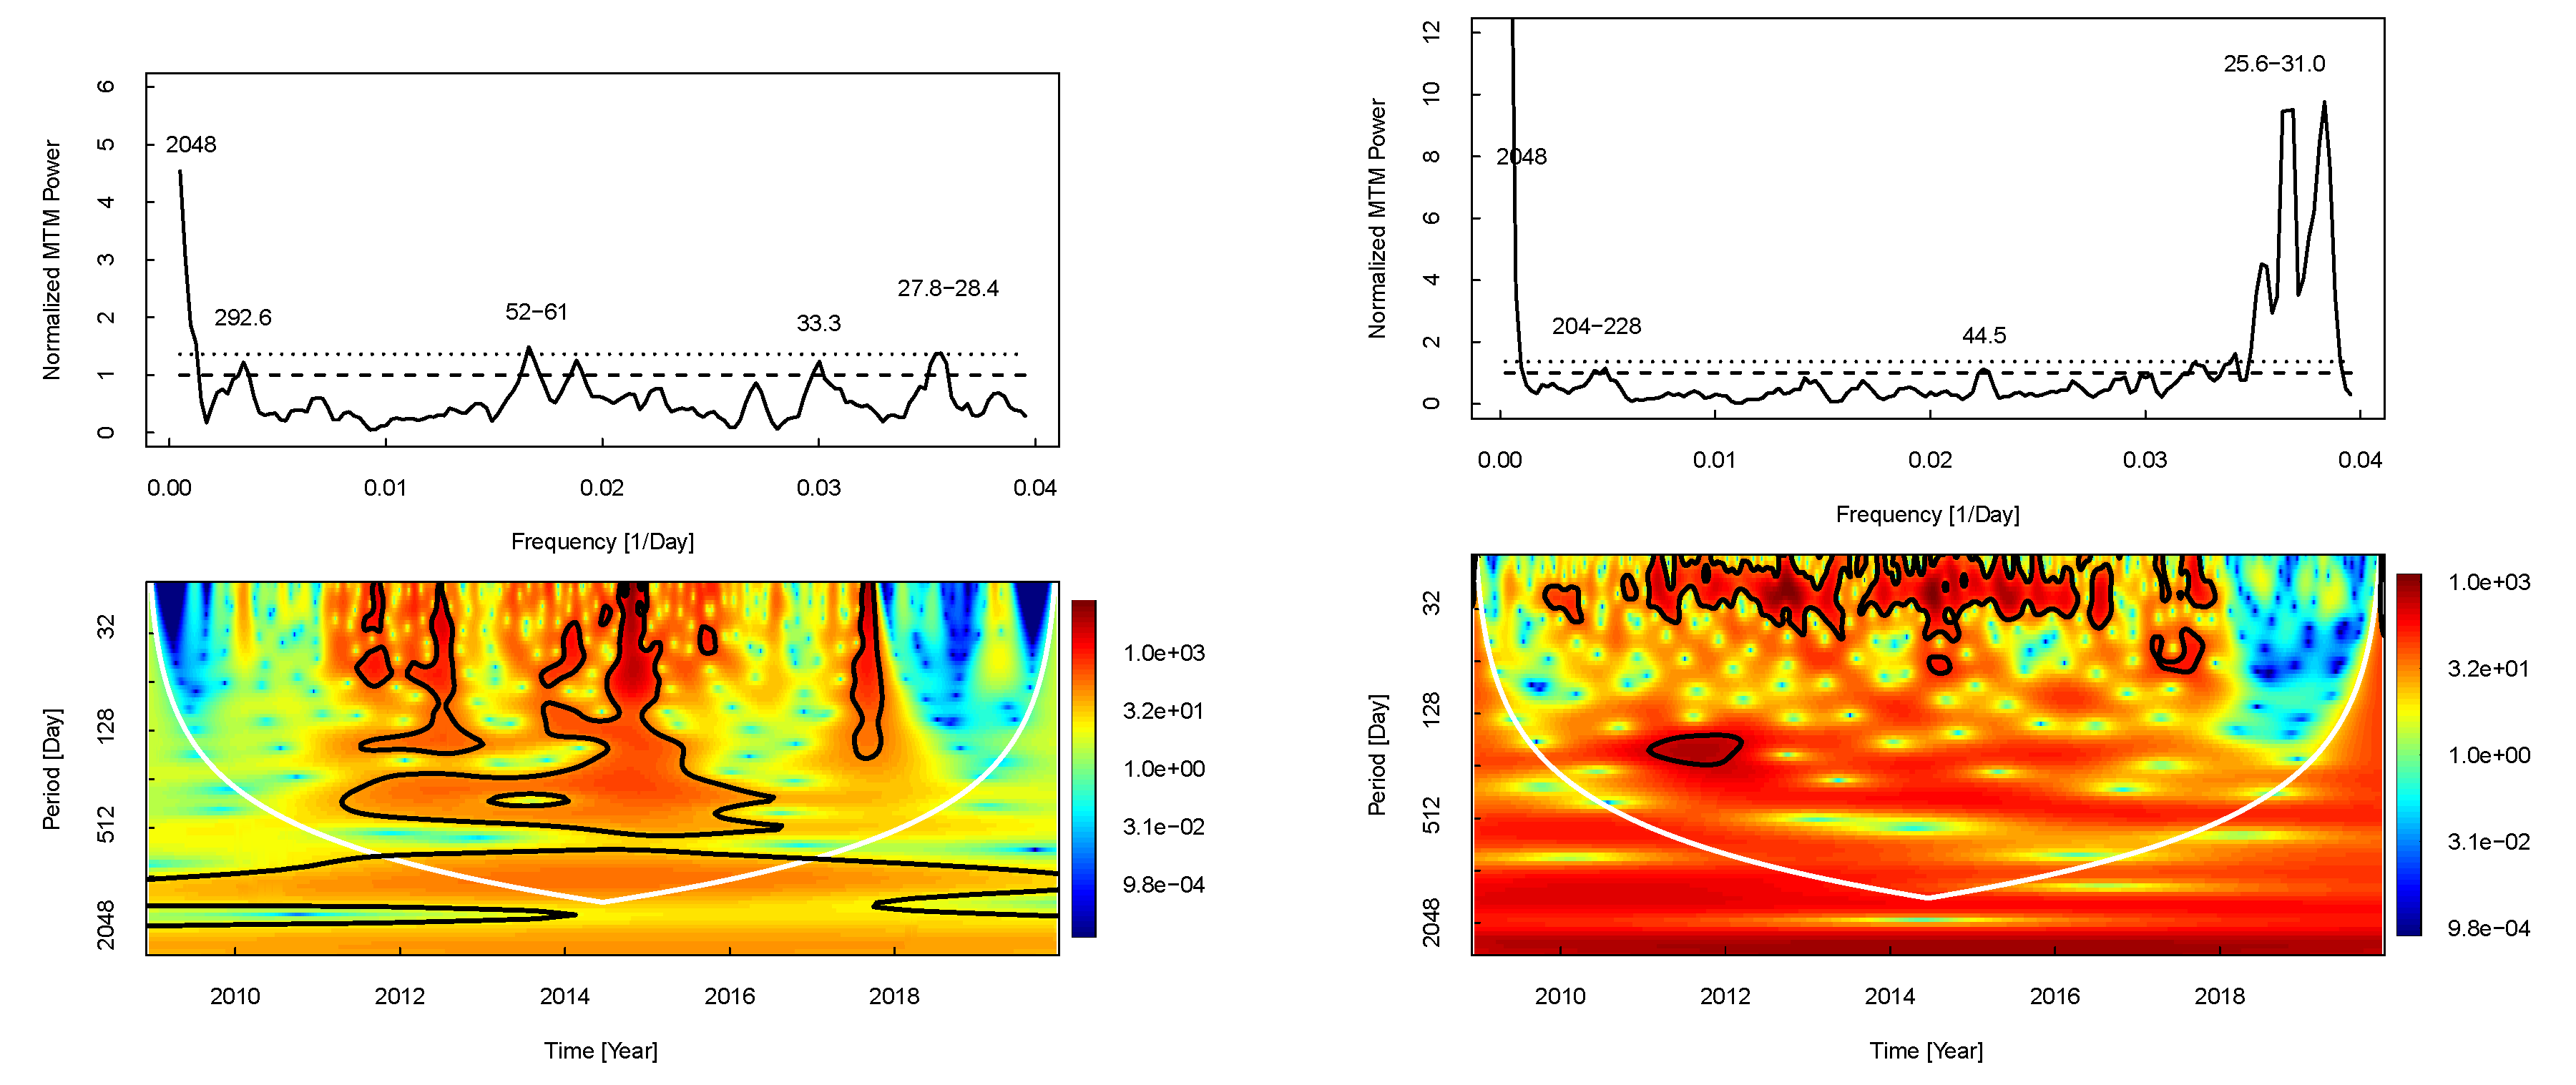
Figure 2.
The same as Figure 1 but for Ap (upper left), Dst (upper right), Scalar B (lower left) and CRI (lower right) data sets.
Figure 2.
The same as Figure 1 but for Ap (upper left), Dst (upper right), Scalar B (lower left) and CRI (lower right) data sets.
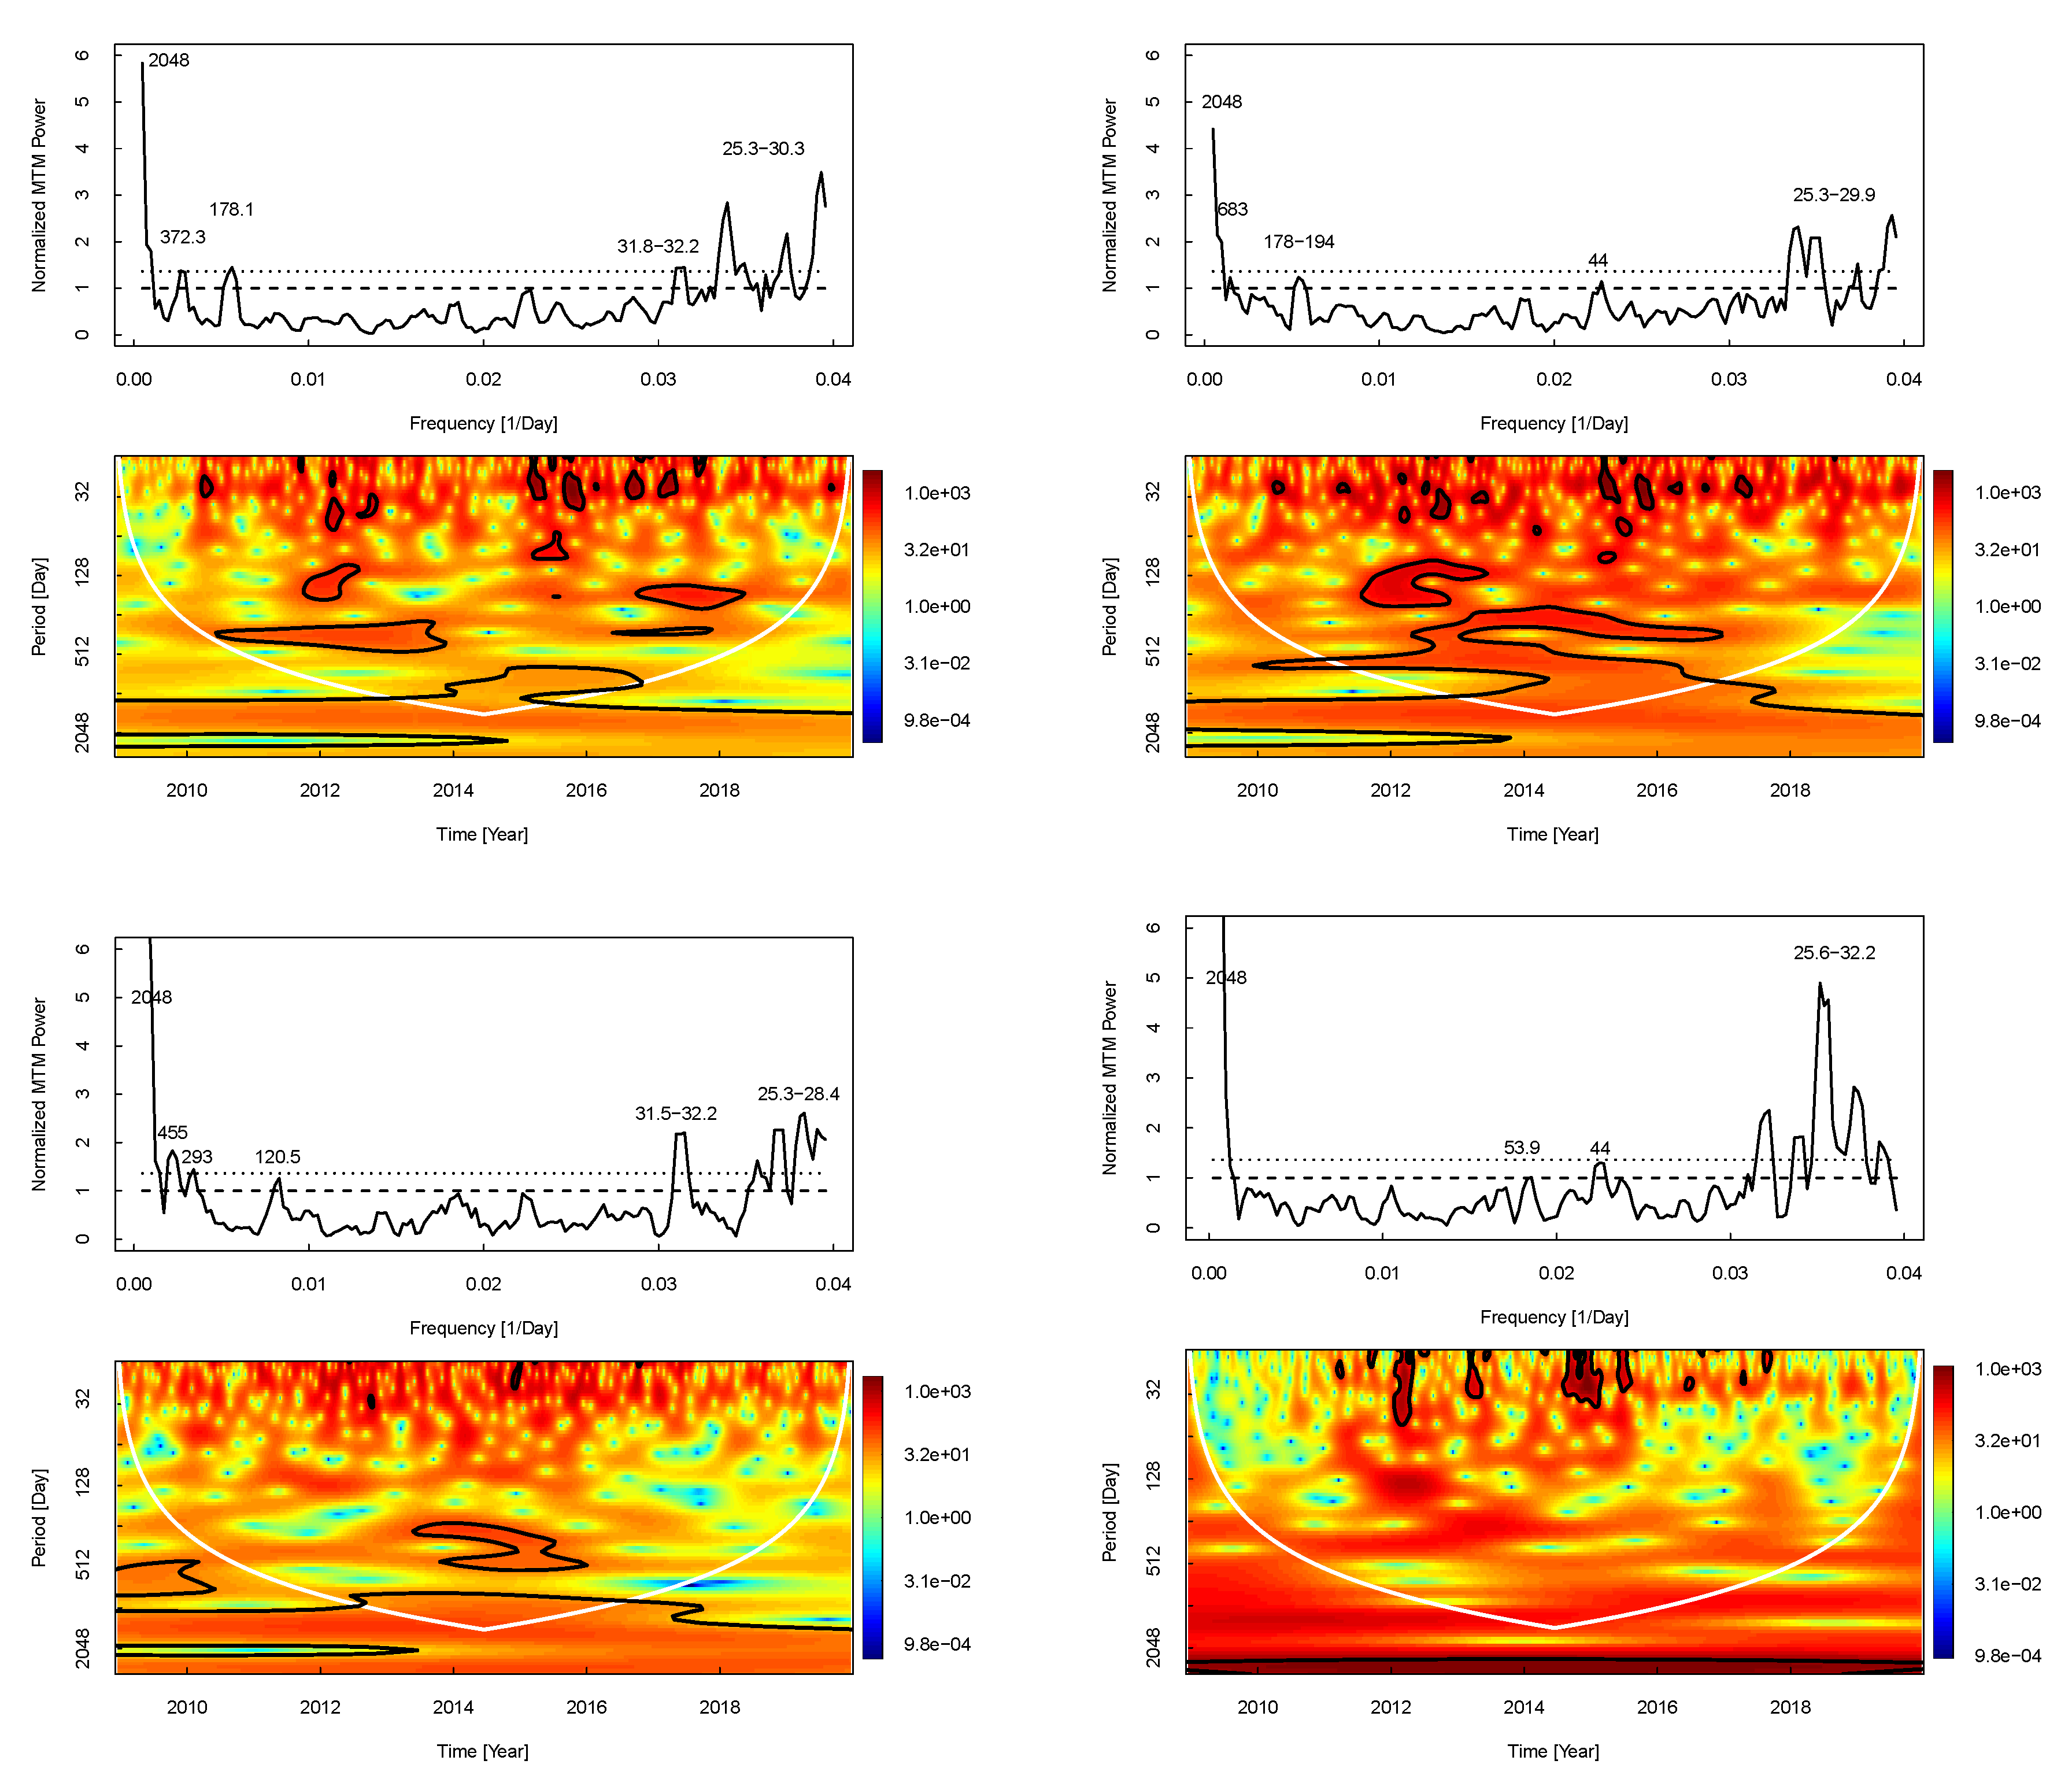
Figure 3.
XWT and WTC scalograms for FI versus all other indices used in this study. The analyses were performed with red noise approximation.
Figure 3.
XWT and WTC scalograms for FI versus all other indices used in this study. The analyses were performed with red noise approximation.
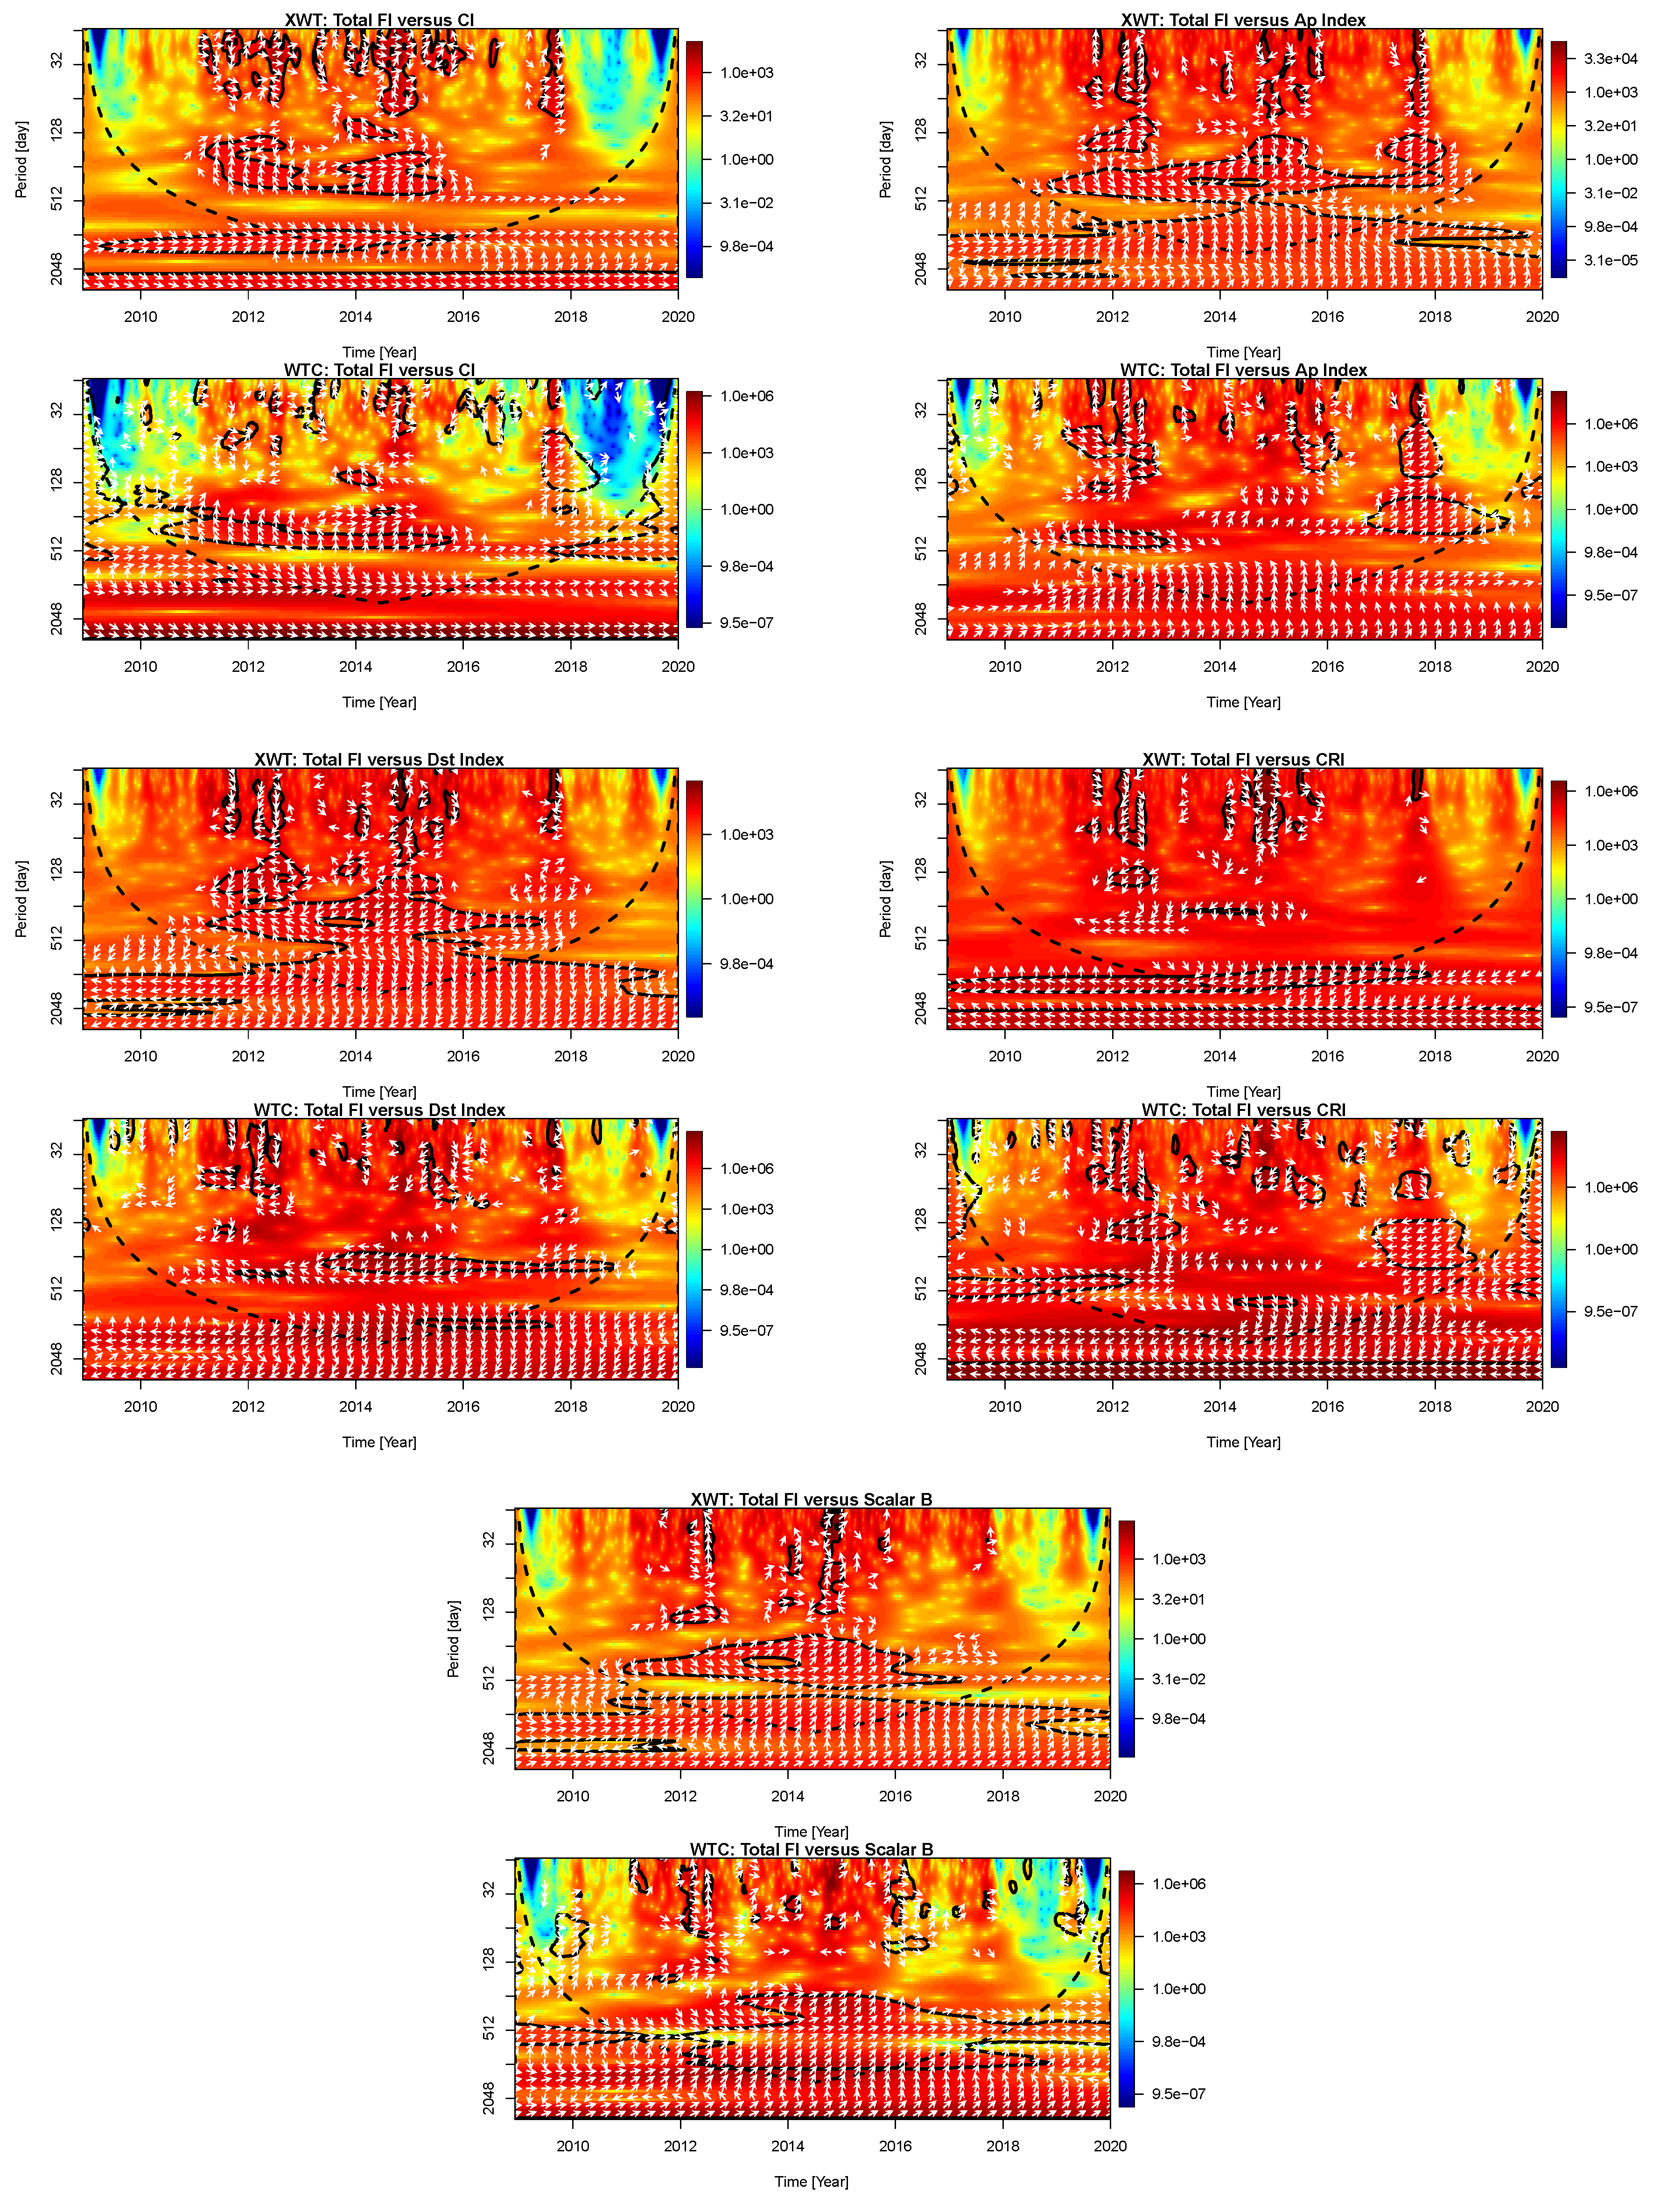

Table 1.
Detected MTM periodicities and their errors, confidence levels and existence in the analyzed data sets.
Table 1.
Detected MTM periodicities and their errors, confidence levels and existence in the analyzed data sets.
| Date Set / | FI | CI | Ap Index | Dst Index | Scalar B | CRI |
|---|---|---|---|---|---|---|
| Period [Day]/ | [nT] | [nT] | [nT] | |||
| 2048 | +> 99% | +> 99% | +> 99% | +> 99% | +> 99% | +> 99% |
| 683 | – | - | – | +> 99% | – | – |
| 372–455 | – | – | +> 95% | – | +> 99% | – |
| 292–293 | – | +> 95% | – | – | +> 95% | – |
| 178–228 | – | +> 95% | +> 95% | +> 95% | – | – |
| 120.5 | – | – | – | – | +> 95% | – |
| 52–61 | +> 95% | – | – | – | – | +> 95% |
| 44–45 | – | +> 95% | – | +> 95% | – | +> 95% |
| 25–33 | +> 99% | +> 99% | +> 99% | +> 99% | +> 99% | +> 99% |
Disclaimer/Publisher’s Note: The statements, opinions and data contained in all publications are solely those of the individual author(s) and contributor(s) and not of MDPI and/or the editor(s). MDPI and/or the editor(s) disclaim responsibility for any injury to people or property resulting from any ideas, methods, instructions or products referred to in the content. |
© 2020 by the authors. Licensee MDPI, Basel, Switzerland. This article is an open access article distributed under the terms and conditions of the Creative Commons Attribution (CC BY) license (https://creativecommons.org/licenses/by/4.0/).
Copyright: This open access article is published under a Creative Commons CC BY 4.0 license, which permit the free download, distribution, and reuse, provided that the author and preprint are cited in any reuse.


