Submitted:
30 October 2023
Posted:
31 October 2023
You are already at the latest version
Abstract
The main objective of this paper is to assess pro-environmental behavior, climate change perception, anxiety, hope and despair in different political orientations. Specific aims included to validate all the instruments; to assess whether the factor structure of the scales were valid across political orientations; to evaluate their reliability; to assess differences concerning age, gender and political orientation; to know the variables that explain pro-environment behavior; and to evaluate the moderating role of climate change perception, despair and hope in the relationship between climate change anxiety and pro-environmental behavior. Confirmatory factor analysis (CFAs), multi-group CFAs (to measurement invariance), multiple linear regressions and moderations were performed. Results showed that pro-environment behavior and climate change hope achieved the four levels of invariance across different political orientations; climate change anxiety achieved the three first levels of invariance; climate change perception and climate change despair achieved configural invariance. Climate change anxiety personal experience, climate change perception total, reality and consequences present higher values in left political orientation that in right or center. Climate change anxiety variables contribute most to explaining pro-environmental behaviors. Hope, despair and climate change perception consequences moderate de relationship between climate change anxiety and pro-environment behavior. These results open up new avenues of investigation, namely, to understand why high levels of anxiety lead to more pro-environment al behaviors.
Keywords:
climate change anxiety
; climate change despair
; climate change hope
; climate change perception
; pro-environment behavior
; political orientation
1. Introduction
1.1. Climate change
Currently, there is a broad consensus that climate change is one of the most serious threats facing humanity [1,2], implying highly marked changes such as abnormal heat and precipitation [3]. Furthermore, climate change has a major impact on animal species, natural resources, the economy, socio-political institutions and structures, cultural traditions and human health [4], undermining the emotional and psychological well-being of those who are directly or indirectly exposed to them [5].
In this way, our planet and our health are intrinsically interconnected, that is, the air we breathe, the food we eat, the resources we consume for our subsistence are factors that determine our quality of life and, consequently, our well-being [6]. The impacts recorded in the health area arising from climate change such as malnutrition, asthma, chronic respiratory diseases are increasingly frequent due, in part, to the lack of use of alternatives to personal transport such as walking or cycling [7].
According to Palinkas and Wong [8], climate change impacts mental health both directly (for example, heat stress, and exposure to extreme weather events) and indirectly (for example, economic loss, threats to health and well-being, displacement and forced migration, collective violence and civil conflict, etc) through three types of climate-related events: acute, subacute, and long lasting. The primary mental health symptoms accompanying disasters are post-traumatic stress disorder, depression, and anxiety; and vulnerable populations include women and girls, lower socioeconomic status populations and older persons [9].
1.2. Pro- Environmental Behavior
The instability of human behavior is considered one of the biggest contributors to environmental problems [10,11]. Examples of this are climate change, loss of biodiversity and pollution that cause the deterioration of our ecosystem [10-14]. Therefore, it becomes pertinent to encourage individuals to engage in a variety of pro-environmental behaviors, such as, reducing energy consumption, increasing the use of public transport and changing agricultural practices, which are seen as preponderant components to maximize positive outcomes and reduce the severity of environmental threats [10]. Thus, the ecological balance of the earth strongly depends on the pro-environmental behaviors of human beings, and it is necessary to understand the behaviors that mitigate and/or aggravate this problem [11].
The often accepted definition of pro-environmental behavior is the intentional action that can reduce the negative impact on the environment [14,15], being a concept of great interest to psychologists [16]. This includes different types of behavior such as recycling, using public transport, waste management and energy consumption. This environmental protection can be promoted indirectly through environmental citizenship behaviors and/or policy support; in this way, individuals can protect the environment through their own individual efforts such as time and energy [15].
1.3. Climate change anxiety
Climate anxiety and eco-anxiety are gaining prominence around the world as people become increasingly aware of current and future global threats associated with our planet [17-20]. A complete understanding of climate anxiety must encompass relational, psychosocial, cultural, ethical, legal, and political factors [18] and can be related to a variety of emotions, including worry [21], fear [22], anger [23], sadness, despair, guilt and shame [24] or hope [25].
Clayton [26] noted that weather-related anxiety can be an appropriate reaction to a realistic threat, or it can be excessive and disproportionate; appropriate levels of anxiety can serve as motivators, providing impetus for individuals to take action to address climate threats. However, as also observed by Hrabok et al. [27], some people may fall into helplessness and despair if they believe that their personal or collective acts are insufficient to deal with the challenge of climate change. Climate anxiety can become clinically significant when it is uncontrollable and begins to interfere with the individual's ability to sleep, work or socialize [26]; also, excessive anxiety can develop, i.e., highly disproportionate given the level of threat [27]. Participants in the Ojala study [28] described worry about climate change consistently with symptoms of clinical anxiety, including feelings of being overwhelmed [29], panic [30], rumination about negative emotions of guilt and worry [31].
1.4. Climate change perception
The question that can be asked is: Why are people all over the world not mobilizing en masse to stop climate change? A possible explanation is related to the perceptions of individuals, that is, climate change is not being considered dangerous enough to create a global public response [32]. Individual perceptions of climate change have been widely studied over the last three decades, with the literature trying to understand how perceptions of climate have contributed to a better understanding of how different individuals perceive and/or get involved to face climate change [33]. While most people agree that climate change is real [34], they may also have different beliefs about the extent to which climate change is caused by humans and what, where and when the future consequences will happen [35]. These same perceptions about climate change play a major role in the support that individuals give to climate policies and their involvement in mitigating and/or adapting to them [35].
Climate change can be perceived as negative, neutral or even positive. However, their impacts are predominantly negative [36] (O'Neill et al., 2017), as are most perceptions [37]. Perceptions considered negative in relation to climate change are, for example, increased anxiety, a feeling of threat, anguish, among others [38] (Demski et al., 2017).
1.5. Climate change hope
Although there is no consensus on how to define hope, Lazarus [39] explains that hope is an emotion related to a pattern of cognitive evaluation, in which it is expected that something desired will come true, even if the probabilities are not high, translating into a way of dealing with negative circumstances in order to find a solution.
In the study by Ojala [28], hope in relation to climate change was observed in three different ways: through strategies focused on meaning, in which individuals trusted different stakeholders, such as politicians or researchers; doing a positive reassessment, in which the problem was recognized and participants had the opportunity to change perspectives and examine positive trends in relation to climate change; and through problem-focused confrontation, in which individuals had faith in their own ability and the ability of others to do something about climate change [28]. In addition, Ojala [28] defined two dimensions of hope: “constructive hope” and “hope based on denying the severity of climate change”. Constructive hope was associated with confidence that climate change can be mitigated by collective action, thus having a positive relationship with pro-environmental behavior, political support and political commitment [40], while the second dimension of hope (denial of gravity) was positively related to doubts about climate change and negatively related to pro-environmental actions [40,41]. Therefore, hope can be positively and negatively related to climate change, depending on its characteristics.
1.6. Climate change despair
The word despair derives from the Latin term “desperare”, which means “descend from hope”. This can affect social contexts, including social support networks and communities [42], which can trigger emotional, cognitive, behavioral and even biological changes, increasing the likelihood of diseases that may result in death [43].
First of all, it must be understood that our emotions and feelings are the engines of despair, which may include sadness related to things that have never been seen before by human beings, such as species that went extinct before our time [44]. Despair can also be related to things that we know or fear that one day we will lose, for example, species and/or habitats with which we have a lot of interactions, and also things that we have to give up in our lives, such as energy based on fossil fuel and single-use plastics [44].
In addition, there are often feelings of impotence in the face of large-scale adversities, which ends up culminating in despair about what we should do in the present and what will happen in the future; this variety of feelings affects us emotionally and ends up harming our well-being [44-45]. Besides, despair in the face of an environmental crisis often leads to coping mechanisms and maladaptive factors, such as avoidance and denial [46], making it necessary to filter out a lot of information that comes to us as it becomes difficult to manage our emotions after reading article after article about the most varied environmental losses and government failures [44].
1.7. Political orientation
Sociopolitical factors have proved to be an element of great importance, since they are responsible for the convictions of climate change based on social norms, as well as cultural, religious and moral values [47]. The high levels of skepticism about climate change are largely due to an active and well-funded disinformation campaign (mainly by conservatives and fossil fuel-based industries) aimed at criticizing the scientific understanding of the problem and discrediting scientists [48]. Thus, this skepticism towards climate change also became a political issue, increasing polarization [49].
According to the literature, political conservatives tend to dismiss the catastrophic potential of climate change, refusing to attribute its cause to human activities, which undermines the much-needed mitigation effort [33,48,50]. Poortinga et al. [33] tend to value government regulations less, while liberals are more likely to tolerate or even welcome a greater government role in promoting public welfare [51]; this is corroborated in the study of Hornsey et al. [52], in Wang and Kim [53], and in Whitmarsh [54]. Consistently, research over the past two decades has reported growing associations between left-right ideology and the environment [55-58].
1.8. Relationship between pro-environmental behavior and climate change anxiety perception, hope and despair
Anxiety about climate change may be linked to constructive problem solving, making the individual alert to danger and motivated for action, finding possible solutions to anxiogenic situations, serving as a source of motivation to stimulate environmental commitment [59,60]. In the investigation of the American Psychological Association [61], people who reported experiencing eco-anxiety were twice as likely to say they are motivated to change their behavior in order to reduce their contribution to climate change compared to those who did not. In contrast, Clayton and Karazsia [17] concluded that climate anxiety was neither positively nor negatively correlated with behavior.
With regard to the perception of climate change, it is known that the more people believe that climate change is happening, the more they are willing to act [62]. A major obstacle to motivating action on climate change is the fact that, for many people, the phenomenon seems personally distant in space and time. In the study of Li et al. [63], respondents who stated that the current day was hotter than normal, believed more in global warming, expressed greater concern and had more pro-environmental behaviors, such as donating more money to institutions related to climate support.
Concerning hope in relation to climate change, constructive hope [28] was associated with confidence that climate change can be mitigated by collective action, thus having a positive relationship with pro-environmental behavior, support policy and political commitment [40]. With regard to despair in relation to climate change, feelings of impotence often arise in the face of large-scale adversities, which culminates in despair about what we should do in the present and what will happen in the future [44,45]. Desperation in the face of an environmental crisis often leads to coping mechanisms maladaptive factors such as avoidance and denial [46], causing a barrier to the adoption of pro-environmental behaviors [44].
1.9. Relationship between pro-environmental behavior and sociodemographic variables
There are some other factors that influence pro-environmental behavior, such as sociodemographic factors, institutional factors, economic factors, social and cultural factors, motivation, environmental knowledge, awareness, values, attitudes, emotion, responsibility and priorities [15]. Initially, the analysis of differences in pro-environmental behavior focused on sociodemographic factors, such as sex, age, education, marital status, place of residence and personal economic situation; in this way, women seem to be more cooperative and compassionate due, in large part, to their role as caregivers, leading to a greater concern for the environment and, consequently, to a greater adoption of pro-environmental behaviors [15].
On the other hand, individuals with higher levels of education and younger ages tend to be more concerned with the environment, being more aware of the possible damage caused by climate change and more familiar with pro-environmental behavior; the same case can be seen in the married population, which tends to pay more attention to environmental problems compared to single people, since they are more concerned with the future environmental conditions of the next generation; the same applies to individuals with a higher socioeconomic level [15].
1.10. Relationship between pro- environmental behavior and politic orientation
Ideology is a system of interconnected values that play key roles in the personal and social life of individuals, influencing their attitudes and actions over time [50]. However, this can also prevent the updating of thoughts and actions, which may be the basis for the growing skepticism towards climate change despite excessive scientific evidence [50].
Political ideology greatly influences pro-environmental behavior [64] (Casper et al., 2021). The views that individuals construct of the world, as well as their ideologies, generally solidify when individuals are in their twenties [65] (Schwartz et al., 2013), guiding their perceptions and behaviors in various contexts. Climate change has become an increasingly politicized and polarized issue, with conservatives (right) being more skeptical of climate change and less willing to act against it than liberals (left) [64].
In fact, political ideology was found to be the most robust predictor of climate change skepticism; “the saliency of political conservativism is reflective of the influence of a broad right-wing disinformation campaign that has been pushing climate change denial” [66] (p. 3). In Western Europe there is a linkage between left-right self-placement and climate attitudes and Europe non-voters are less worried about climate change than voters [67].
2. Materials and Methods
2.1. Aims
The main objective of this paper is to assess pro-environment behavior, climate change anxiety, perception, hope and despair in different political orientations. To achieve this aim, several specific aims were established: a) to validate all the scales for the Portuguese population; b) to assess whether the factor structure of the scales were valid across different political orientations through measurement invariance; c) to evaluate their reliability; d) to assess differences concerning age, gender and political orientation; e) to understand what variables explain each of the pro-environment behavior subscale; and f) to evaluate the moderating role of climate change perception, despair and hope in the relationship between climate change anxiety and pro-environment al behavior.
2.2. Procedures
This study was submitted to the XXX, having been approved. In order to carry out this study, authorization was requested from the original authors of the respective scales to be validated for the Portuguese population. Then, the instruments to be validated were translated and back-translated according to the International Test Commission (ITC) guidelines for translating and adapting tests [68] and the translation back-translation procedure [69]. One of the scales, the PEBS, was slightly modified so that the study could be extended to other age groups. The questionnaire was also applied to ten participants, with the aim of detecting possible difficulties regarding the understanding of the items, which did not happen.
An informed consent form was applied to all participants, which included the objective, as well as an explanation of the investigation procedure and confidentiality and anonymity issues. Participants volunteered for it, and could have withdrawn at any time. Taking into account that the instruments were applied in an online context, a data collection platform was used, google forms, having chosen the non - probabilistic sampling method by snowball (snowball sampling) through social networks.
2.3. Measures
2.3.1. Sociodemographic questionnaire and political question
A sociodemographic questionnaire aimed to collect information about the sample, introducing variables such as age, gender (1 – female, 0 – male), marital status (1 – single, 2 – married / de facto partner; 3 – divorced/separated), relational status (0 – I am not in a romantic relationship, 1 – I am in a romantic relationship), whether or not to have children (1 – yes, 0 – no), education (1 – less than 4th year; 2 – 4th year; 3 – 6th year; 4 – 9th year; 5 – 12th year; 6 – higher education), professional status (0 – inactive, 1 – active) and, finally, political ideology (1 – extreme left; 2 – left; 3 – center; 4 – right; 5 – extreme right).
2.3.2. Pro- Environmental behavior scale (PEBS)
The PEBS was developed by Stevenson and Peterson (2015) [70], with the aim of measuring and evaluating pro-environmental behaviors in the face of climate change. This scale consists of ten items, answered using a Likert scale of 5 points, where 1 corresponds to “never” and 5 corresponds to “always”. A higher score translates the adoption of more pro-environmental behaviors. The scale contains three subscales: “Domestic behavior” (items 1,2,3,4,5); “Information search” (items 6,7,8); and, “Transport” (items 9.10), whose internal consistency are α = 0.69, α = 0.66 and α = 0.64, respectively. This scale has a global Cronbach 's alpha of 0.74. The “Domestic behavior” subscale tries to understand how pro-environmental behavior is carried out at home (for example, “Turn off the lights at home when they are not in use”). The second factor “Information search” concerns items such as, for example, “Talking to my family about how to do something about environmental problems”. Finally, the third factor called “Transport” corresponds to two items related to the type of transport used (for example, “Walking as a means of transport”) [70].
2.3.3. Climate change anxiety scale (CCAS)
The CCAS assesses the anxiety generated by climate change. The scale was developed by Clayton and Karazsia [17] and consists of 22 items, in which participants respond using a Likert scale of 5 points, where 1 corresponds to “never” and 5 corresponds to “almost always”. In this instrument, a high score means greater anxiety about climate change. The scale contains four subscales: (1)“cognitive and emotional impairment”; (2)“behavioral commitment”; (3)“personal experience”; and, (4)“functional impairment”, whose internal consistency, ranging from good to excellent, is α = 0.97, α = 0.79, α = 0.86 and α = 0.94, respectively. This scale comprises an overall Cronbach 's alpha of 0.87. Subscale 1 (includes 8 items: items 1 to 8) concerns cognitive and emotional impairment in response to climate change, reflected in ruminations, difficulties sleeping or concentrating, nightmares or crying (for example, “I have nightmares about climate change”). Subscale 2 (includes 6 items: items 9 to 14) refers to behavioral commitment: not just commitment to sustainable behavior, but understanding the meaning of the behavioral response (eg, “I recycle.”). Subscale 3 (includes 3 items: items 15 to 17) corresponds to personal experience regarding climate change (for example, “I have been directly affected by climate change.”). Subscale 4 (includes 5 items: items 18 to 22) addresses functional impairment, in which high values in this subscale indicate that concern about climate change interferes with the person's ability to work or socialize (for example, "my friends say I think too much about climate change.”) [17].
2.3.4. Climate change perception scale (CCPS)
The CCPS was developed by Valkengoed and collaborators [35] with the aim of measuring individual perception of climate change. This scale consists of eight items, which are answered using a Likert scale of 7 points, where 1 corresponds to “strongly disagree” and 7 corresponds to “strongly agree”. Within these values, the individual will position himself in the one that best describes his posture. A high score means a greater perception of the fact that climate change is truly real, caused by humans and has negative consequences. The scale contains three subscales: “Reality” (items 1,2); “Causes” (items 3,4,5); and, “General consequences” (items 6,7,8), whose internal consistency, ranging from good to excellent, is α = 0.79, α =0.91, α = 0.86, respectively. The “Reality” subscale allows us to understand the extent to which individuals believe that climate change is, in fact, happening (for example, “ I believe that climate change is real”); this factor contains two of the eight items present in the scale. The second factor “Causes” assesses the extent to which people point to human causes versus natural causes to explain climate change (e.g., “Climate change is mostly caused by human activity”), including three items. Finally, the third factor, called “Overall consequences”, consists of three items, and aims to understand the extent to which people perceive the consequences of climate change as negative or positive (for example, “The consequences of climate change will be very serious”) [35].
2.3.5. Climate change hope scale (CCHS)
The CCHS was developed by Stevenson and Peterson [70] with the aim of understanding how participants build and maintain hope in relation to climate change (e.g. “if everyone works together, we can solve the problems caused by climate change”). This is a brief unidimensional scale composed of 8 items, which are answered using a Likert scale of 7 points, ranging from 1 corresponding to “totally disagree” and 7 corresponding to “agree”, with an additional choice of “I do not see climate change as a problem”, and participants who choose this option will be excluded from the study. There are no inverted items. A high score translates a greater hope for climate change. This instrument revealed to have an acceptable internal consistency, with a Cronbach 's alpha of 0.75 [70].
2.3.6. Climate change despair scale (CCDS)
The CCDS was developed by Stevenson and Peterson [70] with the aim of measuring despair in the face of climate change (e.g., “Climate change is such a complex problem that we will never be able to solve it”). This one-dimensional scale consists of four items to which participants respond using a Likert scale of 7 points, where 1 corresponds to “strongly disagree” and 7 corresponds to “agree”, with an additional choice 0 of “I do not see climate change as a problem”, and subjects who choose this option will be excluded from the analysis. A high score translates into a higher rate of despair about climate change. In addition, Cronbach 's alpha turned out to be lower than ideal (α = 0.59), however, it is considered acceptable by the authors for exploratory studies [70].
2.4. Data analysis
Descriptive analysis concerning sociodemographic characteristics and a question about political orientation were computed. The normality of the items’ scales were assessed by skewness (SI < 3) and kurtosis (KI < 10) suggesting non-severe violations of normality [71] (Kline, 2015).
Confirmatory factor analyses (CFAs) were carried out for Portuguese sample, to assess the adequacy of fit of the instruments. Goodness of fit for the CFA models was assessed through the root mean square error of approximation (RMSEA), the comparative and incremental fit indices (CFI and IFI, respectively), and the standardized root mean square residual (SRMR). An excellent model fit was identified when the CFI and the IFI were ≥ .95, the RMSEA ≤ 0.05, and the SRMR ≤ 0.05 [72] (Hu & Bentler, 1999). Values ≥ 0.90 for the CFI and the IFI, ≤ 0.08 for the RMSEA, and ≤ .10 for the SRMR were considered acceptable (Hooper et al., 2008). Satorra-Bentler chi-square (X2), general model significance (p), and relative chi-square (X2/df) were reported; however, X2 is very sensitive to sample size [73] (Jöreskog & Sörbom, 1993), thus, this value must be interpreted with caution.
To assess whether the factor structure of the scales were valid for their use across political orientations, multi-group CFAs were conducted: it was tested four levels of measurement invariance: configural (whether items load on the same factor across groups); metric (whether item factorial loadings are equal across groups); scalar (whether item intercepts are equal across groups) and error variance invariance (whether items measurement error are equal across groups). The progressive constrained models were assessed through the difference between pairs of nested models (△) in the RMSEA, CFI and SRMR. A change ≥ 0.01 in the CFI, ≥ 0.015 in the RMSEA, and ≥ 0.03 in the SRMR indicates a significant decrease in the model fit when assessing for measurement invariance [74](Chen, 2007).
Pearson correlations were established for continuous variables and Spearman correlations when at least one of the variables was ordinal or nominal. Correlations between 0 and 0.3 are weak, between 0.3 and 0.5 are moderate, between 0.5 and 0.7 are strong and between 0.7 and 1 are very strong either positive or negative [75] (Cohen et al., 2009). To assess the model reliability, convergent and discriminant validity, Cronbach’s alpha coefficients, composite reliability (CR, 0.70 or higher suggests good model reliability), average variance extracted (AVE, 0.50 or higher suggests adequate convergence) and square root of AVE (higher than the highest correlation with any other latent variable) were used; if AVE is less than 0.50 and CR higher than 0.60, the convergent validity of the model is adequate [76] (Fornell & Larcker, 1981).
To compare the means of two groups, the independent means t-test (assumes the normality and homoscedasticity of the distribution variable) was applied. To compare the means of more than two groups, the F-test was applied (it assumes that the variable is normally and independently distributed, with equal variances among groups). Two measures of the effect-size, Cohen’s d and eta squared were used accordingly to the level of measurement of the variables; interpretation followed [77] Cohen (1988) guidelines.
Three multiple linear regressions were carried out to assess the variables that predicted the pro-environment subscales. Also, simple moderations were performed to assess the moderating role of climate change perception, hope and despair in the relationship between climate change anxiety and pro-environment behavior. The statistical significance level was set at 0.05. Statistical analysis was performed using SPSS version 28, PROCESS and AMOS version 28.
3. Results
3.1. Sample
The sample consists of 535 participants, mostly female (n = 402; 75.1%), with a mean age of 25.73 years (SD = 10.83; minimum 18 years and maximum 87 years). 312 (58.3%) participants have not university studies and the rest has it. The sample is mostly made up of single people (n = 457; 85.4%), without children (n = 456; 85.2%) and professionally active (students and workers) (n = 495; 92.5%). Asked about their political orientation, the sample proved to be quite balanced with 163 people on the left (30.5%); 183 on the center (34.2%); and 189 on the right (35.3%).
3.2. Descriptive
Table 1 shows the descriptive analysis of the instrument items used in this study (Pro-environmental behavior scale; Climate change anxiety scale; Climate change perceptions scale; Climate change hope scale; and Climate change despair scale). Most of the items present a normal distribution, evaluated by the skewness and kurtosis values, except for some items of the Climate changes perceptions scale that are slightly above the reference values. In Pro-environmental behavior scale, the items with the higher and the lower values are, respectively, items 1 and 10; concerning Climate change anxiety scale, items 11 and 4; regarding Climate change perceptions scale, items 8 and 3; in Climate change hope scale, items 6 and 7; and for Climate change despair scale, items 2 and four (Table 1). In what concerns to reliability, all scales present values of Cronbach's alpha and values of Omega above the reference ones.
3.3. Aims: a) to validate all the scales for the Portuguese population; b) to assess whether the factor structure of the scales were valid across different political orientations through measurement invariance; c) to evaluate their reliability; d) to assess differences concerning age, gender and political orientation
3.3.1. Pro-environmental behavior scale
- a)
- A confirmatory factor analysis of the original model proposed by the authors was carried out. In Table 2, the models found are presented, being that the model with three factors, 10 items and three correlations between errors (theoretically supported) the one that presents the best fit.
- b)
- Results from measurement invariance of the PEBS across political orientation are displayed in Table 3. Configural invariance according to political orientation was confirmed during the first step of the multi-group CFAs. The small changes in the fit indices at the next steps also supported metric invariance according to political orientation. Besides, the increase in the level of measurement constraints at the subsequent steps did not present a significant deterioration of the models’ fit; also, error invariance across political orientation was achieved, providing strong evidence that the PEBS operates similarly in different political orientations (left, center, right). Most of the comparisons were below 0.01, supporting different levels of measurement equivalence between political orientations (Table 3).
- c)
- Reliability indices for the PEBS’ factors are displayed in Table 4. No differences between Cronbach's alpha (α) and McDonald's omega (ω) were observed, except for transportation choice whose McDonald's omega could not be calculated because this factor only contains two items. Besides, this factor also presents a very low value of Cronbach’s alfa. In spite of that, the PEBS is a reliable measure. Besides, composite reliability, average variance extracted (AVE), square root of AVE, mean and standard deviation were calculated (Table 4) and almost all the values were within the reference range.
- d)
- Statistically significant differences were found in relation to gender with regard to the household behavior and information seeking subscales; women present higher values than men (Table 15). Age correlates positively and significantly with household behavior (r = 0.093; p = 0.032) and information seeking (r = 0.154; p < 0.001) subscales.

Table 4.
Correlations, Cronbach’s alpha, McDonald's omega, composite reliability, average variance extracted (AVE), AVE square roots, mean and standard deviation of the Pro-environmental behavior scale (N = 535).
Table 4.
Correlations, Cronbach’s alpha, McDonald's omega, composite reliability, average variance extracted (AVE), AVE square roots, mean and standard deviation of the Pro-environmental behavior scale (N = 535).
| Pearson’s correlations | ||||||||
| 1 | 2 | 3 | α | ω | CR | AVE | Mean (SD) | |
| 1. Household behavior | 0.67 | 0.68 | 0.64 | 0.80 | 0.45 | 4.18 (0.66) | ||
| 2. Information-seeking behavior | 0.428** | 0.87 | 0.84 | 0.85 | 0.90 | 0.76 | 2.69 (1.01) | |
| 3. Transportation choice | 0.276** | 0.284** | 0.81 | 0.48 | a | 0.79 | 0.66 | 2.57 (0.92) |
Note: ** p < 0.001; α = Cronbach’s alpha; ω = McDonald's omega; CR = composite reliability; AVE = average variance extracted; bold (diagonal) = AVE square roots; SD = Standard deviation; a McDonald’s omega cannot be calculated because the number of items is less than 3.
Table 15.
Differences between genders concerning PEBS, CCAS, CCPS, CCHS and CCDS (N = 535).
| Gender | M | SD | t | df | p | d | ||
| PEBS_Household_behavior | Male | 4.06 | 0.75 | -2.234 | 198, 423 | 0.027 | 0.662 | |
| Female | 4.22 | 0.63 | ||||||
| PEBS_Information_seeking | Male | 2.42 | 1.01 | -3.512 | 533 | <0.001 | 1.003 | |
| Female | 2.77 | 1.00 | ||||||
| PEBS_Transportation_choice | Male | 2.61 | 0.97 | 0.601 | 533 | 0.548 | 0.924 | |
| Female | 2.56 | 0.91 | ||||||
| CCAS_Cognitive_emotional_impairment | Male | 1.53 | 0.54 | -2.709 | 533 | 0.007 | 0.555 | |
| Female | 1.68 | 0.56 | ||||||
| CCAS_Behavioral_engagement | Male | 3.53 | 0.64 | -4.009 | 533 | <0.001 | 0.587 | |
| Female | 3.77 | 0.57 | ||||||
| CCAS_Personal_experience_climate_change | Male | 1.05 | 0.43 | 0.150 | 533 | 0.881 | 0.406 | |
| Female | 1.05 | 0.40 | ||||||
| CCAS_Functional_Impairment | Male | 1.43 | 0.59 | -2.062 | 533 | 0.040 | 0.616 | |
| Female | 1.56 | 0.62 | ||||||
| CCPS_Total | Male | 6.3 | 0.87 | -3.177 | 177, 977 | 0.002 | 0.687 | |
| Female | 6.59 | 0.62 | ||||||
| CCPS_Reality | Male | 6.36 | 1.07 | -3.518 | 170, 909 | <0.001 | 0.809 | |
| Female | 6.71 | 0.70 | ||||||
| CCPS_Causes | Male | 6.13 | 1.06 | -2.707 | 533 | 0.007 | 0.979 | |
| Female | 6.40 | 0.95 | ||||||
| CCPS_Consequences | Male | 6.50 | 0.83 | -2.396 | 192, 759 | 0.018 | 0.718 | |
| Female | 6.69 | 0.68 | ||||||
| CCHS_Total | Male | 4.30 | 1.28 | -1.337 | 533 | 0.182 | 1.243 | |
| Female | 4.47 | 1.23 | ||||||
| CCDS_Total | Male | 3.78 | 1.49 | 1.125 | 533 | 0.261 | 1.417 | |
| Female | 3.62 | 1.39 |
M = mean; SD = standard deviation; t = t-test; df = degrees of freedom; p = p-value; d = Cohen’s d; bold = significant differences.
3.3.2. Climate change anxiety scale
- a)
- In order to validate the climate change anxiety scale for this population, a confirmatory factor analysis of the original model proposed by the authors was carried out. The models found are presented in Table 5, and the one with the best fit is the four-factor model, with 22 items, although with the establishment of six correlations between errors of the same factor and, therefore, theoretically supported.
- b)
- Results from measurement invariance of the CCAS across political orientation are displayed in Table 6. Configural invariance according to political orientation was confirmed during the first step of the multi-group CFAs. Small changes in the fit indices at the next steps also supported metric invariance according to political orientation. Besides, the increase in the level of measurement constraints at the subsequent steps did not present a significant deterioration of the models’ fit. However, error invariance across political orientation was not achieved because the comparison of the CFI between scalar and error invariance was 0.024 (above the reference values), providing evidence that the CCAS operates similarly in different political orientations (left, center, right) in configural, metric and scalar invariance (Table 6).
- c)
- Reliability indices for the CCAS’ factors are displayed in Table 7. No differences between Cronbach's alpha (α) and McDonald's omega (ω) were observed. In spite of AVE values of Cognitive emotional impairment and Behavioral engagement are below the reference values, the CCAS is a reliable measure.
- d)
- Statistically significant differences were found in relation to gender with regard to the anxiety emotional cognitive impairment, behavior engagement and functional impairment subscales; women present higher values than men (Table 15). There are statistically significant differences in the values of CCAS Personal experience climate change concerning political orientation [F(2, 532) = 3.718; p = 0.025; η2 = 0.014]: left political orientation (M = 1.11; SD = 0.43) versus center political orientation (M = 0.99; SD = 0.39) versus right political orientation (M = 1.10; SD = 0.39), being that the post hoc Tukey test showed that the comparisons statistically significant occur between left and center.
3.3.3. Climate change perception scale
- a)
- With the aim to validate the climate change perceptions scale for this population, a confirmatory factor analysis of the original model proposed by the authors was carried out. A second-order model, with three factors and eight items presents a very good fit [χ2(17) = 1.81; IFI = 0.995;TLI = 0.992; CFI = 0.995; GFI = 0.986; SRMR = 0.015; RMSEA = 0.039 (CI90% LO90 = 0.015; HI90 = 0.061); AIC = 68.78], confirming the authors’ model.
- b)
- Results from measurement invariance of the CCPS across political orientation are displayed in Table 8. Configural invariance according to political orientation was confirmed during the first step of the multi-group CFAs. However, metric, scalar and error invariance across political orientation was not achieved because the comparison of the RMSEA, CFI and SRMR between them were mostly above the reference values, providing evidence that the CCAS operates differently in different political orientations (left, center, right) (Table 8).
- c)
- Reliability indices for the CCPS’ factors are displayed in Table 9. No differences between Cronbach's alpha (α) and McDonald's omega (ω) were observed, except for reality whose McDonald's omega could not be calculated because this factor only contains two items. Besides, composite reliability, average variance extracted (AVE), square root of AVE, mean and standard deviation were calculated (Table 9) and almost all the values were within the reference range.
- d)
- Statistically significant differences were found in relation to gender with regard to the CCPS total and all subscales; women present higher values than men (Table 15). Age correlates negatively and significantly with total (r = -0.119; p = 0.006), reality (r = -0.110; p < 0.011) and causes (r = -0.134; p = 0.002) subscales. There are statistically significant differences in the values of CCPS total [F(2, 532) = 4.325; p = 0.014; η2 = 0.016]; CCPS reality [F(2, 532) = 4.018; p = 0.019; η2 = 0.015]; and CCPS consequences [F(2, 532) = 3.109; p = 0.045; η2 = 0.012] concerning political orientation. Regarding total, left political orientation (M = 6.65; SD = 0.58) versus center political orientation (M = 6.51; SD = 0.72) versus right political orientation (M = 6.43; SD = 0.75), being that the post hoc Tukey test showed that the comparisons statistically significant occur between left and right. In what concerns to reality, left political orientation (M = 6.74; SD = 0.66) versus center political orientation (M = 6.66; SD = 0.78) versus right political orientation (M = 6.50; SD = 0.96), being that the post hoc Tukey test showed that the comparisons statistically significant occur between left and right. Concerning consequences, left political orientation (M = 6.76; SD = 0.58) versus center political orientation (M = 6.62; SD = 0.79) versus right political orientation (M = 6.57; SD = 0.76), being that the post hoc Tukey test showed that the comparisons statistically significant occur between left and right.
3.3.4. Climate change hope scale
- a)
- With a view to validating the model of the authors of the climate change hope scale for our sample, a confirmatory factor analysis was carried out and a good model fit was achieved. This model is a unidimensional one, with eight items and three correlations between errors (Table 10).
- b)
- Results from measurement invariance of the CCHS across political orientation are displayed in Table 11. Configural invariance according to political orientation was confirmed during the first step of the multi-group CFAs. The small changes in the fit indices at the next steps also supported metric invariance according to political orientation. Besides, the increase in the level of measurement constraints at the subsequent steps did not present a significant deterioration of the models’ fit; also, error invariance across political orientation was achieved, providing strong evidence that the CCHS operates similarly in different political orientations (left, center, right). Most of the comparisons were below 0.01, supporting different levels of measurement equivalence between political orientations (Table 11).
- c)
- This scale presents a mean of 4.42 (SD = 1.24); Cronbach’s alpha of 0.87 and McDonald's omega of 0.87; composite reliability of 0.90, average variance extracted (AVE) of 0.52 and square root of AVE of 0.72.
- d)
- No differences were found in this scale concerning sociodemographic and political variables.
3.3.5. Climate change despair scale
- a)
- To validate the model of the authors of the climate change despair scale for our sample, a confirmatory factor analysis was carried out and a good model fit was achieved [χ2(2) = 2.26; IFI = 0.996;TLI = 0.987; CFI = 0.996; GFI = 0.996; SRMR = 0.022; RMSEA = 0.049 (CI90% LO90 = 0.000; HI90 = 0.100); AIC = 20.52], confirming the authors’ model.
- b)
- Results from measurement invariance of the CCDS across political orientation are displayed in Table 12. Configural invariance according to political orientation was confirmed during the first step of the multi-group CFAs. However, metric, scalar and error invariance across political orientation was not achieved because the comparison of the RMSEA, CFI and SRMR between them were above the reference values, providing little evidence that the CCDS operates differently in different political orientations (left, center, right) (Table 12).
- c)
- This model is a unidimensional one, with four items and one correlation between errors. This scale presents a mean of 3.66 (SD = 1.42); Cronbach’s alpha of 0.77 and McDonald's omega of 0.78; composite reliability of 0.85, average variance extracted (AVE) of 0.59 and square root of AVE of 0.77.
- d)
- No differences were found in this scale concerning sociodemographic and political variables.
3.4. Aim: e) to understand what variables explain each of the pro-environment behavior subscales
3.4.1. Correlations
All the variables under study correlate with each other in a positive and significant way, except the Climate change despair scale which only correlates significantly (albeit with weak correlations) with CCAS Cognitive emotional impairment, CCAS Functional impairment, CCPS total and CCPS Consequences. Also, CCAS Functional impairment only correlates significantly, besides CCDS, with CCPS causes and CCHS total. At last, PEBS Transportation choice does not correlate with any dimension of CCPS (Table 13).
3.4.2. Regressions
- e)
- Age and mainly anxiety behavior engagement explain, altogether, 36.4% of the outcome’s variable (household behavior) (Table 14). Age, gender, children, and anxiety behavior engagement, personal experience with climate change and functional impairment and hope explain, altogether, 39.4% of the outcome’s variable (information seeking) (Table 14). At last, marital status, children, anxiety behavior engagement and functional impairment explain, altogether, 7.6% of the outcome’s variable (transportation choice) (Table 14).
3.5. Aim: f) to evaluate the moderating role of climate change perception, despair and hope in the relationship between climate change anxiety and pro-environment al behavior
3.5.1. Moderations
- f)
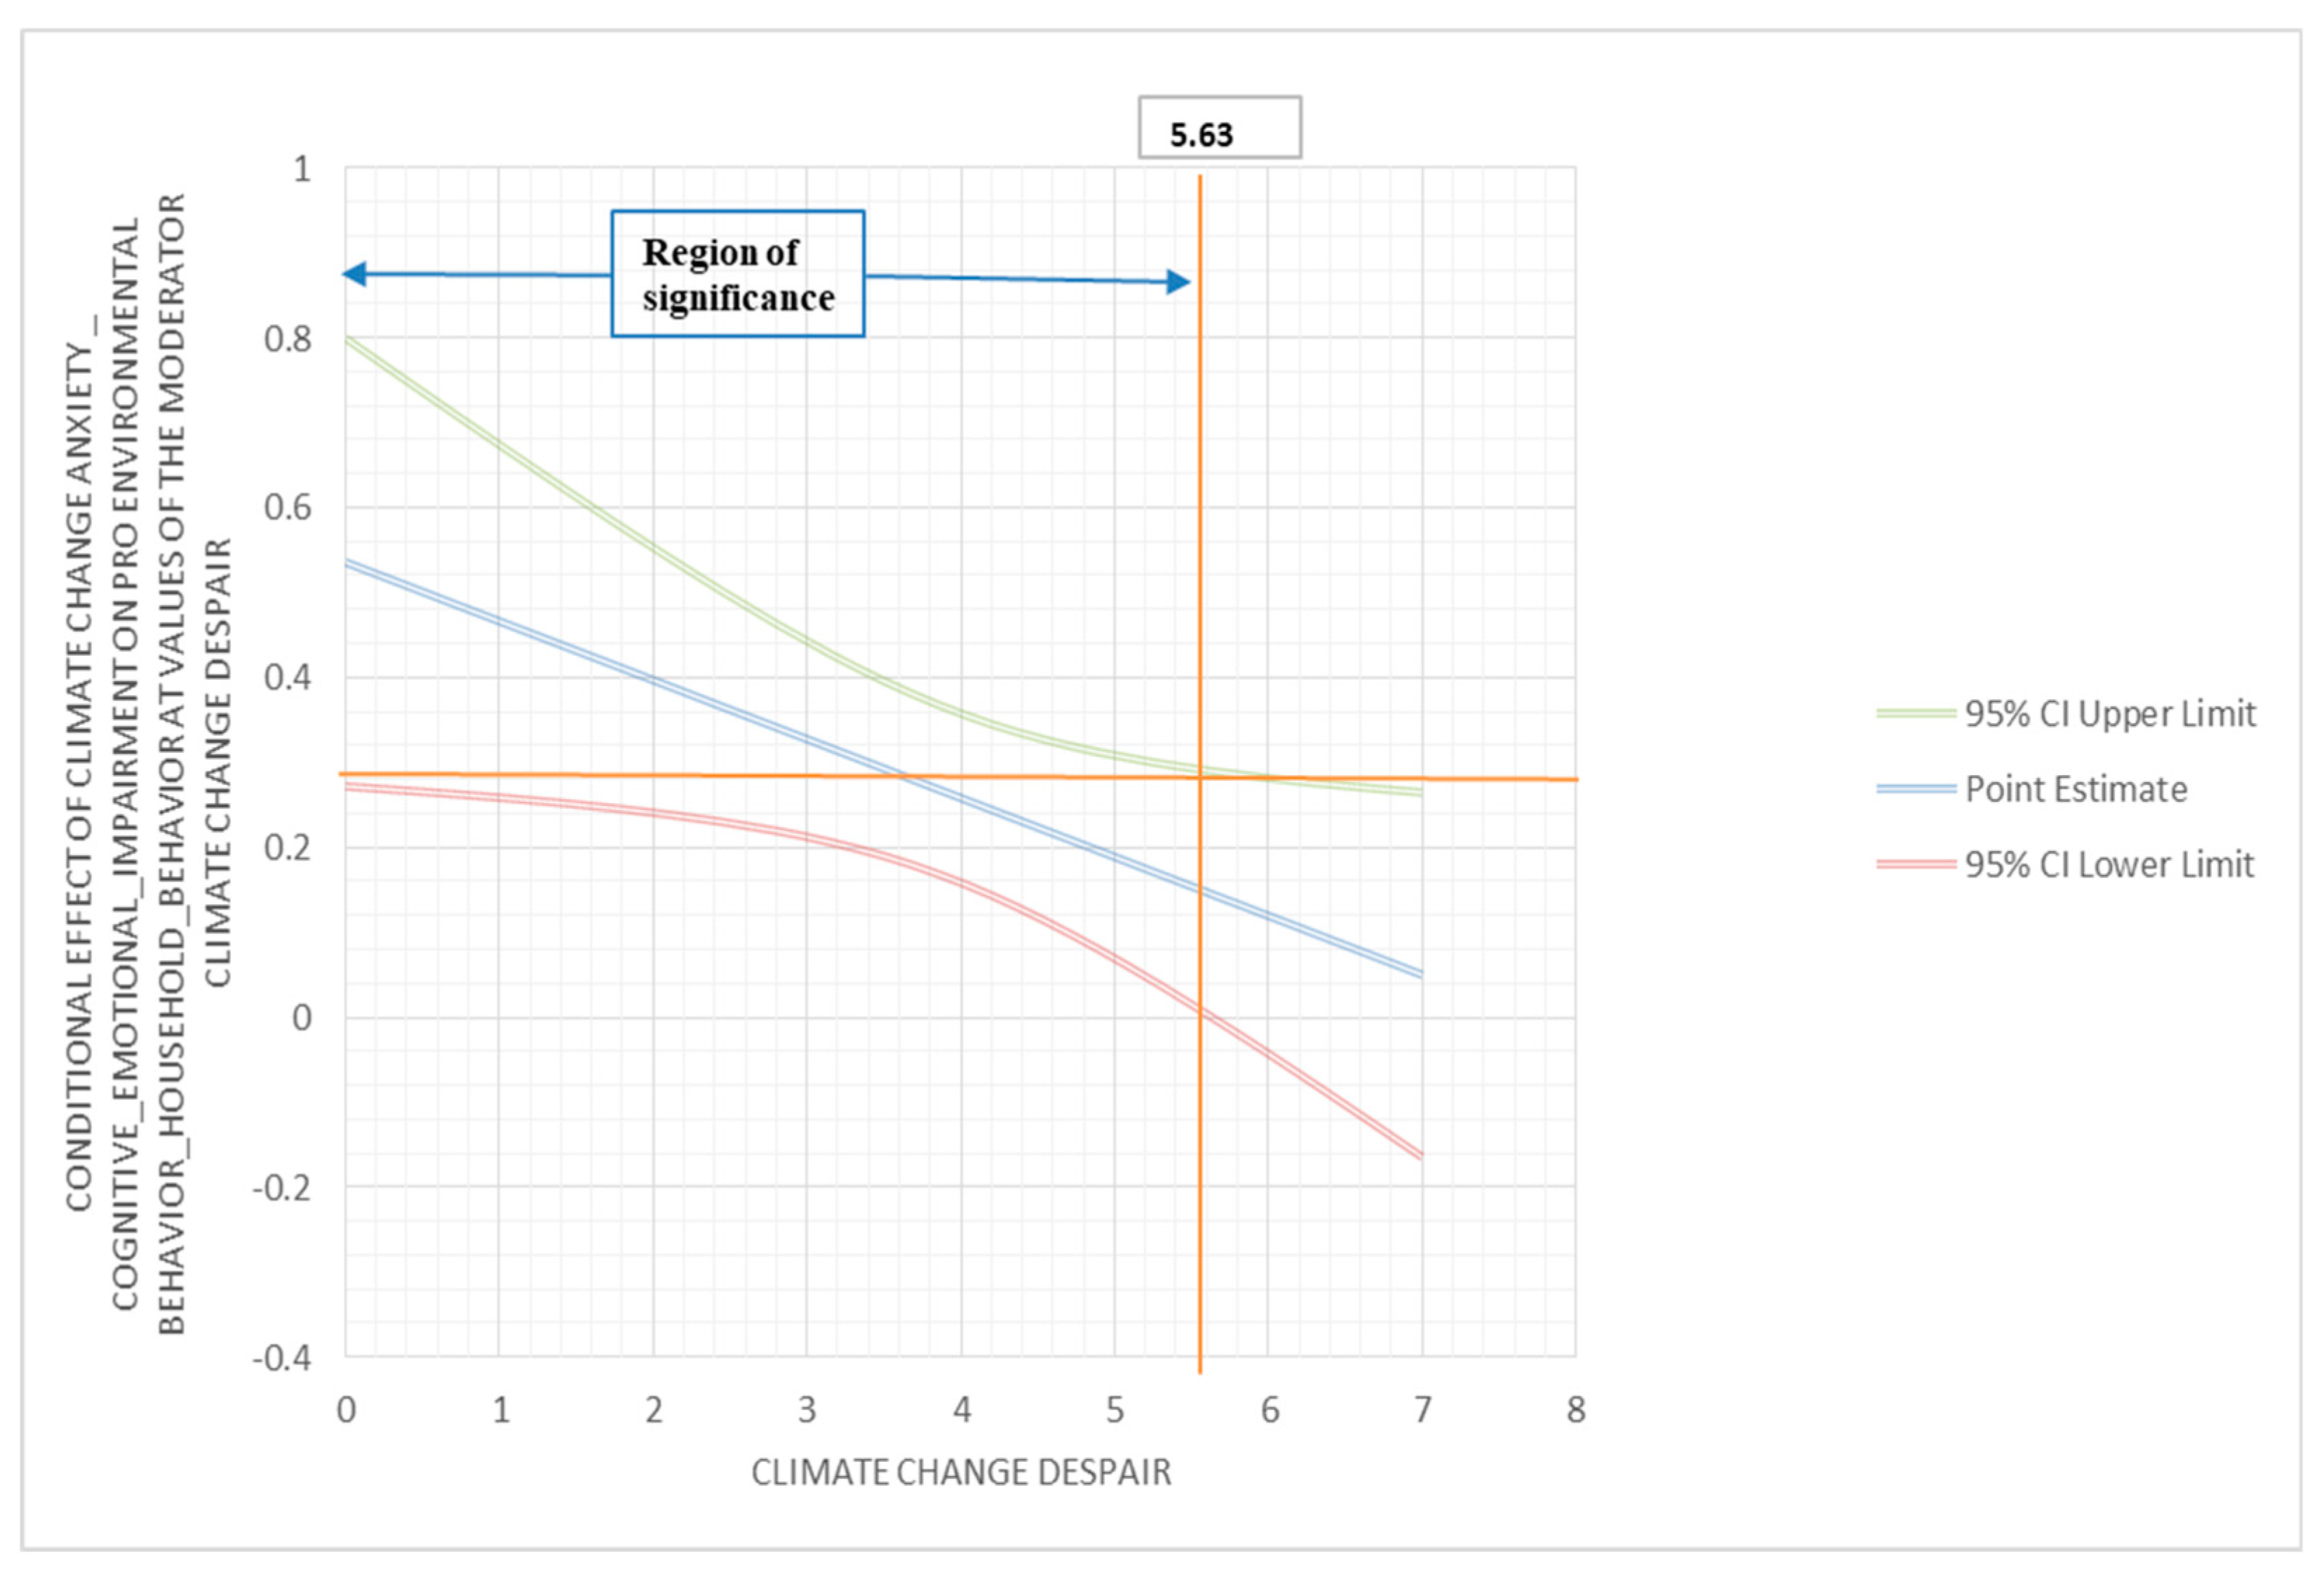
- To investigate if despair moderates the relationship between climate change anxiety (cognitive emotional impairment) and pro-environmental behavior (household behavior), a moderator analysis was performed using PROCESS. The outcome variable for analysis was pro-environmental behavior (household behavior); the predictor variable was climate change anxiety (cognitive emotional impairment); and the moderator variable was despair. The interaction between climate change anxiety (cognitive emotional impairment) and despair was found to be statistically significant [β = -0.07, 95% C.I. (-0.13, -0.01), p < .05]. The conditional effect of climate change anxiety (cognitive emotional impairment) on pro-environmental behavior (household behavior) showed corresponding results. At low moderation (2.25), the conditional effect was 0.38, 95% C.I. (0.24, 0.53), p < .001; at middle moderation (3.50), 0.29, 95% C.I. (0.19, 0.40), p < .001; at high moderation (5.25), 0.17, 95% C.I. (0.04, 0.30), p < .01. These results identify despair as a negative moderator of the relationship between climate change anxiety (cognitive emotional impairment) and pro-environmental behavior (household behavior). The Johnson-Neyman region of significance is 5.63 (below 89.91% and above 10.09%) (Figure 1).
Figure 1.
Despair as moderator of the relationship between climate change anxiety (cognitive emotional impairment) and pro environmental behavior (household behavior).
Figure 1.
Despair as moderator of the relationship between climate change anxiety (cognitive emotional impairment) and pro environmental behavior (household behavior).
To investigate if despair moderates the relationship between climate change anxiety (personal experience with climate change) and pro-environmental behavior (household behavior), a moderator analysis was performed using PROCESS. The outcome variable for analysis was pro-environmental behavior (household behavior); the predictor variable was climate change anxiety (personal experience with climate change); and the moderator variable was despair. The interaction between climate change anxiety (personal experience with climate change) and despair was found to be statistically significant [β = -0.11, 95% C.I. (-0.21, -0.02), p < .05]. The conditional effect of climate change anxiety (personal experience with climate change) on pro-environmental behavior (household behavior) showed corresponding results. At low moderation (2.25), the conditional effect was 0.59, 95% C.I. (0.40, 0.79), p < .001; at middle moderation (3.50), 0.45, 95% C.I. (0.32, 0.59), p < .001; at high moderation (5.25), 0.17, 95% C.I. (0.04, 0.30), p < .05. These results identify despair as a negative moderator of the relationship between climate change anxiety (personal experience with climate change) and pro-environmental behavior (household behavior). The Johnson-Neyman region of significance is 5.57 (below 89.91% and above 10.09%) (Figure 2).
To investigate if hope moderates the relationship between climate change anxiety (behavior engagement) and pro-environmental behavior (information seeking), a moderator analysis was performed using PROCESS. The outcome variable for analysis was pro-environmental behavior (information seeking); the predictor variable was climate change anxiety (behavior engagement); and the moderator variable was hope. The interaction between climate change anxiety (behavior engagement) and hope was found to be statistically significant [β = 0.08, 95% C.I. (0.00, 0.17), p < .05]. The conditional effect of climate change anxiety (behavior engagement) on pro-environmental behavior (information seeking) showed corresponding results. At low moderation (3.13), the conditional effect was 0.63, 95% C.I. (0.46, 0.80), p < .001; at middle moderation (4.50), 0.75, 95% C.I. (0.61, 0.89), p < .001; at high moderation (5.75), 0.85, 95% C.I. (0.67, 1.04), p < .001. These results identify hope as a positive moderator of the relationship between climate change anxiety (behavior engagement) and pro-environmental behavior (information seeking). The Johnson-Neyman region of significance is 0.02 (below 0.19% and above 99.81%) (Figure 3).
To investigate if climate change perception (consequences) moderates the relationship between climate change anxiety (behavior engagement) and pro-environmental behavior (information seeking), a moderator analysis was performed using PROCESS. The outcome variable for analysis was pro-environmental behavior (information seeking); the predictor variable was climate change anxiety (behavior engagement); and the moderator variable was change perception (consequences). The interaction between climate change anxiety (behavior engagement) and change perception (consequences) was found to be statistically significant [β = 0.21, 95% C.I. (0.08, 0.33), p < .05]. The conditional effect of climate change anxiety (behavior engagement) on pro-environmental behavior (information seeking) showed corresponding results. At low moderation (6.00), the conditional effect was 0.71, 95% C.I. (0.56, 0.81), p < .001; at middle and high moderation (7.00), 0.91, 95% C.I. (0.77, 1.06), p < .001. These results identify change perception (consequences) as a positive moderator of the relationship between climate change anxiety (behavior engagement) and pro-environmental behavior (information seeking). The Johnson-Neyman region of significance is 4.17 (below 2.24% and above 97.76%) (Figure 4).
4. Discussion
The main objective of this paper was to assess pro-environment behavior, climate change perception, anxiety, hope and despair in different political orientations. Specific aims included to validate all the instruments; to assess whether the factor structure of the scales were valid across different political orientations; to evaluate their reliability; to assess differences concerning age, gender and political orientation; to know the variables that explain each of the pro-environment behavior subscales; and to evaluate the moderating role of climate change perception, despair and hope in the relationship between climate change anxiety and pro-environmental behavior.
All validated instruments showed a good fit and good reliability, convergent and discriminant validity indicators. Regarding the pro-environment behavior scale (PEBS), it was verified that the Cronbach's alpha value for the total of our study is higher than that of the original version [70], and the Cronbach's alpha values of the subscales are also higher than that of the original version, with the exception of the transportation choice subscale. Concerning to the climate change anxiety scale (CCAS), we found that the Cronbach's alpha value of our study is higher than that of the original version [17]. The instrument, as in the original version, consists of 22 items and 4 subscales (Factor 1, Factor 2, Factor 3, Factor 4). The average, taking into account all subscales, is higher in Factor 2 and lower in Factor 4. In what concerns to the climate change hope scale (CCHS), we found that the Cronbach's alpha value of our study is higher than that of the original version [70]. The instrument, as in the original version, is composed of 8 items. With regard to the climate change perception scale (CCPS), it was also verified that the Cronbach's alpha value of the different subscales of our study is higher than that of the original version [35], with the exception of the subscale of reality. The same applies to the climate change despair scale (CCDS) with the total Cronbach's alpha value of our study being higher than that of the original version [70].
Pro-environmental behavior and climate change hope achieved the four levels of invariance across different political orientations; climate change anxiety achieved the three first levels of invariance; climate change perception and climate change despair achieved only configural invariance. Also, Wang et al. [78] developed the Psychological ownership of nature (PON) and found measurement invariance across gender, age, and political subgroups.
Also, climate change anxiety personal experience, climate change perception total, reality and consequences present higher values in left political orientation than in right or center. Poortinga and collaborators [33] found a negative association between right-wing political orientation and concern and anxiety about climate change. Previous studies have shown that political orientation can moderate the relationship between perception of climate change and anxiety derived from it [79-80]. For example, Hamilton [79] found that anxiety about the impacts of climate change increased when education levels were higher for left-wing individuals, while it decreased for those who identified as right-wing individuals. Malka et al. [81] concluded that greater knowledge about climate change was related to greater concern and anxiety among Democrats, which was not the case for Republicans. These studies indicate that individuals can filter information in a way that is aligned with their political ideology [80].
Regarding the perception of climate change and according to the System Justification Theory [82], individuals who have a right-wing political ideology tend to justify the existing social and economic system, while left-wing individuals tend to question and challenge that same system. In this way, right-wing individuals may be more likely to deny climate change since these changes may imply the need for changes in the existing economic and social system. On the other hand, left-wing individuals may be more likely to accept the reality of climate change and believe in its consequences, as they believe that changes are necessary to achieve a fairer and more equitable world [53, 56]. Exposure to information sources can also influence this relationship, with a study by Schäfer and Painter [83] stating that individuals who watch television more tend to be more skeptical about climate change, while those who read more newspapers tend to be less skeptical. This can be explained by the fact that television often presents the controversy regarding climate change with a balanced debate between supporters and skeptics, while newspapers tend to present scientific results in a more objective and factual way [83].
Climate change anxiety variables contribute most to explaining pro-environmental behaviors. Results found in other studies [59-61] concluded that anxiety about climate change may be linked to pro-environmental behaviors. For example, when individuals are more alert to danger, they are more motivated to take action, that is, climate anxiety can serve as a source of motivation to stimulate environmental commitment [61].
Besides, hope (positively), despair (negatively) and climate change perception consequences (positively) moderate de relationship between climate change anxiety and pro-environment behavior. This means that the less despair people feel about climate change, the stronger the relationship between climate change anxiety and pro-environmental behaviors. On contrary, the more hope and climate change perception people present, the stronger the relationship between climate change anxiety and pro-environmental behaviors. While hope usually motivates individuals to join sustainability-promoting groups, exhaustion experienced as hopelessness and despair can be a demotivating factor, leading to the possible worsening of climate change [84,85]. Most individuals have limited knowledge about how regimes, organizations, laws, international environmental treaties and negotiations proceed and are therefore less likely to make judgments regarding mitigation and adaptation objectives; the most common form of despair in the face of climate change is the feeling that it is impossible to make a difference by reducing greenhouse gas emissions at the individual level, often followed by the thought that it is better not to try [84].
According to the study by Pickering and Dale [86], individuals with higher levels of anxiety are more concerned with the world and, therefore, adopt pro-environmental views. Indeed, studies by Clayton [26] and Clayton and Karazsia [17] demonstrated a strong link between general anxiety levels and climate anxiety. In another recent large-scale study covering 28 countries, Ogunbode and collaborators [87] concluded that climate anxiety was positively associated with increased pro-environmental attitudes and that, in richer democratic countries, such anxiety was positively associated with engagement in pro-environmental behaviors.
Statistically significant differences were found in relation to gender with regard to the pro-environment behavior (household behavior and information seeking); to the climate change anxiety (emotional cognitive impairment, behavior engagement and functional impairment); to the climate change perception (total and all subscales): women present higher values than men in all dimensions. Psychology may offer an explanation for this gender difference in environmental behavior. Studies suggest that gender identity is an important factor in determining environmental behaviors [15, 88, 89]. Women tend to be more likely to exhibit pro-environmental behaviors because sustainability and concern for the environment are consistent with values traditionally associated with the feminine, such as care and social responsibility [90, 91], indicating that women are more exposed to social norms and cultural expectations associated with caring for and preserving the environment, which can lead to a greater adoption of pro-environmental behaviors [15, 92]. This gender difference has already been reported in several studies. A meta-analysis performed by Li et al. [15] found that women were more likely to exhibit pro-environmental behaviors compared to men. Other studies also point in the same direction, such as that by Smith et al. [88] and Xiao and McCright [89].
Age correlates positively and significantly with pro-environmen behavior (household behavior and information seeking), and climate change perception (total, reality and causes): older people tend to present more pro-environment behavior than younger, and higher climate change perception total, reality and causes. Several factors can explain this trend, and scientific evidence points to some possibilities. One of them is that older people have greater environmental awareness and social responsibility towards the environment. This can be explained by Kohlberg's Theory of Moral Development, which suggests that the highest stage of moral development is that of social responsibility, in which people recognize the importance of contributing to the well-being of society and the environment [93]. Therefore, it is possible that age is related to the level of moral development and, consequently, to environmental concern [93]. Another factor that may explain the trend towards an increase in pro-environmental behavior at older ages is social and cultural influence. Modern society has become increasingly concerned with sustainability and the preservation of the environment, and this concern may be being transmitted from generation to generation [94]. In addition, the media and environmental education also play a crucial role in shaping environmental awareness and promoting sustainable behavior [94].
This study has some limitations that must be addressed: the sample is not representative of the Portuguese population; thus, validation studies replication with a sample that meets these requirements may be considered in future studies. In addition, the investigation protocol was applied online, which means that it was not possible to clarify any doubts that might arise. Also, future studies may be conducted in person.
5. Conclusions
The main objective of this paper is to assess pro-environment behavior, climate change perception, anxiety, hope and despair in different political orientations. Confirmatory factor analysis (CFAs), multi-group CFAs, multiple linear regressions and moderations were performed. Results showed that pro-environment behavior and climate change hope achieved the four levels of invariance across different political orientations; climate change anxiety achieved the three first levels of invariance; climate change perception and climate change despair achieved only configural invariance. Also, climate change anxiety personal experience, climate change perception total, reality and consequences present higher values in left political orientation that in right or center. Climate change anxiety variables contribute most to explaining pro-environmental behaviors. Besides, hope, despair and climate change perception consequences moderate the relationship between climate change anxiety and pro-environment. These results add new data to the literature on the subject and open up new avenues of investigation, namely, to understand why high levels of anxiety lead to more pro-environmental behaviors.
Author Contributions
Conceptualization, A.L., D.L., and L.P.; methodology, A.L., D.L., and L.P.; software, A.L., D.L., and L.P.; validation, A.L., D.L., and L.P.; formal analysis, A.L., D.L., and L.P.; investigation, A.L., D.L., and L.P.; writing—original draft preparation, A.L., D.L., and L.P.; writing—review and editing, A.L..; supervision, A.L. All authors have read and agreed to the published version of the manuscript.
Funding
This research received no external funding.
Institutional Review Board Statement
The study was conducted in accordance with the Declaration of Helsinki, and approved by the Institutional Review Board of Universidade Católica Portuguesa (2023REL004 in 2022.04.10).
Informed Consent Statement
Informed consent was obtained from all subjects involved in the study. Written informed consent has been obtained from the patients to publish this paper.
Data Availability Statement
Data are available upon reasonable request.
Conflicts of Interest
The authors declare no conflict of interest.
References
- Seyboth, K. Intergovernmental panel on climate change (IPCC). Encycl Energy Nat Res Environ Econ 2013. [Google Scholar]
- Li, C.J.; Monroe, M.C. Exploring the essential psychological factors in fostering hope concerning climate change. Environmental Education Research 2019, 25, 936–954. [Google Scholar] [CrossRef]
- Tam, K.P.; Leung AK, Y.; Clayton, S. Research on climate change in social psychology publications: A systematic review. Asian Journal of Social Psychology 2021, 24, 117–143. [Google Scholar] [CrossRef]
- Stocker, T.F.; Qin, D.; Plattner, G.K.; Tignor, M.M.; Allen, S.K.; Boschung, J.; Nauels, A.; Xia, Y.; Bex, V.; Midgley, P.M. Climate Change 2013: The physical science basis. contribution of working group I to the fifth assessment report of IPCC the intergovernmental panel on climate change. 2014. [Google Scholar]
- Chen, S.; Bagrodia, R.; Pfeffer, C.C.; Meli, L.; Bonanno, G.A. Anxiety and resilience in the face of natural disasters associated with climate change: a review and methodological critique. Journal of Anxiety Disorders 2020, 76, 102297. [Google Scholar] [CrossRef]
- Watts, N.; Adger, W.N.; Ayeb-Karlsson, S.; Bai, Y.; Byass, P.; Campbell-Lendrum, D. ,.. & Costello, A. The Lancet Countdown: tracking progress on health and climate change. The Lancet 2017, 389, 1151–1164. [Google Scholar] [CrossRef]
- United Nations. Fast Facts 2022. Climate Fast Facts | United Nations.
- Palinkas, L.A.; Wong, M. Global climate change and mental health. Current Opinion in Psychology 2020, 32, 12–16. [Google Scholar] [CrossRef] [PubMed]
- Zakour, M.J. Disasters and Mental Health. In Routledge Handbook of Environmental Hazards and Society; Routledge, 2023; pp. 394–407. [Google Scholar] [CrossRef]
- Kothe, E.J.; Ling, M.; North, M.; Klas, A.; Mullan, B.A.; Novoradovskaya, L. Protection motivation theory and pro-environmental behavior: A systematic mapping review. Australian Journal of Psychology 2019, 71, 411–432. [Google Scholar] [CrossRef]
- Lange, F.; Dewitte, S. Measuring pro-environmental behavior: Review and recommendations. Journal of Environmental Psychology 2019, 63, 92–100. [Google Scholar] [CrossRef]
- Grilli, G.; Curtis, J. Encouraging pro-environmental behaviors: A review of methods and approaches. Renewable and Sustainable Energy Reviews 2021, 135, 110039. [Google Scholar] [CrossRef]
- Lange, F. Behavioral paradigms for studying pro-environmental behavior: A systematic review. Behavior Research Methods 2022, 55, 1–23. [Google Scholar] [CrossRef]
- Rosa, C.D.; Collado, S. Enhancing nature conservation and health: Changing the focus to active pro-environmental behaviors. Psychological Studies 2020, 65, 9–15. [Google Scholar] [CrossRef]
- Li, D.; Zhao, L.; Ma, S.; Shao, S.; Zhang, L. What influences an individual’s pro-environmental behavior? A literature review. Resources, Conservation and Recycling 2019, 146, 28–34. [Google Scholar] [CrossRef]
- Milfont, T.L.; Amirbagheri, K.; Hermanns, E.; Merigó; JM. Celebrating half a century of Environment and Behavior: A bibliometric review. Environment and Behavior 2019, 51, 469–501. [Google Scholar] [CrossRef]
- Clayton, S.; Karazsia, B.T. Development and validation of a measure of climate change anxiety. Journal of Environmental Psychology 2020, 69, 101434. [Google Scholar] [CrossRef]
- Hickman, C.; Marks, E.; Pihkala, P.; Clayton, S.; Lewandowski, R.E.; Mayall, E.E.; van Susteren, L. Climate anxiety in children and young people and their beliefs about government responses to climate change: a global survey. The Lancet Planetary Health 2021, 5, 863–873. [Google Scholar] [CrossRef] [PubMed]
- Pihkala, P. Anxiety and the ecological crisis: An analysis of eco-anxiety and climate anxiety. Sustainability 2020, 12, 7836. [Google Scholar] [CrossRef]
- Searle, K.; Gow, K. Do concerns about climate change lead to distress? International Journal of Climate Change Strategies and Management 2010. [Google Scholar] [CrossRef]
- Stewart, A.E. Psychometric properties of the climate change worry scale. International Journal of Environmental Research and Public Health 2021, 18, 494. [Google Scholar] [CrossRef]
- McQueen, A. The Wages of Fear? Philosophy and Climate Change 2021, 152. [Google Scholar] [CrossRef]
- Stanley, S.K.; Hogg, T.L.; Leviston, Z.; Walker, I. From anger to action: Differential impacts of eco-anxiety, eco-depression, and eco-anger on climate action and wellbeing. The Journal of Climate Change and Health 2021, 1, 100003. [Google Scholar] [CrossRef]
- Jensen, T. Ecologies of guilt in environmental rhetorics. Springer International Publishing 2019. [Google Scholar] [CrossRef]
- Ojala, M. Hope and anticipation in education for a sustainable future. Futures 2017, 94, 76–84. [Google Scholar] [CrossRef]
- Clayton, S. Climate anxiety: Psychological responses to climate change. Journal of Anxiety Disorders 2020, 74, 102263. [Google Scholar] [CrossRef] [PubMed]
- Hrabok, M.; Delorme, A.; Agyapong, V.I. Threats to mental health and well-being associated with climate change. Journal of Anxiety Disorders 2020, 76, 102295. [Google Scholar] [CrossRef] [PubMed]
- Ojala, M. Hope and climate change: The importance of hope for environmental engagement among young people. Environmental Education Research 2012, 18, 625–642. [Google Scholar] [CrossRef]
- Anghelcev, G.; Chung, M.Y.; Sar, S.; Duff, B.R. A ZMET-based analysis of perceptions of climate change among young South Koreans: Implications for social marketing communication. Journal of Social Marketing 2015. [Google Scholar] [CrossRef]
- Hoggett, P.; Randall, R. Engaging with climate change: Comparing the cultures of science and activism. Environmental Values 2018, 27, 223–243. [Google Scholar] [CrossRef]
- Ojala, M. Regulating Worry, Promoting Hope: How Do Children, Adolescents, and Young Adults Cope with Climate Change? International Journal of Environmental and Science Education 2012, 7, 537–561. [Google Scholar]
- Smith, E.K.; Mayer, A. A social trap for the climate? Collective action, trust and climate change risk perception in 35 countries. Global Environmental Change 2018, 49, 140–153. [Google Scholar] [CrossRef]
- Poortinga, W.; Whitmarsh, L.; Steg, L.; Böhm, G.; Fisher, S. Climate change perceptions and their individual-level determinants: A cross-European analysis. Global Environmental Change 2019, 55, 25–35. [Google Scholar] [CrossRef]
- Steg, L. Limiting climate change requires research on climate action. Nature Climate Change 2018, 8, 759–761. [Google Scholar] [CrossRef]
- Valkengoed, A.M.; Steg, L.; Perlaviciute, G. Development and validation of a climate change perceptions scale. Journal of Environmental Psychology 2021, 76, 101652. [Google Scholar] [CrossRef]
- O’Neill, O. Intelligent accountability in education. In The Public Understanding of Assessment; Routledge, 2017; pp. 14–26. [Google Scholar] [CrossRef]
- Steentjes, K. , Pidgeon, N. F., Poortinga, W., Corner, A. J., Arnold, A., Böhm, G.,.. & Tvinnereim, E. (2017). European Perceptions of Climate Change (EPCC): Topline findings of a survey conducted in four European countries in 2016. http://orca.cf.ac.uk/98660/7/EPCC.pdf.
- Demski, C.; Capstick, S.; Pidgeon, N.; Sposato, R.G.; Spence, A. Experience of extreme weather affects climate change mitigation and adaptation responses. Climatic Change 2017, 140, 149–164. [Google Scholar] [CrossRef] [PubMed]
- Lazarus, R.S. (1991). Emotion and adaptation. Oxford University Press.
- Ojala, M. Hope in the face of climate change: Associations with environmental engagement and student perceptions of teachers’ emotion communication style and future orientation. The Journal of Environmental Education 2015, 46, 133–148. [Google Scholar] [CrossRef]
- Marlon, J.R.; Bloodhart, B.; Ballew, M.T.; Rolfe-Redding, J.; Roser-Renouf, C.; Leiserowitz, A.; Maibach, E. How hope and doubt affect climate change mobilization. Frontiers in Communication 2019, 20. [Google Scholar] [CrossRef]
- Shanahan, L.; Hill, S.N.; Gaydosh, L.M.; Steinhoff, A.; Costello, E.J.; Dodge, K.A.; Copeland, W.E. Does despair really kill? A roadmap for an evidence-based answer. American Journal of Public Health 2019, 109, 854–858. [Google Scholar] [CrossRef]
- Brignone, E.; George, D.R.; Sinoway, L.; Katz, C.; Sauder, C.; Murray, A.; Kraschnewski, J.L. Trends in the diagnosis of diseases of despair in the United States, 2009–2018: a retrospective cohort study. BMJ Open 2020, 10. [Google Scholar] [CrossRef]
- Wallace, R.L.; Greenburg, J.; Clark, S.G. Confronting anxiety and despair in environmental studies and sciences: an analysis and guide for students and faculty. Journal of Environmental Studies and Sciences 2020, 10, 148–155. [Google Scholar] [CrossRef]
- Gilford, D.; Moser, S.; DePodwin, B.; Moulton, R.; Watson, S. The emotional toll of climate change on science professionals. Eos 100 2019. [Google Scholar] [CrossRef]
- Hoggett, P. (Ed.) . Climate psychology: On indifference to disaster 2019. Springer.
- Clayton, S.; Devine-Wright, P.; Stern, P.C.; Whitmarsh, L.; Carrico, A.; Steg, L.; Bonnes, M. Psychological research and global climate change. Nature Climate Change 2015, 5, 640–646. [Google Scholar] [CrossRef]
- Haltinner, K.; Sarathchandra, D. Climate change skepticism as a psychological coping strategy. Sociology Compass 2018, 12. [Google Scholar] [CrossRef]
- Egan, P.J.; Mullin, M. Climate change: US public opinion. Annual Review of Political Science 2017, 20, 209–227. [Google Scholar] [CrossRef]
- Chu, H.; Yang, J.Z. Taking climate change here and now–mitigating ideological polarization with psychological distance. Global Environmental Change 2018, 53, 174–181. [Google Scholar] [CrossRef]
- Zhou, M. Public environmental skepticism: A cross-national and multilevel analysis. International Sociology 2015, 30, 61–85. [Google Scholar] [CrossRef]
- Hornsey, M.J.; Harris, E.A.; Bain, P.G.; Fielding, K.S. Meta-analyses of the determinants and outcomes of belief in climate change. Nature Climate Change 2016, 6, 622–626. [Google Scholar] [CrossRef]
- Wang, J.; Kim, S. Analysis of the impact of values and perception on climate change skepticism and its implication for public policy. Climate 2018, 6, 99. [Google Scholar] [CrossRef]
- Whitmarsh, L. Scepticism and uncertainty about climate change: Dimensions, determinants and change over time. Global Environmental Change 2011, 21, 690–700. [Google Scholar] [CrossRef]
- Campbell, T.H.; Kay, A.C. Solution aversion: On the relation between ideology and motivated disbelief. Journal of Personality and Social Psychology 2014, 107, 809. [Google Scholar] [CrossRef]
- McCright, A.M.; Marquart-Pyatt, S.T.; Shwom, R.L.; Brechin, S.R.; Allen, S. Ideology, capitalism, and climate: Explaining public views about climate change in the United States. Energy Research & Social Science 2016, 21, 180–189. [Google Scholar] [CrossRef]
- McCright, A.M.; Xiao, C.; Dunlap, R.E. Polítical polarization on support for government spending on environmental protection in the USA, 1974–2012. Social Science Research 2014, 48, 251–260. [Google Scholar] [CrossRef]
- Schuldt, J.P.; Konrath, S.H.; Schwarz, N. “Global warming” or “climate change”? Whether the planet is warming depends on question wording. Public opinion quarterly 2011, 75, 115–124. [Google Scholar] [CrossRef]
- Barlow, D.H.; Durand, V.M.; Hofmann, S.G. Abnormal psychology: An integrative approach. Cengage Learning 2019. [Google Scholar]
- Tallis, F.; Davey GC, L.; Capuzzo, N. The phenomenology of non-pathological worry: A preliminary investigation. In Worrying: Perspectives on theory, assessment and treatment; Davey & Tallis F. (Eds.); John Wiley & Sons, 1994; pp. 61–89. [Google Scholar]
- 61. American Psychological Association. Majority of US adults believe climate change is most important issue today. American Psychological Association Website, 2020.
- Visschers, V.H. Public perception of uncertainties within climate change science. Risk Analysis 2018, 38, 43–55. [Google Scholar] [CrossRef]
- Li, Y.; Johnson, E.J.; Zaval, L. Local warming: Daily temperature deviations affect both beliefs and concern about climate change. Psychological Science 2011, 22, 454–459. [Google Scholar] [CrossRef]
- Casper, J.M.; McCullough, B.P.; Smith DM, K. Pro-environmental sustainability and political affiliation: an examination of USA college sport sustainability efforts. International Journal of Environmental Research and Public Health 2021, 18, 5840. [Google Scholar] [CrossRef]
- Swartz, D.L. Symbolic power, politics, and intellectuals: The political sociology of Pierre Bourdieu. University of Chicago Press 2013. [Google Scholar]
- Grindal, M.; Sarathchandra, D.; Haltinner, K. White Identity and Climate Change Skepticism: Assessing the Mediating Roles of Social Dominance Orientation and Conspiratorial Ideation. Climate 2023, 11, 26. [Google Scholar] [CrossRef]
- Fisher, S.D.; Kenny, J.; Poortinga, W.; Böhm, G.; Steg, L. The politicization of climate change attitudes in Europe. Electoral Studies 2022, 79, 102499. [Google Scholar] [CrossRef]
- Gregoire, J. ITC guidelines for translating and adapting tests. International Journal of Testing 2018, 18, 101–134. [Google Scholar] [CrossRef]
- Brislin, R.W. Cross-cultural research methods: Strategies, problems, applications. Environment and Culture 1980, 47–82. [Google Scholar] [CrossRef]
- Stevenson, K. , & Peterson, N. Motivating action through fostering climate change hope and concern and avoiding despair among adolescents. Sustainability 2015, 8, 6. [Google Scholar] [CrossRef]
- Kline, R.B. The mediation myth. Basic and Applied Social Psychology 2015, 37, 202–213. [Google Scholar] [CrossRef]
- Hu, L.T.; Bentler, P.M. Cutoff Criteria for Fit Indexes in Covariance Structure Analysis: Conventional Criteria versus New Alternatives. Structural Equation Modeling 1999, 6, 1–55. [Google Scholar] [CrossRef]
- Jöreskog, K. G., & Sörbom, D. LISREL 8: Structural equation modeling with the SIMPLIS command language. Scientific software international. 1993.
- Chen, F.F. Sensitivity of goodness of fit indexes to lack of measurement invariance. Structural equation modeling: a multidisciplinary journal 2007, 14, 464–504. [Google Scholar] [CrossRef]
- Cohen, I.; Huang, Y.; Chen, J.; Benesty, J.; Benesty, J.; Chen, J.; Cohen, I. Pearson correlation coefficient. Noise reduction in speech processing 2009, 1–4. [Google Scholar] [CrossRef]
- Fornell, C.; Larcker, D.F. Structural equation models with unobservable variables and measurement error: Algebra and statistics. 1981. [Google Scholar]
- Cohen, J. Statistical power analysis for the behavioral sciences; Second Edition; Lawrence Erlbaum Associates: Hillsdale, NJ, 1988. [Google Scholar]
- Wang, X. , Fielding, K. S., & Dean, A. J. “Nature is mine/ours”: Measuring individual and collective psychological ownership of nature. Journal of Environmental Psychology 2023, 85, 101919. [Google Scholar] [CrossRef]
- Hamilton, L.C. Education, politics and opinions about climate change evidence for interaction effects. Climatic Change 2011, 104, 231–242. [Google Scholar] [CrossRef]
- McCright, A.M. Political orientation moderates Americans’ beliefs and concern about climate change: An editorial comment. Climatic Change 2011, 104, 243–253. [Google Scholar] [CrossRef]
- Malka, A.; Krosnick, J.A.; Langer, G. The association of knowledge with concern about global warming: Trusted information sources shape public thinking. Risk Analysis: An International Journal 2009, 29, 633–647. [Google Scholar] [CrossRef] [PubMed]
- Jost, J.T.; Banaji, M.R. The role of stereotyping in system-justification and the production of false consciousness. British Journal of Social Psychology 1994, 33, 1–27. [Google Scholar] [CrossRef]
- Schäfer, M.S.; Painter, J. Climate journalism in a changing media ecosystem: Assessing the production of climate change-related news around the world. Wiley Interdisciplinary Reviews: Climate Change 2021, 12. [Google Scholar] [CrossRef]
- McKinnon, C. Climate change: Against despair. Ethics & the Environment 2014, 19, 31–48. [CrossRef]
- Nairn, K. Learning from young people engaged in climate activism: The potential of collectivizing despair and hope. Young 2020, 27, 435–450. [Google Scholar] [CrossRef]
- Pickering, G.J.; Dale, G. Trait anxiety predicts pro-environmental values and climate change action. Personality and Individual Differences 2023, 205, 112101. [Google Scholar] [CrossRef]
- Ogunbode, C.A.; Doran, R.; Hanss, D.; Ojala, M.; Salmela-Aro, K.; van den Broek, K.L.; Martinez-Buelvas, L. Climate anxiety, pro-environmental action and wellbeing: antecedents and outcomes of negative emotional responses to climate change in 28 countries. Journal of Environmental Psychology 2022, 84, 1. [Google Scholar] [CrossRef]
- Smith Jr, W.J.; Liu, Z.; Safi, A.S.; Chief, K. Climate change perception, observation and policy support in rural Nevada: A comparative analysis of Native Americans, non-native ranchers and farmers and mainstream America. Environmental Science & Policy 2014, 42, 101–122. [Google Scholar] [CrossRef]
- Xiao, C.; McCright, A.M. Gender differences in environmental concern: Revisiting the institutional trust hypothesis in the USA. Environment and Behavior 2015, 47, 17–37. [Google Scholar] [CrossRef]
- Bloodhart, B.; Swim, J.K. Sustainability and consumption: what's gender got to do with it? Journal of Social Issues 2020, 76, 101–113. [Google Scholar] [CrossRef]
- Vicente-Molina, M.A.; Fernández-Sainz, A.; Izagirre-Olaizola, J. Does gender make a difference in pro-environmental behavior? The case of the Basque Country University students. Journal of Cleaner Production 2018, 176, 89–98. [Google Scholar] [CrossRef]
- Muralidharan, S.; Sheehan, K. The role of guilt in influencing sustainable pro-environmental behaviors among shoppers: Differences in response by gender to messaging about England's plastic-bag levy. Journal of Advertising Research 2018, 58, 349–362. [Google Scholar] [CrossRef]
- Kohlberg, L.; Gilligan, C. Moral development. Psychology: Revisiting the Classic Studies.
- Corner, A.; Roberts, O.; Chiari, S.; Völler, S.; Mayrhuber, E.S.; Mandl, S.; Monson, K. How do young people engage with climate change? The role of knowledge, values, message framing, and trusted communicators. Wiley Interdisciplinary Reviews: Climate Change 2015, 6, 523–534. [Google Scholar] [CrossRef]
Figure 2.
Despair as moderator of the relationship between climate change anxiety (per sonal experience with climate change) and pro environmental behavior (household behavior).
Figure 2.
Despair as moderator of the relationship between climate change anxiety (per sonal experience with climate change) and pro environmental behavior (household behavior).
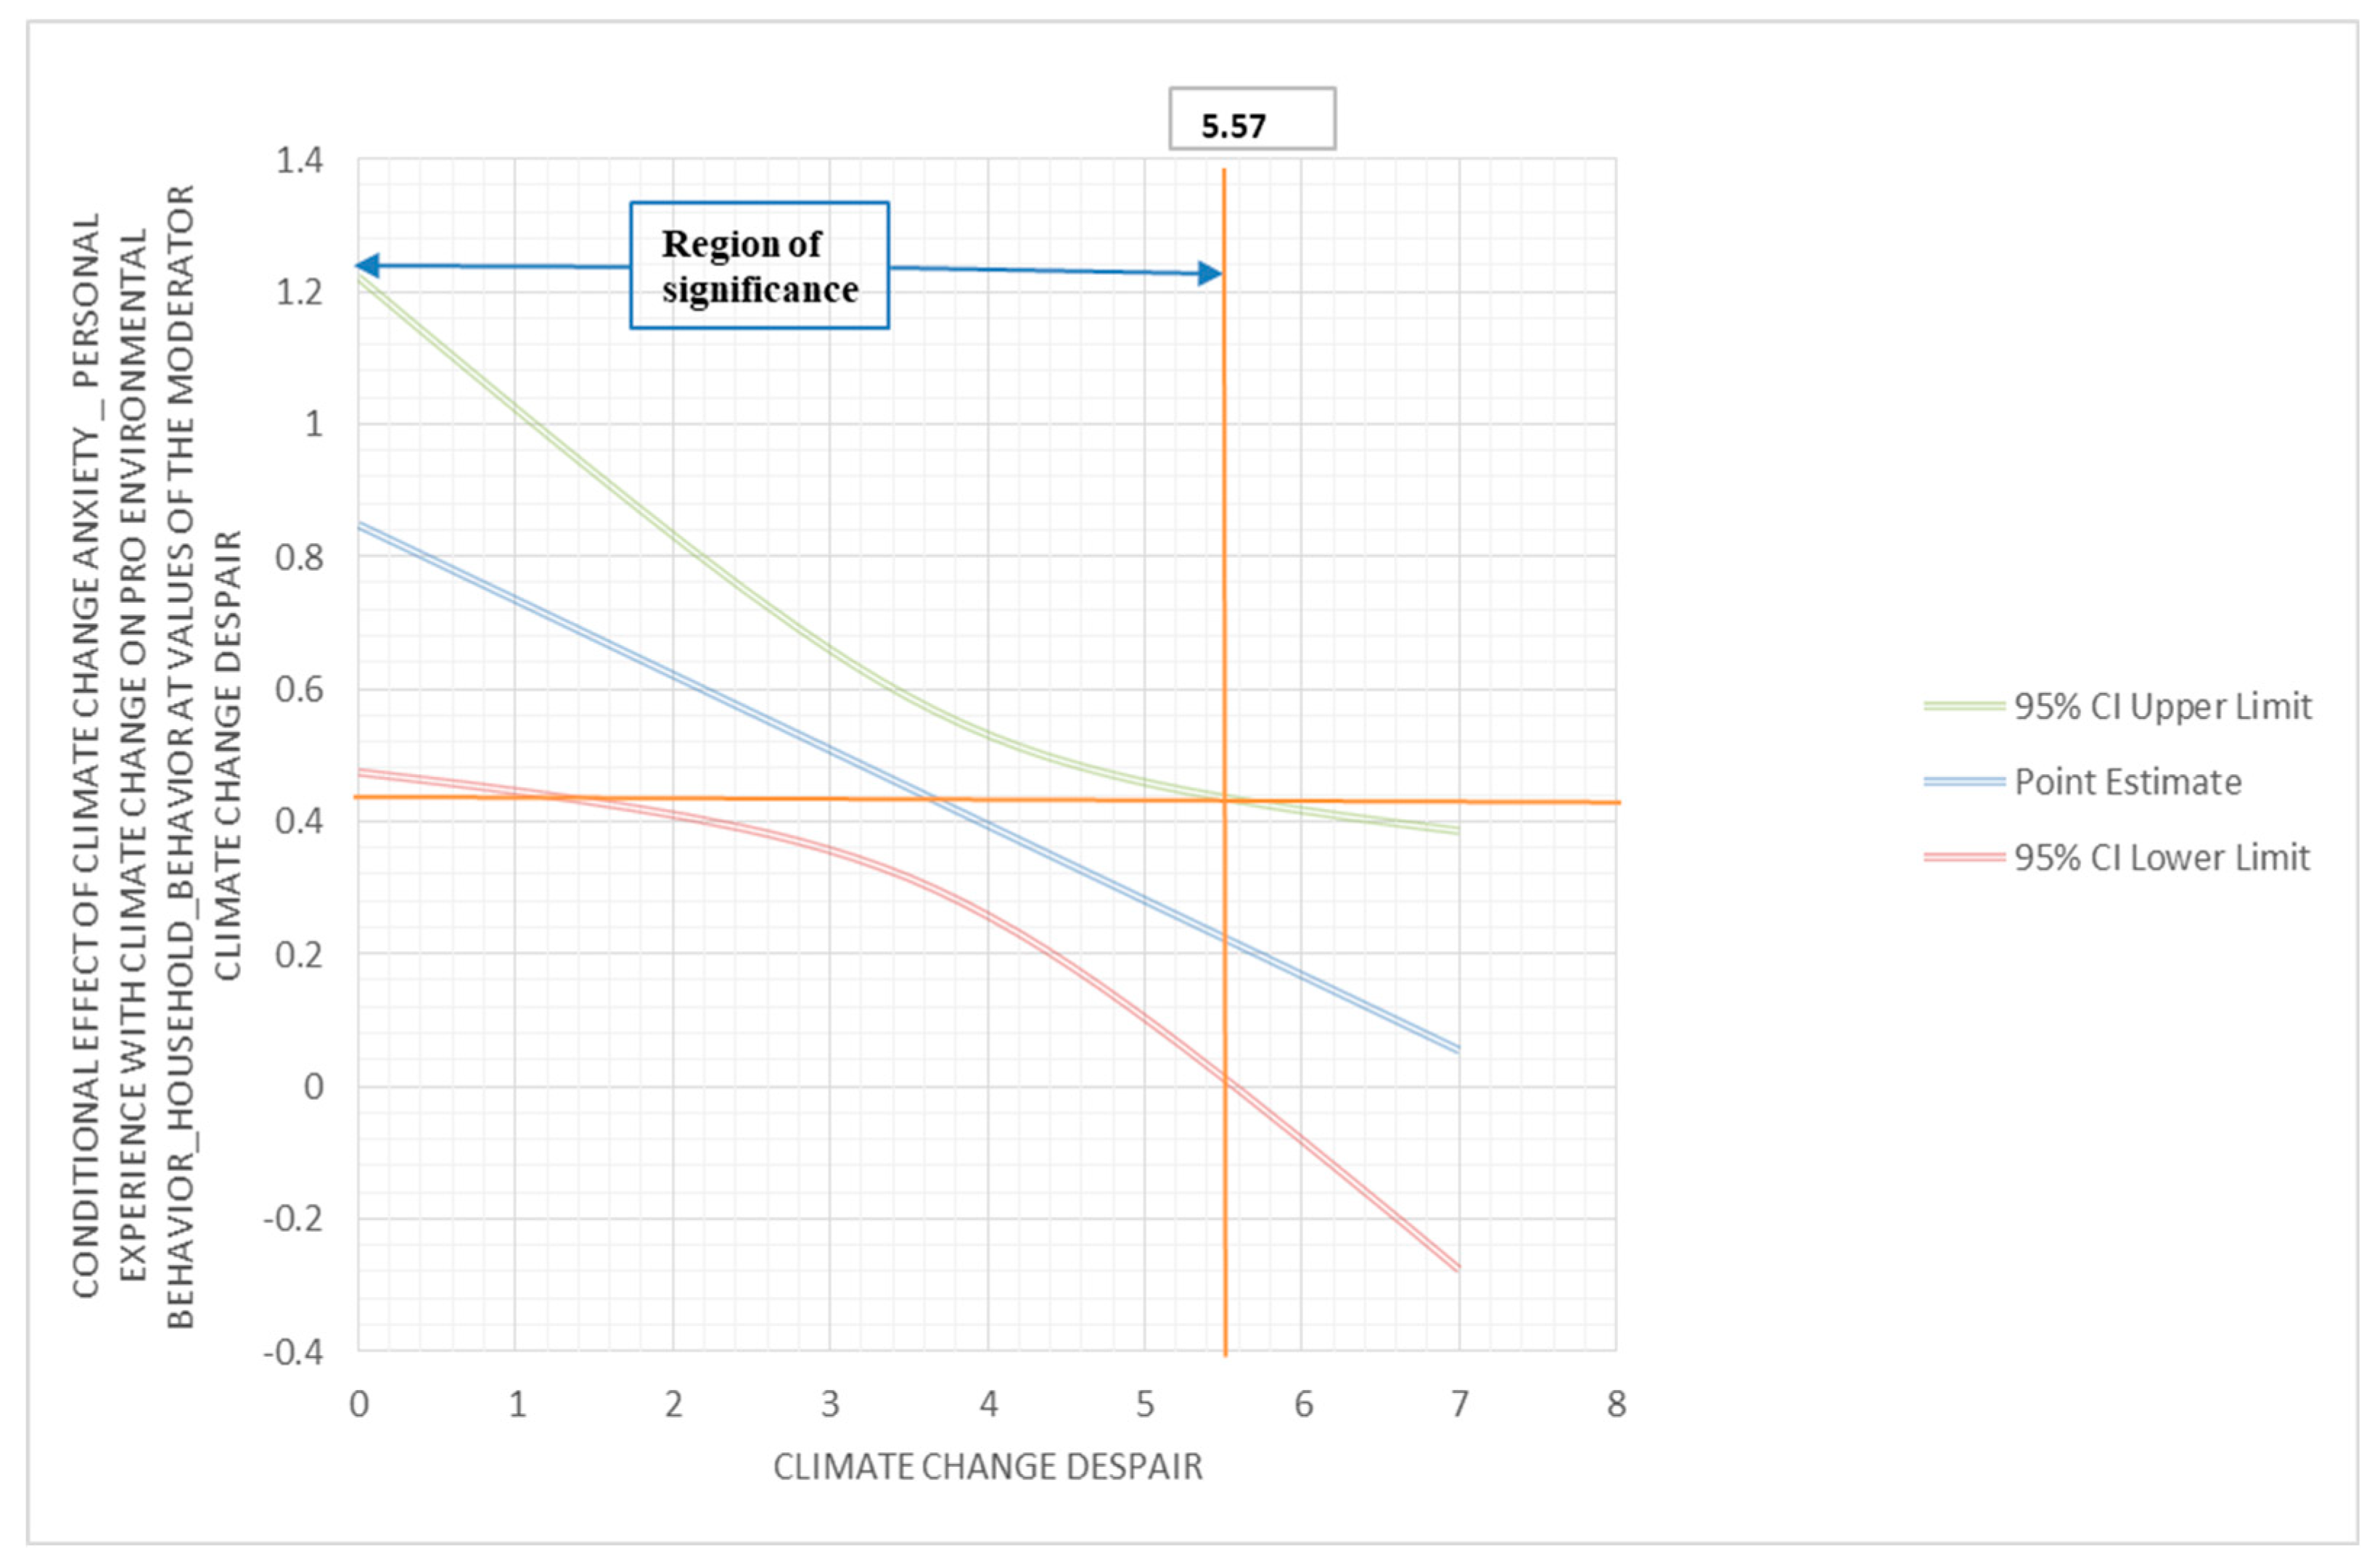
Figure 3.
Hope as moderator of the relationship between climate change anxiety (behavior engagement) and pro environmental behavior (information seeking).
Figure 3.
Hope as moderator of the relationship between climate change anxiety (behavior engagement) and pro environmental behavior (information seeking).
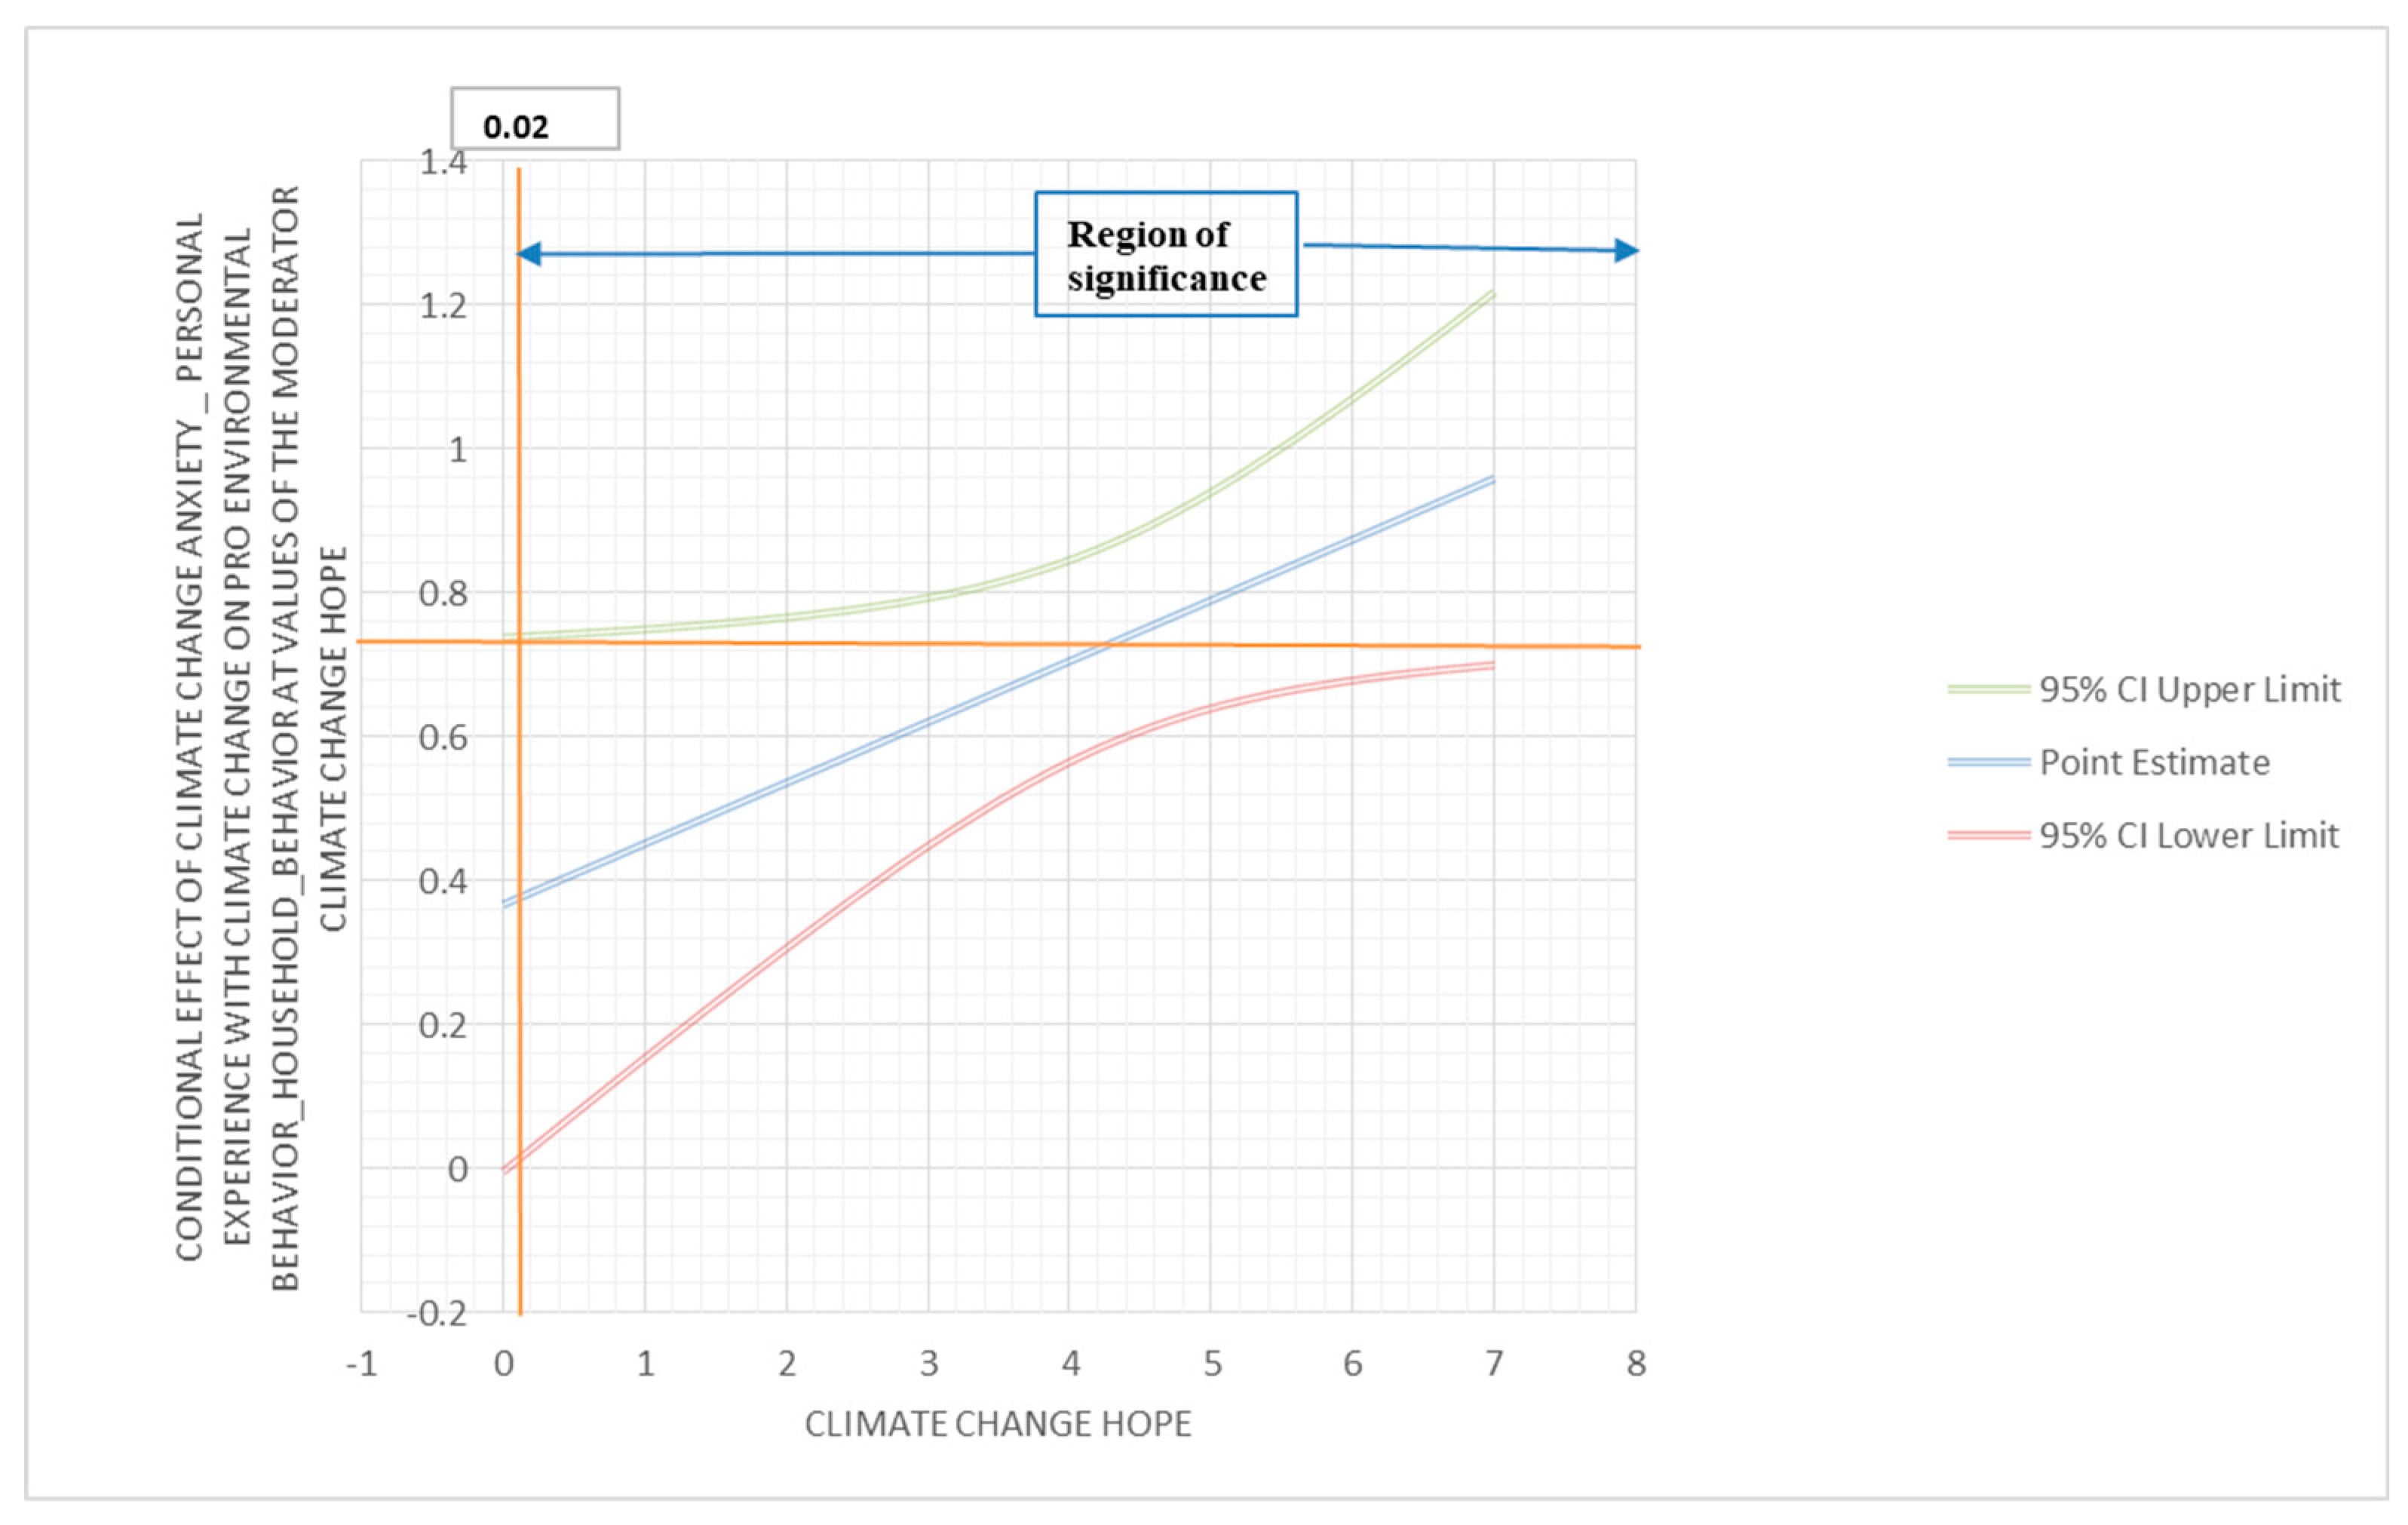
Figure 4.
Change climate perception (consequences) as moderator of the relationship between climate change anxiety (behavior engagement) and pro environmental behavior (information seeking).
Figure 4.
Change climate perception (consequences) as moderator of the relationship between climate change anxiety (behavior engagement) and pro environmental behavior (information seeking).
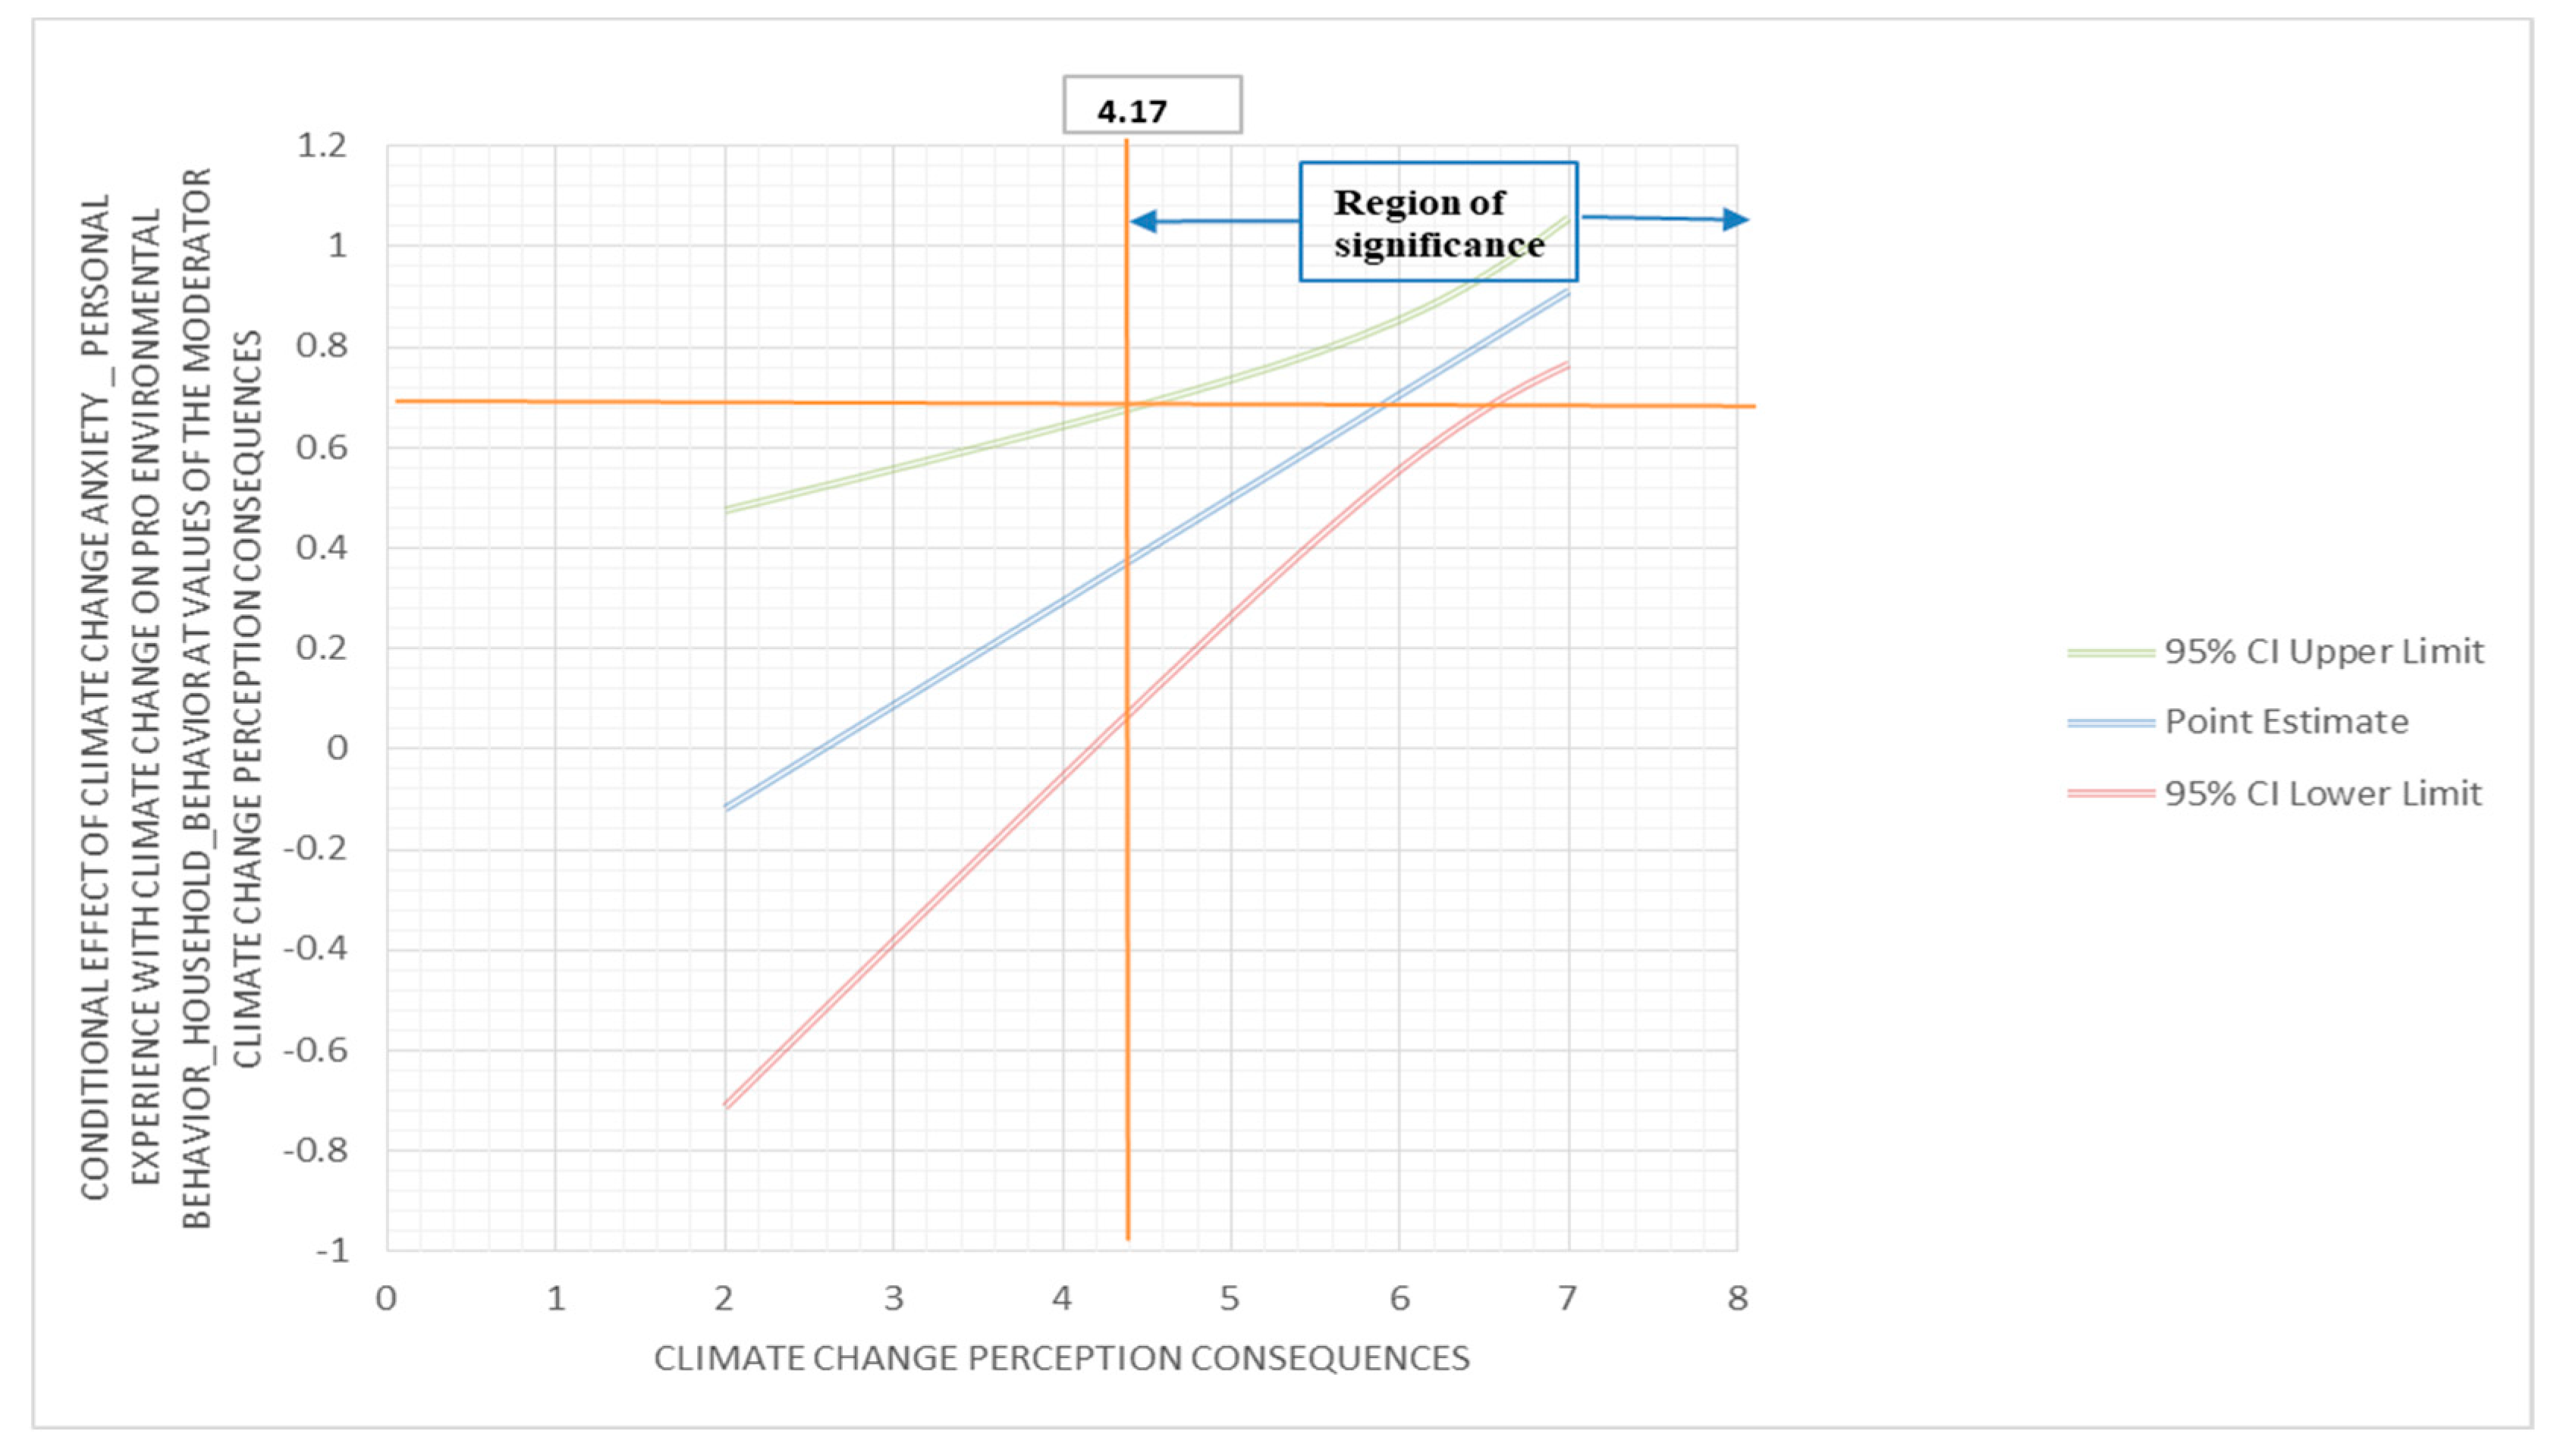
Table 1.
Items’ descriptives.
| M | SD | Var |
Sk (SD = 0.106) |
Kr (SD = 0.211) |
|
| Pro-environmental behavior scale | 1-5 | ||||
| 1. Turn off the lights at home when they are not in use. | 4.56 | 0.63 | 0.40 | -1.45 | 2.58 |
| 2. Ask my family to recycle some of the things we use. | 3.91 | 1.12 | 1.25 | -0.89 | 0.11 |
| 3. Ask other people to turn off the water when it is not in use. | 4.38 | 0.88 | 0.77 | -1.53 | 2.20 |
| 4. Close the refrigerator door while I decide what to get out of it. | 4.22 | 1.04 | 1.08 | -1.35 | 1.22 |
| 5. Recycle at home. | 3.83 | 1.23 | 1.52 | -0.80 | -0.34 |
| 6. Choose and environmental topic when I can choose a topic for an assignment in school. | 2.61 | 1.12 | 1.25 | 0.21 | -0.61 |
| 7. Talk with my parents about how to do something about environmental problems. | 2.88 | 1.19 | 1.42 | 0.09 | -0.85 |
| 8. Ask others about things I can do about environmental problems. | 2.56 | 1.19 | 1.42 | 0.33 | -0.77 |
| 9. Walk for transportation. | 3.18 | 1.18 | 1.39 | -0.18 | -0.80 |
| 10. Bike for transportation. | 1.96 | 1.10 | 1.21 | 0.96 | 0.02 |
| Climate change anxiety scale | 1-5 | ||||
| 1. Thinking about climate change makes it difficult for me to concentrate. | 2.24 | 0.97 | 0.95 | 0.37 | -0.37 |
| 2. Thinking about climate change makes it difficult for me to sleep. | 1.81 | 0.88 | 0.78 | 0.92 | 0.46 |
| 3. I have nightmares about climate change. | 1.41 | 0.70 | 0.49 | 1.80 | 3.33 |
| 4. I find myself crying because of climate change. | 1.29 | 0.62 | 0.38 | 2.16 | 4.03 |
| 5. I think, “why can't I handle climate change better?” | 1.78 | 0.93 | 0.87 | 0.97 | 0.17 |
| 6. I go away by myself and think about why I feel this way about climate change. | 1.60 | 0.82 | 0.68 | 1.32 | 1.25 |
| 7. I write down my thoughts about climate change and analyze them. | 1.34 | 0.71 | 0.50 | 2.28 | 4.97 |
| 8. I think, “why do I react to climate change this way?” | 1.66 | 0.92 | 0.84 | 1.40 | 1.52 |
| 9. I wish I behaved more sustainably. | 3.47 | 1.03 | 1.06 | -0.54 | 0.14 |
| 10. I recycle. | 3.80 | 1.10 | 1.22 | -0.56 | -0.49 |
| 11. I turn off lights. | 4.50 | 0.70 | 0.49 | -1.45 | 2.43 |
| 12. I try to reduce my behaviors that contribute to climate change. | 3.90 | 0.93 | 0.86 | -0.61 | 0.21 |
| 13. I feel guilty if I waste energy. | 3.40 | 1.04 | 1.07 | -0.05 | -0.54 |
| 14. I believe I can do something to help address the problem of climate change. | 3.20 | 1.00 | 1.01 | -0.02 | -0.31 |
| 15. I have been directly affected by climate change. | 2.46 | 1.03 | 1.07 | 0.31 | -0.43 |
| 16. I know someone who has been directly affected by climate change. | 2.08 | 1.18 | 1.39 | 0.76 | -0.51 |
| 17. I have noticed a change in a place that is important to me due to climate change. | 2.79 | 1.20 | 1.44 | -0.04 | -0.94 |
| 18. My concerns about climate change make it hard for me to have fun with my family or friends. | 1.58 | 0.78 | 0.61 | 1.17 | 0.69 |
| 19. I have problems balancing my concerns about sustainability with the needs of my family. | 1.76 | 0.93 | 0.86 | 1.09 | 0.63 |
| 20. My concerns about climate change interfere with my ability to get work or school assignments done. | 1.42 | 0.68 | 0.46 | 1.59 | 2.02 |
| 21. My concerns about climate change undermine my ability to work to my potential. | 1.44 | 0.72 | 0.52 | 1.67 | 2.50 |
| 22. My friends say I think about climate change too much. | 1.42 | 0.79 | 0.62 | 2.07 | 4.32 |
| Climate change perceptions scale | 1-7 | ||||
| 1. I believe that climate change is real. | 6.68 | 0.78 | 0.61 | -3.35 | 13.83 |
| 2. Climate change is occurring. | 6.57 | 1.12 | 1.25 | -3.42 | 11.93 |
| 3. Human activities are a major cause of climate change. | 6.29 | 1.05 | 1.11 | -1.93 | 4.57 |
| 4. Climate change is mostly caused by human activity. | 6.38 | 1.01 | 1.03 | -1.96 | 4.09 |
| 5. The main causes of climate change are human activities. | 6.31 | 1.07 | 1.15 | -1.99 | 4.43 |
| 6. Overall, climate change will bring more negative than positive consequences to the world. | 6.62 | 0.85 | 0.72 | -2.70 | 7.85 |
| 7. Climate change will bring about serious negative consequences. | 6.63 | 0.85 | 0.73 | -3.22 | 13.26 |
| 8. The consequences of climate change will be very serious. | 6.69 | 0.73 | 0.53 | -2.90 | 9.61 |
| Climate change hope scale | 0-7 | ||||
| 1. I believe people will be able to stop global warming. | 3.86 | 1.77 | 3.13 | 0.11 | -0.87 |
| 2. I believe scientists will be able to find ways to solve problems caused by climate change. | 4.17 | 1.70 | 2.89 | 0.02 | -0.84 |
| 3. Even when some people give up, I know there will be people who will continue to try to solve problems caused by climate change. | 4.99 | 1.75 | 3.07 | -0.47 | -0.67 |
| 4. Because people can learn from our mistakes, we will influence climate change in a positive direction. | 3.93 | 1.84 | 3.40 | 0.07 | -0.96 |
| 5. Every day, more people care about problems caused by climate change. | 4.60 | 1.67 | 2.79 | -0.22 | -0.74 |
| 6. If everyone works together, we can solve problems caused by climate change. | 5.32 | 1.66 | 2.76 | -0.87 | 0.08 |
| 7. At the present time, I am energetically pursuing ways to solve problems caused by climate change. | 3.63 | 1.64 | 2.70 | 0.13 | -0.54 |
| 8. I know that there are many things that I can do to help solve problems caused by climate change. | 4.88 | 1.76 | 3.11 | -0.42 | -0.80 |
| Climate change despair scale | 0-7 | ||||
| 1. I feel helpless to solve problems caused by climate change. | 3.85 | 1.83 | 3.36 | 0.11 | -0.84 |
| 2. The actions I can take are too small to help solve problems caused by climate change. | 4.06 | 1.98 | 3.93 | -0.02 | -1.08 |
| 3. Problems caused by climate change are out of my control. | 3.72 | 1.89 | 3.55 | 0.23 | -0.94 |
| 4. Climate change is such a complex problem, we will never be able to solve it. | 3.01 | 1.67 | 2.80 | 0.52 | -0.55 |
M = mean; SD = standard deviation; Sk = skweness; Kr = kurtosis.
Table 2.
Goodness of fit indexes for the four dimensional model of Pro-environmental behavior scale (N = 535).
Table 2.
Goodness of fit indexes for the four dimensional model of Pro-environmental behavior scale (N = 535).
| RMSEA CI90% | ||||||||||||
| χ2 | DF | χ2/DF | IFI | TLI | CFI | GFI | SRMR | RMSEA | LO90 | HI90 | AIC | |
| Three factors, 10 items | 226.88 | 32 | 7.09 | 0.878 | 0.828 | 0.877 | 0.913 | 0.079 | 0.107 | 0.094 | 0.120 | 272.88 |
| Three factors, 10 items, three correlations between errors | 79.99 | 29 | 2.76 | 0.968 | 0.950 | 0.968 | 0.971 | 0.050 | 0.057 | 0.043 | 0.063 | 131.99 |
Table 3.
Multigroup CFAs of Pro-environmental behavior scale according to political orientation (N = 535).
Table 3.
Multigroup CFAs of Pro-environmental behavior scale according to political orientation (N = 535).
| χ2 | df | χ2/df | RMSEA (CI) | CFI | IFI | SRMR | Comparisions | ΔRMSEA | ΔCFI | ΔSRMR | |
| Configural invariance | 132.56 | 87 | 1.52 | 0.031 (0.020-0.042) | 0.971 | 0.972 | 0.062 | NA | NA | NA | NA |
| Metric invariance | 156.47 | 101 | 1.54 | 0.032 (0.022-0.042) | 0.965 | 0.966 | 0.063 | Configural vs metric | 0.001 | 0.006 | 0.001 |
| Scalar invariance | 167.87 | 113 | 1.49 | 0.030 (0.020-0.039) | 0.966 | 0.966 | 0.064 | Metric vs Scalar | 0.002 | 0.001 | 0.001 |
| Error variance invariance | 198.94 | 139 | 1.43 | 0.028 (0.019-0.037) | 0.962 | 0.962 | 0.065 | Scalar vs error variance | 0.002 | 0.004 | 0.001 |
Note. χ2= qui-squared; DF = degrees of freedom; IFI = incremental fit index; CFI = comparative fit index; RMSEA = root mean square error of approximation; CI = confidence interval; SRMS = standard root mean square; △ RMSEA = change in RMSEA compared with the previous model (expressed in absolute values); △ CFI = change in CFI compared with the previous model (expressed in absolute values); △ SRMR = change in SRMR compared with the previous model (expressed in absolute values). All models are significant at p < .001.
Table 5.
Goodness of fit indexes for the four dimensional model of Climate change anxiety scale (N = 535).
Table 5.
Goodness of fit indexes for the four dimensional model of Climate change anxiety scale (N = 535).
| RMSEA CI90% | ||||||||||||
| χ2 | DF | χ2/DF | IFI | TLI | CFI | GFI | SRMR | RMSEA | LO90 | HI90 | AIC | |
| Second order model, four factors, 22 items | 742.24 | 205 | 3.62 | 0.873 | 0.856 | 0.872 | 0.879 | 0.078 | 0.070 | 0.065 | 0.076 | 838.24 |
| Second order model, four factors, 22 items, six correlations between errors | 485.66 | 199 | 2.44 | 0.932 | 0.921 | 0.932 | 0.922 | 0.061 | 0.052 | 0.046 | 0.058 | 593.66 |
| Four factors, 22 items | 715.39 | 203 | 3.52 | 0.879 | 0.861 | 0.878 | 0.881 | 0.074 | 0.069 | 0.063 | 0.074 | 815.39 |
| Four factors, 22 items, six correlations between errors | 467.31 | 197 | 2.37 | 0.936 | 0.924 | 0.936 | 0.925 | 0.057 | 0.051 | 0.045 | 0.057 | 579.31 |
Note. χ2= qui-squared; DF = degrees of freedom; IFI = incremental fit index; TFI= Tucker–Lewis index; CFI = comparative fit index; GFI = goodness of fit index; SRMS = standard root mean square; RMSEA = root mean square error of approximation; CI = confidence interval; AIC = Akaike information criterion.
Table 6.
Multigroup CFAs of Climate change anxiety scale according to political orientation (N = 535).
Table 6.
Multigroup CFAs of Climate change anxiety scale according to political orientation (N = 535).
| χ2 | df | χ2/df | RMSEA (CI) | CFI | IFI | SRMR | Comparisions |
Δ RMSEA |
Δ CFI |
Δ SRMR |
|
| Configural invariance | 963.13 | 591 | 1.63 | 0.034 (0.030-0.038) | 0.914 | 0.916 | 0.084 | NA | NA | NA | NA |
| Metric invariance | 1008.80 | 627 | 1.61 | 0.034 (0.030-0.038) | 0.912 | 0.913 | 0.091 | Configural vs metric | 0.000 | 0.002 | 0.007 |
| Scalar invariance | 1035.26 | 647 | 1.60 | 0.034 (0.030-0.037) | 0.911 | 0.911 | 0.095 | Metric vs Scalar | 0.000 | 0.001 | 0.004 |
| Error variance invariance | 1195.64 | 703 | 1.70 | 0.036 (0.033-0.040) | 0.887 | 0.886 | 0.093 | Scalar vs error variance | 0.002 | 0.024 | 0.002 |
Note. χ2= qui-squared; DF = degrees of freedom; IFI = incremental fit index; CFI = comparative fit index; RMSEA = root mean square error of approximation; CI = confidence interval; SRMS = standard root mean square; △ RMSEA = change in RMSEA compared with the previous model (expressed in absolute values); △ CFI = change in CFI compared with the previous model (expressed in absolute values); △ SRMR = change in SRMR compared with the previous model (expressed in absolute values). All models are significant at p < .001.
Table 7.
Correlations, Cronbach’s alpha, McDonald's omega, composite reliability, average variance extracted (AVE), AVE square roots, mean and standard deviation of the Climate change anxiety scale (N = 535).
Table 7.
Correlations, Cronbach’s alpha, McDonald's omega, composite reliability, average variance extracted (AVE), AVE square roots, mean and standard deviation of the Climate change anxiety scale (N = 535).
| Pearson’s correlations | |||||||||
| 1 | 2 | 3 | 4 | α | ω | CR | AVE | Mean (SD) | |
| 1. Cognitive emotional impairment | 0.68 | 0.83 | 0.83 | 0.87 | 0.46 | 1.64 (0.56) | |||
| 2. Behavioral engagement | 0.324** | 0.63 | 0.66 | 0.65 | 0.79 | 0.40 | 3.71 (0.59) | ||
| 3. Personal experience climate change | 0.481** | 0.408** | 0.83 | 0.77 | 0.78 | 0.87 | 0.69 | 1.05 (0.41) | |
| 4. Functional impairment | 0.651** | 0.262** | 0.487** | 0.80 | 0.85 | 0.85 | 0.90 | 0.64 | 1.53 (0.62) |
Note: ** p < 0.001; α = Cronbach’s alpha; ω = McDonald's omega; CR = composite reliability; AVE = average variance extracted; bold (diagonal) = AVE square roots; SD = Standard deviation.
Table 8.
Multigroup CFAs of Climate change perceptions scale according to political orientation (N = 535).
Table 8.
Multigroup CFAs of Climate change perceptions scale according to political orientation (N = 535).
| χ2 | df | χ2/df | RMSEA (CI) | CFI | IFI | SRMR | Comparisions |
Δ RMSEA |
Δ CFI |
Δ SRMR |
|
| Configural invariance | 112.62 | 51 | 2.21 | 0.048 (0.036-0.060) | 0.980 | 0.980 | 0.060 | NA | NA | NA | NA |
| Metric invariance | 159.88 | 61 | 2.62 | 0.055 (0.045-0.066) | 0.967 | 0.968 | 0.105 | Configural vs metric | 0.007 | 0.013 | 0.045 |
| Scalar invariance | 186.08 | 65 | 2.86 | 0.059 (0.049-0.069) | 0.960 | 0.960 | 0.104 | Metric vs scalar | 0.004 | 0.007 | 0.001 |
| Error variance invariance | 200.55 | 67 | 2.99 | 0.061 (0.052-0.071) | 0.956 | 0.956 | 0.085 | Scalar vs error variance | 0.003 | 0.004 | 0.019 |
Note. χ2= qui-squared; DF = degrees of freedom; IFI = incremental fit index; CFI = comparative fit index; RMSEA = root mean square error of approximation; CI = confidence interval; SRMS = standard root mean square; △ RMSEA = change in RMSEA compared with the previous model (expressed in absolute values); △ CFI = change in CFI compared with the previous model (expressed in absolute values); △ SRMR = change in SRMR compared with the previous model (expressed in absolute values). All models are significant at p < .001.
Table 9.
Correlations, Cronbach’s alpha, McDonald’s omega, composite reliability, average variance extracted (AVE), AVE square roots, mean and standard deviation of the Climate change perceptions scale (N = 535).
Table 9.
Correlations, Cronbach’s alpha, McDonald’s omega, composite reliability, average variance extracted (AVE), AVE square roots, mean and standard deviation of the Climate change perceptions scale (N = 535).
| Pearson’s correlations | |||||||||
| 1 | 2 | 3 | 4 | α | ω | CR | AVE | Mean (SD) | |
| 1. Total | 0.75 | 0.88 | 0.88 | 0.91 | 0.57 | 6.52 (0.70) | |||
| 2. Reality | 0.688** | 0.86 | 0.62 | a | 0.85 | 0.74 | 6.63 (0.82) | ||
| 3. Causes | 0.873** | 0.369** | 0.94 | 0.94 | 0.94 | 0.96 | 0.89 | 6.33 (0.99) | |
| 4. Consequences | 0.856** | 0.504** | 0.598** | 0.89 | 0.87 | 0.87 | 0.92 | 0.80 | 6.64 (0.72) |
Note: ** p < 0.001; α = Cronbach’s alpha; ω = McDonald's omega; CR = composite reliability; AVE = average variance extracted; bold (diagonal) = AVE square roots; SD = Standard deviation; a McDonald’s omega cannot be calculated because the number of items is less than 3.
Table 10.
Goodness of fit indexes for the unidimensional model of Climate change hope scale (N = 535).
Table 10.
Goodness of fit indexes for the unidimensional model of Climate change hope scale (N = 535).
| RMSEA CI90% | ||||||||||||
| χ2 | DF | χ2/DF | IFI | TLI | CFI | GFI | SRMR | RMSEA | LO90 | HI90 | AIC | |
| One factor, 8 items | 166.38 | 20 | 8.32 | 0.911 | 0.875 | 0.911 | 0.922 | 0.053 | 0.117 | 0.101 | 0.134 | 198.38 |
| One factor, 8 items, three correlations between errors | 53.68 | 17 | 3.16 | 0.978 | 0.963 | 0.978 | 0.975 | 0.030 | 0.064 | 0.045 | 0.083 | 91.68 |
Note. χ2= qui-squared; DF = degrees of freedom; IFI = incremental fit index; TFI= Tucker–Lewis index; CFI = comparative fit index; GFI = goodness of fit index; SRMS = standard root mean square; RMSEA = root mean square error of approximation; CI = confidence interval; AIC = Akaike information criterion.
Table 11.
Multigroup CFAs of Climate change hope scale according to political orientation (N = 535).
Table 11.
Multigroup CFAs of Climate change hope scale according to political orientation (N = 535).
| χ2 | df | χ2/df | RMSEA (CI) | CFI | IFI | SRMR | Comparisions |
Δ RMSEA |
Δ CFI |
Δ SRMR |
|
| Configural invariance | 114.82 | 51 | 2.25 | 0.048 (0.037-0.060) | 0.962 | 0.962 | 0.041 | NA | NA | NA | NA |
| Metric invariance | 121.87 | 65 | 1.88 | 0.041 (0.029-0.052) | 0.966 | 0.966 | 0.045 | Configural vs metric | 0.007 | 0.004 | 0.003 |
| Scalar invariance | 123.88 | 67 | 1.85 | 0.040 (0.029-0.051) | 0.966 | 0.966 | 0.045 | Metric vs scalar | 0.001 | 0.000 | 0.000 |
| Error variance invariance | 146.84 | 89 | 1.65 | 0.035 (0.025-0.045) | 0.965 | 0.965 | 0.054 | Scalar vs error variance | 0.005 | 0.001 | 0.009 |
Note. χ2= qui-squared; DF = degrees of freedom; IFI = incremental fit index; CFI = comparative fit index; RMSEA = root mean square error of approximation; CI = confidence interval; SRMS = standard root mean square; △ RMSEA = change in RMSEA compared with the previous model (expressed in absolute values); △ CFI = change in CFI compared with the previous model (expressed in absolute values); △ SRMR = change in SRMR compared with the previous model (expressed in absolute values). All models are significant at p < .001.
Table 12.
Multigroup CFAs of Climate change despair scale according to political orientation (N = 535).
Table 12.
Multigroup CFAs of Climate change despair scale according to political orientation (N = 535).
| χ2 | df | χ2/df | RMSEA (CI) | CFI | IFI | SRMR | Comparisions |
Δ RMSEA |
Δ CFI |
Δ SRMR |
|
| Configural invariance | 8.10 | 6 | 1.35 | 0.026 (0.000-0.066) | 0.996 | 0.996 | 0.029 | NA | NA | NA | NA |
| Metric invariance | 8.86 | 10 | 0.89 | 0.000 (0.000-0.043) | 1.000 | 1.002 | 0.032 | Configural vs metric | 0.026 | 0.004 | 0.003 |
| Scalar invariance | 11.76 | 12 | 0.98 | 0.000 (0.000-0.043) | 1.000 | 1.000 | 0.037 | Metric vs scalar | 0.000 | 0.000 | 0.005 |
| Error variance invariance | 28.46 | 22 | 1.29 | 0.023 (0.000-0.043) | 0.989 | 0.989 | 0.037 | Scalar vs error variance | 0.023 | 0.011 | 0.000 |
Note. χ2= qui-squared; DF = degrees of freedom; IFI = incremental fit index; CFI = comparative fit index; RMSEA = root mean square error of approximation; CI = confidence interval; SRMS = standard root mean square; △ RMSEA = change in RMSEA compared with the previous model (expressed in absolute values); △ CFI = change in CFI compared with the previous model (expressed in absolute values); △ SRMR = change in SRMR compared with the previous model (expressed in absolute values). All models are significant at p < .001.
Table 13.
Correlations between all the variables in this study.
| 1 | 2 | 3 | 4 | 5 | 6 | 7 | 8 | 9 | 10 | 11 | 12 | 13 | |
| 1.PEBS_Household_behavior | 1 | ||||||||||||
| 2.PEBS_Information_seeking | 0.428** | 1 | |||||||||||
| 3.PEBS_Transportation_choice | 0.276** | 0.284** | 1 | ||||||||||
| 4.CCAS_Cognitive_emotional_impairment | 0.218** | 0.516** | 0.195** | 1 | |||||||||
| 5.CCAS_Behavioral_engagement | 0.601** | 0.473** | 0.221** | 0.324** | 1 | ||||||||
| 6.CCAS_Personal_experience_climate_change | 0.258** | 0.430** | 0.190** | 0.481** | 0.408** | 1 | |||||||
| 7.CCAS_Functional_impairment | 0.180** | 0.464** | 0.209** | 0.651** | 0.262** | 0.487** | 1 | ||||||
| 8.CCPS_Total | 0.189** | 0.173** | 00.027 | 0.178** | 0.362** | 0.190** | 00.071 | 1 | |||||
| 9.CCPS_Reality | 0.141** | 0.129** | 00.051 | 0.138** | 0.297** | 0.182** | 00.049 | 0.688** | 1 | ||||
| 10.CCPS_Causes | 0.172** | 0.162** | 00.012 | 0.152** | 0.301** | 0.143** | 0.087* | 0.873** | 0.369** | 1 | |||
| 11.CCPS_Consequences | 0.143** | 0.126** | 00.015 | 0.145** | 0.294** | 0.155** | 0.028 | 0.856** | 0.504** | 0.598** | 1 | ||
| 12.CCHS_Total | 0.241** | 0.286** | 0.155** | 0.248** | 0.403** | 0.231** | 0.188** | 0.342** | 0.249** | 0.302** | 0.278** | 1 | |
| 13.CCDS_Total | 0.011 | -0.033 | -0.025 | 0.123** | 0.020 | 0.016 | 0.092* | 0.085* | 0.058 | 0.055 | 0.100* | 0.004 | 1 |
**<0.001; *<0.010.
Table 14.
Variables that contribute to explain Pro-environmental behavior scale.
| Household behavior | Information seeking | Transportation choice | |||||||
| B | EP B | β | B | EP B | β | B | EP B | β | |
| Age | 0.004 | 0.002 | 0.072 | 0.009 | 0.005 | 0.097 | |||
| Gender | 0.253 | 0.084 | 0.108 | ||||||
| Marital status | -0.240 | 0.121 | -0.123 | ||||||
| Children | 0.291 | 0.135 | 0.102 | 0.360 | 0.161 | 0.138 | |||
| CCAS_Behavioral_engagement | 0.669 | 0.039 | 0.598 | 0.480 | 0.068 | 0.281 | 0.284 | 0.067 | 0.183 |
| CCAS_Personal_experience_climate_change | 0.347 | 0.103 | 0.139 | ||||||
| CCAS_Functional_impairment | 0.493 | 0.064 | 0.301 | 0.239 | 0.064 | 0.160 | |||
| CCHS_total | 0.071 | 0.030 | 0.088 | ||||||
| R2 (R2 Adj.) | 0.366 (0.364) | 0.403 (0.395) | 0.082 (0.076) | ||||||
| F for change in R2 | 300.339** | 75.167** | 21.066** | ||||||
R2 = R squared; R2 Adj. = R squared adjusted; B = unstandardized regression coeficients; EP B = unstandardized error of B; β = standardized regression coefficients; **p < 0.001.
Disclaimer/Publisher’s Note: The statements, opinions and data contained in all publications are solely those of the individual author(s) and contributor(s) and not of MDPI and/or the editor(s). MDPI and/or the editor(s) disclaim responsibility for any injury to people or property resulting from any ideas, methods, instructions or products referred to in the content. |
© 2023 by the authors. Licensee MDPI, Basel, Switzerland. This article is an open access article distributed under the terms and conditions of the Creative Commons Attribution (CC BY) license (http://creativecommons.org/licenses/by/4.0/).
Copyright: This open access article is published under a Creative Commons CC BY 4.0 license, which permit the free download, distribution, and reuse, provided that the author and preprint are cited in any reuse.


