
Submitted:
27 October 2023
Posted:
30 October 2023
You are already at the latest version
Abstract
Background: The effect of rice bran arabinoxylan compound (RBAC), a plant-based immunomodulator, on the quality of life (QoL) in cancer patients and underlying physiological pathways remains unclear. Trial design: The RBAC-QoL study is a double-blind, randomised, controlled pilot feasibility study. The aim is to determine RBAC’s effects on QoL and the associated action mechanisms. Primary outcomes are the EORTC QLQ-C30 functional, symptom, and global QoL scores with inflammatory, nutritional, and cytokine parameters as secondary and exploratory outcomes. Methods: Recruitment targets adults diagnosed with solid organ tumours (≥ stage II) undergoing active treatment in several outpatient centres in New South Wales, Australia. Interventions are RBAC or matched placebo at 3g/day for 24 weeks allocated through stratified randomisation with participants, oncologists, and data collectors blinded. Data is collected from five study visits six weeks apart. The trial is ongoing. An interim intention-to-treat analysis was performed using repeated measure ANOVA with pairwise comparisons where statistical significance is observed and adjusted with covariates. Results: Global QoL scores from currently available data (n = 16; RBAC = 7, placebo = 9) were statistically different between groups (F[1,8] = 8.6, p = 0.019, eta2[g] = 0.267). Pairwise comparisons found significant differences at week 6 (p = 0.032, Cohen’s d = 1.454) and marginally at week 12 (p = 0.069, d = 1.427). Age-adjusted analysis showed a continuous upward trend in QoL improvement over time with RBAC, while the placebo group did not deviate from baseline QoL. Significant elevations of serum white blood cell count (week 18) and total protein (weeks 12 and 18) were detected in the RBAC group compared to placebo. The total protein levels correlated highly with white blood cell count (Pearson’s r = 0.539, p < 0.001) and moderately with the global QoL scores (r = 0.338, p = 0.01). No intervention-related adverse events were reported in both groups. Conclusions: RBAC improves QoL beyond placebo during active cancer treatment, possibly through the immuno-nutritional pathway. These findings are preliminary but valuable for future research. Funding and registration: Daiwa Pharmaceutical Co., Ltd, Japan; BioMedica Nutraceuticals Pty Ltd., Australia. ANZCTR Reg No: ACTRN12619000562178p.
Keywords:
Biobran
; biological response modifier
; polysaccharide
; immunomodulator
; MGN-3
; immunotherapy
; chemotherapy
Introduction
Rice bran arabinoxylan compound (RBAC) is a heteropolysaccharide derivative of defatted rice bran obtained through enzymatic treatment with shiitake mushroom (Lentinus Edodes) mycelium. First developed by Daiwa Pharmaceutical Co. Ltd. (Tokyo, Japan) as MGN-3 in the early 90s, the product has since been commercially marketed as a nutraceutical for the immune system worldwide under brand names such as BioBran (globally), Lentin Plus (Japan/Asia), Ribraxx (Australia/New Zealand), and BRM4 (United States of America). Notably, due to its immunomodulating properties, RBAC is used by some cancer patients as a complementary therapy alongside conventional oncological treatment (Ooi et al., 2018).
Although the exact chemical composition of the immunologically active ingredient of RBAC remains unclear, research based on MGN-3 found RBAC to be a complex polysaccharide with arabinoxylan as its primary structure (36%) while also containing galactan and glucan (Ooi, Micalos, & Pak, 2023). In preclinical experiments with healthy cells and animals, RBAC was shown to promote innate immune defences by upregulating macrophage phagocytosis and enhancing natural killer cell activity while lowering oxidative stress through strong antioxidant capacity (Ooi, Micalos, & Pak, 2023). RBAC has also been reported to augment adaptive immunity by promoting T and B lymphocyte proliferation through the induction of dendritic cell maturation. Moreover, in other preclinical studies, RBAC inhibited mast cell degranulation during allergic reactions to lower inflammation and downregulated angiogenesis by modulating cytokines and growth factors (Ooi, Micalos, & Pak, 2023).
In cancer research, RBAC has exhibited anticancer properties by arresting in vivo tumour growth in murine models and in vitro experiments showed RBAC promoted apoptosis in cancer cells by increasing the responsiveness of CD95 (Fas/APO-1) ligands (Ooi, Micalos, Kim, et al., 2023). RBAC has also been demonstrated to restore immune dysfunction in cancer patients by upregulating natural killer cell activity and modulating cytokine production to enhance inflammatory and cytotoxic responses (Ooi, Micalos, Kim, et al., 2023).
A previous review by the lead authors (SLO and SCP) has found evidence to support RBAC as an immunomodulator for complementing conventional cancer treatment with favourable effects, including enhancing the immune profile, reducing side effects, improving treatment outcomes, and increasing survival rates (Ooi et al., 2018). Promising results from Tan and Flores (2020) also showed that head and neck cancer patients taking RBAC during radiation treatment had significantly better health-related quality of life (QoL) than patients taking placebos. However, the impact of RBAC on the QoL of patients with different types of solid organ tumours remained unclear. Hence, there is a need for further research to validate the beneficial effect of RBAC on the QoL in cancer patients and the underlying physiological pathways.
The RBAC-QoL study is a pilot feasibility study based on a double-blind, randomised, controlled trial (RCT) design, which aims to determine the potential effect of RBAC compared to placebo on the QoL of cancer patients undergoing active treatment. The secondary objectives are to determine the associations between RBAC intervention and the nutritional and inflammatory status of the body as the possible mechanisms influencing the psycho-neuro-immune axis that affects the perceived QoL of the patients. The study also attempts to explore whether cytokine modulation and changes in the gut microbiota may be potential biological pathways that RBAC wields its QoL effects. The present article sets forth a detailed statistical analysis plan for the RBAC-QoL study and presents the results of an interim analysis based on the prescribed statistical methods.
Materials and Methods
The study protocol was published for open access (Ooi et al., 2020). A synopsis of the clinical trial is presented in this article, with approved variations from the original protocol highlighted.
Research Ethics Approval
The Human Research Ethics Committee of Concord Repatriation General Hospital, Sydney Local Health District (Application No. 2019/ ETH00489) and Charles Sturt University HREC (Protocol No. H19244) approved the research project. The trial has been registered with the Australian New Zealand Clinical Trials Registry (ANZCTR Reg No: ACTRN12619000562178p) before recruitment.
Study Synopsis
Eligibility Criteria
Recruitment targets cancer patients visiting outpatient cancer centres with the following inclusion criteria: Adult patients aged 18 years and above at the time of providing informed consent; Diagnosed with any solid organ cancer (including but not limited to colon, breast, melanoma, lung, pancreatic, bladder, and prostate) of stage II and above; Currently undergoing active cancer treatment; Received an explanation of the purpose and methods of the study; Provided written consent before the start of the trial. Consented patients must also maintain adequate bone marrow, liver, and kidney functions.
The exclusion criteria are as follows: Existing mental health conditions that may impede the ability to provide consent; Inability to complete the QoL questionnaire with minimal assistance; Pregnant, lactating, or plan to get pregnant during the period of the study; Active or prior documented autoimmune or inflammatory disorders within the last five years, except for vitiligo or alopecia, stable hypothyroidism on hormone replacement, and any chronic skin condition that does not require systemic therapy. Patients with ongoing but stable conditions, including diabetes, hypertension, and chronic obstructive pulmonary disease, will not be excluded.
Randomisation, Intervention, and Participation
Eligible patients are assigned into RBAC or placebo groups based on a stratified randomisation algorithm that considers metastatic status (yes or no) and treatment (chemotherapy or immunotherapy). The study interventions are either RBAC or a placebo powder with similar colour, odour, and taste (1g x 3 times per day). Both the RBAC and placebo powder are manufactured and supplied by Daiwa Pharmaceutical Co., Ltd. (Tokyo, Japan), and the plastic sachets that contain both RBAC and placebo powder are also identical in appearance. The participant, the treating oncologist, and the study coordinator (data collector) are blinded to the actual content of the study intervention.
In the 24-week trial period, each participant will attend five study visits six weeks apart starting from baseline (week 0). The participants will also continue their oncological treatment according to their prescribed regimens. At each study visit, each participant will have body composition measurements taken on a Bioelectric Impedance Analysis scale (Tanita, Kewdale, WA Australia), complete a set of questionnaires and undergo blood tests. Participants who opt for gut microbiome analysis will also provide stool samples.
Outcome Measures
The primary outcome measure of this study is self-reported QoL based on the European Organisation for the Research and Treatment of Cancer (EORTC) core 30-item QoL questionnaire (QLQ-C30). The QLQ-C30 is composed of both multi-item scales and single-item measures. These include five functional scales (physical, role, emotional, cognitive, and social), three symptom scales (fatigue, nausea & vomiting, pain), a global QoL scale, and six single items (dyspnoea, insomnia, appetite loss, constipation, diarrhoea, financial difficulties). The scoring of QLQ-C30 follows the QLQ-C30 manual stipulated by EORTC (Fayers et al., 2001). Each of the 15 scales/items is mapped into a linear transformation of 0–100. Each scale/item is an outcome variable for analysis to determine the most appropriate primary outcome measures that best reflect any potential effect of RBAC compared to placebo on the QoL of cancer patients.
The secondary outcome measures include body composition parameters (body weight, body fat ratio, and muscle mass), body mass index (BMI), neutrophil to lymphocyte ratio (NLR), and the inflammatory-nutritional index (INI = the ratio of C-Reactive Protein [CRP] and albumin). These are nutritional and inflammatory indicators of cancer patients, of which any correlations with the QoL scores may help to explain the mechanisms of RBAC as an intervention.
Exploratory outcome measures include serum cytokine profiles at each time point to assess the potential immunomodulating effects of RBAC. The original plan was to evaluate 42 human cytokine/chemokine markers with multiplexing analysis, as stated in the protocol. However, with the increasing cost exacerbated by currency depreciation, the number of parameters was reduced to 15 due to budget constraints. The 15-plex analysis covers granulocyte-macrophage colony-stimulating factor (GM-CSF), interferon-gamma (IFN-γ), interleukin (IL)-1β, IL-1RA, IL-2, IL-4, IL-5, IL-6, IL-8, IL-10, IL-12p40, IL-12p70, IL-13, monocyte chemoattractant protein-1 (MCP-1), and tumour necrosis factor-alpha (TNF-α).
The present study will also compare the microbiota diversity (alpha diversity) and composition of different gut bacteria groups (beta diversity) between the two groups by studying the faecal microbiome based on 16S ribosomal ribonucleic acid (rRNA) gene sequencing. Thus, gut microbiome analysis is another set of exploratory outcomes to assess the gut-immune-brain axis as a potential pathway through which RBAC may influence cancer patients’ QoL.
The safety assessment will be based on routine blood tests at study visits. These tests include complete blood count, liver function, electrolytes, urea, creatinine and prealbumin. The study will also track and analyse adverse events reported by participants during clinical visits throughout the trial using the Common Terminology Criteria for Adverse Events (CTCAE) version 5.0.
Sample Size
The recruitment target is 50 participants with equal distribution in two groups. This sample size calculation was based on repeated measures (RM) analysis of variance (ANOVA) with (two groups and five repeated measures) using a priori parameters with an alpha of 0.05, power of 0.8, and an effect size of 0.35, resulting in a total sample size of 42. The effect size estimate of 0.35 was used according to the guidelines for sample size calculations for QLQ-C30 scores (Cocks et al., 2010). The recruitment target is also consistent with sample size recommendations for a pilot study, as mentioned in the literature (Cocks & Torgerson, 2013; Whitehead et al., 2015).
Lifestyle Factors
The present study also collects data on the lifestyle factors identified as potential confounding variables that may affect QoL during cancer treatment. Participants will complete an Australian Eating Survey® food frequency questionnaire (AES FFQ) to assess dietary patterns (Visits 0 and 4), an International Physical Activity Questionnaire (IPAQ) for physical activeness (Visits 0 – 4), and a Use of Complementary and Alternative Medicine Questionnaire (CAMQ) to determine usage and perceived value of complementary therapies (Visits 0, 2, and 4). However, these questionnaires are optional components, which the participants can choose to opt out of.
An Australian Recommended Food Score (ARFS) is derived from the AES FFQ to provide a diet quality index ranging from 0 to 73 to indicate the consumption level of core nutrient-dense foods, including vegetables, fruit, protein foods, bread/cereals, and spreads/sauces recommended in the Australian Dietary Guidelines (Collins et al., 2015). A higher ARFS score is indicative of a healthier diet. Scoring of the IPAQ will be based on the protocol specified by Forde (2018). The score is reported in metabolic equivalents (MET) minutes per week, representing the amount of energy expended carrying out physical activity. The MET/week score can also be mapped into three categories: low, moderate, and high activity levels.
CAMQ is a custom-designed questionnaire comprising 15 items covering the usage frequency of different complementary therapies, including herbal medicine, nutritional supplements, massage, etc. The questionnaire assesses the respondent’s perception towards the efficacy of complementary therapies. A copy of the questionnaire is available for downloading online (Ooi et al., 2020). The scoring of the CAMQ questionnaire is similar to the QLQ-C30 procedure, whereby the items are grouped and transformed into a global score with a linear scale of 0-100 (CAMQ score). The scoring method is presented in Supplementary S1.
Sample Collection, Preservation, and Assay
At sites participating in sample collection for cytokine analysis, blood samples will be collected from each participant at each study visit and centrifuged into serum before being placed in 2 x 0.6 ml microcentrifuge tubes (duplicate) for transportation and storage in a -80 oC facility. This study will use Luminex xMAP technology for multiplex quantification of analytes. The multiplexing analysis will be performed using the Luminex™ 200 system (Luminex, Austin, TX, USA) by Eve Technologies Corp. (Calgary, AB, Canada). According to the manufacturer’s protocol, 15 markers will be simultaneously measured in the samples using Eve Technologies’ Human Focused 15-Plex Discovery Assay® (MilliporeSigma, Burlington, Massachusetts, USA). The assay sensitivities of these markers range from 0.14 – 5.39 pg/mL. Individual analyte sensitivity values are available in the MilliporeSigma MILLIPLEX® MAP protocol. The average raw fluorescence signal (FI) from duplicate testing of each sample is used in the analysis.
Stool samples are to be collected by participants using a fit-for-purpose specimen collection kit (Microba Life Sciences, Brisbane, QLD Australia) within three days of each study visit. The heat-stable faecal swabs are collected from participants and stored in a -80 oC freezer. Samples are subjected to DNA extraction using the microbiome DNA isolation kit (Norgen Biotek Corp., Thorold, ON, Canada) before being sealed and transported to a microbiology laboratory for amplification and sequencing using the Illumina MiSeq platform, targeting the 16S rRNA V3-V4 gene region of the DNA.
Protocol Variations
Several protocol variations have been approved and implemented since the publishing of the study protocol. Firstly, the study was originally a single-site study at a regional cancer centre in the Central West of New South Wales, Australia. However, the study has expanded to include three additional outpatient cancer care centres in the Central West and Sydney regions. Due to logistic considerations, the collection of serum samples for cytokine analysis has been made optional by site. Secondly, as many cancer patients visiting the study sites are elderly, the upper limit of 70 years old in the original inclusion criteria was removed to facilitate recruitment efforts without compromising safety.
Thirdly, a research contingency plan has been implemented since the start of the COVID-19 pandemic (in April 2020) to allow for remote interactions between the study coordinators and participants, eliminating the need for on-site face-to-face meetings. Electronic versions of all questionnaires and case report forms are used to facilitate online access. The collections of the body composition data have also been outsourced to the pathology clinics performing the blood draw. Additionally, the dispensing of study interventions can be done via postal service if needed. Due to the disruption of the COVID-19 pandemic, the trial has been extended until mid-2024.
Statistical Analysis
General Principles
Records of each dataset will be exported from the project database and loaded into Microsoft Excel 365 (Richmond, WA, USA) for data cleaning, such as removing duplicate entries, correcting errors, checking structural consistency, and validating completeness. Calculations of ratios and scoring of questionnaires will also be performed before analysis. The statistical analysis software of choice in this study is RStudio (Posit, Boston, MA, USA), running with the latest version of the R programming language and any relevant R packages. Data analysis of the 16S rRNA sequences of the faecal samples will be analysed with the QIIME2 (Quantitative Insights into Microbial Ecology software) pipeline (Bolyen et al., 2019).
Participation Summary and Comparisons
The participant flow report will be in a CONSORT flowchart (Falci & Marques, 2015) showing the numbers of patients screened for eligibility, randomly assigned, completed and analysed for the primary outcome. Also, for each group, exclusions at screening and dropouts after randomisation will be reported together with reasons. The number of participants who opted to provide stool samples and those who agreed to complete additional lifestyle-related questionnaires will also be reported. Furthermore, the completion and dropout distribution of the two groups will be tested for any nonrandom association. Moreover, the compliance rate based on the percentage of intervention sachets consumed at the end of the trial out of the total number of sachets issued to each participant will also be reported.
The baseline characteristics of the participants to be compared include age, sex, primary cancer, cancer stage, recurrence (Yes/No), metastasis (Yes/No), and primary treatment (chemotherapy/immunotherapy). The participant’s age is computed from the difference between baseline date (visit 0) and date of birth. The data fields for participants are summarised in Supplementary S2.
In general, hypothesis testing between the two groups will be carried out to compare participant characteristics at baseline, compliance to treatment, and adverse events. Continuous variables will be reported in the format of mean ± standard deviation. The difference between means of two continuous variables will be analysed with the two-sided student’s t-statistics. Fisher's exact test will be used to determine if there are nonrandom associations between two categorical variables. A p-value of less than or equal to 0.05 is considered statistically significant.
Primary Analysis
The RBAC group will be compared against the placebo group across multiple time points for all outcome measures. The primary analysis will be based on the intention-to-treat principle using every data point collected from participants in the trial regardless of withdrawal. Missing data due to dropout or administrative errors will be handled with pairwise deletion to maximise all data available. All outcome data fields, including safety outcomes, except gut microbiome data, are shown in Supplementary S2.
Each outcome variable, except the gut microbiome parameter, will be analysed as a dependent variable in RM ANOVA, with intervention (group) as a between-subject factor and time (study visit) as the within-subject factor. The lifestyle factors of diet, physical activity, and use of complementary therapies will also be analysed using RM ANOVA similar to the outcome variables, with dependent variables being AFRS, MET score, and CAMQ score, respectively.
Box-Cox transformation on the dependent variables and removal of extreme outliers are methods used to ensure conformity to the normality assumption of RM ANOVA. For factors that failed Mauchly's test for sphericity, the p-value of the Huynd-Feldt correction will be used as the significance value for testing. For significant outcomes, the F statistics with degrees of freedom, p-value, and the effect size (generalized eta2) will be reported. The effect size interpretation of eta2 is small (eta2 = 0.01), medium (eta2 = 0.06), and large (eta2 = 0.14). Pairwise comparisons will be performed where significance is observed. The Bonferroni adjustment or the false discovery rates (FDR) will be applied to adjust the p-values in case of multiple comparisons to control the final type-I errors. The effect sizes of the pairwise comparisons in Cohen’s d will also be reported and interpreted as small (d = 0.2), medium (d = 0.5), and large (d = 0.8). For outcome variables with significance detected, Pearson’s correlation coefficient (r) will be used to detect the strengths and directions of the relationships.
Adjusted Analysis
Covariance analysis (ANCOVA) will be performed if there are any significant differences between groups in any baseline characteristics of the participants or lifestyle factors. Outcome variables with significant differences detected in the primary analysis will be analysed to determine any influence from the differences in the baseline characteristics or lifestyle factors as covariates. The Estimated Marginal Means (emmeans) of the outcome variables will be calculated to adjust for any significant impact, with pairwise comparisons performed to predict the differences after considering all confounding factors.
Microbiome Analysis
The 16S rRNA data will be loaded into the QIIME2 pipeline for preprocessing to locate amplicons, remove chimeric, and minimise noise created by spurious operational taxonomic units using the DADA2 plugin to trim and truncate only the quality sequences for analysis. Alpha diversity will be calculated using the richness of ASVs (Amplicon Sequence Variants), Chao1 index, Shannon index, and Faith's phylogenetic diversity. Beta diversity will be calculated using four different methods: unweighted unique fraction metric (unifrac), weighted unifrac, Bray Curtis, and Jaccard. Patterns in diversity as a response to the intervention of RBAC will be visualised with PCoA (Principal Coordinate Analysis) with the statistical significance of groupings validated with an ANOSIM (Analysis Of SIMilarity) test in the context of other potentially interacting variables in the dataset. Differentially abundant microbial taxa that distinguish between groups will be identified using ANCOM (Analysis of Composition of Microbiomes) and further visualised with the WGCNA (Weighted Correlation Network Analysis).
Results
The following section presents the interim analysis results of the RBAC-QoL study based on data collected from two cancer centres in the Central Western region of New South Wales until January 2023. Recruitment remains ongoing at the time of analysis.
Recruitment Flow
The recruitment flow is depicted in Figure 1.
Between June 2020 and January 2023, 22 patients consented to participate in the study and were assessed for eligibility. Five were excluded; three did not meet the criteria for maintaining adequate major organ functions. One was excluded due to exceeding the age limit (which led to the subsequent removal of the upper age limit in a protocol amendment). Another patient declined to participate after screening but before randomisation. The patient complained of being unable to cope with cancer symptoms and treatment.
A total of 17 patients were randomised into the RBAC (n = 7) and Placebo group (n = 10). One participant from each group withdrew from the study before starting the trial. One participant in the RBAC group was hospitalised two weeks into the trial and later passed away due to rapidly progressing malignancy. The death was deemed unrelated to the study intervention. Two in the placebo group withdrew from the study due to not being able to cope with the cancer treatment. As such, five participants in the RBAC group and seven in the placebo group completed the trial. Based on the intention-to-treat principle, all randomised participants with at least some data collected were included in the analysis. One participant from the placebo group was excluded due to early withdrawal without providing baseline data. Hence, data from 16 participants (RBAC=7, Placebo=9) were analysed for the primary outcome. There is no significant difference in the ratio of completion and dropout between the two groups. Additionally, the compliance rates among the participants who completed the trial were high, with both groups achieving >99%.
Regarding the optional trial elements, only one out of seven participants in the RBAC group consented to provide faecal samples, compared to four out of nine participants in the placebo group. Only one participant in each group opted not to complete additional questionnaires for lifestyle factor assessment.
Participant Characteristics
Table 1 compares the participant characteristics between the two groups. Both groups have predominantly male participants (RBAC=85.7%, Placebo=88.9%), each group having only one female participant. There are no significant differences in the frequency distribution of sex, trial status, cancer stage, recurrency, metastasis, and treatment types based on Fisher’s exact tests. However, the RBAC group has a mean age of 70.8 ±7.34, marginally different from the placebo group (64±6.70, p = 0.079). However, when tested with the alternative hypothesis that the mean age of the RBAC group is greater than that of the placebo, the one-sided p-value is statistically significant (p = 0.040). Hence, participants in the RBAC group are significantly older than those in the placebo group, making age a potential influencing factor that needs to be accounted for.
As for primary cancer sites, the RBAC group includes patients with malignant melanoma (3), lung (2), bladder (1), and stomach (1) cancers, whereas the placebo group consists of patients diagnosed with cancers of the colon and rectal (4), malignant melanoma (2), lung (1), oesophageal (1), and kidney (1). It appears that the placebo group is over-represented by colon and rectal cancers. However, testing for nonrandom associations between primary cancer site and group allocation was not statistically significant (p = 0.177).
Primary Outcome Analysis
No statistically significant difference in effects at different time points between groups was detected for all QLQ-C30 scales/items except one: the global QoL score (QL2). The QL2 score was statistically different between groups (F[1,8] = 8.6, p = 0.019, eta2[g] = 0.267). However, the effects of time and the interaction between time and group were not statistically significant.
The pairwise comparisons of mean QL2 between groups for each time point are shown in Table 2. A statistically significant difference in global QoL was observed at visit 1 (week 6), with the RBAC group scoring 76.67 ± 6.97 in mean QL2 compared to 57.29 ± 17.50 in the placebo group (p = 0.032, Cohen’s d = 1.454). The mean QL2 difference between RBAC and placebo at visit 2 (week 12) was also marginally significant (79.77 ± 4.81 vs. 67.86 ± 10.13, p = 0.069, Cohen’s d = 1.427). The effect sizes at weeks 6 and 12 were considered large.
The difference in mean QL2 scores between groups over time is also depicted in Figure 2. The plot shows a dip in the global QoL of the placebo group at visit 1 (week 6) and recovered over the subsequent two visits before dropping again at the last visit. However, these differences over time were not statistically significant in pairwise comparison. In contrast, the global QoL of the RBAC group was relatively consistent over time. The most significant between-group difference was at visit 1.
Secondary Outcome Analysis
The body composition data collection was to be completed at pathology collection centres after the COVID-19 pandemic. However, many participants did not visit these collection centres for blood draws during the trial. As a result, body composition data, particularly body fat ratio and muscle mass, were not measured. Hence, only body weight and height from the participants’ clinical data were available for outcome analysis.
RM ANOVA was conducted on body weight, BMI, and the blood markers of NLR, and INI. No statistical significance results were detected between groups and across time points for these parameters. Therefore, the interim analysis could not isolate any potential RBAC effect on these nutritional and inflammatory markers beyond the placebo.
Exploratory Outcome Analysis
Among the 15 cytokines, chemokines, and growth factors analysed, only IL12p40 showed a significant result for the main analysis based on RM ANOVA. An effect across different timepoints was detected (F[4, 36] = 2.633, p = 0.05, eta2[g] = 0.05). However, the subsequent pairwise comparisons of different time points did not reveal any significant difference between any two visits for both groups. After eliminating extreme outliers from the dataset, the RM ANOVA analysis showed no significant change across time. Hence, the initial finding was a false positive due to a violation of the RM ANOVA assumptions caused by extreme outliners.
Microbiome analysis was not carried out in this interim analysis due to insufficient samples. Out of the 5 participants who agreed to provide faecal samples (RBAC=1, placebo=4), only 22 specimens were collected, with one in the placebo group dropping out after the second visit. Performing DNA amplification and sequencing using the Illumina MiSeq platform with such limited samples was not cost-effective. As such, the analysis has been deferred.
Safety Outcome Analysis
No safety issues were detected for all participants in their routine clinical assessment based on their blood tests of complete blood count, liver function, electrolytes, urea, creatinine and prealbumin. Two markers, white blood cell count (WBC) and total protein (TP), showed significant differences based on RM ANOVA and pairwise comparisons after multiplicity corrections. The WBC test was significantly different across time (F[4, 36] = 4.572, p = 0.004, eta2[g] = 0.175), whereas the TP test showed significant effects between groups (F[1, 9] = 5.133, p = 0.05, eta2[g] = 0.288) and the interaction of group and time (F[4, 36] = 4.137, p = 0.007, eta2[g] = 0.118).
Table 3 shows the pairwise comparisons of the means of WBC and TP for the two groups across different time points. Significant between-group differences were observed for WBC at visit 3, with 7.68 ± 0.99 for RBAC, higher than the 5.80 ± 1.13 recorded in the placebo group (p = 0.022, Cohen’s d = 1.767). The mean TP values of the RBAC group were also higher than those of the placebo group at visits 2 (77.00 ± 2.16 vs. 69.13 ± 5.03, p = 0.015, Cohen’s d = 2.035) and 3 (79.50 ± 5.97 vs. 68.86 ± 4.88, p = 0.010, Cohen’s d = 1.952). Note that the difference in mean TP at visit 4 was also marginally significant (p = 0.056, Cohen’s d = 1.421).
The trends of WBC and TP for the two groups over time are visualised in Figure 3. Although time effects were detected as statistically significant with RM ANOVA, pairwise comparisons of different time points by groups did not yield any significant difference after the p-values were corrected for multiplicity with FDR.
Correlations of Significant Outcomes
The pairwise correlation coefficients of the QL2, WBC and TP as significant outcomes of this trial are shown in Table 4. A strong positive correlation was detected between TP and WBC (r = 0.539, p < 0.001) compared to a moderate positive correlation between TP and QL2 (r = 0.338, p = 0.010). In contrast, the correlation between QL2 and WBC was positive but weak (r = 0.156, p = 0.248). Hence, improved QoL in the participants appeared linearly associated with increased TP during treatment.
Analysis of Lifestyle Factors
RM ANOVA was applied to analyse ARFS as the indicator of diet, MET score for physical activity and CAMQ score for usage and belief in complementary therapies. Analysis of ARFS and CAMQ scores were unremarkable. Only the MET score showed a significant difference for time effect (F[4, 28] = 5.376, p = 0.002, eta2[g] = 0.325). However, pairwise comparisons between time points by group did not reveal any significant difference for both groups after adjustment for multiple comparisons.
The differences in mean MET scores between time points become significant after combining the data from all participants, as shown in Table 5. Specifically, differences between visits 1 and 2 (p = 0.046, Cohen’s d = -0.887), 1 and 3 (p = 0.040, Cohen’s d = -0.985), 2 and 4 (p = 0.033, Cohen’s d = 1.223), and 3 and 4 (p = 0.033, Cohen’s d = 1.370) were statistically significant.
Changes in physical activity levels over time are illustrated in Figure 4. The participants were sedentary at the start of treatment (weeks 0 to 6) but became more active physically at weeks 12 and 18 while slowing down at the end of their treatment (week 24). Both groups exhibited similar behaviours with no significant difference in MET score at any time point. Hence, physical activity level was not likely a confounding variable that could influence the between-group differences in the current experiment.
Adjusted Analysis
ANCOVA was performed for outcome variables QL2, WBC, and TP with age as a covariate. For the global QoL scores, the group effect was reduced after adjusting for age variation but remained marginally significant (F[1, 7] = 4.731, p = 0.066, eta2[g] = 0.217). The effects of time (F[4, 28] = 2.786, p = 0.046, eta2[g] = 0.190) and the interaction of time and age (F[4, 28] = 2.718, p = 0.050, eta2[g] = 0.186) were statistically significant.
The emmeans predicting the QL2 values after adjusting for age are shown in Table 6. There was a significant difference between RBAC and placebo groups at visit 3 (85.76 ± 10.42 vs. 67.66 ± 9.35, p = 0.039, d = 4.069). The predicted trends of QoL change for the two groups based on emmeans are shown in Figure 5. The RBAC group had a continuous upward trend in QoL improvement over time, whereas the placebo group showed a fluctuating QoL that did not deviate much from the baseline level.
Under ANCOVA with age as a covariate, a significant group-time interaction effect was detected for both WBC (F[4, 32] = 2.749, p = 0.045, eta2[g] = 0.118) and TP (F[4, 32] = 5.688, p = 0.001, eta2[g] = 0.147) after sphericity corrections. The emmeans of WBC and TP are shown in Table 7. A very significant between-group difference was detected after 18 weeks for WBC (8.65 ± 1.18 vs. 5.24 ± 1.06, p = 0.003, d = 6.775). For TP, significant between-group differences were shown at weeks 12 (79.45 ± 5.96 vs. 67.90 ± 5.19, p = 0.019, d = 4.670) and 18 (81.77 ± 7.18 vs. 67.56 ± 6.44, p = 0.023, d = 4.636).
Table 7 also includes the emmeans of the neutrophil counts of the RBAC and placebo groups. Similar to WBC, a significant between-group difference was detected for neutrophils at week 18 (4.75 ± 0.61 vs. 3.22 ± 0.55, p = 0.007, d = 5.869), albeit no effect was not detected under ANCOVA. The plots of emmeans over time for WBC and neutrophils showing parallel trends for both groups are shown in Figure 6 (I). As neutrophil is the most abundant type of WBC, its increased count during the trial set the RBAC group’s WBC emmeans higher than the placebo group over time. Figure 6 (II) plots TP emmeans over time comparing RBAC to the placebo groups. The graph shows a similar trend compared to the unadjusted mean TP values in Figure 3.
Adverse Events
Table 8 shows a comparison between the two groups in terms of the adverse events reported during the trial period. The two groups had no statistically significant differences in mean adverse events reported per participant. There was one incident of life-threatening bowel obstruction in the placebo group where the patient was hospitalised. The event was resolved and deemed unlikely to be study-related. In the RBAC group, one death resulted from complications from a fast-growing malignancy unrelated to the study intervention two weeks after starting the trial. Most adverse events were mild (RBCA = 73.1%, placebo = 90%) to moderate (RBCA = 23.1%, placebo = 8%). The differences in grading distribution showed a higher portion of moderate adverse events in the RBAC group but were not statistically significant.
Fatigue was the most common adverse event reported in both groups (RBAC = 15.4%, placebo = 14%). Participants in the placebo group reported five incidents of oral thrush, but none was reported in the RBAC group. Other adverse events reported include diarrhoea, chemotherapy-induced peripheral neuropathy, constipation, cough, nausea, rash, shortness of breath, and dysgeusia. Of all the events, 96% were deemed unrelated to the study intervention. The oncologists rated three adverse events (diarrhoea, abdominal pain, and dysgeusia) as possibly study-related, with one in the RBAC group and two in the placebo group. However, these adverse events were also commonly associated with oncological treatment. Overall, there was no significant difference between groups in adverse events reported.
Discussion
The RBAC-QoL study aims to determine the potential effect of RBAC compared to placebo on the QoL of cancer patients undergoing active treatment. This interim analysis showed encouraging results, with RBAC showing a statistically significant difference in increasing QoL over placebo during the trial with a large effect size in the primary analysis (F[1,8] = 8.6, p = 0.019, eta2[g] = 0.267). Specifically, the global QoL scores of the patients taking RBAC were higher than those taking placebos at week 6 and marginally higher at week 12 during the trial. The placebo group had a drop in global QoL at week 6 before experiencing some recovery after that (Figure 2). Since the participants were starting active treatment at baseline, a decline in QoL was expected since antitumour treatment, especially chemotherapy with unwanted side effects, could negatively affect their well-being (Chagani et al., 2017; Sibeoni et al., 2018). The RBAC group, however, maintained their QoL throughout the trial while on active treatment, revealing the effectiveness of RBAC in QoL maintenance. Notably, the reported effect size (eta2[g] = 0.267) is considered large for ANOVA (Lakens, 2013), and Cohen’s d measuring the differences in mean QL2 between groups at weeks 6 and 12 were large and thus clinically significant (Cocks et al., 2010). The treatment effects of RBAC appeared more pronounced after adjusting for the age differences between groups (Figure 5). Such favourable observation is thus consistent with the results of Tan and Flores (2020), whereby there was a statistically significant difference in the mean QoL scores (p = 0.019) between the RBAC and placebo groups two months after radiation treatment for participants with head and neck cancers.
Other RCTs have reported RBAC’s benefits in reducing cancer treatment’s side effects. Masood et al. (2013) studied the incidents of side effects in breast cancer patients taking RBAC compared to those who did not during six cycles of chemotherapy using a self-reporting questionnaire. Reductions in the proportions of patients experiencing anorexia/tiredness (RBAC vs. control: 20% vs. 88%), nausea/vomiting (40% vs. 100%), hair loss (28% vs. 100%), and weight loss (0% vs. 84%) were reported. Another study by Petrovics et al. (2016) also reported significant alleviation of fatigue symptoms (p<0.001) in cancer patients with chronic fatigue syndrome after 24 weeks of RBAC plus oncothermia interventions during active treatment compared to control patients who received only conventional oncological treatment. The fatigue measurement was based on the Chalder fatigue questionnaire and Patients’ Global Impression of Change (PGIC) scales.
In the present study, fatigue was also one of the treatment side effects experienced by the participants. However, no statistically significant differences between the groups were detected in fatigue and other treatment side-effects, such as nausea and vomiting or pain, based on QLQ-C30. Such discrepancy could be due to the lack of sensitivity in the symptom scores of QLQ-C30, based on 4-point Likert scales. Finstad (2010) found that 7-point Likert items could provide a more accurate measure of a participant’s evaluation than a 5-point scale (let alone 4) in electronic questionnaires. Moreover, the lack of sensitivity in the symptom scales could also be compounded by the small sample size in this interim analysis, which may not have enough power. Therefore, to assess treatment side effects, future studies should consider augmenting the QLQ-C30 with a more specific self-evaluated adverse effects questionnaire, such as the 10-item instrument proposed by Montemurro et al. (2016) and the Chalder fatigue questionnaire.
While RBAC was hypothesised to impact the QoL of cancer patients via the inflammatory and nutritional pathways, none of the secondary and exploratory outcome measures, including BMI, INI, NLR, and cytokine profile, showed significant differences between groups. Notwithstanding, this interim analysis detected substantial between-group differences in WBC and TP from the routine safety assessment of participants with considerably large effect sizes, albeit not being the pre-established outcome measures of interest. The analysis found relatively higher WBC and TP in the RBAC group compared to the placebo group at visits 2 and 3 (Figure 3). In particular, the rise in WBC resulted from rising neutrophil count in the RBAC group based on the age-adjusted analysis (Figure 6).
Two other RBAC RCTs also examined WBC. Itoh et al. (2015) compared RBAC to placebo in patients with cervical cancer undergoing chemoradiotherapy. Depletion of WBC was reported in all patients after three weeks of treatment due to radiation side effects. However, no significant difference between groups was found, although the study authors commented that the control group tended to have lower WBC than the RBAC group. Radiation therapy also caused head and neck cancer patients to have lower posttreatment WBC in the RCT by Tan and Flores (2020). Similarly, there was no significant difference between the RBAC and placebo groups in this study. Therefore, RBAC was not known to affect WBC. The current study is the first to demonstrate that RBAC could potentially preserve and improve the WBC profiles of cancer patients during active treatment with chemotherapy or immunotherapy.
The potential effects of RBAC on cancer patients’ neutrophil count were previously reported by Golombick et al. (2016) in a single-arm before and after study in patients with monoclonal gammopathy of undetermined significance (MGUS)/smouldering multiple myeloma (SMM). Combining RBAC with curcumin improved the neutrophil count of eight out of 10 MGUS/SMM patients after six months. In another case series by Tsunekawa (2004) with 16 cancer patients who had recently completed oncological treatment, the proportion of patients who had increased, unchanged, and decreased neutrophil categorisation after six months of RBAC treatment were 5/16, 5/16, and 6/16, respectively. Hence, RBAC appeared to maintain or increase the neutrophil count 10/16 of these patients. Many cancer patients develop neutropenia due to chemotherapy, thus increasing the risk of infection (Lustberg, 2012). Hence, the findings of this interim analysis are consistent with these earlier reports. RBAC’s immunomodulatory effect appeared to help maintain adequate neutrophil count in cancer patients during and after treatment.
TP measures the concentration of proteins dissolved in the plasma, which consists mainly of albumins and globulins (Rahman & Begum, 2005). Older cancer patients, those with gastrointestinal cancer, and malnutrition were found to be significantly associated with hypoproteinemia (Enkobahry et al., 2023). As a marker for protein-energy malnutrition, TP has been found to correlate well with nutritional screening based on the subjective global assessment tool in cancer patients (Enkobahry et al., 2023). The current analysis found that the participants’ TP strongly correlated with their WBC level (r = 0.539), and a moderate correlation with their QoL scores (r = 0.338) was also detected. The RBAC group demonstrated better QoL at weeks 6 and 12 of active treatment than the placebo group, coinciding with their higher TP and WBC. These preliminary findings support that RBAC could improve QoL via the immuno-nutrition pathway by interacting with the immune system and nutritional status. However, the lower TP levels in the placebo group may also result from the overrepresentation of colorectal cancer patients with an increased risk of malnutrition (Lewandowska et al., 2022). Therefore, further validation in the final analysis with a larger sample size and a more balanced group is needed.
Physical activity is recommended for all cancer patients at all stages of their treatment (Misiąg et al., 2022), and many oncologists routinely advise patients to be physically active (Hardcastle et al., 2018). The pattern of changing physical activity levels among the participants in this analysis is intriguing, albeit not directly related to the study objectives. The inverted V curve (Figure 4) depicted a scenario in which the generally sedentary participants at baseline complied with the advice and were more physically active during the treatment. However, they appeared to be lowering their physical activity level near the end of the treatment. Such behaviour warrants further investigation to inform the design of interventional exercise programmes as supportive care for cancer patients during and after treatment to improve outcomes and QoL.
Conclusions
This paper presents a statistical plan and an interim analysis of the RBAC-QoL study. The preliminary findings based on 16 participants showed encouraging results that RBAC could improve the QoL of cancer patients beyond placebo during active treatment, most prominently at six to 12 weeks into the trial. The QoL improvement may be due to effects on the immuno-nutritional pathway, with the RBAC group showing higher WBC and TP levels than the placebo group, which correlated with the QoL scores. Such preliminary findings, however, should be interpreted with caution as the trial remains ongoing, and the detected effect size will likely change with a larger sample size. Regardless, this analysis provides valuable information for designing a larger RCT to confirm RBAC’s beneficial effects on cancer patients' QoL.
Supplementary Materials
The following supporting information can be downloaded at the website of this paper posted on Preprints.org.
Declarations
SLO is a recipient of the Australian Government Research Training Program scholarship for his PhD study. This study will contribute toward the Ph.D. degree for SLO.
Author Contributions
SLO: Conceptualisation, Methodology, Software, Formal analysis, Investigation, Data Curation, Writing - Original Draft, Visualisation. PSM: Conceptualisation, Methodology, Validation, Writing - Review & Editing. RZ: Conceptualisation, Methodology, Investigation, Validation, Resources, Writing - Review & Editing. SCP: Conceptualisation, Methodology, Validation, Resources, Writing - Review & Editing, Supervision, Project administration.
Funding
This clinical trial is funded by Daiwa Pharmaceutical Co., Ltd. (Japan) and BioMedica Nutraceuticals Pty Ltd. (Australia). The funding bodies have no involvement in study design, collection, management, analysis and interpretation of data or the decision to submit for publication.
Acknowledgement
The authors acknowledge the assistance of Emily Schupfer and Tegan Grosfeld in trial coordination and data collection for this study.
Conflicts of Interest
The authors have no conflicts of interest to declare.
References
- Bolyen, E., Rideout, J. R., Dillon, M. R., Bokulich, N. A., Abnet, C. C., Al-Ghalith, G. A., Alexander, H., Alm, E. J., Arumugam, M., Asnicar, F., Bai, Y., Bisanz, J. E., Bittinger, K., Brejnrod, A., Brislawn, C. J., Brown, C. T., Callahan, B. J., Caraballo-Rodríguez, A. M., Chase, J., . . . Caporaso, J. G. (2019). Reproducible, interactive, scalable and extensible microbiome data science using QIIME 2. Nature Biotechnology, 37, 852-857. [CrossRef]
- Chagani, P., Parpio, Y., Gul, R., & Jabbar, A. A. (2017). Quality of life and its determinants in adult cancer patients undergoing chemotherapy treatment in Pakistan. Asia-Pacific Journal of Oncology Nursing, 4, 140-146. [CrossRef]
- Cocks, K., King, M. T., Velikova, G., Martyn St-James, M., Fayers, P. M., & Brown, J. M. (2010). Evidence-based guidelines for determination of sample size and interpretation of the European Organisation for the Research and Treatment of Cancer Quality of Life Questionnaire Core 30. Journal of Clinical Oncology, 29, 89-96. [CrossRef]
- Cocks, K., & Torgerson, D. J. (2013). Sample size calculations for pilot randomized trials: a confidence interval approach. Journal of Clinical Epidemiology, 66, 197-201. [CrossRef]
- Collins, C. E., Burrows, T. L., Rollo, M. E., Boggess, M. M., Watson, J. F., Guest, M., Duncanson, K., Pezdirc, K., & Hutchesson, M. J. (2015). The comparative validity and reproducibility of a diet quality index for adults: The Australian Recommended Food Score. Nutrients, 7, 785-798. [CrossRef]
- Enkobahry, A., Sime, T., Kene, K., Mateos, T., Dilnesa, S., & Zawdie, B. (2023). Blood biomarkers as potential malnutrition screening alternatives among adult patients with cancer on treatment in oncology unit of jimma tertiary hospital: A cross-sectional analysis. BMC Nutrition, 9, 38. [CrossRef]
- Falci, S. G., & Marques, L. S. (2015). CONSORT: when and how to use it. Dental Press Journal of Orthodontics, 20, 13-15. [CrossRef]
- Fayers, P. M., Aaronson, N. K., Bjordal, K., Groenvold, M., Curran, D., Bottomley, A., & on behalf of the EORTC Quality of Life Group. (2001). EORTC QLQ-C30 Scoring Manual. European Organisation for Research and Treatment of Cancer. https://www.eortc.org/app/uploads/sites/2/2018/02/SCmanual.pdf.
- Finstad, K. (2010). Response interpolation and scale Sensitivity: Evidence against 5-point scales. Journal of Usability Studies, 5, 104–110.
- Forde, C. (2018). Scoring the International Physical Activity Questionnaire (IPAQ). The University of Dublin. https://ugc.futurelearn.com/uploads/files/bc/c5/bcc53b14-ec1e-4d90-88e3-1568682f32ae/IPAQ_PDF.pdf.
- Golombick, T., Diamond, T. H., Manoharan, A., & Ramakrishna, R. (2016). Addition of rice bran arabinoxylan to curcumin therapy may be of benefit to patients with early-stage B-cell lymphoid malignancies (monoclonal gammopathy of undetermined significance, smoldering multiple myeloma, or stage 0/1 chronic lymphocytic leukemia). Integrative Cancer Therapies, 15, 183-189. [CrossRef]
- Hardcastle, S. J., Kane, R., Chivers, P., Hince, D., Dean, A., Higgs, D., & Cohen, P. A. (2018). Knowledge, attitudes, and practice of oncologists and oncology health care providers in promoting physical activity to cancer survivors: an international survey. Supportive Care in Cancer, 26, 3711-3719. [CrossRef]
- Itoh, Y., Mizuno, M., Ikeda, M., Nakahara, R., Kubota, S., Ito, J., Okada, T., Kawamura, M., Kikkawa, F., & Naganawa, S. (2015). A randomized, double-blind pilot trial of hydrolyzed rice bran versus placebo for radioprotective effect on acute gastroenteritis secondary to chemoradiotherapy in patients with cervical cancer. Evidence-Based Complementary and Alternative Medicine, 2015, 974390. [CrossRef]
- Lakens, D. (2013). Calculating and reporting effect sizes to facilitate cumulative science: a practical primer for t-tests and ANOVAs. Frontiers in Psychology, 4, 863. [CrossRef]
- Lewandowska, A., Religioni, U., Czerw, A., Deptała, A., Karakiewicz, B., Partyka, O., Pajewska, M., Sygit, K., Cipora, E., Kmieć, K., Augustynowicz, A., Mękal, D., Waszkiewicz, M., Barańska, A., Mináriková, D., Minárik, P., & Merks, P. (2022). Nutritional treatment of patients with colorectal cancer. International Journal of Environmental Research and Public Health, 19, 6881. [CrossRef]
- Lustberg, M. B. (2012). Management of neutropenia in cancer patients. Clinical Advances in Hematology and Oncology, 10, 825-826. https://www.hematologyandoncology.net/archives/december-2012/management-of-neutropenia-in-cancer-patients/.
- Masood, A. I., Sheikh, R., & Anwer, R. A. (2013). “BIOBRAN MGN-3"; Effect of reducing side effects of chemotherapy in breast cancer patients [Article]. The Professional Medical Journal, 20, 13-16. http://www.theprofesional.com/index.php/tpmj/article/view/4869.
- Misiąg, W., Piszczyk, A., Szymańska-Chabowska, A., & Chabowski, M. (2022). Physical activity and cancer care - A review. Cancers, 14, 4154. [CrossRef]
- Montemurro, F., Mittica, G., Cagnazzo, C., Longo, V., Berchialla, P., Solinas, G., Culotta, P., Martinello, R., Foresto, M., Gallizioli, S., Calori, A., Grasso, B., Volpone, C., Bertola, G., Parola, G., Tealdi, G., Giuliano, P. L., Aglietta, M., & Ballari, A. M. (2016). Self-evaluation of adjuvant chemotherapy-related adverse effects by patients with breast cancer. JAMA Oncology, 2, 445-452. [CrossRef]
- Ooi, S. L., McMullen, D., Golombick, T., & Pak, S. C. (2018). Evidence-based review of BioBran/MGN-3 arabinoxylan compound as a complementary therapy for conventional cancer treatment. Integrative Cancer Therapies, 17, 165-178. [CrossRef]
- Ooi, S. L., Micalos, P. S., Kim, J., & Pak, S. C. (2023). Rice bran arabinoxylan compound as a natural product for cancer treatment – an evidence-based assessment of the effects and mechanisms [Preprint]. Preprints.org, 2023101057. [CrossRef]
- Ooi, S. L., Micalos, P. S., & Pak, S. C. (2023). Modified rice bran arabinoxylan by Lentinus Edodes mycelial enzyme as an immunoceutical for health and aging – A comprehensive literature review. Molecules, 28, 6313. [CrossRef]
- Ooi, S. L., Pak, S. C., Micalos, P. S., Schupfer, E., Zielinski, R., Jeffries, T., Harris, G., Golombick, T., & McKinnon, D. (2020). Rice bran arabinoxylan compound and quality of life of cancer patients (RBAC-QoL): Study protocol for a randomized pilot feasibility trial. Contemporary Clinical Trials Communications, 19, 100580. [CrossRef]
- Petrovics, G., Szigeti, G., Hamvas, S., Mate, A., Betlehem, J., & Hegyi, G. (2016). Controlled pilot study for cancer patients suffering from chronic fatigue syndrome due to chemotherapy treated with BioBran (MGN-3Arabinoxylane) and targeted radiofrequency heat therapy. European Journal of Integrative Medicine, 8, 29-35. [CrossRef]
- Rahman, M. Z., & Begum, B. A. (2005). Serum total protein, albumin and A/G ratio in different grades of protein energy malnutrition. Mymensingh Medical Journal, 14, 38-40. [CrossRef]
- Sibeoni, J., Picard, C., Orri, M., Labey, M., Bousquet, G., Verneuil, L., & Revah-Levy, A. (2018). Patients’ quality of life during active cancer treatment: a qualitative study. BMC Cancer, 18, 951. [CrossRef]
- Tan, D. F. S., & Flores, J. A. S. (2020). The immunomodulating effects of arabinoxylan rice bran ( Lentin ) on hematologic profile, nutritional status and quality of life among head and neck carcinoma patients undergoing radiation therapy: A double blind randomized control trial. Radiology Journal, The Official Publication of the Philippine College of Radiology, 12(February), 11-16. https://philippinecollegeofradiology.org.ph/wppcr/wp-content/uploads/Radiology-Journal-2020.pdf.
- Tsunekawa, H. (2004). Effect of long-term administration of immunomodulatory food on cancer patients completing conventional treatments. Clinical Pharmacology and Therapy, 14, 295-302.
- Whitehead, A. L., Julious, S. A., Cooper, C. L., & Campbell, M. J. (2015). Estimating the sample size for a pilot randomised trial to minimise the overall trial sample size for the external pilot and main trial for a continuous outcome variable. Statistical Methods in Medical Research, 25, 1057-1073. [CrossRef]
Figure 1.
The recruitment flow of the RBAC-QoL study from June 2020 to January 2023 in a CONSORT diagram.
Figure 1.
The recruitment flow of the RBAC-QoL study from June 2020 to January 2023 in a CONSORT diagram.
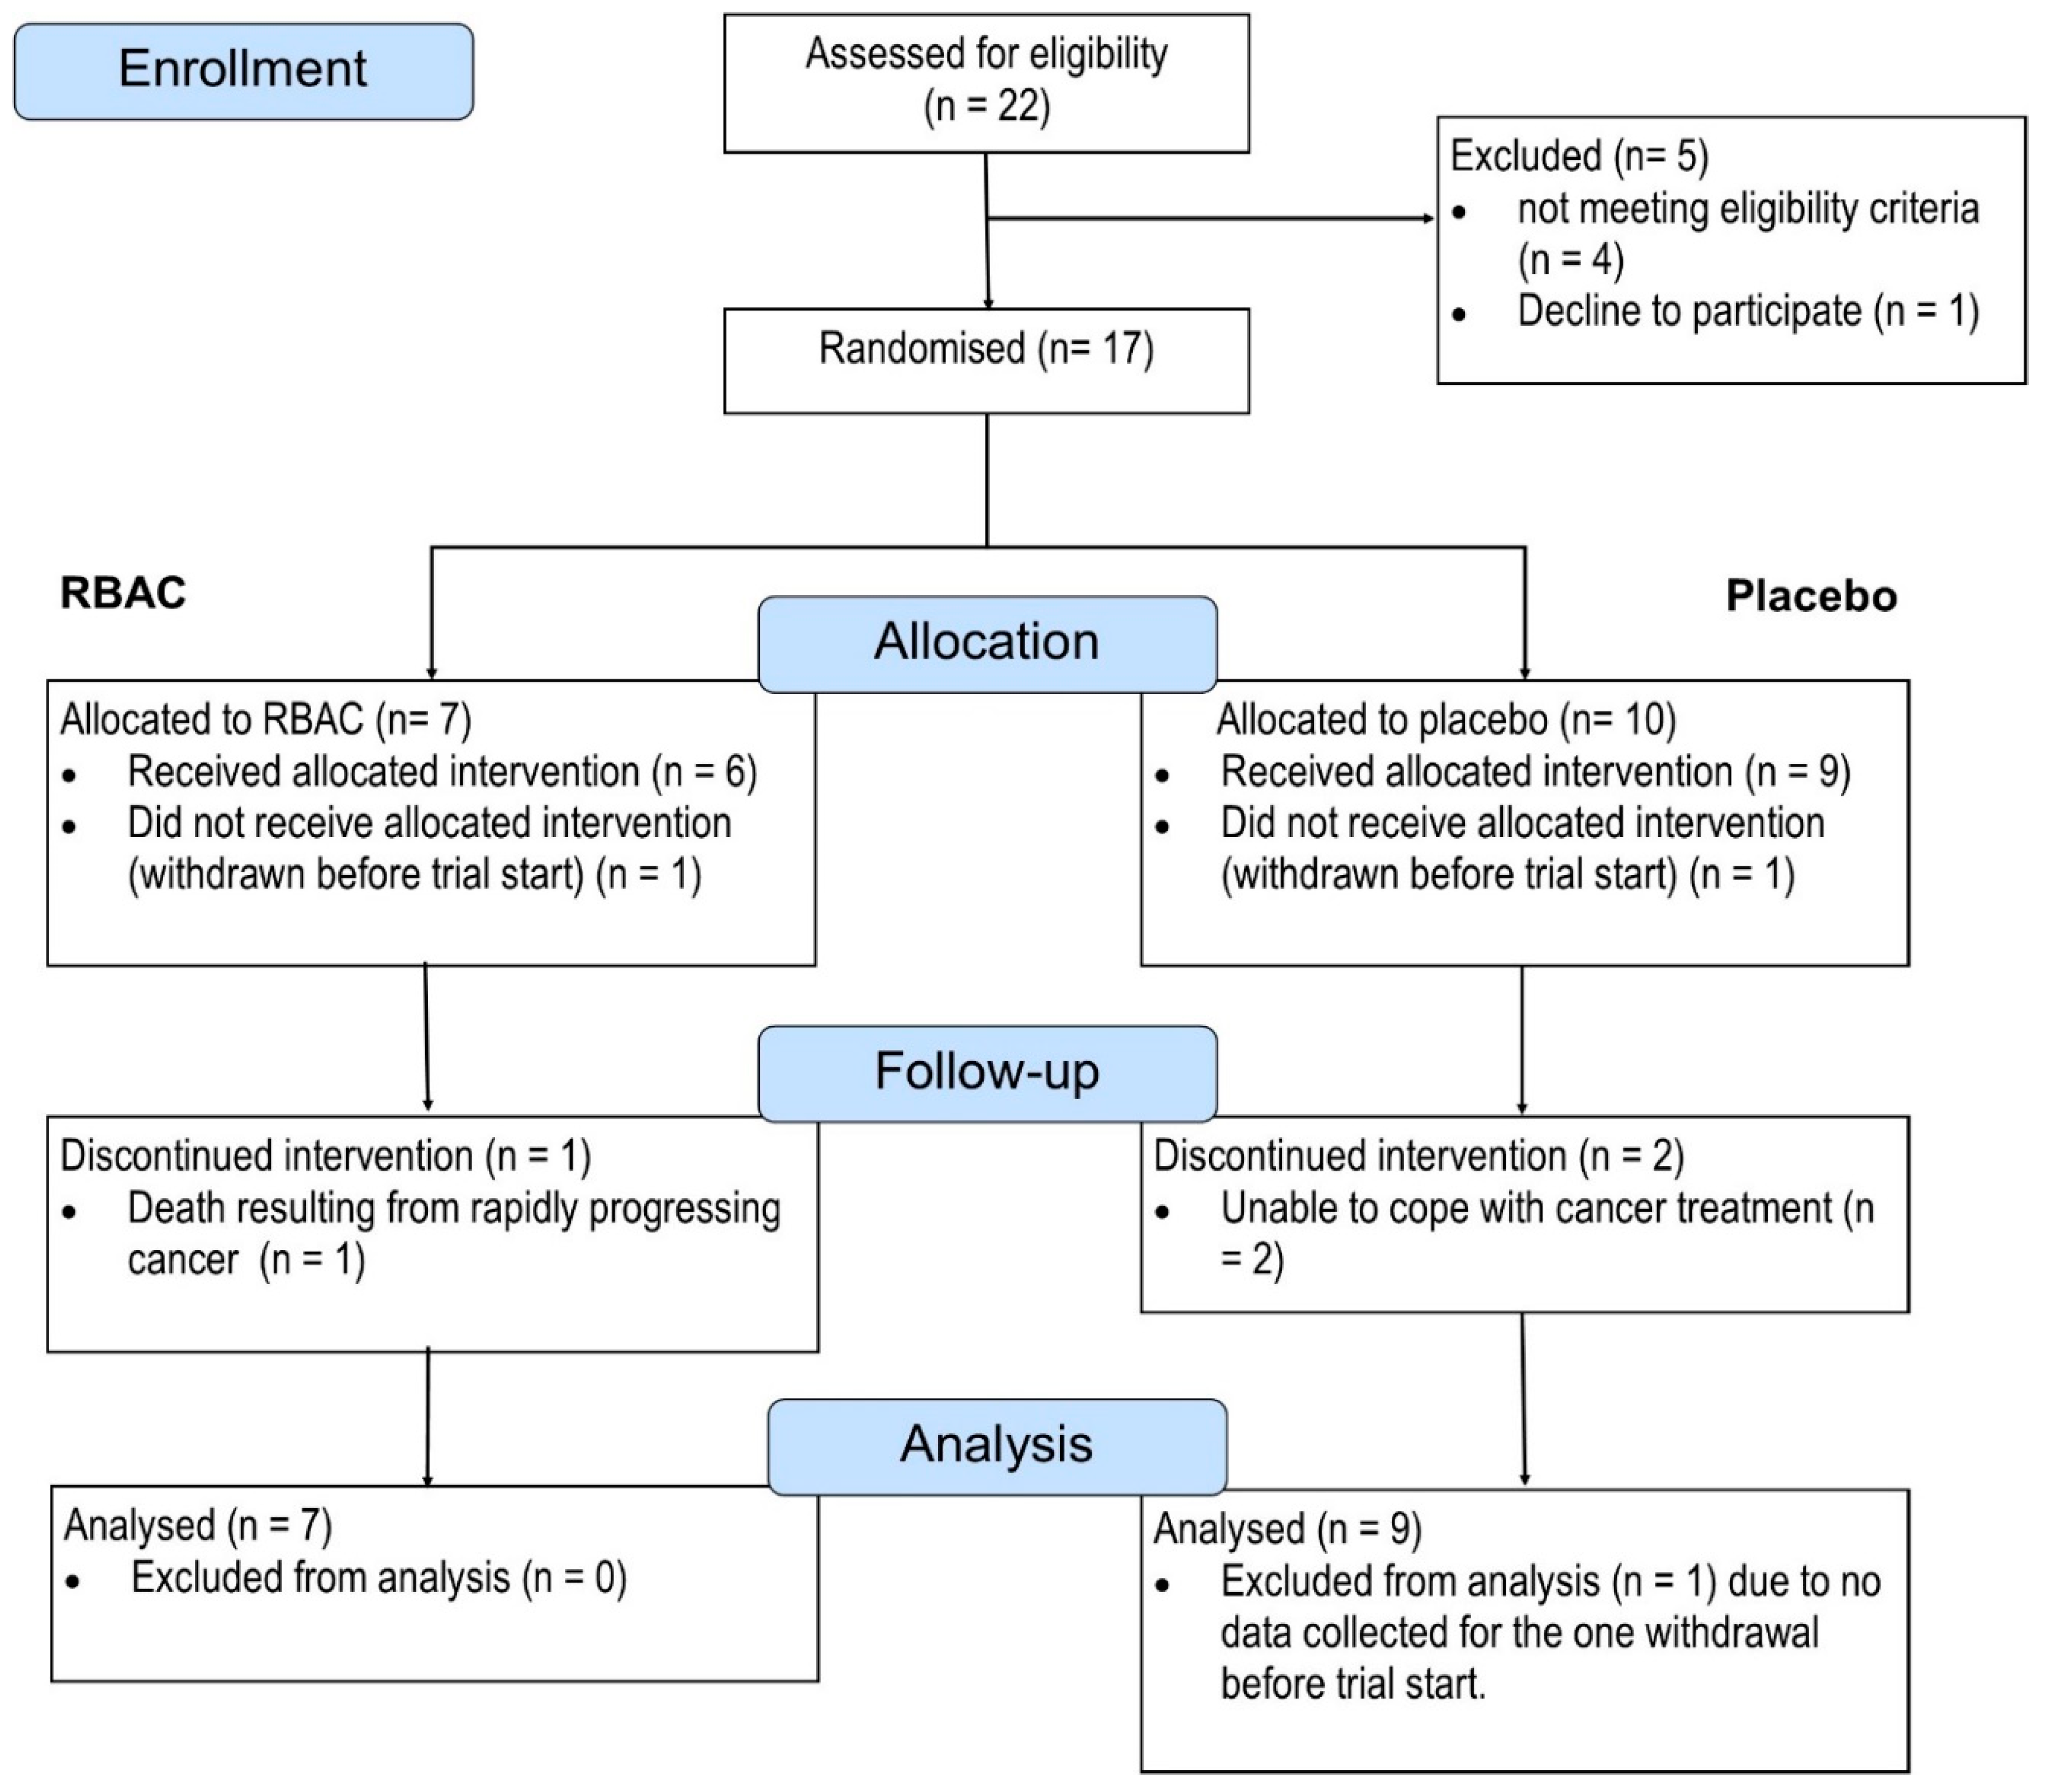
Figure 2.
A plot showing the mean global quality of life scores (QL2) for RBAC (A) and placebo (B) groups over time. * Significant difference p < 0.05.
Figure 2.
A plot showing the mean global quality of life scores (QL2) for RBAC (A) and placebo (B) groups over time. * Significant difference p < 0.05.
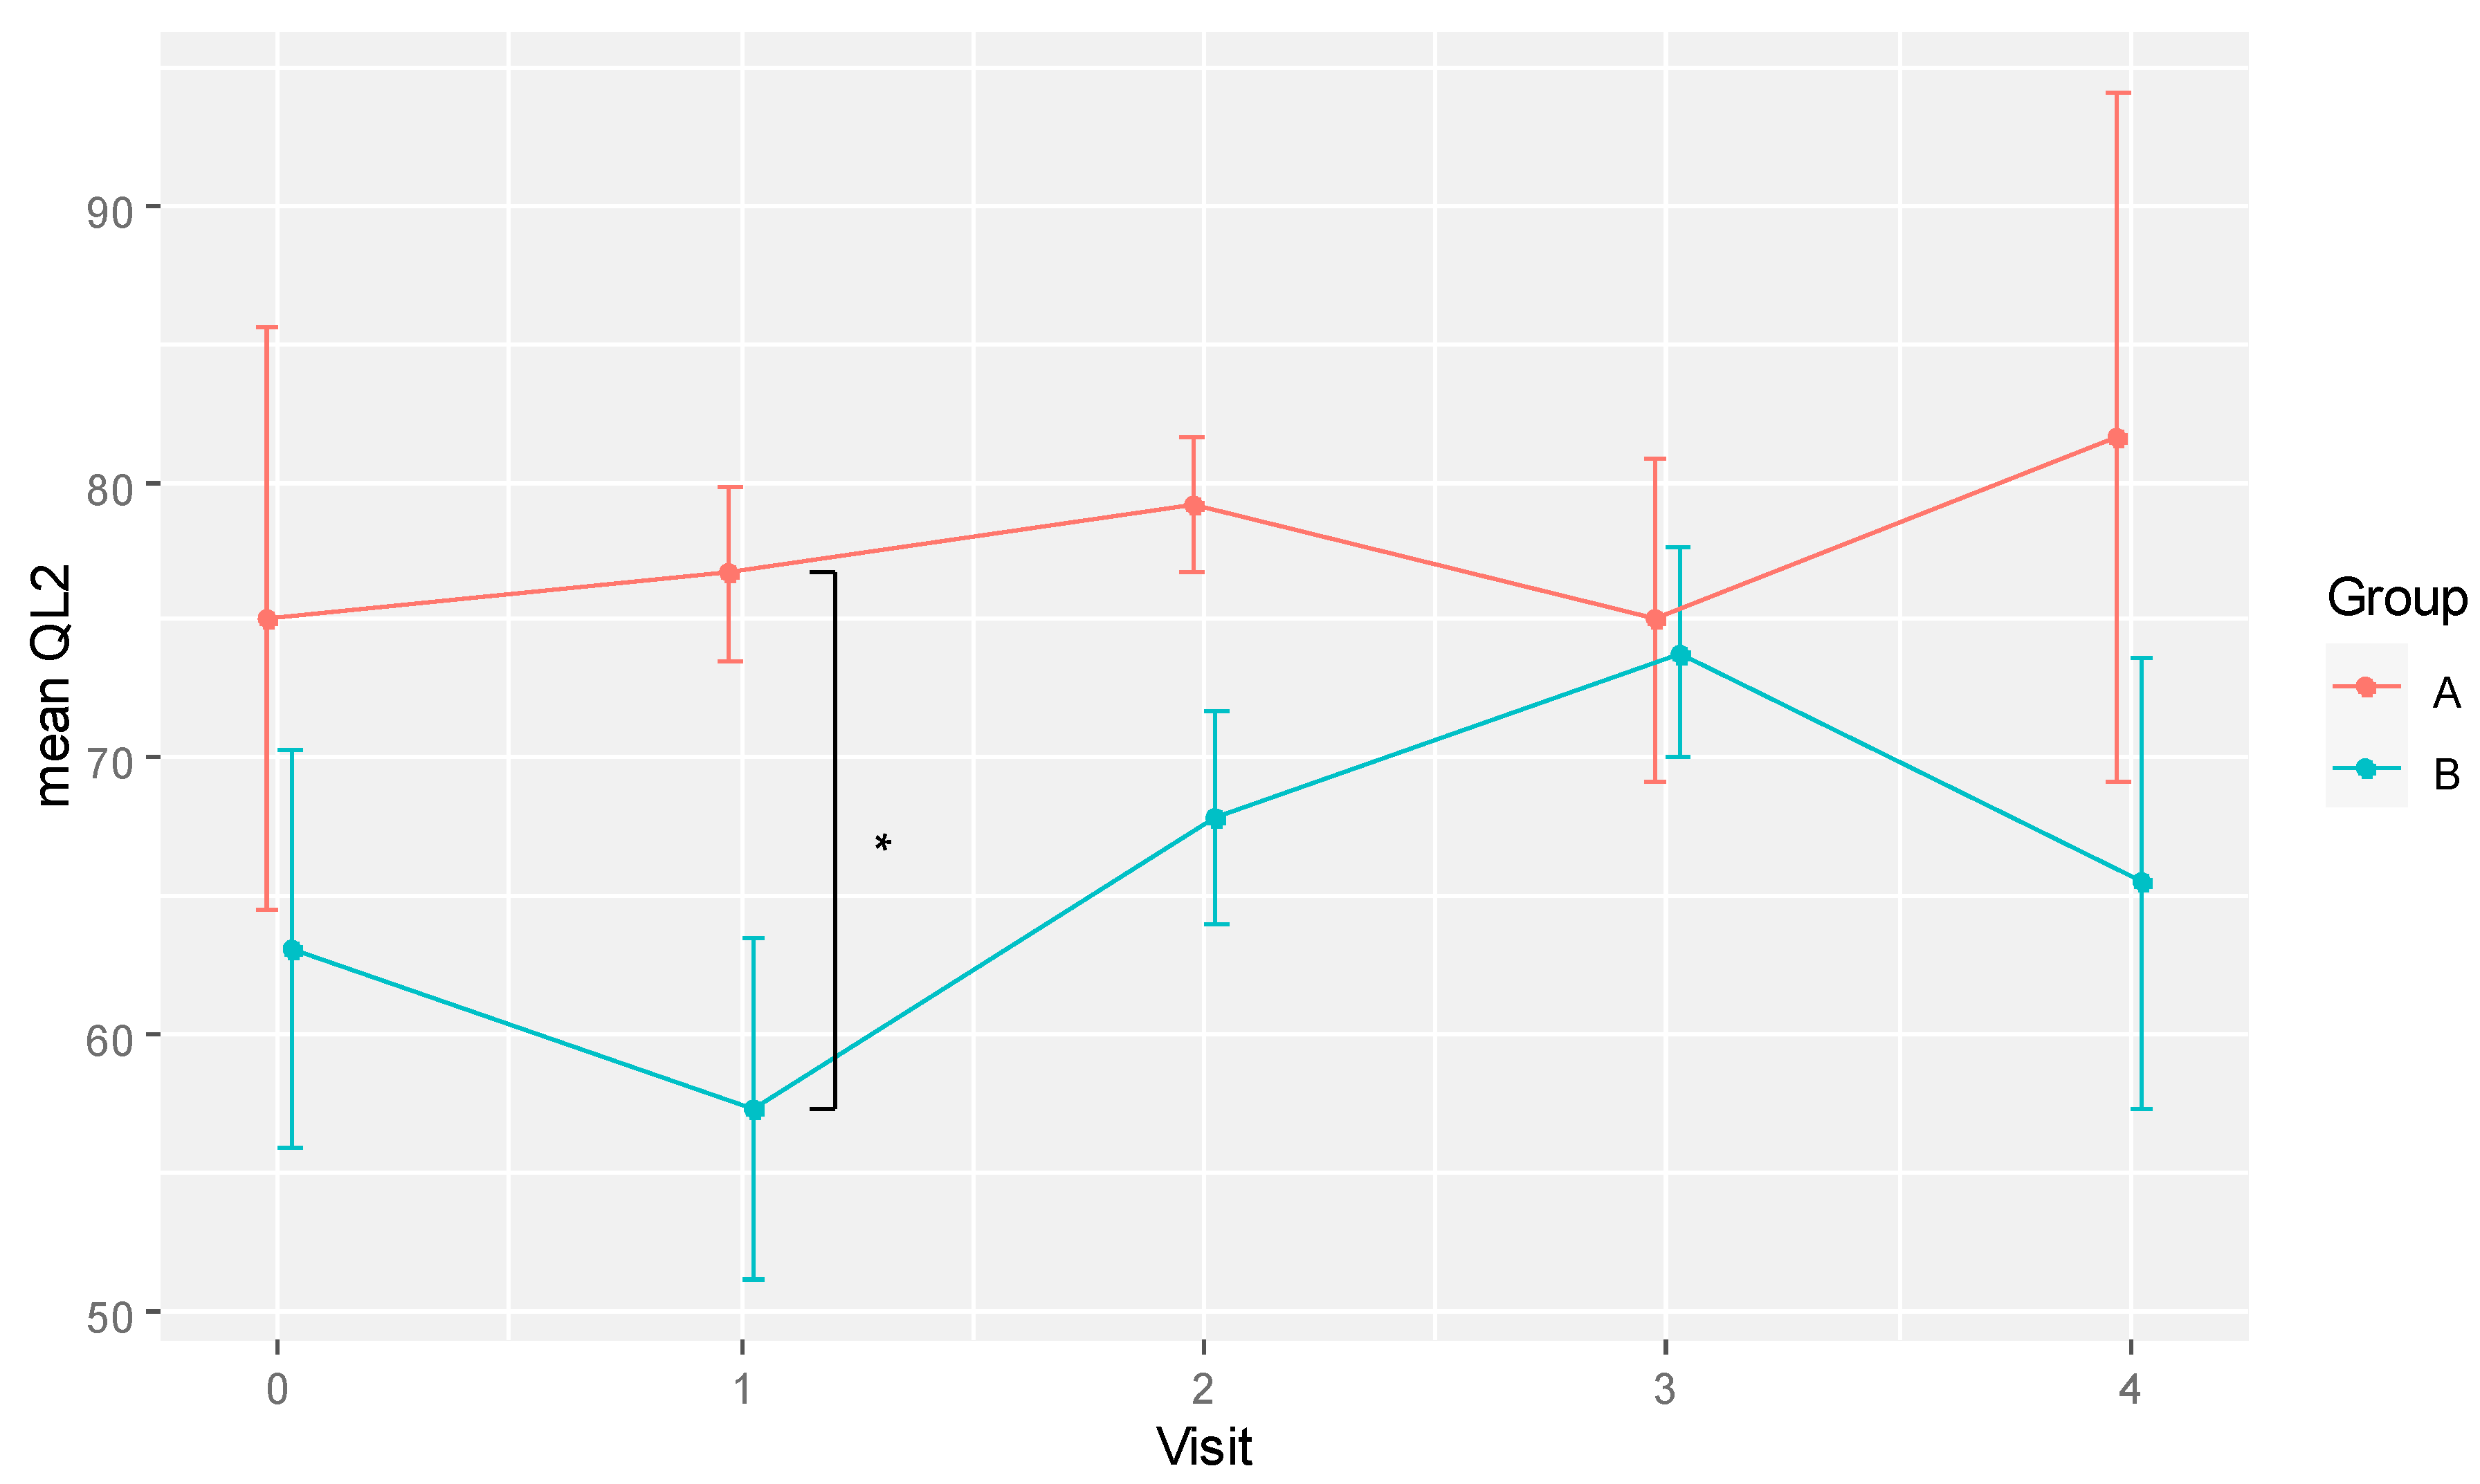
Figure 3.
Plots of (I) mean white blood cell count (WBC) and (II) total protein for RBAC (A) and placebo (B) groups over time. * Significant difference p < 0.05.
Figure 3.
Plots of (I) mean white blood cell count (WBC) and (II) total protein for RBAC (A) and placebo (B) groups over time. * Significant difference p < 0.05.
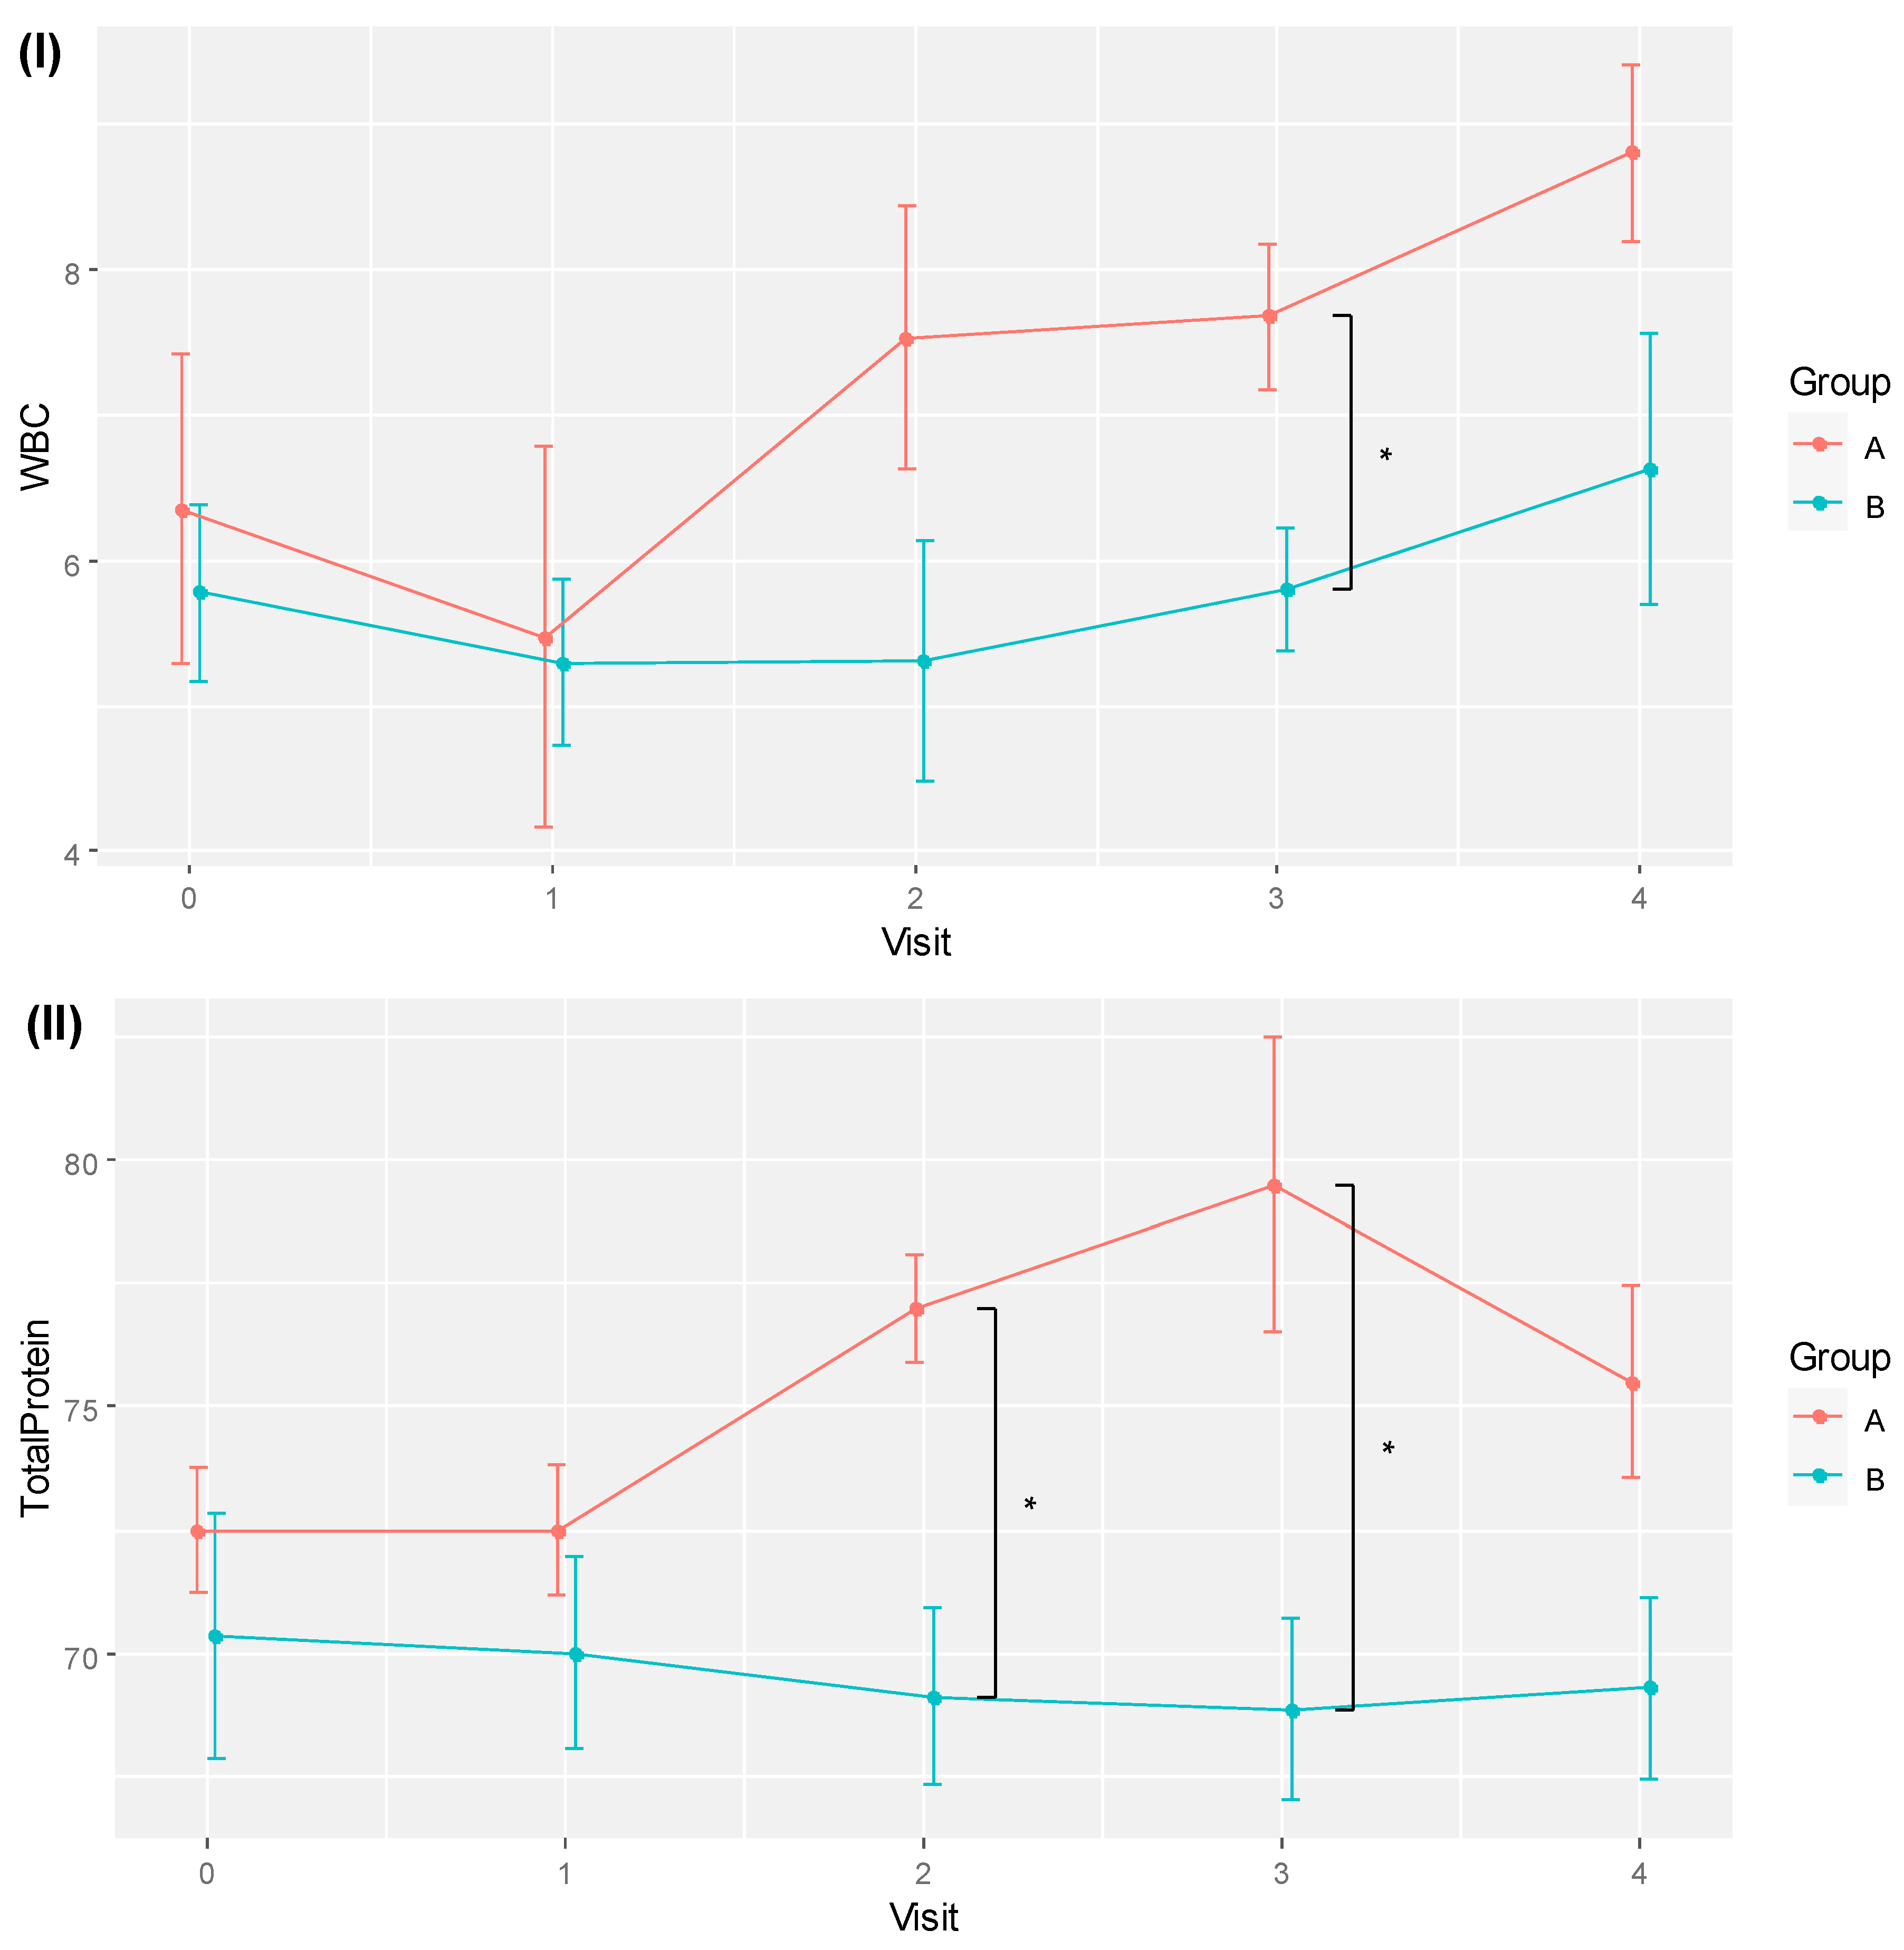
Figure 4.
A plot showing the physical activity levels (MET/week) for RBAC (A) and placebo (B) groups and all participants combined over time. * Significant difference p < 0.05.
Figure 4.
A plot showing the physical activity levels (MET/week) for RBAC (A) and placebo (B) groups and all participants combined over time. * Significant difference p < 0.05.
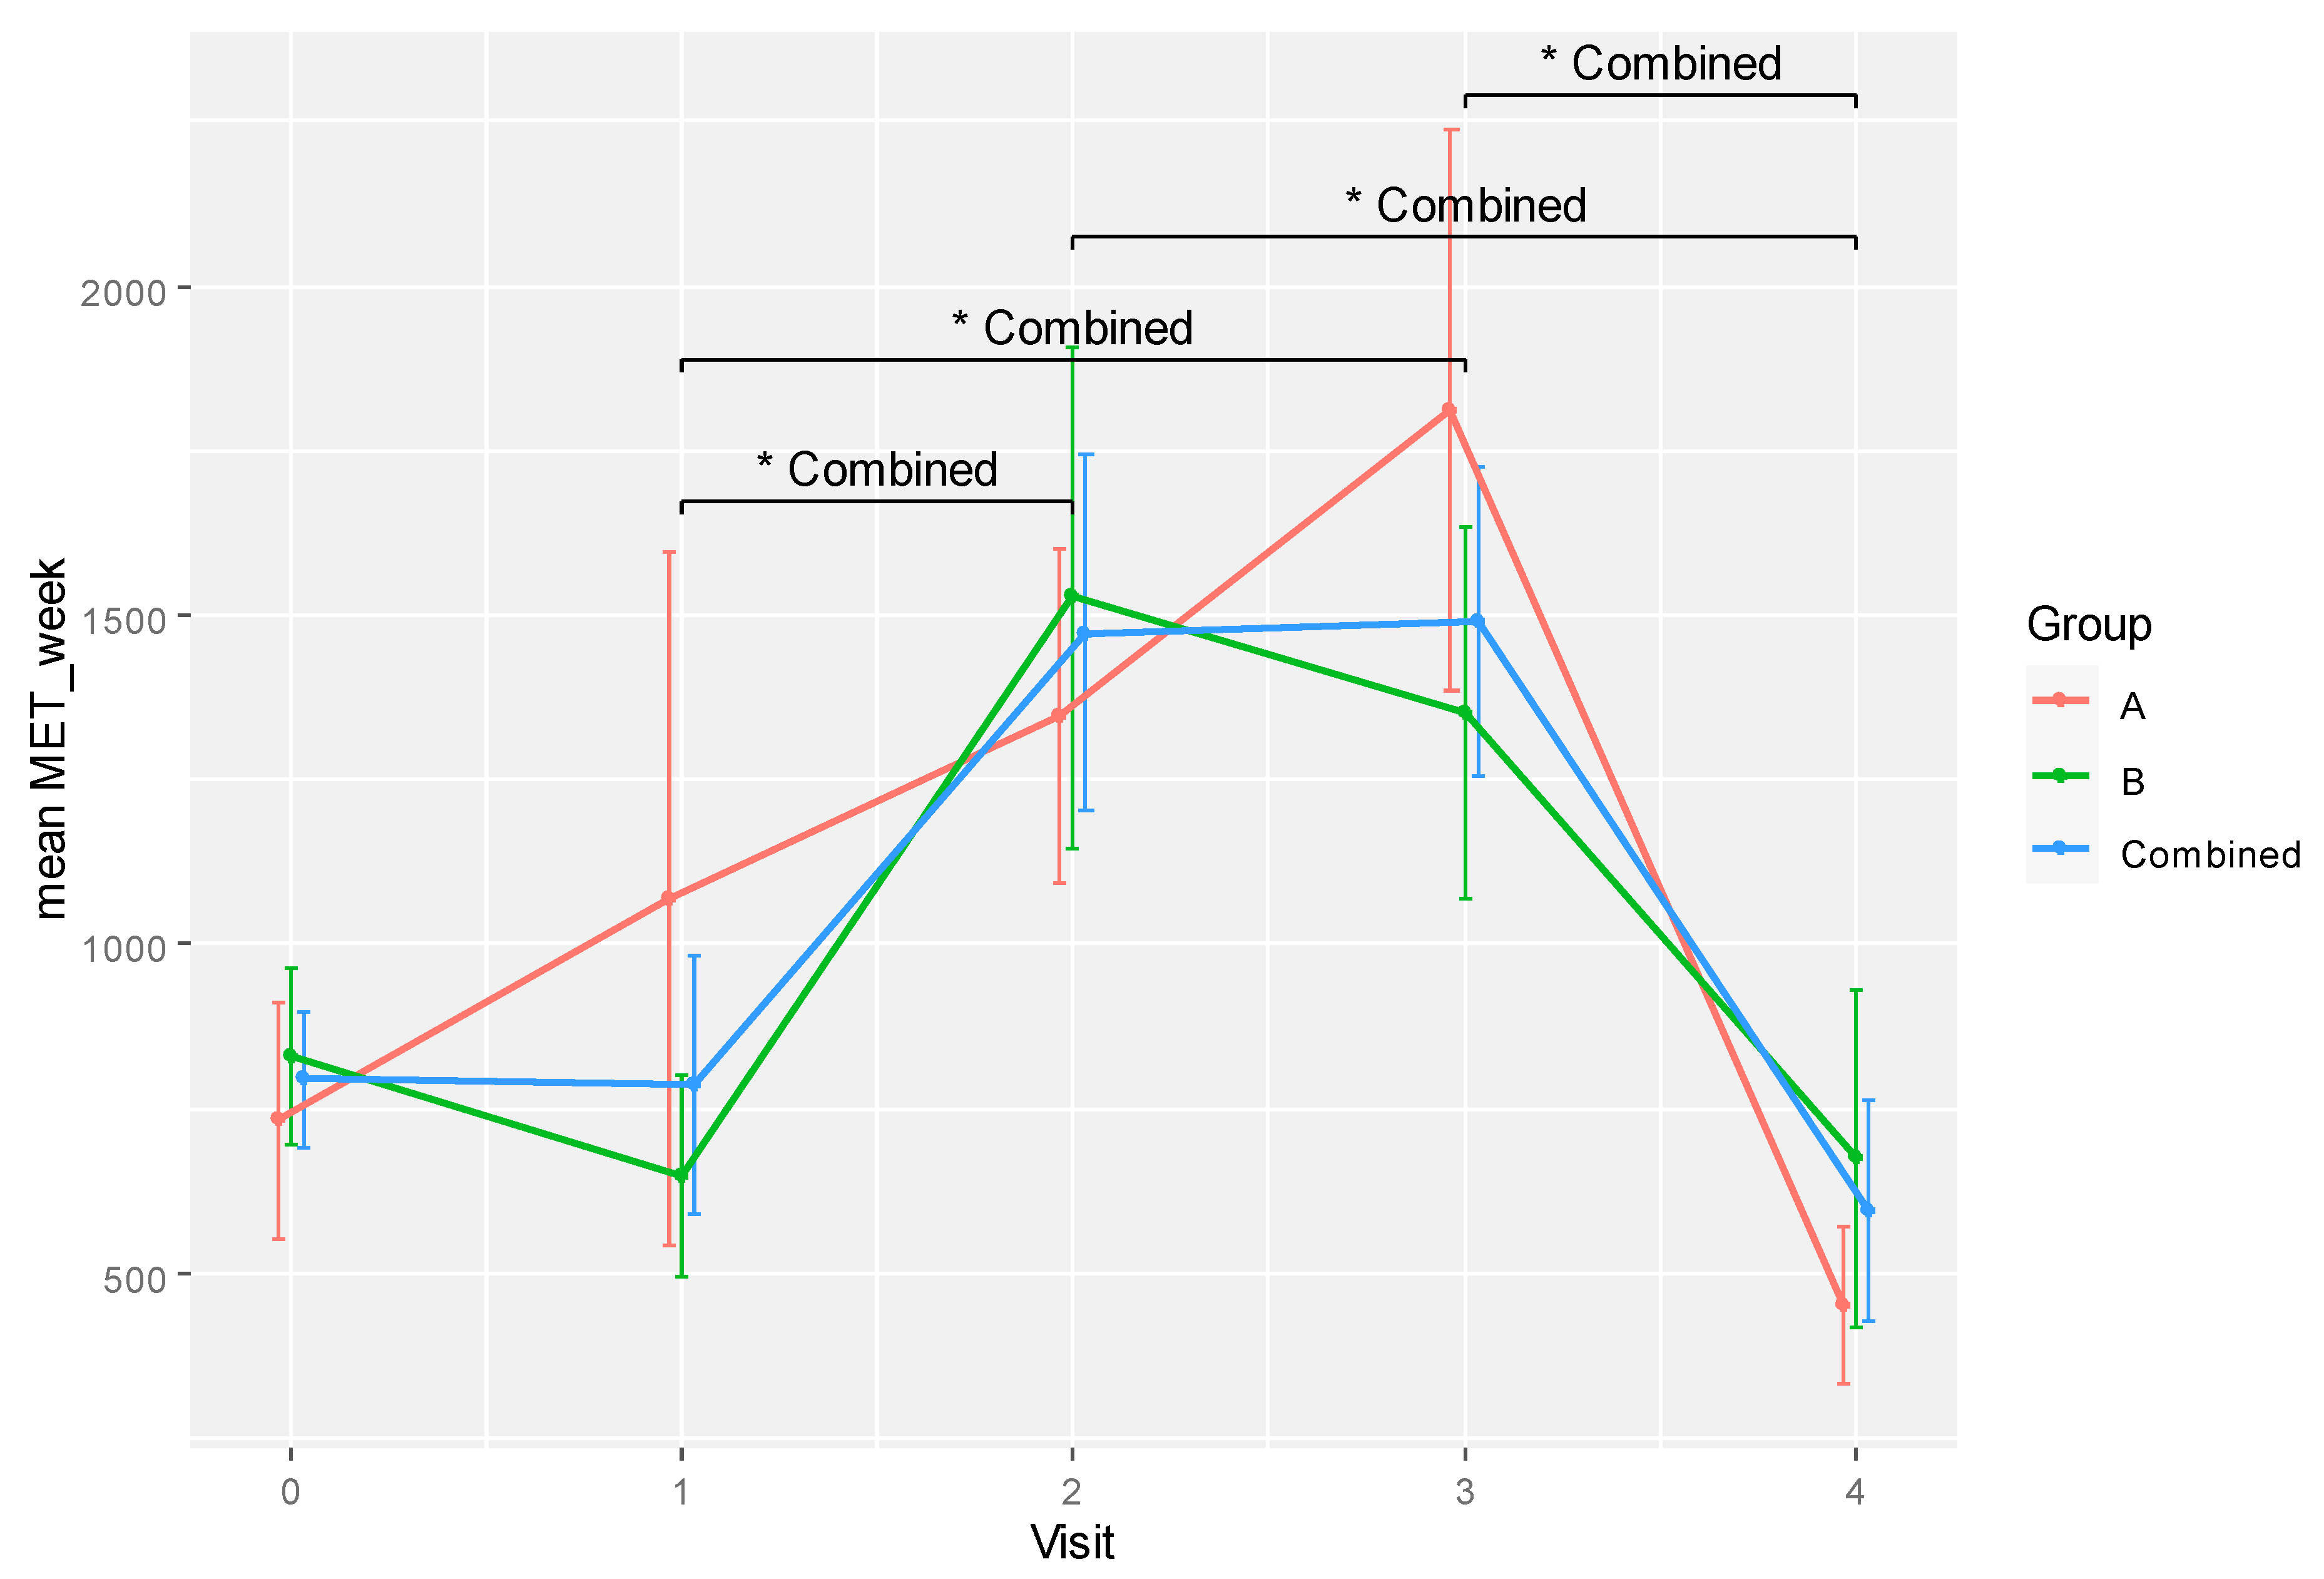
Figure 5.
A plot showing the trends of estimated marginal means (emmeans) in global quality of life score (QL2) for RBAC (A) and placebo (B) groups over time. * Significant difference p < 0.05.
Figure 5.
A plot showing the trends of estimated marginal means (emmeans) in global quality of life score (QL2) for RBAC (A) and placebo (B) groups over time. * Significant difference p < 0.05.
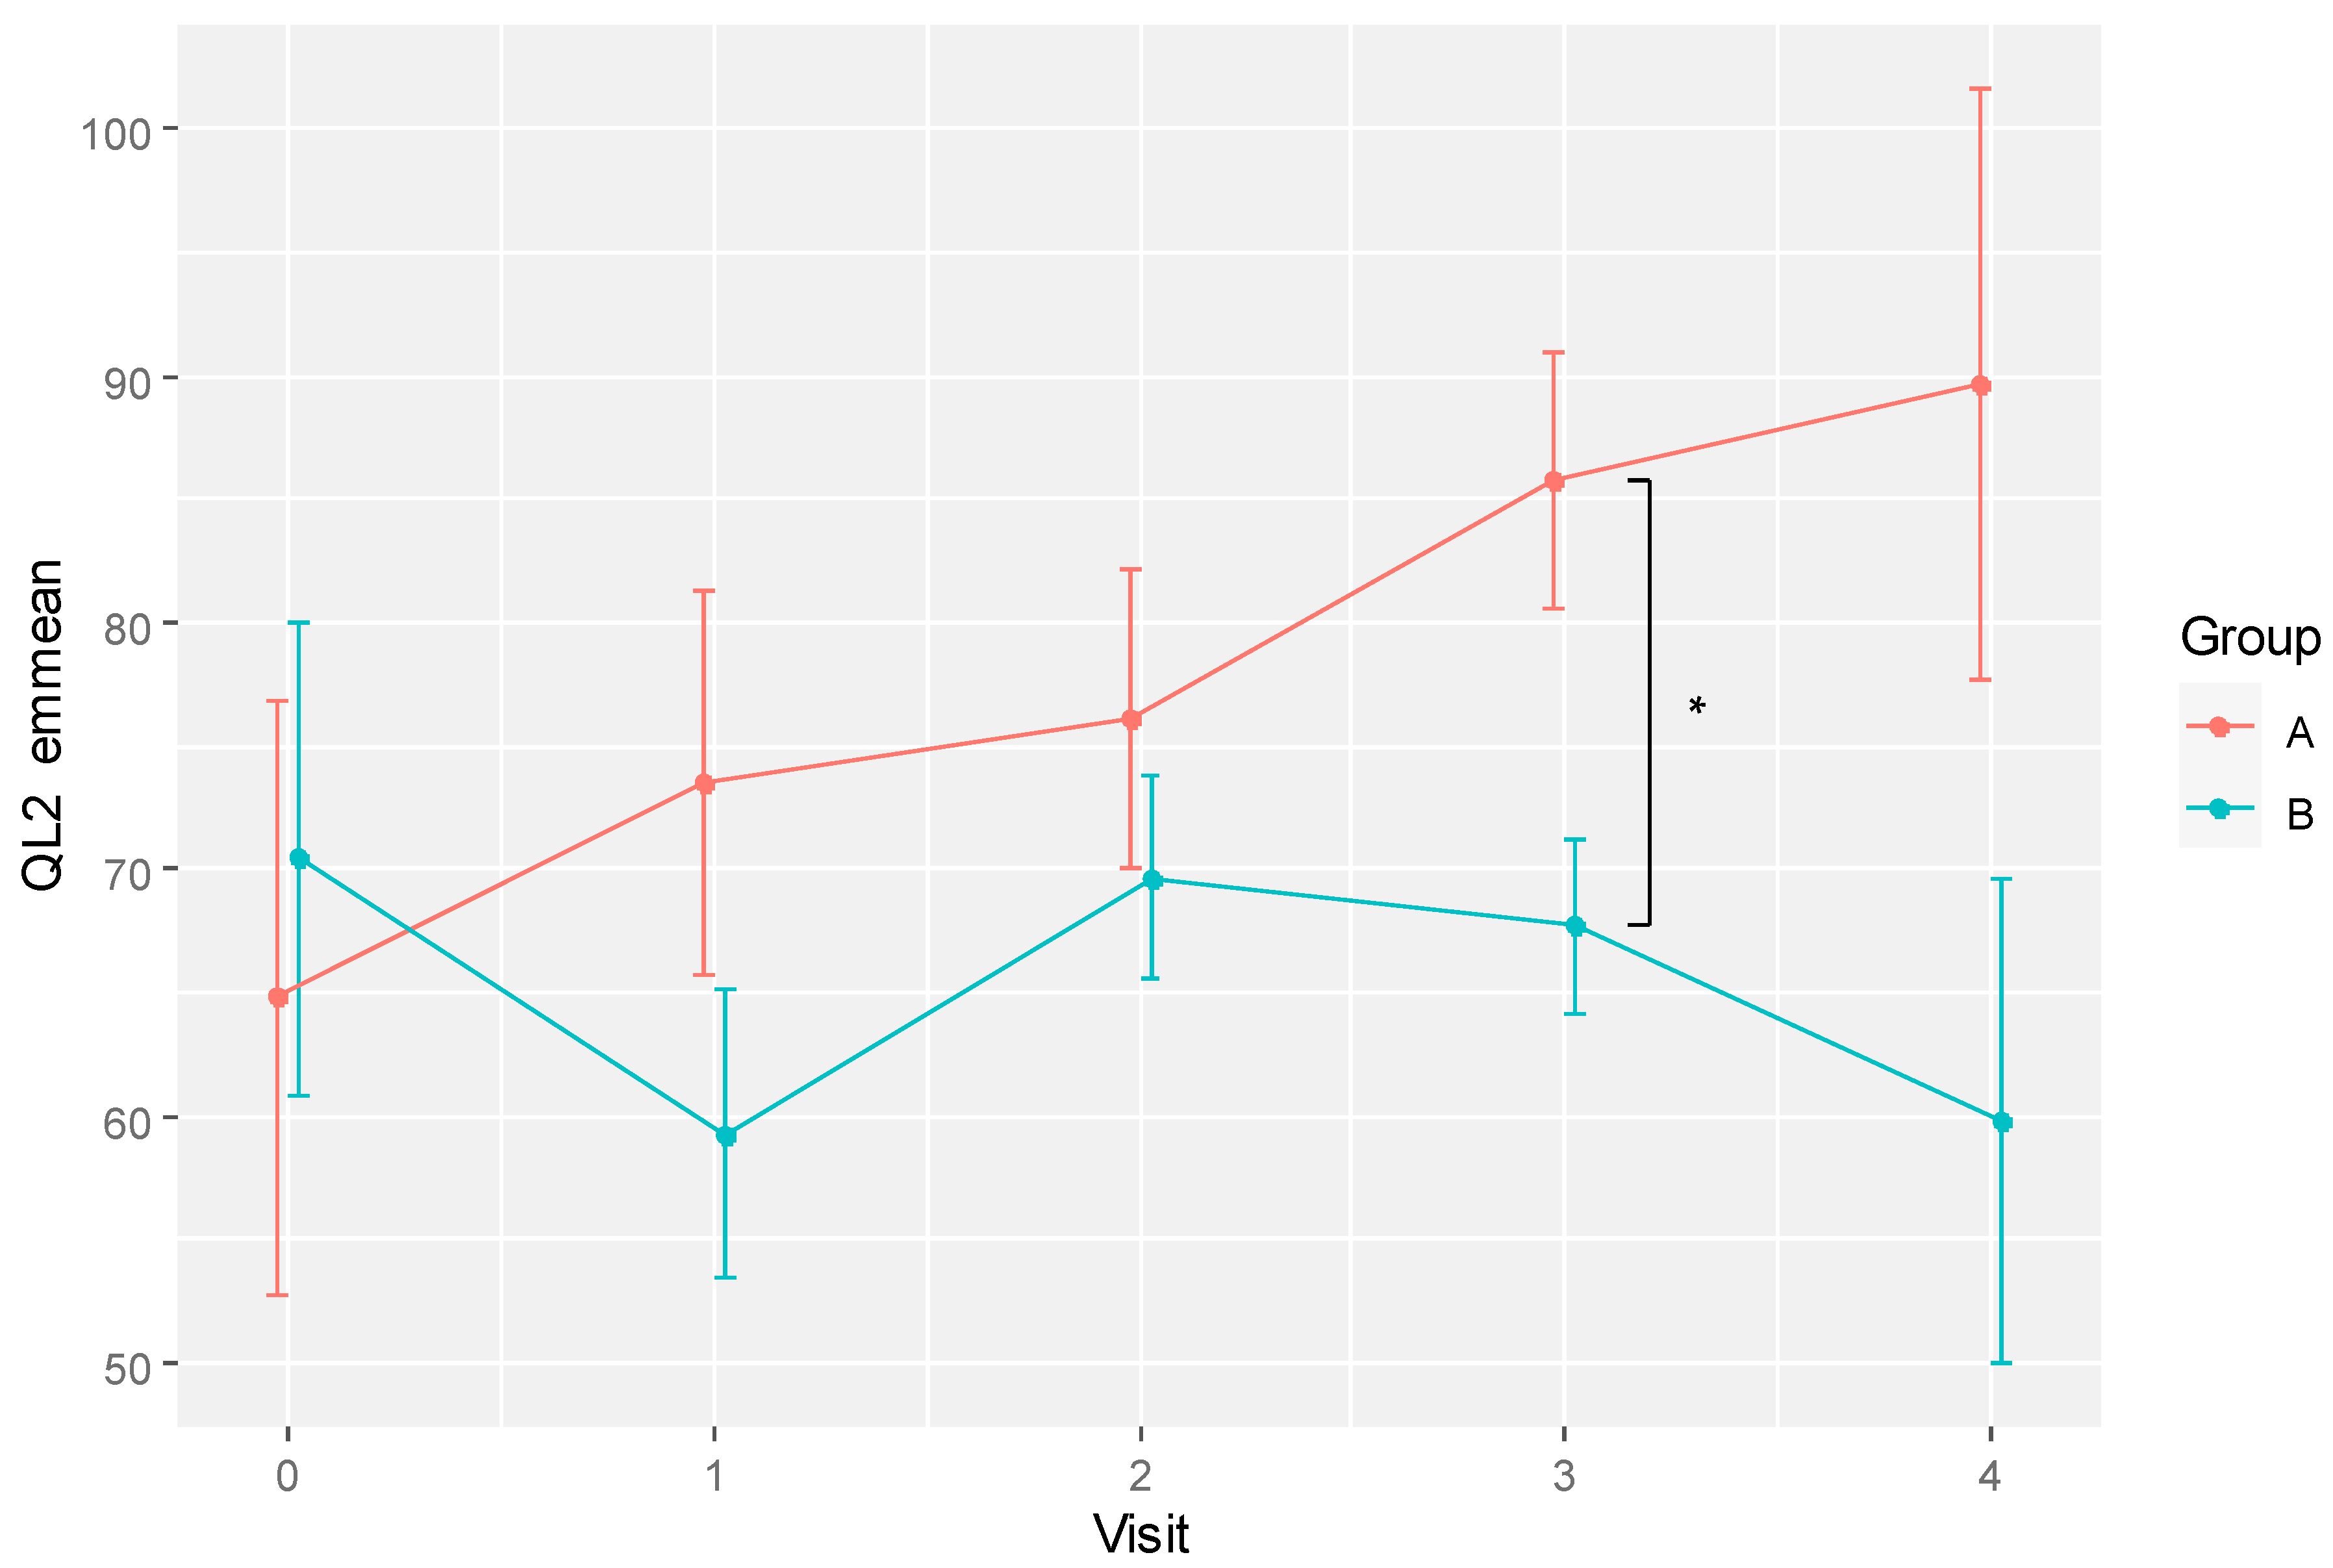
Figure 6.
Plots of (I) emmeans of white blood cell count (WBC) plus neutrophil count and (II) total protein for RBAC (A) and placebo (B) groups over time. * Significant difference p < 0.05; ** p < 0.01.
Figure 6.
Plots of (I) emmeans of white blood cell count (WBC) plus neutrophil count and (II) total protein for RBAC (A) and placebo (B) groups over time. * Significant difference p < 0.05; ** p < 0.01.
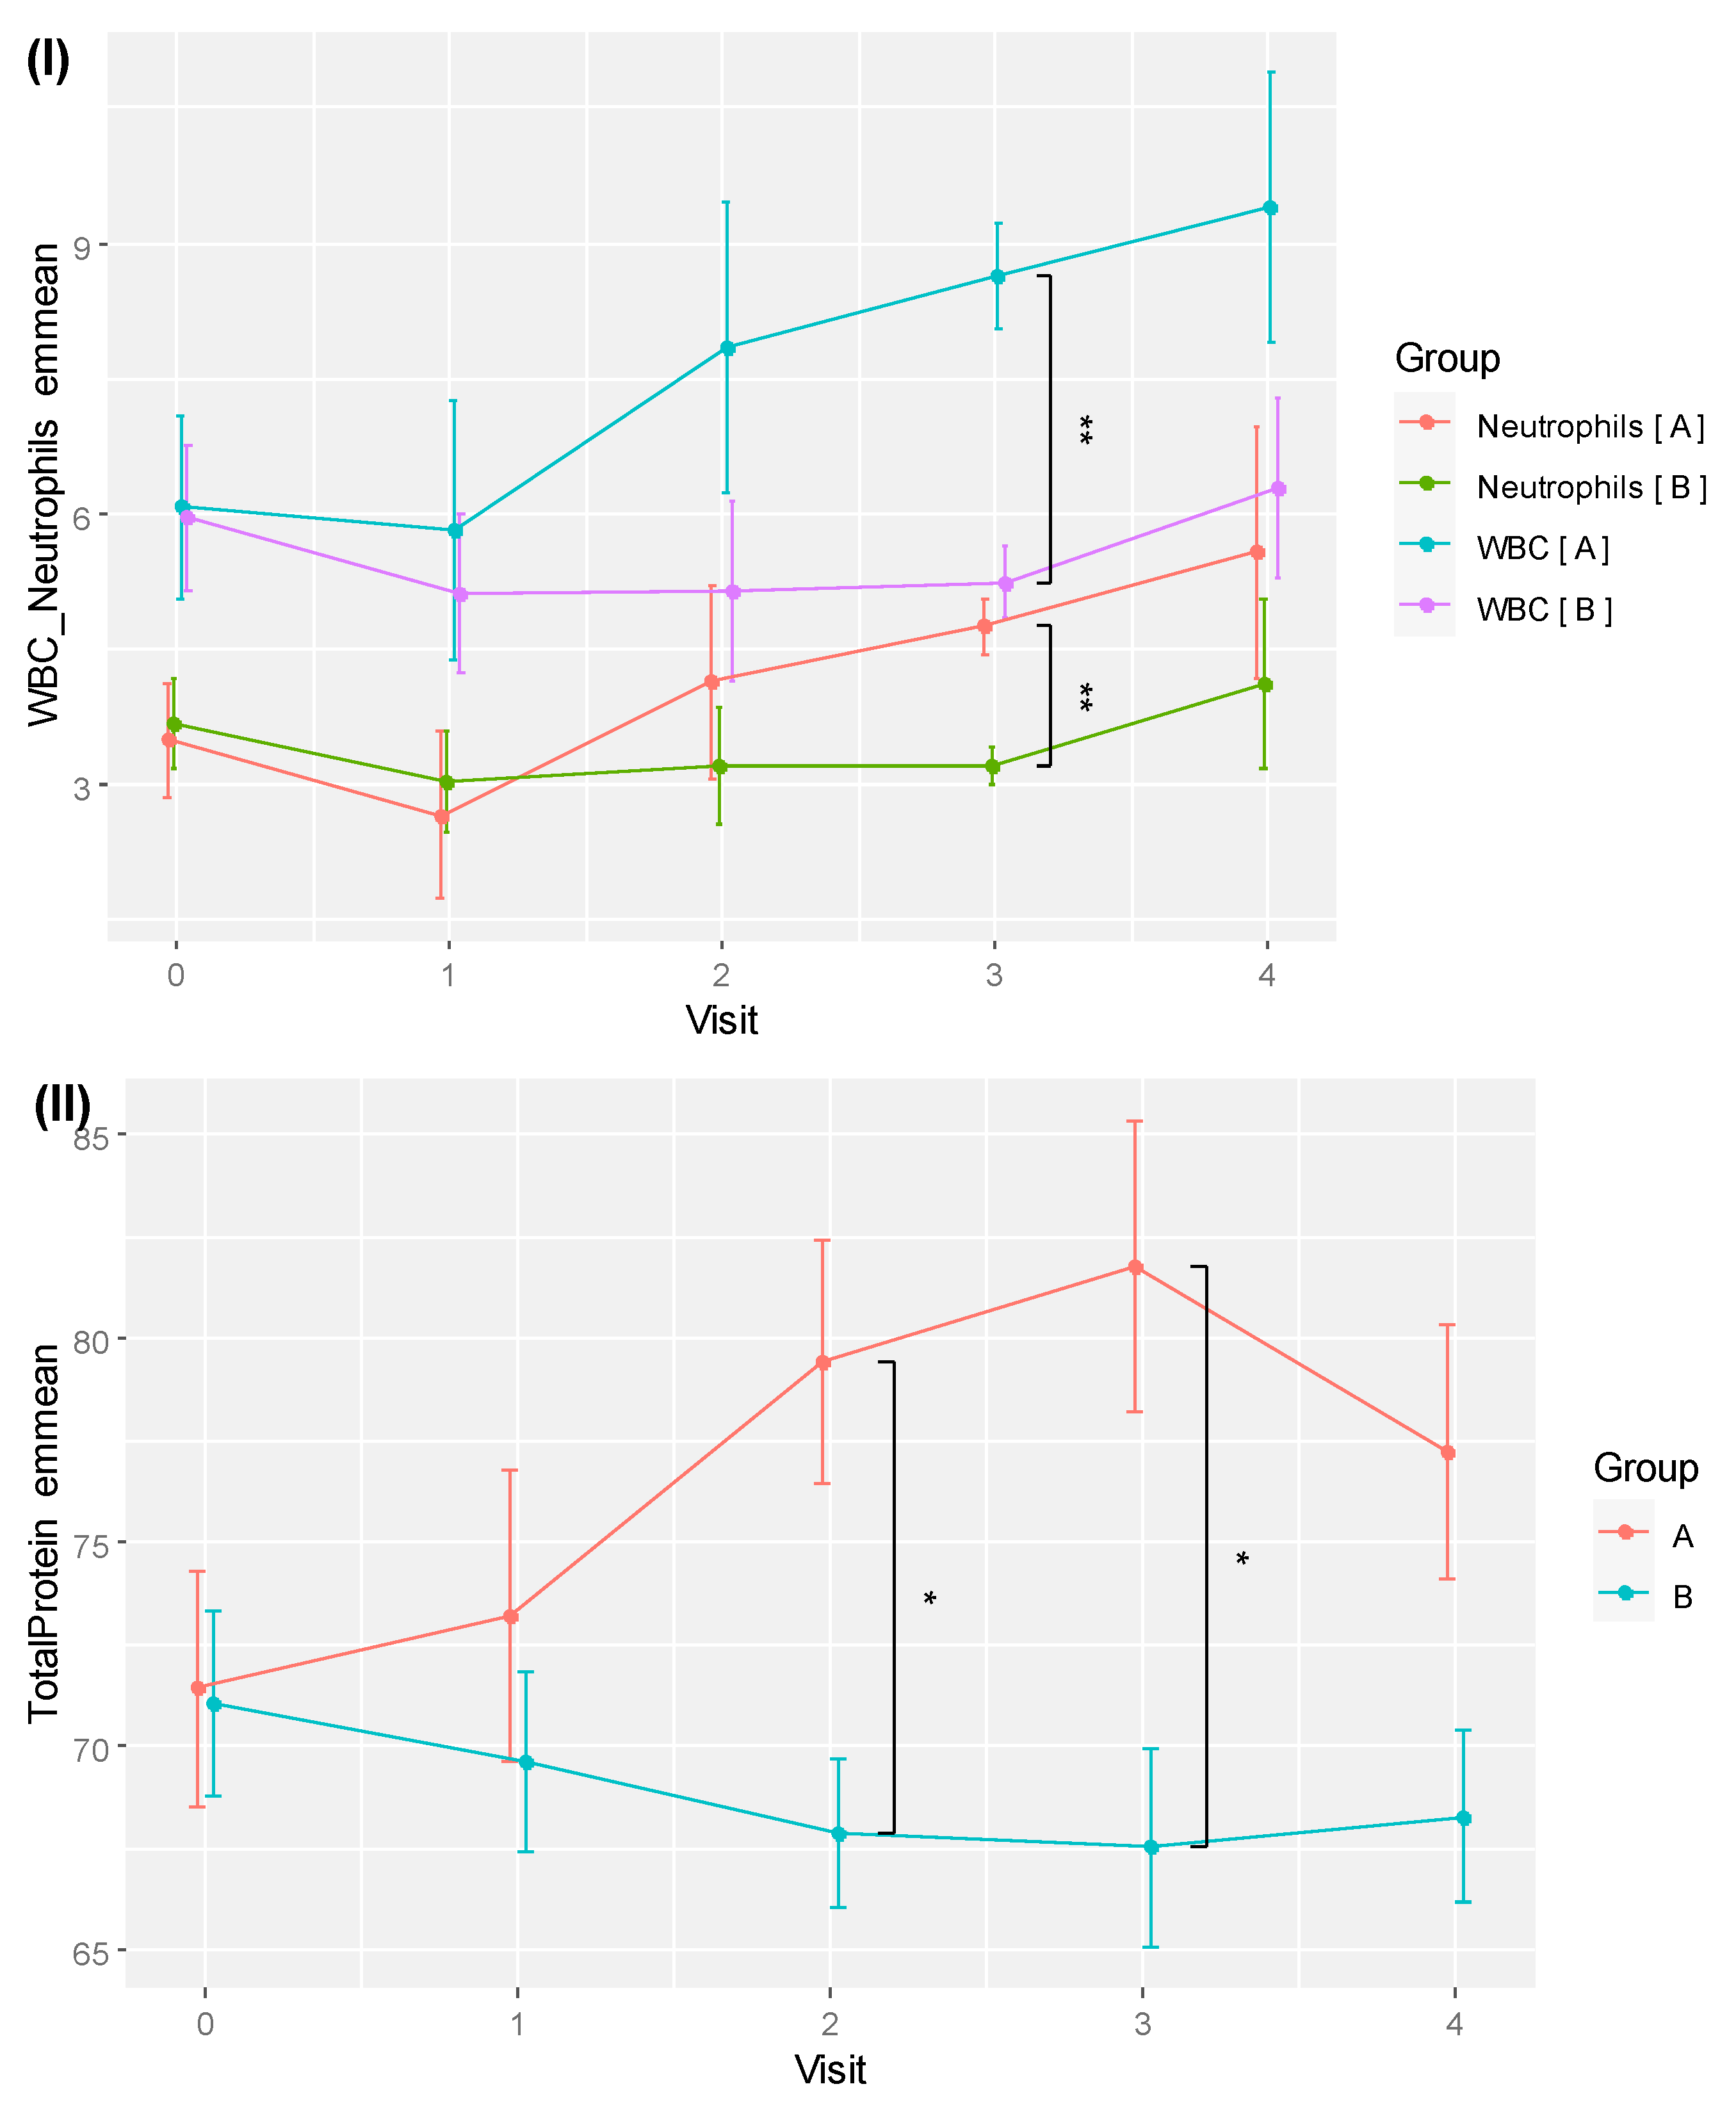

Table 1.
Participant characteristics.
| RBAC | Placebo | p-Value | ||
|---|---|---|---|---|
| N (available for analysis) | 7 (100%) | 9 (100%) | ||
| Age | 70.8 ±7.34 | 64.0 ±6.70 | p = 0.079 | |
| Sex | Male | 6 (85.7%) | 8 (88.9%) | p = 1.0 |
| Female | 1 (14.3%) | 1 (11.1%) | ||
| Trial Status | Withdrawn | 1 (14.3%) | 2 (22.2%) | p = 0.758 |
| Deceased | 1 (14.3%) | 0 (0%) | ||
| Completed | 5 (71.4%) | 7 (77.8%) | ||
| Primary Cancer | Colon and Rectal | 0 (0%) | 4 (44.4%) | p = 0.177 |
| Melanoma | 3 (42.8%) | 2 (22.2%) | ||
| Lung | 2 (28.6%) | 1 (25.6%) | ||
| Bladder | 1 (14.3%) | 0 (0%) | ||
| Stomach | 1 (14.3%) | 0 (0%) | ||
| Oesophageal | 0 (0%) | 1 (11.1%) | ||
| Kidney | 0 (0%) | 1 (11.1%) | ||
| Cancer Stage | III | 2 (28.6%) | 3 (33.3%) | p = 1.0 |
| IV | 5 (71.4%) | 6 (66.7%) | ||
| Recurrent | No | 3 (42.9%) | 6 (66.7%) | p = 0.615 |
| Yes | 4 (57.1%) | 3 (33.3%) | ||
| Metastasis | No | 1 (14.3%) | 1 (11.1%) | p = 1.0 |
| Yes | 6 (85.7%) | 8 (88.9%) | ||
| Treatment | Chemotherapy | 4 (57.1%) | 6 (66.7%) | p = 1.0 |
| Immunotherapy | 3 (42.9%) | 3 (33.3%) | ||
Note: Continuous variable is presented in mean ± standard deviation, and the hypothesis testing of two means is based on the two-sided student’s t-test. Significant testing of categorical variables is computed with Fisher’s exact test.
Table 2.
Pairwise comparisons of mean global quality of life score (QL2) between groups over time.
| Visit | Variable (Unit) | RBAC | Placebo | p-Value | Cohen’s d |
|---|---|---|---|---|---|
| 0 (Baseline) | QL2 (1-100) | 75.0 ± 23.57 | 63.10 ± 19.16 | 0.261 | 0.554 |
| 1 (Week 6) | QL2 (1-100) | 76.67 ± 6.97 | 57.29 ± 17.50 | 0.032 ^ | 1.454 |
| 2 (Week 12) | QL2 (1-100) | 79.77 ± 4.81 | 67.86 ± 10.13 | 0.069 | 1.427 |
| 3 (Week 18) | QL2 (1-100) | 75.0 ± 11.79 | 73.81 ± 10.13 | 0.852 | 0.108 |
| 4 (Week 24) | QL2 (1-100) | 81.67 ± 27.89 | 65.48 ± 21.75 | 0.172 | 0.647 |
^ Statistically significant difference between two means based on the two-sided student’s t-test with p<0.05 (with multiplicity adjusted with false discovery rate).
Table 3.
Pairwise comparisons of white blood cell count (WBC) and total protein (TP) between groups over time.
Table 3.
Pairwise comparisons of white blood cell count (WBC) and total protein (TP) between groups over time.
| Visit | Variable (Unit) | RBAC | Placebo | p-Value | Cohen’s d |
|---|---|---|---|---|---|
| 0 (Baseline) | WBC (x109/L) | 6.35 ± 2.61 | 5.78 ± 1.80 | 0.622 | 0.255 |
| 1 (Week 6) | WBC (x109/L) | 5.48 ± 2.61 | 5.30 ± 1.60 | 0.887 | 0.081 |
| 2 (Week 12) | WBC (x109/L) | 7.53 ± 1.81 | 5.31 ± 2.35 | 0.132 | 1.055 |
| 3 (Week 18) | WBC (x109/L) | 7.68 ± 0.99 | 5.80 ± 1.13 | 0.022 ^ | 1.767 |
| 4 (Week 24) | WBC (x109/L) | 8.80 ± 1.22 | 6.63 ± 2.45 | 0.137 | 1.122 |
| 0 (Baseline) | TP (g/L) | 72.50 ± 3.15 | 70.33 ± 7.45 | 0.516 | 0.379 |
| 1 (Week 6) | TP (g/L) | 72.50 ± 2.65 | 70.00 ± 5.56 | 0.421 | 0.575 |
| 2 (Week 12) | TP (g/L) | 77.00 ± 2.16 | 69.13 ± 5.03 | 0.015 ^ | 2.035 |
| 3 (Week 18) | TP (g/L) | 79.50 ± 5.97 | 68.86 ± 4.88 | 0.010 ^ | 1.952 |
| 4 (Week 24) | TP (g/L) | 75.50 ± 3.87 | 69.29 ± 4.82 | 0.056 | 1.421 |
^ The statistically significant difference between the two means is based on the two-sided student’s t-test with p<0.05 (multiplicity adjusted with false discovery rate).
Table 4.
Pairwise comparisons of the correlation among global quality of life score (QL2), white blood cell count (WBC), and total protein (TP).
Table 4.
Pairwise comparisons of the correlation among global quality of life score (QL2), white blood cell count (WBC), and total protein (TP).
| Pearson’s r | QL2 | WBC | TP |
|---|---|---|---|
| QL2 | 1 | 0.156 (p = 0.248) | 0.338 (p = 0.010) * |
| WBC | 0.156 (p = 0.248) | 1 | 0.539 (p < 0.001) ** |
| TP | 0.338 (p = 0.010) * | 0.539 (p < 0.001) ** | 1 |
Pearson correlation coefficient (r): * moderate correlation; ** highly correlated.
Table 5.
Pairwise comparisons of the participant’s physical activity level measured in MET/week at different visits. (Hypothesis testing, Ho: X = Y).
Table 5.
Pairwise comparisons of the participant’s physical activity level measured in MET/week at different visits. (Hypothesis testing, Ho: X = Y).
| Visit (X) | MET/Week (X) | Visit (Y) | MET/Week (Y) | p-value (X = Y) | Cohen’s d |
|---|---|---|---|---|---|
| 0 (Baseline) | 794.27 ± 344.78 | 1 (Week 6) | 788.29 ± 681.87 | 0.391 | 0.011 |
| 2 (Week 12) | 1473.60 ± 853.55 | 0.162 | -1.044 | ||
| 3 (Week 18) | 1489.50 ± 740.87 | 0.119 | -1.203 | ||
| 4 (Week 24) | 594.64 ± 166.50 | 0.153 | 0.434 | ||
| 1 (Week 6) | 788.29 ± 681.87 | 2 (Week 12) | 1473.60 ± 853.55 | 0.046 ^ | -0.887 |
| 3 (Week 18) | 1489.50 ± 740.87 | 0.040 ^ | -0.985 | ||
| 4 (Week 24) | 594.64 ± 166.50 | 0.646 | 0.312 | ||
| 2 (Week 12) | 1473.60 ± 853.55 | 3 (Week 18) | 1489.50 ± 740.87 | 0.871 | -0.020 |
| 4 (Week 24) | 594.64 ± 166.50 | 0.033 ^ | 1.223 | ||
| 3 (Week 18) | 1489.50 ± 740.87 | 4 (Week 24) | 594.64 ± 166.50 | 0.033 ^ | 1.370 |
^ Statistically significant difference between two means based on the two-sided student’s t-test with p< 0.05 (with multiplicity adjusted with false discovery rate).
Table 6.
Pairwise comparisons of the estimated marginal means (emmeans) of global quality of life score (QL2) between groups over time after adjusting for age as a covariate.
Table 6.
Pairwise comparisons of the estimated marginal means (emmeans) of global quality of life score (QL2) between groups over time after adjusting for age as a covariate.
| Visit | Emmean (Unit) | RBAC | Placebo | p-Value | Cohen’s d |
|---|---|---|---|---|---|
| 0 (Baseline) | QL2 (1-100) | 64.77 ± 26.99 | 70.40 ± 25.28 | 0.762 | -0.518 |
| 1 (Week 6) | QL2 (1-100) | 73.51 ± 17.31 | 59.27 ± 16.42 | 0.211 | 2.082 |
| 2 (Week 12) | QL2 (1-100) | 76.06 ± 12.09 | 69.63 ± 10.85 | 0.471 | 1.246 |
| 3 (Week 18) | QL2 (1-100) | 85.76 ± 10.42 | 67.66 ± 9.35 | 0.039 ^ | 4.069 |
| 4 (Week 24) | QL2 (1-100) | 89.67 ± 26.81 | 59.76 ± 25.88 | 0.112 | 2.733 |
^ Statistically significant difference between two means based on the two-sided student’s t-test with p<0.05 (with multiplicity adjusted with false discovery rate).
Table 7.
Pairwise comparisons of the emmeans of white blood cell count (WBC) and total protein (TP) between groups with age as a covariate over time.
Table 7.
Pairwise comparisons of the emmeans of white blood cell count (WBC) and total protein (TP) between groups with age as a covariate over time.
| Visit | Emmean (Unit) | RBAC | Placebo | p-Value | Cohen’s d |
|---|---|---|---|---|---|
| 0 (Baseline) | WBC (x109/L) | 6.07 ± 2.50 | 5.96 ± 2.40 | 0.940 | 0.119 |
| 1 (Week 6) | WBC (x109/L) | 5.82 ± 2.84 | 5.13 ± 2.48 | 0.728 | 0.590 |
| 2 (Week 12) | WBC (x109/L) | 7.85 ± 3.21 | 5.15 ± 2.80 | 0.249 | 2.024 |
| 3 (Week 18) | WBC (x109/L) | 8.65 ± 1.18 | 5.24 ± 1.06 | 0.003 ^^ | 6.775 |
| 4 (Week 24) | WBC (x109/L) | 9.39 ± 2.98 | 6.29 ± 2.67 | 0.177 | 2.436 |
| 0 (Baseline) | Neutrophils (x109/L) | 3.50 ± 1.54 | 3.68 ± 1.48 | 0.832 | -0.332 |
| 1 (Week 6) | Neutrophils (x109/L) | 2.67 ± 1.84 | 3.03 ± 1.60 | 0.774 | -0.487 |
| 2 (Week 12) | Neutrophils (x109/L) | 4.14 ± 2.12 | 3.21 ± 1.84 | 0.538 | 1.052 |
| 3 (Week 18) | Neutrophils (x109/L) | 4.75 ± 0.61 | 3.22 ± 0.55 | 0.007 ^^ | 5.869 |
| 4 (Week 24) | Neutrophils (x109/L) | 5.57 ± 2.78 | 4.12 ± 2.49 | 0.477 | 1.227 |
| 0 (Baseline) | TP (g/L) | 71.43 ± 7.08 | 71.04 ± 6.82 | 0.924 | 0.150 |
| 1 (Week 6) | TP (g/L) | 73.22 ± 7.10 | 69.64 ± 6.19 | 0.479 | 1.215 |
| 2 (Week 12) | TP (g/L) | 79.45 ± 5.96 | 67.90 ± 5.19 | 0.019 ^ | 4.670 |
| 3 (Week 18) | TP (g/L) | 81.77 ± 7.18 | 67.56 ± 6.44 | 0.023 ^ | 4.636 |
| 4 (Week 24) | TP (g/L) | 77.21 ± 6.24 | 68.30 ± 5.60 | 0.077 | 3.341 |
^ The statistically significant difference between the two means is based on the two-sided student’s t-test with p<0.05 (multiplicity adjusted with false discovery rate) and ^^ p<0.01.
Table 8.
A comparison of the adverse events (AE) reported between RBAC and placebo groups.
| RBAC | Placebo | p-Value | ||
|---|---|---|---|---|
| Number of Participants (N) | 7 | 9 | ||
| Number of AEs reported | 26 (100%) | 50 (100%) | ||
| Mean AE per patient | 3.71 ± 3.64 | 5.56 ± 2.92 | p = 0.2921 | |
| CTCAE Grade | 1 – Mild | 19 (73.1%) | 45 (90.0%) | p = 0.0647 |
| 2 – Moderate | 6 (23.1%) | 4 (8.0%) | ||
| 3 – Severe | 0 (0%) | 0 (0%) | ||
| 4 – Life-threatening | 0 (0%) | 1 (3.8%) | ||
| 5 – Death | 1 (3.8%) | 0 (0%) | ||
| Trial | 1 – Not related | 13 (50.0%) | 28 (56.0%) | p = 0.8314 |
| Relationship | 2 – Unlikely | 12 (46.2%) | 20 (40.0%) | |
| 3 – Possible | 1 (3.8%) | 2 (4.0%) | ||
| 4 – Probable | 0 (0%) | 0 (0%) | ||
| 5 – Definite | 0 (0%) | 0 (0%) | ||
| Most Common | Fatigue | 4 (15.4%) | 7 (14.0%) | p = 0.2529 |
| Events | Oral Thrush | 0 (0%) | 5 (10.0%) | |
| Diarrhoea | 2 (7.7%) | 3 (6.0%) | ||
| Peripheral neuropathy | 1 (3.9%) | 3 (6.0%) | ||
| Constipation | 1 (3.9%) | 3 (6.0%) | ||
| Cough | 2 (7.7%) | 2 (4.0%) | ||
| Nausea | 2 (7.7%) | 2 (4.0%) | ||
| Rash | 0 (0%) | 3 (6.0%) | ||
| Shortness of breath | 1 (3.9%) | 2 (4.0%) | ||
| Dysgeusia | 1 (3.9%) | 1 (2.0%) | ||
| Other isolated events | 12 (46.1%) | 19 (38.0%) | ||
Note: Continuous variable is presented in mean ± standard deviation, and the hypothesis testing of two means is based on the two-sided student’s t-test. Significant testing of categorical variables is computed with Fisher’s exact test.
Disclaimer/Publisher’s Note: The statements, opinions and data contained in all publications are solely those of the individual author(s) and contributor(s) and not of MDPI and/or the editor(s). MDPI and/or the editor(s) disclaim responsibility for any injury to people or property resulting from any ideas, methods, instructions or products referred to in the content. |
© 2023 by the authors. Licensee MDPI, Basel, Switzerland. This article is an open access article distributed under the terms and conditions of the Creative Commons Attribution (CC BY) license (http://creativecommons.org/licenses/by/4.0/).
Copyright: This open access article is published under a Creative Commons CC BY 4.0 license, which permit the free download, distribution, and reuse, provided that the author and preprint are cited in any reuse.


