Submitted:
14 February 2025
Posted:
14 February 2025
Read the latest preprint version here
Abstract
Synchronization of complex networks has been widely studied. Current research on the synchronization of complex networks is based on concepts from graph theory and statistical physics. However, the study of real network synchronization remains present substantial obstacles. To overcome the difficulties caused by the complexity of the network, I report a simple synchronization stability boundary equation and identify a spontaneous synchronization structure in power grids for the first time. The findings indicate that both the synchronization stability boundary and the location of spontaneous synchronization occurred are independent of the network. The boundary equation harmonizes two contradictory conclusions well and reveals the mechanism of the synchronization of different individuals through coupling. These results offer a new direction for synchronization research, providing a means to overcome the challenges posed by network complexity, nonlinearity, and uncertainty, and enabling a unified approach to analyzing the synchronization stability of grids.
Keywords:
Introduction
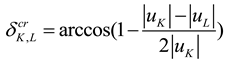
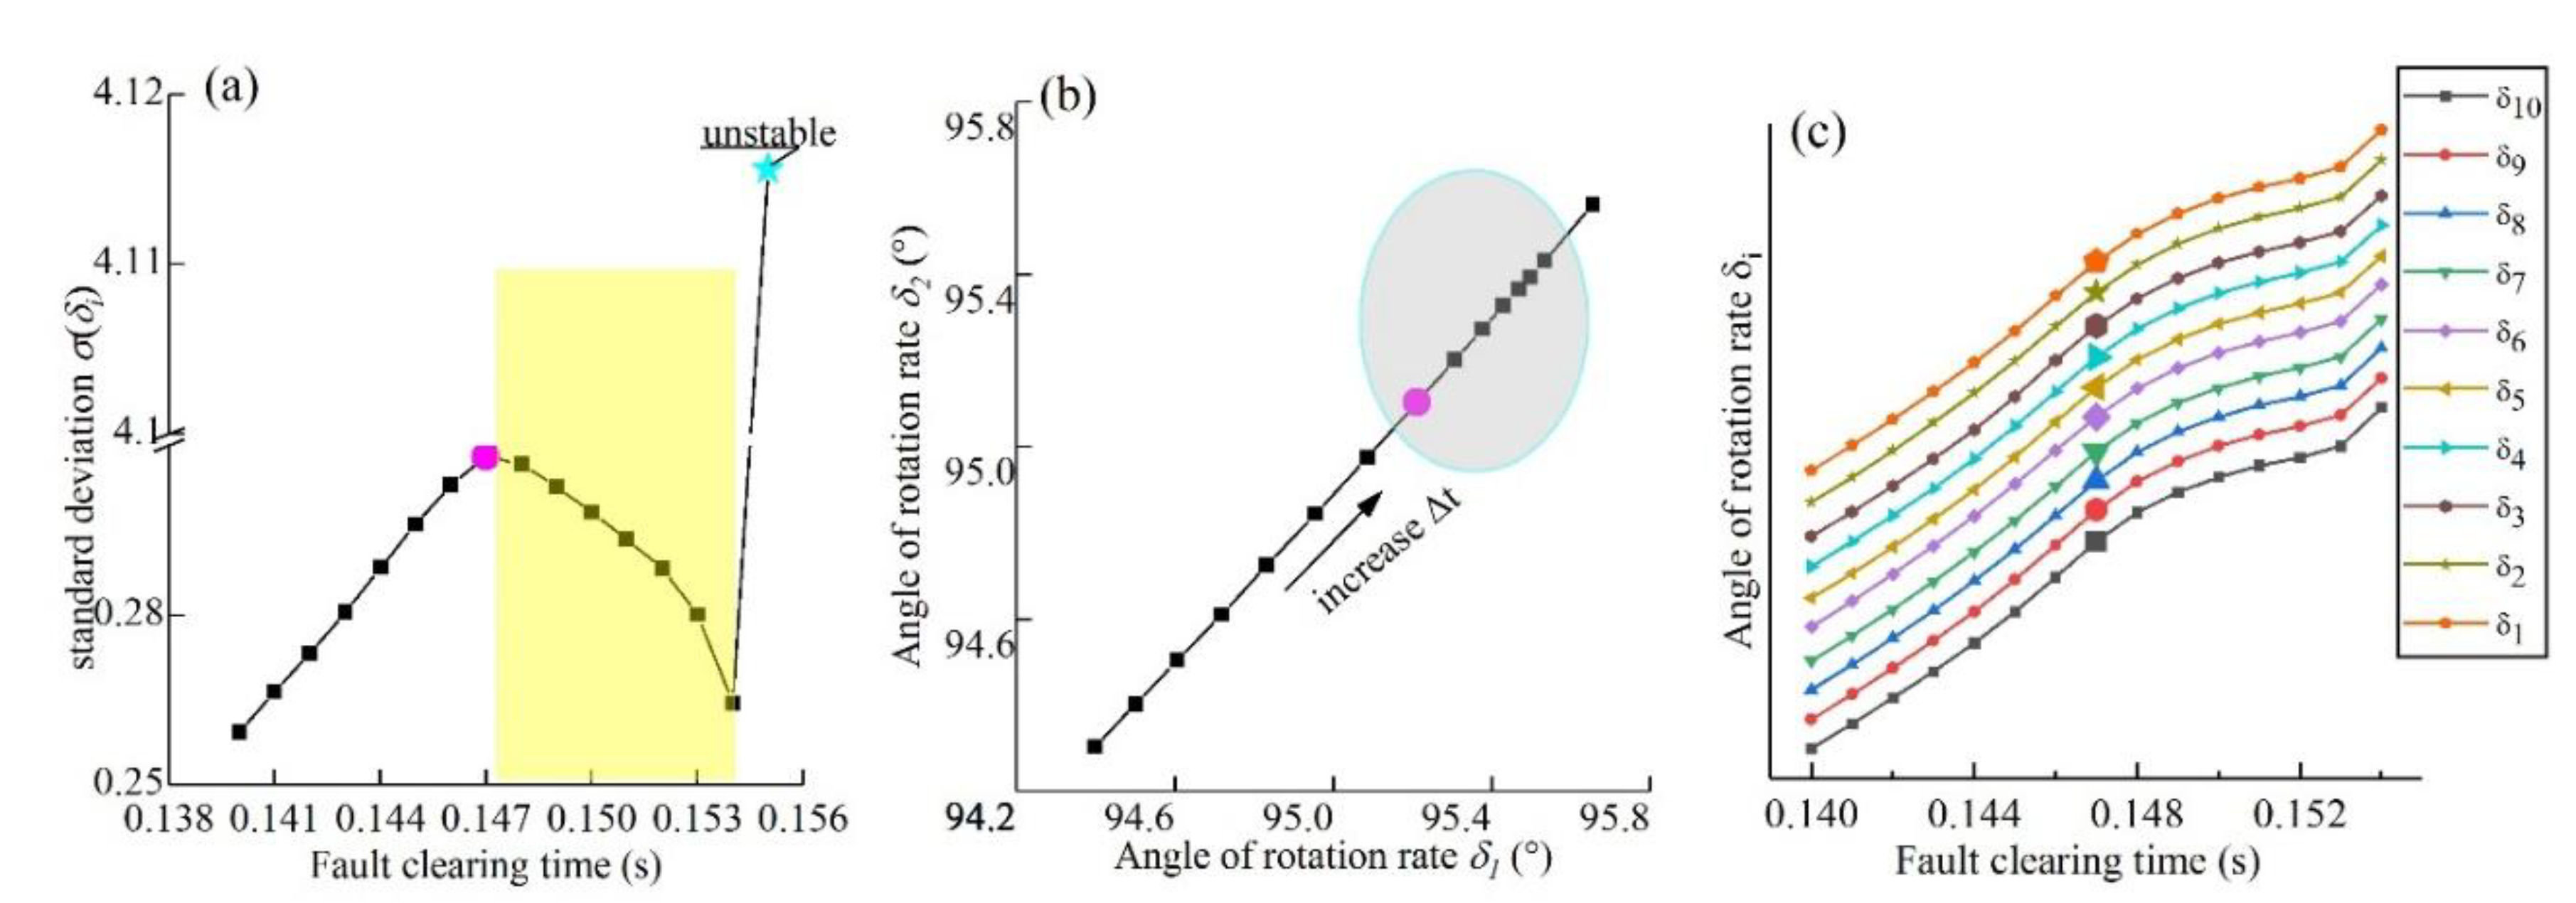
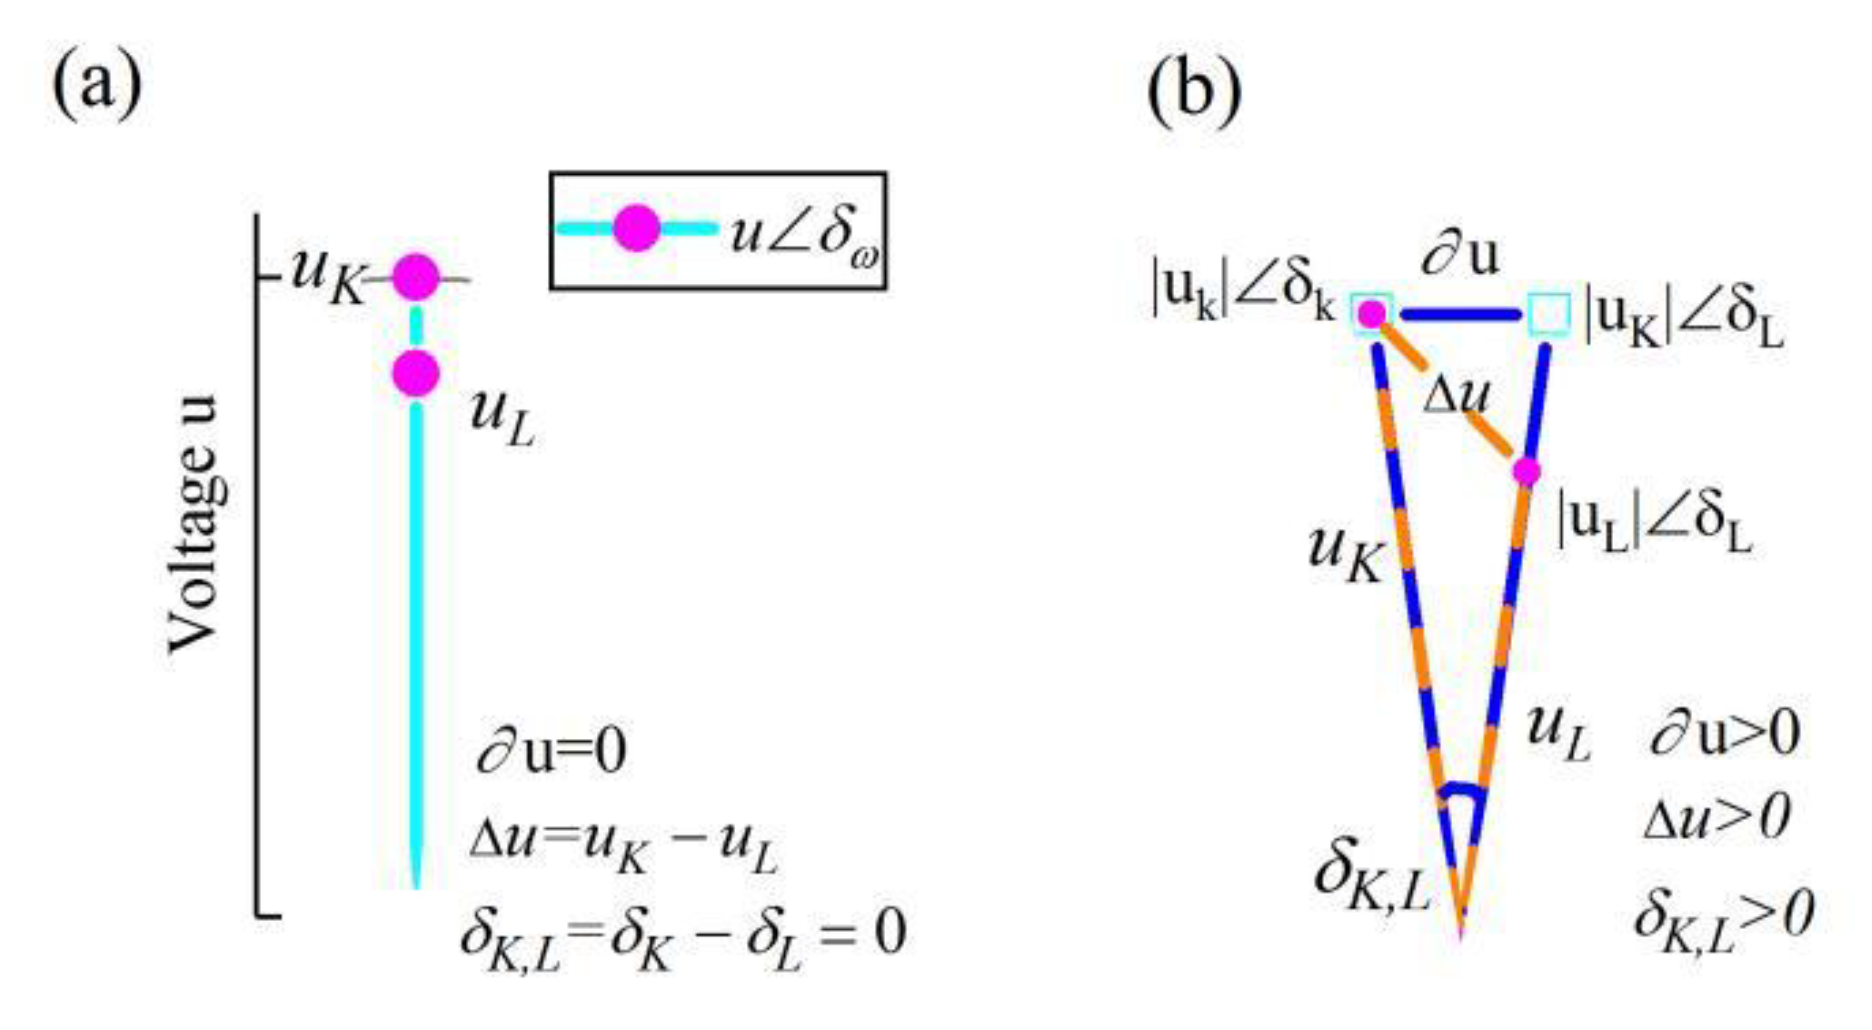
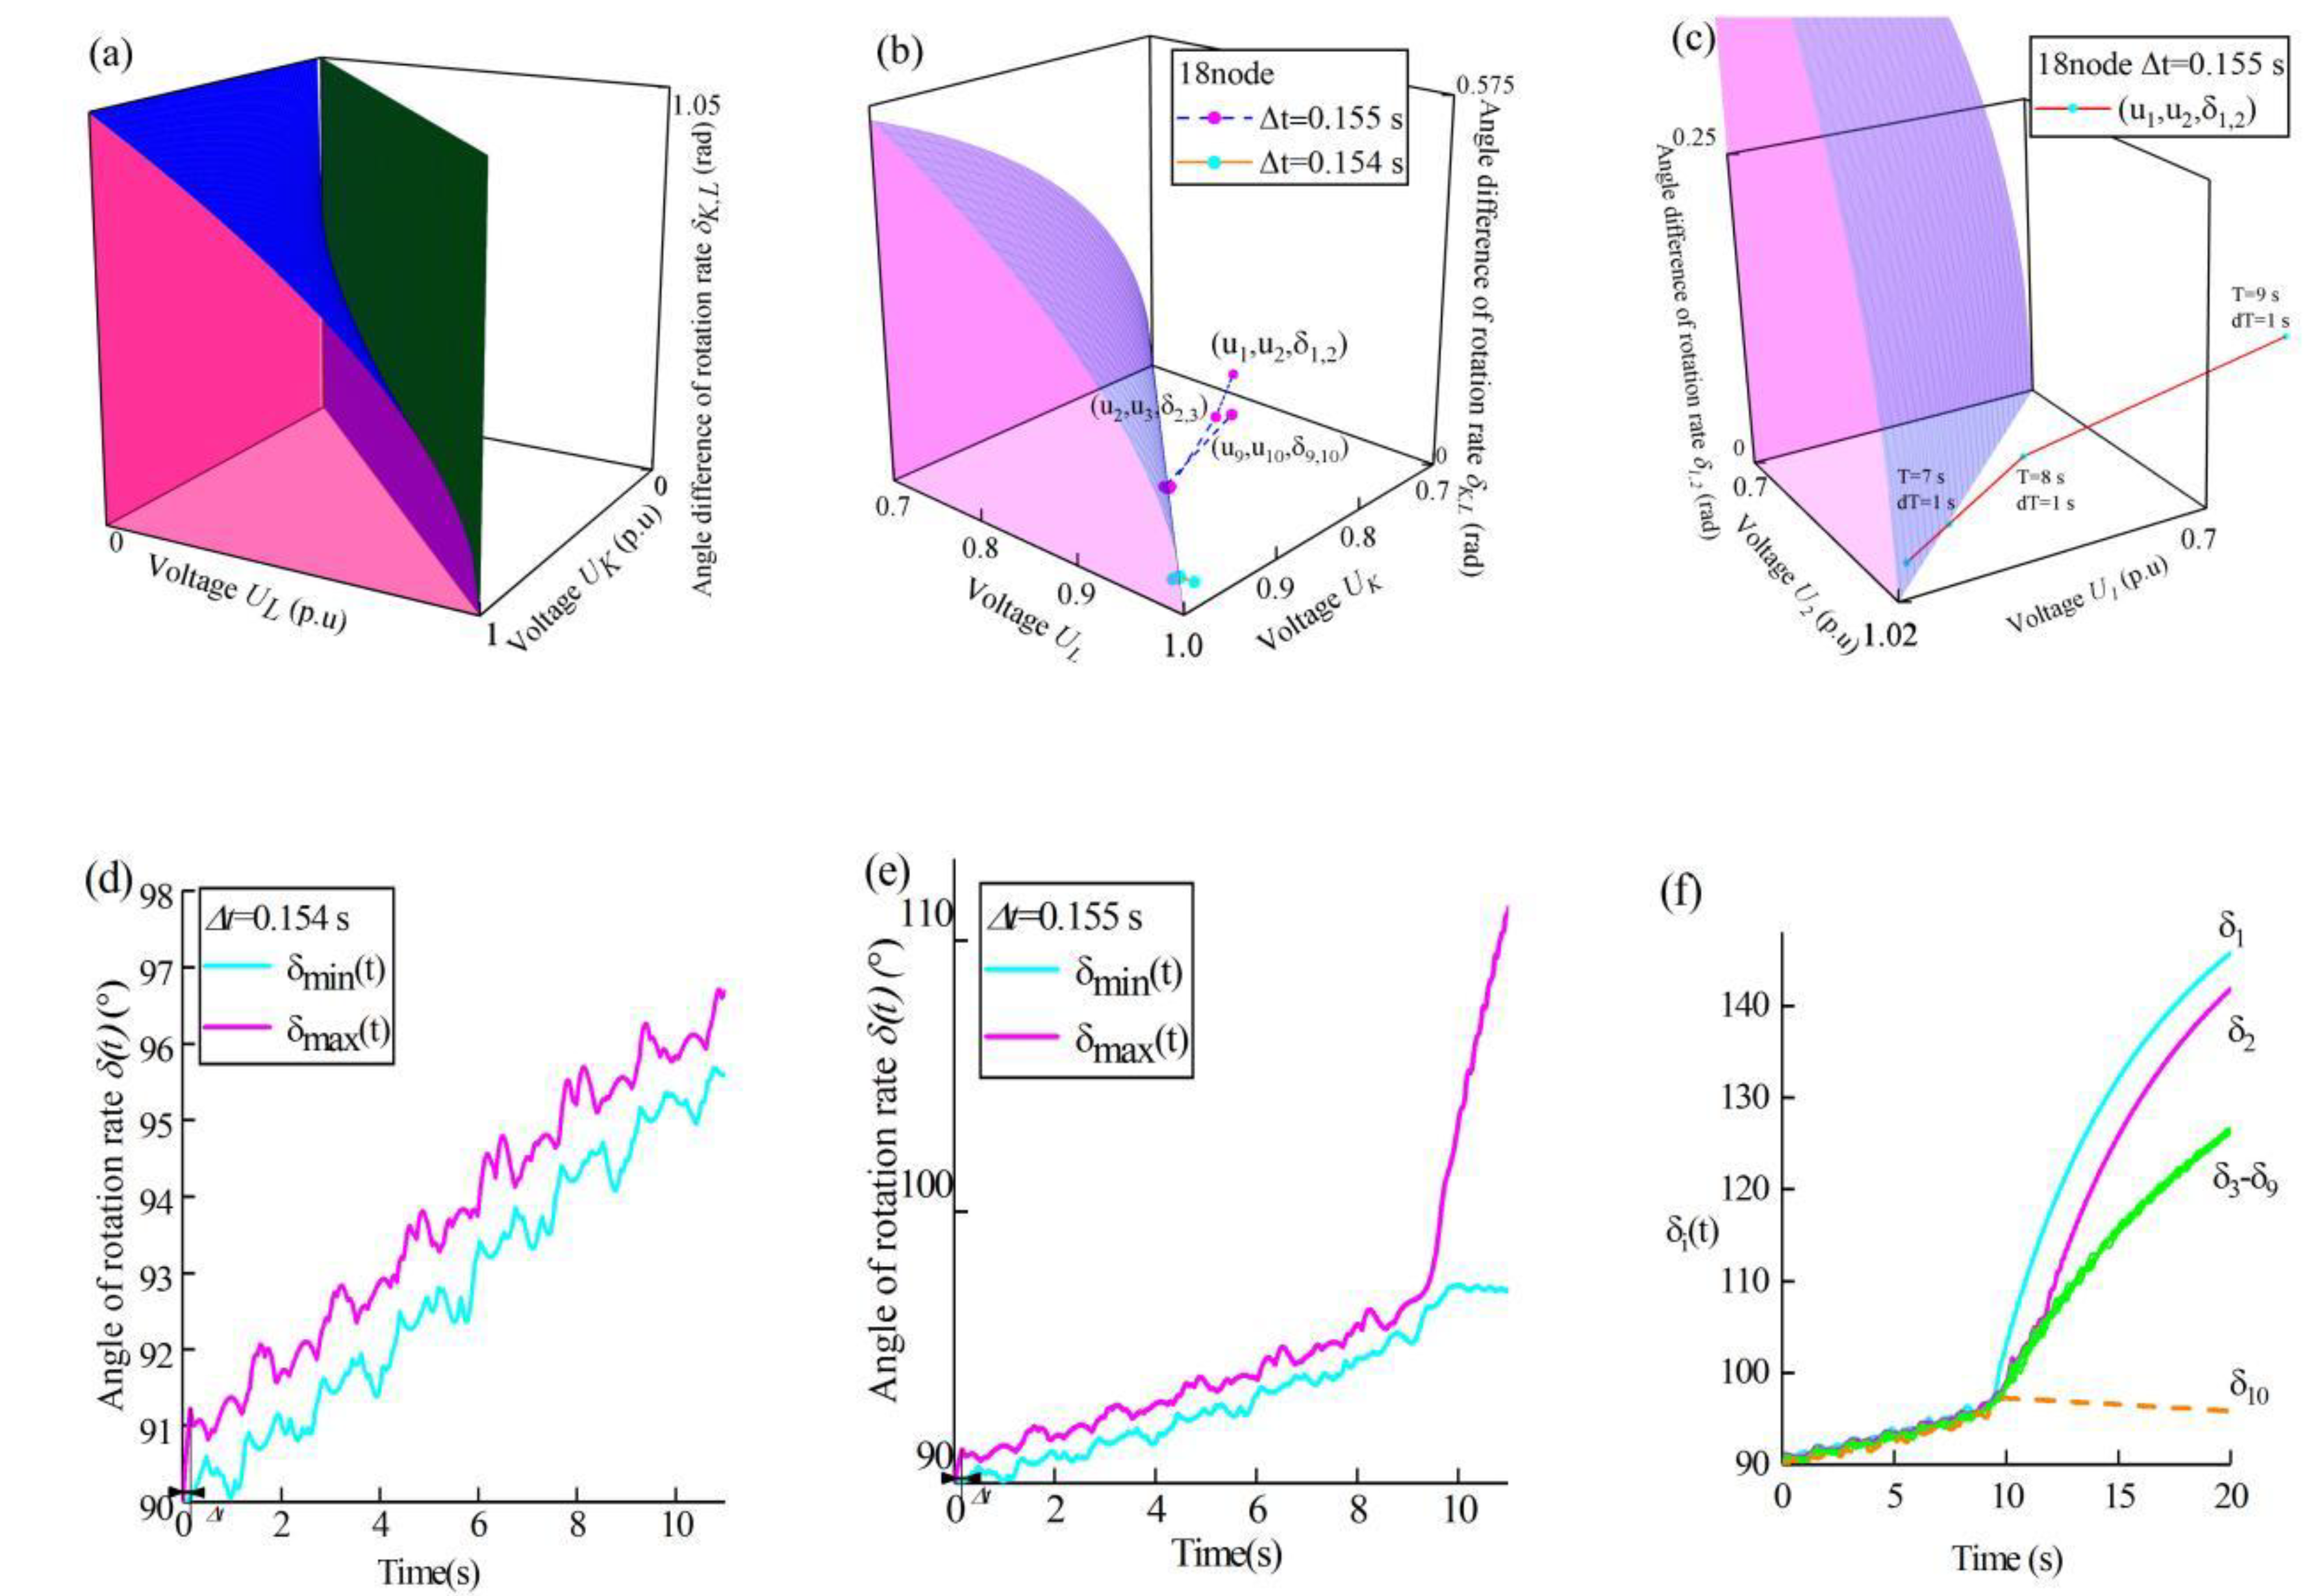
Stability Boundary
Spontaneous Synchronization
Methods
Supplementary Materials
References
- Koronovskii, A.A.; Moskalenko, O.I.; Hramov, A.E. synchronization in complex networks. Tech. Phys. Lett. 2012, 38, 924–927. [Google Scholar] [CrossRef]
- Dörfler, F.; Chertkov, M.; Bullo, F. Synchronization in complex oscillator networks and smart grids. Proc. Natl. Acad. Sci. U. S. A. 2013, 110, 2005–2010. [Google Scholar] [CrossRef]
- Wu, K.; Hao, X.; Liu, J.; Liu, P.; Shen, F. Online Reconstruction of Complex Networks From Streaming Data. IEEE Trans. Cybern. 2022, 52, 5136–5147. [Google Scholar] [CrossRef] [PubMed]
- Linyuan, L.L.; Zhou, T. Link prediction in complex networks: A survey. Phys. A Stat. Mech. its Appl. 2011, 390, 1150–1170. [Google Scholar] [CrossRef]
- Xu, Y.; Zhou, W.; Fang, J. Topology identification of the modified complex dynamical network with non-delayed and delayed coupling. Nonlinear Dyn. 2012, 68, 195–205. [Google Scholar] [CrossRef]
- Molnar, F.; Nishikawa, T.; Motter, A.E. Asymmetry underlies stability in power grids. Nat. Commun. 2021, 12, 1–9. [Google Scholar] [CrossRef]
- Martínez, I.; Messina, A.R.; Vittal, V. Normal form analysis of complex system models: A structure-preserving approach. IEEE Trans. Power Syst. 2007, 22, 1908–1915. [Google Scholar] [CrossRef]
- Zhu, L.; Hill, D.J. Synchronization of Kuramoto Oscillators: A Regional Stability Framework. IEEE Trans. Automat. Contr. 2020, 65, 5070–5082. [Google Scholar] [CrossRef]
- Casals, M.R.; Bologna, S.; Bompard, E.F.; D’, G.; Agostino, N.A.; Ellens, W.; Pagani, G.A.; Scala, A.; Verma, T. Knowing power grids and understanding complexity science. Int. J. Crit. Infrastructures 2015, 11, 4. [Google Scholar] [CrossRef]
- Gurrala, G.; Dimitrovski, A.; Pannala, S.; Simunovic, S.; Starke, M. Parareal in Time for Fast Power System Dynamic Simulations. IEEE Trans. Power Syst. 2016, 31, 1820–1830. [Google Scholar] [CrossRef]
- Gurrala, G.; Dinesha, D.L.; Dimitrovski, A.; Sreekanth, P.; Simunovic, S.; Starke, M. Large Multi-Machine Power System Simulations Using Multi-Stage Adomian Decomposition. IEEE Trans. Power Syst. 2017, 32, 3594–3606. [Google Scholar] [CrossRef]
- Wang, B.; Fang, B.; Wang, Y.; Liu, H.; Liu, Y. Power System Transient Stability Assessment Based on Big Data and the Core Vector Machine. IEEE Trans. Smart Grid 2016, 7, 2561–2570. [Google Scholar] [CrossRef]
- Yu, Y.; Liu, Y.; Qin, C.; Yang, T. Theory and Method of Power System Integrated Security Region Irrelevant to Operation States: An Introduction. Engineering 2020, 6, 754–777. [Google Scholar] [CrossRef]
- Yang, P.; Liu, F.; Wei, W.; Wang, Z. Approaching the Transient Stability Boundary of a Power System: Theory and Applications. IEEE Trans. Autom. Sci. Eng. 2022, 1–12. [Google Scholar] [CrossRef]
- Al-Ammar, E.A.; El-Kady, M.A. Application of operating security regions in power systems. IEEE PES Transm. Distrib. Conf. Expo. Smart Solut. a Chang. World 2010. [Google Scholar] [CrossRef]
- Kundur, P.; Paserba, J.; Ajjarapu, V.; Andersson, G.; Bose, A.; Canizares, C.; Hatziargyriou, N.; Hill, D.; Stankovic, A.; Taylor, C.; et al. Definition and classification of power system stability. IEEE Trans. Power Syst. 2004, 19, 1387–1401. [Google Scholar] [CrossRef]
- Student Member, B.B.; Senior Member, G.A. On the nature of unstable equilibrium points in power systems. IEEE Trans. Power Syst. 1993, 8, 738–745. [Google Scholar] [CrossRef]
- Chiang, H.D.; Wu, F.F.; Varaiya, P.P. A BCU Method for Direct Analysis of Power System Transient Stability. IEEE Trans. Power Syst. 1994, 9, 1194–1208. [Google Scholar] [CrossRef]
- Shubhanga, K.N.; Kulkarni, A.M. Application of Structure Preserving Energy Margin Sensitivity to Determime the Effectiveness of Shunt and Serles FACTS Devices. IEEE Power Eng. Rev. 2002, 22, 57. [Google Scholar] [CrossRef]
- Bhui, P.; Senroy, N. Real-Time Prediction and Control of Transient Stability Using Transient Energy Function. IEEE Trans. Power Syst. 2017, 32, 923–934. [Google Scholar] [CrossRef]
- Al Marhoon, H.H.; Leevongwat, I.; Rastgoufard, P. A fast search algorithm for Critical Clearing Time for power systems transient stability analysis. 2014 Clemson Univ. Power Syst. Conf. PSC 2014 2014. [Google Scholar] [CrossRef]
- Rimorov, D.; Wang, X.; Kamwa, I.; Joos, G. An approach to constructing analytical energy function for synchronous generator models with subtransient dynamics. IEEE Trans. Power Syst. 2018, 33, 5958–5967. [Google Scholar] [CrossRef]
- Motter, A.E.; Myers, S.A.; Anghel, M.; Nishikawa, T. Spontaneous synchrony in power-grid networks. Nat. Phys. 2013, 9, 191–197. [Google Scholar] [CrossRef]
- Li, X.; Wei, W.; Zheng, Z. Promoting synchrony of power grids by restructuring network topologies. Chaos An Interdiscip. J. Nonlinear Sci. 2023, 33, 63149. [Google Scholar] [CrossRef] [PubMed]
- Kuramoto, Y.; Battogtokh, D. Coexistence of Coherence and Incoherence in Nonlocally Coupled Phase Oscillators. Physics (College. Park. Md). 2002, 4, 380–385. [Google Scholar] [CrossRef]
- Martens, E.A.; Thutupalli, S.; Fourrière, A.; Hallatschek, O. Chimera states in mechanical oscillator networks. Proc. Natl. Acad. Sci. U. S. A. 2013, 110, 10563–10567. [Google Scholar] [CrossRef]
- Panaggio, M.J.; Abrams, D.M. Chimera states: Coexistence of coherence and incoherence in networks of coupled oscillators. Nonlinearity 2015, 28, R67–R87. [Google Scholar] [CrossRef]
- Ding, L.; Gonzalez-Longatt, F.M.; Wall, P.; Terzija, V. Two-step spectral clustering controlled islanding algorithm. IEEE Trans. Power Syst. 2013, 28, 75–84. [Google Scholar] [CrossRef]
- Ajala, O.; Dominguez-Garcia, A.; Sauer, P.; Liberzon, D. A Second-Order Synchronous Machine Model for Multi-swing Stability Analysis. 51st North Am. Power Symp. NAPS 2019 2019. [Google Scholar] [CrossRef]
- Alberto, L.F.C.; Bretas, N.G. Required damping to assure multiswing transient stability: the SMIB case. Int. J. Electr. Power Energy Syst. 2000, 22, 179–185. [Google Scholar] [CrossRef]
- Pecora, L.M.; Sorrentino, F.; Hagerstrom, A.M.; Murphy, T.E.; Roy, R. Cluster synchronization and isolated desynchronization in complex networks with symmetries. Nat. Commun. 2014, 5. [Google Scholar] [CrossRef] [PubMed]
- Denker, M.; Timme, M.; Diesmann, M.; Wolf, F.; Geisel, T. Breaking Synchrony by Heterogeneity in Complex Networks. Phys. Rev. Lett. 2004, 92, 1–4. [Google Scholar] [CrossRef] [PubMed]
- Karatekin, C.Z.; Uçak, C. Sensitivity analysis based on transmission line susceptances for congestion management. Electr. Power Syst. Res. 2008, 78, 1485–1493. [Google Scholar] [CrossRef]
- Nishikawa, T.; Motter, A.E. Symmetric States Requiring System Asymmetry. Phys. Rev. Lett. 2016, 117, 114101. [Google Scholar] [CrossRef]
- Dörfler, F.; Bullo, F. Synchronization in complex networks of phase oscillators: A survey. Automatica 2014, 50, 1539–1564. [Google Scholar] [CrossRef]
- Fan, H.; Wang, Y.; Wang, X. Eigenvector-based analysis of cluster synchronization in general complex networks of coupled chaotic oscillators. Front. Phys. 2023, 18. [Google Scholar] [CrossRef]
- Anderson, P.M.; Fouad, A.A. Power system control and stability; John Wiley & Sons, 2008; ISBN 8126518189.
- Pai, A. Energy function analysis for power system stability; Springer Science & Business Media, 1989; ISBN 0792390350.
- Niu, M; Wan, C; Xu, Z. A review on applications of heuristic optimization algorithms for optimal power flow in modern power systems. J. Mod. Power Syst. Clean Energy 2014, 2, 289–297. [Google Scholar] [CrossRef]
Disclaimer/Publisher’s Note: The statements, opinions and data contained in all publications are solely those of the individual author(s) and contributor(s) and not of MDPI and/or the editor(s). MDPI and/or the editor(s) disclaim responsibility for any injury to people or property resulting from any ideas, methods, instructions or products referred to in the content. |
© 2025 by the authors. Licensee MDPI, Basel, Switzerland. This article is an open access article distributed under the terms and conditions of the Creative Commons Attribution (CC BY) license (http://creativecommons.org/licenses/by/4.0/).


