
Submitted:
26 October 2023
Posted:
27 October 2023
You are already at the latest version
Abstract
This article presents the development of an innovative Maximum Power Point Tracking (MPPT) strategy, utilizing a Particle Swarm Optimization (PSO) algorithm to improve the effectiveness of PV systems and expedite convergence. The new MPPT method incorporated a unique Swarm Self-Reinforcement Mechanism (SSRM) within the PSO algorithm, targeting quick convergence and excellent tracking accuracy. This approach enables the PSO to eliminate the fitness function that has the lowest value and subsequently reinforce it in the next iteration, revolving around the global maximum power point (GMPP). By applying this novel PSO-based method, the MPPT performance of PV systems was significantly improved, facilitating the algorithm to proficiently navigate through the solution space and quickly locate the GMPP, even in rapidly changing environmental conditions. The outcomes derived from this novel approach were contrasted with other algorithmic optimization methods, validating its superior convergence speed and tracking accuracy. Different swarm sizes were examined using SSRM, and the optimal swarm size for the system employing MPPT was identified to achieve the lowest convergence time (CT). The results showcased the impressive performance capabilities of this novel strategy, resulting in a time con-traction of up to 28% compared to the conventional PSO technique, where the optimal swarm size was found to be 5. This achievement marks a significant milestone in the evolution of PSO-based MPPT techniques, and paves the way for future advancements in this exciting field.
Keywords:
MPPT
; particle swarm optimization
; partial shading conditions
; metaheuristic techniques
; optimization techniques
; global maximum power
; photovoltaic
1. Introduction
Electricity generation through PV systems boasts numerous applications, including powering space satellites and orbital stations, solar vehicles, remote area energy supply, street lighting, and central power stations. PV technology is environmentally friendly, as it does not produce harmful emissions typically associated with traditional electricity generation methods [1]. Recent developments have led to reduced energy generation costs and enhanced efficiency in PV arrays by focusing on tracking maximum power point (MPP), which stands as the primary emphasis of this research. Undoubtedly, boosting the energy output from PV systems will significantly lower energy costs and improve overall performance [2]. This can be accomplished by integrating modern, efficient, and intelligent maximum power point tracker (MPPT) techniques into PV energy systems [3,4,5]. The power produced by a PV array depends on its terminal voltage, necessitating the use of a DC-DC converter at the array’s terminal to ensure optimal power output. This employs a boost converter for this purpose. To follow the MPP from the PV array, the MPPT is utilized to control the switching performance of boost converter. When the PV array subjected to uniform irradiance, the power-voltage (P-V) traits of the PV array exhibit a single peak point in its P-V characteristics. However, when subject to partial shading conditions (PSCs), the P-V characteristics exhibit multiple peaks [6]. Partial shading conditions (PSCs) not only deleteriously impact the performance of the individual shaded modules or arrays, but also leading to a decrease in the overall power output derived from the entire PV system [7]. MPPT strategies hold a central role in boosting the PV systems’ operational functionality. They guarantee that the system’s operating point remains in proximity to the MPP [8]. Traditional MPPT methods including the perturb and observe (P&O) [9], hill climbing (HC) [10], and incremental conductance [11], and others, display efficiency in tracing the MPP when there’s a unique peak [5,12,13]. However, tracking the global MPP (GMPP) under PSCs necessitate the use of sophisticated metaheuristic methods to effectively identify the singular GMPP without becoming caught in any of the Local Maximum Power points (LMPPs) [3,14,15,16]. As a solution, many innovative, precise, and high-performance smart MPPT strategies have been introduced to concentrate on identifying the GMP instead of LMPs. For instance, particle swarm optimization (PSO) [3], ant colony algorithm (ACA) [17], genetic algorithm (GA) [18], bat algorithm (BA) [19], cuckoo search algorithm (CSA) [20], gray wolf optimization (GWO) [16], among others. These methods vary in factors like complexity, expense, efficiency, response time, and resilience [1]. Each of these computational methods has shown efficient tracing of the GMPP from the PV array [6].
PSO is an optimization algorithm developed around population concepts, deriving its principles from the collective behavior seen in bird flocks or fish schools [21]. Owing to its potency and effectiveness in addressing non-linear optimization problems, PSO has achieved notable recognition [22]. It has found widespread use in various optimization challenges, such as MPPT. The PSO method is highly regarded as a resilient, straightforward, efficient, and widely-adopted swarm optimization method, which has led to its extensive application in MPPT for PV systems [2,13,23,24]. In applications of MPPT in PV systems using PSO, a significant benefit is its capacity for swift convergence to the global optimum without succumbing to local optima, a common issue in optimization techniques with gradient-based methodologies [25]. The time to convergence (CT) and rate of failure (FR) in MPPT methods based on PSO serve as crucial elements in determining the total performance of the algorithm [26]. CT denotes the time required for the algorithm to reach a satisfactory closeness to the global optimum, whereas FR signifies the likelihood of the algorithm failing to converge to the optimal solution [27]. Several aspects influence the CT and FR, such as the initial population, parameter settings, and the criteria dictating the termination of the PSO algorithm [28,29]. The proper tuning of these factors is essential to ensure the algorithm’s success in finding the global optimum, thus enhancing the overall performance of the PV system. This adaptability and efficiency make PSO a valuable tool in the continuous pursuit of improved MPPT methods for PV systems.
The initial population size has a significant impact on the CT. A larger population may take longer to converge due to the increased number of individuals that need evaluation and updating. On the other hand, a smaller population size might result in quicker convergence, but with the potential drawback of becoming stuck in local optima, which represent suboptimal solutions [28,30]. Consequently, this research seeks to explore the intricate relationship between CT and population size, as finding the optimal balance is crucial for effective optimization.
Numerous studies have embarked on the mission to formulate innovative PSO-based MPPT strategies. As a prime example, the PSO with targeted position-mutated elitism (PSO-TPME) technique was introduced in [31]. In the research conducted by [32], techniques intertwining grey wolf optimization and PSO (GWO–PSO) were discussed. Concurrently, [33] unveiled a fusion of PSO and salp swarm optimization (PSOSSO). An approach introducing incremental conductance with particle swarm optimization and model predictive control (IncCond-PSO-MPC) was advanced in [34]. Additionally, the tunicate swarm algorithm paired with the PSO technique (TSA-PSO) was detailed in [35]. In a significant contribution, [6] introduced a new adaptive PSO (NA-PSO). In [36], a methodology combining PSO, and incremental conductance (PSO+IC) was introduced. Further strategies include two nested PSO (NESTPSO), proposed in [37], and the concept of anticipated peaks, presented in [38]. The research carried out by [39] led to the conception of an enhanced PSO (EPSO). [40], on the other hand, introduced an Incremental conductance based PSO (ICPSO) algorithm. Also, a unique PSO-PID algorithm emerged from the research in [41]. Additionally, the method recently proposed, which hinges on the swarm size reduction within the PSO (SSR-PSO), is discussed in [28]. Collectively, these methodologies, each with their unique approach, have proven capable of pinpointing the MPP in a split second, indicating a significant leap forward compared to traditional PSO) algorithms.
A novel MPPT algorithm, rooted in PSO principles, is the focus of this research study, aimed at addressing the shortcomings of existing techniques by integrating an advanced optimization strategy.
The method is specifically designed to substantially enhance CT and minimize false responses, facilitating the prompt adjustment of the algorithm to changing levels of solar irradiation and temperature variations. Comprehensive results from simulations show that, in terms of tracking speed, accuracy, and reliability, the proposed approach surpasses other PSO-based MPPT algorithms. This makes it a compelling solution for practical applications in PV systems. The core novelty of this method resides in the employment of a self-reinforcement mechanism for swarms during each iteration to achieve a rapidly converging system. This self-reinforcement is achieved by removing one particle with the lowest fitness value per iteration and reinforcing it with a degree of constrained randomness in the subsequent iteration as shown in Figure 1. Employing the PSO-SSRM ensures that the iteration count will be reduced in comparison to the conventional PSO (C-PSO), resulting in an improved CT. The goal is to showcase the efficacy of the proposed system. The ultimate goal is to identify the optimal swarm size that would yield the best performance in practical photovoltaic applications.
The structure of the remaining sections of this paper is as follows: the second section, delivers an overview of the PSO, followed by an in-depth explanation of the proposed MPPT strategy, which employs an adapted version of the PSO algorithm, demonstrating its effectiveness under fluctuating environmental conditions. The third section gives a comprehensive view of the PV system and the MPPT problem, emphasizing the critical need for maximizing the output power by tracking the maximum power point on the PV module’s power-voltage curve. The fourth section presents simulation results that compare the performance of the conventional PSO with the newly proposed PSO-based MPPT method, highlighting the superior tracking performance and convergence speed of the proposed approach. Finally in the fifth section, the key findings are encapsulated, and future research directions are proposed, including potential enhancements to the PSO algorithm and exploration of alternate optimization techniques for the MPPT problem.
2. Methodology
This section is dedicated to a thorough exploration of the PSO technique. The complexities of the C-PSO have been dissected first, followed by an extensive exposition of the innovative PSO-SSRM methodology that has been proposed in this study. The PV system utilized in this research comprises a series arrangement of three PV panels, a DC-DC converter, and a PSO-guided MPPT. This configuration governs the duty ratio of the boost converter to trace the GMPP, as demonstrated in Figure 2.
2.1. Implementation of the PSO approach for MPPT in PV systems
The technique of the Particle Swarm Optimization (PSO), a prominent member of the metaheuristic approaches family, is ingeniously inspired by the group dynamics of animals or fish in their quest for sustenance. This technique encapsulates the intriguing phenomenon of collective exploration and experience sharing. Specifically, particles traverse the search space in a seemingly random fashion, and the particle that stumbles upon a region rich in food shares its findings with its counterparts, thus guiding their trajectories towards the optimal feeding location [38]. This PSO technique can be ingeniously adapted as a MPPT strategy for PV systems. The procedure commences with particles obtaining duty ratio values, which are then used to compute the corresponding power output. The particle that boasts the highest power output becomes a beacon, serving as the reference point for the other particles, which tweak their trajectories accordingly to gravitate towards this optimal position. Throughout this exploration, each particle maintains a record of the most optimal solution it has achieved, a value referred to as its personal best. The trajectory and movement speed of the particles in their pursuit of new positions can be deduced using Equation (1). Moreover, the updated position of the particles can be calculated by summing the particle’s velocity, and its current position, a process represented in Equation (2) [42].
In these formulas, represents the inertia weight, while and denote the acceleration coefficients, refers to the personal best solution of particle at iteration , and signifies the global best at iteration . The term indicates the particle order within the swarm, and and are random values that fall within the range of .
The practice of initializing the swarms in a random manner can lead to an extension in CT and an increased risk of failure. To mitigate this complication, an approach that equally distributes the swarms within the range of , can be adopted. The implementation of this method is elucidated in Equation (3) [6].
where stands for the initial particle (duty ratio) with the number in the swarm, and denotes the swarm-size. The counter is used to symbolize the number of the particle in the swarm . The subscript in is utilized to highlight that these are the initial values of the particles.
Traditionally, the PSO algorithm has tended to rely on a static, unchanging value for the inertia weight, a practice that has been substantiated in [43]. To augment and finetune its performance, scientific curiosity led researchers to conceive the innovative concept of Time-Varying Inertia Weight (TVIW), a significant evolution highlighted in [44,45]. Distinct in its approach, the PSO-TVIW method exhibits an enhanced aptitude for quickly identifying a potentially promising solution, particularly when compared against alternative evolutionary optimization techniques. However, it is not devoid of hurdles. One such challenge involves the precise finetuning of the optimal solution, a complication that emerges due to a decrease in diversity as the search process nears completion [6]. In a review of previous academic studies, it is evident that the importance of parameter tuning, specifically tailored to the problem at hand within the PSO algorithm, has been emphasized. This unique approach is championed for its capacity to deliver solutions that are not only more targeted but also more efficient [46]. In an effort to mitigate identified limitations and bolster the effectiveness of the PSO algorithm, [47] has proposed an innovative strategy known as the Time-Varying Acceleration Coefficients (TVAC) approach. This promising method aims to enhance the overall performance of the PSO algorithm, representing an exciting advancement in the field of optimization techniques. Proceeding further, the mathematical equations corresponding to the concepts of TVIW and TVAC are elaborated below in Equations (4)–(6):
In these equations, and represent the initial and final values of the inertia weight respectively. The constants are represented by , , and . The current iteration is denoted by , while stands for the maximum number of allowable iterations.
A multitude of research works have suggested various methodologies for determining the PSO control parameters’ optimal values [48,49,50,51,52]. A considerable number of these methodologies rely on the trial-and-error method or the application of empirical formulas with the purpose of enhancing the PSO’s performance. Nevertheless, these methodologies have had varied success, proving effective in certain scenarios while failing to deliver in others. This inconsistency underscores the escalating need to customize the PSO control parameters to fit different applications [37]. In the context of this paper, the values have been carefully chosen from reference [28], with the precise objective of enhancing the effectiveness of the PSO process. ; , , , , , & .
In the literature [37], various stopping criteria have been discussed. For this study, two conditions have been adopted from [28] to calculate the CT. Firstly, the difference in power must be less than a predefined tolerance value, referred to as . Secondly, the difference in the duty cycle, at each iteration, must be less than another predefined tolerance value, referred to as .
2.2. PSO Swarm Self-Reinforcement Mechanism (PSO-SSRM)
The primary contribution of this novel adaptive PSO approach is the iterative reinforcement of swarms. The underlying concept involves removing the lowest fitness function value (the worst solution) at each iteration and reinforce it in the subsequent iteration at the MPP, but with a slight random deviation. The deviation is guided by a prearranged value, denoted as ± Q. This value had been meticulously set to align closely with a predefined tolerance level, . This tolerance level held significance as it had been identified as one of the stopping criteria, as was discussed in earlier sections. The precise alignment of this prearranged value and the tolerance level demonstrated careful planning and ensured that the procedure adhered consistently to the comprehensive stopping criteria. This arrangement had the added benefit of introducing an element of randomness, as the range of focus is widened to encompass , thereby facilitating a richer diversity in the generation of random numbers, as depicted in Figure 3. During the simulation process, a random number, denoted as , is generated within the range of [-1,1]. This generated number is subsequently multiplied by . This act of multiplication served as a limiting factor, ensuring that any reinforcements applied to the swarms remained within the pre-specified range.
Following this operation, this newly generated number is then added to the most recent optimal value . This addition resulted in an updated duty cycle, which is specifically designed to hover around the MPP, thus optimizing the system’s operational efficiency.
The simulation kept running, iterating through these steps, until the desired convergence point was reached. This ensured that the process is comprehensive and that the final output is both accurate and optimized to the highest degree possible. In essence, this technique aims to minimize exploration while maximizing extensive exploitation. This innovative idea results in fewer iterations as compared to the C-PSO, thereby leading to a quicker CT. This approach facilitates the implementation of a fast tracker under Partial Shading Conditions (PSCs) and rapid temperature change conditions, an achievement that, to the authors’ knowledge, has not been identified in previous research. The proposed approach carries the potential to enhance not just the PSO strategy, but also other metaheuristic methods encountering similar difficulties in their respective applications. To guarantee the successful execution of this strategy, it’s crucial to thoughtfully assess the initialization of the PSO algorithm, the performance parameters, and the criteria for terminating the algorithm. With a thorough examination of these critical factors, the efficiency of the optimization process can be enhanced, and a superior solution for addressing the challenges encountered in various optimization problems can be provided by the proposed method. By incorporating this adaptive PSO approach, researchers and practitioners can expect to improve the overall performance of their optimization tasks, leading to more robust and efficient solutions across a broad spectrum of applications. This, in turn, can help advance the field of optimization and contribute to the development of cutting-edge techniques for overcoming complex optimization challenges.
The logic of the adaptive PSO is represented in a flowchart as displayed in Figure 4 and can be delineated via the subsequent steps:
| Step1: | Initialize the particle to have a uniform distribution within the range [0.1, 0.9]. |
| Step2: | Dispatch every particle to the MPPT system at every step, then gather the corresponding power at each one. |
| Step3: | Inspect the current location of each particle. If it’s superior to , then update to this best new value. If not, proceed to Step 4. |
| Step4: | Compare each with . If is smaller than , then update accordingly. If not, advance to Step 5. |
| Step5: | Discard the particle that has the minimum fitness function, then reinforce it by adjusting its value with . |
| Step6: | Update the velocity for every particle. |
| Step7: | Update the position of the particle, considering both the global and personal best. |
| Step8: | Updated parameter of , & based on current iteration, then proceed to Step 2. |
3. PV System Modeling:
In the proposed scheme, a DC-DC boost converter is interlinked with PV arrays. The objective of this configuration is to enhance the power output under fluctuating irradiance conditions. In PV systems, these boost converters are routinely employed alongside MPPT and can be arranged in either a single or interleaved configuration as mentioned in [3]. For the simulation’s objective, the PV system is insulated and comprises three PV panels connected in series. Each panel possesses a maximum power generation capacity of 83.28 W. A control mechanism is integrated into this system which utilizes a PSO-based MPPT to follow the GMPP. The boost converter’s duty ratio is adjusted, as displayed in Figure 2, to facilitate this tracking.
Under both uniform and non-uniform conditions, Figure 5 illustrates the interaction between the output voltage and the power output of the PV system. When conditions exhibit uniform irradiance, as indicated by SPO [1000 1000 1000], a Maximum Power Point (MPP) is clearly visible on the curve illustrating Power against Voltage (P-V). Traditional MPPT techniques can effectively track this point. However, when faced with non-uniform irradiance conditions, as indicated by SP1 [900 700 500], the P-V curve displays several Local Peaks (LPs) alongside the Global Peak. This phenomenon is clearly illustrated in Figure 5. The specific parameters of the individual modules, which are vital for the simulation, are detailed in Table 1.
4. Simulation Analysis and Results
In this section, the proposed PV system, which has been designed using a novel adaptive approach via the PSO technique, is simulated and discussed. This technique functions as a MPPT system, designed to optimize the power output under various environmental conditions. The simulation process is executed by synergistically integrating MATLAB code, encompassing the PSO algorithm, with the Simulink platform. The latter houses the comprehensive model of the PV system and the DC-DC converter, providing a comprehensive environment for testing and visualization of the system’s behavior.
The PV system configuration incorporated in this research comprises three PV modules connected in series, each experiencing distinct levels of solar radiation. The radiation exposure for each module was set at different levels, specifically at [900, 700, 500] to mimic non-uniform irradiance conditions. A key objective of this investigation is the implementation of the SSRM within each iterative stage. This approach is aimed at optimizing the PV system’s performance under varying irradiance conditions, and to track the GMPP more effectively. Two distinct scenarios were subjected to rigorous examination. The first scenario pertains to the C-PSO approach, while the second involves the application of the SSRM. In both instances, the Swarm Size (SS) was systematically reduced from an initial count of 20 down to 3, with data acquisition conducted at each decrement of swarm size. Consequent to this systematic analysis, the optimal swarm size for each of the two scenarios was identified. This identification was based on the optimal CT and FR percentage, key metrics in determining the performance and efficiency of the PSO algorithm. Table 2 provides a comprehensive display of the CT and FR results for the two contrasting scenarios, offering valuable insights into the relative performance and benefits of the conventional PSO and the SSRM-enhanced PSO approach.
As delineated in Table 2, a consistent trend is observed in both strategies whereby the CT continually decreases in congruence with the reducing Swarm Size (SS). This observable phenomenon is attributable to the reinforcement of the swarms, which triggers an intensive and thorough exploitation around the global peak at each iteration. Consequently, this extensive exploitation reduces the total number of iterations required, leading to a reduced quantity of particles that need processing. The net effect of this progressive reduction is a hastening of the overall computational process, resulting in a more efficient operation. Specifically, in the context of C-PSO, the FR trend initially maintains a zero state. Nonetheless, upon reducing the swarm size to its minimum limit, the FR begins to manifest. This emergence of the FR at lower SS provides a compelling insight into the vital importance of judiciously choosing an effective swarm size. Meanwhile, for the SSRM-PSO, the FR also exists. However, the incidence of its occurrence is notably lower compared to the C-PSO. This reduction in FR frequency is directly linked to the extensive exploitation that ensues around the MPP. If, in the early stages, the PSO achieves proximity to the MPP, it will converge in alignment with the appropriate criteria. Conversely, should it fail to reach the MPP, the likelihood of becoming ensnared in local minima increases. In the quest to ascertain the optimum swarm size for this study, two critical criteria are given due consideration: the minimum CT and FR. Considering these considerations, the swarm size is optimally identified as 5. The rationale for this choice is twofold: firstly, the CT achieves its lowest value when the SS is set to 5, and secondly, the FR is zero at this swarm size. Therefore, an SS of 5 strikes the delicate balance between computational efficiency and the minimization of FRs, representing the most advantageous swarm size for this study. A bar chart, as depicted in Figure 6, is used to represent the study’s results.
The analytical results delineated in Table 2 provide a comprehensive understanding of the correlation between the SS and CT in the context of both C-PSO and the suggested PSO algorithm. These findings shed light on the potentiality benefits of employing the newly suggested PSO algorithm, especially in terms of attaining more efficient CTs. They also highlight the crucial necessity of maintaining an optimal equilibrium between the SS and exploration efficiency, both of which are pivotal for consistent performance in pinpointing the MPP. Figure 7 and Figure 8 provide a visual representation of the relationship between the PV curve, Swarm Size & CT curve. These figures emphasize the reduction in time as the Swarm Size decreases, assisting in the selection of the optimum Swarm Size.
In this specific configuration with swarm size of 5, the CT is recorded at 0.67 seconds. This timing signifies a notable enhancement of 28% in comparison to the 0.93-second CT that was observed when the C-PSO method was employed. The potential of the proposed PSO to deliver superior performance across a diverse range of applications is underlined by this marked decrease in CT, serving as a compelling endorsement of its efficacy. Determining the optimal SS for improved performance offers an invaluable insight into the mechanics of the proposed PSO algorithm. By significantly contributing to the expanding body of research on PSO techniques, this achievement paves the way for future investigations focusing on the further refinement and optimization of PSO algorithms across diverse contexts. It is an important step towards harnessing the full potential of PSO algorithms, paving the way for future advancements in this field. Figure 9 and Figure 10 showcase the results related to power, duty cycle, and swarm size under both circumstances, highlighting the implementation of a SS composed of 5 particles.
To illustrate the process of identifying the MPP using the C-PSO method, Figure 11 had been utilized. This figure effectively represented the movements and convergence of the particles towards the MPP, with an optimum swarm size of 5. The algorithm had necessitated 18 iterations to achieve convergence, reinforcing the iterative nature intrinsic to the C-PSO method. In each of these iterations, a batch of 5 particles had been strategically dispatched to seek the MPP. This led to a collective count of 90 particles involved in the search operation. The considerable participation of particles had naturally escalated the particle traffic around the MPP. While the iterative process was proceeding, this particle traffic had intensified, reflecting the dynamic and evolving nature of the search for the MPP using the C-PSO method.
Contrastingly, Figure 12 depicts the behaviors of particles as they gravitate when the proposed SSRM-PSO algorithm is put into action, it directs towards the MPP. This strategy manages to achieve convergence in a mere 13 iterations, with a consistent swarm size of 5. In this context, while the total number of particles remains unchanged, one particle with the lowest value is removed and subsequently reinforced in each iteration, aiming at the GMPP with a deviation of Q as previously discussed. This method deploys 5 particles during each iteration, emphasizing intensive exploitation at every step, culminating in convergence at the 13th iteration. This amounts to a total of 65 particles engaged in the search operation. It is apparent from this comparison that the SSRM strategy uses a significantly smaller number of particles compared to the C-PSO method to reach the MPP, leading to a more expedited convergence.
5. Conclusion
The self-reinforcement of particles was incorporated into an inventive PSO approach to track the Global Maximum Power Point (GMPP) of Photovoltaic (PV) systems under conditions of partial shading. Notably, this PSO-centric Maximum Power Point Tracker (MPPT) methodology demonstrated considerable superiority over conventional MPPT strategies, particularly in the face of fluctuating environmental variations and partial shading scenarios. Performance metrics like Convergence Time (CT) and Failure Rate (FR) were identified to significantly influence the efficacy of these PSO-based MPPT techniques. To acquire a comprehensive understanding of the system and pinpoint the optimal swarm size ensuring the minimal CT and a zero FR, an array of swarm sizes, descending from 20 to 3, were scrutinized in a pair of distinct scenarios.
As far as the author is aware, this research signifies the first application of the reinforcement concept to enhance the performance of PSO. The optimal swarm size was determined to be 5, which exhibited an outstanding CT and a zero FR. These results highlight the exceptional performance of this advanced technique, which achieved a significant reduction of up to 28% in time compared to the traditional PSO approach. However, some failures were observed at swarm sizes of 4 and 3 in both scenarios, which can be attributed to the limited number of particles available for exploration in the quest to locate the Maximum Power Point (MPP). Future research will involve comparisons between this novel method and other metaheuristic techniques. Additionally, the potential adaptability of the swarm self-reinforcement mechanism to other metaheuristic appraoaches will be further explored.
Author Contributions
Conceptualization, Ali M. Eltamaly and Majed A. Alotaibi; Data curation, Adel O. Baatiah, Ali M. Eltamaly and Majed A. Alotaibi; Formal analysis, Adel O. Baatiah, Ali M. Eltamaly and Majed A. Alotaibi; Funding acquisition, Ali M. Eltamaly and Majed A. Alotaibi; Investigation, Adel O. Baatiah, Ali M. Eltamaly and Majed A. Alotaibi; Methodology, Adel O. Baatiah, Ali M. Eltamaly and Majed A. Alotaibi; Project administration, Adel O. Baatiah, Ali M. Eltamaly and Majed A. Alotaibi; Resources, Adel O. Baatiah, Ali M. Eltamaly and Majed A. Alotaibi; Software, Adel O. Baatiah, Ali M. Eltamaly and Majed A. Alotaibi; Supervision, Adel O. Baatiah, Ali M. Eltamaly and Majed A. Alotaibi; Validation, Adel O. Baatiah, Ali M. Eltamaly and Majed A. Alotaibi; Visualization, Adel O. Baatiah, Ali M. Eltamaly and Majed A. Alotaibi; Writing—original draft, Adel O. Baatiah, Ali M. Eltamaly and Majed A. Alotaibi; Writing—review & editing, Adel O. Baatiah, Ali M. Eltamaly and Majed A. Alotaibi.
References
- A. M. Eltamaly, “Performance of MPPT Techniques of Photovoltaic Systems Under Normal and Partial Shading Conditions,” in Advances in Renewable Energies and Power Technologies, Elsevier, 2018, pp. 115-161.
- A. M. Eltamaly, H. M. H. Farh and M. S. Al Saud, “Impact of PSO reinitialization on the accuracy of dynamic global maximum power detection of variant partially shaded PV systems,” Sustainability, vol. 11, no. 7, 2019. [CrossRef]
- H. M. H. Farh, M. F. Othman, A. M. Eltamaly and M. S. Al-Saud, “Maximum Power Extraction from a Partially Shaded PV System Using an Interleaved Boost Converter,” Energies, vol. 11, no. 10, p. 1–18, 2018. [CrossRef]
- H. M. H. Farh, M. F. Othman and A. M. Eltamaly, “Maximum Power Extraction from Grid-Connected PV System,” in Saudi Arabia Smart Grid (SASG), Jeddah, Saudi Arabia, 2017.
- A. M. Eltamaly, H. M. Farh and M. F. Othman, “A novel evaluation index for the photovoltaic maximum power point tracker techniques,” Solar Energy, vol. 174, p. 940–956, 2018. [CrossRef]
- A. M. Eltamaly, H. M. H. Farh and A. G. Abokhalil, “A novel PSO strategy for improving dynamic change partial shading photovoltaic maximum power point tracker,” ENERGY SOURCES, PART A: RECOVERY, UTILIZATION, AND ENVIRONMENTAL EFFECTS, 2020. [CrossRef]
- H. M. Farh, A. M. Eltamaly and M. S. Al-Saud, “Interleaved boost converter for global maximum power extraction from the photovoltaic system under partial shading,” IET Renewable Power Generation, vol. 13, no. 8, pp. 1232-1238, 2019. [CrossRef]
- T. Esram and P. L. Chapman, “Comparison of photovoltaic array maximum power point tracking techniques,” IEEE, vol. 22, no. NO. 2, pp. 439-449, 2007. [CrossRef]
- J. Ahmed and Z. Salam, “An Enhanced Adaptive P&O MPPT for Fast and Efficient Tracking Under Varying Environmental Conditions,” IEEE, vol. 9, no. 3, pp. 1487-1496, 2018. [CrossRef]
- W. Zhu, L. Shang, P. Li and H. Guo, “Modified hill climbing MPPT algorithm with reduced steady-state oscillation and improved tracking efficiency,” J. Eng, vol. 2018, no. 17, p. 1878–1883, 2018. [CrossRef]
- Ilyas, A.; Ayyub, M.; Khan, M.R.; Jain, A.; Husain, M.A. Realization of Incremental Conductance MPPT Algorithm for Solar Photovoltaic System. International Journal of Ambient Energy 2017, 39, 873–884. [Google Scholar] [CrossRef]
- H. Rezk and A. M. Eltamaly, “A comprehensive comparison of different MPPT techniques for photovoltaic systems,” Solar Energy, vol. 112, p. 1–11, 2015. [CrossRef]
- A. M. Eltamaly, “Performance of smart maximum power point tracker under partial shading conditions of photovoltaic systems,” Journal of Renewable and Sustainable Energy, vol. 7, no. 4, 2015. [CrossRef]
- B. Subudhi and R. Pradhan, “A Comparative Study on Maximum Power Point Tracking Techniques for Photovoltaic Power Systems,” IEEE, vol. VOL. 4, no. 1, 2013. [CrossRef]
- J. C. Teo, R. H. G. Tan, V. H. Mok, V. K. Ramachandaramurthy and C. Tan, “Impact of Partial Shading on the P-V Characteristics and the Maximum Power of a Photovoltaic String,” Energies, vol. 11, no. 7, p. 1860, 2018. [CrossRef]
- A. M. Eltamaly and H. M. Farh, “Dynamic global maximum power point tracking of the PV systems under variant partial shading using hybrid GWO-FLC,” Solar Energy, pp. 306-316, 2019. [CrossRef]
- N. Priyadarshi, V. K. Ramachandaramurthy, S. Padmanaban and F. Azam, “An Ant Colony Optimized MPPT for Standalone Hybrid PV-Wind Power System with Single Cuk Converter,” Energies, vol. 12, no. 1, pp. 167-190, 2019. [CrossRef]
- S. Hadji, J.-P. Gaubert and F. Krim, “Real-Time Genetic Algorithms-Based MPPT: Study and Comparison (Theoretical an Experimental) with Conventional Methods,” Energies, vol. 11, no. 2, pp. 459-476, 2018. [CrossRef]
- K. S. Tey, S. Mekhilef and M. Seyedmahmoudian, “Implementation of BAT algorithm as maximum power point tracking technique for photovoltaic system under partial shading conditions.pdf,” IEEE Energy Conversion Congress and Exposition (ECCE), pp. 2531-2535, 2018.
- J. Ahmed and Z. Salam, “A maximum power point tracking (MPPT) for PV system using cuckoo search with partial shading capability.pdf,” Applied Energy, vol. 119, pp. 118-130, 2014. [CrossRef]
- J. Kennedy and R. Eberhart, “Particle Swarm Optimization,” International Conference on Neural Networks (ICNN’95), p. 1942–1948, 1995.
- A. M. Eltamaly, H. M. Farh and M. S. Al-Saud, “Grade point average assessment for metaheuristic GMPP techniques of partial shaded PV systems,” IET Renewable Power Generation, vol. 13, no. 8, pp. 1215-1231, 2019. [CrossRef]
- K.-H. Chao, Y.-S. Lin and U.-D. Lai, “Improved particle swarm optimization for maximum power point tracking in photovoltaic module arrays,” Applied Energy, vol. 158, pp. 609-618, 2015. [CrossRef]
- J. Ahmed and Z. Salam, “A critical evaluation on maximum power point tracking methods for partial shading in PV systems,” Renewable and Sustainable Energy Reviews, vol. 47, pp. 933-953, 2015. [CrossRef]
- M. A. Elgendy, B. Zahawi and D. J. Atkinson, “Assessment of perturb and observe MPPT algorithm implementation techniques for PV pumping applications,” IEEE, vol. 3, no. 1, pp. 21-33, 2012. [CrossRef]
- A. M. Eltamaly, M. S. Al-Saud and A. G. Abokhalil, “A novel scanning bat algorithm strategy for maximum power point tracker of partially shaded photovoltaic energy systems,” Ain Shams Engineering Journal, vol. 11, no. 4, pp. 1093-1103, 2020. [CrossRef]
- A. Askarzadeh and A. Rezazadeh, “Artificial bee swarm optimization algorithm for parameters identification of solar cell models,” Applied Energy, vol. 102, pp. 943-949, 2013. [CrossRef]
- A. O. Baatiah, A. M. Eltamaly and M. A. Alotaibi, “Improving Photovoltaic MPPT Performance through PSO Dynamic Swarm Size Reduction,” Energies, vol. 16, no. 18, 2023. [CrossRef]
- A. M. Eltamaly, “A novel particle swarm optimization optimal control parameter determination strategy for maximum power point trackers of partially shaded photovoltaic systems,” Engineering Optimization, vol. 54, no. 4, pp. 634-650, 2021. [CrossRef]
- A. M. Eltamaly, Z. A. Almutairi and M. A. Abdelhamid, “Modern Optimization Algorithm for Improved Performance of Maximum Power Point Tracker of Partially Shaded PV Systems,” Energies, vol. 16, no. 13, 2023. [CrossRef]
- T. Shaqarin, “Particle Swarm Optimization with Targeted Position-Mutated Elitism (PSO-TPME) for Partially Shaded PV Systems,” Sustainability, vol. 15, no. 5, p. 3993, 2023. [CrossRef]
- S. Chtita, S. Motahhir, A. El Hammoumi, A. Chouder, A. S. Benyoucef, A. El Ghzizal, A. Derouich, M. Abouhawwash and S. S. Askar, “novel hybrid GWO–PSO-based maximum power point tracking for photovoltaic systems operating under partial shading conditions,” Sci Rep 12, p. 10637, 2022. [CrossRef]
- I. Dagal, B. Akın and E. Akboy, “MPPT mechanism based on novel hybrid particle swarm optimization and salp swarm optimization algorithm for battery charging through simulink,” Sci Rep 12, p. 2664, 2022. [CrossRef]
- N. Kacimi, A. Idir, S. Grouni and M. S. Boucherit, “Improved MPPT Control Strategy for PV Connected to Grid Using IncCond-PSO-MPC Approach,” CSEE JOURNAL OF POWER AND ENERGY SYSTEMS, vol. 9, no. 3, pp. 1008-1020, 2023.
- A. Sharma, A. Sharma, V. Jately, M. Averbukh, S. Rajput and B. Azzopardi, “A Novel TSA-PSO Based Hybrid Algorithm for GMPP Tracking under Partial Shading Conditions,” Energies, vol. 15, no. 9, p. 3164, 2022. [CrossRef]
- M. H. IBRAHIM, S. P. ANG, M. N. DANI, M. I. RAHMAN, R. PETRA and S. M. SULTHAN, “Optimizing Step-Size of Perturb & Observe and Incremental Conductance MPPT Techniques Using PSO for Grid-Tied PV System,” IEEE Access, vol. 11, pp. 13079-13090, 2023. [CrossRef]
- A. M. Eltamaly, “A Novel Strategy for Optimal PSO Control Parameters Determination for PV Energy Systems,” Sustainability, no. 13, p. 1008, 2021. [CrossRef]
- A. M. Eltamaly, M. S. Al-Saud and A. G. Abo-Khalil, “Performance Improvement of PV Systems’ Maximum Power Point Tracker Based on a Scanning PSO Particle Strategy,” Sustainability, vol. 12, no. 1185, 2020. [CrossRef]
- A. A. Kamil and M. S. Nasr, “Maximum Power Point Tracking Method for Photovoltaic System Based on Enhanced Particle Swarm Optimization Algorithm Under Partial Shading Condition,” International Journal of Intelligent Engineering and Systems, vol. 13, no. 6, pp. 241-254, 2020. [CrossRef]
- G. S. Chawda, O. P. Mahela, N. Gupta, M. Khosravy and T. Senjyu, “Incremental Conductance Based Particle Swarm Optimization Algorithm for Global Maximum Power Tracking of Solar-PV under Nonuniform Operating Conditions,” MDPI, vol. 10, no. 13, 2020. [CrossRef]
- G. Al-Muthanna, S. Fang, I. AL-Wesabi, K. Ameur, H. Kotb, K. M. AboRas, H. Z. Al Garni and A. A. Mas’ud, “A High Speed MPPT Control Utilizing a Hybrid PSO-PID Controller under Partially Shaded Photovoltaic Battery Chargers,” MDPI, vol. 15, no. 4, pp. 35-78, 2023. [CrossRef]
- A. M. Eltamaly and H. M. H. Farh, “Maximum Power Extraction from the Photovoltaic System Under Partial Shading Conditions,” pp. 107-129, 2019.
- P. Umapathy, C. Venkataseshaiah and M. S. Arumugam, “Particle Swarm Optimization with Various Inertia Weight Variants for Optimal Power Flow Solution,” Hindawi Publishing Corporation, 2010. [CrossRef]
- M. Abido, “Multiobjective particle swarm optimization technique for environmental/economic dispatch problem,” IEEE, 2008.
- Y. Shi and R. C. Eberhart, “Empirical study of particle swarm optimization,” IEEE, 1999.
- Y. Shi and R. C. Eberhart, “Parameter Selection in Particle Swarm Optimization,” in Lecture Notes in Computer Science—Evolutionary Programming VII, vol. 1447, pp. 591-600, 1998.
- A. Ratnaweera, S. K. Halgamuge and H. C. Watson, “Self-Organizing Hierarchical Particle Swarm Optimizer with Time-Varying Acceleration Coefficients,” IEEE, vol. 8, no. 3, 2004. [CrossRef]
- M. Clerc and J. Kennedy, “he particle swarm-explosion, stability, and convergence in a multidimensional complex space,” IEEE, vol. 6, pp. 58-73, 2002. [CrossRef]
- M. Clerc, “The Swarm and the Queen: Towards a Deterministic and Adaptive Particle Swarm Optimization,” In Proceedings of the 1999 Congress on Evolutionary Computation-CEC99, Washington, DC, vol. 3, p. 1951–1957, 1999.
- M. Jiang, Y. P. Luo and S. Y. Yang, “Particle swarm optimization-stochastic trajectory analysis and parameter selection,” In Swarm Intelligence, Focus on Ant and Particle Swarm Optimization, p. 179–198, 2007.
- W. Zhang, D. Ma, J.-j. Wei and H.-f. Liang, “A parameter selection strategy for particle swarm optimization based on particle positions.,” Expert Systems with Applications, p. 3576–3584, 2014. [CrossRef]
- K. R. Harrison, A. P. Engelbrecht and B. M. Ombuki-Berman, “An adaptive particle swarm optimization algorithm based on optimal parameter regions,” IEEE, pp. 1-8, 2017.
Figure 1.
The Reinforcement concept.
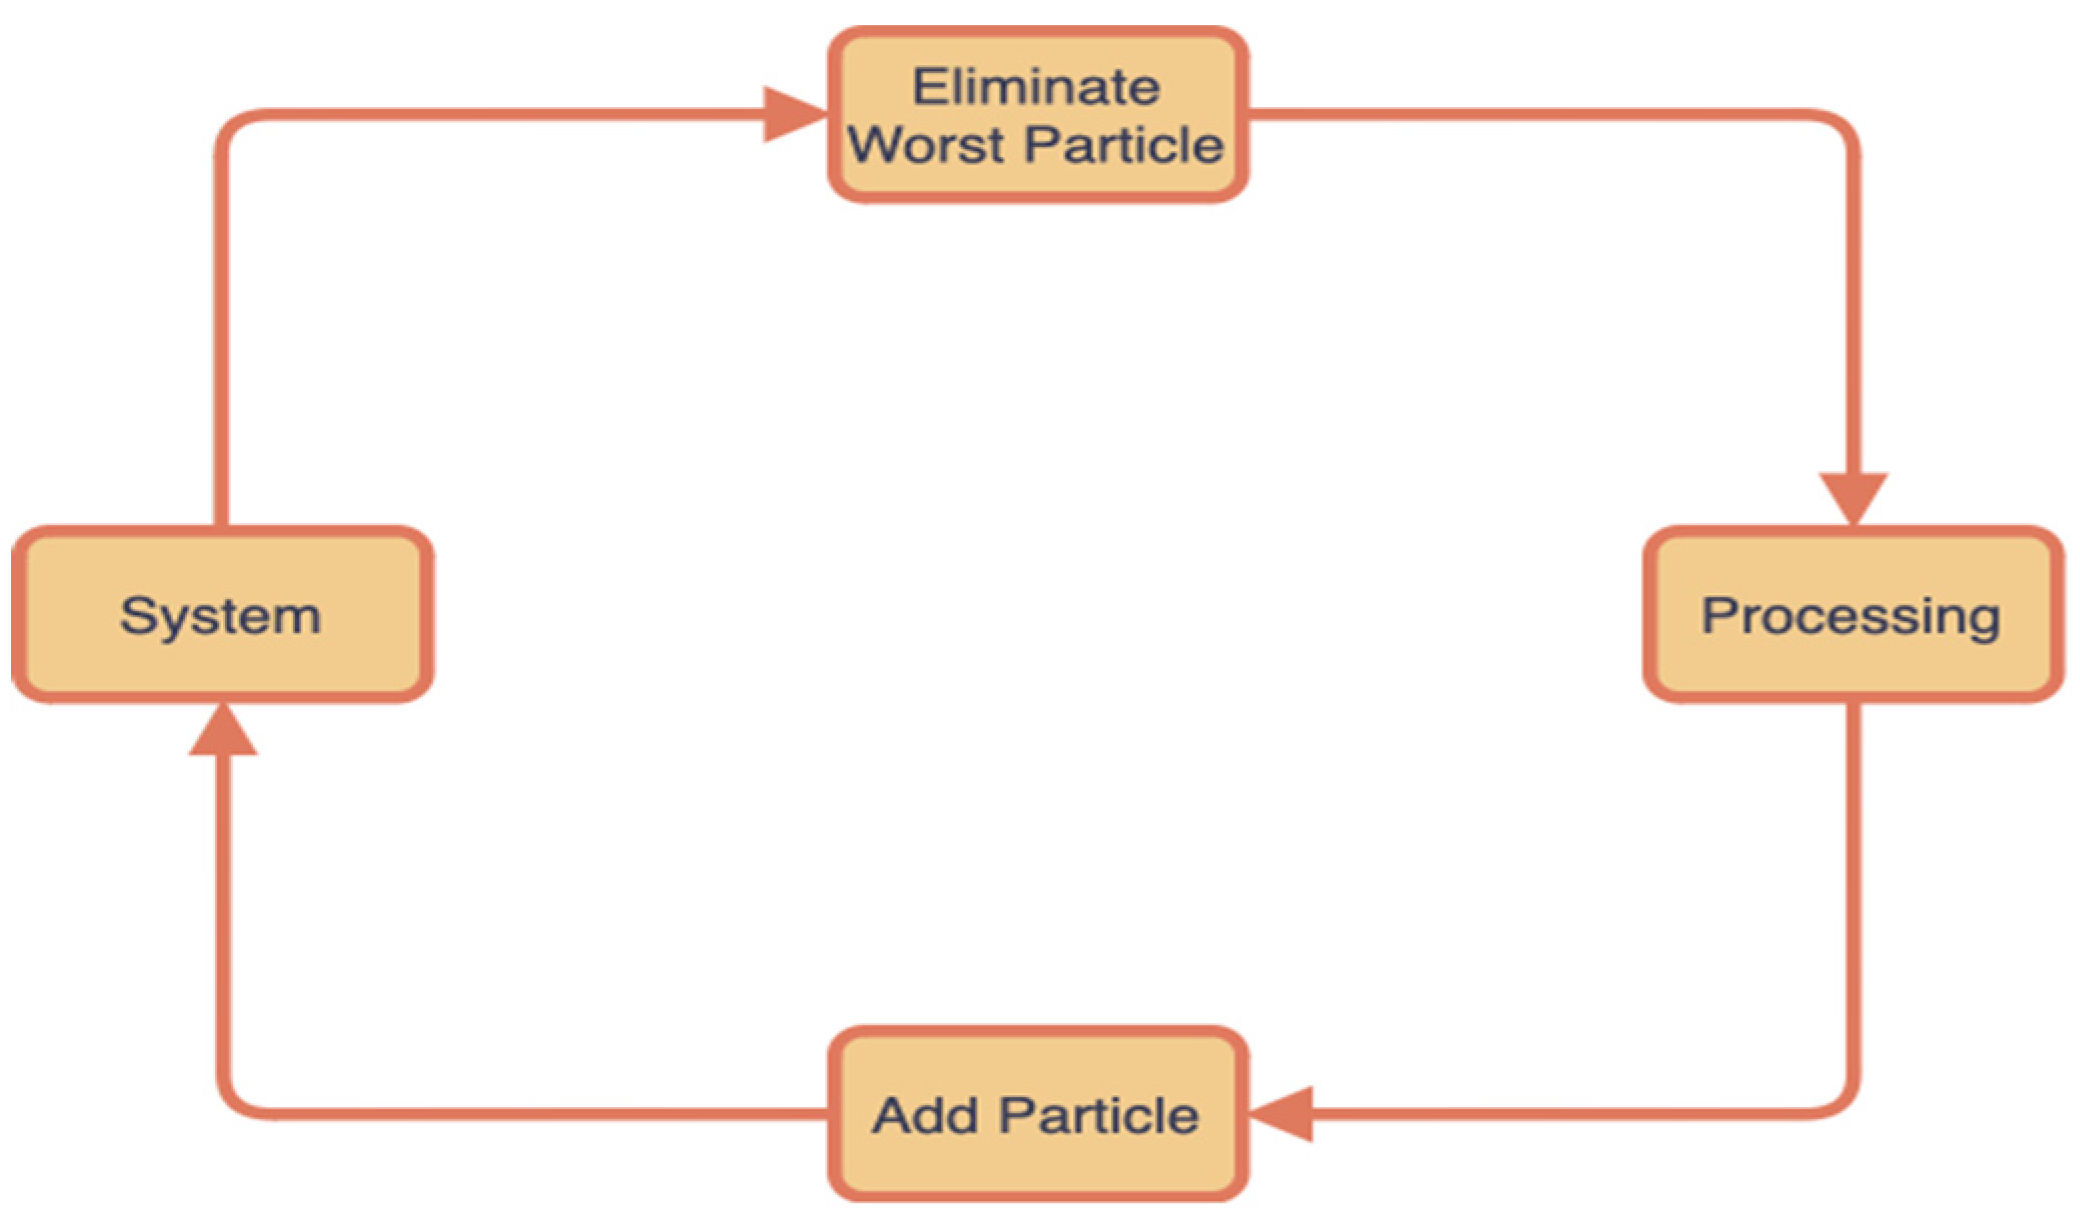
Figure 2.
The proposed PV system.
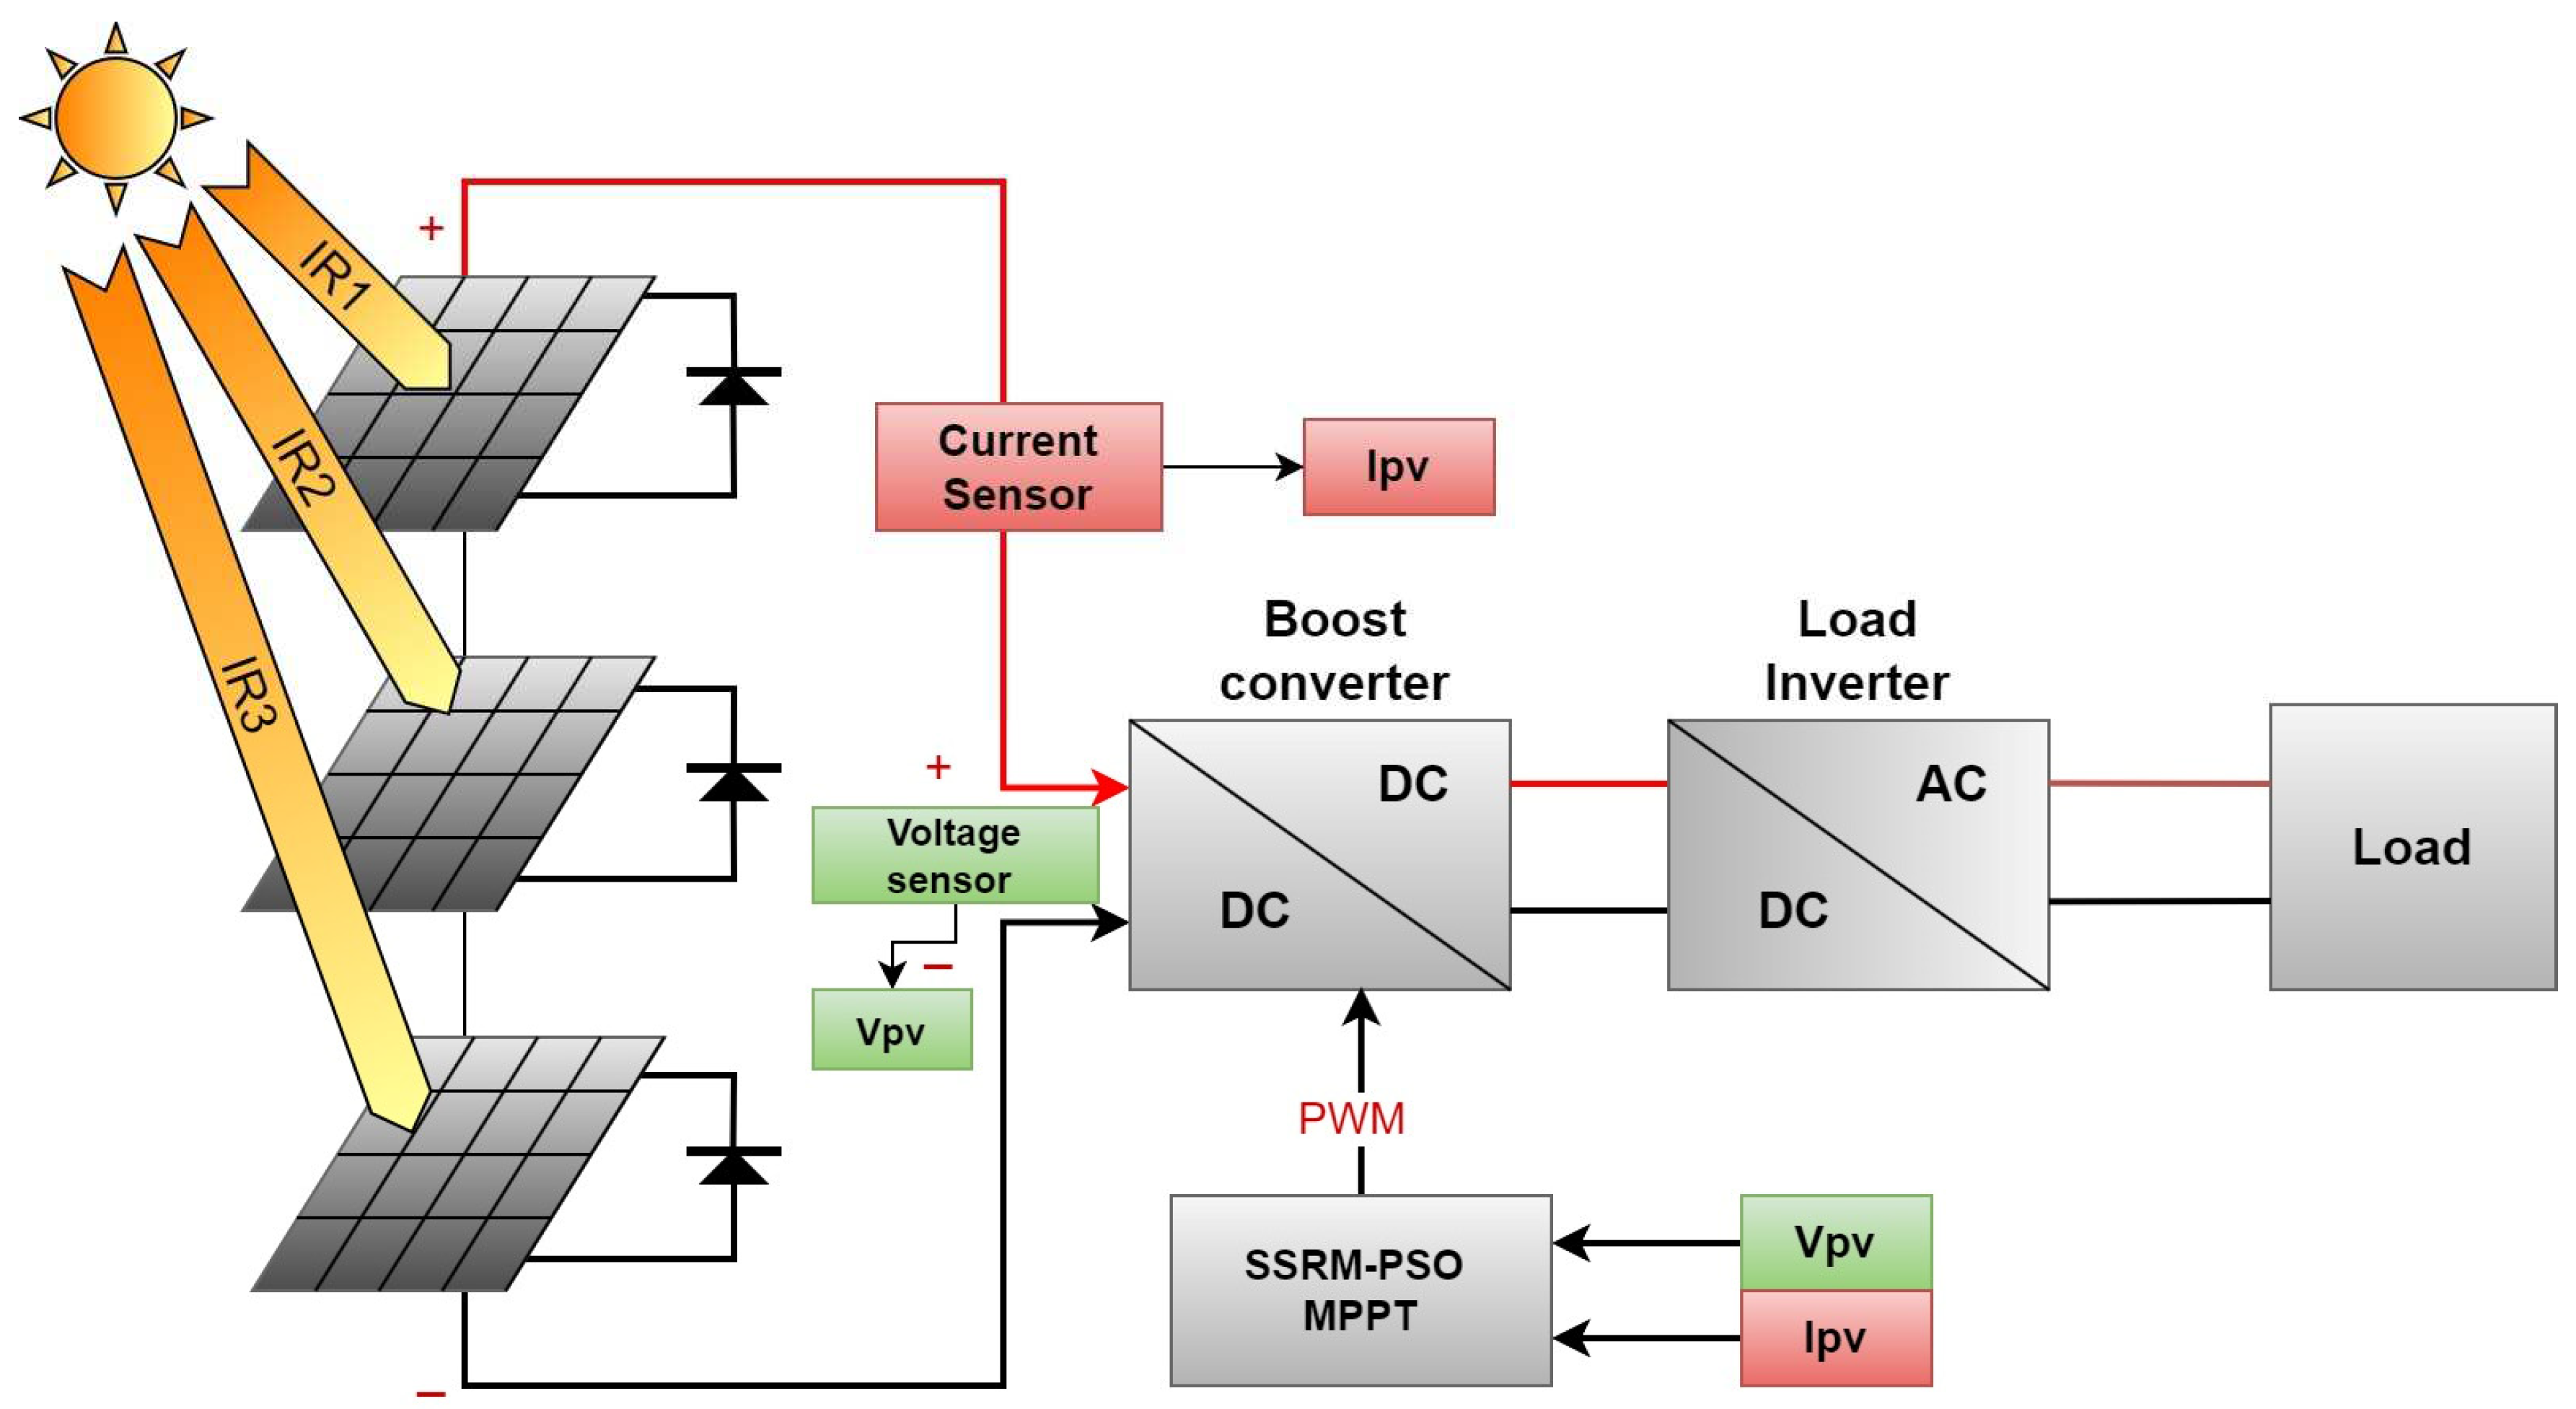
Figure 3.
The determination of the new number Q for the reinforcement.
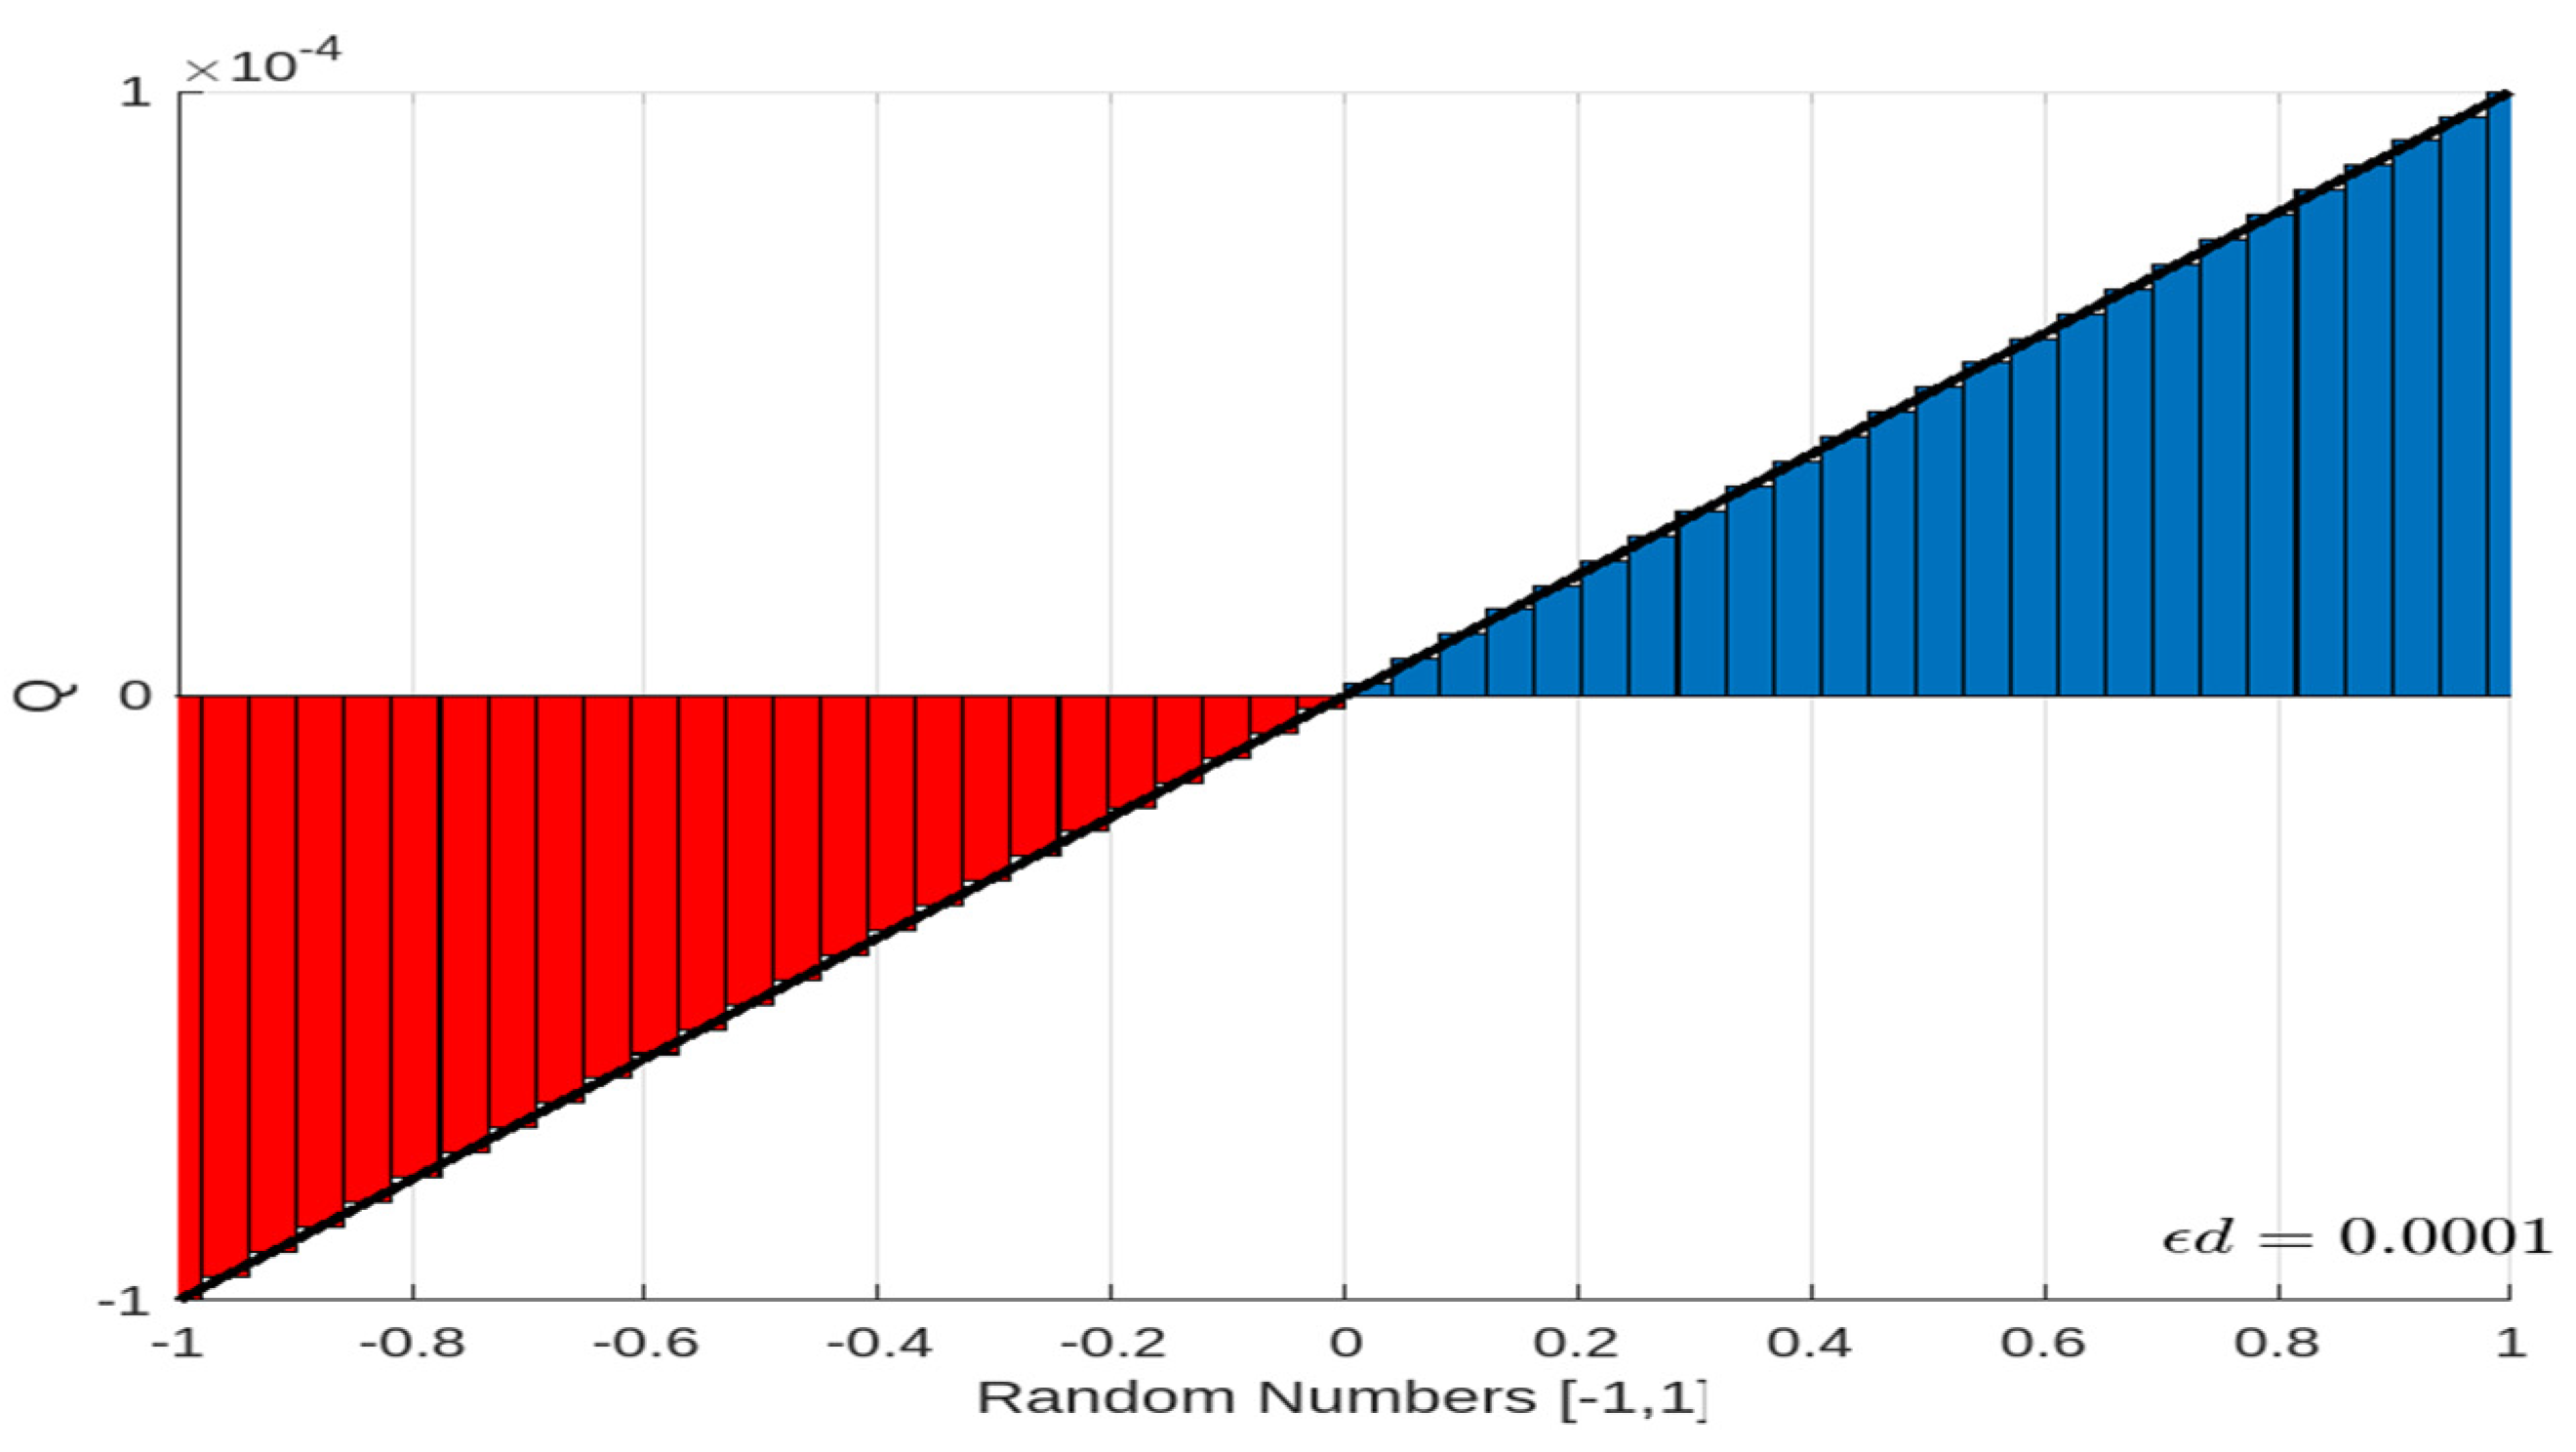
Figure 4.
Flowchart of the proposed PSO.
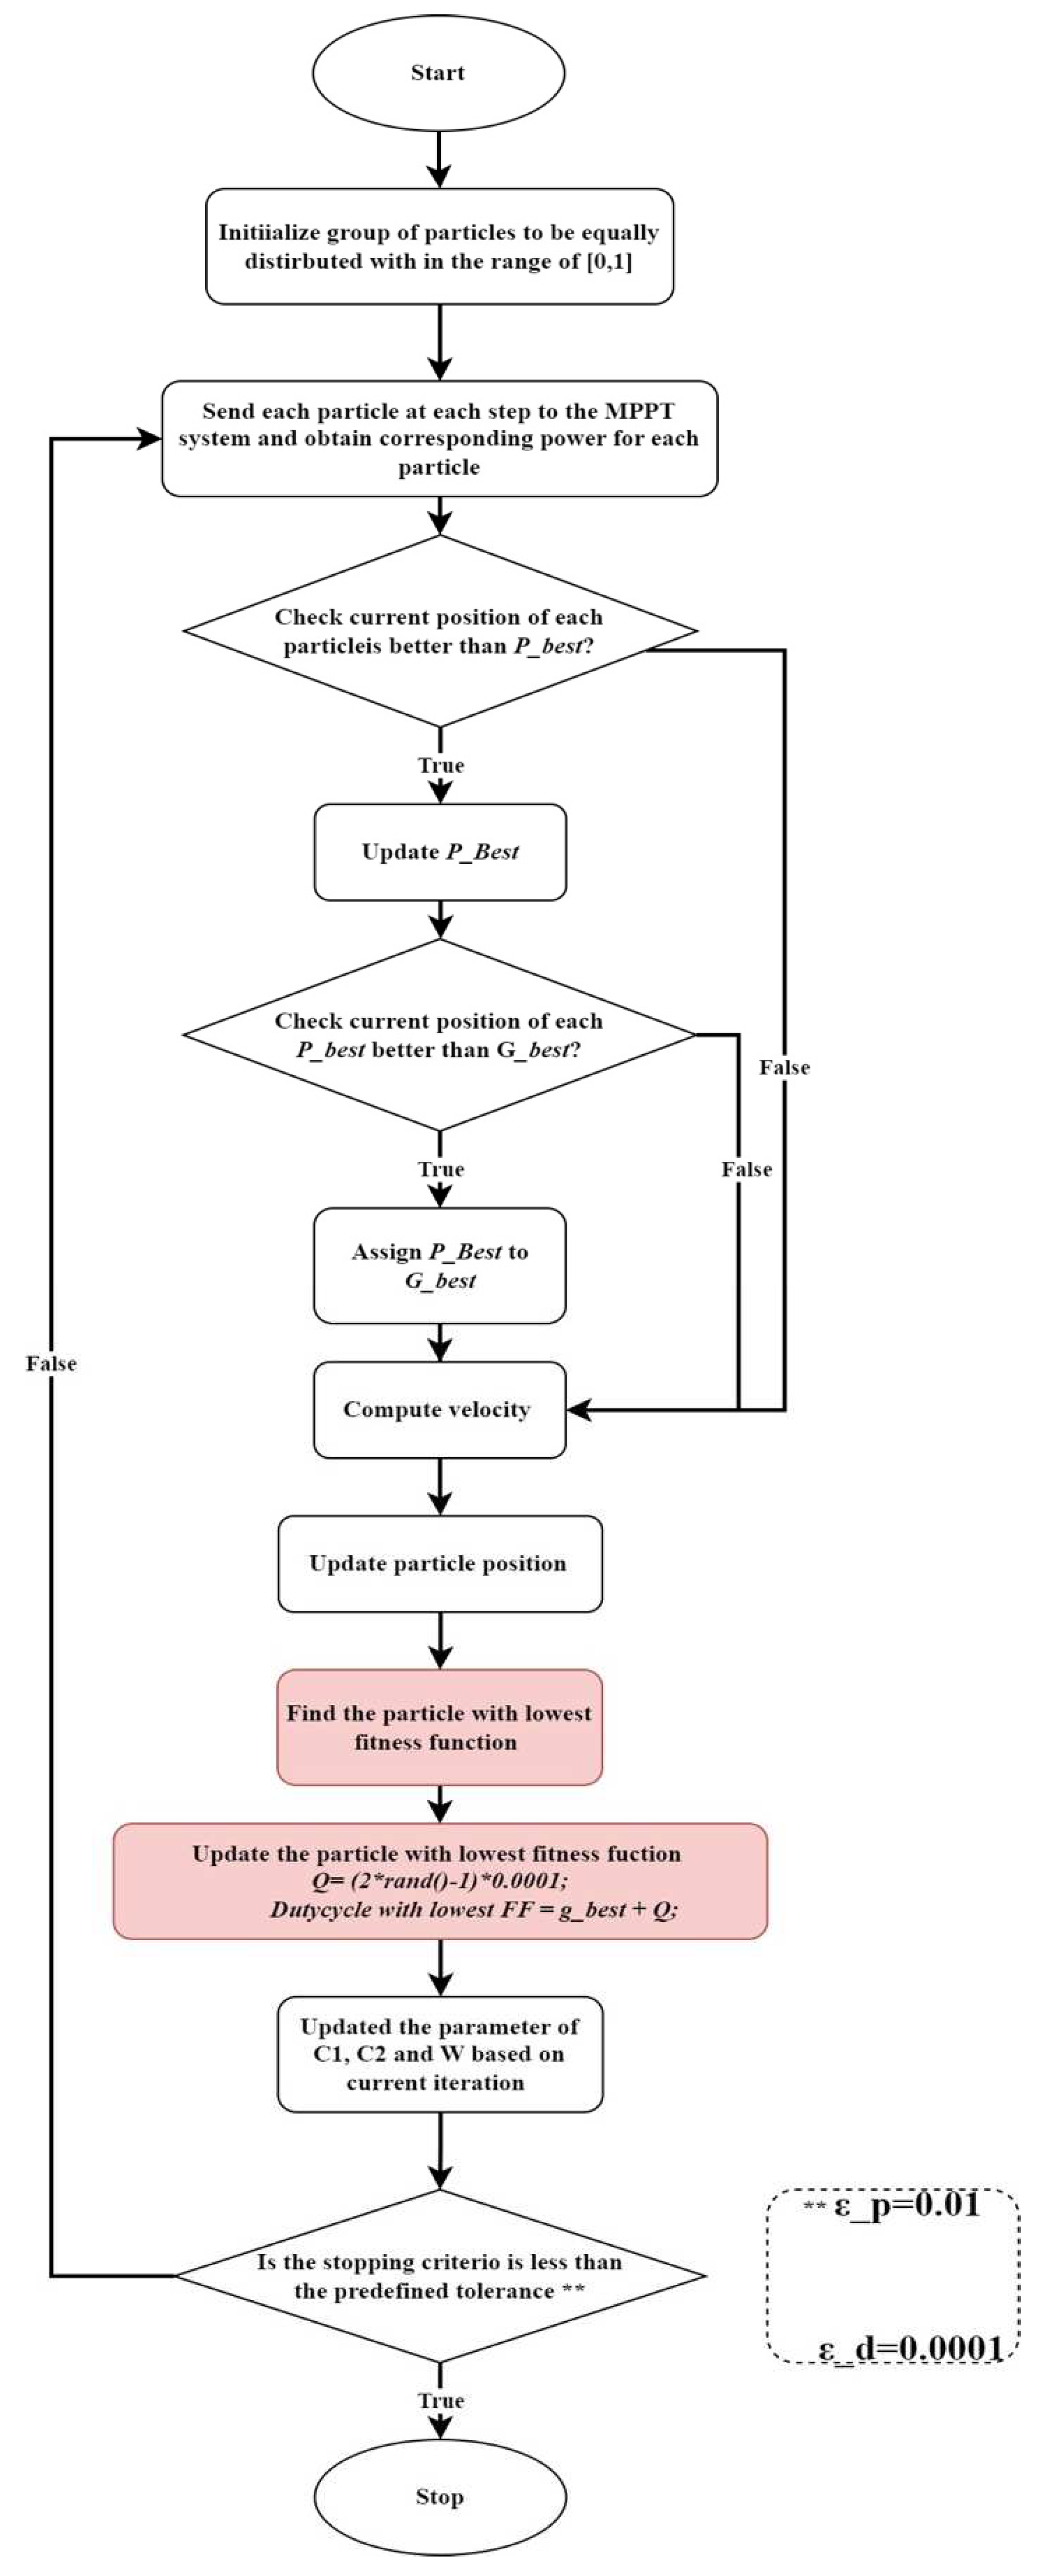
Figure 5.
The P-V curve under uniform irradiance [1000 1000 1000], and non-uniform irradiance [900 700 500].
Figure 5.
The P-V curve under uniform irradiance [1000 1000 1000], and non-uniform irradiance [900 700 500].
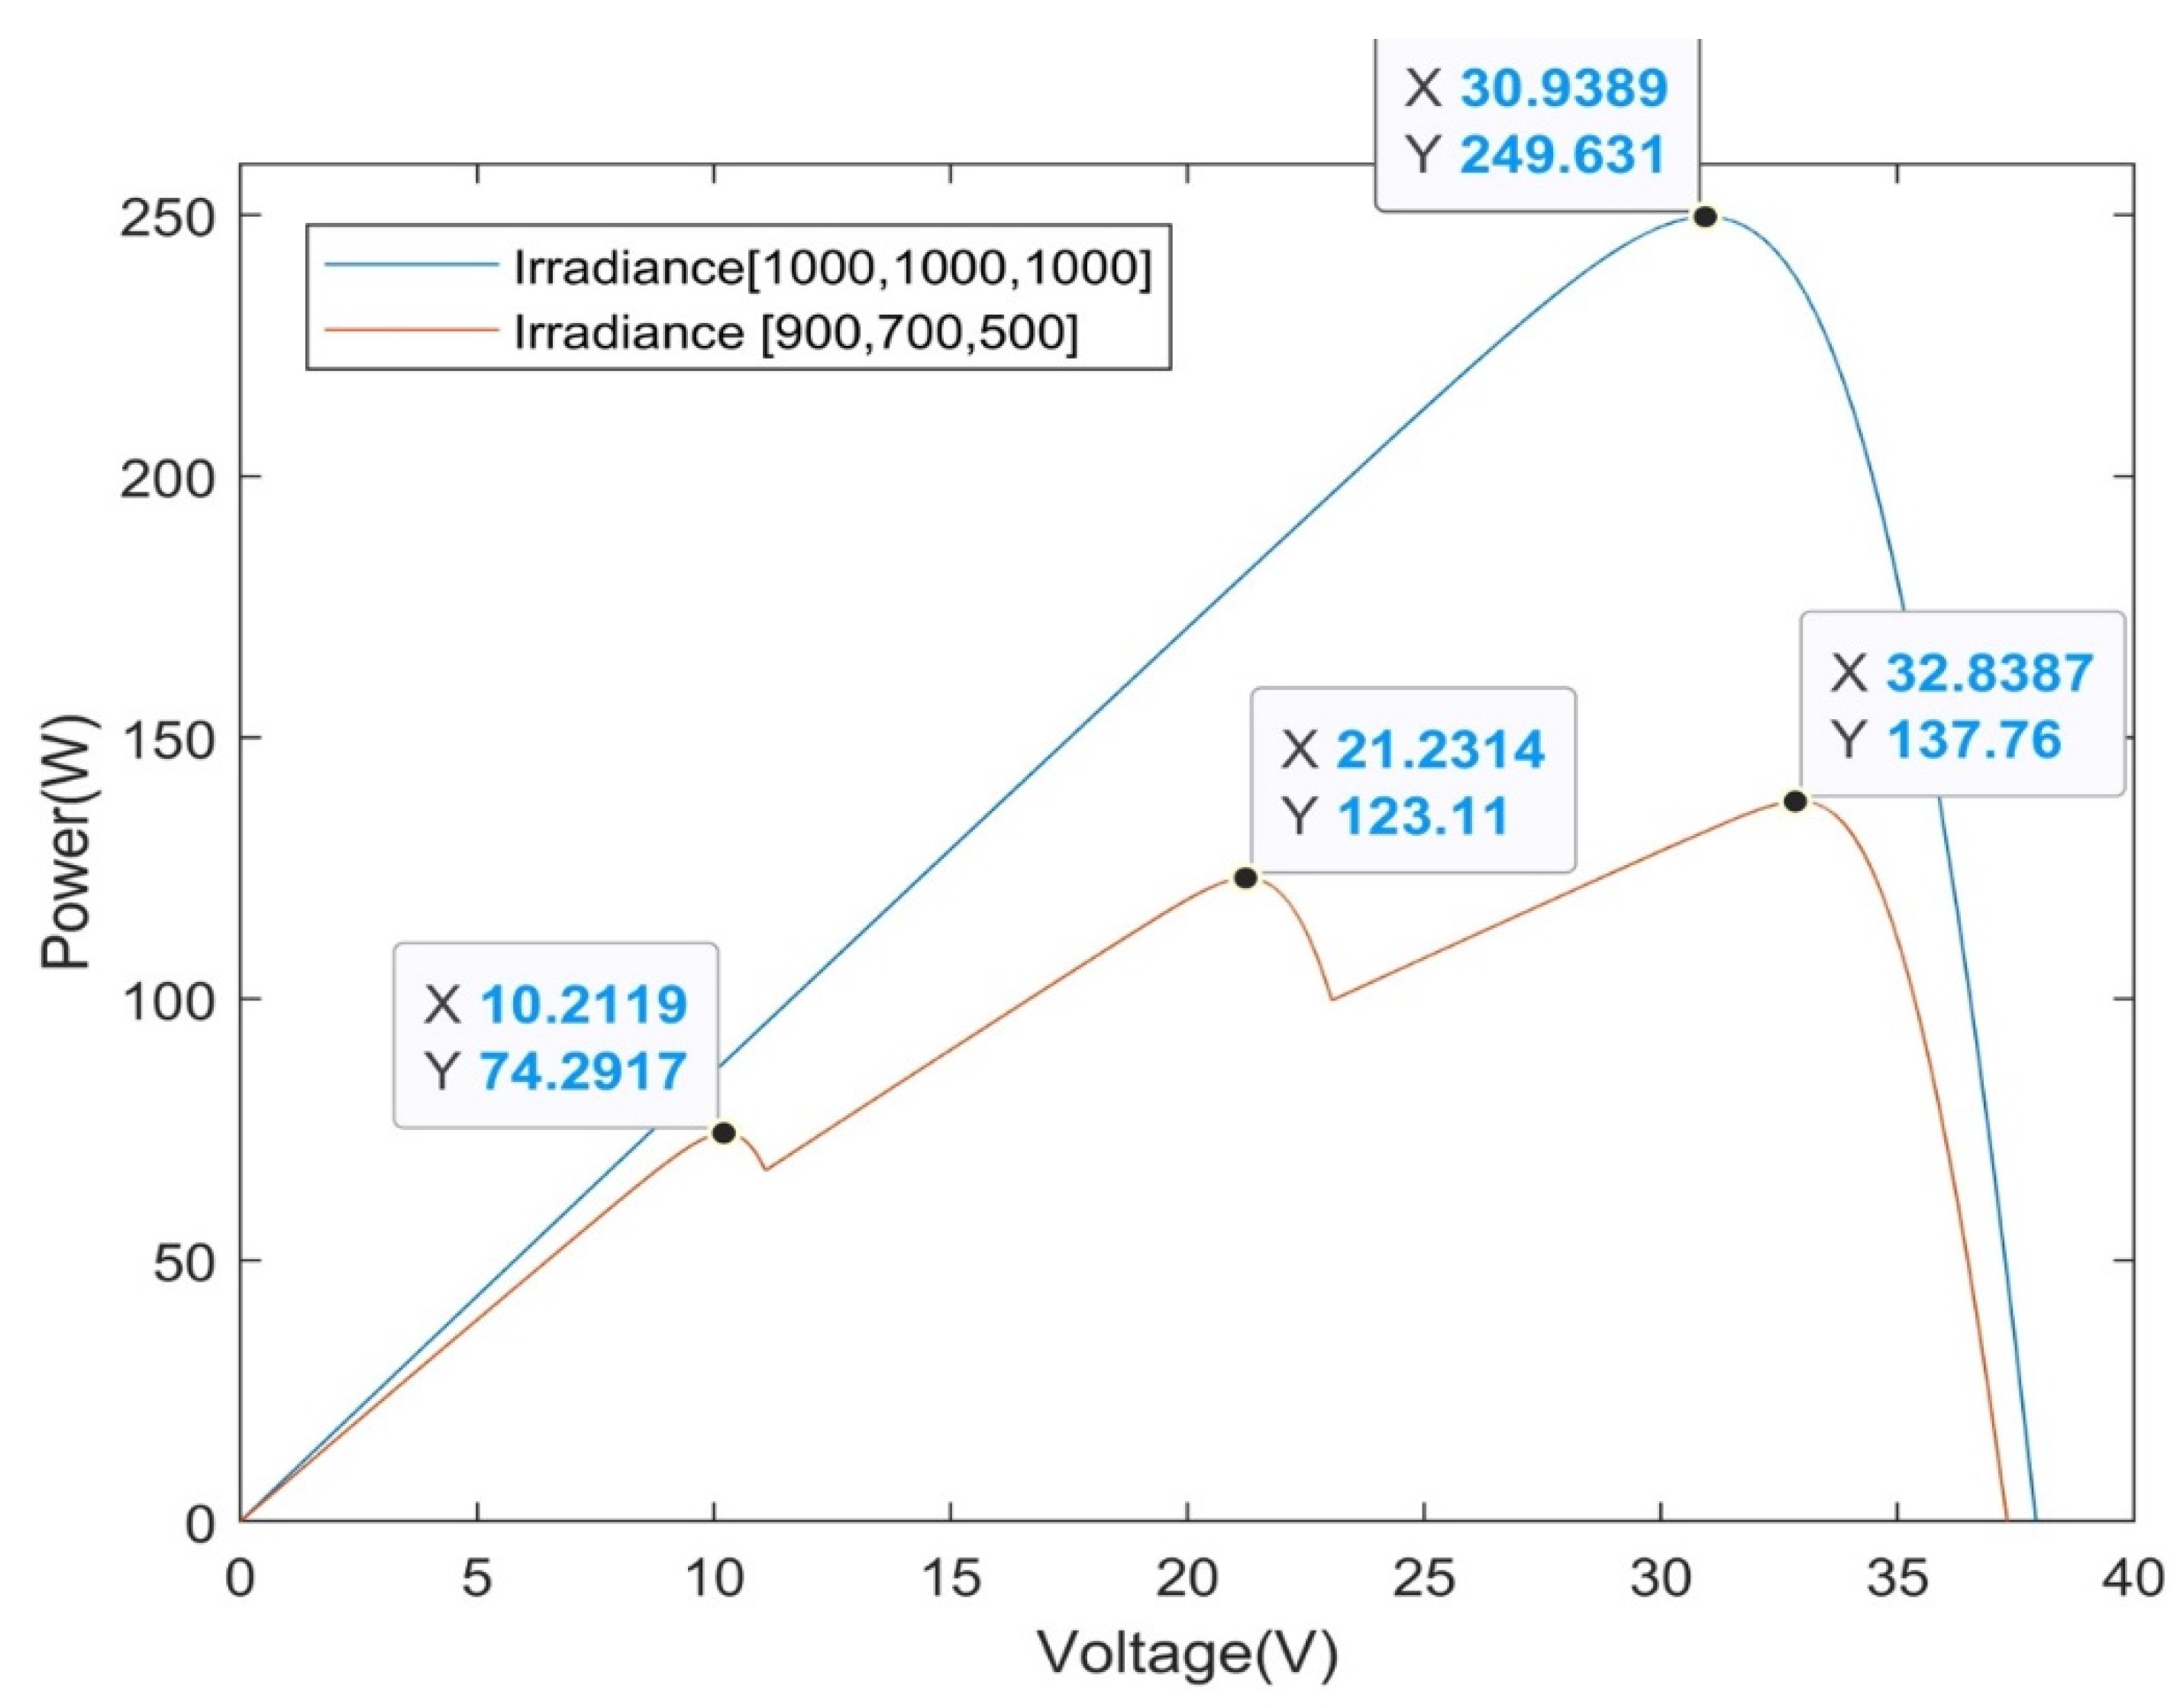
Figure 6.
Bar Chart to visualize the Results of the study.
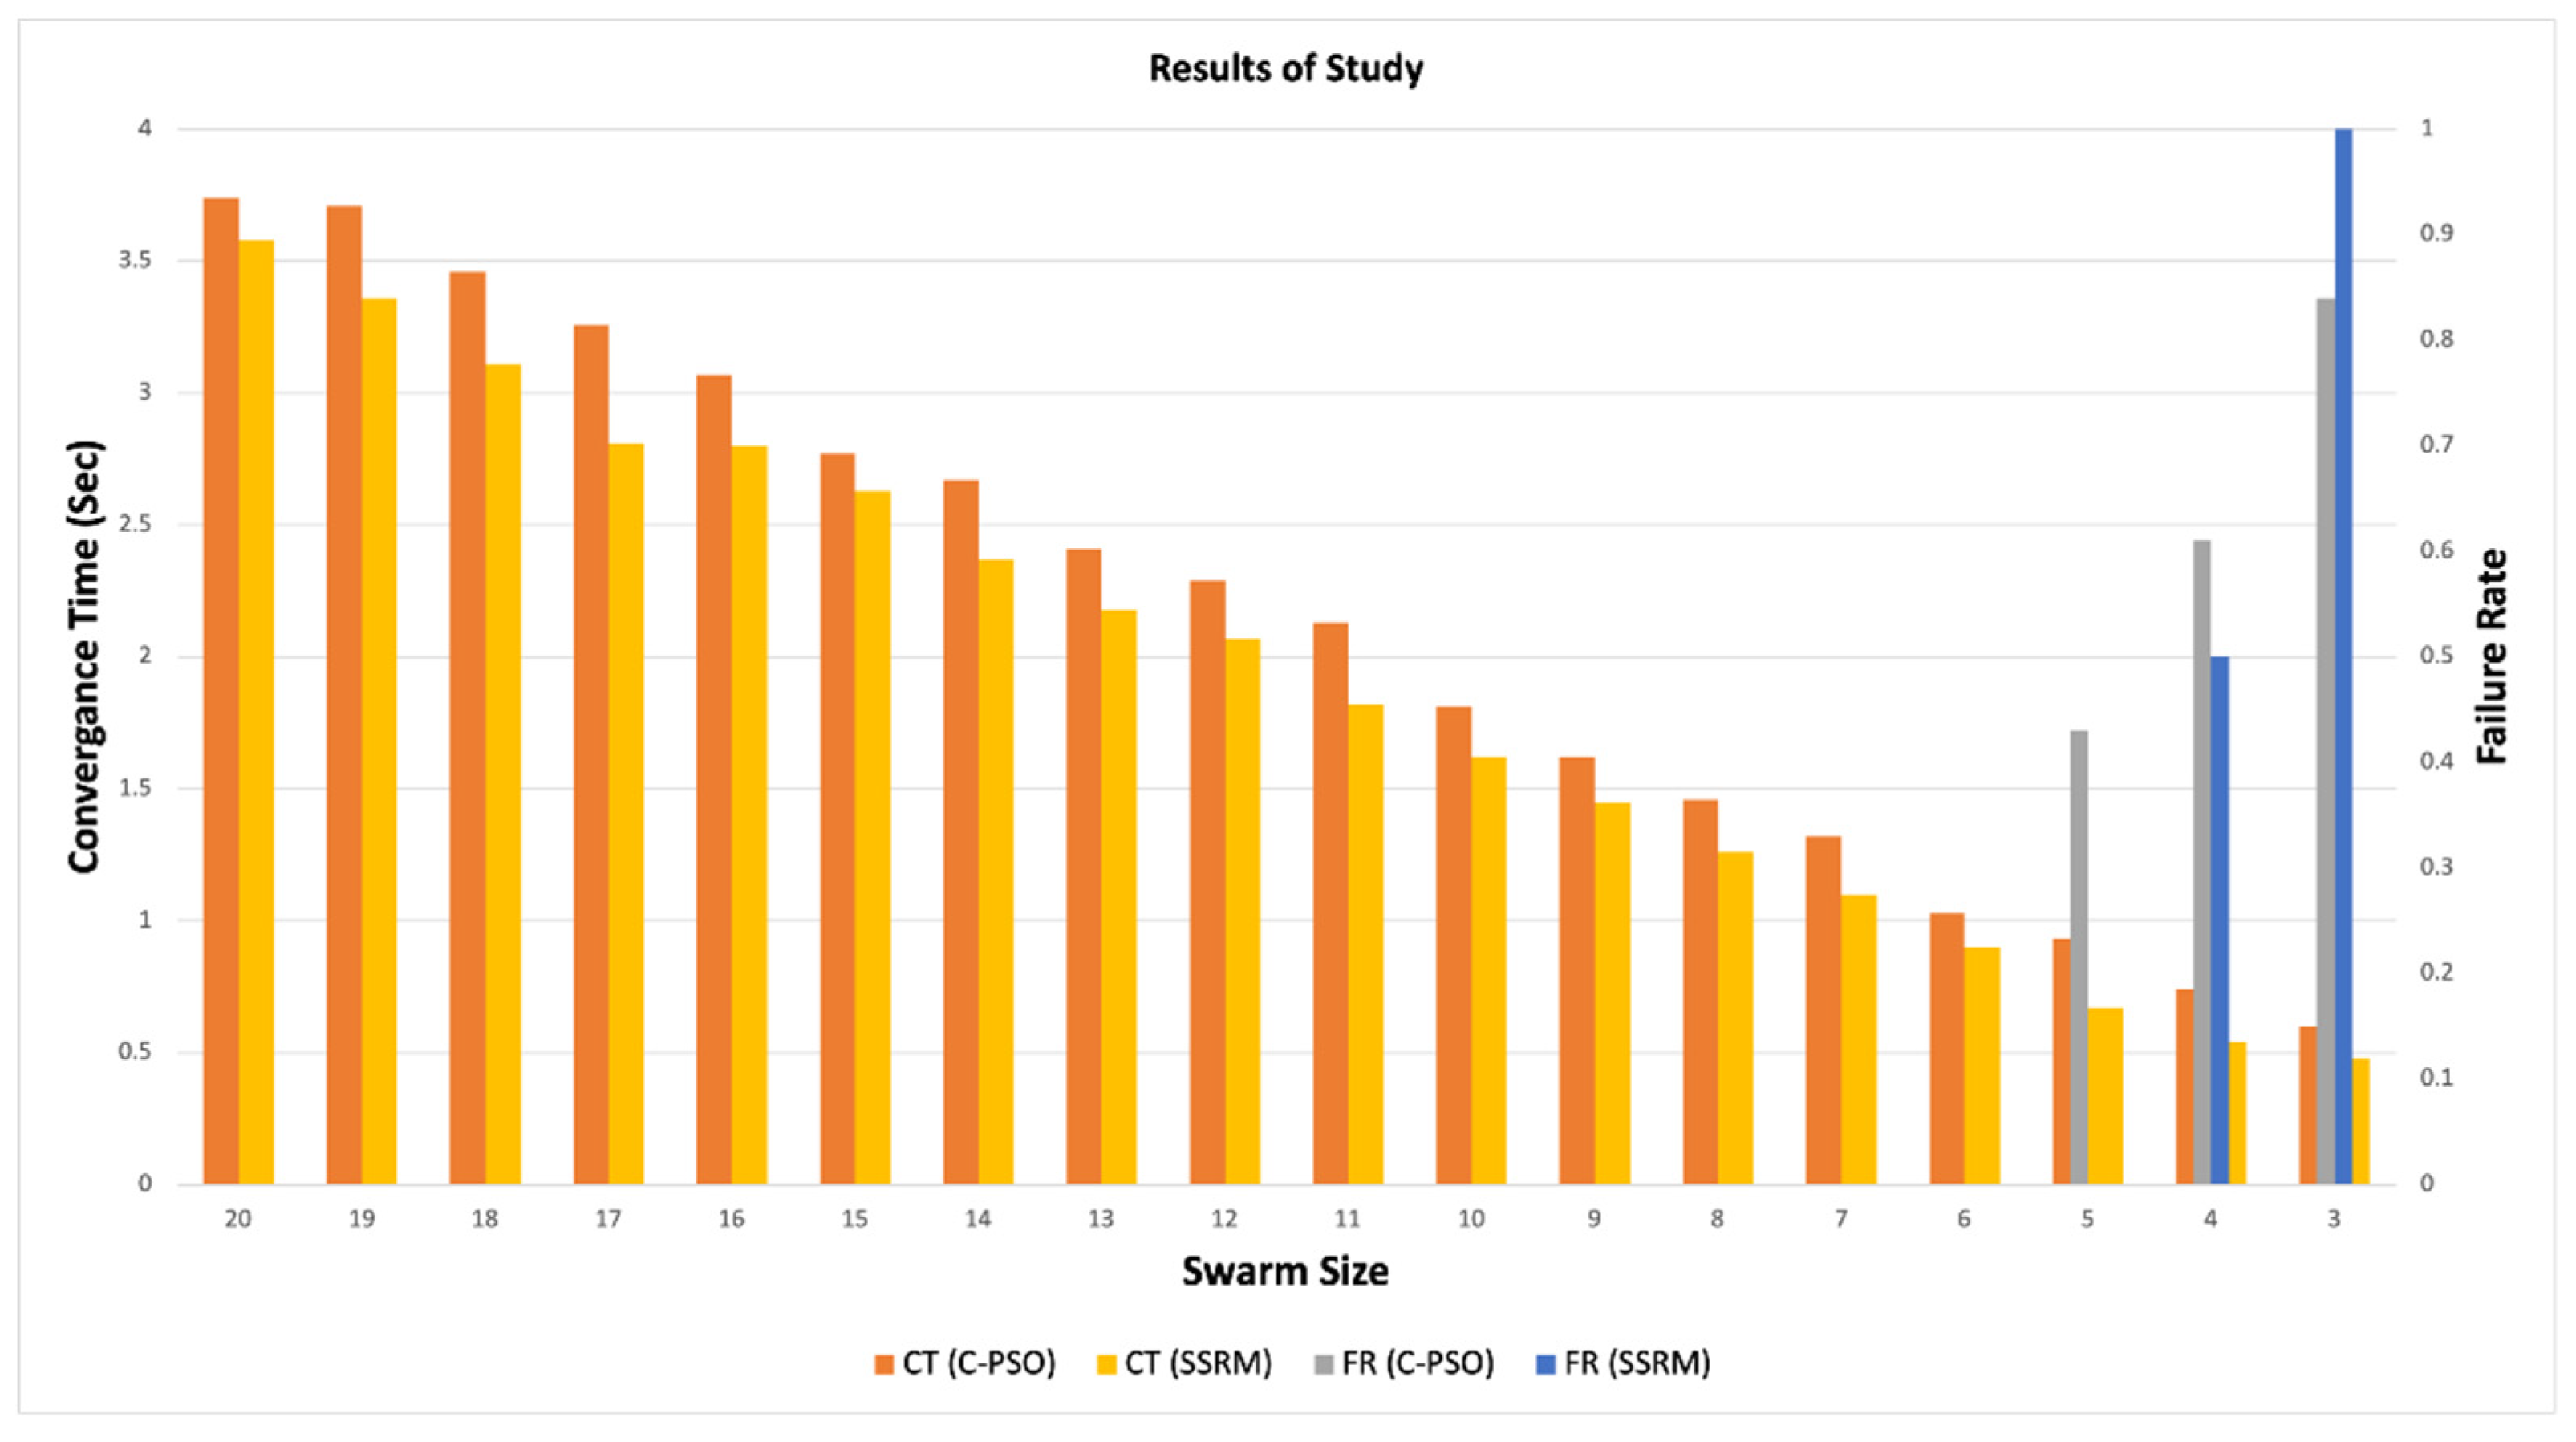
Figure 7.
The interplay between the PV curve and CT-SS curve as demonstrated using the C-PSO.
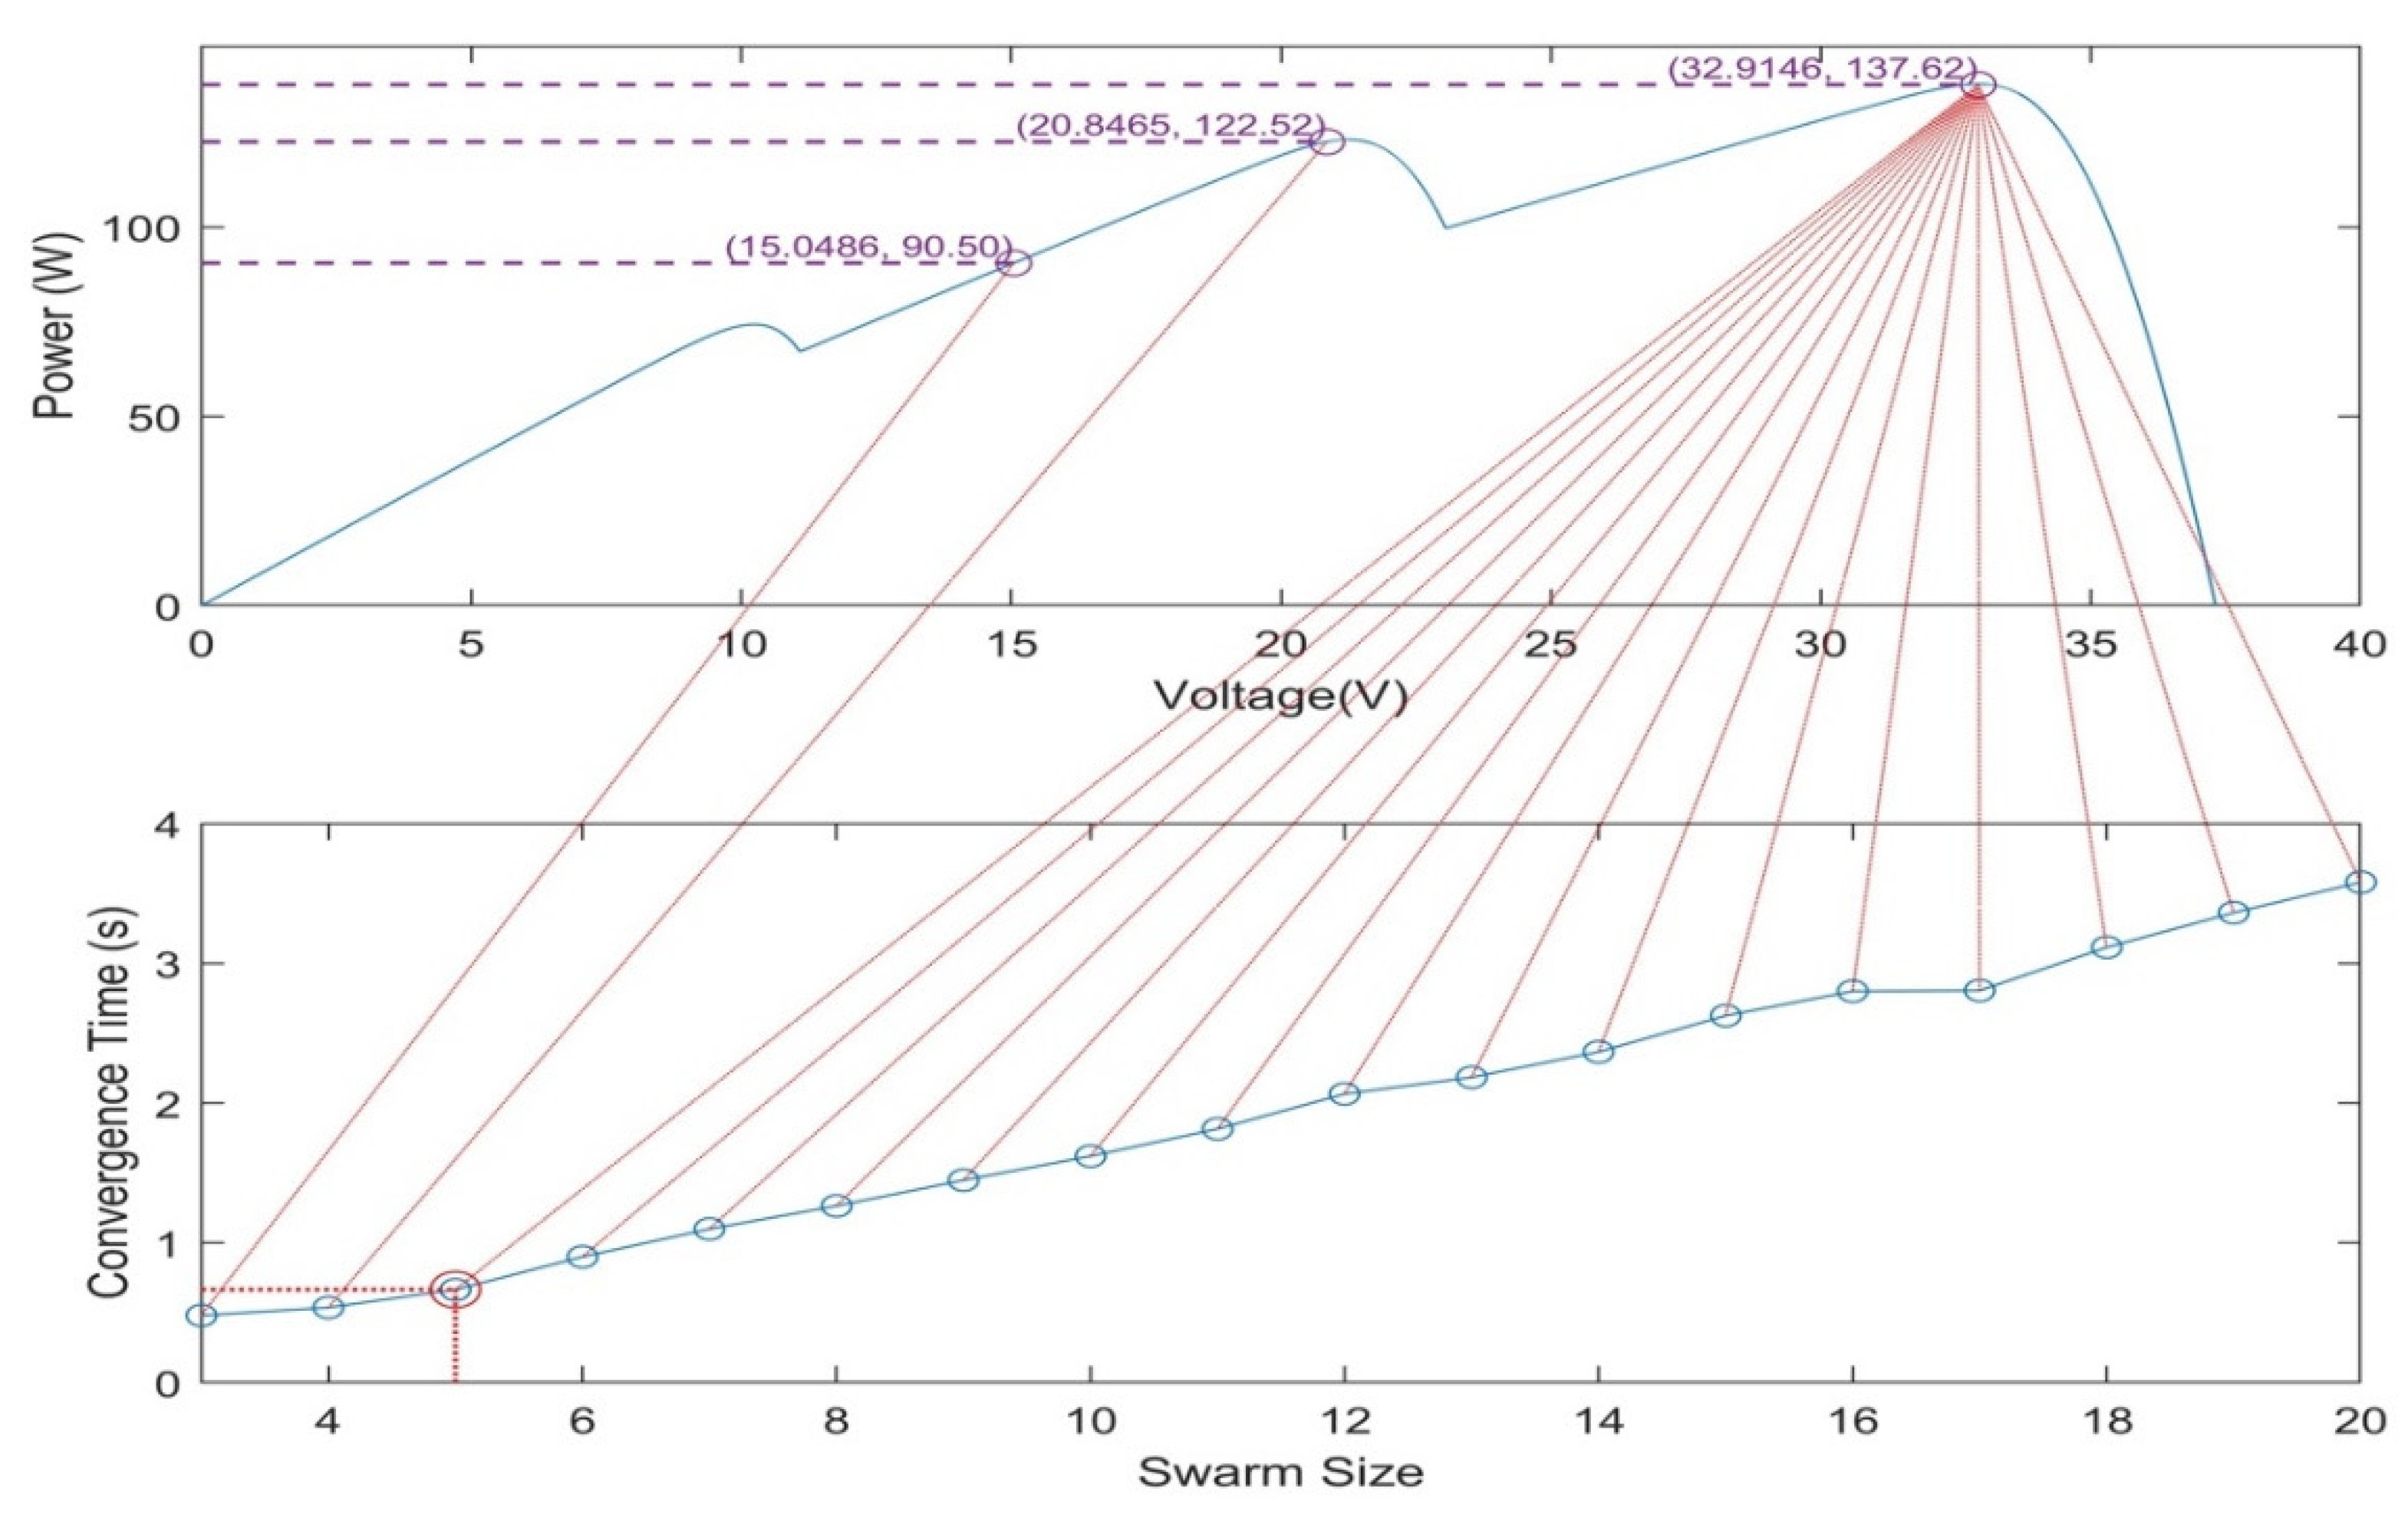
Figure 8.
The interplay between the PV curve and CT-SS curve as demonstrated using the SSRM-PSO.

Figure 9.
Simulation Results of C-PSO and Swarm Size = 5.
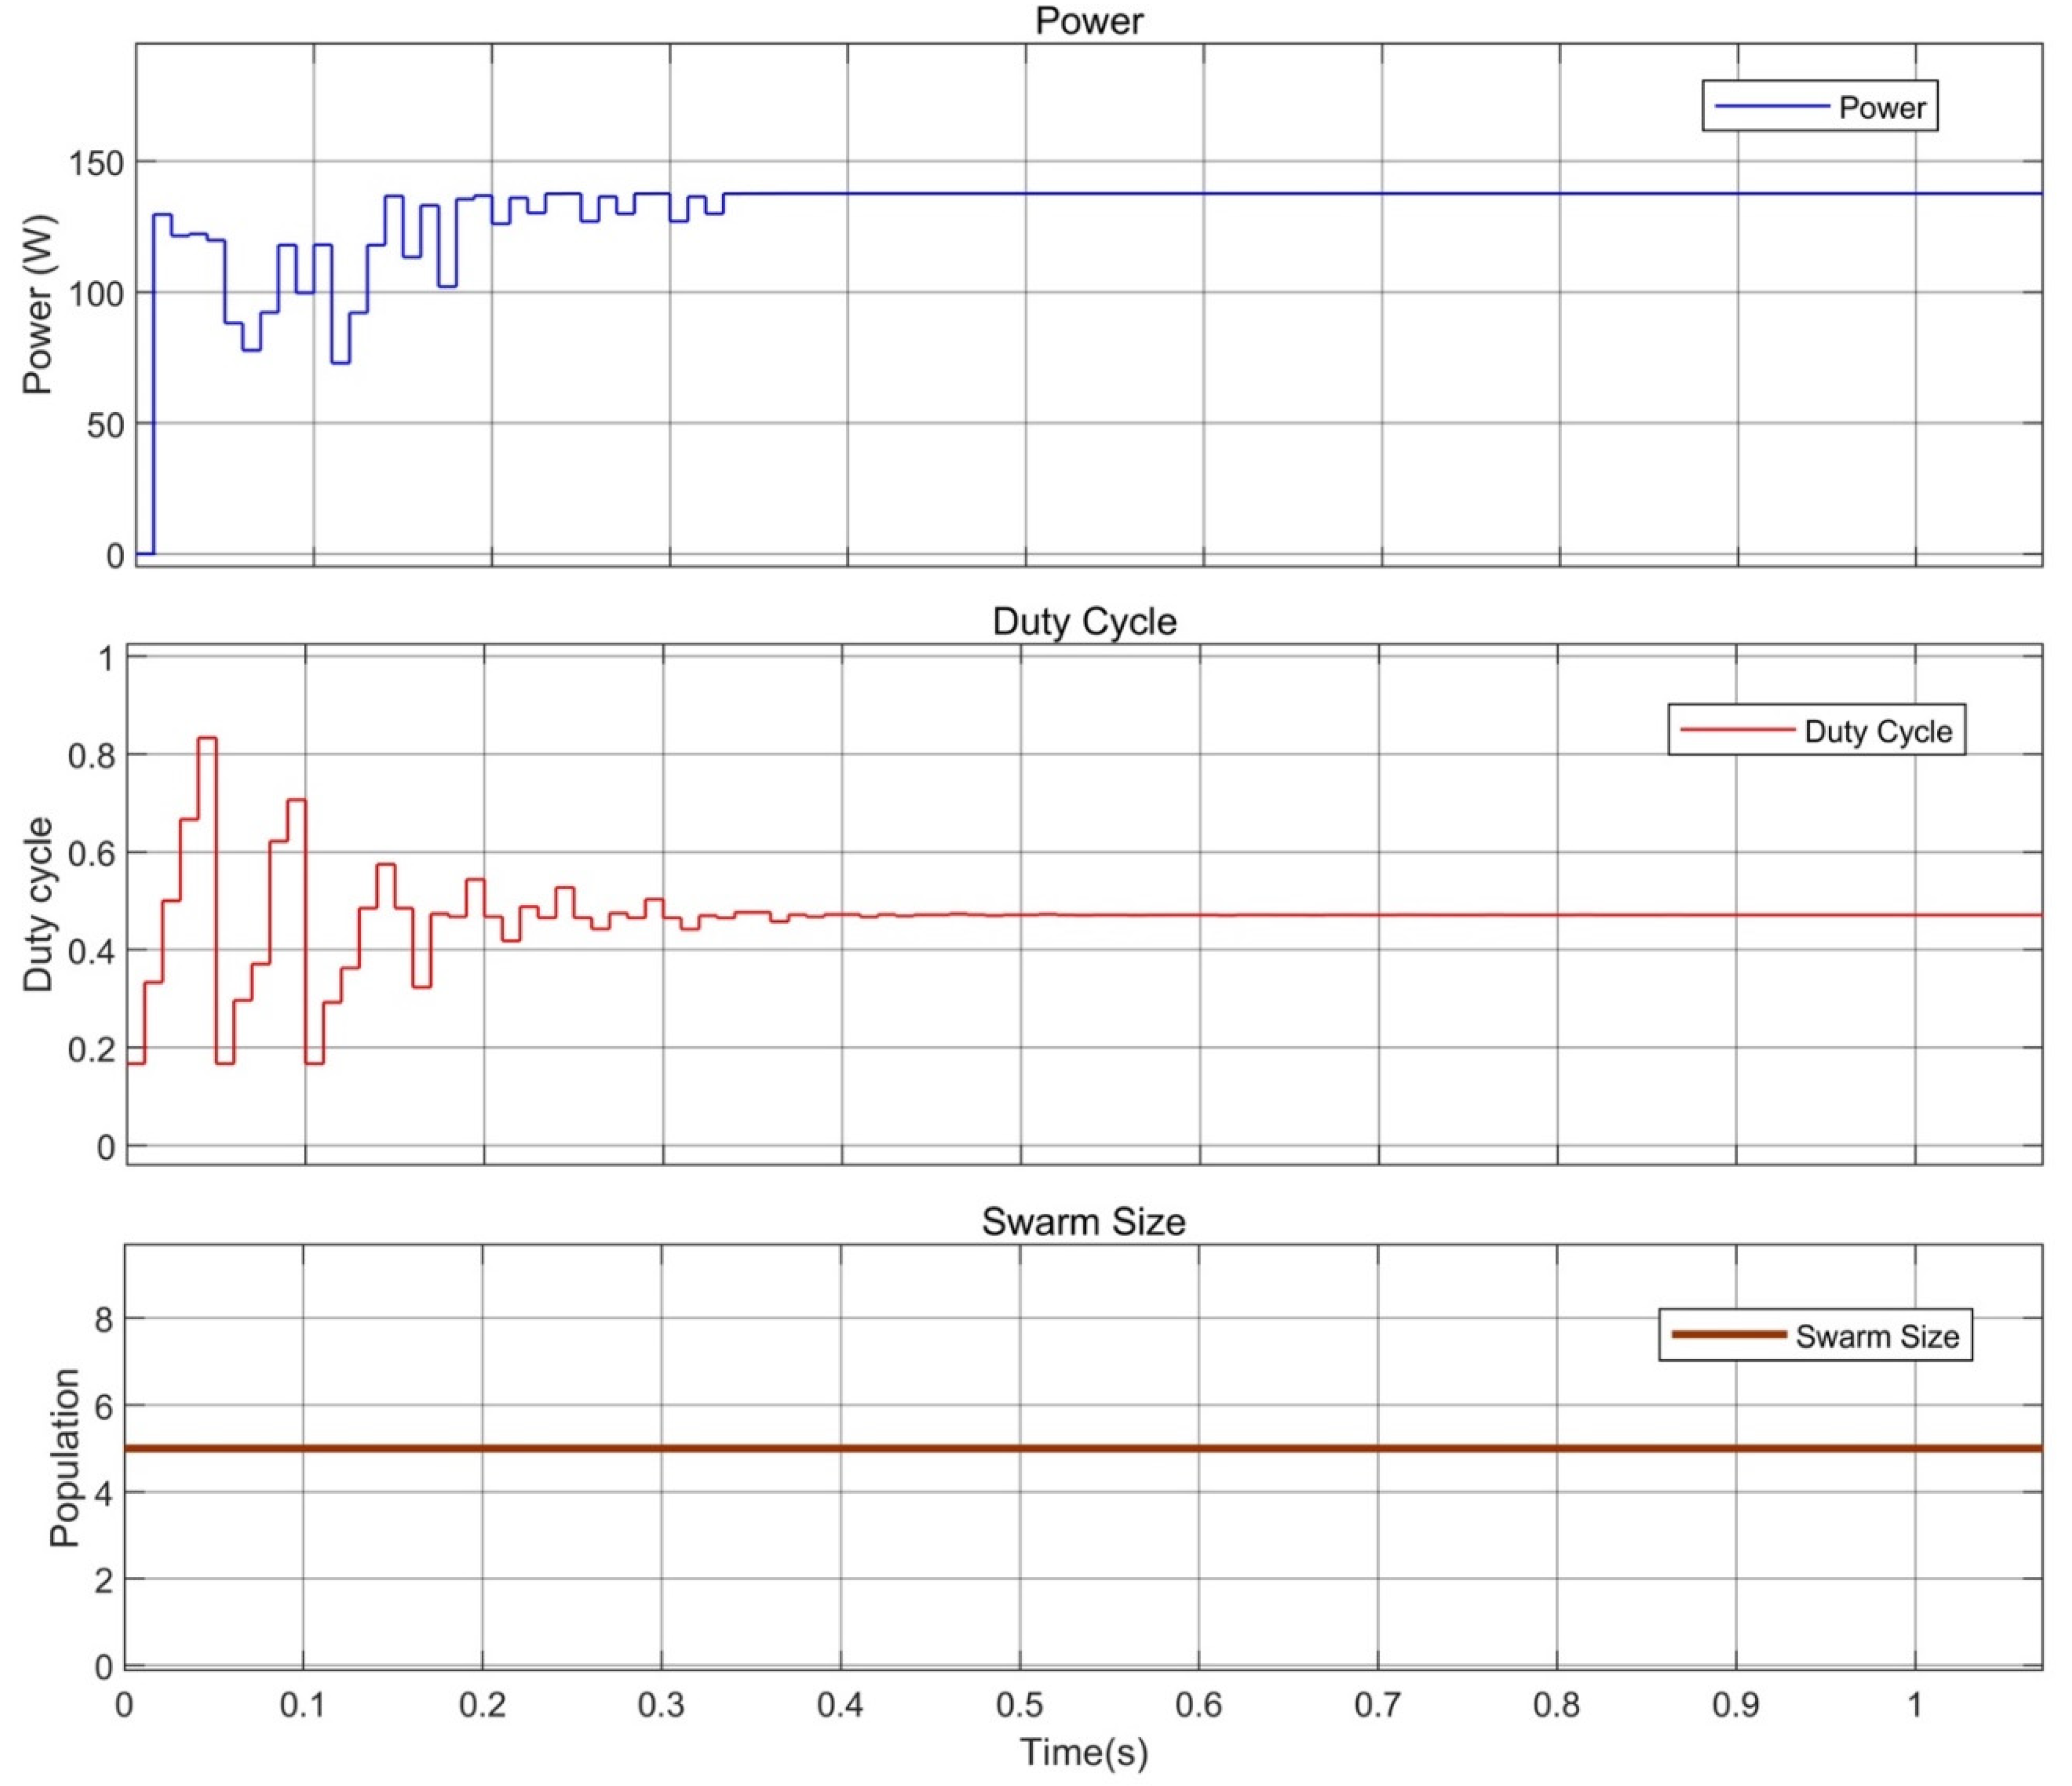
Figure 10.
Simulation Results of PSO-SSRM and Swarm Size = 5.
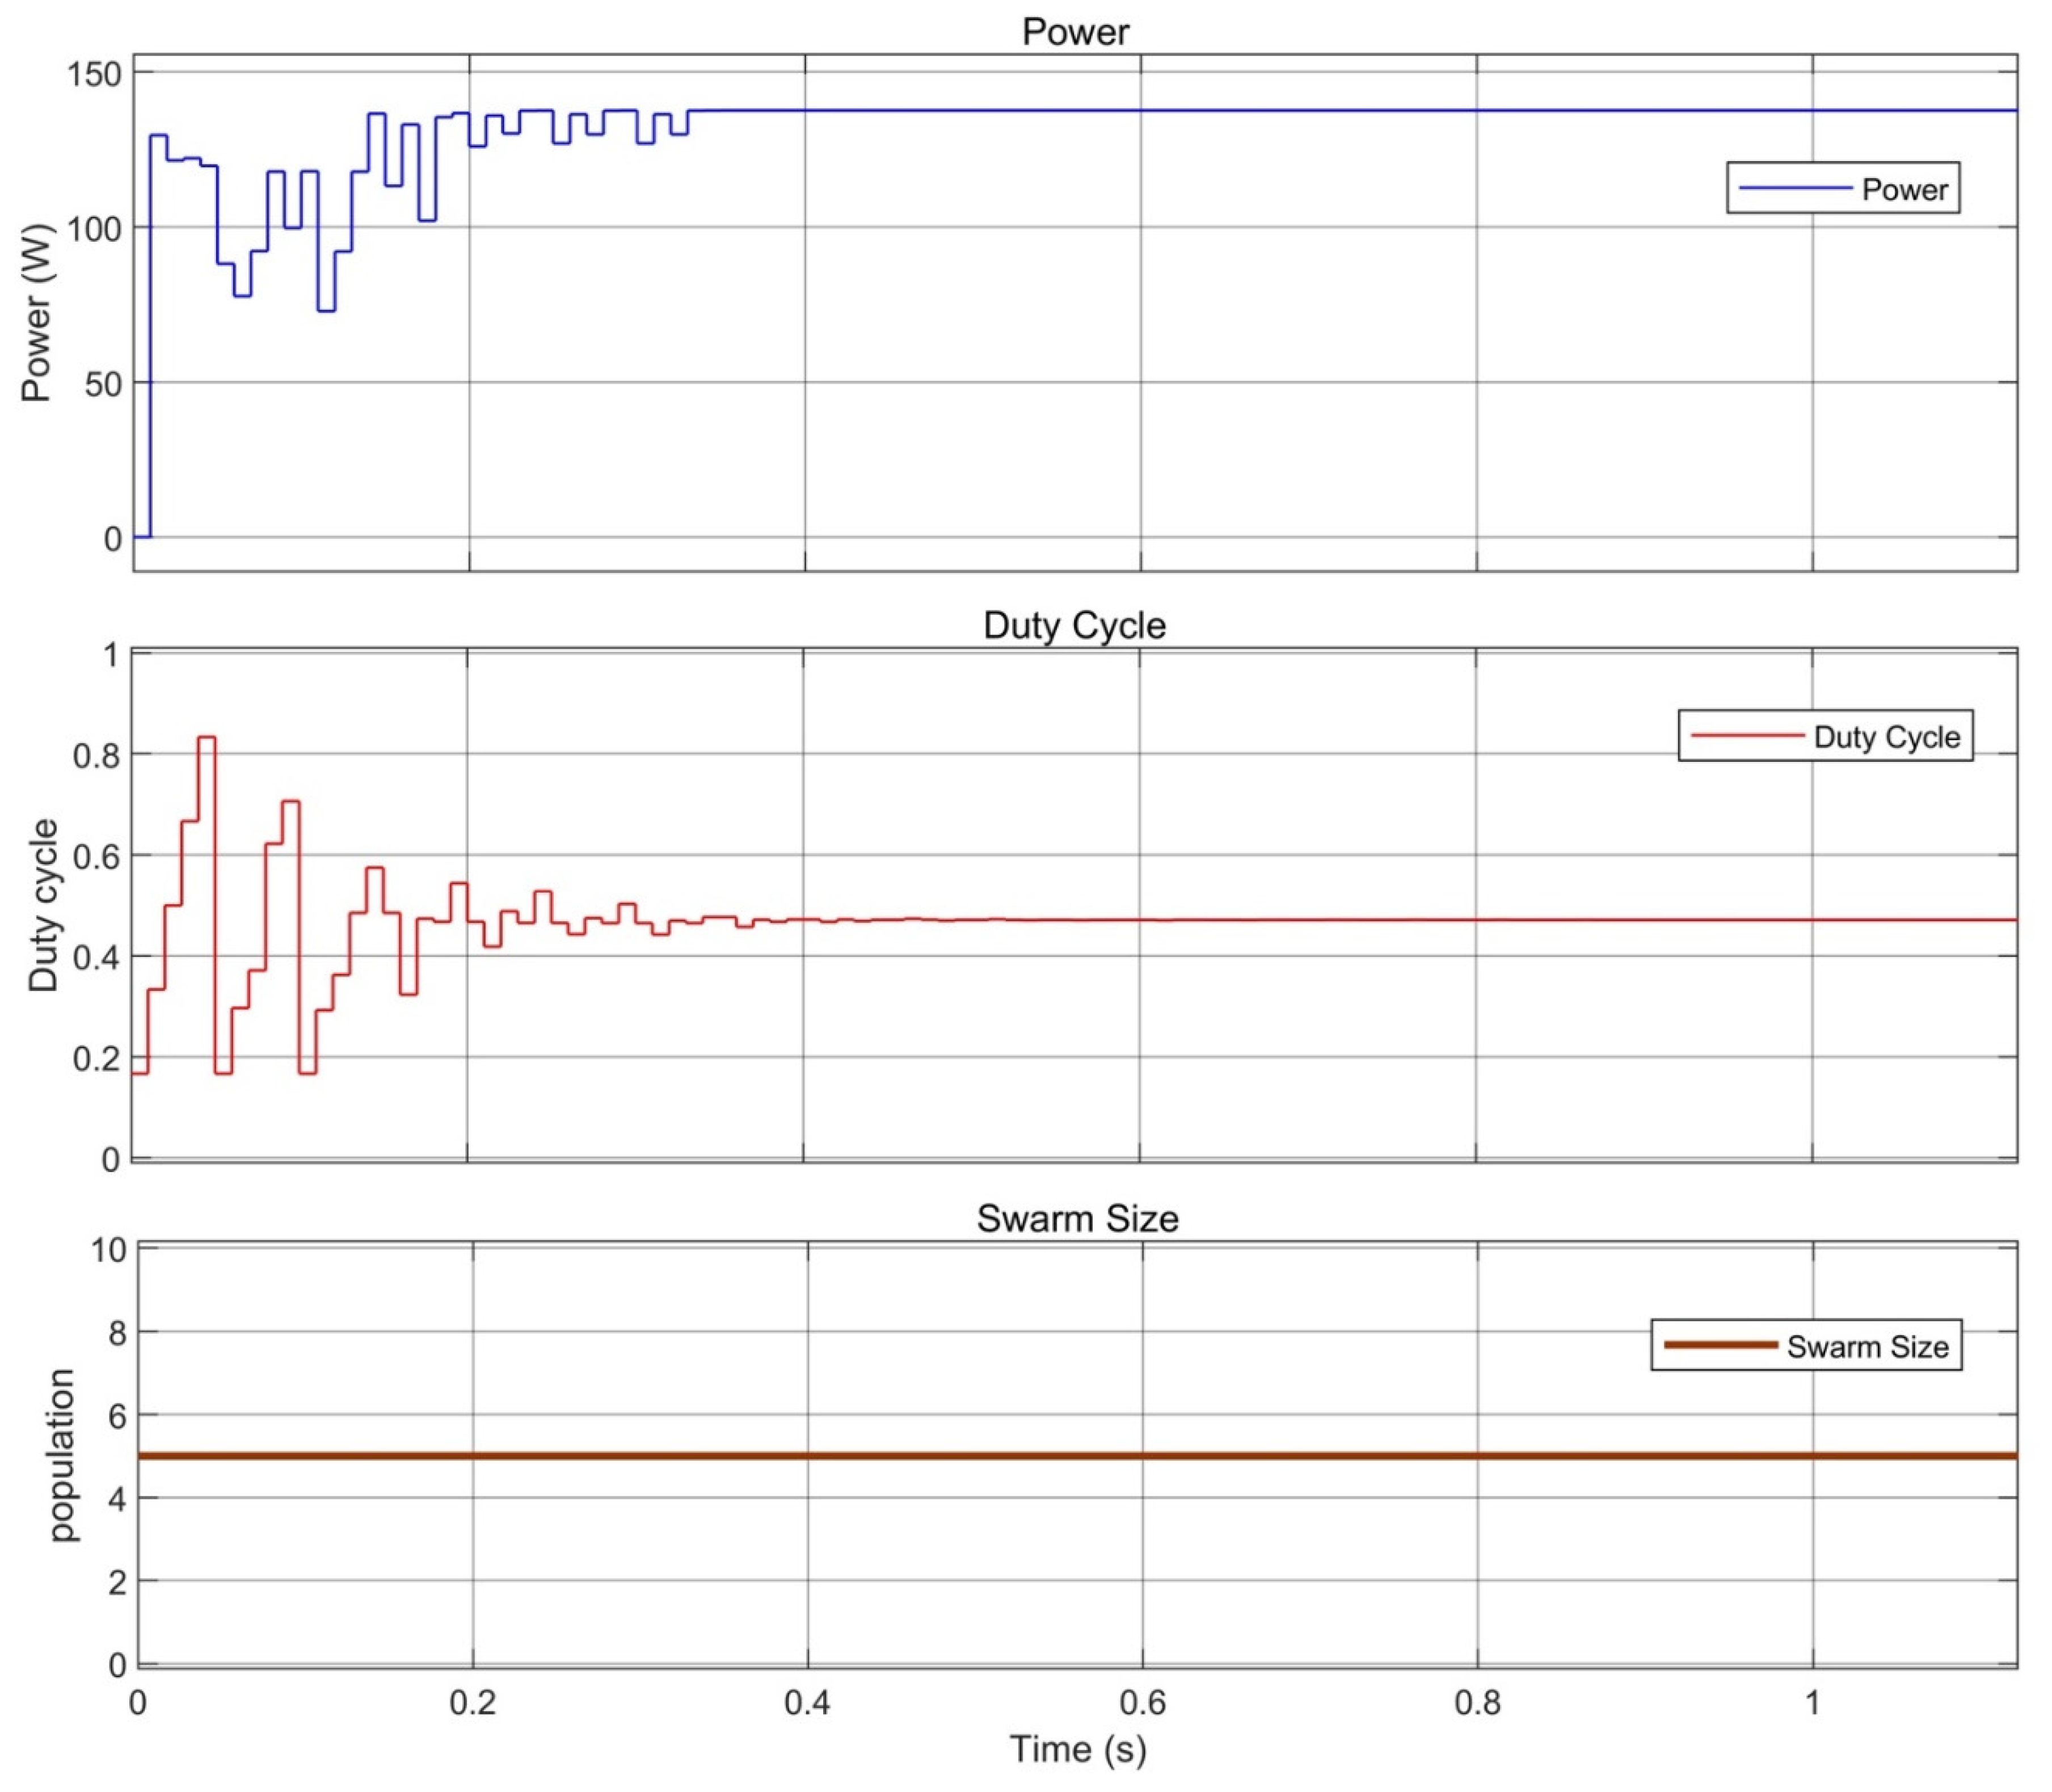
Figure 11.
3D graph shows Power, Duty Cycle, at each iteration for the C-PSO.
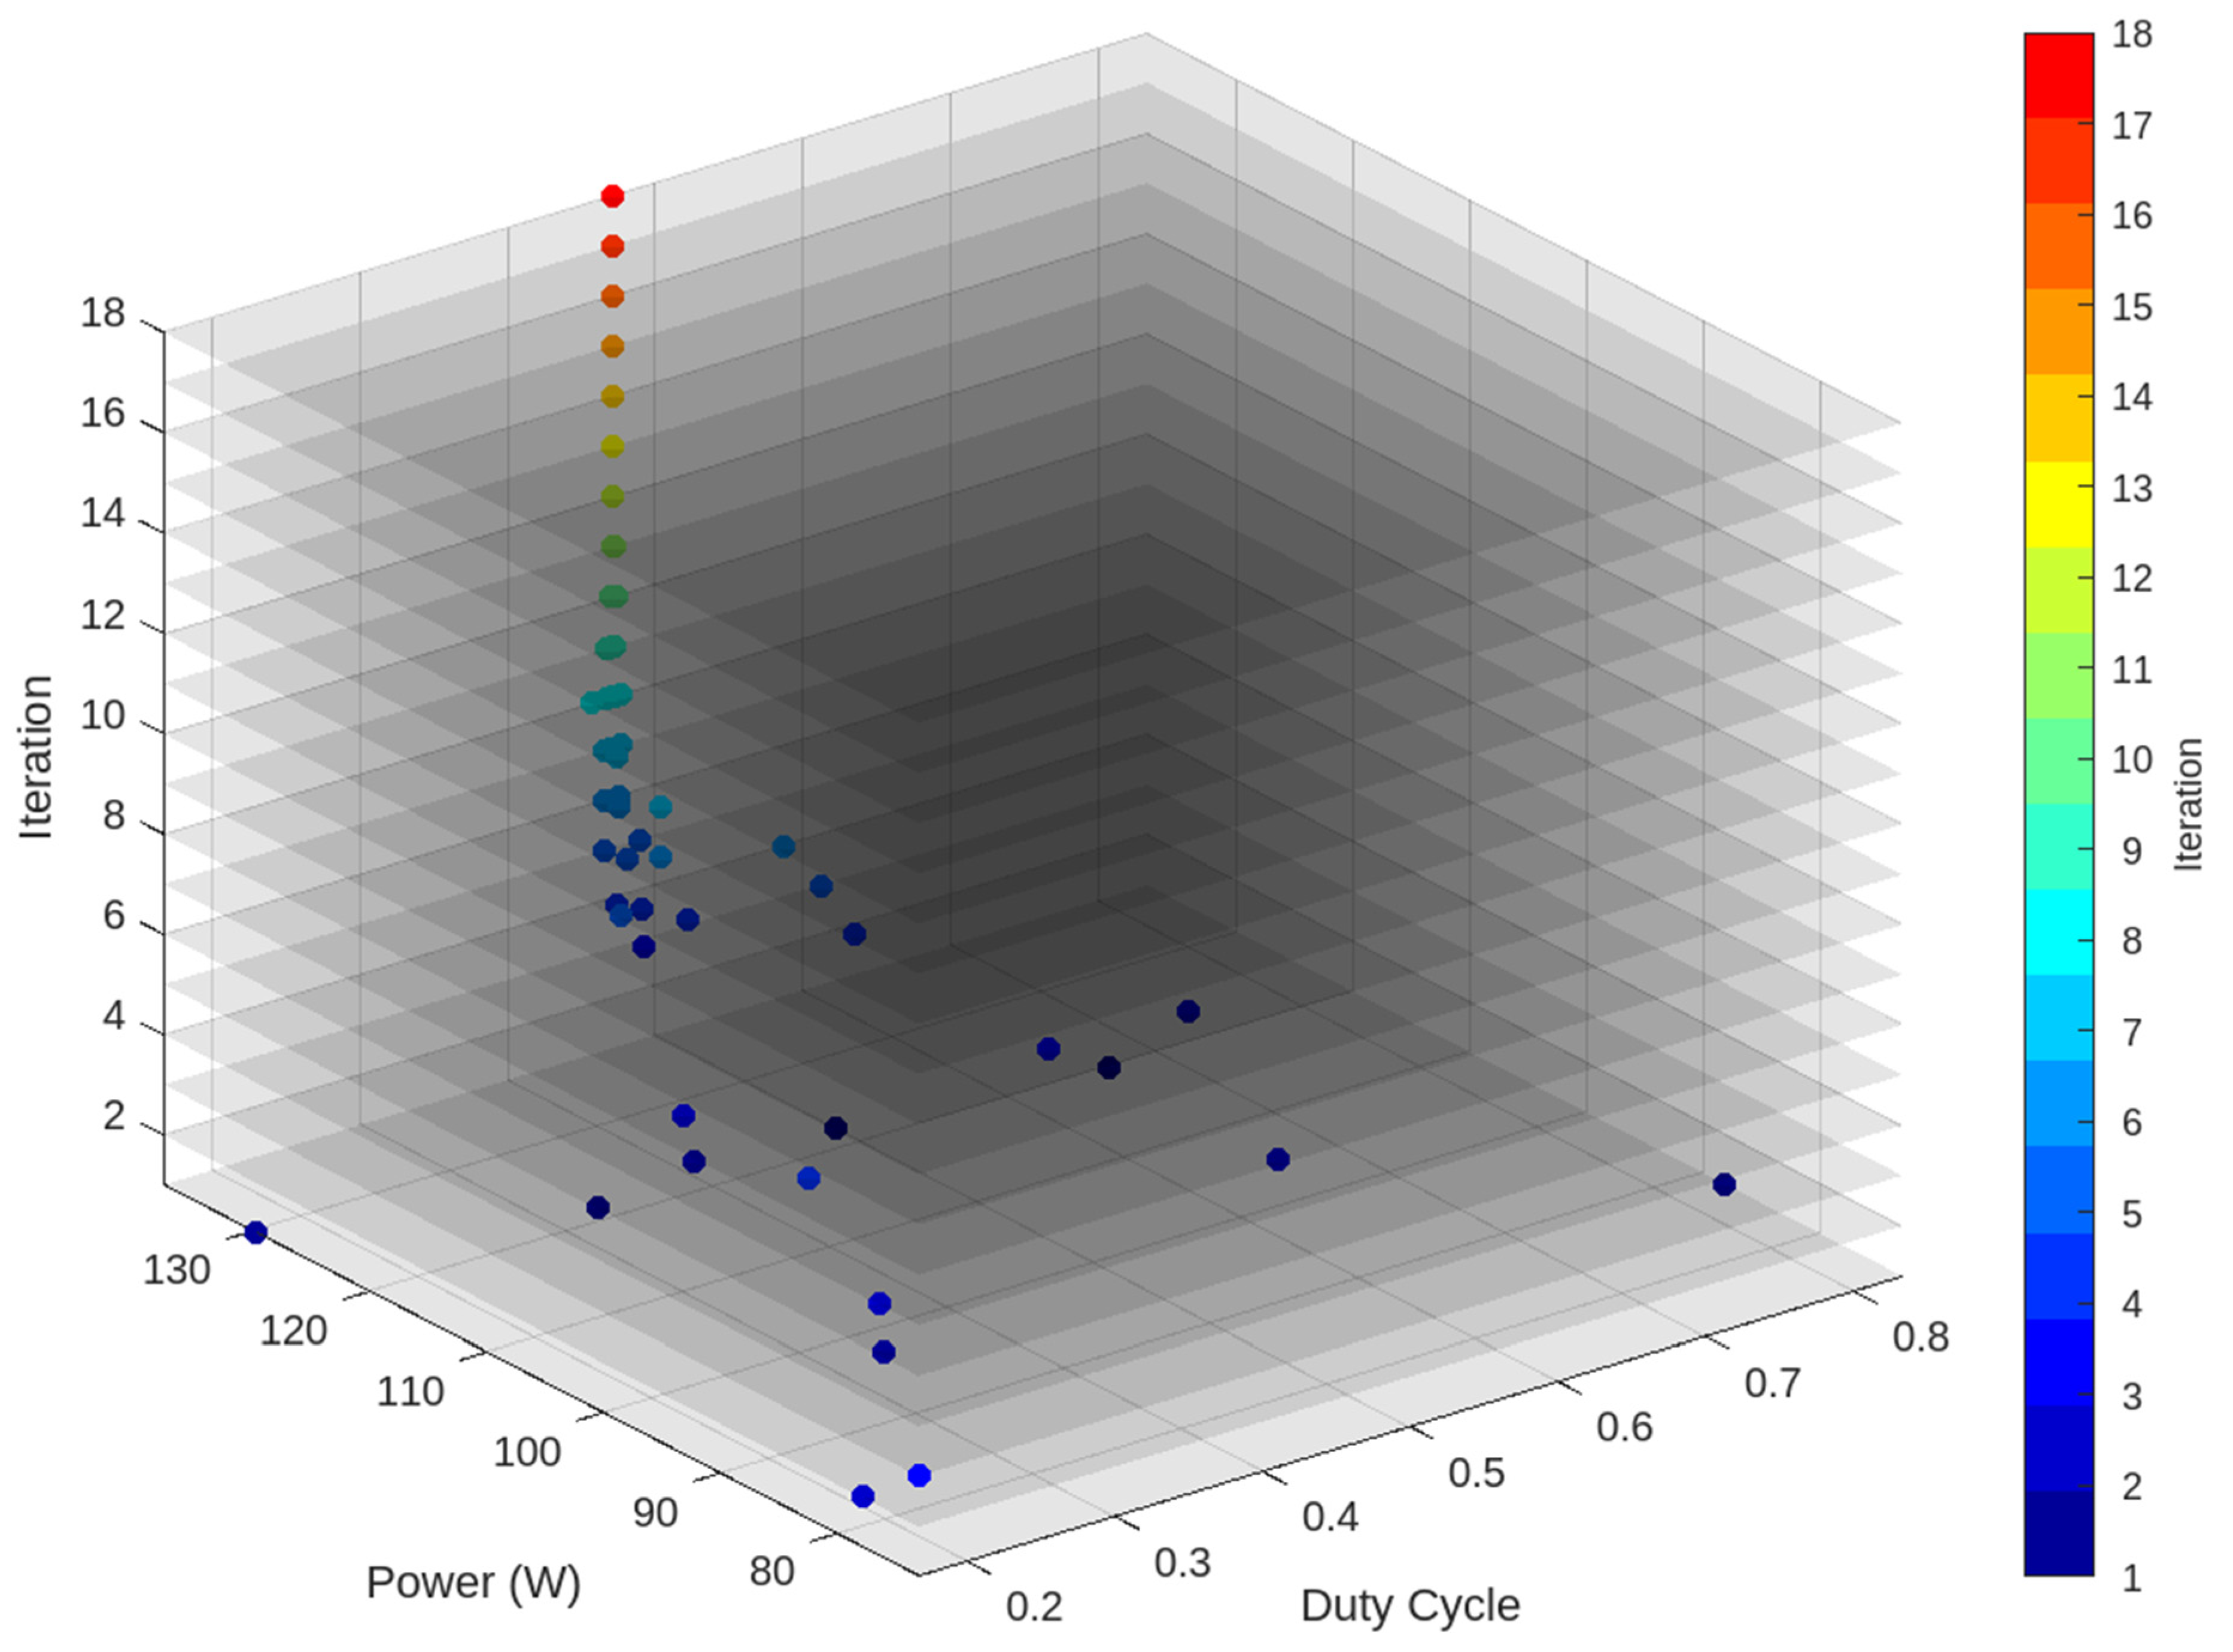
Figure 12.
3D graph shows Power, Duty Cycle, at each iteration for the PSO-SSRM.
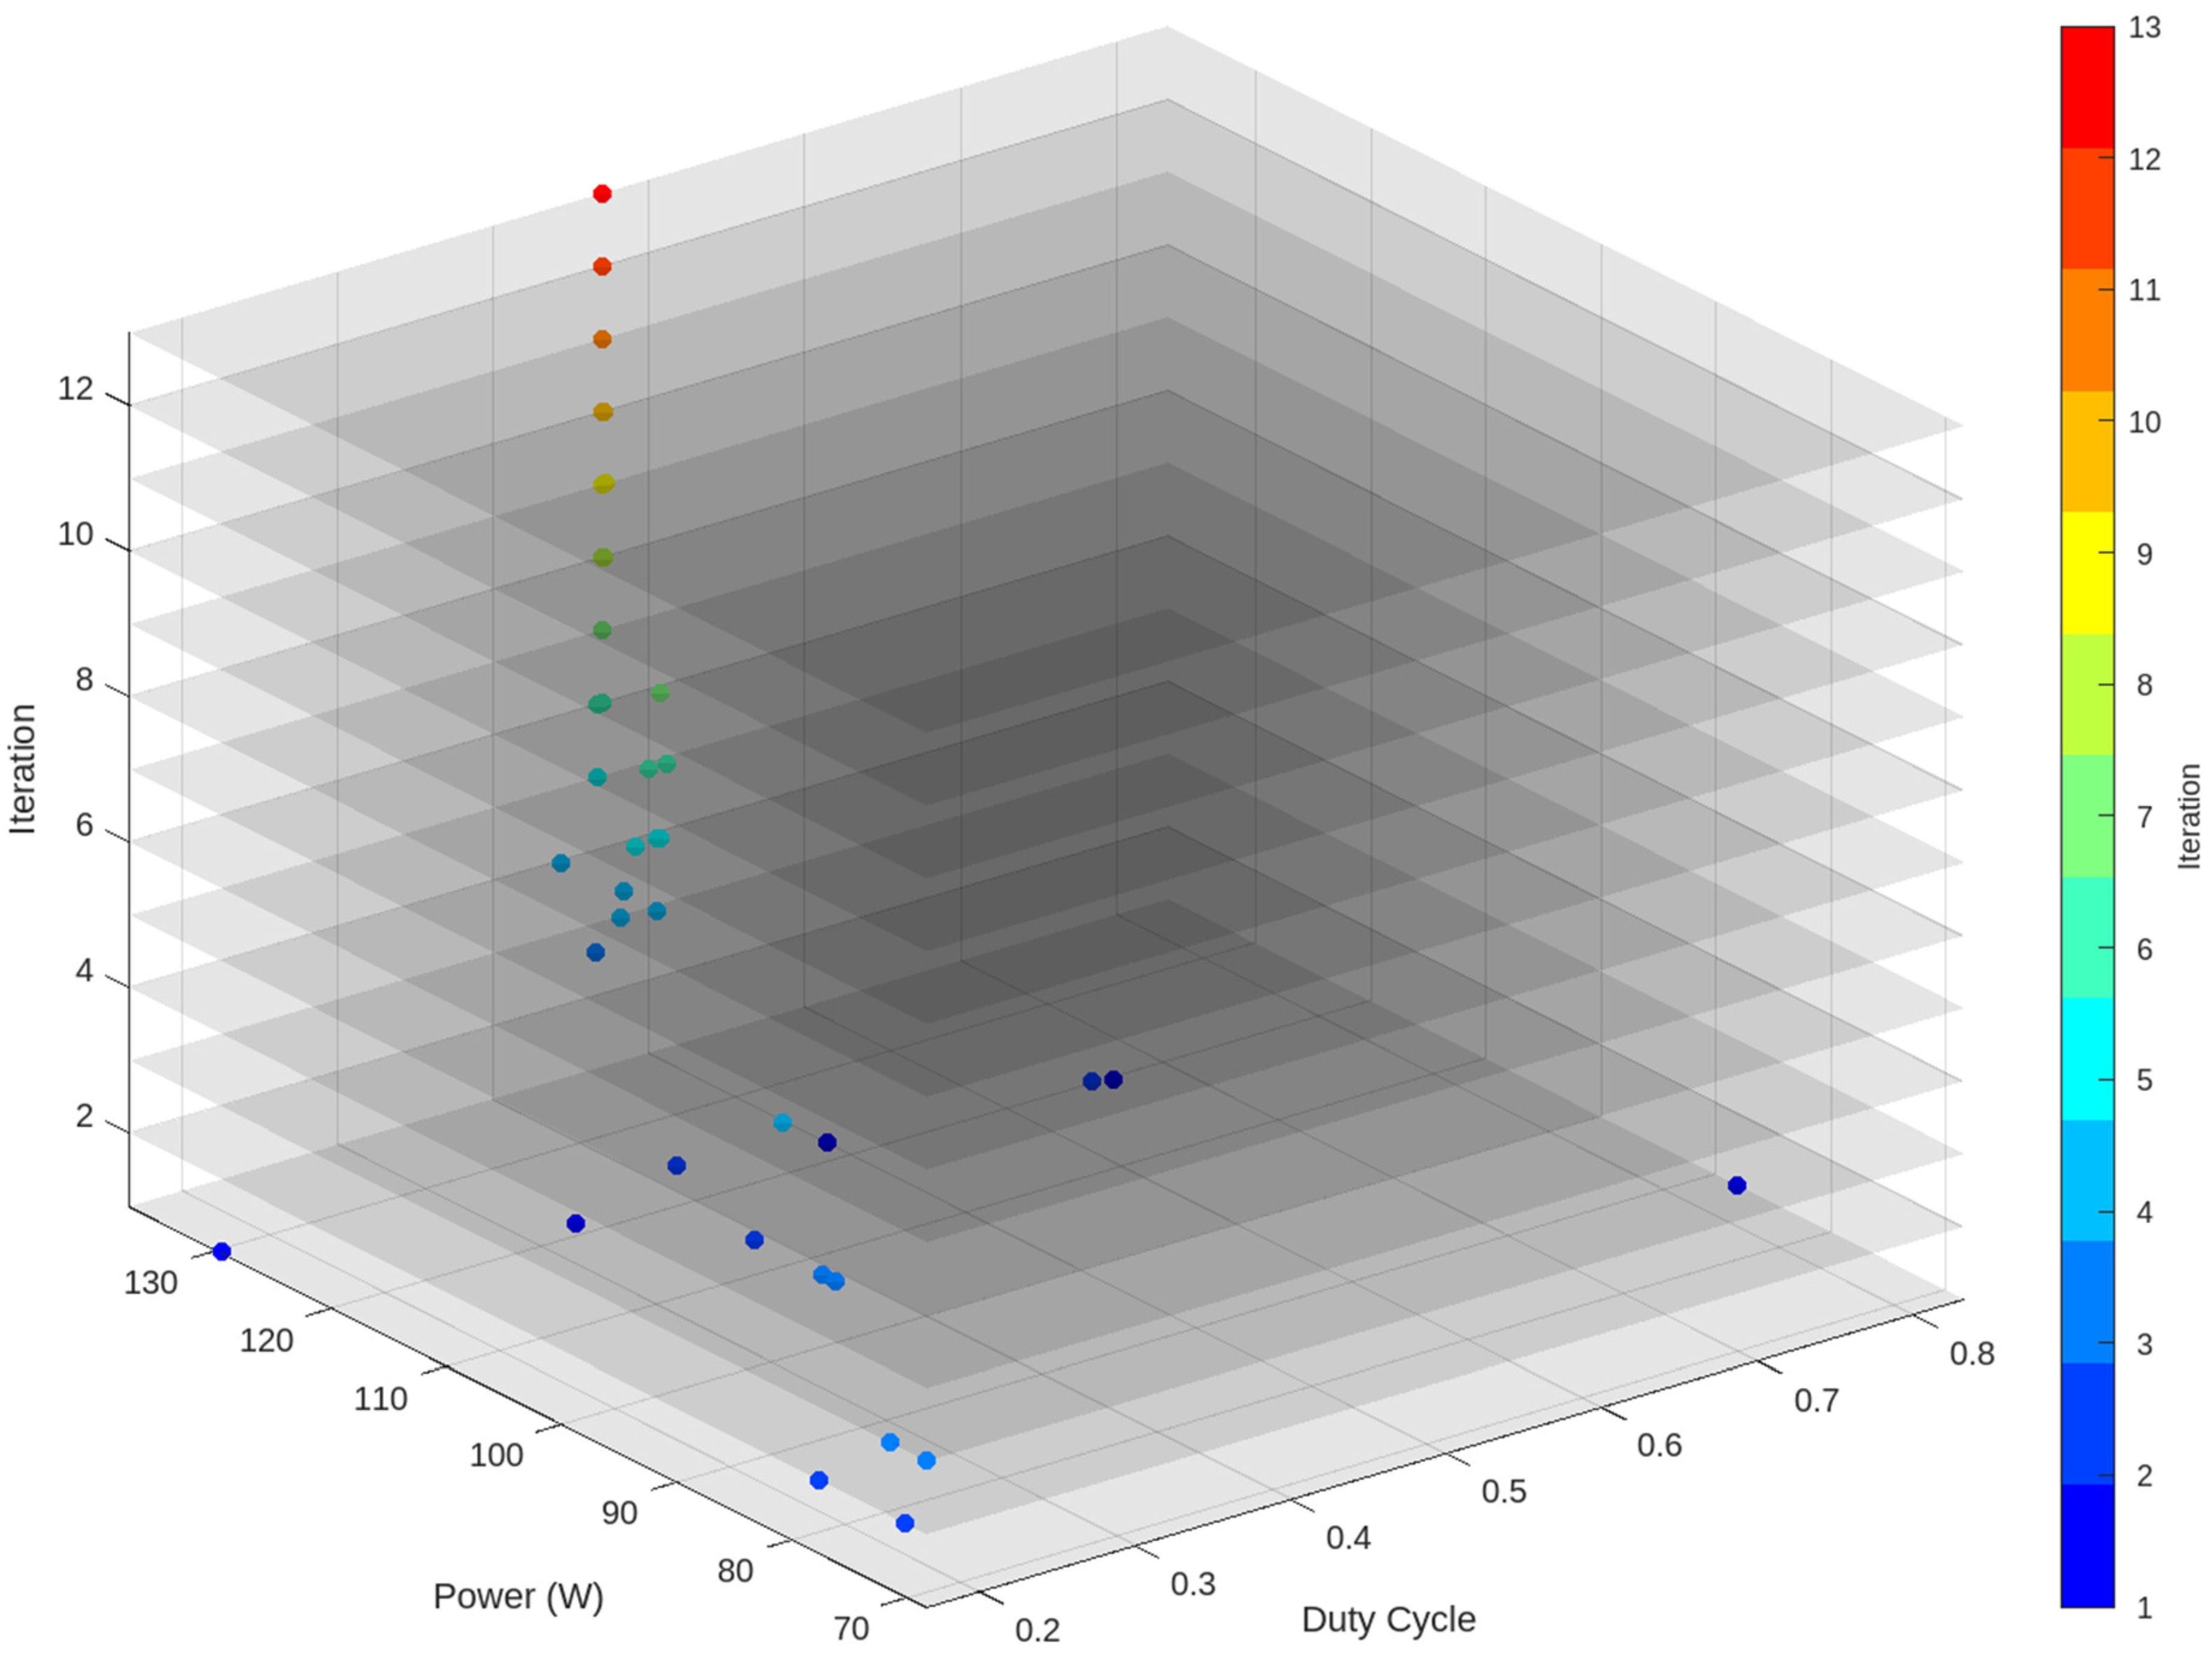

Table 1.
PV module Specifications [28].
Table 1.
PV module Specifications [28].
| Specification | Value |
| Maximum Power per module | 83.28 W |
| Open Circuit voltage | 12.64 V |
| Short Circuit current | 8.62 A |
| Voltage at MPP | 10.32 V |
| Current at MPP | 8.07 A |
Table 2.
Results of the simulation for the CT and FR at every specific Swarm Size (SS).
| SS | C-PSO | SSRM-PSO | ||
| CT | FR | CT | FR | |
| 20 | 3.74 | 00% | 3.58 | 0% |
| 19 | 3.71 | 0% | 3.36 | 0% |
| 18 | 3.46 | 0% | 3.11 | 0% |
| 17 | 3.26 | 0% | 2.81 | 0% |
| 16 | 3.07 | 0% | 2.8 | 0% |
| 15 | 2.77 | 0% | 2.63 | 0% |
| 14 | 2.67 | 0% | 2.37 | 0% |
| 13 | 2.41 | 0% | 2.18 | 0% |
| 12 | 2.29 | 0% | 2.07 | 0% |
| 11 | 2.13 | 0% | 1.82 | 0% |
| 10 | 1.81 | 0% | 1.62 | 0% |
| 9 | 1.62 | 0% | 1.45 | 0% |
| 8 | 1.46 | 0% | 1.26 | 0% |
| 7 | 1.32 | 0% | 1.1 | 0% |
| 6 | 1.03 | 0% | 0.9 | 0% |
| 5 | 0.93 | 43% | 0.67 | 0% |
| 4 | 0.74 | 61% | 0.54 | 50% |
| 3 | 0.6 | 84% | 0.48 | 100% |
Disclaimer/Publisher’s Note: The statements, opinions and data contained in all publications are solely those of the individual author(s) and contributor(s) and not of MDPI and/or the editor(s). MDPI and/or the editor(s) disclaim responsibility for any injury to people or property resulting from any ideas, methods, instructions or products referred to in the content. |
© 2023 by the authors. Licensee MDPI, Basel, Switzerland. This article is an open access article distributed under the terms and conditions of the Creative Commons Attribution (CC BY) license (http://creativecommons.org/licenses/by/4.0/).
Copyright: This open access article is published under a Creative Commons CC BY 4.0 license, which permit the free download, distribution, and reuse, provided that the author and preprint are cited in any reuse.


