
Submitted:
12 July 2024
Posted:
15 July 2024
You are already at the latest version
Abstract
This paper proposes a novel approach called Multi-strategy Improved Chaotic Whale fused with Perturbation Observation method (IWOA-PO) for Maximum Power Point Tracking (MPPT) con-trol, to address the challenge of low efficiency in photovoltaic (PV) power generation under local shadows, according to the features of whale optimization algorithm (WOA) and perturbation observation (P&O) method. In the early stage of control algorithm, IWOA is used for global search to quickly locate the position of the Maximum Power Point (MPP). In the later stage of control algorithm, P&O is used for fine-grained local search to quickly, accurately and low oscillation track the position of the global maximum power point (GMPP). In order to verify the correctness, the tracking performance of IWOA-PO is comprehensively compared with WOA-PO、WOA、PSO under four conditions including uniform illumination, static partial shade, dynamic irradiance mutation and sudden changes in temperature and irradiance. In the above four conditions, the IWOA-PO algorithm has faster convergence and less power oscillations compared to the re-maining three algorithms, indicating that the IWOA-PO algorithm is effective. Finally, a physical verification experiment process is built to verify the correctness and effectiveness of the algorithm proposed in this paper.
Keywords:
photovoltaic power generation
; MPPT control
; intelligent algorithm
; improved whale optimization algorithm
; mixed control strategy
1. Introduction
For many years, fossil-fueled power stations have been the most common source of electricity in most countries. However, burning fossil fuels will release a large amount of greenhouse gases such as carbon dioxide, causing pollution and natural disasters. Because of the above problems, many scholars have proposed using renewable energy to replace fossil fuels for protecting environment, such as wind energy and photovoltaic energy. In the process of photovoltaic power generation, improving the efficiency of power generation and reducing costs are the key focuses of the photovoltaic industry. The core issue in enhancing power generation efficiency is to accurately and quickly achieve MPPT of PV systems [1,2,3,4].
When the solar panels are uniformly irradiated, the power-voltage characteristic curve (P-V) of the system displays a single peak and a single MPP. However, due to the coverage of clouds, trees and buildings, photovoltaic panels often have local shadows. In this case, the P-V of PV system displays multiple peaks characteristics [5,6,7,8], including multiple localized pole points (LMPPs) and a GMPP. In addition, MPPT techniques, such Constant Voltage (CV), Perturbation Observation (P&O) [9], Incremental Conductance (INC) [10], etc., often fall into localized poles and cannot effectively monitor the MPP. In order to realize MPP tracking in multimodal cases [11,12], using intelligent optimization algorithms to optimize the maximum power point has become a current research hotspot [13]. The problems that need to be considered for maximum power point tracking include tracking speed, tracking accuracy, and oscillation size, etc. External variations in irradiance significantly affect the P-V and I-V of solar PV system [14].
Reference [15] proposes a territorial particle swarm algorithm to improve tracking speed by intelligently removing regions where maximum power points cannot occur. Reference [16] utilizes the Cat Swarm Optimization (CSO) algorithm, combined with a chaotic search strategy, to address the issue of "premature convergence" in the CSO algorithm by using the traversal and randomness of chaotic sequences. Reference [17] combines Grey Wolf Optimization (GWO) with P&O to address the issues of slow optimization speed and low optimization accuracy of GWO algorithm, and the proposed algorithm has a better tracking performance under any external environmental changes. Reference [18] proposes a hybrid butterfly particle swarm and P&O algorithm, which shortens search time by introducing a sensitivity factor and an adaptive weighting factor, and can accurately track the position of GMPP, reducing the power oscillations in the search space. Reference [19] constructs a hybrid MPPT system that integrates ANFIS with HC technique, which has good stability and short tracking stabilization time under different climate conditions.
WOA is an innovative heuristic optimization algorithm proposed by Professor Mirjalili’s team in 2016. The algorithm has few parameters, good convergence, simple operation and is easy to implement [20,21,22,23]. Good results have been obtained in many fields. Reference [24] introduces cosine nonlinear convergence factor and inertia weight factor to improve the whale algorithm, aiming to enhance the optimization accuracy and search speed of the system. Reference [25] employs the whale optimization algorithm for tuning the Proportional Integral controller, aiming to enhance the performance of a 400 kW grid-connected PV system. However, the WOA algorithm also suffers from slow convergence speed, poor convergence accuracy, and large fluctuations in power oscillations. Currently, many scholars are using hybrid algorithms to deal with the aforementioned problems. The paper proposes a novel MPPT control method. Firstly, based on the standard WOA, a Multi-strategy Improved Chaotic Whale Algorithm (IWOA) is proposed. By introducing the Tent chaotic mapping [26,27], the nonlinear convergence factor, and the Levy flight multiple strategies, the defects of slow optimization speed and easy falling into local optima in the standard WOA are further solved. Then, the combined method of IWOA and P&O is applied to MPPT control, and referred to as IWOA-PO. Finally, a simulation model is established using Matlab/Simulink. The results show that compared with PSO, WOA and WOA-PO, IWOA-PO algorithm has positive advantages and has achieved a relatively ideal effect. Furthermore, GMPP can quickly and accurately search for local shadow occlusion and illumination mutation, and shows better tracking performance.
The remaining work contributed to this paper is: Section 2 analyzes of photovoltaic power generation principle and output characteristics. Section 3 proposes a multi-strategy improved chaotic whale-perturbation observation method for MPPT control. Section 4 analyzes the simulation results of MPPT techniques based on PSO algorithm, WOA algorithm, WOA-PO algorithm and IWOA-PO algorithm. Section 5 is the experimental results. Section 6 concludes the paper.
2. Analysis of photovoltaic power generation principle and output characteristics
PV power system is an innovative power generation technology. The PV effect generated by semiconductor materials in solar cells directly converts solar radiation into electrical energy. The PV power generation system comprises a PV array, converter, MPPT controller, inverter, and power grid, and its structure is shown in Figure 1.
2.1. Mathematical Modelling of Photovoltaic Systems
The physical model of a PV cell, also known as the single diode model is shown in Figure 2. In the PV cell model, the magnitude of the series resistance (Rs) is closely related to the material properties of the solar cell itself and other relevant factors. The resistance value of series resistance is often close to zero, whereas the parallel resistance (Rsh) is caused by factors such as aging of the material of the PV panel, and the resistance value of Rsh is considered to be infinite [28].
According to the equivalent circuit diagram of PV cell, the output current of the load can be calculated as follows:
The characteristic equation of PV I-U curve is given in Equation (2)
Typically, larger Rsh and smaller Rs values are often ignored in engineering mathematical modelling. That is the mathematical modelling of PV cells, expressed as follows:
where Ish is the photogenerated current of the cell, Rs is the series resistance of the PV cell, Rsh is the parallel resistance of the PV cell, U is the output voltage, I is the output current, I0 is the reverse saturation current, n is the diode constant factor, which takes the value of 1. k is Boltz's constant, . T is the temperature of the solar cell, and q is the electronic charge constant, .
In Equation (3), the value of n and I0 parameter is related to the external changing conditions. In order to facilitate the output characteristic curve of PV cells, it is generally simplified as shown in Equations (4)-(6)
Where Im is the output current at the MPP, Isc is the short-circuit current of a solar cell under the condition of reference sunlight irradiance and temperature, Um is the output voltage at the MPP, Uoc is the open-circuit voltage of a solar cell under the condition of reference sunlight irradiance and temperature.
In practice, the environment cannot be recognized as a constant value due to the changes in the external environment that have an impact on the PV. To solve this problem, corrections will be made to the PV cell [29], and the values set for each parameter are shown in Table 1.
To confirm the impact of external environments on PV cells' output characteristics, the specific conditions are as follows: at a fixed temperature of 25 ℃, the irradiance is set to 600W/m2, 800W/m2, 1000W/m2, and 1200W/m2, respectively. The I-V and P-V characteristic curves of PV output obtained through simulation under the same temperature and different irradiance are shown in Figure 3.
From Figure 3 (b), when the temperature is 25°C and the irradiance is 800W/m2, the output voltage at MPP is 28.74V, and the output power is 164.62W. When the irradiance is 1000W/m2 , the output voltage at MPP is 29.62V, and the output power is 213.83 W. The results show that when the temperature remains constant and the irradiance increases, the Uoc and Isc of the PV cell increase and the power difference at MPP is larger, so the irradiance has a greater effect on the output power of the PV cell. In summary, the output characteristics of PV cells are more affected by irradiance and less affected by temperature, so it is more meaningful to analyze and study PV cells under different irradiance.
2.2. Multi-Peak Characterisation of 6×1 PV Array under Partial Shading
The photovoltaic module is connected with a bypass diode because the bypass diode can reduce the output power loss under shadow conditions and also reduce the "hot spot effect". This section analyzes and studies the 6×1 photovoltaic array (PV array) under local shadow occlusion (PSC) and standard uniform irradiance conditions, respectively [30], and the PV array is shown in Figure 4.
Under the condition of uniform irradiance, two cases are studied. The irradiance for condition 1 is set to 1000 W/m2, and the irradiance of condition 2 is 800 W/m2. P-V and I-V are observed for both cases, as shown in Figure 5. It can be inferred that when the system operates under condition 1, the theoretical value of the system is 1273 W. Under condition 2, the system is 1027 W.
Under the local shadow shading condition, two different cases are considered in this paper. Condition 3: the irradiance of the PV module is 1000 W/m2, 1000 W/m2, 800 W/m2, 800 W/m2, 600 W/ m2, and 400 W/m2, respectively. Condition 4: the irradiance is 1000 W/m2, 800 W/m2, 600 W/m2, 400 W/m2, 200 W/m2, 200 W/m2. The P-V and I-V are observed under two different conditions, as shown in Figure 5. When local shadows are blocked, the theoretical value of the system for condition 3 and condition 4 are 719.1 W and 412.7 W, respectively.
From Figure 5 that the P-V has only a single peak under uniform irradiance and multi-peak under the cover of local shadows. In this case, the conventional MPPT is prone to getting stuck in local optima and cannot accurately track MPP. Therefore, this paper proposes a new MPPT control method based on IWOA-PO method.
3. Multi-Strategy Improved Chaotic Whale-Perturbation and Observation Method for MPPT Control Methods
3.1. P&O
P&O has a good tracking effect under uniform irradiance conditions. It has the characteristics of relatively few parameters and simple theoretical framework, and is widely used for mixing with other swarm intelligent optimization algorithms, which is also the research direction of many scholars in recent years [31,32]. P&O first calculates the output power by measuring the output voltage (VPV) and output current (IPV) of the PV array, and then observes the power changes before and after disturbance by interfering with the output voltage. After continuous disturbance, the VPV of the PV array gradually approaches the MPP until the operation approaches MPP [33]. The flowchart for P&O is shown in Figure 6.
3.2. WOA
The inspiration for WOA comes from the predation behavior of humpback whales, a huge mammal that is over 12 meters long and weighs over 20 tons, known for its ingenious predation strategy [34]. In recent years, WOA has become a hot research topic for researchers. It has the advantages of few parameters, simple structure, and high efficiency. The algorithm plays a great role in solving practical application problems. The schematic diagram of humpback whale predation behavior is shown in Figure 7.
(1) Random prey searches
In this stage, a whale is randomly selected as a search target in the whale population and its location is updated. When |A| > 1, search individual for global search. When |A| < 1, the individual is searched for local search, the mathematical model is shown in Equation (7) and Equation (8).
Where A and C are coefficient vectors, the A affects the search ability range of whale individuals, t is the current iteration, Xr(t) is the whale position vector randomly selected in the current population, X(t) is the current whale position vector, D is the distance between the current whale individual position and the optimal whale individual position, X(t+1) is the updated position vector.
(2) Surrounding the prey stage
In WOA, individuals of the whale population interact and move to the position of the whale individual closest to the prey, but the position of the target prey within the search range is uncertain. Since each whale is a search individual, the position of the optimal search individual is the global optimal solution, so other search individuals in the search space is close to the current optimal position. The mathematical model of the stage of whale surrounding prey is shown in Equations (9) and (10).
where Xb(t) is the position vector of the optimal solution in the current search space.
where is a control parameter that linearly decreases from 2 to 0 during the iteration. r1 and r2 are random vectors of [0,1], respectively, and Tmax is the maximum number of iterations.
(3) Bubble-net feeding phase
The strategy first calculates the distance between the location of the current individual whale in the search space and the known optimal whale position, reflecting the position relationship both of them. Secondly, the whale approaches the target prey along the spiral path. In the process, the location of the individual whale is constantly updated, and each update will bring the individual whale approach to the optimal solution. The mathematical model under this method is shown in Equations (14) and (15).
Where is a vector of distances between the optimal whale individual and the whale individual itself in the current region, b is a coefficient taking the value of 1, l is an arbitrary number between [-1,1].
The choice of three stages in the whale algorithm depends on the parameter |A| and the probability factor p. When p≥0. 5, it is in the bubble-net feeding phase. When p<0. 5, it is in the two stages of random prey searches and surrounding the prey stage. The mathematical equation is outlined:
3.3. IWOA algorithm
Because WOA is prone to local optima, this paper makes the following improvements to WOA and proposes a Multi-strategy Improved Chaotic Whale Algorithm (IWOA).
(1) Tent chaotic mapping
Tent mapping is ergodic and stochastic. Tent mapping makes the intelligent optimization algorithm to have higher convergence speed and uniform distribution of population sequence. Many scholars use Logistic mapping in chaotic sequence, but its sequence distribution is not uniform [35,36]. Therefore, the paper employs the Tent mapping. The computational formula of Tent chaotic map is:
Where is Xm (k)-the value of the kth mapping function, and k is the chaos.
(2) Nonlinear convergence factor
Introducing nonlinear convergence factor can improve the optimization speed. Optimizing the balance between global and local search during the iteration process of WOA. Therefore, to further accelerate the convergence speed, the paper constructs the nonlinear convergence factor as follows:
Where t is the current iteration, and Tmax is the maximum iteration.
(3) Introducing Levy Flight
In the optimization search process, the substantial perturbation of the individual whale's position enables the algorithm to avoid falling into premature convergence, and the method can effectively leap beyond the local optimal solution and improve the global search capability. Levy flight is fused with the WOA algorithm to implement the MPPT control strategy for PV power generation in the case of local shadow occlusion. Utilizing Levy flight, the new position update formula is given as follows:
where X’(t) is the update position by Levy flight, is the dot product operation,is the distance update coefficient, and Levy(s) is the random search path.
3.4. MPPT Control Method Based on IWOA-PO
This paper proposes the IWOA-PO hybrid algorithm. The algorithm is derived from the standard WOA algorithm by incorporating strategies such as Tent chaotic mapping, introduction of nonlinear convergence factor α1, and Levy flights, and then combining it with P&O to further improve the algorithm's optimization speed and avoid power oscillations to reduce the energy loss, the principle of this algorithm is to perform global search to the vicinity of the GMPP by using the IWOA firstly in the early stage of the algorithmic control and then use the P&O to perform the fine local search in the vicinity of the GMPP at the end of the algorithmic control, the overall flowchart of IWOA-PO algorithm is shown in Figure 8. The specific steps for the implementation of the IWOA-PO algorithm are as follows:
Step1: Initialize the population and set the parameters in the algorithm. N individuals with a relatively balanced distribution of whale positions are initialized in the search space using Tent chaotic mapping.
Step2: Collect VPV and IPV of the PV array, and calculate the corresponding PPV for each whale.
Step3: Update the whale position using IWOA, collect the voltage, current, and power at the new position, and compare it with the previous power. If the current power is greater than the previous power, keep the current position as the iterative position, and vice versa, keep the previous position as the iterative position.
Step4: Update the power value of each whale and update the current optimal power value with the corresponding position. Determine whether the whale is the predation global optimal position. If so, skip to Step5, otherwise, skip to step Step6.
Step5: Use P&O for local search.
Step6: Check whether the environment status changes. If so, skip to Step1, if not, skip to Step5.
4. Simulation Results and Analysis
In this paper, MPPT control system mainly includes PV array, Boost circuit, MPPT controller and load, etc. The simulation parameters in the control circuit are set as follows: C1=20 μF, C2=200 μF, L=3×10⁻³ mH. The corresponding MPPT structure diagram of photovoltaic system based on IWOA-PO is shown in Figure 9.
The IWOA-PO method is used to analyze MPPT under different irradiance conditions, and the parameters setting for 3 operating conditions are shown in Table 2.
4.1. Simulation Verification and Result Analysis of MPPT Control under Uniform Irradiance
In this paper, six photovoltaic modules are selected, the simulation time is 0.6 s, the temperature is 25 ℃, and the irradiance of photovoltaic modules is 800 W/m2. The theoretical values of the system GMPP is 1027 W. The power tracking curves of four algorithms under the condition 2 are obtained through simulation, as shown in Figure 10.
As shown in Figure 10, all four algorithms can track GMPP with a value of 1027 W. The tracking time of WOA algorithm, PSO algorithm and WOA-PO algorithm is 0.12 s, which consumes more time and has larger fluctuation and oscillation in the early stage. The tracking time of IWOA-PO algorithm is 0.09 s, which is the shortest. Compared with the previous three algorithms, it significantly shortens the time, improves the convergence speed, and minimizes oscillation fluctuation. Compared with PSO, WOA and WOA-PO algorithms, the tracking accuracy of the IWOA-PO is further improved.
4.2. Simulation Verification and Result Analysis of MPPT Control under Static Local Shading
The standard WOA algorithm searches for the global optimal solution through many iterations over a large range, resulting in slower convergence speed and relatively serious power oscillation. However, the paper starts IWOA to globally optimize the vicinity of GMPP when tracking the MPP, and then combines with P&O for fine tracking to the GMPP to locate it accurately and quickly.
When the photovoltaic array has static local shading, the irradiance of each component is not uniform (assuming that the temperature of all photovoltaic modules is the same and remains constant during the simulation process), and due to the influence of the parallel bypass diode, the output P-V curve presents the characteristics of multiple peaks. To further better simulate the static local shadows of the PV system, operating results at 25℃ conditions are divided into two cases.
Condition 3: The irradiance of 1000 W/m2, 1000 W/m2, 800 W/m2, 800 W/m2, 600 W/m2, and 400 W/m2 is applied to PV modules #1, #2, #3, #4, #5, and #6, respectively, and the theoretical values of the system is 719.1 W. The power tracking curves of the four algorithms under condition 3 are obtained through simulation, as shown in Figure 11.
As shown in Figure 11, both IWOA-PO algorithm and WOA-PO algorithm can accurately track the theoretical GMPP of the system, with a tracking power of 719.1 W. The IWOA-PO algorithm has the minimum tracking time of 0.10s, and the WOA-PO algorithm is 0.11 s, slightly slower than the IWOA-PO algorithm. While the GMPP tracked by the PSO algorithm is slightly lower at 717.0W, with a deviation value of 2.1W. Both PSO algorithm and WOA algorithm take an approximate time of 0.12s. Compared with the IWOA-PO algorithm, the other three algorithms have longer tracking time, slower convergence, and larger power fluctuations.
4.3. Simulation Verification and Result Analysis of MPPT Control under Dynamic Shading
The irradiance received by PV array usually changes in practical applications. To further verify the MPPT control performance of the IWOA-PO algorithm under the sudden change of irradiance, four algorithms are compared and analyzed under dynamic working conditions. The irradiance variation conditions experienced by the PV array is shown in Figure 12. The temperature is 25°C. At 0.2s, the irradiance of six PV array cells changes from 650 W/m2 to 1100 W/m2. At 0.4s, the irradiance changes from 1100 W/m2 to 450 W/m2, and the P-V and I-V under this condition are shown in Figure 14. When the irradiance is 450 W/m2, the output voltage is 175.0 V, the output current is 3.317 A and the output power is 580.6 W of the PV array MPP. When the irradiance is 650 W/m2, the output voltage is 175.1 V, the output current is 4.786 A and the output power is 837.7 W of the PV array MPP. When the irradiance is 1100 W/m2, the output voltage is 172.6 V, the output current is 8.067 A and the output power is 1393.0 W of the PV array MPP. The tracking curves of each calculation rate under sudden changes in irradiance are shown in Figure 13.
As shown in Figure 14 that the IWOA-PO algorithm accurately tracks the theoretical MPP with the minimum deviation under sudden change in irradiance. In the first stage: all the four algorithms can accurately track the MPP value of 837.7 W. The longest tracking time of PSO algorithm and WOA algorithm is 0.12 s, and the tracking time of WOA-PO algorithm is 0.11 s. The power oscillations of the three algorithms are significant. However, the tracking times of IWOA-PO is smaller than the other three algorithms, with the shortest tracking time of 0.07s and less power oscillation.
In the second stage: IWOA-PO algorithm and WOA algorithm can track near MPP with a value of 1392.6 W. The deviation of 0.4 W is closest to MPP, but the tracking time of IWOA-PO algorithm is 0.1 s and WOA algorithm is 0.12 s. The tracking power of PSO algorithm and WOA-PO algorithm are 1392.5 W. The PSO algorithm takes 0.12 s and the WOA-PO algorithm takes 0.11 s. The IWOA-PO algorithm is the fastest, PSO algorithm and WOA algorithm are the slowest in terms of tracking speed. In terms of power oscillation, the IWOA-PO algorithm is the smallest and superior to the other three algorithms.
In the third stage: In this stage, the WOA-PO algorithm takes 0.11 s and has a tracking power value of 578.7 W, which is the largest deviation value of 1.9 W among the four algorithms. The PSO algorithm and the WOA algorithm take 0.12 s, with the tracking power values of 579.8 W and 580.4 W, respectively. The IWOA-PO algorithm can accurately track the power value of 580.6W with minimal power oscillation fluctuations in just 0.09 s. In summary, the IWOA-PO algorithm demonstrates superior tracking performance under dynamic local shading conditions. Compared with the other three algorithm, IWOA-PO algorithm has better tracking speed and smaller power oscillation fluctuation.
4.4. Simulation Verification and Results of MPPT Control under Sudden Changes in Irradiance and Temperature
To further verify the influence of the external environment on the output power characteristics of the MPP, the temperature T and irradiance S of the PV array are set: when t=0-0.3s, T=35°C, S is condition 4; t=0.3s-0.6s, T and S change abruptly, T= 25°C, S is 1000 W/m2, 400 W/m2, 500 W/m2, 200 W/m2, 400 W/m2, 200 W/m2. The I-V and P-V output characteristic curves under the resulting conditions are shown in Figure 15.
As shown in Figure 16. The MPP of the two stages is 379.1 W and 364.6 W respectively. Figure 16 show the power tracking curves of each algorithm under sudden changes in both temperature and irradiance. Both the IWOA-PO algorithm and the WOA-PO algorithm can accurately track GMPP, but the IWOA-PO algorithm has the fastest tracking time, with both phases not exceeding 1 s and with less power oscillations. The PSO algorithm and the WOA algorithm have a larger deviation from the theoretical value of the system, a longer tracking time, and a larger amplitude near GMPP.
In summary, the comparison of simulation results shows that the IWOA-PO algorithm has superior tracking performance. The WOA is integrated with the P&O to improve the algorithm, enhance its local searching ability, further improve the searching speed of the algorithm, and enable the system to jump out of local optimum.
4.5. Statistics and Analysis of Results
As shown in Table 3, in terms of convergence speed and convergence accuracy, the results of IWOA-PO algorithm under all conditions show that it is better than the other three algorithms, and the IWOA-PO algorithm can accurately and quickly converge to GMPP.
Under uniform irradiance, all four algorithms can converge to GMPP with a slight deviation in convergence time, and the IWOA-PO algorithm has a faster convergence time than the other three algorithms, only taking 0.09s, and has the smallest power oscillation fluctuation.
In the static local shading, both IWOA-PO algorithm and WOA-PO algorithm can converge to GMPP, but the convergence time of WOA-PO algorithm is longer than that of IWOA-PO algorithm. PSO algorithm and WOA algorithm have longer convergence time than that of IWOA-PO algorithm, and the power oscillation of both algorithms are larger. The deviation between the convergence power of the WOA algorithm and the theoretical value of the system is not more than 1W, while the convergence power of the PSO algorithm is less than 3W.
In the dynamic irradiance changes, in the first stage, all the four algorithms can converge to GMPP, but IWOA-PO algorithm takes the shortest time of 0.07s and has the smallest power oscillation. In the second stage, WOA algorithm and IWOA-PO algorithm are closest to the GMPP value of 1392.6W, where WOA algorithm has a larger power oscillation amplitude. While PSO algorithm and WOA-PO algorithm have a power tracking value of 1392.5W, which deviates from the theoretical value of the system by 0.1W, and it takes slightly longer than IWOA-PO algorithm. The amplitude of power oscillation fluctuates greatly. In the third stage, the IWOA-PO algorithm accurately tracks the GMPP, with the shortest time and the smallest power oscillation amplitude.
In the case of sudden changes in temperature and irradiance, both WOA-PO algorithm and IWOA-PO algorithm can accurately track GMPP, but the IWOA-PO has the smallest power oscillation amplitude. The IWOA-PO algorithm has the fastest convergence time and better convergence accuracy than the other three algorithms, demonstrating obvious performance advantages. The results show that the IWOA-PO algorithm effectively improves the convergence speed and accuracy of the WOA algorithm. Compared to PSO algorithm, WOA algorithm and WOA-PO algorithm, IWOA-PO algorithm is more suitable for MPPT control in PV systems.
5. Experimental Results
In order to further verify the validity and reliability of the algorithm as well as its realisability on the basis of simulation, this study embedded the IWOA-PO based control algorithm on the designed MPPT controller hardware, built an actual PV experimental platform based on the IWOA-PO control algorithm and carried out practical experiments. The actual MPPT control experiment platform diagram is shown in Figure 17.
In order to match the previous simulation, the irradiance settings in the experiment are consistent with the simulation settings. The experiment is conducted under such dynamic change of light irradiance from Condition 1 to Condition 2 to Condition 3, and the running time of the experiment is set to 3 seconds. The output voltage tracking curves of PSO algorithm, WOA algorithm, WOA-PO algorithm and IWOA-PO algorithm are monitored, and the specific results are shown in Figure 18. The MPP output voltage for 3 condition is shown in Table 4.
The IWOA-PO algorithm achieves better results than WOA-PO algorithm, WOA algorithm and PSO algorithm in the experimental application of MPPT control, with high MPPT tracking accuracy, faster convergence speed and lower volatility. The results show that IWOA-PO algorithm can significantly improve the tracking accuracy and speed, and the efficiency of the PV power generation system is also greatly improved
6. Conclusions
The paper proposes a MPPT control method of PV power generation system based on IWOA-PO. Firstly, IWOA is used to improve global search for GMPP, and P&O is used to accurately track GMPP with a faster convergence speed. Through the simulation analysis of changes in scene environment, it has been proven that the algorithm has better optimization performance. Therefore, the conclusions can be drawn as follows:
1) The IWOA-PO algorithm can accurately and quickly track the GMPP under the condition of environmental changes, and the power oscillation fluctuation is small, reducing the power loss in the optimization process, thereby improving the photoelectric conversion rate, reducing the power generation cost, and bringing important economic benefits to practical engineering applications.
2) In terms of tracking time, the IWOA-PO algorithm has a significant enhancement, especially in the case of sudden changes in irradiance, temperature and irradiance simultaneously, the convergence time of the IWOA-PO algorithm is less than 0.1s.
3) To further verify the performance of the proposed IWOA-PO algorithm, the MPPT controller hardware corresponding to the previous model was designed, an actual PV MPPT control experimental platform was built, and the control algorithm was embedded into the MPPT controller for experimental verification
Compared with PSO algorithm, WOA algorithm and WOA-PO algorithm, IWOA-PO algorithm has faster tracking speed and smaller power oscillation, which can effectively improve the reliability and safety of power supply.
Author Contributions
Conceptualization, T.L. and Q.Y.; methodology, T.L.; software, S.L.; validation, T.L., S.L. and Q.Y.; formal analysis, Q.Y. and S.L.; investigation, H.Y. and Z.W.; resources, S.L.; data curation, H.Y. and J.T.; writing—original draft preparation, T.L. and S.L.; writing—review and editing, T.L. and Q.Y.; visualization, Z.W. and J.T.; supervision, T.L.; project administration, Q.Y. and S.L.; funding acquisition, Q.Y. All authors have read and agreed to the published version of the manuscript.
Funding
This work was supported by Liaoning provincial Education Department Project (LJKMZ20221035, LJKZ0683), Liaoning Provincial Science and Technology Department Project (2023-MS-212), National Natural Science Foundation of China (No. 32001415).
Data Availability Statement
Data are unavailable due to privacy.
Acknowledgments
The authors sincerely thank the National Natural Science Foundation of China for their financial support. We are also very grateful to the anonymous reviewers for their valuable comments and suggestions for the improvement of this paper.
Conflicts of Interest
The authors declare no conflict of interest.
References
- Li, A.; Liu, W.F.; Li, Y.K.; et al. Research on MPPT control of photovoltaic system based on IP&O-ICS algorithm. Journal of solar energy 2023, 44, 203–209. [Google Scholar]
- Wang, L.S.; Jiang, S.J.; Wang, J.; et al. Optimal control of photovoltaic MPPT algorithm based on hybrid strategy. Journal of solar energy 2016, 37, 1396–1402. [Google Scholar]
- Zhang, L.; Hurley, W.G.; Wolfle, W.H. A new approach to achieve maximum power point tracking for PV system with a variable inductor. IEEE transactions on power electronics 2010, 26, 1031–1037. [Google Scholar] [CrossRef]
- Zhang, S.Z.; Chu, B.Q.; Yuan, X.F.; et al. Research on photovoltaic array model analysis and maximum power point tracking. Automation and instrumentation 2019, 114–116. [Google Scholar]
- Jia, L.Z.; Chen, K.; Li, G.J.; et al. Research on MPPT algorithm for photovoltaic arrays under local shadowing conditions. Journal of solar energy 2014, 35, 1614–1621. [Google Scholar]
- Wu, D.S.; Wang, L.D.; Liu, T.; et al. Neural network-based multi-peak MPPT for photovoltaic arrays. Electrical measurement and instrumentation 2019, 56, 69–74. [Google Scholar]
- Fu, W.L.; Meng, J.X.; Zhang, Y.N.; et al. Improved GWO-based PV multi-peak MPPT control under complex shading. Journal of solar energy 2023, 44, 435–442. [Google Scholar]
- Eltamaly, A.M.; Farh, H.M.H. Dynamic global maximum power point tracking of the PV systems under variant partial shading using hybrid GWO-FLC. Solar energy 2019, 177, 306–316. [Google Scholar] [CrossRef]
- Cai, X.Q.; Chen, X.F. Application of improved disturbance observation method in MPPT of photovoltaic power generation. Electronic testing, 2019, 59-60.
- Su, Y.G.; Wang, D.C.; Wang, Y.; et al. Simulation of MPPT control strategy based on improved variable step size conductance increment method. Automation technology and Application 2019, 38, 11–15. [Google Scholar]
- Laxman, B.; Annamraju, A.; Srikanth, N.V. A grey wolf optimized fuzzy logic based MPPT for shaded solar photovoltaic systems in microgrids. International journal of hydrogen energy 2021, 46, 10653–10665. [Google Scholar] [CrossRef]
- Nassef, A.M.; Houssein, E.H.; Helmy, B.E.; et al. Modified honey badger algorithm based global MPPT for triple-junction solar photovoltaic system under partial shading condition and global optimization. Energy 2022, 254, 124363. [Google Scholar] [CrossRef]
- Wu, Z.Q.; Cao, B.L.; Hou, L.C.; et al. Maximum power point tracking of photovoltaic system based on improved multivariate universe optimisation algorithm. Journal of electronics and information 2021, 43, 3735–3742. [Google Scholar]
- Zafar, M.H.; Khan, N.M.; Mirza, A.F.; et al. A novel meta-heuristic optimization algorithm based MPPT control technique for PV systems under complex partial shading condition. Sustainable energy technologies and assessments 2021, 47, 101367. [Google Scholar] [CrossRef]
- Shi, J.Y.; Ling, L.T.; Xue, F.; et al. Application of territorial particle swarm algorithm for photovoltaic maximum power tracking. Journal of solar energy 2019, 40, 2554–2560. [Google Scholar]
- Nie, X.H.; Wang, W. Chaotic improved cat swarm algorithm and its application in photovoltaic MPPT. Chinese journal of electrical engineering 2016, 36, 6103–6110. [Google Scholar]
- Mohanty, S.; Subudhi, B.; Ray, P.K. A grey wolf-assisted perturb & observe MPPT algorithm for a PV system. IEEE transactions on energy conversion 2016, 32, 340–347. [Google Scholar]
- Mathi, D.K.; Ramulu, C. A hybrid global maximum power point tracking method based on butterfly particle swarm optimization and perturb and observe algorithms for a photovoltaic system under partially shaded conditions. International Transactions on Electrical Energy Systems 30, e12543. [CrossRef]
- Lasheen, M.; Abdel-Salam, M. Maximum power point tracking using Hill Climbing and ANFIS techniques for PV applications: A review and a novel hybrid approach. Energy conversion and management 2018, 171, 1002–1019. [Google Scholar] [CrossRef]
- Li, J.Y.; Zhang, W.B.; Zhao, X.Z.; et al. Improved whale algorithm to optimise support vector regression for photovoltaic maximum power point tracking. Journal of electrotechnology 2021, 36, 1771–1781. [Google Scholar]
- Chen, B.; Wang, J.J.; Zhao, M.Y.; et al. Research on MPPT control of photovoltaic power generation system based on improved whale optimisation algorithm. Journal of power system and automation 2023, 35, 19–26. [Google Scholar]
- Tao, H.; Ghahremani, M.; Ahmed, F.W.; et al. A novel MPPT controller in PV systems with hybrid whale optimization-PS algorithm based ANFIS under different conditions. Control engineering practice 2021, 112, 104809. [Google Scholar] [CrossRef]
- Chen, Y.X.; Vepa, R.; Shaheed, M.H. Enhanced and speedy energy extraction from a scaled-up pressure retarded osmosis process with a whale optimization based maximum power point tracking. Energy 2018, 153, 618–627. 23. [Google Scholar] [CrossRef]
- Sun, R.X.; Shang, Y.H.; Han, S. Research on MPPT of photovoltaic array based on improved whale algorithm. Information technology and network security 2021, 40, 31–36. [Google Scholar]
- Ebrahim, M.A.; Osama, A.; Kotb, K.M.; et al. Whale inspired algorithm based MPPT controllers for grid-connected solar photovoltaic system. Energy Procedia 2019, 162, 77–86. [Google Scholar] [CrossRef]
- Mao, Q.H.; Yang, L.; Wang, Y.L. A grey wolf algorithm incorporating improved Tent chaos and simulated annealing. Practice and understanding of mathematics 2021, 51, 147–161. [Google Scholar]
- Ma, X.N.; Li, X.H. Reproducible whale algorithm based on Tent chaotic mapping. Computer simulation 2022, 39, 363–368. [Google Scholar]
- You, H.Y. Research on MPPT control strategy based on composite algorithm[D]. Shenyang Engineering College, 2023.
- Tang, G.Q. Research on control strategy of hybrid energy storage system for photovoltaic microgrid [D]. Anhui university of technology, 2019.
- Gong, L.; Hou, G.; Huang, C. A two-stage MPPT controller for PV system based on the improved artificial bee colony and simultaneous heat transfer search algorithm. ISA transactions 2023, 132, 428–443. [Google Scholar] [CrossRef]
- Yi, L.; Xie, Y.L.; Zeng, F.Y.; et al. Neural network-based MPPT control with improved disturbance observation method. Journal of solar energy 2022, 43, 198–203. [Google Scholar]
- Zhang, J.; Li, L.G. Research on photovoltaic MPPT control based on improved disturbance observation method. Electromechanical information 2023, 11–14. [Google Scholar]
- Bhattacharyya, S.; Samanta, S.; Mishra, S.; et al. Steady output and fast tracking MPPT (SOFT-MPPT) for P&O and InC algorithms. IEEE transactions on sustainable energy 2021, 12, 293–302. [Google Scholar]
- Wang, L.Z.; Liu, G.Y. Tracking control of photovoltaic MPPT based on simplified ant colony algorithm. Power technology 2020, 44, 1152–1155. [Google Scholar]
- Wen, Q.; Shi, X.P.; Zhang, L.F.; et al. APSO-LSTM natural gas demand forecasting model based on improved Tent mapping. Oil and gas storage and transportation 2023, 42, 702–712. [Google Scholar]
- Zhang, Z.M.; Wang, W.B.; Peng, H.Y.; et al. Photovoltaic maximum power point tracking based on improved firefly algorithm. Journal of beihua university (Natural science edition) 2021, 22, 405–409. [Google Scholar]
Figure 1.
Photovoltaic power generation system structure diagram.
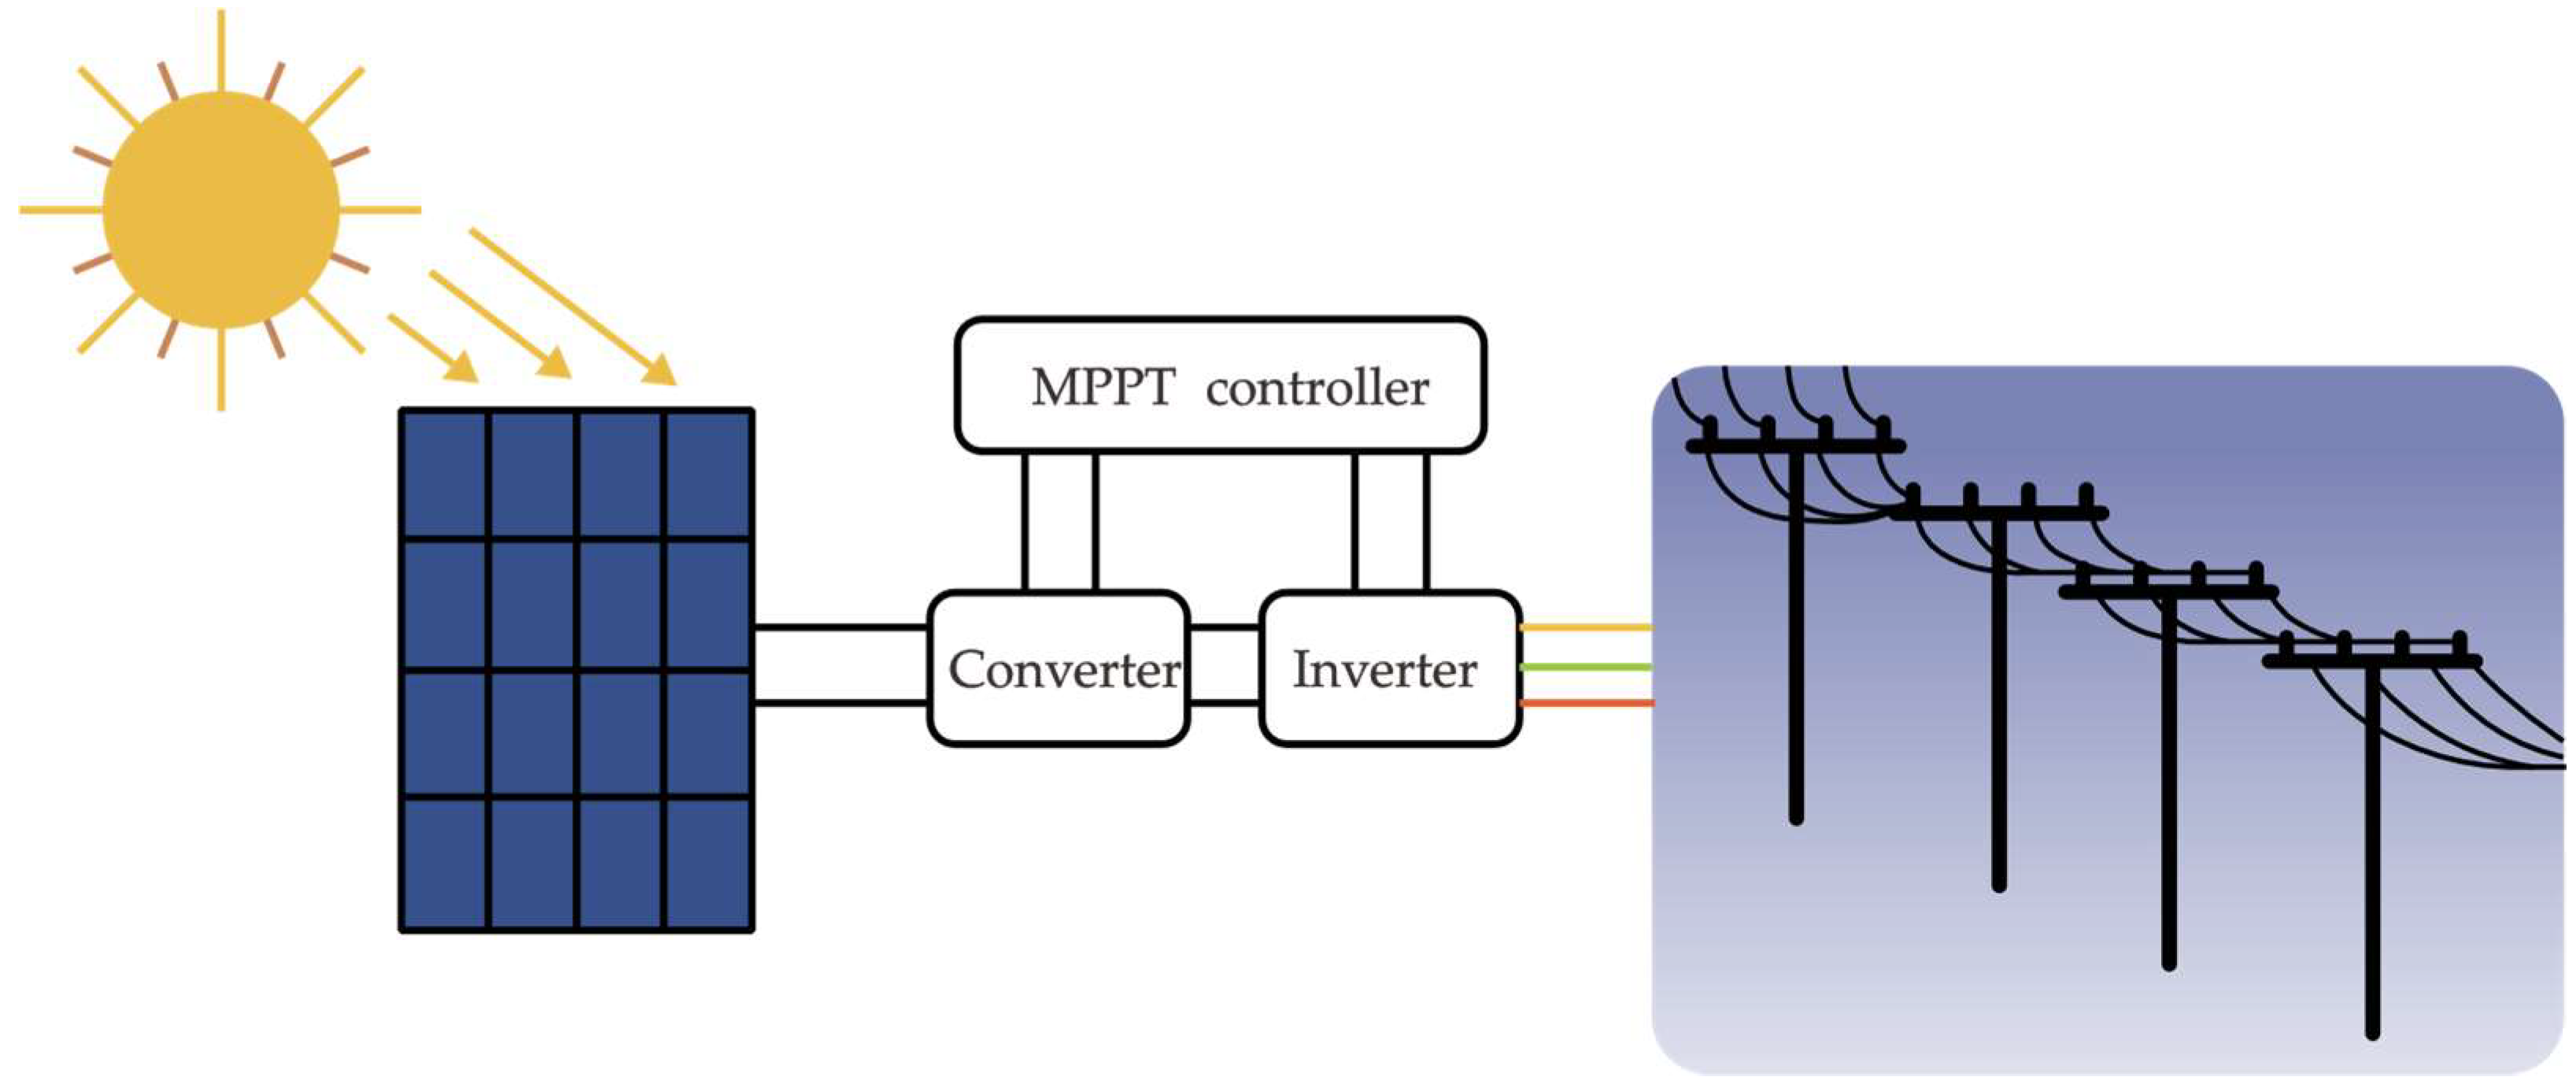
Figure 2.
PV cell equivalent circuit diagram.
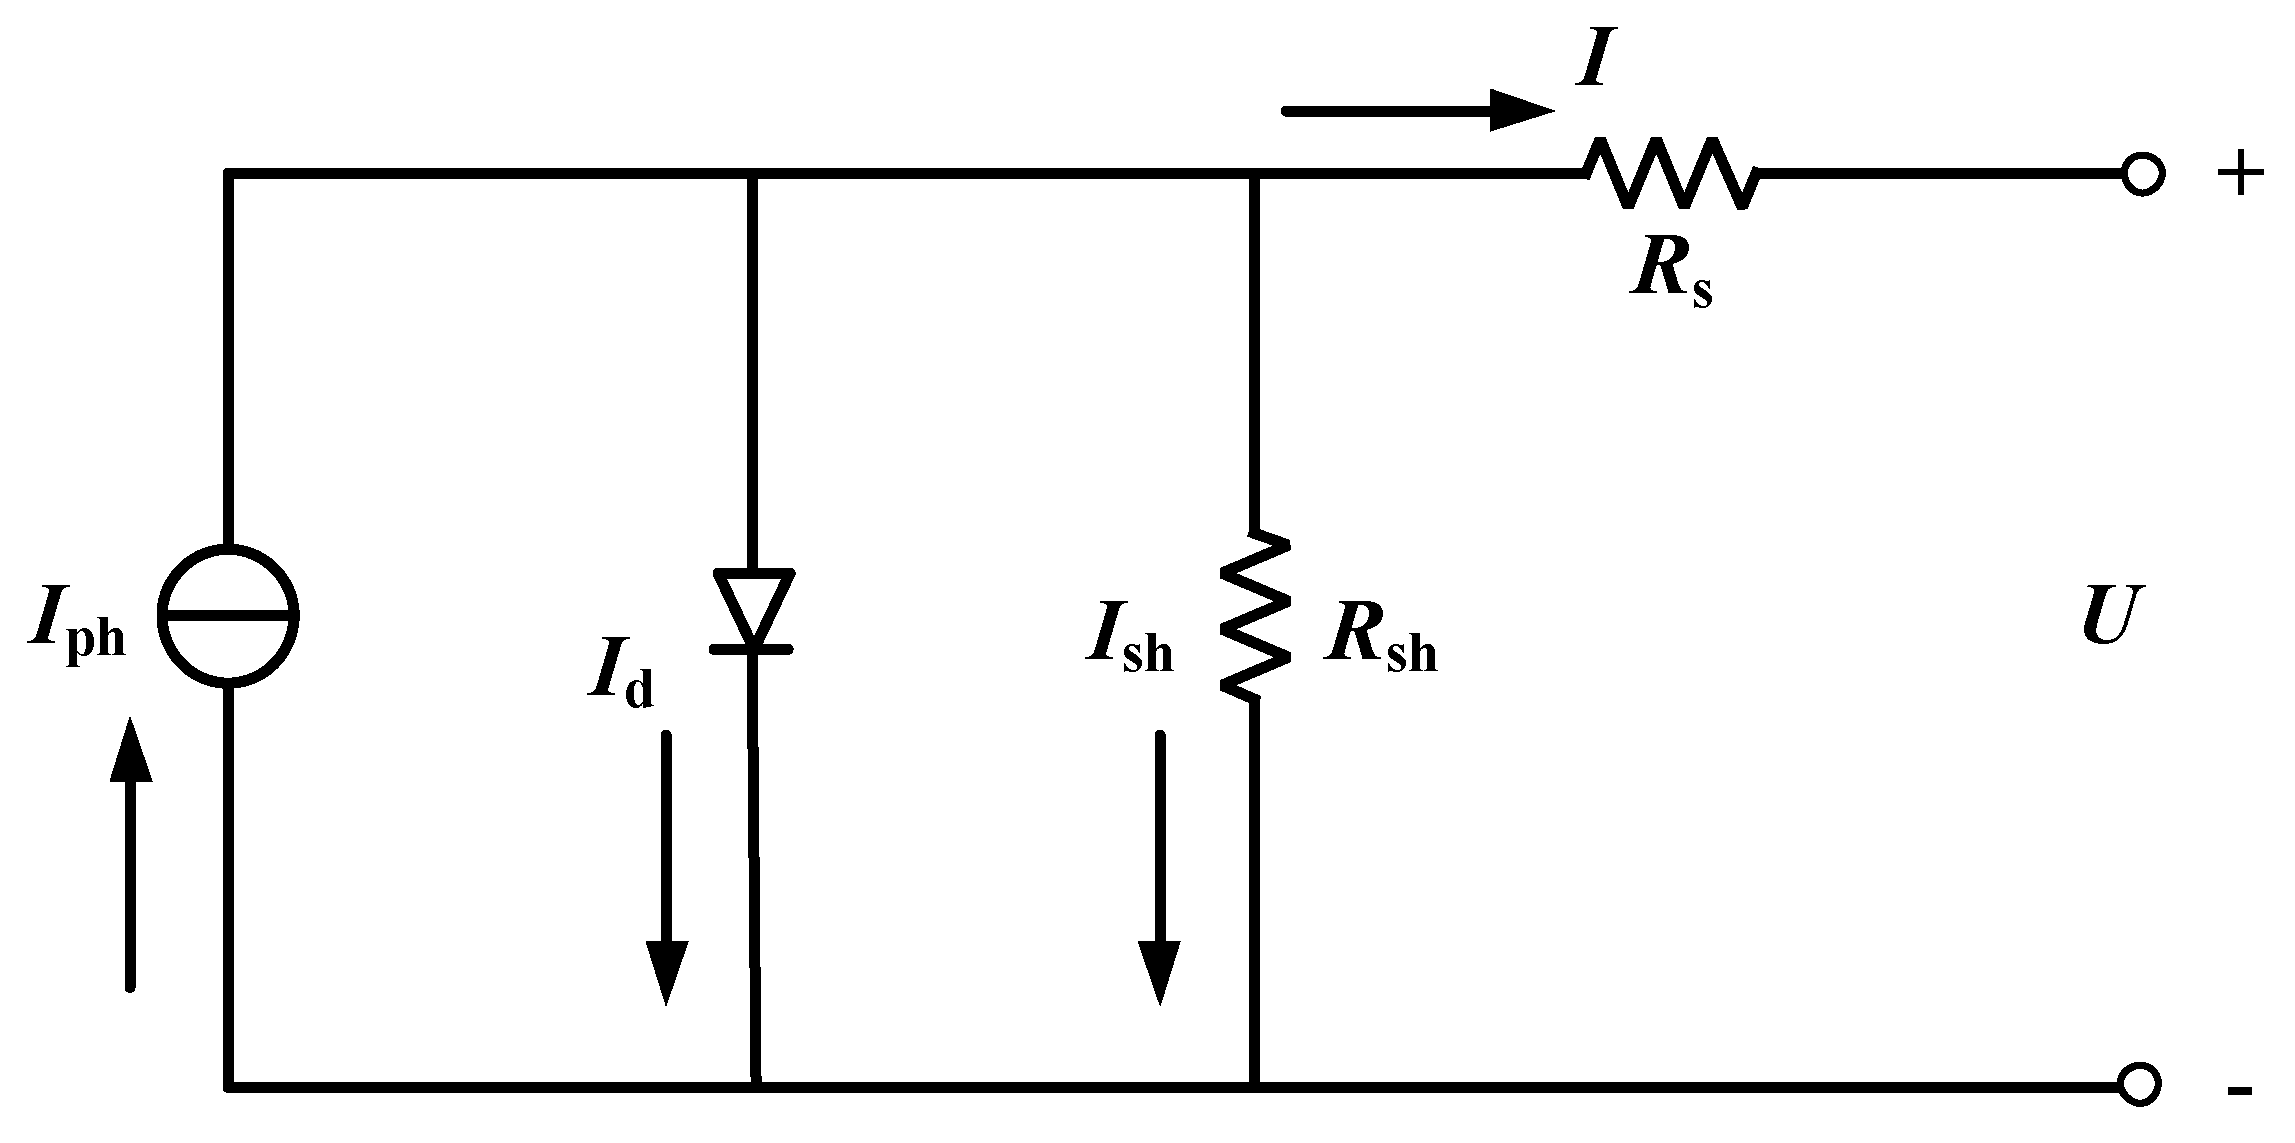
Figure 3.
Output characteristic curves at different irradiances. (a) I-V; (b) P-V.
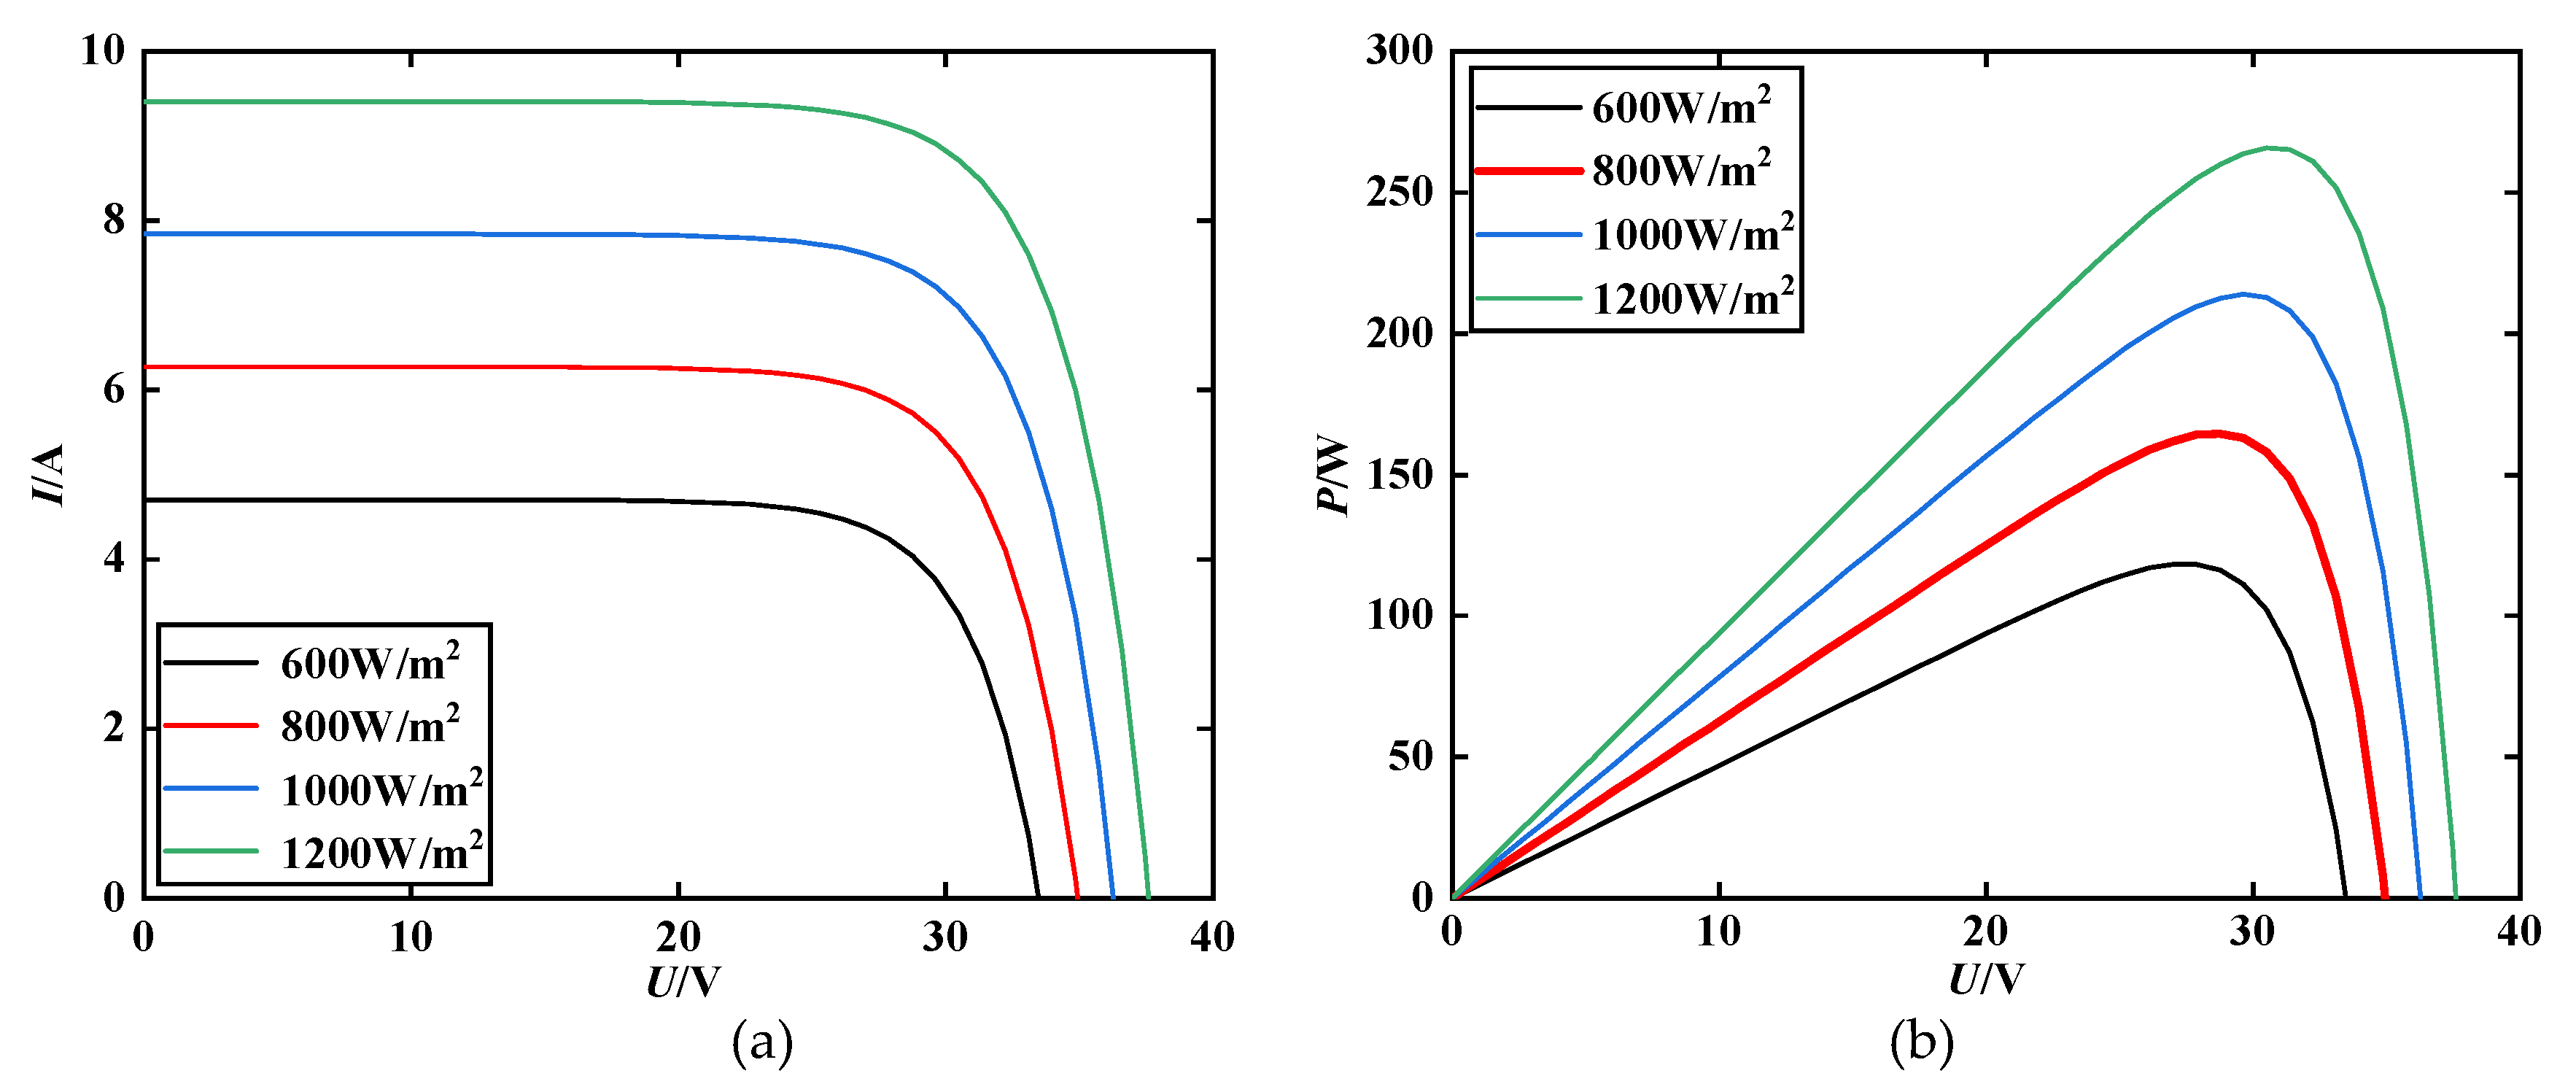
Figure 4.
Schematic diagram of 6×1 photovoltaic array.
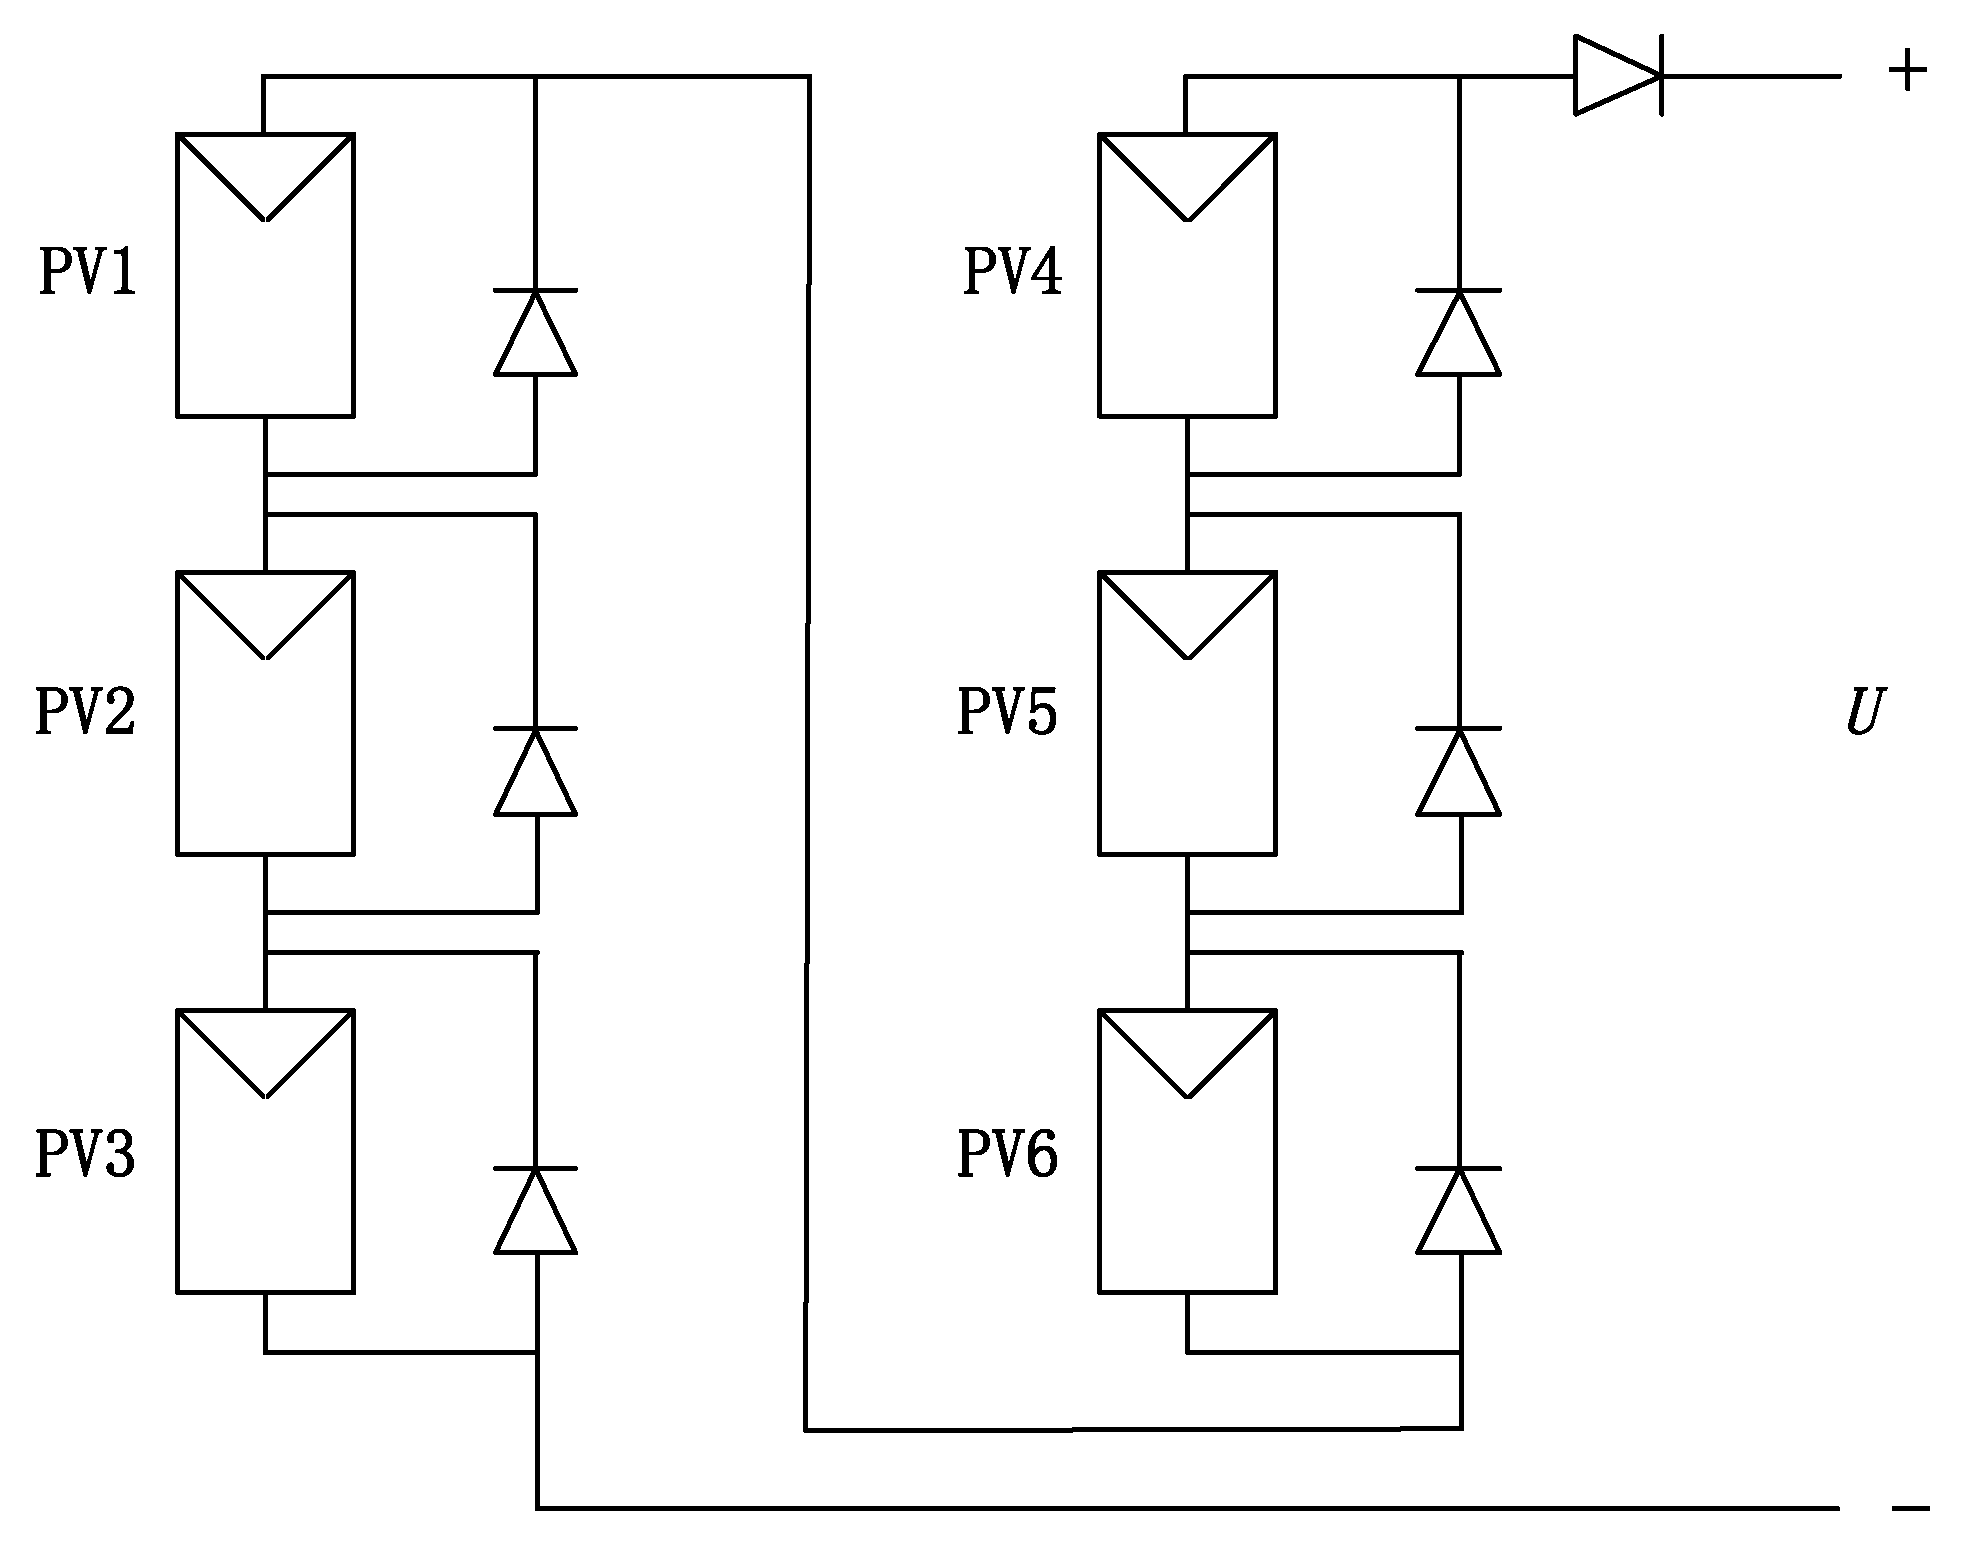
Figure 5.
Output characteristic curves of PV array at different irradiances. (a) I-V; (b) P-V.
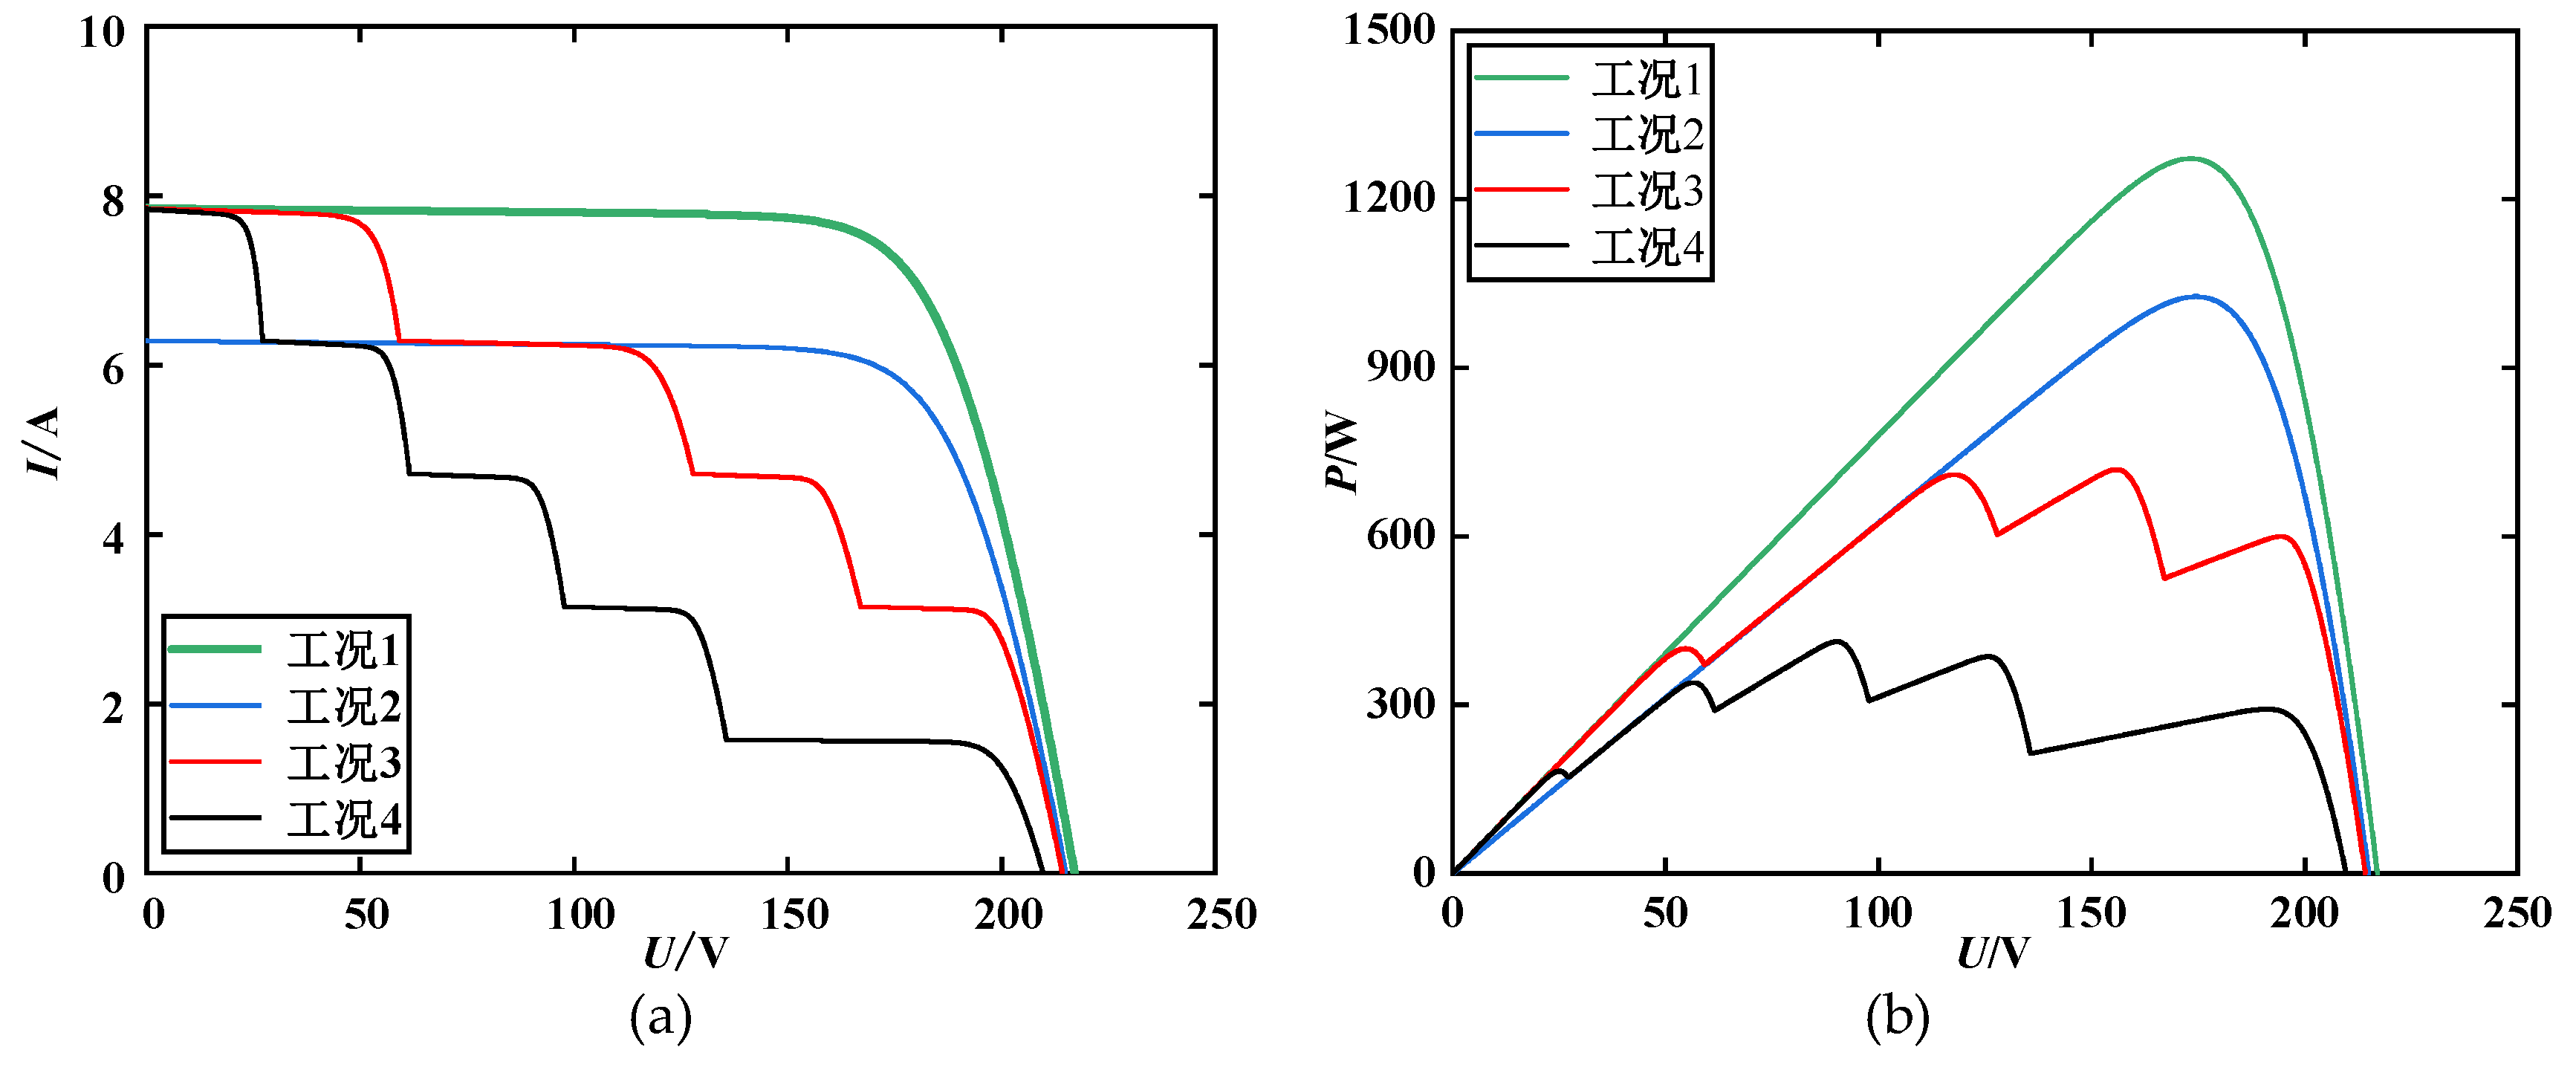
Figure 6.
Flowchart of the P&O algorithm.
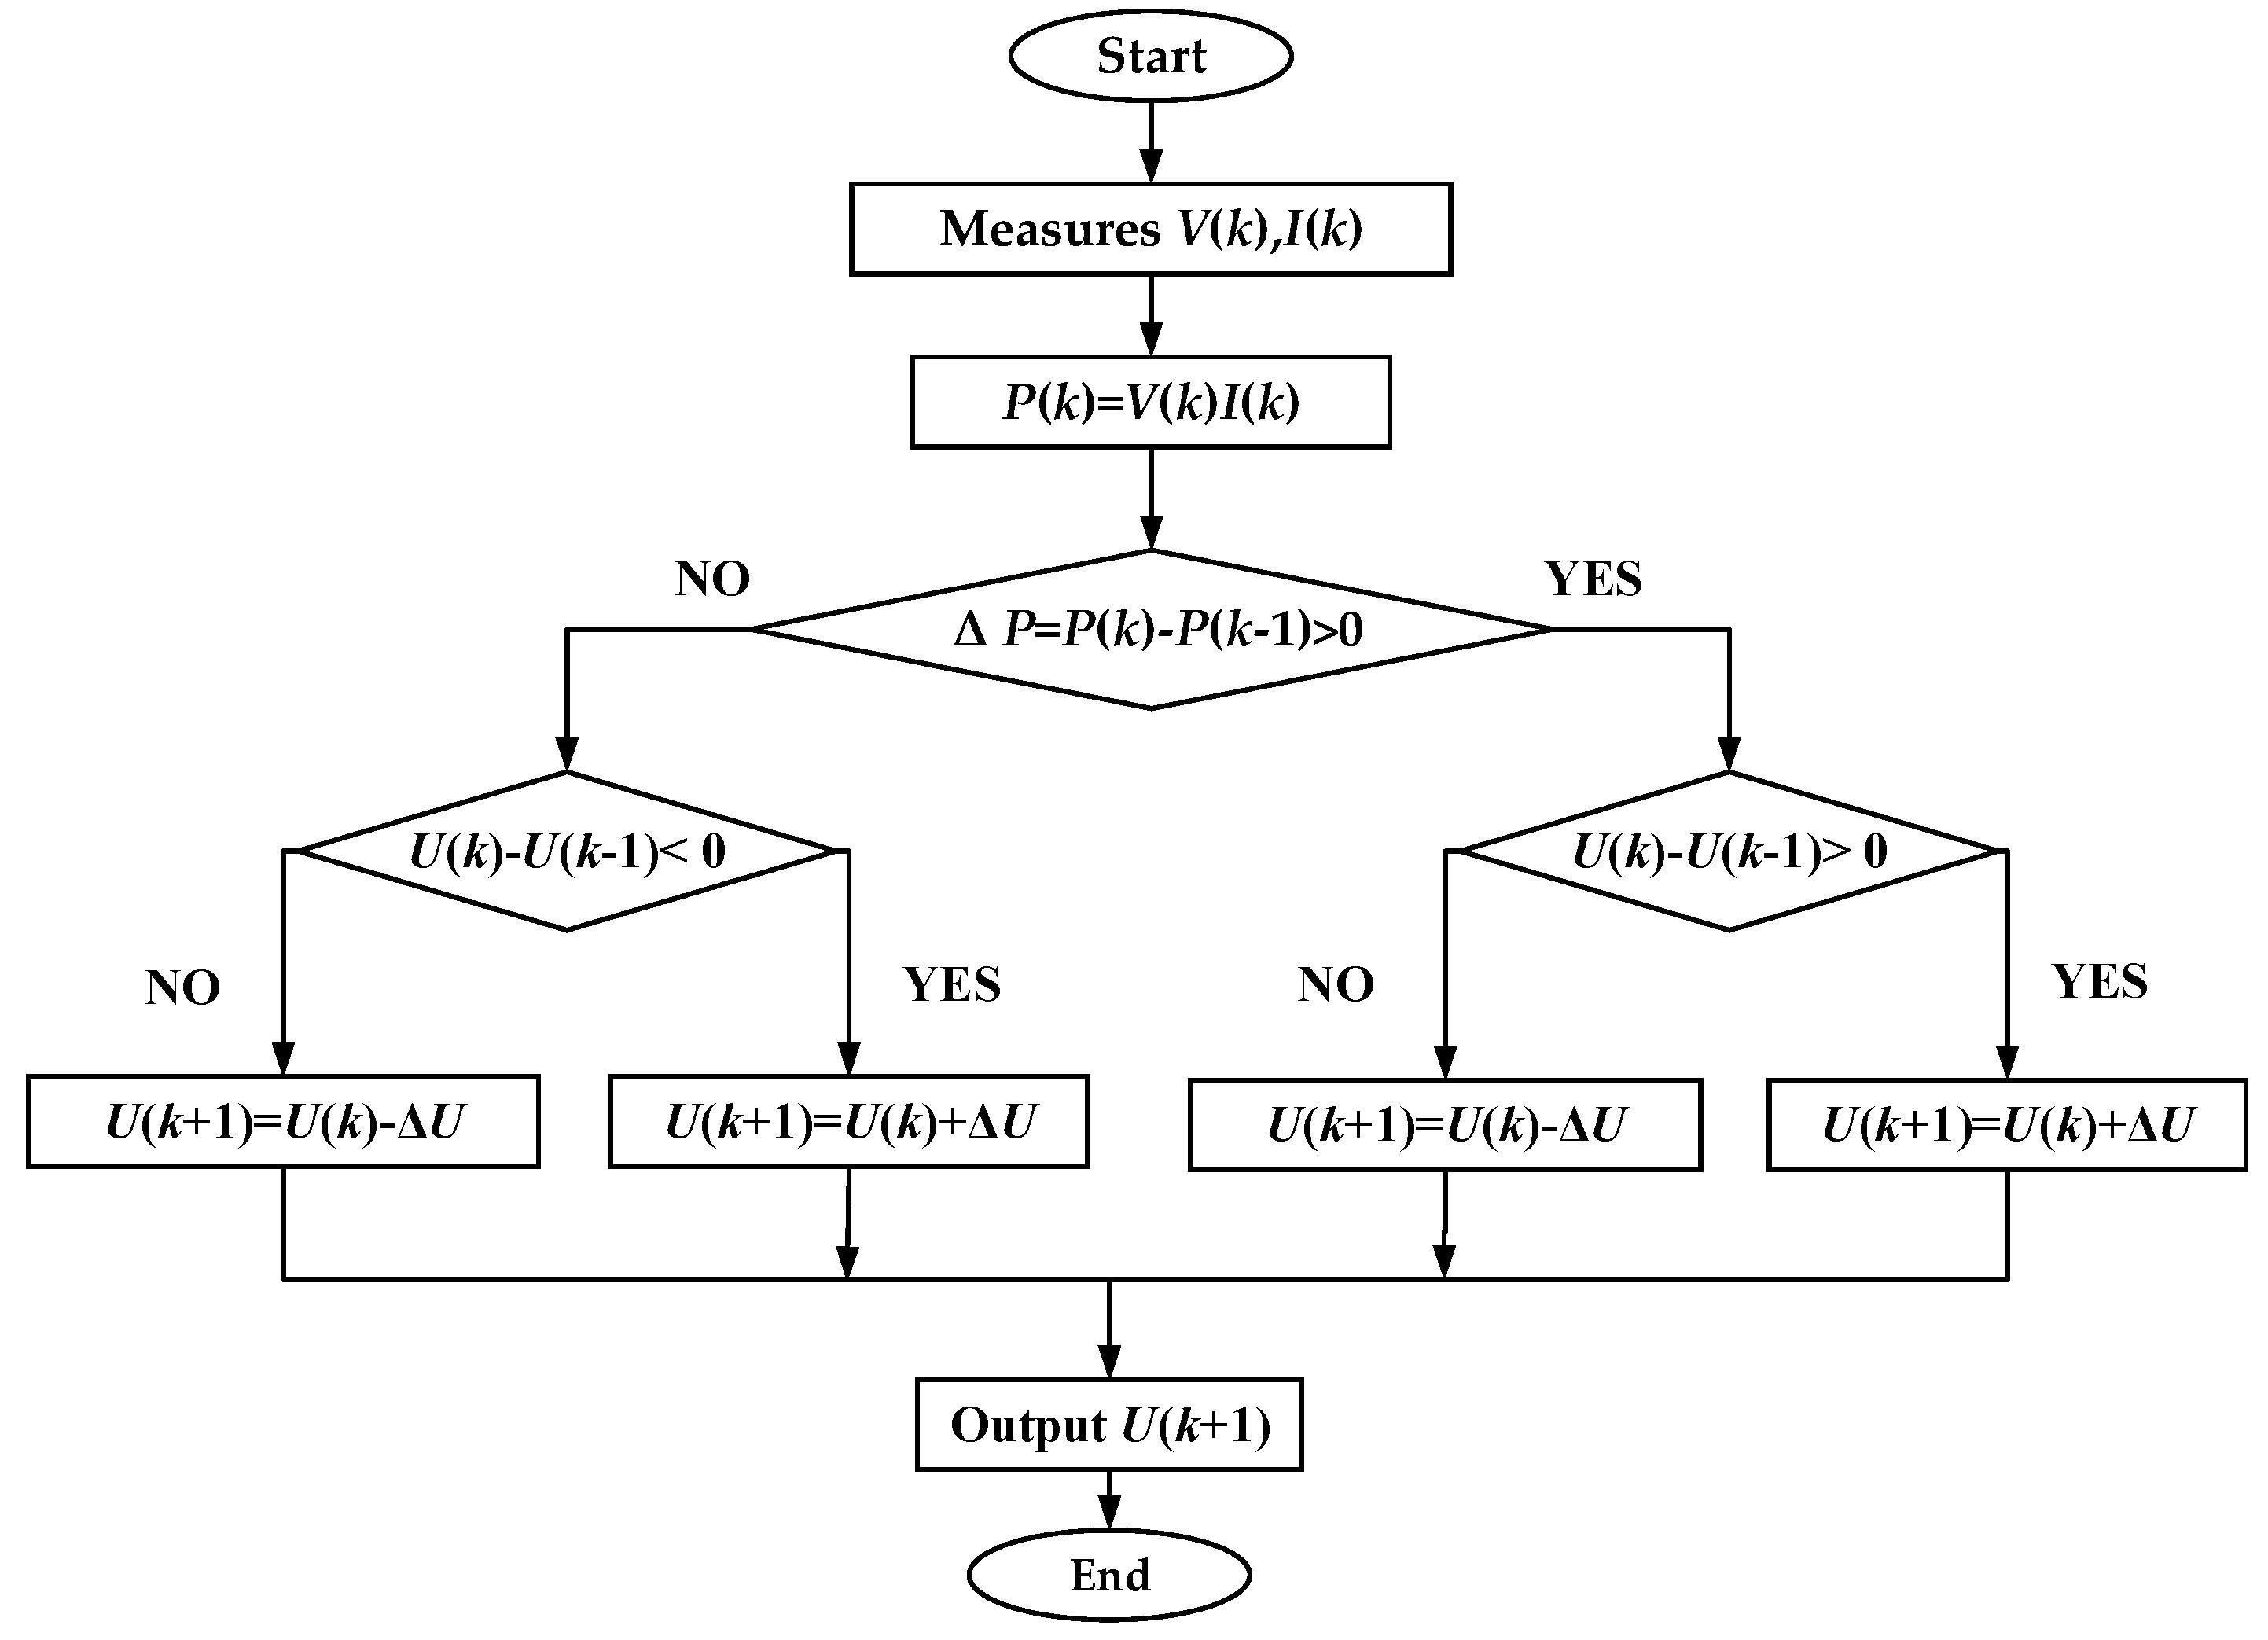
Figure 7.
Predation in the form of "bubble nets".
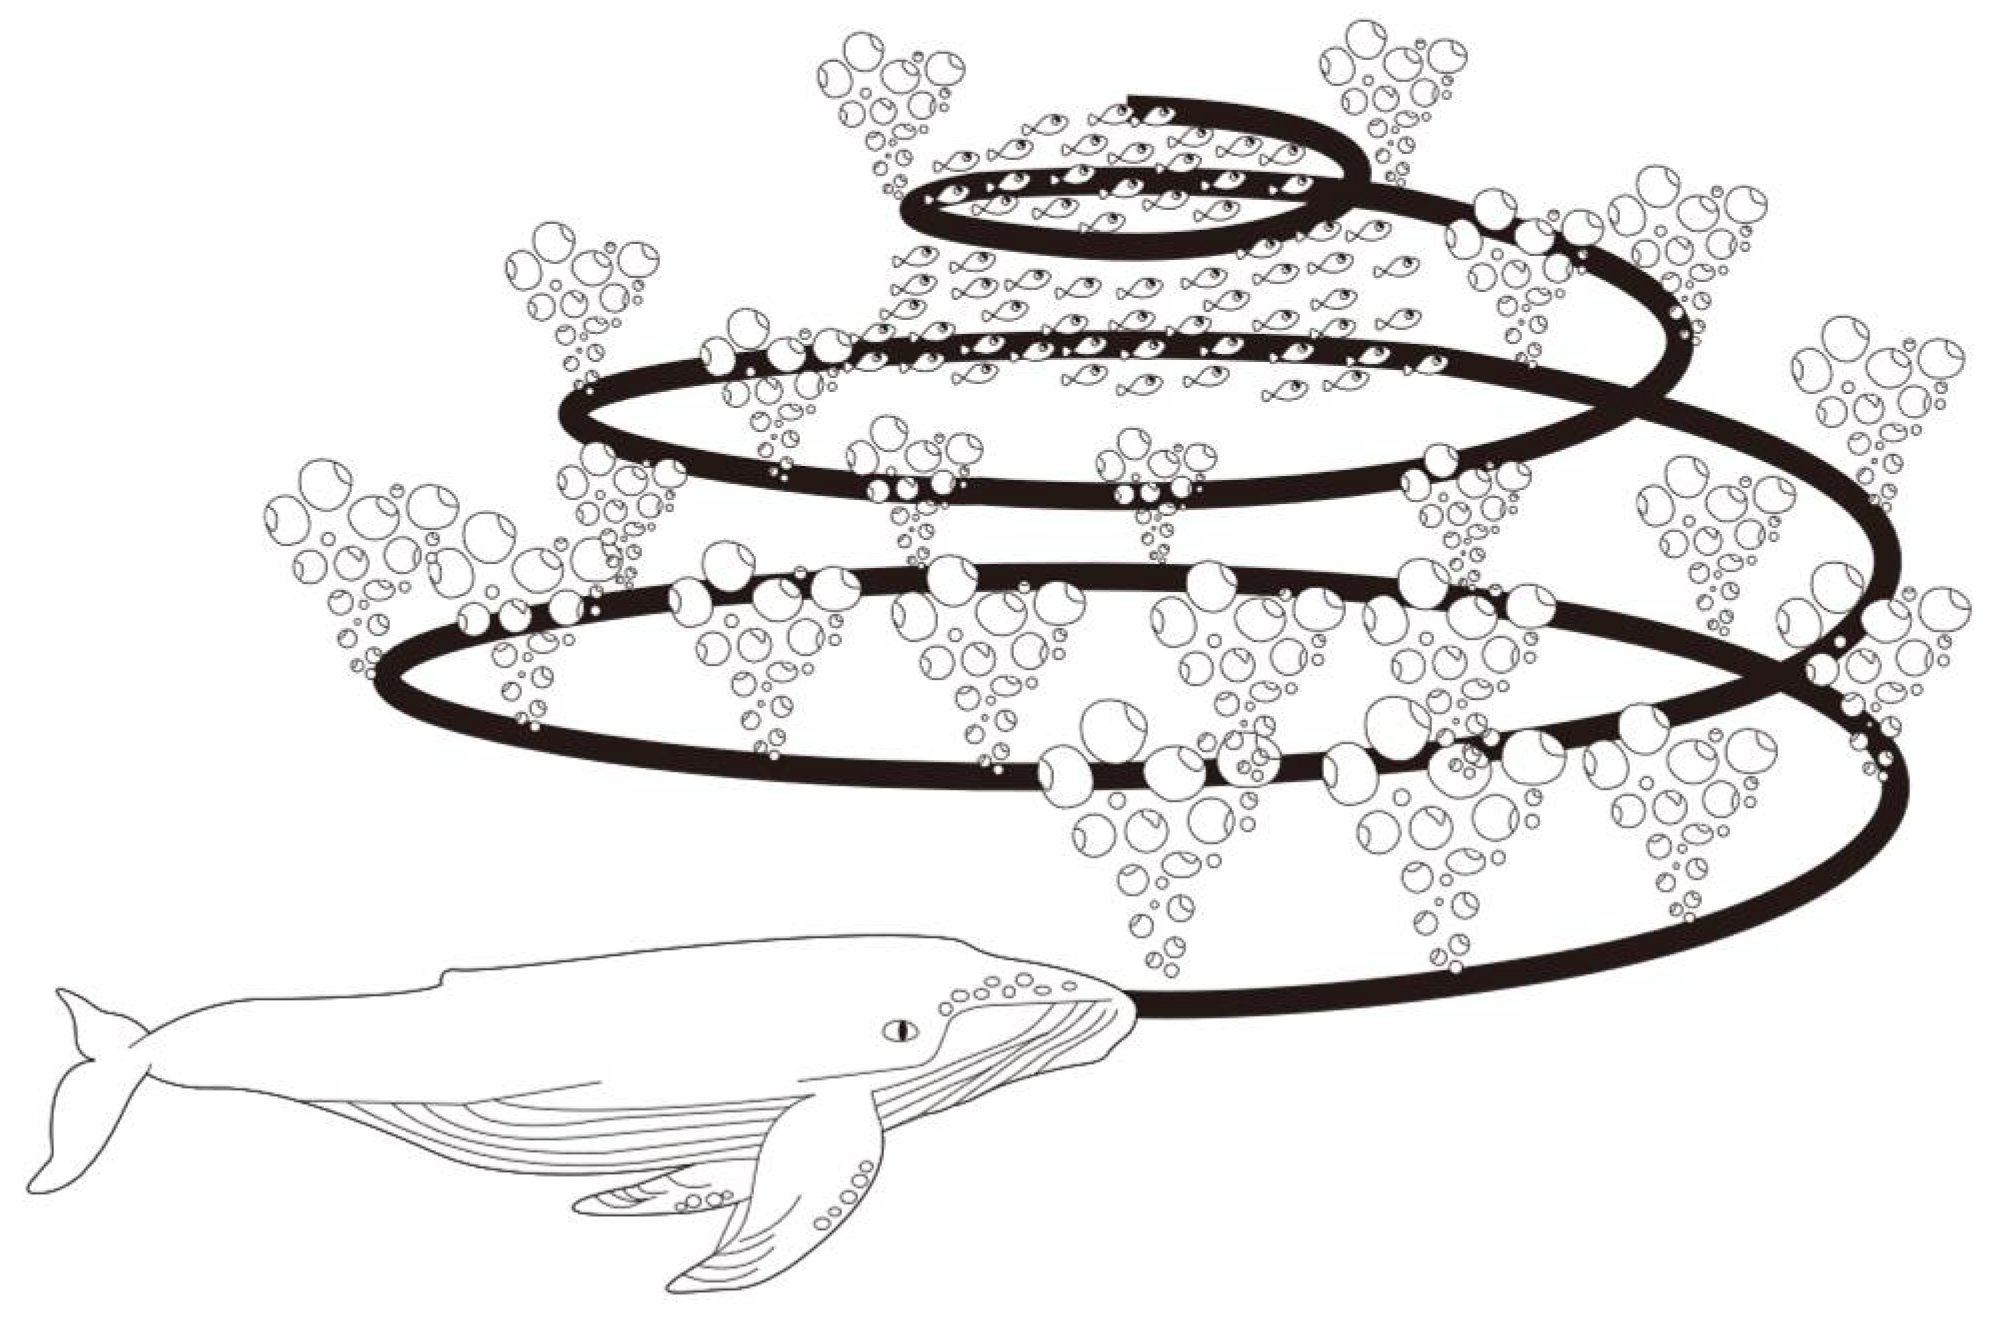
Figure 8.
Overall flowchart of IWOA-PO algorithm.
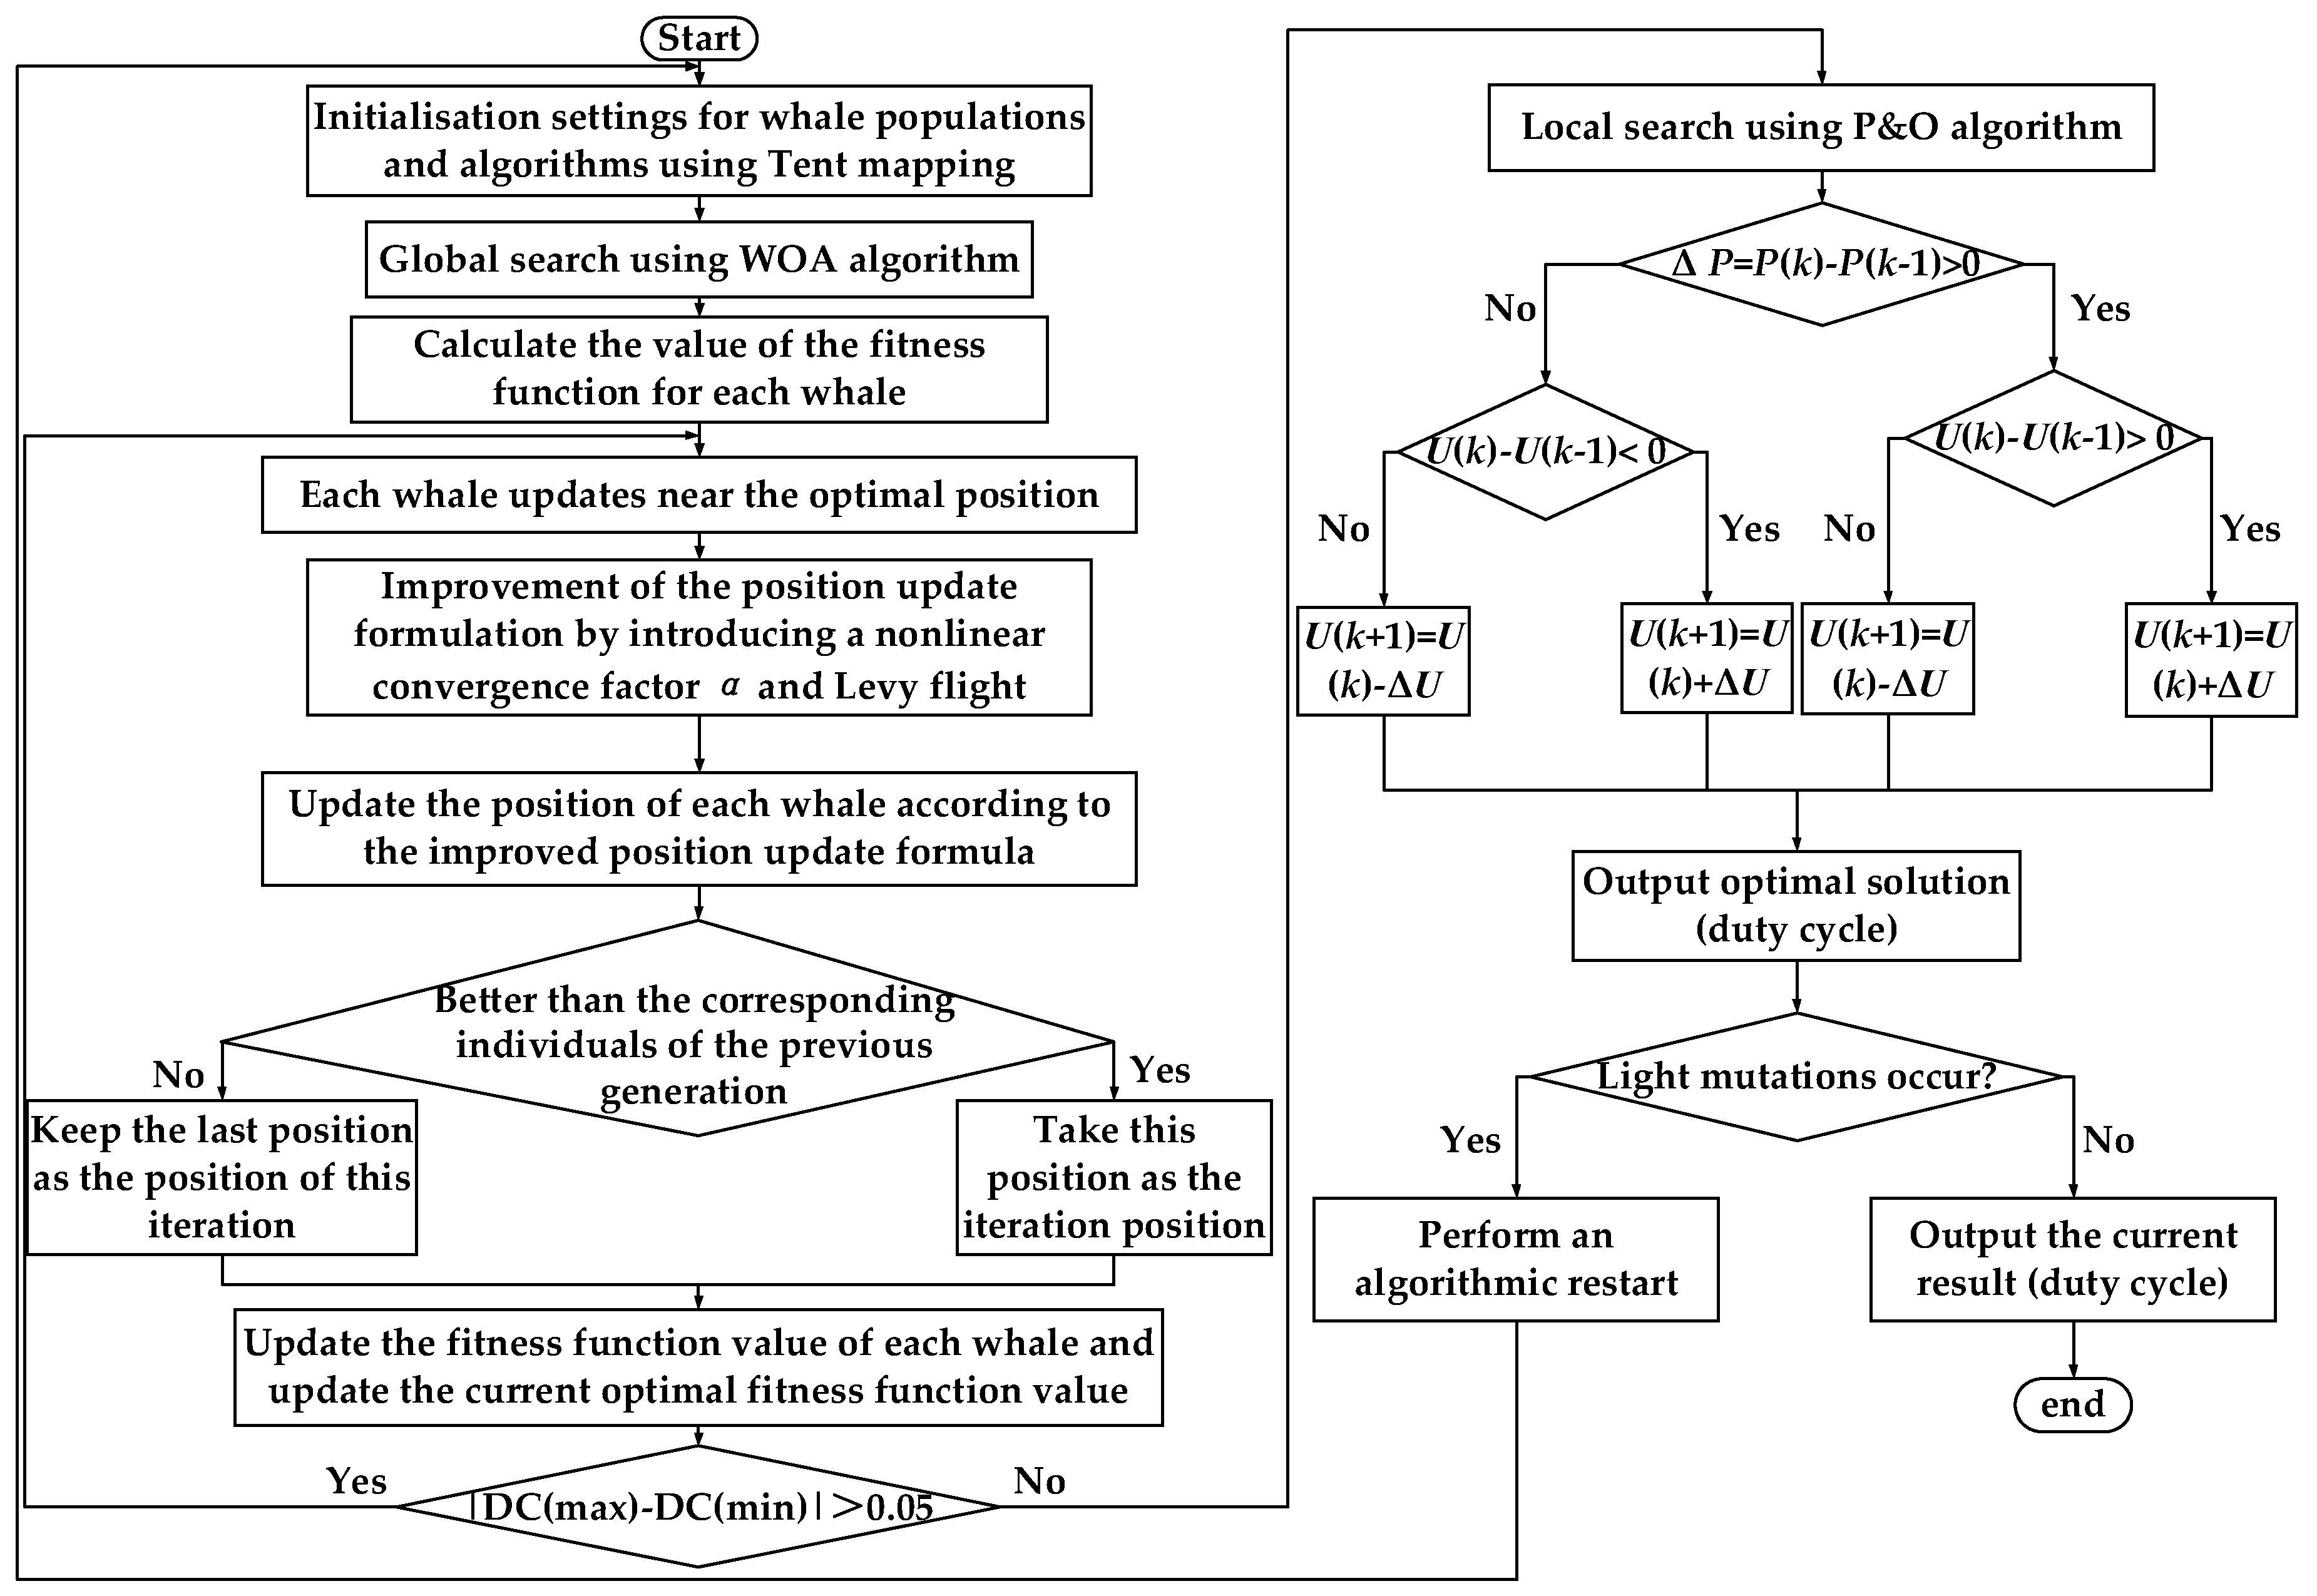
Figure 9.
Structure of MPPT for PV system based on IWOA-PO.
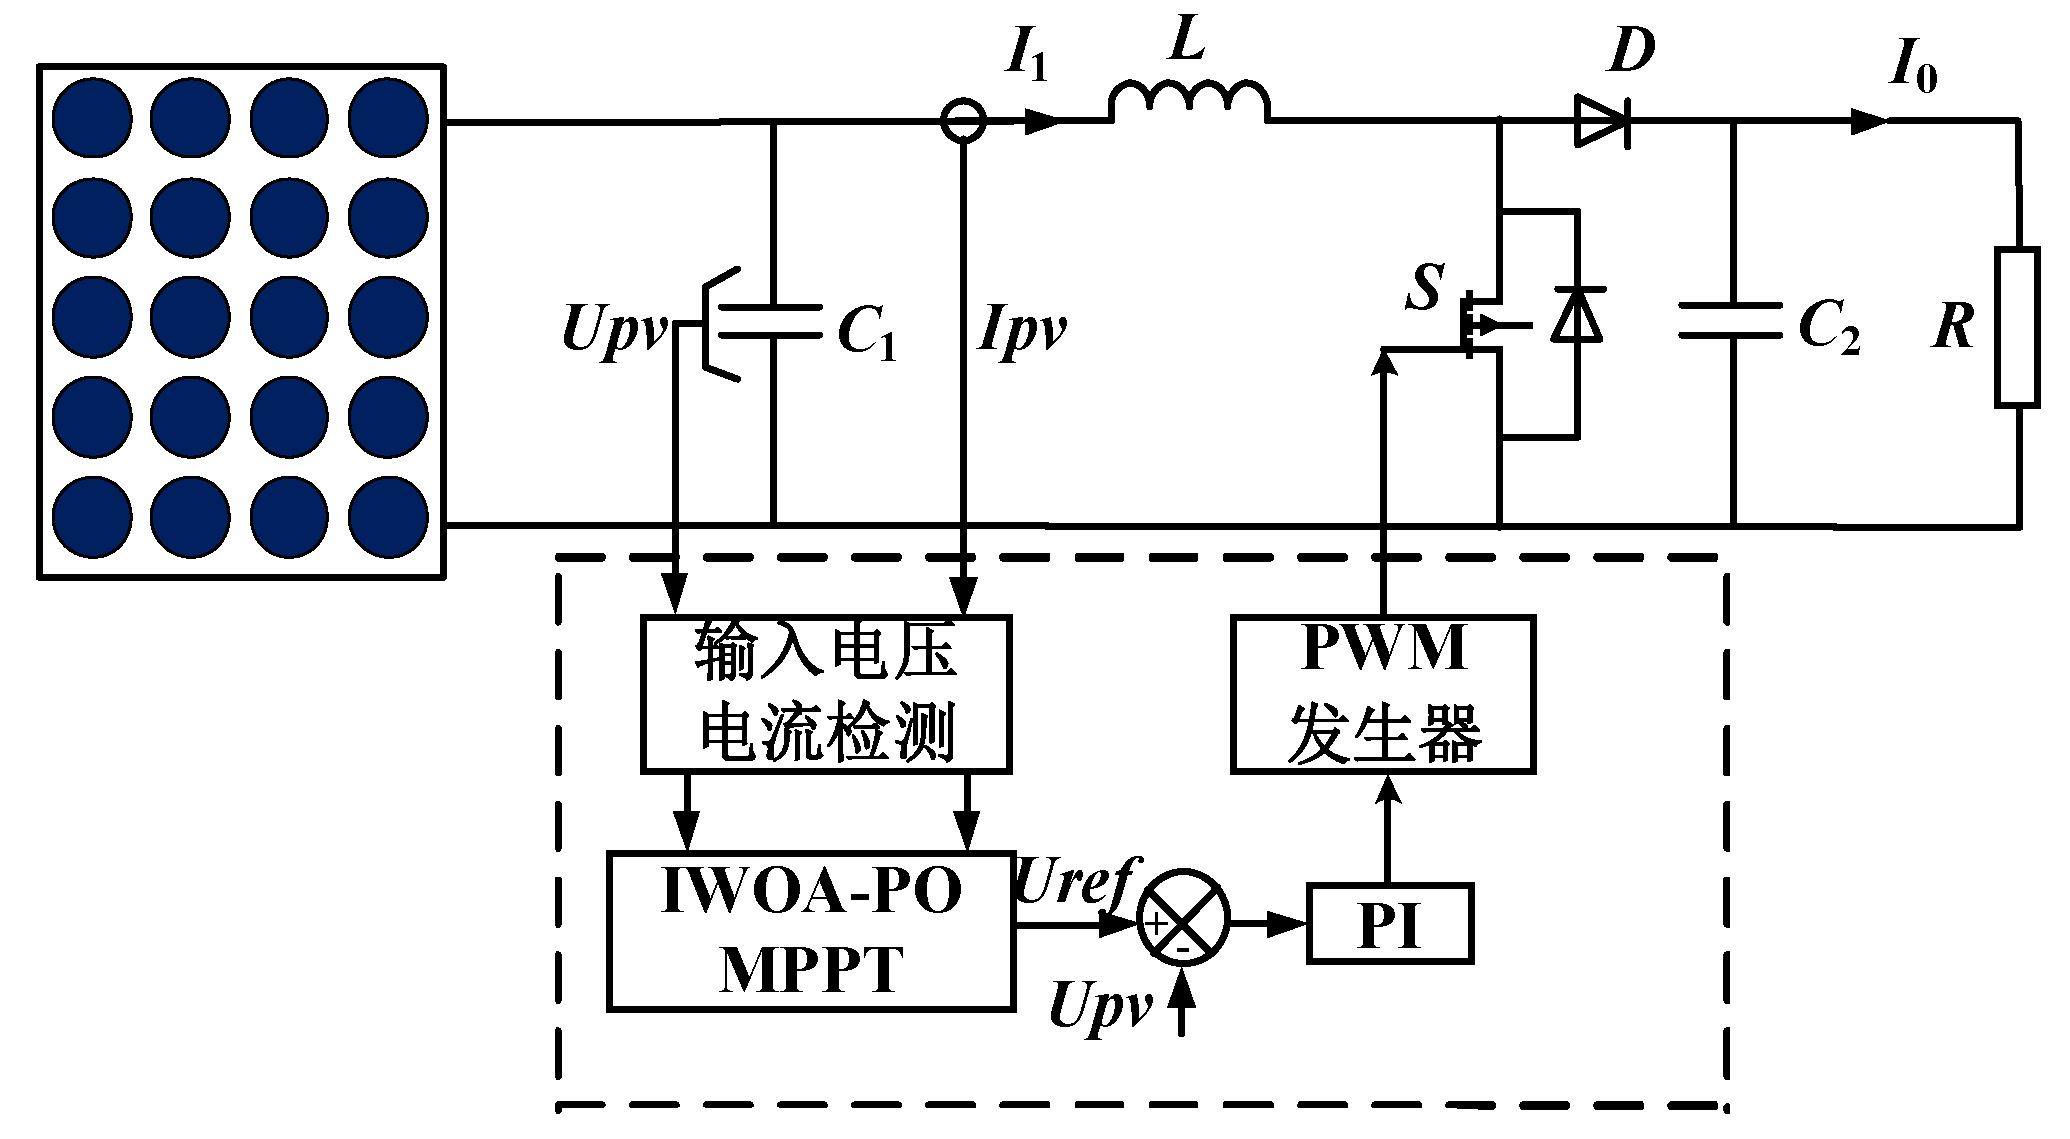
Figure 10.
P-V response diagram of the system under uniform irradiance. (a) PSO algorithm; (b). WOA algorithm; (c) WOA-PO algorithm; (d) IWOA-PO algorithm.
Figure 10.
P-V response diagram of the system under uniform irradiance. (a) PSO algorithm; (b). WOA algorithm; (c) WOA-PO algorithm; (d) IWOA-PO algorithm.
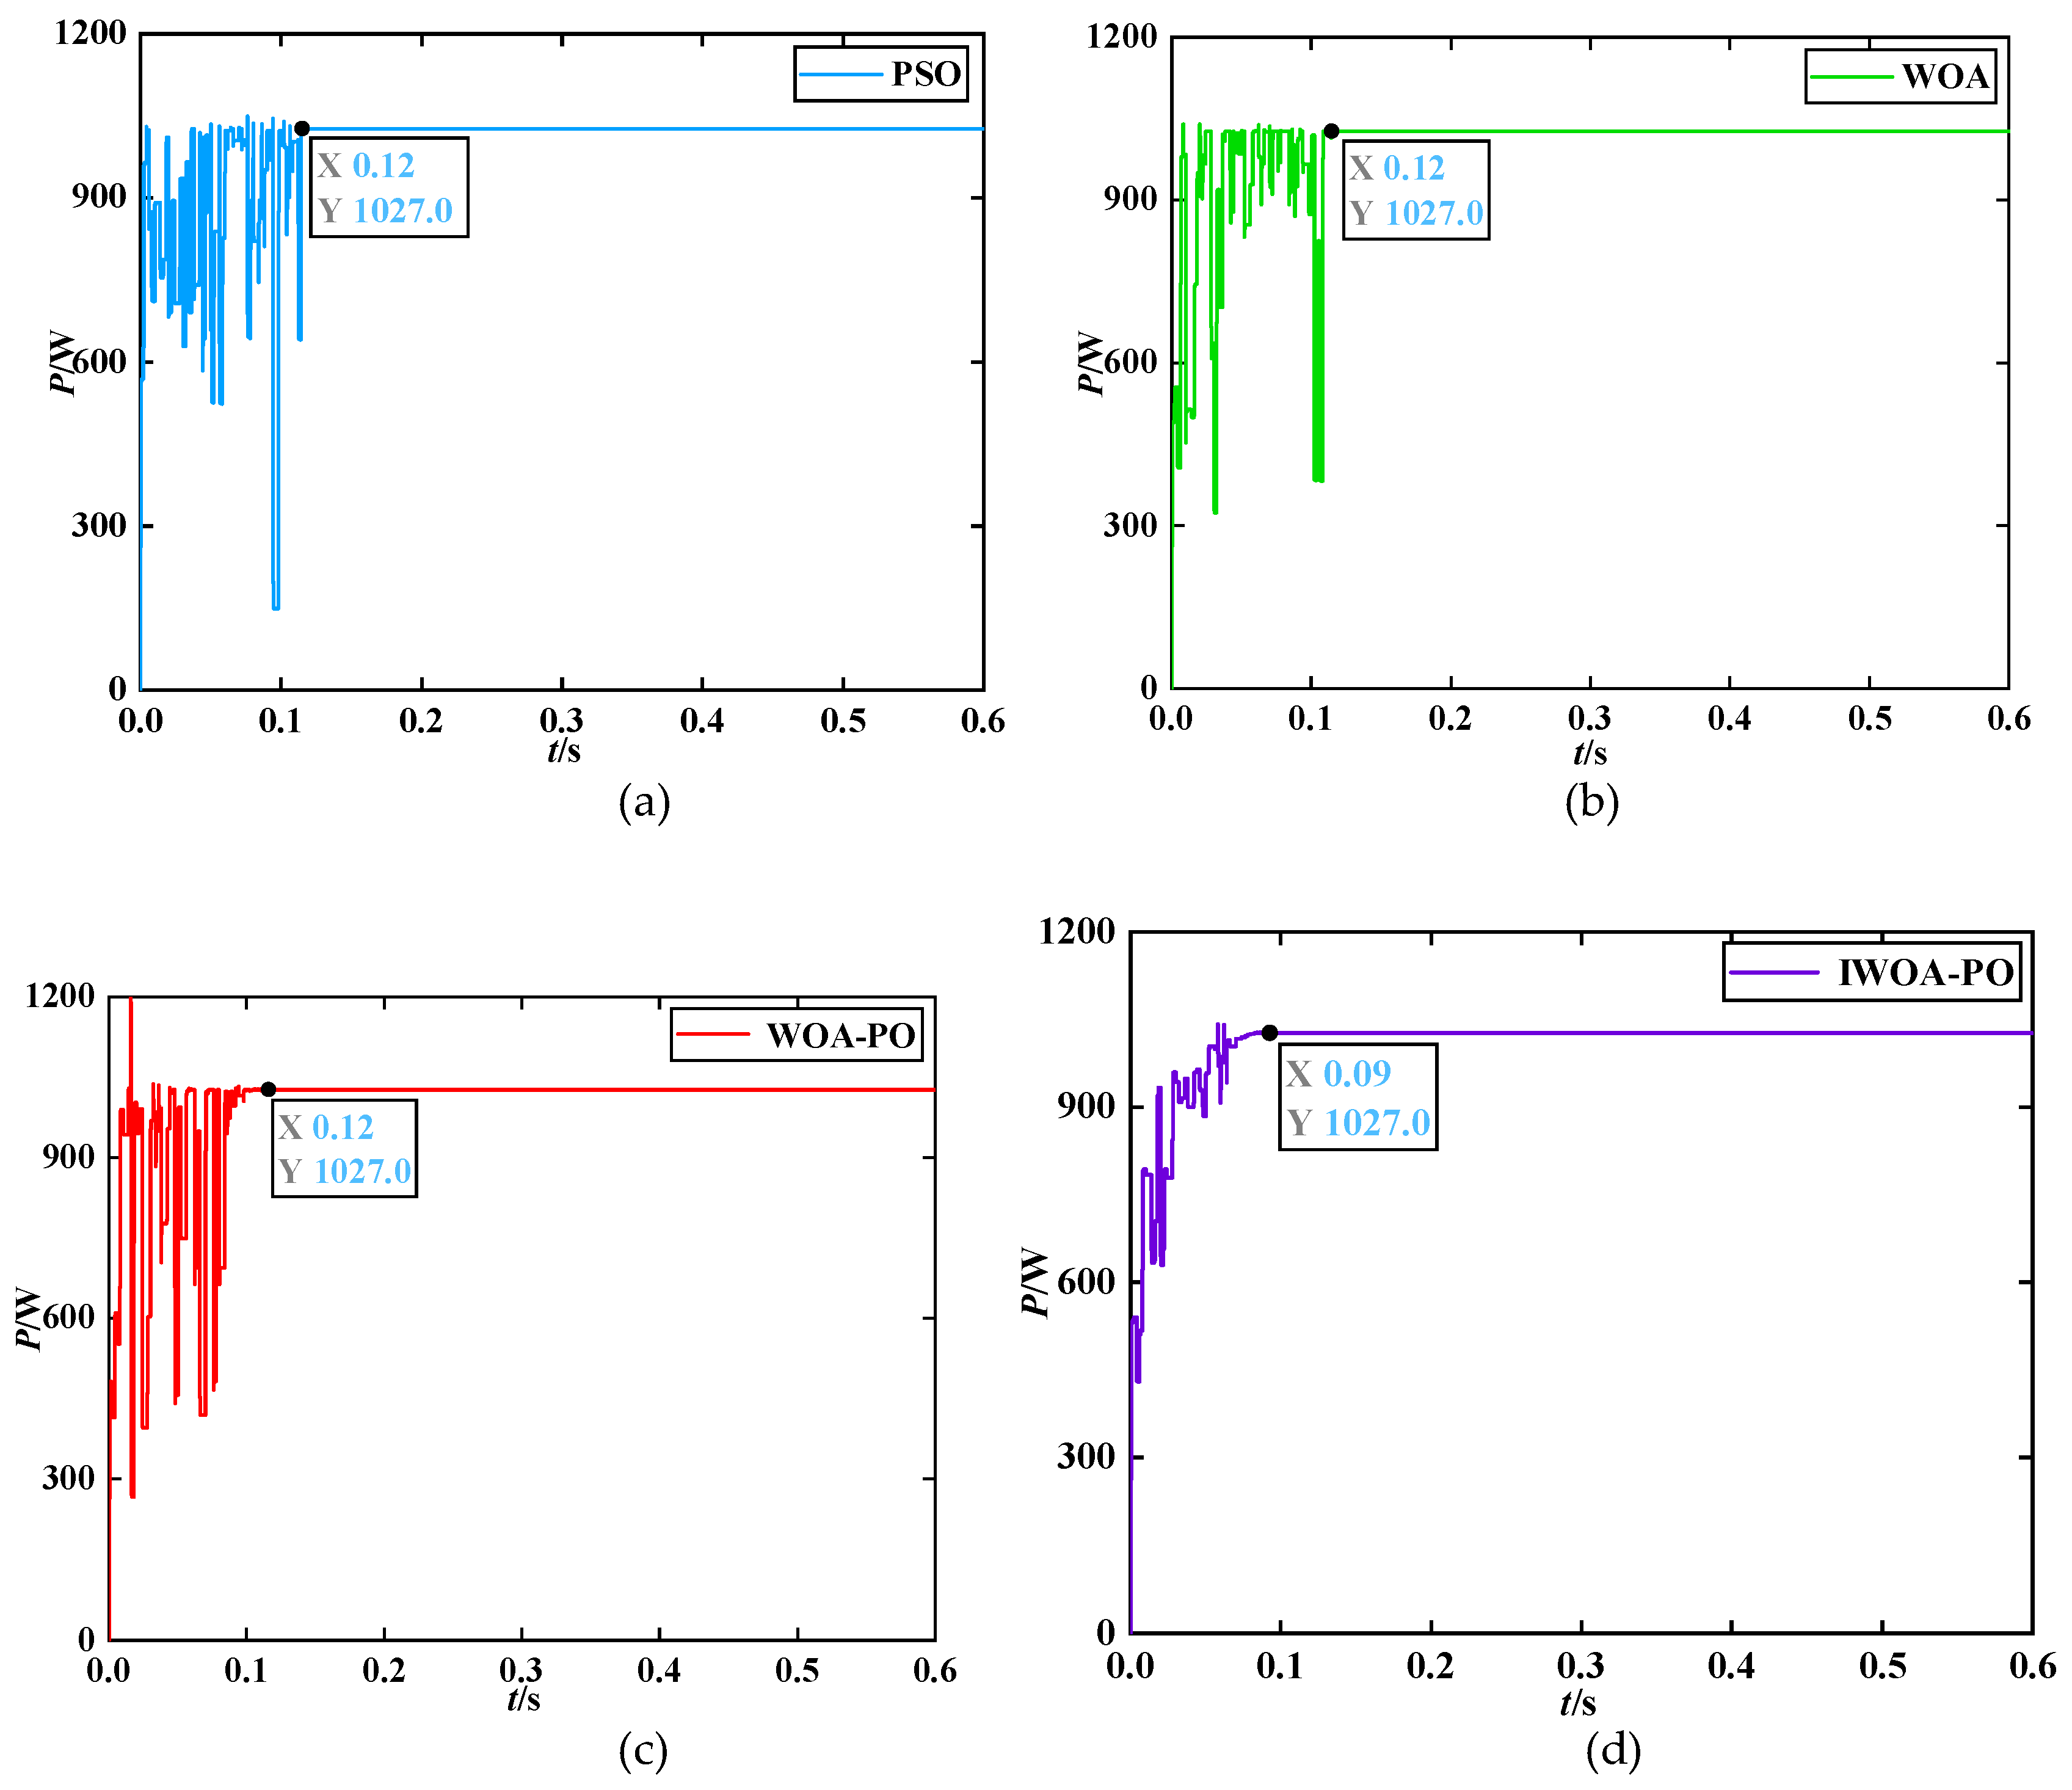
Figure 11.
Condition 3: Power tracking curves of each algorithm under static shading. (a) PSO algorithm; (b) WOA algorithm; (c) WOA-PO algorithm; (d) IWOA-PO algorithm.
Figure 11.
Condition 3: Power tracking curves of each algorithm under static shading. (a) PSO algorithm; (b) WOA algorithm; (c) WOA-PO algorithm; (d) IWOA-PO algorithm.
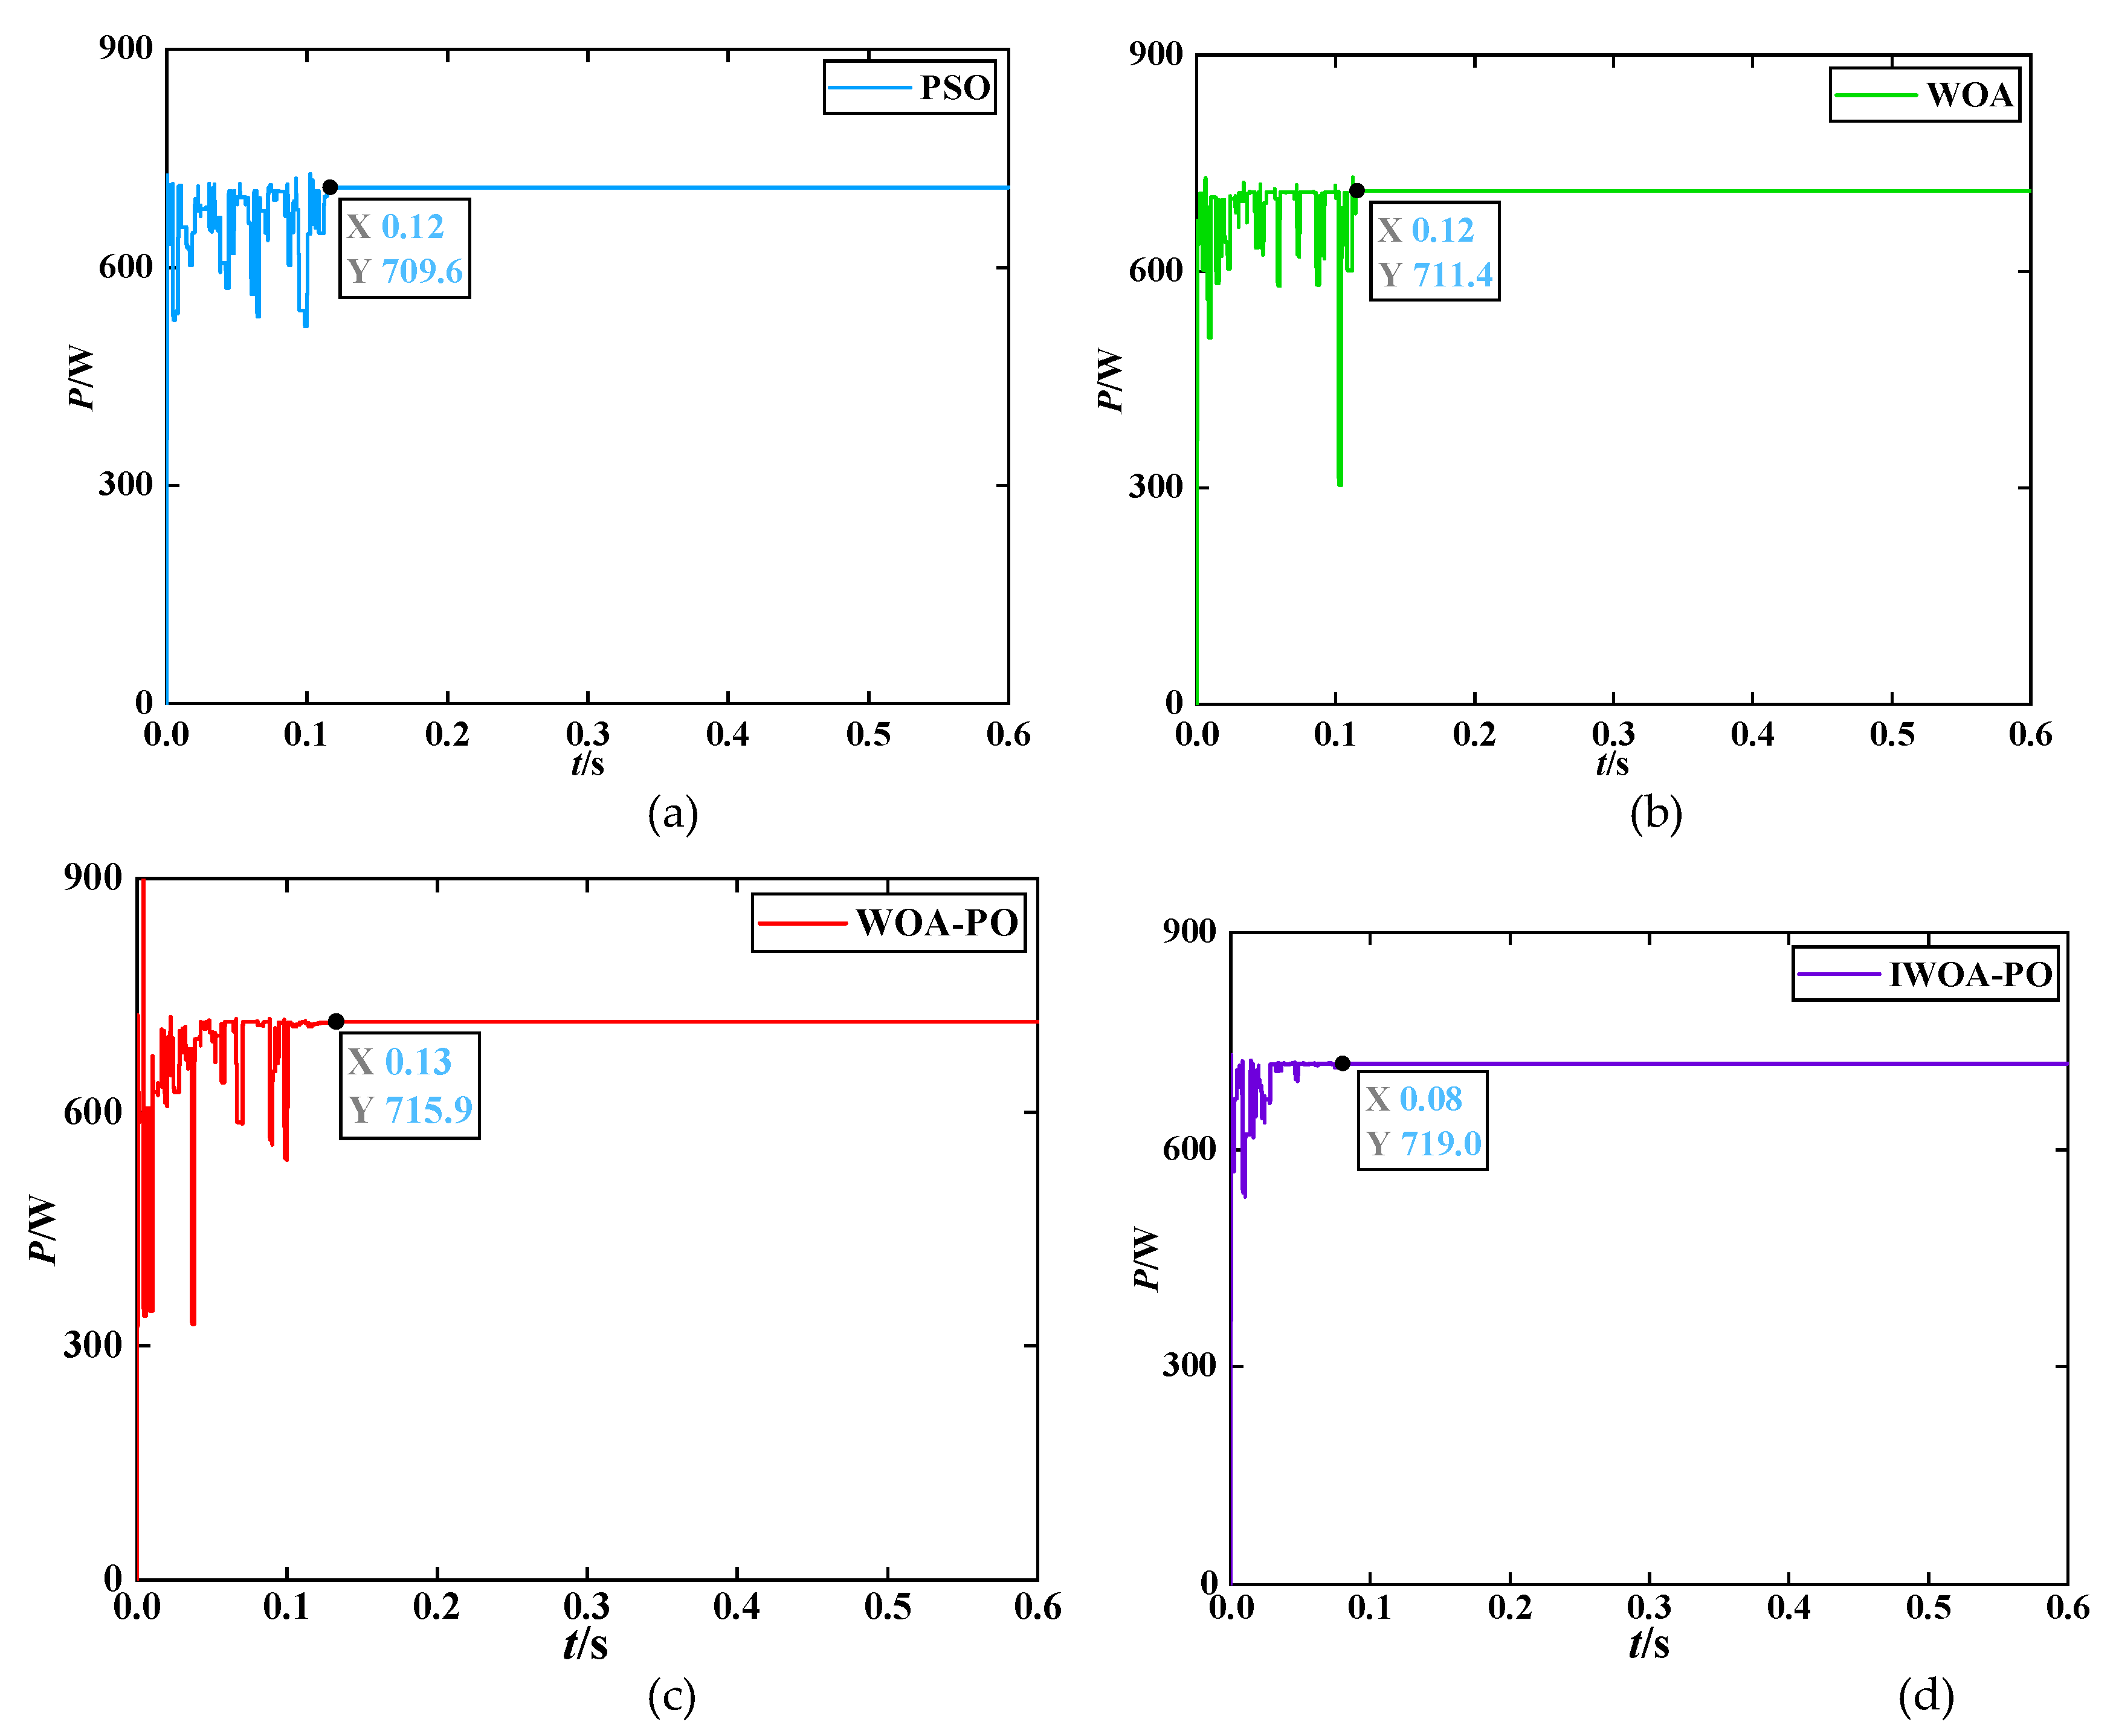
Figure 12.
Photovoltaic array environmental change conditions.
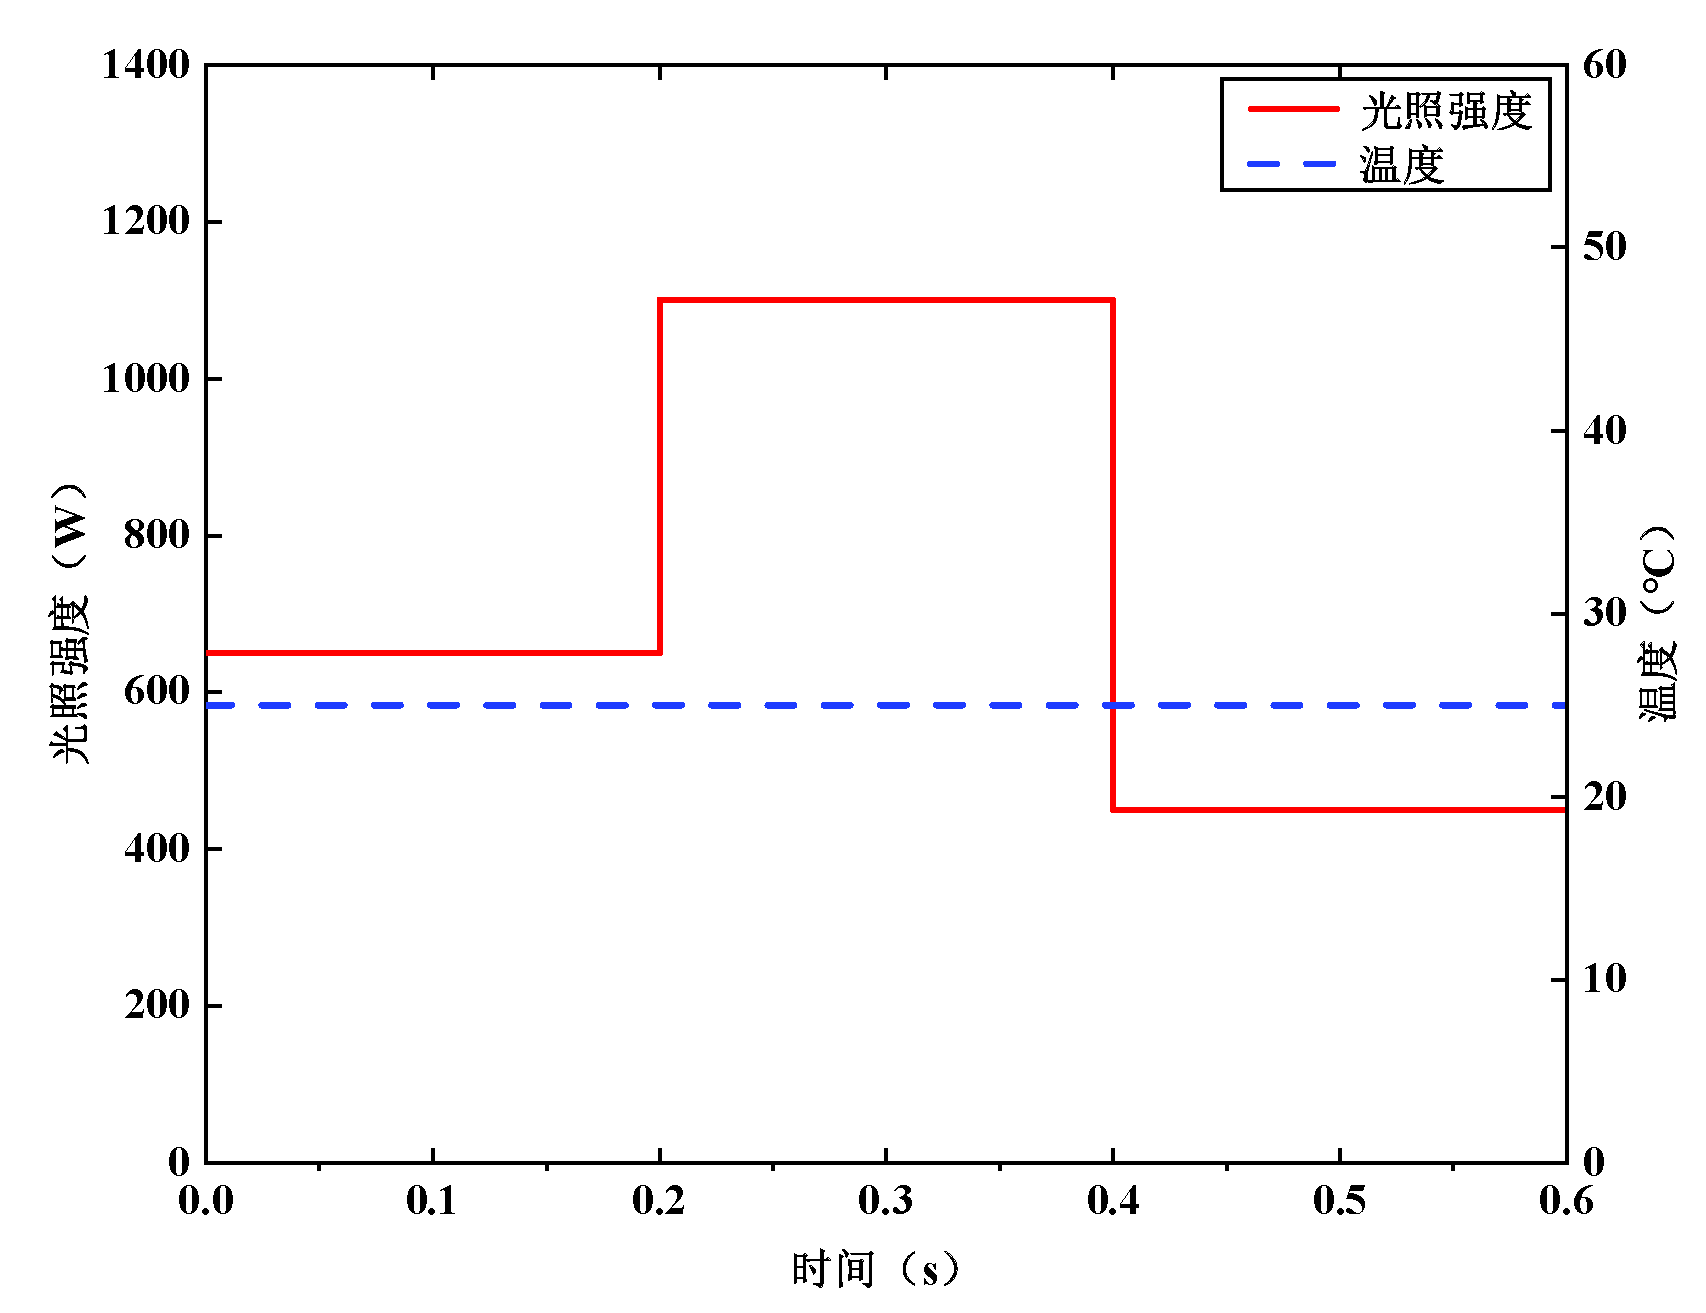
Figure 13.
Output characteristic curves under three lighting conditions. (a) I-V curve; (b) P-V curve.
Figure 13.
Output characteristic curves under three lighting conditions. (a) I-V curve; (b) P-V curve.
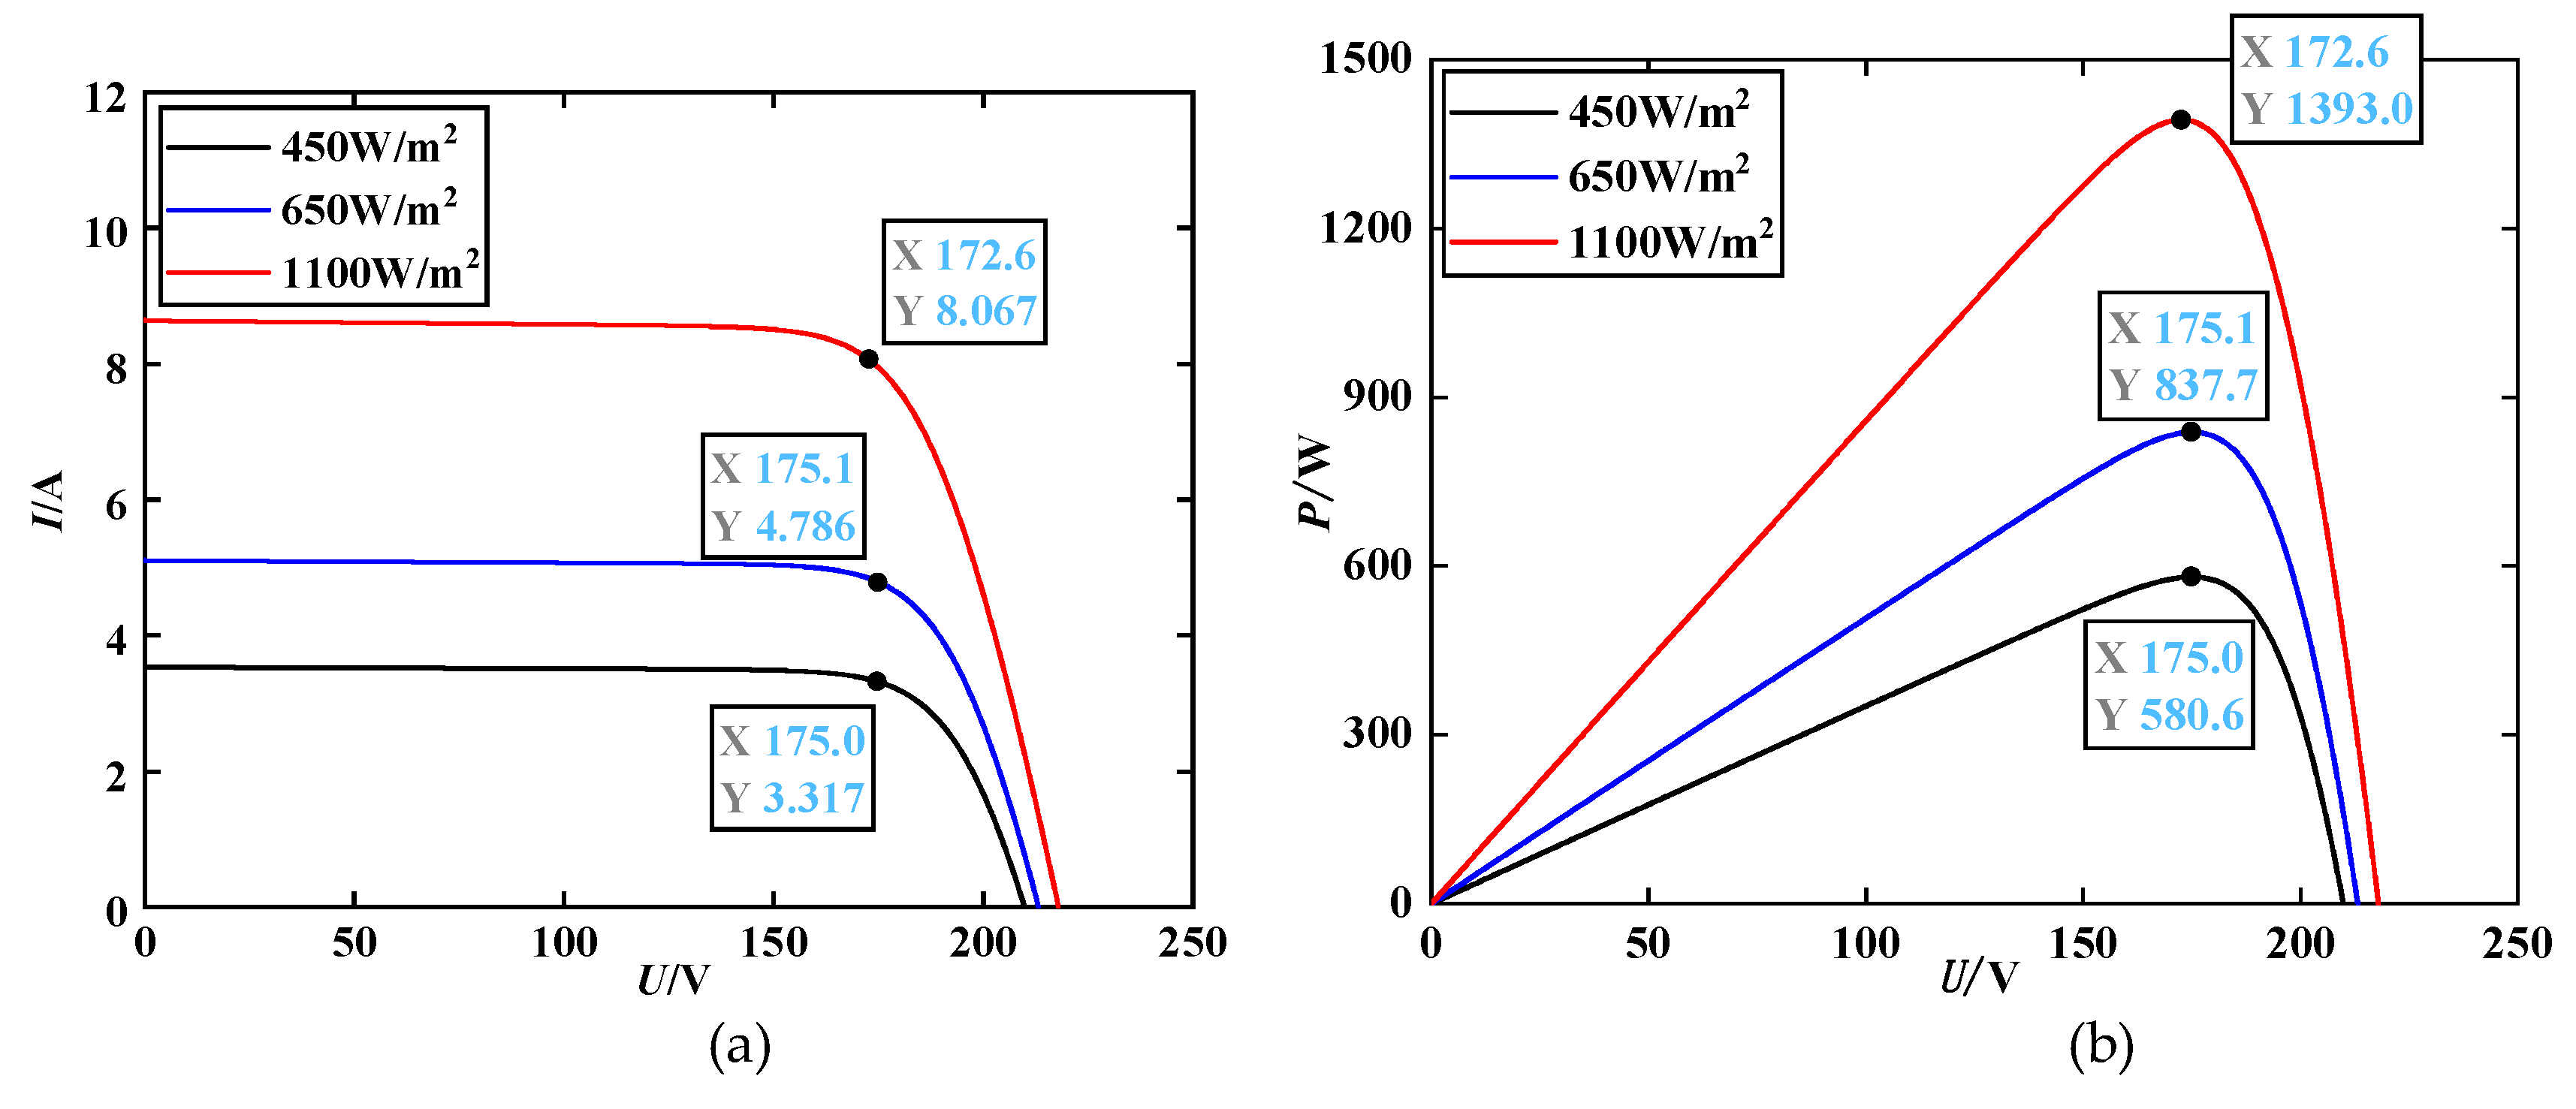
Figure 14.
Power tracking curves of various algorithms under sudden changes in irradiance. (a). PSO algorithm; (b) WOA algorithm; (c) WOA-PO algorithm; (d) IWOA-PO algorithm.
Figure 14.
Power tracking curves of various algorithms under sudden changes in irradiance. (a). PSO algorithm; (b) WOA algorithm; (c) WOA-PO algorithm; (d) IWOA-PO algorithm.
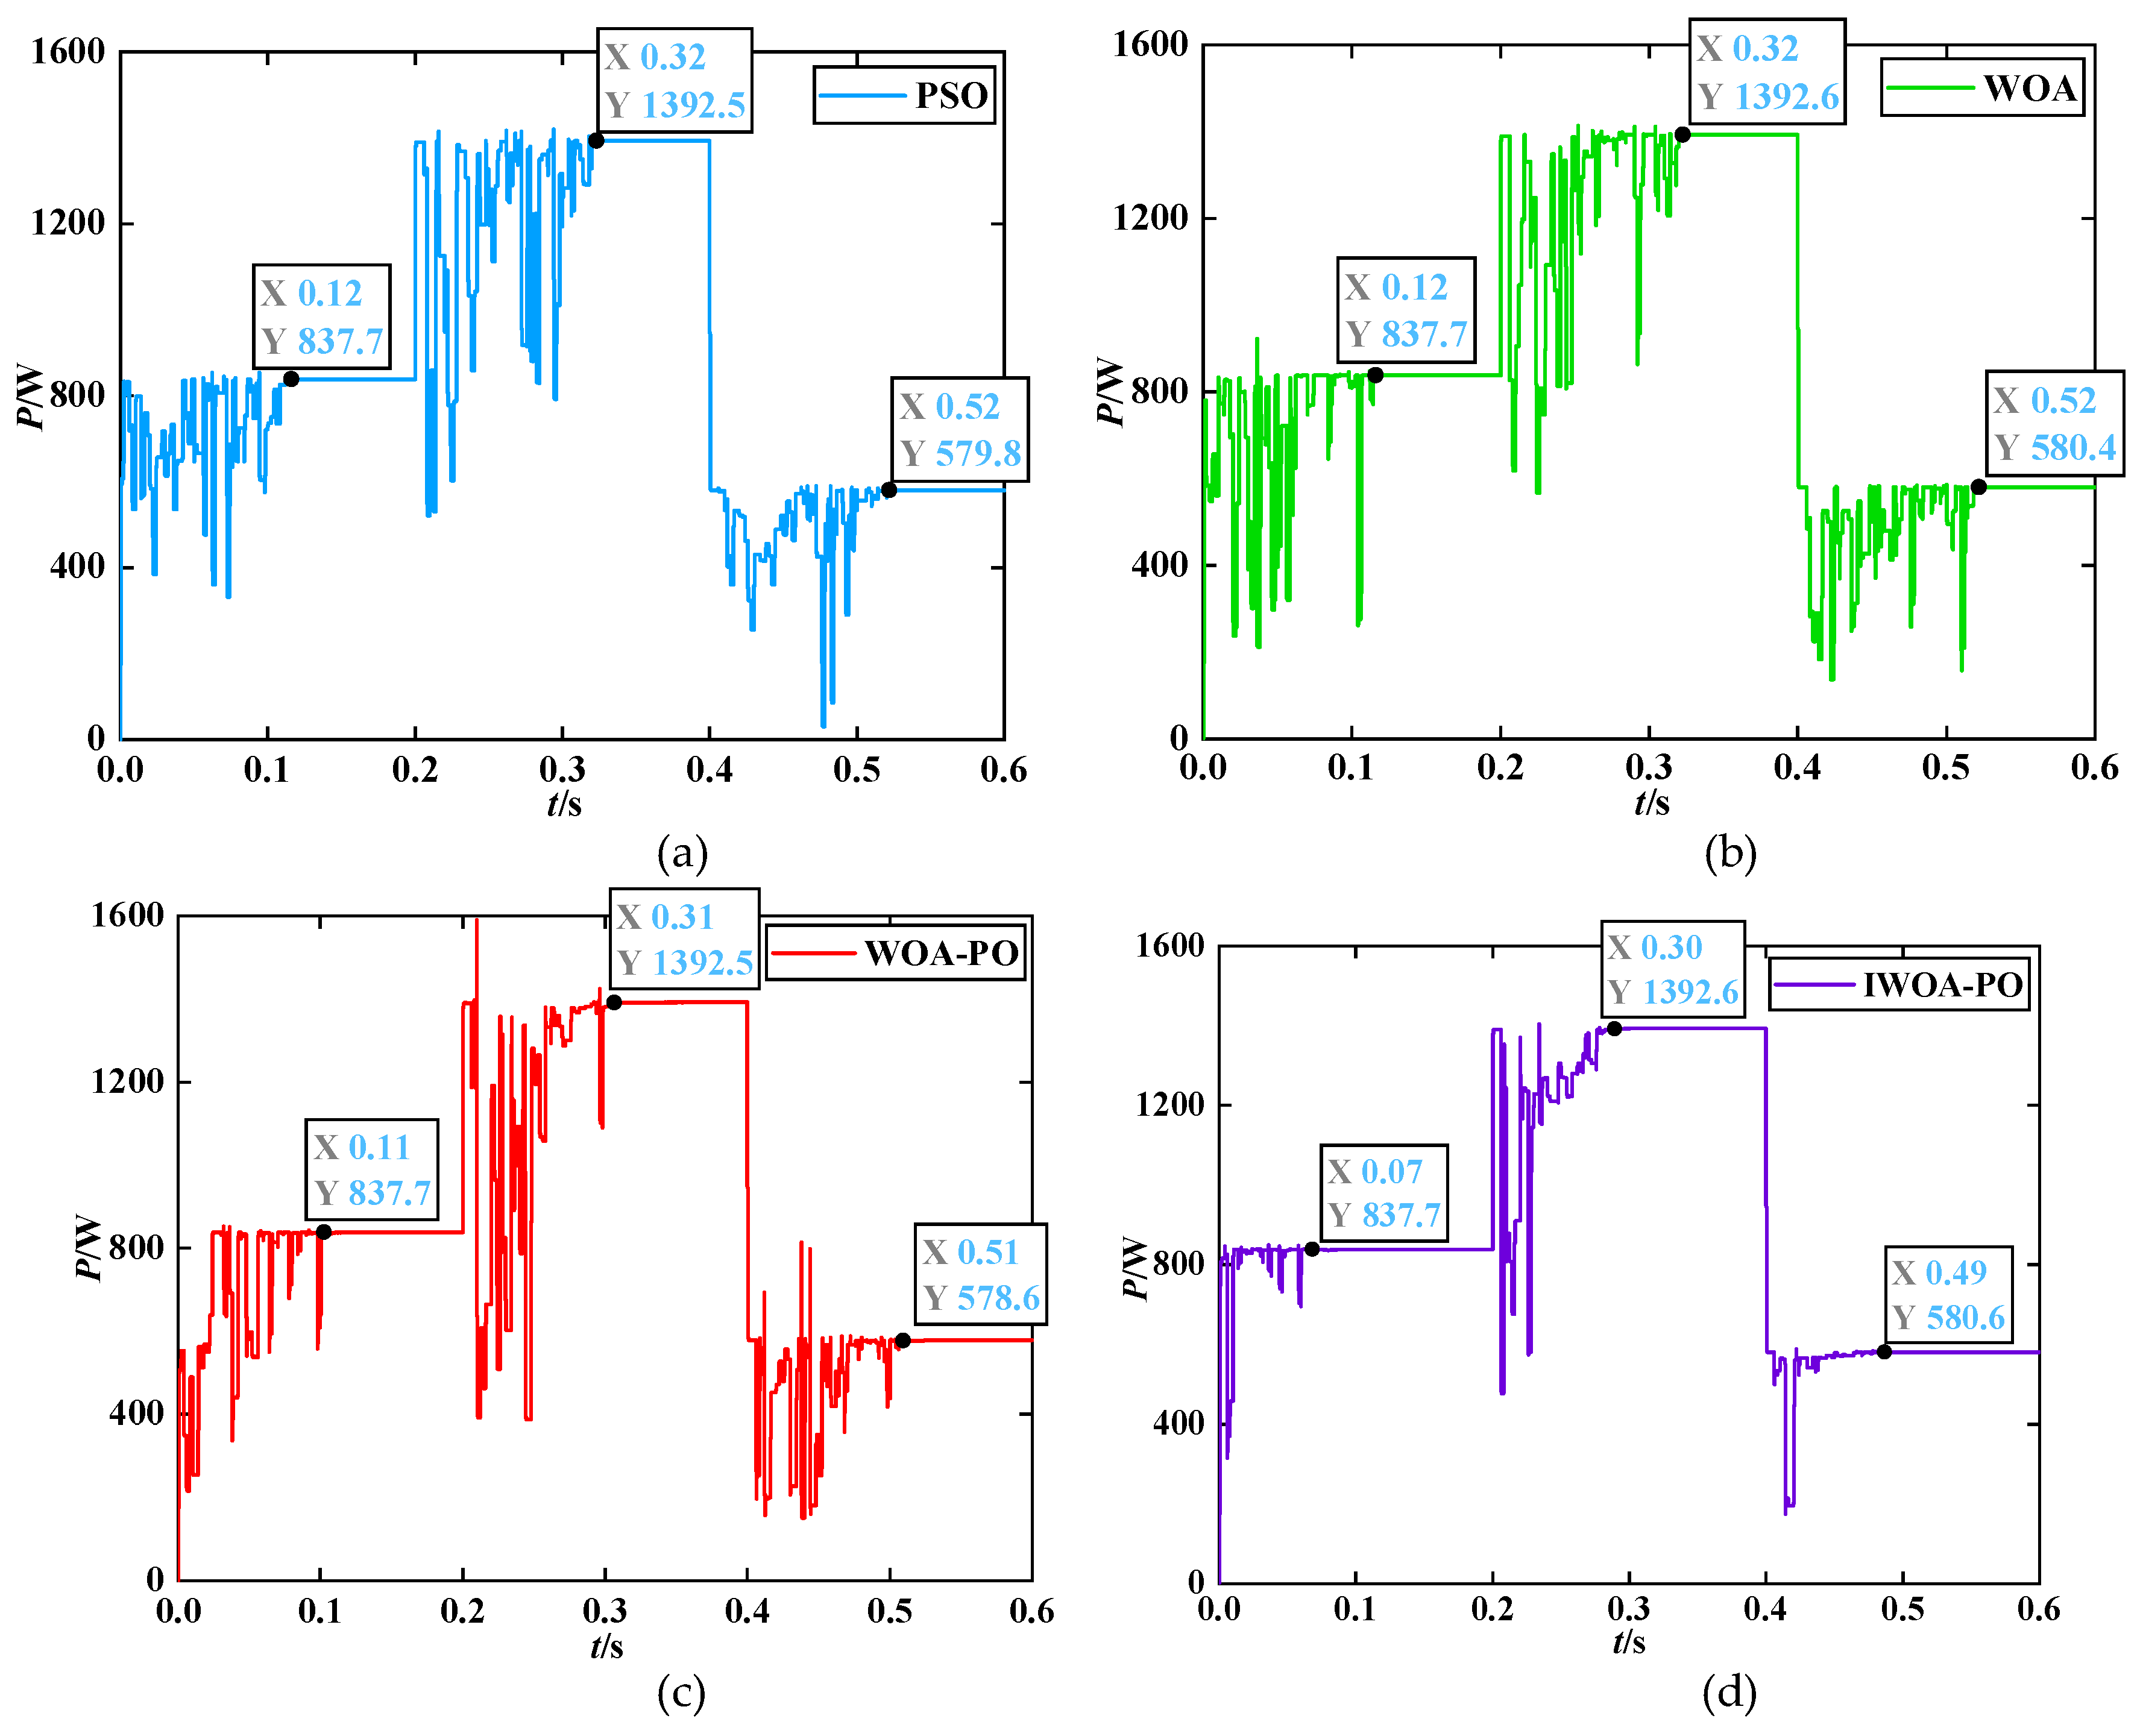
Figure 15.
Output characteristic curves for sudden changes in both irradiance and temperature. (a). I-V curve; (b) P-V curve.
Figure 15.
Output characteristic curves for sudden changes in both irradiance and temperature. (a). I-V curve; (b) P-V curve.
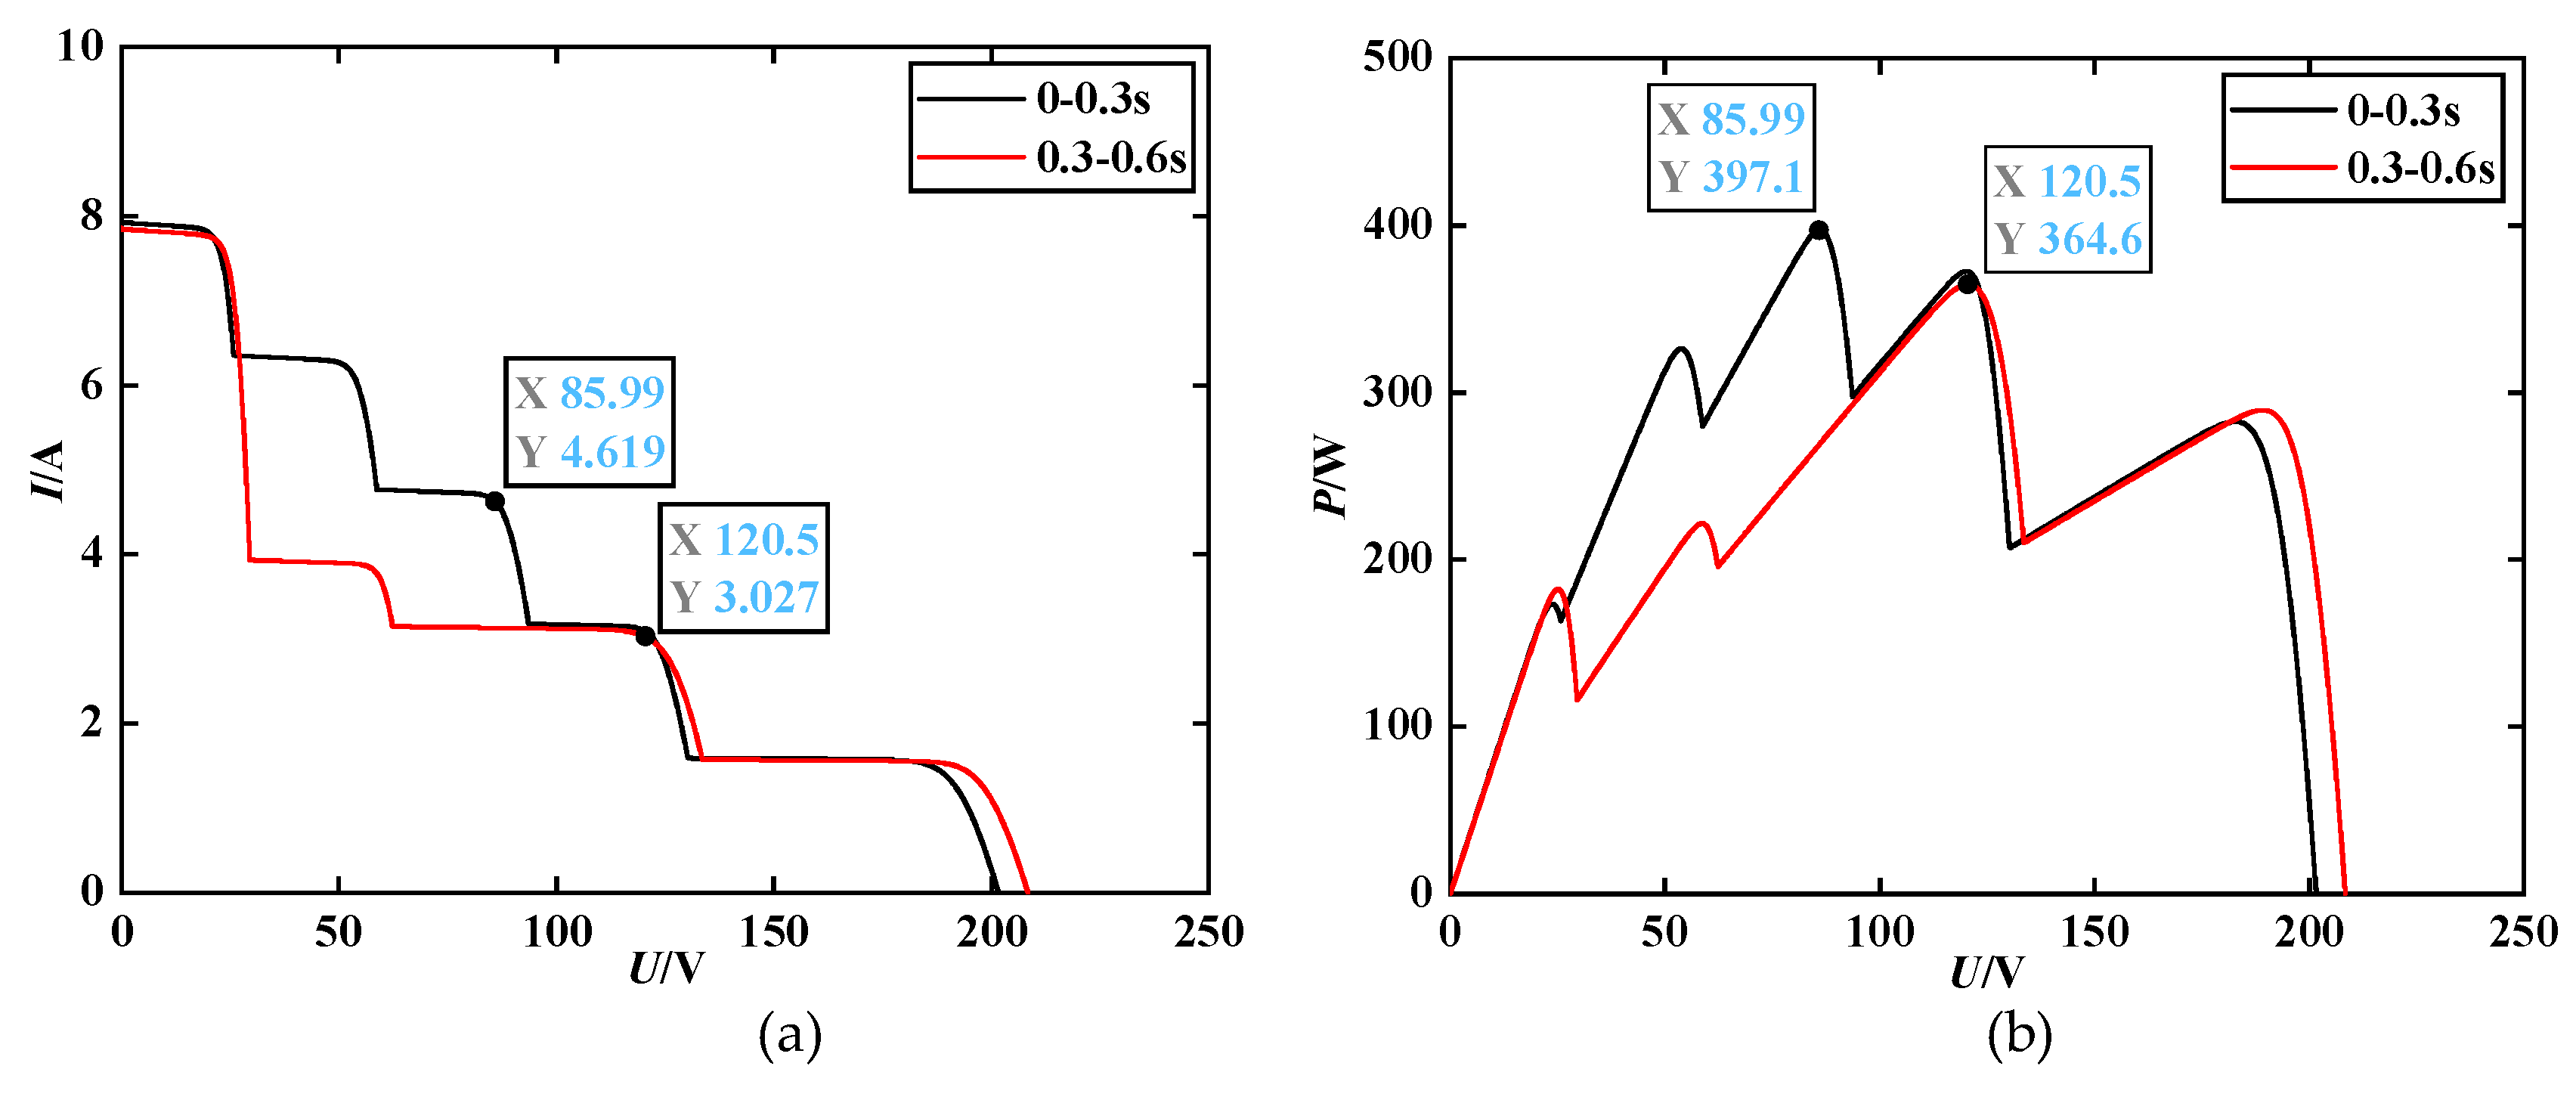
Figure 16.
Power tracking curves of each algorithm under sudden changes in both temperature and. irradiance. (a) PSO algorithm; (b) WOA algorithm; (c) WOA-PO algorithm; (d) IWOA-PO algorithm.
Figure 16.
Power tracking curves of each algorithm under sudden changes in both temperature and. irradiance. (a) PSO algorithm; (b) WOA algorithm; (c) WOA-PO algorithm; (d) IWOA-PO algorithm.
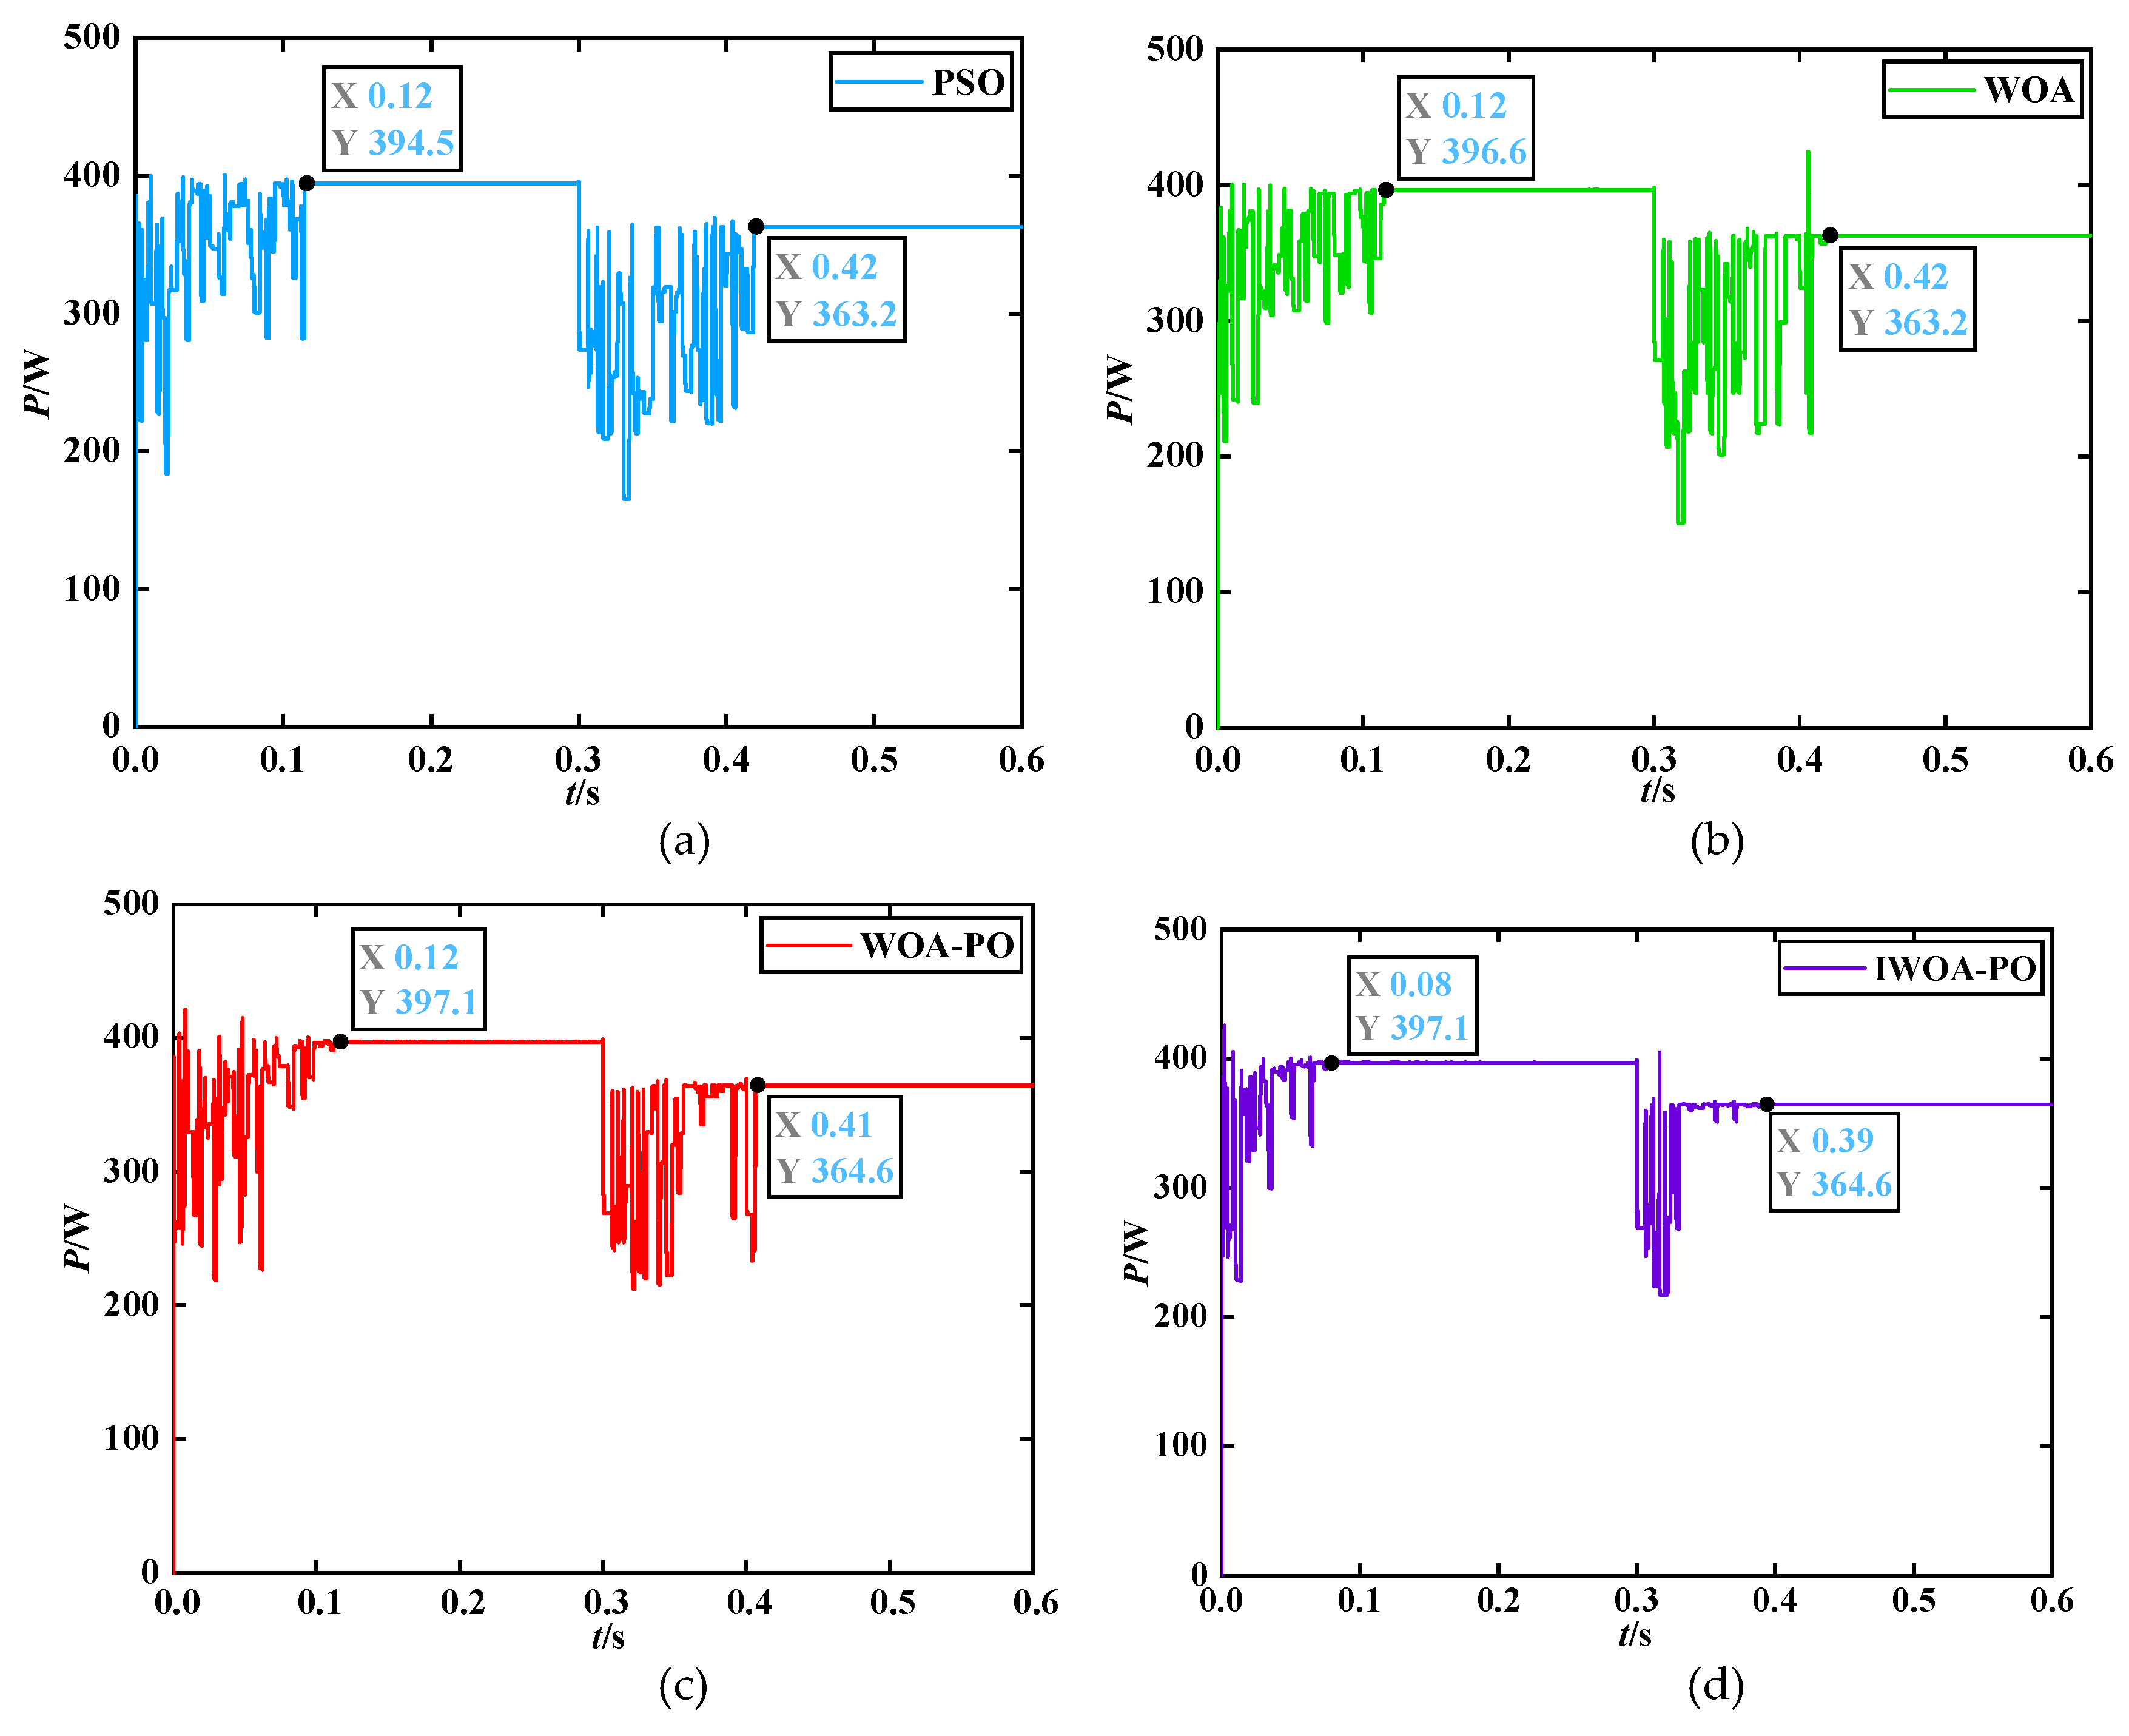
Figure 17.
Experimental platform.
Figure 18.
Experimental results. (a) PSO algorithm; (b) WOA algorithm; (c) WOA-PO algorithm; (d) IWOA-PO algorithm.
Figure 18.
Experimental results. (a) PSO algorithm; (b) WOA algorithm; (c) WOA-PO algorithm; (d) IWOA-PO algorithm.
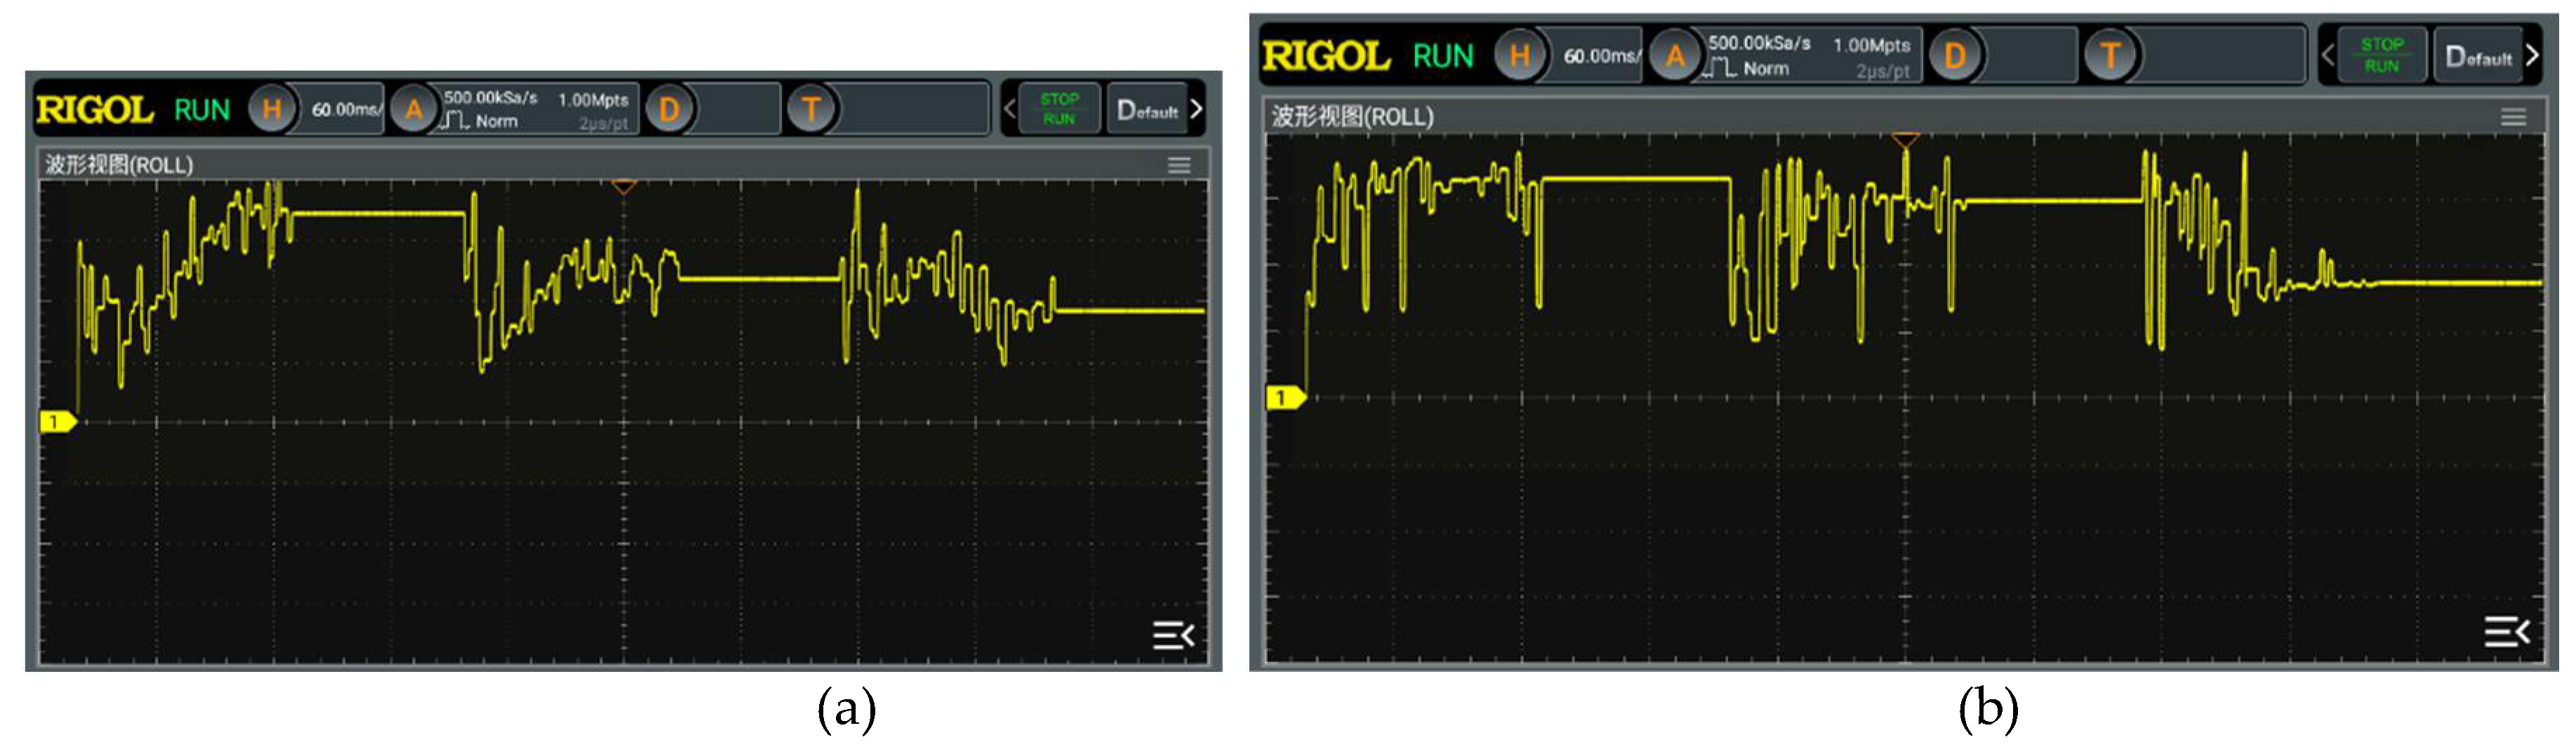
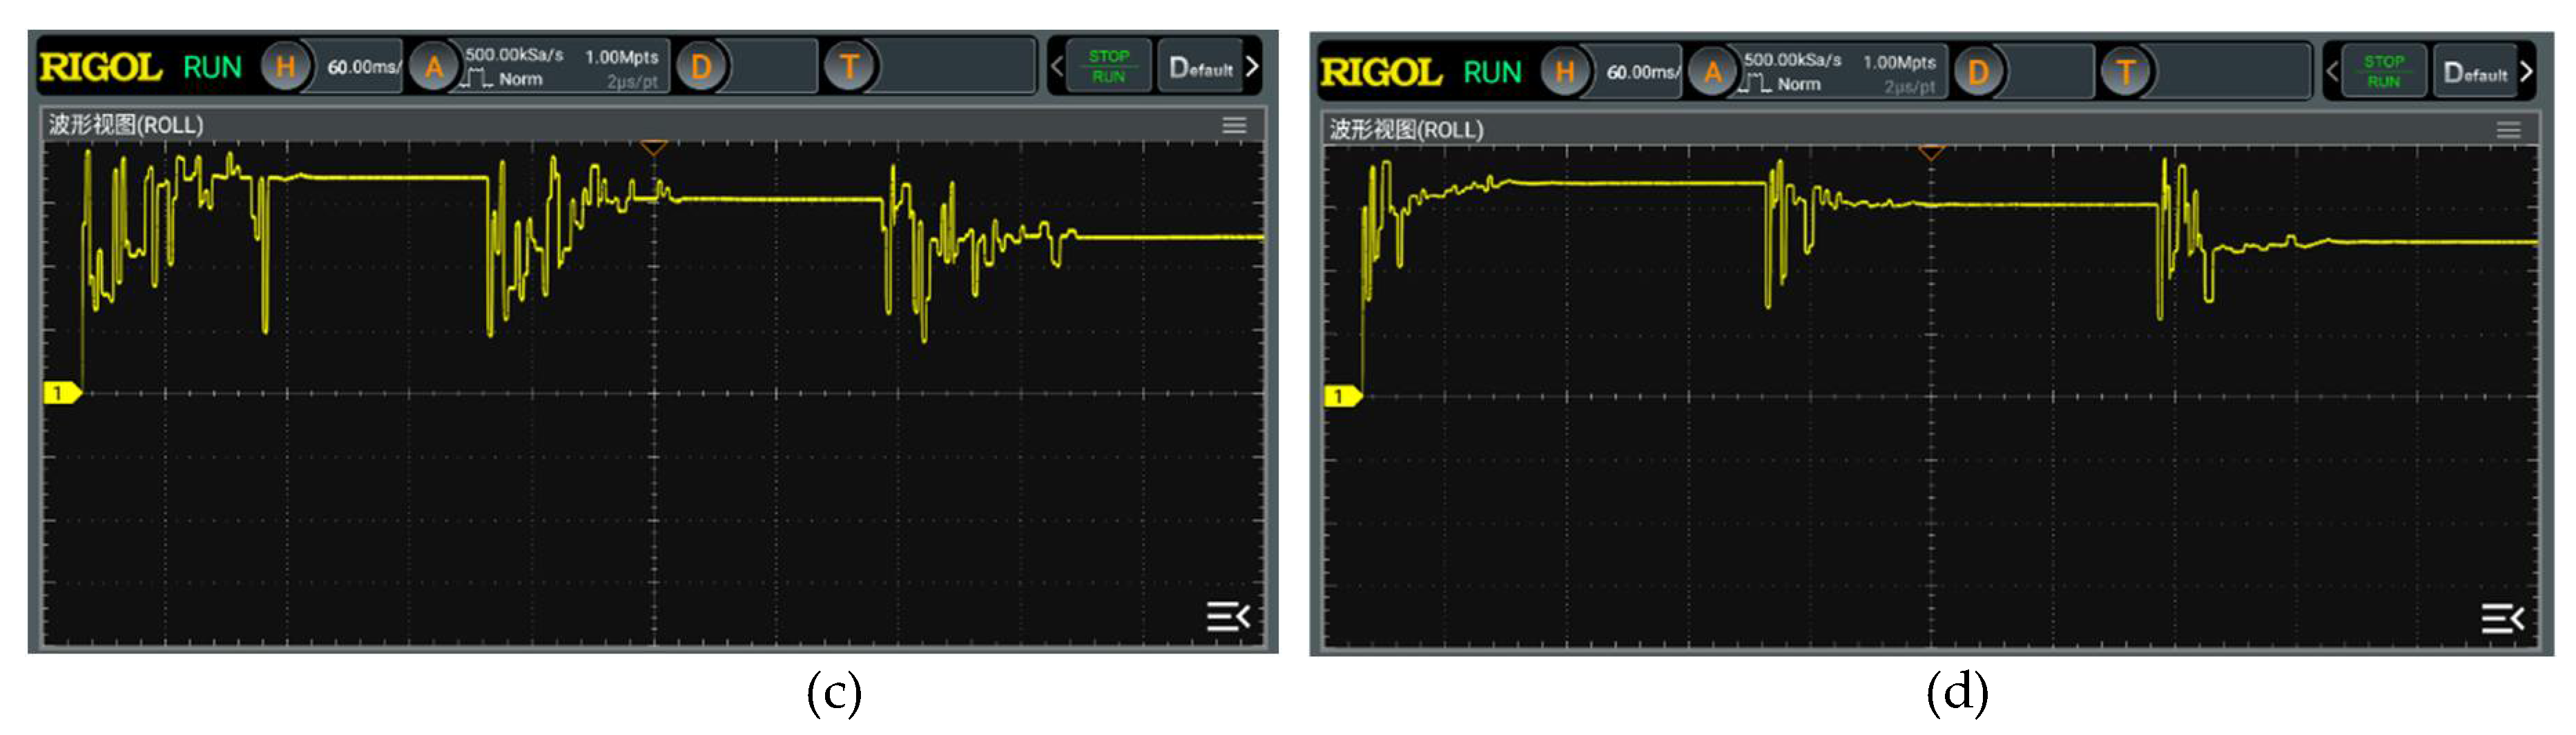

Table 1.
Setting value of each parameter of photovoltaic cell.
| Parameter | Specific value | |
| Temperature under conditions: Tref | 25 ℃ | |
| Irradiance under conditions: Sref | 1000 W/㎡ | |
| Correction factor a | 0.0025 /℃ | |
| Correction factor b | 0.5 | |
| Open-circuit voltage: Uoc | 36.3 V | |
| Short-Circuit Current: Isc | 7.84 A | |
| The voltage of MPP: Um | 29 V | |
| The current of MPP: Im | 7.35 A | |
Table 2.
Parameter setting for 3 operating conditions.
| Condition | #1 | #2 | #3 | #4 | #5 | #6 | ||||||
| S | T | S | T | S | T | S | T | S | T | S | T | |
| Condition 2 | 800 | 25 | 800 | 25 | 800 | 25 | 800 | 25 | 800 | 25 | 800 | 25 |
| Condition 3 | 1000 | 25 | 1000 | 25 | 800 | 25 | 800 | 25 | 600 | 25 | 400 | 25 |
| Condition 4 | 1000 | 25 | 800 | 25 | 600 | 25 | 400 | 25 | 200 | 25 | 200 | 25 |
Table 3.
Performance comparison of algorithms.
| Example | Statistics | Units | PSO | WOA | WOA-PO | IWOA-PO |
| Uniform irradiance | Theoretical | W | 1027 | 1027 | 1027 | 1027 |
| track time | s | 0.12 | 0.12 | 0.12 | 0.09 | |
| Optimization value | W | 1027 | 1027 | 1027 | 1027 | |
| Tracking accuracy | % | 100 | 100 | 100 | 100 | |
| oscillation state | / | big | big | big | small | |
| Static local shading(Condition 3) | Theoretical | W | 719.1 | 719.1 | 719.1 | 719.1 |
| track time | s | 0.12 | 0.12 | 0.11 | 0.10 | |
| Optimization value | W | 717.0 | 718.2 | 719.1 | 719.1 | |
| Tracking accuracy | % | 98.70 | 98.87 | 100 | 100 | |
| oscillation state | / | big | big | big | small | |
| Static local shading(Condition 4) | Theoretical | W | 412.7 | 412.7 | 412.7 | 412.7 |
| track time | s | 0.11 | 0.12 | 0.12 | 0.09 | |
| Optimization value | W | 410.8 | 411.7 | 412.7 | 412.7 | |
| Tracking accuracy | % | 99.54 | 99.76 | 100 | 100 | |
| oscillation state | / | big | big | big | small | |
| sudden changes in irradiance | Theoretical | W | 837.7/1393/580.6 | 837.7/1393/580.6 | 837.7/1393/580.6 | 837.7/1393/580.6 |
| track time | s | 0.12/0.12/0.12 | 0.12/0.12/0.12 | 0.11/0.11/0.11 | 0.07/0.1/0.09 | |
| Optimization value | W | 837.7/1392.5/579.8 | 837.7/1392.6/580.4 | 837.7/1392.5/578.6 | 837.7/1392.6/580.6 | |
| Tracking accuracy | % | 100/99.96/99.86 | 100/99.97/99.97 | 100/99.96/99.66 | 100/99.97/100 | |
| oscillation state | / | big | big | big | small | |
| sudden changes in both temperature and irradiance | Theoretical | W | 397.1/364.6 | 397.1/364.6 | 397.1/364.6 | 397.1/364.6 |
| track time | s | 0.12/0.12 | 0.12/0.12 | 0.12/0.11 | 0.08/0.09 | |
| Optimization value | W | 394.5/363.2 | 396.6/363.2 | 397.1/364.6 | 397.1/364.6 | |
| Tracking accuracy | % | 99.35/99.62 | 99.87/99.62 | 100/100 | 100/100 | |
| oscillation state | / | big | big | big | small |
Table 4.
Output voltage values for 3 conditions.
| Condition | voltage |
| Condition 1 | 173.3 V |
| Condition 3 | 155.8 V |
| Condition 4 | 90.17 V |
Disclaimer/Publisher’s Note: The statements, opinions and data contained in all publications are solely those of the individual author(s) and contributor(s) and not of MDPI and/or the editor(s). MDPI and/or the editor(s) disclaim responsibility for any injury to people or property resulting from any ideas, methods, instructions or products referred to in the content. |
© 2024 by the authors. Licensee MDPI, Basel, Switzerland. This article is an open access article distributed under the terms and conditions of the Creative Commons Attribution (CC BY) license (http://creativecommons.org/licenses/by/4.0/).
Copyright: This open access article is published under a Creative Commons CC BY 4.0 license, which permit the free download, distribution, and reuse, provided that the author and preprint are cited in any reuse.


