

Submitted:
24 October 2023
Posted:
25 October 2023
You are already at the latest version
Abstract
Iron (Fe) deficiency specifically is the most common nutritional disorder due to insufficient absorbable Fe. Biofortification is a process of enriching the nutrient content of staple crops and is considered as a sustainable and cost-effective strategy to address micronutrient deficiency problems especially in the less developed countries. Chickpea (Cicer arietinum L.) is a staple food in many developing countries worldwide and is an excellent source of micronutrients. Biofortification of chickpea is a possible solution to address Fe deficiency problem. Chickpea biofortification experiment was conducted under field conditions to evaluate the effects of different doses of Fe fertilizer (0 kg ha-1,10 kg ha-1 and 30 kg ha-1 of Fe-EDDHA) on Fe content in seeds of 18 chickpea cultivars. The experiment was designed as a factorial combination of 18 chickpea cultivars and 3 different doses in a randomized complete block design with 4 replications at two locations in Saskatchewan in 2015 and 2016. Fe concentration in seeds across 18 different chickpea cultivars increased with Fe fertilization. Fe concentration in X05TH20-2 and CDC Frontier cultivars increased from 57 ppm to 59 ppm and 56 ppm to 58 ppm, respectively, after adding Fe fertilizer in both location in 2015 and 2016.
Keywords:
biofortification
; chickpea
; iron deficiency
; Fe-EDDHA
; fertilization
1. Introduction
Fe is a key micronutrient for most living organisms to conduct ubiquitous metabolic processes involving electron transfer. Examples of such metabolic processes include DNA synthesis, oxygen transport, cellular respiration, and photosynthesis. Moreover, Fe is vital as a co-factor in numerous heme-complexes, for example, hemoglobin, catalase and DNA helicases [1,2,3]. Although Fe in many arable lands is relatively abundant (range concentrations of 20-40 g kg-1), the low amount of the available form has resulted in Fe deficiency that limits plant growth [4]. Since Fe is highly reactive to oxygen, formation of insoluble oxidized Fe (III) restricts Fe uptake by roots especially in high pH and high HCO3- calcareous soils. In high pH and well aerated soils, the total conc. of Fe in soil solution was around 10-10 M, which is 10-4 - 10-5 folds less than the required amount for optimum plant growth [5,6]. In terms of Fe uptake from soil, plants are divided into two categories: Strategy I in nongraminaceous plants and Strategy II in graminaceous plants [6]. Strategy I plant species acquires Fe after the reduction of Fe (III) chelates at the root surface followed by absorption of Fe (II) ions throughout the plasma membrane [7]. Since one-third of the world’s arable land is too alkaline for optimum plants growth, many studies have focused on how plants acclimatized with Fe deficiency [8]. In addition, limited uptake of Fe was mostly observed in Strategy I plant species that depend on ferric reductase for transferring Fe [9,3]. Consequently, this condition decreased plant productivity and led to low quality including low Fe content in seeds that ultimately result in public health problem. Fe in plant-based diets is a non-heme Fe that is less bioavailable than heme Fe. As such, the prevalence of Fe deficiency induced anemia often occurred in populations where total calorie intake came from monotonous plant-based diets [1].
Biofortification is a long-term food-based approach to alleviate micronutrient deficiency. It is a strategy of producing staple food crops with increasing concentration of bioavailable micronutrients in the edible parts, that is considered more sustainable and economical [10,11]. To increase bioavailable Fe in seeds, Fe biofortification strategy can be implemented that includes agronomy, plant breeding and genetic engineering approaches [12]. Agronomic approach could be a rapid solution to boost Fe content in plants. Furthermore, agronomic biofortification can be integrated with other breeding-based biofortification methods [13]. Agronomic biofortification, which is also known as ferti-fortification, involves the use of fertilizer either to soil and/or to foliage to increase the bioavailability of nutrients in edible parts of plant [14,15]. Adding micronutrients in soil is a functional strategy to enhance nutritional status in plant [16,17,18]. However, there are several factors that control the increase of bioavailable nutrient into seeds. For example, source of fertilizer, time and application method of fertilizer, and quantity of fertilizer [19,20]. As Fe can be rapidly converted into unavailable form when it is applied to high pH soil, the application of inorganic fertilizer such as ferrous sulphate (FeSO4) could be ineffective [3]. Synthetic Fe chelates, in which Fe is combined with an organic chemical to form a chelate makes the Fe in a form accessible to plants. Moreover, Fe-chelates is soluble for a longer period than inorganic Fe. In this context, the application of chelated Fe fertilizers, for example, Fe-DTPA, Fe-EDTA and Fe-EDDHA can be effective in high pH soils. Among the three, Fe-EDDHA is the most effective Fe fertilizer than others [21].
Chickpea (Cicer arietinum L.) is a staple food crop in many African and Asian countries where the incidence of Fe deficiency is common [1,22,23] . Based on global production, chickpea is the second most important pulse after common bean [24]. Globally, chickpea production has increased gradually mostly (96%) in developing countries [24]. Like production, the highest chickpea consumption rate occurred in the South Asia and Middle East-North Africa at 4.25 kg person-1 and 2.11 kg person-1 year-1, respectively [25]. The growth of chickpea consumption has also increased in developed countries. In USA, the consumption of chickpea has increased almost double from 199.6 g in 2010 to 322.1 g per person per year in 2014 [26]. Chickpea is consumed in a variety of ways, for example, green pods, immature seeds and young leaves as vegetables, whereas as the primary commodity, chickpea is consumed as dried mature seeds, as whole, hulled or flour form [27,28]. Nutritionally chickpea is a rich source of protein (20-22%) along with micronutrients including Fe (3.0-14.3 mg 100 g-1) [29,30]. Therefore, Fe biofortification of chickpea to produce seeds with increased Fe concentration can mitigate Fe deficiency in populations with poor Fe intake [22]. Several studies have reported that agronomic approach could result in higher micronutrients in edible parts of different crops. Examples of successful agronomic biofortification include zinc (Zn) fertilizer to wheat and selenium (Se) to maize [31,32]. Moreover, in chickpea, soil application of Zn fertilizer increased grain Zn content and Zn yield compared to control [33]. In addition, foliar application of Zn and Fe fertilizer also increased grain Zn yield in chickpea and leaves, stems and grains Fe content in mung bean [33,34]. Foliar application of Se fertilizer increased Se concentration in pea and common bean seeds [35,36]. In addition, Fe and Zn concentration in grain of cowpea increased after applying Zn-EDTA in potting compost [37]. Combined application of Zn-DTPA and ZnSO4 also increased Fe and Zn content in bean using hydroponic system [38]. Fe biofortification in cowpea also showed that combined application of ferrous sulfate and ferrous chelate in potting compost increased Fe content of cowpea seeds compared to control [39]. In terms of bioavailability, several authors reported that Zn and Se fertilization increased their bioavailability in human diets [40,41,42].
To date, there is no report on the agronomic approach for Fe biofortification in chickpea. Given the importance of soil-Fe concentration, soil pH and HCO3- level, we hypothesised that the application of Fe fertilizer through soil increased Fe concentration in seeds. The main objectives of this study were: 1) to evaluate the effects of soil applied Fe fertilizer on Fe concentration in the seeds; and 2) to find out correlation between the Fe concentration and yield and correlation between the Fe concentration and Fe yield.
2. Materials and Methods
2.1. Description of Location and Year
The study was conducted at two locations, Elrose and Moose Jaw of Saskatchewan, Canada during the growing seasons from May to September in 2015 and 2016. The geographical coordinates of Elrose and Moose Jaw are 51.2006° N, 108.0329° W and 50.3916° N, 105.5349° W, respectively. The soil texture at both locations is clay loam to clay. The soil climatic zone of Elrose and Moose Jaw are dark brown and brown soil zones, respectively
2.2. Soil Sample Analysis
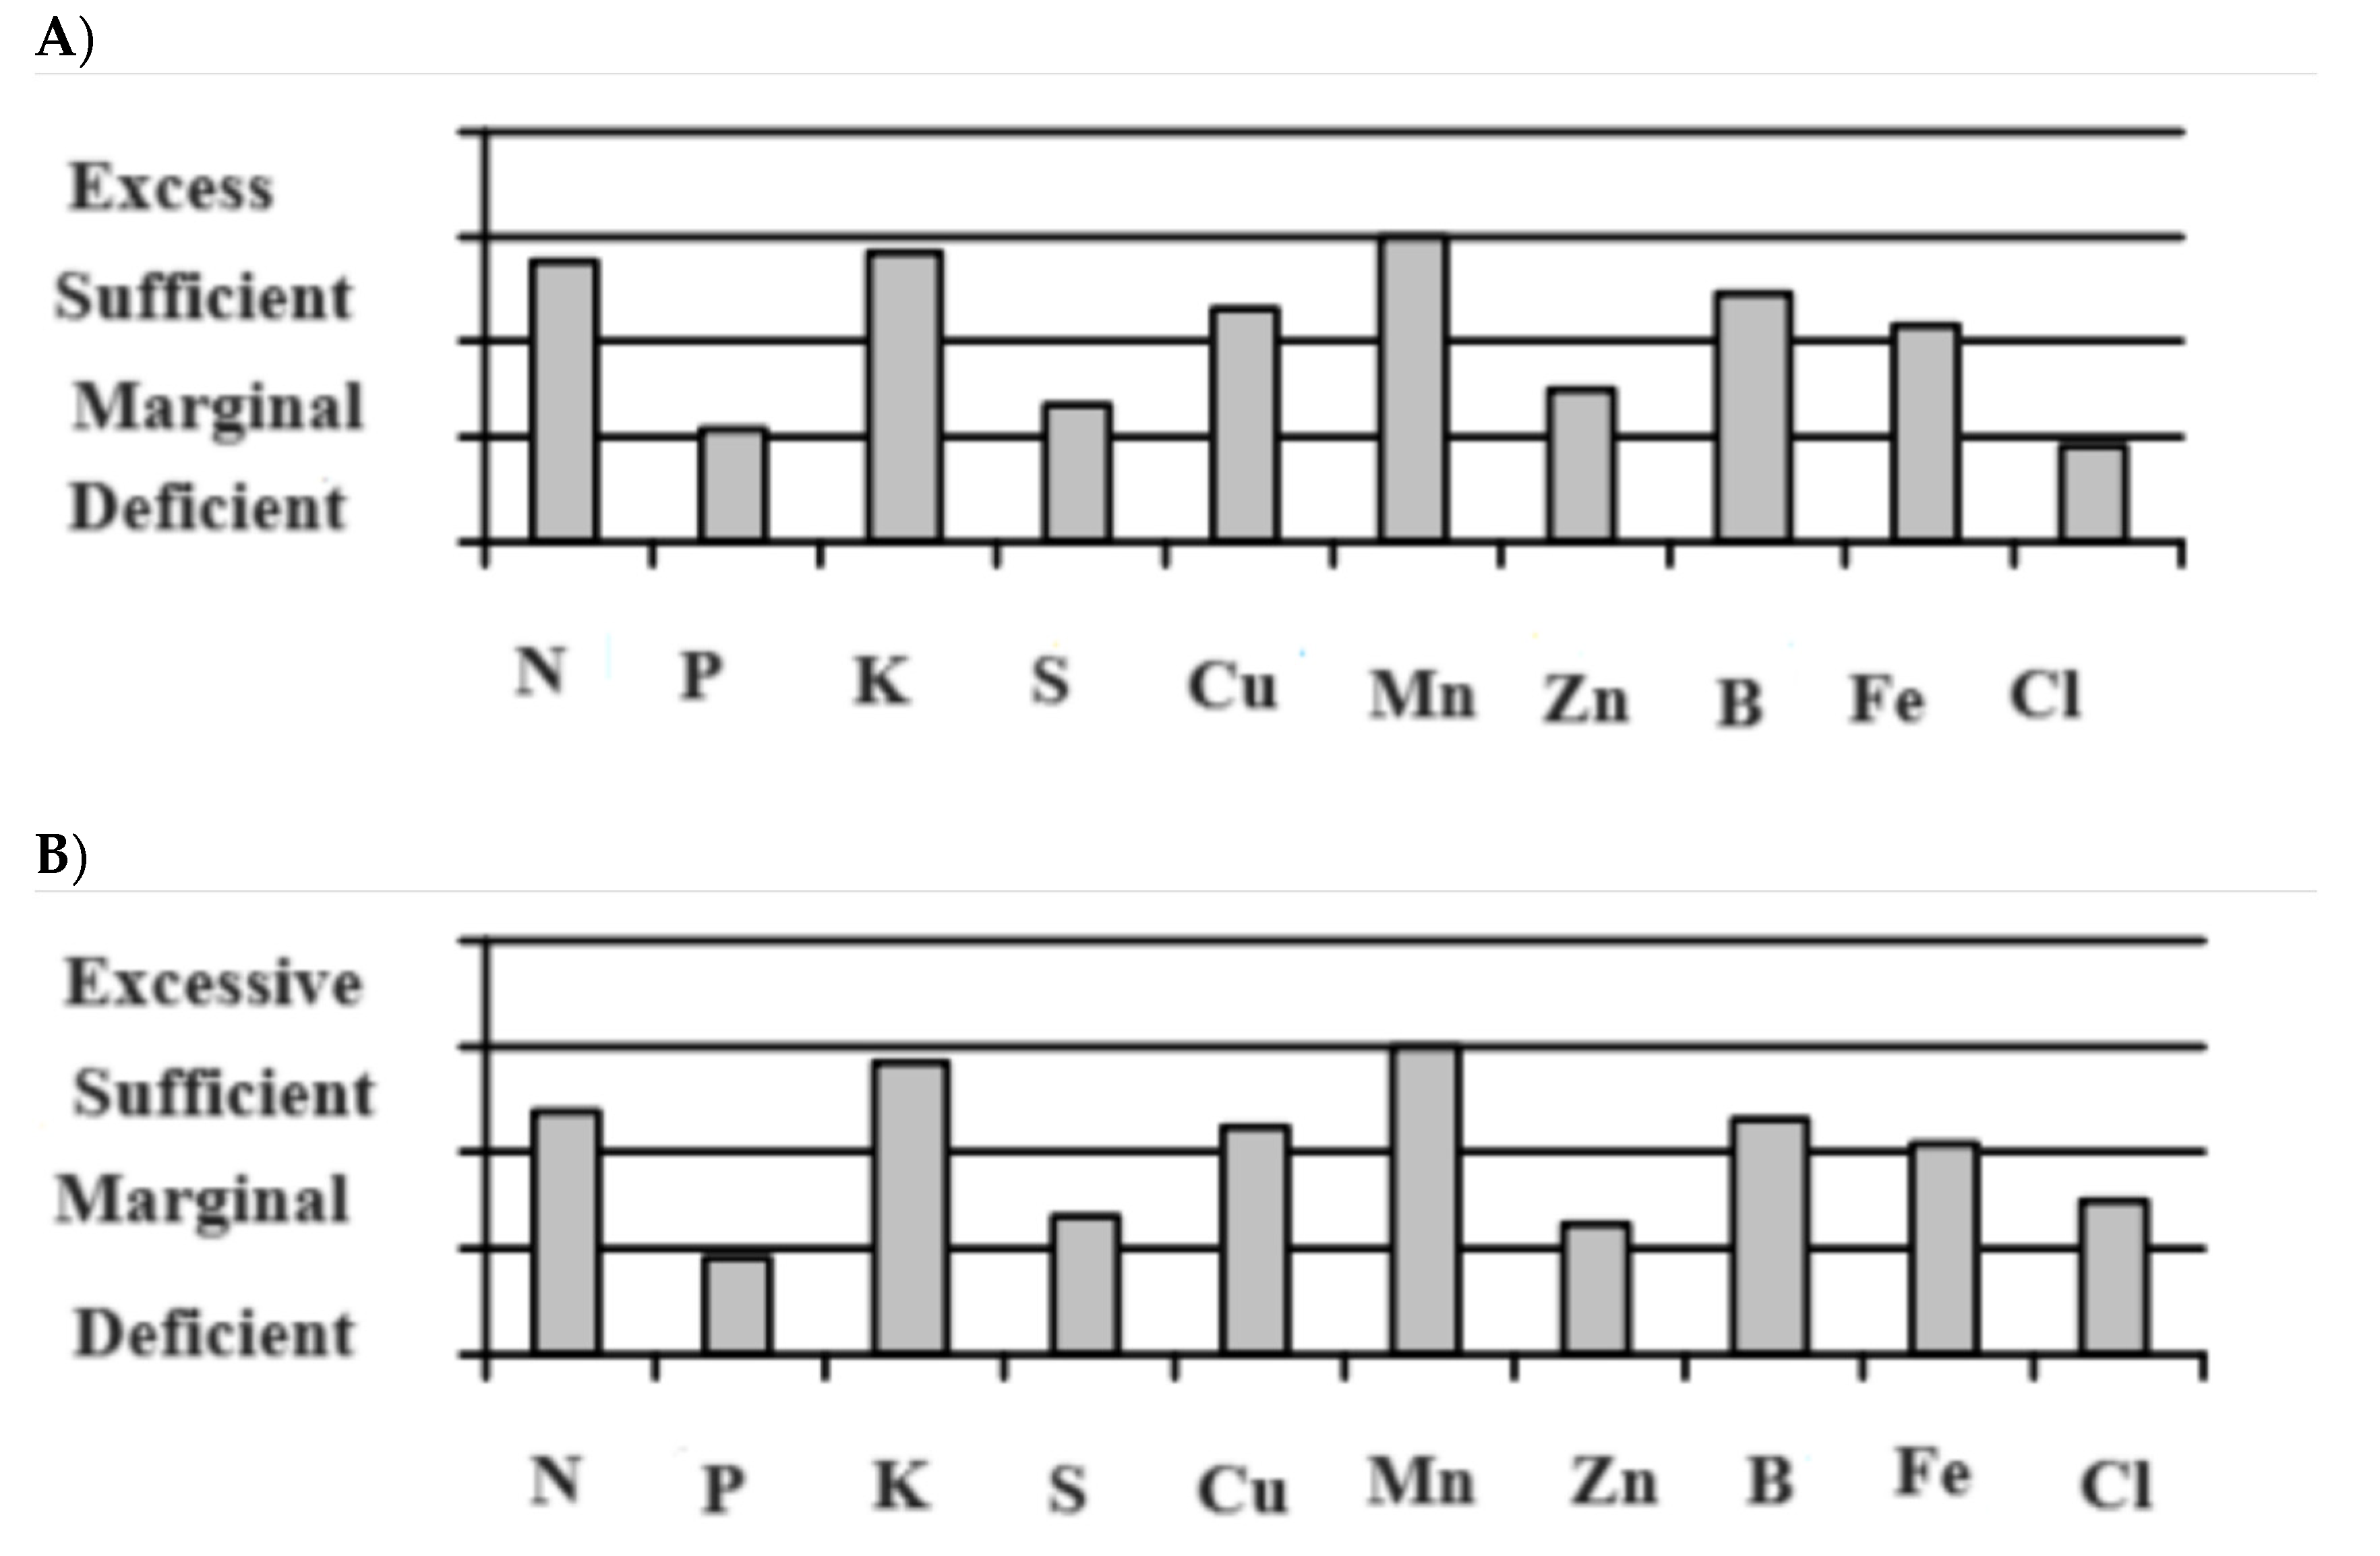
Soil sample analysis was done to examine the physico-chemical characteristics along with the concentrations of several micronutrients including Fe. Soils from both locations are calcareous (pH > 7.0) with the Fe status was above the marginal level (Figure 1).
Figure 1.
The status of Fe and other macro and micronutrients at the experimental sites at A) Elrose and B) Moose Jaw, SK.
Figure 1.
The status of Fe and other macro and micronutrients at the experimental sites at A) Elrose and B) Moose Jaw, SK.
Ten to twelve soil samples were collected diagonally from two layers (0-6" and 6-12") from each location for physico chemical analyses before and after Fe fertilization. Samples were air dried at 35° C for five days and a wooden roller was used to ground the soils. The ground soil samples were analyzed for different nutrients and chemical properties. The summary of soil properties prior to fertilization and after fertilization in 2015 and 2016 showed in

Table 1.
Summary of soil properties prior to fertilization and after fertilization in 2015 and 2016.
Table 1.
Summary of soil properties prior to fertilization and after fertilization in 2015 and 2016.
| Before Fertilization | After Fertilization | |||||||||||||||
|---|---|---|---|---|---|---|---|---|---|---|---|---|---|---|---|---|
| Location | Location | |||||||||||||||
| Elrose | Moose Jaw | Elrose | Moose Jaw | Elrose | Moose Jaw | Elrose | Moose Jaw | |||||||||
| 2015 | 2016 | 2015 | 2016 | |||||||||||||
| Depth (inches) | Depth (inches) | Depth (inches) | Depth (inches) | |||||||||||||
| Soil Properties | 0-6 | 6-12 | 0-6 | 6-12 | 0-6 | 6-12 | 0-6 | 6-12 | 0-6 | 6-12 | 0-6 | 6-12 | 0-6 | 6-12 | 0-6 | 6-12 |
| pH | 7.5 | 7.9 | 7.9 | 8.2 | 7.9 | 8.1 | 7.5 | 8.2 | 7.2 | 7.6 | 7.9 | 8.2 | 7.4 | 8.1 | 7.7 | 8.2 |
| N (mg kg-1) | 13.0 | 10.0 | 6.5 | 3.5 | 8.6 | 8.1 | 12.4 | 7.6 | 8.8 | 4.8 | 8.1 | 5.4 | 4.4 | 1.7 | 6.6 | 1.0 |
| P (mg kg-1) | 13.0 | 3.5 | 9.5 | 2.0 | 3.6 | 2.0 | 14.4 | 3.9 | 19.3 | 7.5 | 10.8 | 2.0 | 11.9 | 2.0 | 13.2 | 2.1 |
| K (mg kg-1) | 270 | 255 | 270 | 255 | 699 | 501 | 756 | 614 | 1120 | 856 | 849 | 420 | 932 | 582 | 885 | 507 |
| Fe (mg kg-1) | 20.5 | 11.4 | 13.3 | 9.4 | 19.8 | 19.8 | 18.3 | 17.0 | 22.1 | 23.0 | 16.7 | 13.8 | 20.7 | 21.3 | 22.1 | 19.7 |
2.3. Plant Materials
Eighteen chickpea cultivars and advanced breeding lines were used in this experiment (Table 2). All the cultivars were obtained from the chickpea breeding program at the Crop Development Centre, University of Saskatchewan.
Table 2.
Description of eighteen cultivars used in the soil applied Fe fertilization.
| Entry | Cultivars | Types | 1000 Seed Weight(g) (Avg. of 2015 and 2016) |
|---|---|---|---|
| 1. | 1173-1 | Kabuli | 349 |
| 2. | 1460-2 | Desi | 203 |
| 3. | AB06-156-2 | Kabuli | 376 |
| 4. | Amit | Kabuli | 252 |
| 5. | CA05-75-45 | Kabuli | 265 |
| 6. | CDC Alma | Kabuli | 293 |
| 7. | CDC Cabri | Desi | 286 |
| 8. | CDC Consul | Desi | 299 |
| 9. | CDC Corinne | Desi | 255 |
| 10. | CDC Cory | Desi | 266 |
| 11. | CDC Frontier | Kabuli | 309 |
| 12. | CDC Leader | Kabuli | 356 |
| 13. | CDC Luna | Kabuli | 297 |
| 14. | CDC Orion | Kabuli | 360 |
| 15. | CDC Palmer | Kabuli | 393 |
| 16. | CDC Vanguard | Desi | 219 |
| 17. | X05TH20-2 | Kabuli | 371 |
| 18. | X05TH47-3 | Kabuli | 351 |
2.4. Fe Fertilizer and Application
Synthetic Fe (III)-chelates (Fe-EDDHA) was used as soil applied fertilizer as chelating Fe fertilizer is more effective and stable in high pH soil (Table 3).
Table 3.
Fe (III)-chelates and their stability level on high pH soil in order to correct Fe deficiency.
Table 3.
Fe (III)-chelates and their stability level on high pH soil in order to correct Fe deficiency.
| Fe fertilizer | Stability | Fe deficiency |
|---|---|---|
| Fe-EDTA, Fe-DTPA and Fe-HEDTA | Low | Limited/no results |
| Fe-EDDHA | High | Effective |
Source: (Lucena, 2006) [43].
Eighteen chickpea cultivars (Table 2) and three rates of Fe fertilizer (Fe-EDDHA) were used in the experiment. Fe fertilizer was applied at three rates: S0 (control: no Fe application), S1 (10 kg ha-1) and S2 (30 kg ha-1) of Fe (Fe-EDDHA) solution with 6% actual Fe and 38.7% EDDHA. The application of Fe fertilizer was done by spraying method by using nozzle sprayer to the soil immediately after planting. Each low dose plot (S1) was applied with 9 g of Fe-EDDHA solution, whereas high dose plot (S2) with 27 g. The range of solution preparation for regular agricultural practice was 0.05 to 0.1 g/ml of H2O. The solution of Fe-EDDHA with the rate of 38.7% EDDHA was prepared with 0.07 g of Fe-EDDHA per ml of H2O. By this protocol, 128 ml and 385 ml of Fe-EDDHA solution were sprayed in the S1 and S2 plots, respectively. The timing of spraying in each row of S1 plot was 6 seconds, whereas in each S2 plot was 18 seconds.
2.5. Experimental Design
To evaluate the interaction effects of different doses of Fe fertilizer and chickpea cultivars, the experiment was arranged as a 18x3 factorial randomized complete block design (RCBD) with four replications at each location and year. Each experimental plot was 4.2 m2 and total number of plots was 216 at each location and year. The plot consisted of 3 rows with 0.31m intra-row spacing. Seeding rate was 180 seeds per plot. The experiment was seeded using plot seeder on the 29th of April and 1st May 2015 at Elrose and Moose Jaw, respectively, and 3rd May and 29th April 2016 at Elrose and Moose Jaw, respectively. General crop management practices were done following the recommendation for chickpea crop in the area. No herbicide was used to manage weeds. When required, weeding at the experimental site was done manually. In 2016, due to wet condition in the second half of the growing season, both locations were infected by the ascochyta blight disease.
2.6. Data Collection
2.6.1. Agronomic Traits
Data were taken for the following agronomic characteristics: germination (%), node number, days to flowering, days to maturity, plant height (cm), disease score, 1000-seed weight and seed yield (converted to kg ha-1). Germination % was determined by counting the total plant number at each plot and then was converted into %. Node number and plant height were recorded by randomly selected five plants from the middle row of each plot. Days to flowering was calculated from the seeding date until 50% of the plants within a plot had flowered. Like days to flowering, days to maturity was counted when 50% of the plants have changed color. At maturity, five individual plants from each plot were taken randomly to determine the biomass (dry weight). The reaction to ascochyta blight disease was scored at late podding stage (before maturity) by using 0-9 scale [44]. The detail rating scale for ascochyta blight on chickpea is given in Table 4.
Table 4.
Disease rating scale (0-9) of ascochyta blight in chickpea.
| Rating | Symptoms |
|---|---|
| 0 | No symptoms |
| 1 | Few, very small (<2mm2) lesions on leaves and/or stems, <2% plant area affected (PAA) |
| 2 | Very small ((<2mm2) lesions, 2-5% PAA |
| 3 | Many small lesions (#2-5mm2), 5-10% PAA |
| 4 | Many small lesions, few large (>5 mm2) lesions, 10-25% PAA |
| 5 | Many large lesions, 25-50% PAA |
| 6 | Lesions coalescing, 50-75% PAA |
| 7 | Lesions coalescing with stem girdling, 75-90% PAA |
| 8 | Stem girdling or breakage, >90% PAA |
| 9 | Plant dead |
Source: Chongo et al.2004 [44].
The 1000-seed weight was determined by randomly taking 200 seeds that were counted by using seed counter followed by weighing with digital balance. The weight of 200 seeds was then converted into 1000-seed weight. Seed yield of each plot was recorded in gram per plot and then converted into kg ha-1. Fe yield was calculated by multiplying seed Fe concentration with seed yield and then converted into g ha-1.
2.6.2. Seed Fe Analysis
Fe concentrations (µg g-1) in mature seeds of eighteen different cultivars with three doses of Fe fertilizer were measured by flame atomic absorption spectrometry (F-AAS, Nova 300, Analytik Jena AG, Jena, Germany) at the analytical laboratory at the Department of Plant Sciences, University of Saskatchewan. Before Fe concentration analysis, the Vulcan digester (Vulcan 84, Questron Technology, Ontario, CA, USA) was used to digest the samples. The procedures for digestion and Fe concentration analysis were described previously [45,30]. After harvest, mature seeds were cleaned to get rid of any soil particles using air pressure. Cleaned seeds were grounded by using a cyclone sample mill (UDY Corporation, Fort Collins, CO, USA). One-half gram of powdered sample was used for determining seed Fe concentration with three replications.
2.7. Statistical Analysis
Statistical analysis was done following PROC MIXED procedure of the SAS version 8.0 (SAS institute Inc., Cary, NC, USA) for a factorial randomized complete block design. Initially, the analysis was conducted for each location and year followed by combined analysis across locations and years. The location and year and their interactions were considered as random effects, whereas the effect of cultivar and Fe fertilizer dose were considered fixed. Least Significant Difference (LSD) test was used for separating mean values.
3. Results
The effects of soil-applied Fe fertilizer across locations, years, their interaction (location*year), cultivar, dose and their interaction (cultivar* dose) along with all the two, three, and four-ways interactions on different parameters of chickpea cultivars are presented in Table 5.
Table 5.
Analysis of variance and F values of the effect of location (LOC), year (YEAR), replication (REP), cultivar (CUL), dose (DOS) and the interaction of LOC*YEAR, LOC*CUL, LOC*DOS, CUL*YEAR, CUL*DOS, DOS*YEAR, LOC*YEAR*CUL, LOC*YEAR*DOS, CUL*YEAR*DOS, CUL*LOC*DOS, and LOC*YEAR*CUL*DOS on germination (%), node no., days to flowering (50%), days to maturity (50%), plant height (cm), biomass (g), 1000 seed weight (g), yield (kg ha-1), seed Fe (µg g-1) and Fe yield (g ha-1) of eighteen chickpea cultivars with three doses of Fe-EDDHA over four replications at both sites.
| Sources of Variation | df | Germination | Node Number | Days to Flowering | Days to Maturity | Plant Height | Biomass | 1000 Seed Weight | Yield | Seed Fe Conc |
|---|---|---|---|---|---|---|---|---|---|---|
| LOC | 1 | 68.3** | 3.6ns | 1232** | 536** | 766** | 101** | 0.6ns | 1254** | 1248** |
| YEAR | 1 | 227** | 93.8** | 131** | 12804** | 5701** | 0.8ns | 1385** | 1367** | 884** |
| REP | 3 | 0.9ns | 3.0* | 3.2* | 1.9ns | 4.7* | 2.4* | 7.8** | 22.0** | 12.4** |
| CUL | 17 | 4.3** | 9.9** | 12.2** | 8.2** | 17.5** | 8.1** | 116** | 35.1** | 19.3** |
| DOS | 2 | 1.3ns | 0.7ns | 1.8ns | 2.7ns | 0.3ns | 61.7** | 1.7ns | 0.0ns | 14.1** |
| LOC*YEAR | 1 | 0.9ns | 19.0** | 395** | 968** | 157** | 1292** | 99.0** | 1866** | 88.9** |
| LOC*CUL | 17 | 1.4ns | 1.4ns | 2.1* | 2.4* | 1.9* | 6.0** | 3.1** | 5.9** | 2.5* |
| LOC*DOS | 2 | 1.6ns | 1.4ns | 4.3* | 15.8** | 2.0ns | 25.5** | 3.4* | 3.6* | 0.9ns |
| CUL*YEAR | 17 | 6.9** | 3.5** | 6.8** | 6.1** | 3.2** | 9.4** | 17.0** | 7.7** | 11.0** |
| CUL*DOS | 34 | 1.2ns | 1.2ns | 0.6ns | 0.7ns | 0.5ns | 1.4ns | 0.7ns | 1.6* | 0.6ns |
| DOS*YEAR | 2 | 2.5ns | 0.2ns | 1.4ns | 1.5ns | 2.6ns | 2.4ns | 2.0ns | 1.3ns | 4.1* |
| LOC*YEAR*CUL | 17 | 1.5ns | 3.1** | 6.0** | 2.4* | 2.6* | 3.2** | 4.2** | 12.6** | 2.0* |
| LOC*YEAR*DOS | 2 | 2.0ns | 0.4ns | 0.5ns | 11.3** | 0.6ns | 32.1** | 1.5ns | 1.3ns | 1.4ns |
| CUL*YEAR*DOS | 34 | 1.1ns | 1.6* | 0.7ns | 0.8ns | 0.7ns | 1.0ns | 0.8ns | 2.4** | 0.7ns |
| CUL*LOC*DOS | 34 | 0.9ns | 0.8ns | 0.6ns | 0.7ns | 0.7ns | 1.1ns | 0.8ns | 1.7* | 0.9ns |
| LOC*YEAR*CUL*DOS | 34 | 1.1ns | 1.3ns | 0.9ns | 0.8ns | 0.5ns | 1.9* | 0.8ns | 1.5* | 1.2ns |
* = significant at 5%, ** = significant at 1%, ns= nonsignificant, df = degrees of freedom.
Across the sixteen different factors, cultivar (CUL) and the interaction of cultivar and location (CUL*LOC) were highly significant (p < 0.01) for all parameters. Furthermore, the effect of location (LOC), year (YEAR), replication (REP), the interactions of location and year (LOC*YEAR), location and cultivar (LOC*CUL), and location, year and cultivar (LOC*YEAR*CUL) were also significant on most of the parameters. However, the effects of Fe fertilizer were significant only on plant biomass and seed Fe concentration. The interaction effects between cultivar and fertilizer dose (CUL*DOS), dose and year (DOS*YEAR), location, year, and dose (LOC*YEAR*DOS), cultivar, year, and dose (CUL*YEAR*DOS), cultivar, location, and dose (CUL*LOC*DOS) and location, year, cultivar, and dose (LOC*YEAR*CUL*DOS) on most of the parameters were not significant. However, the interaction effects of location and dose (LOC*DOS) were significant on most of the parameters, except germination, node number, plant height, and seed Fe concentration (Table 5).
The effects of soil-applied Fe fertilizer across locations, cultivar, dose and their interaction(location*cultivar), (location*dose), (cultivar*dose), and (location*cultivar*dose) on disease ascochyta blight score of chickpea cultivars in 2016 are presented in Table 6.
Table 6.
Analysis of variance and F values of the effect of location (LOC), replication (REP), cultivar (CUL), dose (DOS) and the interaction of LOC*CUL, LOC*DOS, CUL*DOS, and CUL*LOC*DOS on disease score of eighteen chickpea cultivars with three doses of Fe-EDDHA over four replications at both sites in 2016.
| Sources of Variation | df | Disease score |
|---|---|---|
| LOC | 1 | 62.4** |
| REP | 3 | 37.7** |
| CUL | 17 | 8.9** |
| DOS | 2 | 2.1ns |
| LOC*CUL | 17 | 0.6ns |
| LOC*DOS | 2 | 13.2** |
| CUL*DOS | 34 | 0.5ns |
| LOC*CUL*DOS | 34 | 0.7ns |
* = significant at 5%, ** = significant at 1%, ns= nonsignificant, df = degrees of freedom.
Across the eight different factors, location (LOC), cultivar (CUL), replication (REP) and the interaction of location and dose (LOC*DOS) were highly significant (p < 0.01) for ascochyta blight disease score. However, the effect of Fe fertilizer on the disease severity was not significant. The interaction effects between location and cultivar (LOC*CUL), cultivar and dose (CUL*DOS) and cultivar, location, and dose (CUL*LOC*DOS) on disease were also not significant (Table 6).
3.1. Biomass
The biomass data were based on the mean dry weight of randomly harvested five plants per plot. The mean biomass (g) of each of eighteen chickpea cultivars with three Fe fertilizer doses (0 kg ha-1, 10 kg ha-1, and 30 kg ha-1) at both locations in 2015 and 2016 are presented in Table 7.
Table 7.
The mean biomass (g plant-1) of eighteen chickpea cultivars with three Fe fertilizer doses (0 kg ha-1, 10 kg ha-1, and 30 kg ha-1) at Elrose and Moose Jaw in 2015 and 2016.
Table 7.
The mean biomass (g plant-1) of eighteen chickpea cultivars with three Fe fertilizer doses (0 kg ha-1, 10 kg ha-1, and 30 kg ha-1) at Elrose and Moose Jaw in 2015 and 2016.
|
Cultivars |
Elrose | Moose Jaw | |||||||||||
|---|---|---|---|---|---|---|---|---|---|---|---|---|---|
| 2015 | 2016 | 2015 | 2016 | ||||||||||
| 0 kg ha-1 | 10 kg ha-1 | 30 kg ha-1 | 0 kg ha-1 | 10 kg ha-1 | 30 kg ha-1 | 0 kg ha-1 | 10 kg ha-1 | 30 kg ha-1 | 0 kg ha-1 | 10 kg ha-1 | 30 kg ha-1 | Cultivars Mean | |
| 1173-1 | 199 | 208 | 255 | 109 | 119 | 127 | 89 | 125 | 99 | 157 | 166 | 182 | 153 |
| 1460-2 | 175 | 232 | 244 | 112 | 116 | 124 | 118 | 89 | 105 | 171 | 257 | 171 | 159 |
| AB06-156-2 | 149 | 280 | 295 | 101 | 117 | 146 | 149 | 127 | 157 | 198 | 201 | 207 | 177 |
| Amit | 195 | 220 | 244 | 126 | 136 | 160 | 118 | 125 | 148 | 216 | 246 | 247 | 182 |
| CA05-75-45 | 179 | 198 | 263 | 125 | 128 | 149 | 87 | 108 | 139 | 173 | 189 | 263 | 167 |
| CDC Alma | 183 | 170 | 208 | 82 | 92 | 100 | 102 | 119 | 85 | 162 | 121 | 113 | 128 |
| CDC Cabri | 166 | 260 | 329 | 129 | 144 | 161 | 81 | 73 | 111 | 127 | 178 | 153 | 159 |
| CDC Consul | 116 | 215 | 223 | 133 | 139 | 143 | 83 | 125 | 85 | 176 | 207 | 261 | 159 |
| CDC Corinne | 167 | 226 | 260 | 147 | 148 | 170 | 129 | 138 | 134 | 196 | 217 | 219 | 179 |
| CDC Cory | 167 | 250 | 262 | 160 | 162 | 174 | 109 | 143 | 123 | 229 | 245 | 301 | 194 |
| CDC Frontier | 238 | 240 | 263 | 136 | 161 | 169 | 136 | 137 | 121 | 243 | 264 | 248 | 196 |
| CDC Leader | 195 | 222 | 235 | 137 | 141 | 145 | 94 | 82 | 86 | 205 | 216 | 259 | 168 |
| CDC Luna | 150 | 248 | 304 | 115 | 134 | 130 | 102 | 90 | 93 | 100 | 164 | 165 | 150 |
| CDC Orion | 207 | 316 | 389 | 130 | 134 | 148 | 105 | 109 | 106 | 191 | 191 | 197 | 185 |
| CDC Palmer | 166 | 170 | 215 | 119 | 132 | 141 | 113 | 112 | 95 | 222 | 229 | 266 | 165 |
| CDC Vanguard | 201 | 259 | 261 | 127 | 129 | 157 | 157 | 127 | 149 | 132 | 238 | 141 | 173 |
| X05TH20-2 | 270 | 302 | 325 | 117 | 124 | 147 | 122 | 122 | 114 | 172 | 172 | 178 | 180 |
| X05TH47-3 | 160 | 166 | 258 | 129 | 156 | 186 | 131 | 134 | 111 | 210 | 214 | 223 | 173 |
| Dose Mean | 182 | 232 | 268 | 124 | 134 | 149 | 112 | 116 | 115 | 182 | 206 | 211 | 169 |
| LSD0.05 | 51.9 | 72.9 | 58.1 | 30.0 | 29.6 | 39.8 | 40.9 | 37.7 | 36.4 | 55.9 | 53.9 | 71.7 | 48.2 |
LSD = Least Significant Difference.
The effects of locations, cultivars, and their interactions were significant on biomass (Table 5). Moreover, the main effect of Fe fertilizer on biomass was highly significant (p < 0.01). The highest biomass was obtained from cultivar CDC Frontier (196 g per plant) followed by CDC Cory (194 g per plant), whereas the lowest was found by CDC Alma (128 g per plant). The highest mean of biomass (268 g) was obtained with 30 kg ha-1 of Fe fertilizer at Elrose in 2015. Biomass of the cultivars grown with no Fe fertilizer was significantly lower than the other two doses. However, some cultivars at Moose Jaw in 2015 obtained the highest biomass with no Fe fertilizer compared to the other two doses. For instance, cultivar CDC Luna had the highest biomass (102 g per plant) at 0 kg ha-1 of Fe fertilizer compared to the other two doses (Table 7).
3.2. Seed Fe
The mean seed Fe concentrations (mg kg-1) of eighteen cultivars with three Fe fertilizer doses (0 kg ha-1, 10 kg ha-1, and 30 kg ha-1) at both locations in 2015 and 2016 are presented in Table 8.
Table 8.
Seed Fe concentrations (mg kg-1) of eighteen chickpea cultivars with three Fe fertilizer doses (0 kg ha-1, 10 kg ha-1, and 30 kg ha-1) at Elrose and Moose Jaw in 2015 and 2016.
Table 8.
Seed Fe concentrations (mg kg-1) of eighteen chickpea cultivars with three Fe fertilizer doses (0 kg ha-1, 10 kg ha-1, and 30 kg ha-1) at Elrose and Moose Jaw in 2015 and 2016.
| Elrose | Moose Jaw | ||||||||||||
|---|---|---|---|---|---|---|---|---|---|---|---|---|---|
| 2015 | 2016 | 2015 | 2016 | Cultivar | |||||||||
| Cultivars | 0 kg ha-1 | 10 kg ha-1 | 30 kg ha-1 | 0 kg ha-1 | 10 kg ha-1 | 30 kg ha-1 | 0 kg ha-1 | 10 kg ha-1 | 30 kg ha-1 | 0 kg ha-1 | 10 kg ha-1 | 30 kg ha-1 | Mean |
| 1173-1 | 43 | 48 | 49 | 61 | 63 | 67 | 38 | 37 | 41 | 46 | 46 | 52 | 49 |
| 1460-2 | 47 | 52 | 54 | 56 | 60 | 61 | 39 | 39 | 44 | 45 | 44 | 50 | 49 |
| AB06-156-2 | 51 | 52 | 57 | 67 | 70 | 71 | 41 | 43 | 41 | 47 | 49 | 55 | 54 |
| Amit | 49 | 50 | 48 | 59 | 65 | 72 | 40 | 41 | 43 | 46 | 49 | 51 | 51 |
| CA05-75-45 | 48 | 43 | 49 | 58 | 57 | 59 | 35 | 34 | 34 | 49 | 44 | 51 | 47 |
| CDC Alma | 43 | 50 | 50 | 65 | 72 | 80 | 38 | 39 | 39 | 48 | 50 | 54 | 52 |
| CDC Cabri | 46 | 46 | 54 | 57 | 57 | 60 | 37 | 40 | 40 | 47 | 48 | 51 | 49 |
| CDC Consul | 52 | 52 | 54 | 57 | 63 | 57 | 42 | 47 | 43 | 41 | 44 | 47 | 50 |
| CDC Corinne | 46 | 50 | 50 | 55 | 55 | 60 | 41 | 39 | 41 | 41 | 41 | 43 | 47 |
| CDC Cory | 47 | 48 | 51 | 56 | 60 | 64 | 42 | 44 | 45 | 42 | 45 | 48 | 49 |
| CDC Frontier | 57 | 55 | 55 | 66 | 73 | 76 | 43 | 45 | 46 | 49 | 52 | 57 | 56 |
| CDC Leader | 48 | 47 | 45 | 60 | 60 | 62 | 38 | 37 | 39 | 43 | 46 | 53 | 48 |
| CDC Luna | 48 | 47 | 48 | 78 | 73 | 80 | 38 | 39 | 37 | 49 | 56 | 56 | 54 |
| CDC Orion | 46 | 53 | 52 | 70 | 68 | 71 | 39 | 37 | 40 | 47 | 52 | 54 | 52 |
| CDC Palmer | 48 | 48 | 48 | 64 | 63 | 69 | 37 | 40 | 39 | 46 | 44 | 48 | 50 |
| CDC Vanguard | 44 | 47 | 48 | 53 | 49 | 57 | 40 | 39 | 47 | 41 | 44 | 48 | 46 |
| X05TH20-2 | 55 | 57 | 58 | 75 | 72 | 76 | 49 | 50 | 46 | 50 | 51 | 54 | 58 |
| X05TH47-3 | 53 | 50 | 56 | 72 | 67 | 70 | 46 | 49 | 48 | 49 | 52 | 51 | 55 |
| Dose Mean | 48 | 50 | 51 | 63 | 64 | 67 | 40 | 41 | 42 | 46 | 48 | 51 | 51 |
| LSD0.05 | 7.0 | 11.4 | 7.6 | 9.6 | 11.6 | 9.3 | 4.9 | 4.8 | 5.5 | 7.1 | 5.5 | 6.8 | 7.6 |
LSD = Least Significant Difference.
The main effects of locations, years, and cultivars as well as their interactions were highly significant (p < 0.01) on seed Fe concentrations (Table 5). Moreover, significant differences were found among doses. Seed Fe concentrations obtained from Elrose in the year 2015 and 2016 were significantly higher than from Moose Jaw. The highest Fe concentration in seed was observed for cultivar X05TH20-2 (58 mg kg-1) followed by CDC Frontier (56 mg kg-1). Furthermore, the highest dose means (67 mg kg-1) in seed Fe concentration was obtained at 30 kg ha-1 of Fe fertilizer at Elrose in 2016 compared to all other doses at both locations in 2015 and at Moose Jaw in 2016. Seed Fe concentrations obtained from no Fe fertilizer was the lowest compared to the other two doses, except for cultivar X05TH47-3 at Elrose in 2016. The lowest dose means (40 mg kg-1) in seed Fe concentration was observed under no Fe fertilizer treatment at Moose Jaw in 2015 compared to both locations in 2016 and Elrose in 2015 with other two doses (Table 8).
3.3. Fe Yield
The mean of Fe yield (g ha-1) of eighteen chickpea cultivars with three Fe fertilizer doses (0 kg ha-1, 10 kg ha-1, and 30 kg ha-1) at both locations in 2015 and 2016 are presented in Table 9.
Table 9.
The mean of Fe yield (g ha-1) of eighteen chickpea cultivars with three different doses (0 kg ha-1, 10 kg ha-1, and 30 kg ha-1) of Fe-EDDHA at Elrose and Moose Jaw in 2015 and 2016.
Table 9.
The mean of Fe yield (g ha-1) of eighteen chickpea cultivars with three different doses (0 kg ha-1, 10 kg ha-1, and 30 kg ha-1) of Fe-EDDHA at Elrose and Moose Jaw in 2015 and 2016.
| Cultivars | Elrose | Moose Jaw | |||||||||||
|---|---|---|---|---|---|---|---|---|---|---|---|---|---|
| 2015 | 2016 | 2015 | 2016 | ||||||||||
| 0 kg ha-1 | 10 kg ha-1 | 30 kg ha-1 | 0 kg ha-1 | 10 kg ha-1 | 30 kg ha-1 | 0 kg ha-1 | 10 kg ha-1 | 30 kg ha-1 | 0 kg ha-1 | 10 kg ha-1 | 30 kg ha-1 | Cultivar Mean |
|
| 1173-1 | 311 | 347 | 316 | 129 | 116 | 31 | 86 | 83 | 111 | 141 | 131 | 170 | 164 |
| 1460-2 | 340 | 337 | 369 | 137 | 125 | 126 | 113 | 91 | 113 | 171 | 132 | 184 | 187 |
| AB06-156-2 | 396 | 410 | 447 | 137 | 170 | 125 | 93 | 104 | 104 | 145 | 98 | 199 | 202 |
| Amit | 306 | 337 | 335 | 132 | 113 | 174 | 93 | 86 | 89 | 132 | 150 | 150 | 175 |
| CA05-75-45 | 305 | 250 | 311 | 160 | 132 | 138 | 74 | 59 | 61 | 112 | 171 | 126 | 158 |
| CDC Alma | 234 | 250 | 247 | 62 | 65 | 63 | 89 | 79 | 109 | . | . | . | 133 |
| CDC Cabri | 291 | 326 | 319 | 284 | 172 | 187 | 74 | 99 | 90 | 152 | 72 | 107 | 181 |
| CDC Consul | 430 | 405 | 419 | 172 | 171 | 135 | 132 | 127 | 129 | 196 | 253 | 291 | 238 |
| CDC Corinne | 405 | 438 | 434 | 174 | 248 | 211 | 122 | 110 | 100 | 149 | 182 | 189 | 230 |
| CDC Cory | 376 | 351 | 374 | 262 | 264 | 155 | 122 | 144 | 159 | 127 | 203 | 141 | 223 |
| CDC Frontier | 443 | 433 | 427 | 130 | 150 | 314 | 140 | 131 | 131 | 78 | 62 | 75 | 209 |
| CDC Leader | 359 | 420 | 367 | 152 | 135 | 69 | 98 | 104 | 104 | 190 | 156 | 165 | 193 |
| CDC Luna | 282 | 294 | 291 | 149 | 112 | 141 | 100 | 107 | 110 | . | . | . | 136 |
| CDC Orion | 267 | 379 | 315 | 139 | 96 | 185 | 106 | 96 | 104 | 106 | 89 | 81 | 164 |
| CDC Palmer | 416 | 342 | 422 | 190 | 206 | 204 | 97 | 95 | 98 | 173 | 170 | 300 | 226 |
| CDC Vanguard | 272 | 372 | 288 | 168 | 151 | 156 | 105 | 95 | 94 | 108 | 97 | 104 | 167 |
| X05TH20-2 | 263 | 334 | 306 | 109 | 97 | 147 | 85 | 92 | 83 | 104 | 98 | 109 | 152 |
| X05TH47-3 | 346 | 367 | 387 | 133 | 182 | 113 | 103 | 141 | 123 | 198 | 153 | 209 | 205 |
| Dose Mean | 335 | 355 | 354 | 157 | 150 | 148 | 102 | 102 | 106 | 135 | 131 | 155 | 186 |
| LSD0.05 | 73.4 | 90.8 | 69.6 | 73.0 | 98.8 | 136.2 | 24.8 | 24.5 | 34.4 | 57.3 | 59.6 | 65.7 | 67.3 |
LSD = Least Significant DifferenceThere were significant differences in Fe yield among cultivars and doses. Fe yield obtained from Elrose in 2015 was significantly higher than other location and year. The highest cultivars mean for Fe yield was obtained from CDC Consul (238 g ha-1) followed by CDC Corinne (230 g ha-1). Furthermore, Fe fertilizer with a dose of 10 kg ha-1 and 30 kg ha-1 yielded the highest Fe yield of 355 g ha-1 and 354 g ha-1, respectively, at Elrose in 2015 compared to the Fe yield at both locations in 2016 and at Moose Jaw in 2015. Fe yield obtained from plants with no application of Fe fertilizer was the lowest than the other two doses for most cultivars. However, some cultivars were able to produce the highest Fe yield with low dose (0 kg ha-1) of Fe fertilizer compared to the other two doses. For instance, cultivar 1173-1 had the highest Fe yield (129 g ha-1) at 0 kg ha-1 of Fe fertilizer (Table 9).
4. Discussion
The application of synthetic Fe chelates on chickpeas across two years and two locations in Saskatchewan had significant effects (p < 0.01) on biomass and seed Fe concentration (Table 5). The chelate Fe fertilizer at 10 kg ha-1 and 30 kg ha-1 improved the seed Fe concentration across cultivars and environments. In 2015 and 2016, Elrose yielded higher levels of seed Fe concentration compared to Moose Jaw. Moreover, the highest seed Fe concentration (58.5 mg kg-1) was obtained from CDC Frontier with 30 kg ha-1 dose of chelate Fe fertilizer, whereas the lowest (44.5 mg kg-1) was obtained from CDC Vanguard with no fertilizer application. At 30 kg ha-1 Fe fertilizer, seed Fe concentration of CDC Frontier at Elrose and Moose Jaw in 2016 increased by 15% and 16%, respectively, compared to control. However, the seed Fe concentrations at different doses across environments only gained 5-11% increase compared to control. This suggests that the application of chelated Fe, which is the dominant form of Fe in the alkaline soil, provided readily available Fe to the roots of chickpea plants. Consequently, Fe concentration in seeds increased compared to control. Our findings are in agreement with findings of Moraghan et al. [46] who reported that application of Fe-EDDHA increased seed Fe concentration in common bean. Moreover, the highest seed Fe concentration (65 mg kg-1) was observed at Elrose in 2016 compared to the rest of the environments (Table 8). The cultivars X05TH20-2 (58 mg kg-1) and CDC Frontier (56 mg kg-1) had the highest mean of seed Fe concentration compared to the rest of the cultivars, whereas CDC Vanguard had the lowest concentration (46 mg kg-1). The variability in Fe concentrations was mostly attributed to cultivars across locations and years. Similar findings were previously reported in chickpea [30].
Elrose location produced higher Fe yield compared to Moose Jaw in 2015 and 2016. The highest Fe yield (447 g ha-1) was found on AB06-156-2 cultivar at 30 kg ha-1 of chelate Fe fertilizer. At 30 kg ha-1 fertilizer rate, Fe yield of AB06-156-2 cultivar at Elrose in 2015 increased by 12% compared to control. The overall Fe yield increased varying from 4 to19% in parallel with the Fe fertilizer doses across environments (Table 9). Kumar et al. [47] reported that the application of varying levels of Fe fertilizer up to 10 kg ha-1 significantly increased Fe concentration in chickpea grain over control. Similar findings were also reported by Sharma et al. [48] who observed that the application of chelated Fe fertilizer improved the Fe content in seeds of pigeon pea.
Locations, cultivars, and their interaction significantly affected biomass. The highest biomass (228 g per five plants) was observed at Elrose in 2015 compared to the rest of the environments. These findings are similar to those reported by Kumawat et al. [49] and Sahu et al. [50] who observed that soil-applied Fe fertilizer increased biomass yield in chickpea. Similarly, in cowpea, Mahriya and Meena [51] reported that the application of Fe fertilizer improved biomass, which is consistent with our findings. Furthermore, the results are also similar to the findings of Bansal and Chahal [52] who reported that application of 25 µg g-1 Fe in mung bean grown in an alkaline soil significantly increased biomass and Fe content, which is in agreement with our findings. However, previous studies done in chickpea and soybean reported that application of Fe-EDDHA did not results in significant increase in biomass, which contrasts with our findings [53,54,55].
The present study also showed that ascochyta blight disease affected the yield in both locations in 2016 (Table S1.). The correlation analysis showed that ascochyta blight and yield were highly correlated (r = 0.75; p < 0.01) at Moose Jaw in 2016 (Table S2.). Due to ascochyta blight, Fe was most likely distributed to relatively a smaller number of plants that ultimately increased seed Fe concentration level at Moose Jaw location in 2016 compared to 2015. These findings suggested that the magnitude of the effects of ascochyta blight on seed Fe concentration depended on the cultivars and environments.
Other characteristics such as thousand seed weight, and seed yield varied significantly (p < 0.01) among locations, years, cultivars, and their interactions in the two-year experiment (Table 5). For thousand seed weight, both locations in 2015 produced larger seed size compared to 2016. This is mostly attributed to ascochyta blight disease that affected the plants in both locations in 2016 (Table S1). As a result, thousand seed weight decreased. Moreover, the highest location means of thousand seed weight (363 g) was observed at Elrose in 2015, whereas the lowest (250 g) was found at Elrose in 2016 (Table S3.). The highest grain yield (6904 kg ha-1) was observed at Elrose in 2015, whereas the lowest (2421 kg ha-1) was found at Elrose in 2016. CDC Corinne had the highest mean yield (4832 kg ha-1), whereas CDC Alma had the lowest yield (2137 kg ha-1) (Table S4.). Mevada et al. [56] also reported that the application of Fe chelates increased grain yield significantly over control in urdbean. Similar findings were also observed by Kumar et al. [47] and Sahu et al. [50] who reported that the application of Fe fertilizer increased grain yield of chickpea by 17.3%. Furthermore, thousand seed weight and seed yield were higher in resistant cultivars such as CDC Corinne, CDC Consul, CDC Leader, and CDC Frontier compared to the susceptible cultivars CDC Alma and CDC Luna. The variations in thousand seed weight and seed yield among cultivars could be due to the differences in their genetic constitution, physiology, and the cultivar response to various environmental conditions. Similar observations were also made by many authors in previous studies in chickpea and common bean [57,30].
The effects of Fe fertilizer on germination, node number, days to flowering, days to maturity, and plant height were not significant (Table 1). However, locations, years, cultivars and their interactions significantly affected germination, node number, days to flowering, days to maturity, and plant height. Germination at both locations in 2015 was higher than in 2016. For instance, germination at Elrose in 2015 was 10% and 4% higher than in Elrose and Moose Jaw in 2016 However, node number, days to flowering, days to maturity, and plant height were higher at both locations in 2016 than 2015. The variations in the above-mentioned characteristics were mostly due to ascochyta blight infestation, cultivar response to various environmental conditions, genetics, and physiology. Current findings were consistent with previous studies in mung bean, chickpeas, common bean that showed application of Fe fertilizer did not improve vegetative growth attributes [30,47,57,58,59]. However, previous studies in cowpea, black gram, and pea showed that growth characteristics were increased with the application of Fe fertilizer, which are in contrast with our findings [60,61,62].
5. Conclusions
Chickpea is a daily staple in many developing countries where people often affected by Fe deficiency and Fe deficiency related anemia. Improvement of Fe concentration in seeds of chickpea along with increasing consumption is one of the major strategies to correct Fe deficiency. The present study demonstrated that chickpea contained Fe at 3.4-8.0 mg 100 g-1 concentration. One of the major findings from this study is chelate Fe fertilizer 30 kg ha-1 increased the seed Fe concentration. Results from soil-applied Fe fertilizer showed that the highest seed Fe concentration was obtained from X05TH20-2 and CDC Frontier cultivars (58 and 56 mg Fe kg-1 seed, respectively). Therefore, Fe biofortified in seeds of those two cultivars can provide approximately 6 mg Fe 100-1 g seeds. Thus, a 58 and 83 g serving of Fe biofortified chickpea seeds can provide adequate amount (50%) of Fe for children at the age groups 1-3 (7 mg Fe day-1) and 4-8 (10 mg day-1) years, respectively. Moreover, at the age group 19-50 years, 67 and 150 g of Fe biofortified chickpea seeds can provide adequate amount (50%) of Fe for men (8 mg Fe day-1) and women (18 mg Fe day-1).
Author’s contributions
T. A. Jahan, and B. Tar’an conceived and designed the study. T. A. Jahan analysed the data. T. A. Jahan prepared the draft manuscript. B. Tar’an, reviewed all documents critically and approved the final manuscript for submission in the journal.
Supplementary Materials
The following supporting information can be downloaded at the website of this paper posted on Preprints.org. Supplementary Table S1. Disease score (0-9) of eighteen chickpea cultivars with three different doses of Fe-EDDHA at Elrose and Moose Jaw in 2016. Supplementary Table S2. Correlation between ascochyta blight score and yield as well as Fe yield of eighteen chickpea cultivars with three different doses of Fe-EDDHA at Elrose and Moose Jaw in 2016. Supplementary Table S3. Thousand seed weight (g) of eighteen chickpea cultivars with three different doses of Fe-EDDHA at Elrose and Moose Jaw in the year 2015 and 2016. Supplementary Table S4. Average yield (kg ha-1) of eighteen chickpea cultivars across all doses of Fe-EDDHA at Elrose and Moose Jaw in the year 2015 and 2016
Acknowledgments
We greatly acknowledge the financial support from the Saskatchewan Ministry of Agriculture through the Agricultural Development Fund. Technical helps from Jaret Horner, Scott Ife and Brent Barlow during the field trials were greatly appreciated. The authors also thank to Barry Goetz for seed iron analysis.
Conflicts of interest
The authors declare no conflict of interest.
References
- Grillet, L.; Mari, S.; Schmidt, W. Fe in seeds – loading pathways and subcellular localization. Front. Plant Sci. 2014, 4, 1–8. [Google Scholar] [CrossRef] [PubMed]
- Tan, G. Z. H.; Das Bhowmik, S. S.; Hoang, T. M. L.; Karbaschi, M. R.; Johnson, A. A. T.; Williams, B.; Mundree, S. G. Finger on the pulse: Pumping Fe into chickpea. Front. Plant Sci. 2017, 8, 1–17. [Google Scholar] [CrossRef] [PubMed]
- Zuo, Y.; Zhang, F. Soil and crop management strategies to prevent Fe deficiency in crops. Plant Soil. 2011, 339, 83–95. [Google Scholar] [CrossRef]
- Colombo, C.; Palumbo, G.; He, J. Z.; Pinton, R.; Cesco, S. Review on Fe availability in soil: Interaction of Fe minerals, plants, and microbes. J. Soils Sediments. 2014, 14, 538–548. [Google Scholar] [CrossRef]
- Boukhalfa, H.; Crumbliss, A. L. Chemical aspects of siderophore mediated Fe transport. Biometals. 2002, 15, 325–339. [Google Scholar] [CrossRef] [PubMed]
- Römheld, V.; Marschner, H. Evidence for a specific uptake system for Fe phytosiderophores in roots of grasses. Plant Physiol. 1986, 80, 175–180. [Google Scholar] [CrossRef] [PubMed]
- Robinson, N. J.; Procter, C. M.; Connolly, E. L.; Guerinot, M. L. A ferric-chelate reductase for Fe uptake from soils. Nature. 1999, 397, 694–697. [Google Scholar] [CrossRef]
- Morrissey, J.; Guerinot, M. Fe uptake and transport in plants: The good, the bad, and the ionome. Chem. Rev. 2009, 109, 4553–4567. [Google Scholar] [CrossRef]
- Jeong, J.; Connolly, E. L. Fe uptake mechanisms in plants: Functions of the FRO family of ferric reductases. Plant Sci. 2009, 176, 709–714. [Google Scholar] [CrossRef]
- Chugh, V.; Dhaliwal, H. Biofortification of Staple Crops. In Agricultural Sustainability, Elsevier, 2013, 177-196. [CrossRef]
- Mayer, J.; Pfeiffer, W.; Beyer, P. Biofortified crops to alleviate micronutrient malnutrition. Curr. Opin. Plant Biol. 2008, 11, 166–170. [Google Scholar] [CrossRef]
- Briat, J.F. Fe Nutrition and Implications for Biomass Production and the Nutritional Quality of Plant Products. In Molecular and physiological basis of nutrient use efficiency in crops, Hawkesford, M. J.; Barraclough, P., Ed.; Wiley-Blackwell: Oxford, UK, 2011; pp. 309–328. [Google Scholar] [CrossRef]
- Cakmak, I. Enrichment of cereal grains with zinc: Agronomic or genetic biofortification? Plant Soil, 2008, 302, 1–17. [Google Scholar] [CrossRef]
- de Valença, A.; Bake, A.; Brouwer, I.; Giller, K. Agronomic biofortification of crops to fight hidden hunger in sub-Saharan Africa. Global Food Security, 2017, 12, 8–14. [Google Scholar] [CrossRef]
- Prasad, R. Ferti-fortifcation of grains an easy option to alleviate malnutrition of some micronutrients in human beings. Indian J. Fertilisers. 2009, 5, 129–133. [Google Scholar]
- Manzeke, G.; Mapfumo, M.; Mtambanengwe, P.; Chikowo, F.; Tendayi, R.; Cakmak, T. Soil fertility management effects on maize productivity and grain zinc content in smallholder farming systems of Zimbabwe. Plant Soil, 2012, 361(1-2), 57-69. [CrossRef]
- Vanlauwe, B.; Descheemaeker, K.; Giller, K.; Huising, J.; Merckx, R.; Nziguheba, G.; Zingore. S. Integrated soil fertility management in sub-Saharan Africa: Unravelling local adaptation. Soil, 2015, 1, 491–508. [Google Scholar] [CrossRef]
- Voortman, R.L.; Bindraban, P.S. Beyond N and P: Towards a land resource ecology perspective and impactful fertilizer interventions in Sub-Sahara Africa. In VFRC Report 2015/1; Virtual Fertilizer Research Center: Washington, D.C. USA,, 2015; 49. [Google Scholar]
- Singh, M.; Prasad, K. Agronomic Aspects of Zinc Biofortification in Rice (Oryza sativa L.). Proceedings of the National Academy of Sciences, India Section B: Biol. Sci. 2014, 84, 613–623. [Google Scholar] [CrossRef]
- Rietra, R.P.J.J.; Heinen, M.; Dimpla, C.; Bindraban, P.S. Effects of nutrients antagonism and synergism on fertilizer use efficiency. VFRC Report 2015/5. Virtual Fertilizer Research Centre. Available online: http://www.vfrc.org/getdoc/e738b7d3-8f70-4b18-b3d9-980694b5f26c/vfrc_2015-5_effects_of_nutrient_antagonism_and_syn.pdf (accessed on 20 January 2018).
- Walworth, D. J. Recognizing and Treating Fe Deficiency in the Home Yard. Available online: https://extension.arizona.edu/sites/extension.arizona.edu/files/pubs/az1415.pdf (accessed on 10 May 2019).
- Millán, T.; Madrid, E.; Cubero, J. I.; Amri, M.; Patricia, C.; Rubio, J. Chickpea. In Handbook of Plant Breeding; De Ron. A. M., D., Ed.; Springer: Pontevedra, Spain, 2015; pp. 85–88. [Google Scholar] [CrossRef]
- Zhu, H.; Choi, H.; Cook, D. R.; Shoemaker, R. C. Bridging model and crop legumes through comparative genomics. Plant Physiol. 2005, 137, 1189–1196. [Google Scholar] [CrossRef] [PubMed]
- FAOSTAT. FAO Statistical Database. Available online: http://www.fao.org/faostat/en/#data/QC (accessed on 15 May 2018).
- Akibode, C. S.; Maredia, M. K. Global and regional trends in production, trade and consumption of food legume crops. Michigan State University, Michigan, USA. 2012. [CrossRef]
- Wells, H. F.; Bond, J.K. Vegetables and Pulses Yearbook Data. Economic Research Service, USDA. 2016. 2016. Available online: https://downloads.usda.library.cornell.edu/usda-esmis/files/1n79h429p/z890rw81t/rj430695g/VGS-08-30-2016.pdf (accessed on 15 March 2019).
- Ibrikci, H.; Knewtson, S.; Grusak, M. Chickpea leaves as a vegetable green for humans: Evaluation of mineral composition. Journal of the Science of Food and Agriculture, 2003, 83, 945–950. [Google Scholar] [CrossRef]
- Yadav, S. S.; Longnecker, N.; Dusunceli, F.; Bejiga, G.; Yadav, M.; Rizvi, A. H.; … Chen, W. Uses, consumption and utilization. In Chickpea Breeding and Management, Yadav, S.S.; Redden, R.J., Chen, W., Eds.; Sharma, B. Eds. CABI: Cambridge, MA , USA, 2007. [Google Scholar] [CrossRef]
- Diapari, M.; Sindhu, A.; Bett, K.; Deokar, A.; Warkentin, T.; Tar'an, B. Genetic diversity and association mapping of Fe and zinc concentrations in chickpea (Cicer arietinum L.). Genome, 2014, 57, 459–468. [Google Scholar] [CrossRef]
- USDA. National Nutrient Database for Standard Reference. Available online: http://www.ars.usda.gov/Services?docs.htm?docid=8964 (accessed on 25 March 2018).
- Chilimba, A.; Young, S.; Black, C.; Meacham, M.; Lammel, J.; Broadley, M. Agronomic biofortification of maize with selenium (Se) in Malawi. Field Crops Res. 2012, 125, 118–128. [Google Scholar] [CrossRef]
- Yilmaz, A.; Ekiz, H.; Torun, B.; Gultekin, I.; Karanlik, S.; Bagci, S.A.; Cakmak, I. Effect of different zinc application methods on grain yield and zinc concentration in wheat cultivars grown on zinc-deficient calcareous soils. J. Plant. Nutr. 1997, 20(4-5), 461–471. [Google Scholar] [CrossRef]
- Hidoto, L.; Worku, W.; Mohammed, H.; Bunyamin, T. Effects of zinc application strategy on zinc content and productivity of chickpea grown under zinc deficient soils. J. Soil Sci. Plant Nutr. 2017, 17(1), 0. [CrossRef]
- Ali, B.; Ali, A.; Tahir, M.; Ali, S. Growth, Seed yield and quality of mungbean as influenced by foliar application of Fe sulfate. Pak J Life Soc Sci. 2014, 12, 20–25. [Google Scholar]
- Smrkolj, P.; Germ, M.; Kreft, I.; Stibilj, V. Respiratory potential and Se compounds in pea (Pisum sativum L.) plants grown from Se-enriched seeds. J Exp Bot. 2006, 57, 3595–3600. [Google Scholar] [CrossRef] [PubMed]
- Smrkolj, P.; Osvald, M.; Osvald, J.; Stibilj, V. Selenium uptake and species distribution in selenium-enriched bean (Phaseolus vulgaris L.) seeds obtained by two different cultivations. Eur. Food Res. Technol. 2007, 225, 233–237. [Google Scholar] [CrossRef]
- Molina, M. G.; Quiroz, C. M.; de la Cruz, L. E.; Martinez, J. R.V.; Parra, J. M. S; Carrillo, M. G.; Vidal, J.A.O. Biofortification of cowpea beans (Vigna unguiculata L. Walp) with Fe and zinc. Mexican Journal of Agricultural Sciences, 2016, 17, 3427–3438. [Google Scholar]
- Sida-Arreola, J.; Sánchez, E.; Ojeda-Barrios, D.; Ávila-uezada, G.; Flores-Córdova, M.; Márquez-Quiroz, C.; Preciado-Rangel, P. Can biofortification of zinc improve the antioxidant capacity and nutritional quality of beans? Emir J Food Agric. 2017, 29, 237–241. [Google Scholar]
- Márquez-Quiroz, C.; De-La-Cruz-Lázaro, E.; Osorio-Osorio, R.; Sánchez-Chávez., E. Biofortification of cowpea beans with Fe: Fe´s influence on mineral content and yield. J. Soil Sci. Plant Nutr. ahead of print. 2015. [Google Scholar] [CrossRef]
- Hussain, S.; Rengel, Z.; Aziz, T.; Abid, M. Estimated Zinc Bioavailability in Milling Fractions of Biofortified Wheat Grains and in Flours of Different Extraction Rates. Int J Agric Biol. 2013, 15, 921–926. [Google Scholar]
- White, P. J.; Broadley, M. R. Biofortification of crops with seven mineral elements often lacking in human diets. The New Phytologist, 2009, 182, 49–84. [Google Scholar] [CrossRef]
- Alfthan, G.; Eurola, M.; Ekholm, P.; Venäläinen, E.; Root, T.; Korkalainen, K.; Aero, A. Effects of nationwide addition of selenium to fertilizers on foods, and animal and human health in Finland: From deficiency to optimal selenium status of the population. J Trace Elem Med Biol. 2015, 31, 142–147. [Google Scholar] [CrossRef]
- Lucena, J. Synthetic Iron Chelates to Correct Iron Deficiency in Plants. In Iron Nutrition in Plants and Rhizospheric Microorganisms; Barton, L.L., Abadia, J., Eds.; Springer: Dordrecht, Netherland, 2006. [Google Scholar] [CrossRef]
- Chongo, G.; Gossen, B. D.; Buchwaldt, L.; Adhikari, T.; Rimmer, S. R. Genetic diversity of Ascochyta rabiei in Canada. Plant Dis. 2004, 88(1), 4–10. [Google Scholar] [CrossRef]
- DellaValle, D. M.; Thavarajah, D.; Thavarajah, P.; Vandenberg, A.; Glahn, R. P. Lentil (Lens culinaris L.) as a candidate crop for Fe biofortification: Is there genetic potential for Fe bioavailability? Field Crops Res. 2013, 144, 119–125. [Google Scholar] [CrossRef]
- Moraghan, J.; Padilla, T.; Etchevers, J.; Grafton, K.; Acosta-Gallegos, J. Fe accumulation in seed of common bean. Plant Soil. 2002, 246, 175–183. [Google Scholar] [CrossRef]
- Kumar, V.; Dwivedi, V. N.; Tiwari, D. D. Effect of phosphorous and Fe on yield and mineral nutrition in chickpea. Ann. Plant soil res. 2009, 11, 16–18. [Google Scholar]
- Sharma, S.; Sharma, M.; Ramesh, A. Biofortification of crops with micronutrients through agricultural approaches. Indian Farming. 2010, 60, 7–12. [Google Scholar]
- Kumawat, R. N.; Rathore, P. S.; Pareek, N. Response of mung bean to sulphur and Fe nutrition grown on calcareous soil of Western Rajasthan. Indian J Pulses Res. 2006, 19, 228–230. [Google Scholar]
- Sahu, S.; Lidder, R. S.; Singh. P., K. Effect of micronutrients and biofertilizers on growth, yield and nutrient uptake by chickpea (Cicer aeritinum L.) in Vertisols of Madhya Pradesh. Adv Plant Sci. 2008, 21, 501–503. [Google Scholar]
- Mahriya, A. K.; Meena, N. Response of phosphorous and Fe on growth and quality of cowpea (Vigna unguiculata L.). Ann. Agric. Biologic. Res. 1999, 4, 203–205. [Google Scholar]
- Bansal, R. L.; Chahal, D. S. Interaction effect of Fe and Mn on growth and nutrient content of moong (Phaseolus aureus L.). Acta Agronomica Hungarica 1990, 39, 59–63. [Google Scholar]
- Ghasemi-Fasaei, R.; Ronaghi, A.; Maftoun, M.; Karimian, N.; Soltanpour, P. Fe-Manganese Interaction in Chickpea as Affected by Foliar and Soil Application of Fe in a Calcareous Soil. Commun. Soil Sci. Plant Anal. 2005, 36(13-14), 1717–1725. [Google Scholar] [CrossRef]
- Moosavi, A. A.; Ronaghi, A. Influence of foliar and soil applications of Fe and manganese on soybean dry matter yield and Fe-manganese relationship in a calcareous soil. Aust J Crop Sci. 2011, 5, 1550–1556. [Google Scholar]
- Ronaghi, A.; Ghasemi-Fasaei, R. Field Evaluations of Yield, Fe-Manganese Relationship, and Chlorophyll Meter Readings in Soybean Genotypes as Affected by Fe-Ethylenediamine Di-o-hydroxyphenylacetic Acid in a Calcareous Soil. J. Plant Nutr. 2007, 31, 81–89. [Google Scholar] [CrossRef]
- Mevada, K. D.; Patel, J. J.; Petel, K.P. Effect of micronutrients on yield of urdbean. Indian J Pulses Res. 2005, 18, 214–216. [Google Scholar]
- Ariza-Nieto, M.; Blair, M.; Welch, R; Glahn, R. Screening of Fe bioavailability patterns in eight bean (Phaseolus vulgaris L.) genotypes using the Caco-2 cell in vitro model. J Agric Food Chem. 2007, 55, 7950–7956. [Google Scholar] [CrossRef] [PubMed]
- Janmohammadi, M.; Abdoli, H.; Sabaghnia, N.; Esmailpour, M.; Aghaei, A. The Effect Of Fe, Zinc and Organic Fertilizer on Yield of Chickpea (Cicer Artietinum L.) in Mediterranean Climate. Acta Universitatis Agriculturae et Silviculturae Mendelianae Brunensis, 2018, 66, 0049–0060. [Google Scholar] [CrossRef]
- Shukla, V. S. I. Effect of Fe, Mo, Zn and P on symbiotic nitrogen fixation of chickpea. Indian J Agric. Chemis. 1994, 32, 118–123. [Google Scholar]
- Balachandar, D.; Nagarajan, P.; Gunasekaran, S. Effect of organic amendments and micronutrients on nodulation of black gram in acid soil. Legumes Res, 2003, 26, 192–195. [Google Scholar]
- Mahriya, A. K.; Meena, N. Response of phosphorous and Fe on growth and quality of cowpea (Vigna unguiculata L.). Ann Agric Biologic Res. 1999, 4, 203–205. [Google Scholar]
- Thapu, U.; Rai, P.; Suresh, C. P.; Pal., P. Effect of micronutrients on the growth and yield of pea in gangetic alluvial of West Bengal. Environment and Ecology, 2003, 21, 179–182. [Google Scholar]
Disclaimer/Publisher’s Note: The statements, opinions and data contained in all publications are solely those of the individual author(s) and contributor(s) and not of MDPI and/or the editor(s). MDPI and/or the editor(s) disclaim responsibility for any injury to people or property resulting from any ideas, methods, instructions or products referred to in the content. |
© 2023 by the authors. Licensee MDPI, Basel, Switzerland. This article is an open access article distributed under the terms and conditions of the Creative Commons Attribution (CC BY) license (http://creativecommons.org/licenses/by/4.0/).
Copyright: This open access article is published under a Creative Commons CC BY 4.0 license, which permit the free download, distribution, and reuse, provided that the author and preprint are cited in any reuse.