
Submitted:
23 October 2023
Posted:
24 October 2023
You are already at the latest version
Abstract
Over the last decade, highly pathogenic avian influenza (HPAI) has severely affected poultry production systems across the globe. In particular, massive pre-emptive depopulation of all poultry within the certain distance has raised concerns regarding animal welfare and food security. Thus, alternative approaches to reducing unnecessary depopulation, such as risk-based depopulation, are highly demanded. This paper proposes a data-driven method to generate a rule table and risk score for each farm to identify preventive measures against HPAI. To evaluate the proposed method, 105 cases of HPAI occurring in a total of 381 farms in Jeollanam-do from 2014 to 2023 were evaluated. The accuracy of preventive measure identification was assessed for each case using both the conventional culling method and the proposed data-driven method. The evaluation showed that the proposed method achieved an accuracy of 84.19%, significantly surpassing the previous 10.37%. The result was attributed to the proposed method reducing the false-positive rate by 83.61% compared with the conventional method, thereby enhancing the reliability of identification. The proposed method is expected to be utilized in selecting farms for monitoring and management of HPAI.
Keywords:
Highly Pathogenic Avian Influenza (HPAI)
; Biosecurity Zones
; Machine Learning
; Risk Analysis
; Pre-emptive depopulation
1. Introduction
Highly pathogenic avian influenza (HPAI) continues to pose a sustained threat to the global livestock industry and has significant socioeconomic impact [1]. According to reports from the World Health Organization, the virus has a very high mortality rate of approximately 50% when transmitted to humans. With increasing mutations, the risk of human infection is also on the rise. According to data from the Food and Agriculture Organization, the number of global incidents is steadily increasing and is expected to continue until 2023. This disease recurs every 2–3 years, and due to its rapid rate of spread, thorough reevaluation and improvement of existing disease control strategies are needed [2]. Despite many efforts, current control measures have proven insufficient in curbing the rapid spread of this disease [3].
South Korea, especially the Jeonnam region, has suffered significant damage from persistent and large-scale outbreaks of HPAI since 2003 [4]. Cases in this region account for approximately 20% of national outbreaks, and as of 2019, they have severely impacted the livestock industry, which constitutes approximately 6% of Jeollanam-do’s economic output. According to data from the Korean Animal Health Integrated System (KAHIS) of the Ministry of Agriculture, Food and Rural Affairs, the number of HPAI cases has been increasing in recent years. This has led to large-scale preventative culling, movement restrictions, and various resulting issues such as economic losses, price hikes, and fatigue in epidemic prevention [5]. Interestingly, South Korea is the only country in the world that performs preventative culling in all farms within a 3-km radius. During the avian flu epidemic in the winter of 2020/2021, approximately 13,015,000 birds were preventively culled within a 3-km radius of infected sites, accounting for approximately 70% of the total culled poultry [6]. This excessive culling has led to various problems such as labor shortages, lack of burial sites, inadequacies in initial response measures, and ethical dilemmas between farms and government departments, provoking a wave of criticism against the government’s disease control policies.
In contrast, most developed countries focus on a preventive approach emphasizing individual farm disinfection and sanitation and avoiding preventive culling [1]. Countries such as the Netherlands and Hong Kong control avian flu by blocking transmission routes or using vaccines, approaches that are known to be economical and effective in the long term [3]. South Korea should also consider referring to these advanced methodologies, reconsidering the targets for preventive culling, and conducting scientific epidemiological investigations and risk assessments on a farm-by-farm basis [7].
The high rate of culling and rapid spread of the disease indicates that there is a significant need for improvement in current disease response strategies [1]. Therefore, more effective and efficient response measures are urgently needed to mitigate the impact of this spread [3]. To this end, Korean health authorities are considering options including risk-based prevention and response systems in collaboration with industry, universities, and research institutes, as well as artificial intelligence (AI)-based risk prediction systems [8]. Specifically, the adoption of AI and Internet of Things (IoT) technology allows for proactive responses for high-risk farms and regions, and plans are being explored for risk prediction and priority allocation of epidemic prevention resources [9].
This paper proposes a data-driven approach to identify isolation zones in the event of HPAI outbreaks [10]. The proposed method defines a heuristic rule table based on expert opinions, considering factors such as geography, farms, outbreak history, surrounding facilities, migratory bird habitats, and weather information [11]. Using this rule table, a factor-specific risk assessment is conducted for farms within the area of interest. Scores obtained from these risk assessments are combined to calculate the risk score for each farm, and a support vector machine (SVM)-based outbreak standard score is derived to classify these risk scores [12]. Finally, based on the outbreak standard score, the designation of each farm for HPAI prevention is determined. The research focuses on the development of early detection systems for HPAI, data-based spread response systems, and emergency decision-making support systems. Through this, we aim to conduct an in-depth study of risk factors related to HPAI outbreaks in the Jeonnam region and to explore appropriate measures to minimize transmission.
2. Materials and Methods
2.1. Data Preparation and Organization
The data for identifying HPAI quarantine zones are intricately organized by major categories closely related to HPAI outbreak factors and their respective sub-categories. The final structure consists of a total of 7 major categories and 13 sub-categories. Firstly, Table 1 is composed of terrain items, including sub-categories on mountain ranges [13] and river ratios [14]. Table 2 addresses the status around the farm, with sub-categories including proximity to roads [15], population density [14], farm density [15], farmland ratio [13], and proximity to traditional markets. Lastly, Table 3 consists of breeding information, epidemic information, weather information, epidemiological information, and ecological environmental information, with sub-categories including breeding types, distance from nearby farms subject to analysis [16], temperature [17], wind direction [17], analysis farm occurrence history, and distance from migratory bird habitats [15]. Ultimately, all major categories are termed under one large ’rule table.’
The composition of the sub-items in the rule table is divided into two main forms. The first includes items considering the correlation between the target farm and nearby farms, such as mountain ranges, distance to nearby farms, and wind direction. These three items can verify the influence of nearby farms on the target farm based on certain conditions. The other form calculates the conditions of the sub-items based on the target farm itself. Finally, scores are set for all sub-items of the rule table.
Once the overall score setting for the conditions of the sub-items in the rule table is completed, we collect raw data that corresponds to the sub-items. For the collection of items such as mountain range, river ratio, road proximity, population density, and distance from bird arrival areas, we utilized data from [18]. Additionally, information on farm density, farmland ratio, and proximity to traditional markets was based on data from [19]. Data related to weather, such as temperature and wind direction, were collected through [20]. Finally, information related to the farm, such as types of livestock breeding, distance to nearby farms under analysis, and outbreak history of the analysis farm, was provided through the relevant agency [21].
Following the raw data collection phase, a preprocessing step is conducted to ensure that each farm’s data can be directly applied to the rule table. In this stage, the raw data is matched to each farm according to Table 1, Table 2, and Table 3 of the entire rule table, so that each farm possesses the variables and values of the sub-items. However, for sub-items derived from interrelationships, such as distance to nearby farms, temperature, wind direction, and mountain ranges, or for weather information items that change daily, distance analysis and weather data processing are carried out using latitude and longitude coordinate values for each farm variable. Through these data configuration processes, various sub-items and rules necessary for identifying HPAI quarantine zones are accurately integrated and preprocessed for each farm, ultimately preparing them for final analysis.
2.2. Rule-Based Scoring
To identify the HPAI quarantine zones, the final evaluation score for all farms is calculated based on the scoring rule table. This scoring rule is structured to assign points to specific items that meet certain conditions according to the rules shown in Table 1, Table 2 and Table 3.
The evaluation scoring method designates each chicken and duck farm across the country as an analysis target, represented by a. The nearby farms within a 3,000m radius from the designated analysis farm a are referred to as b. Figure 1 illustrates an example of the six processes for setting the range of these nearby farms when each farm becomes the benchmark for analysis. The evaluation score is derived by calculating the item scores according to specific rule items for these designated nearby farms. Equation (1) represents the formula to determine the single evaluation score, where denotes the evaluation score of farm a in relation to its nearby farms b. m stands for the number of rule items, and signifies the score corresponding to rule item x.
If there are no other farms within a 3,000-m radius, the evaluation score for the analysis farm is calculated considering only its surrounding environmental rules.
After evaluating all the chicken and duck farms nationwide, a single evaluation score for the nearby farms within a 3,000m radius can be derived, as shown in the example of Figure 1. Table 4 depicts each example from Figure 1 in a table format and illustrates the calculation of the final evaluation score using the average value after the single evaluation scores have been derived. Equation (2) explains the method to derive the final evaluation score. Here, is the final evaluation score of the analysis target farm a, n is the number of nearby farms within a 3,000m radius centered on the analysis target farm a, k is the number of nearby farms determined as outliers, and represents the single score between farm a and the nearby farm b.
2.3. Decision Model
SVM inherently possesses excellent generalization capabilities and is useful for building accurate and reliable classification models even with limited data [22]. It is particularly specialized for binary and multi-classification, making it highly suitable for accurately classifying whether the final evaluation score of a farm is at a dangerous level.
First, during the training process, the final evaluation scores of farms nationwide that were analyzed in Section 3.2 are combined with historical occurrence data, as depicted in Figure 2. Farms with at least one past occurrence of HPAI are designated as Class 1, and farms with no such history are designated as Class 0 [23]. The completed training dataset then uses the final evaluation score just before training as the feature variable and the class information regarding occurrence history as the target variable, and training is conducted. Figure 3 illustrates the training process and the criteria for deriving the score.
However, an important challenge in this approach is the potential issue of data imbalance, given that historical data on HPAI occurrences in farms are not abundant [24]. To address this challenge, we employ a strategy involving the adjustment of class-specific weights. Through iterative testing, we optimize these weights to balance the training process. SVM training is subsequently performed using a Gaussian kernel to improve the model’s ability to generalize from the training data to unseen instances. The model in Figure 4a was trained by assigning equal weights to all classes, resulting in a relatively low baseline score. Consequently, the accuracy reached 85.19%. On the other hand, the Figure 4b model was trained by applying optimal weights, achieving a high accuracy of 99.74%. The accuracy difference between these two models is 14.55%, confirming that weight adjustment has a significant impact on model training.
In our upcoming experiment details, we delve into a comparative analysis illustrating the effect of these strategic weight adjustments. We designate these weights as w representing the specific values assigned during the training phase. This notation aids in clearly distinguishing the contribution of each weight parameter to the model’s overall performance, highlighting the pivotal role of fine-tuning the balance between classes to enhance the prediction accuracy for HPAI occurrences.
Upon completion of the training phase, we establish a criterion score, which is illustrated in Figure 3, to serve as the risk threshold score for classification. Farms that have evaluation scores surpassing this criterion are labeled as “dangerous farms” that require immediate attention and potentially stringent measures. On the other hand, farms that score below this criterion are further segmented into two categories: “caution farms” and “safe farms.” This categorization is based on their average evaluation scores, allowing for a nuanced understanding of the risk levels and thereby enabling more targeted interventions.
2.4. Experiment Setup
In this research, we zero in on the issue of HPAI affecting farms in the Jeollanam-do region of South Korea. The temporal scope spans from March 14, 2014, to April 7, 2023, encapsulating 105 reported HPAI cases across 381 distinct farms. Designed as a bifurcated experimental inquiry, the research engages deeply with two different but related facets of the HPAI outbreak scenario.
The first experimental session adopts a micro view by examining the geographical cluster formed by each farm that has experienced an HPAI outbreak [4]. When such a farm is identified, it becomes a point of criterion, and the surrounding farms within a 3,000-m radius are closely examined. If any of these nearby farms report an HPAI case within a month from the date of the outbreak at the criterion farm, that cluster is treated as a single case for the analysis. This method allowed us to pinpoint 47 unique cases of HPAI spread in the region.
The second session shifts the lens to a macro view by analyzing the data year by year [25]. The occurrence dates of the farms from the 47 cases of the first session are grouped by year, resulting in 8 separate case sessions corresponding to the years 2014, 2015, 2016, 2017, 2020, 2021, 2022, and 2023.
Then, the methodology remains consistent across both experimental sessions. The term “positive” is assigned to farms within the 3,000-m radius of a subject farm if they also experienced an HPAI outbreak within one month of the incident at the subject farm. Those that do not meet these criteria are tagged as “negative.” Our ground-truth data are then formed based on these designations.
To evaluate various efficiencies for identifying high-risk farms, we compared four approaches using actual data. The first approach is the conventional method of culling by rule [16], which classifies all neighboring farms as ’positive’. The remaining three approaches hinge on the final evaluation scores calculated through a rule engine to classify high-risk farms. These methods, distinct from one another, depend on how the weights, designated as w, are adjusted. This adjustment is critical in deriving the criterion score that becomes instrumental in future risk assessments conducted via the rule engine.
The first of these, termed the w=1 maintains the status quo in learning, with no weight adjustment to offset class imbalance, thereby not considering the ratio. This approach derives the risk criterion score based on the existing data distribution, without any regard for potential skewness between classes.
In what we’ve designated the w=485 we take a different tack. Here, the ratio between classes 0 and 1 is meticulously adjusted to attain parity. Through this method, the risk criterion score is derived by considering more nuanced factors, even if there is a pronounced imbalance within each class. This strategy allows for a more balanced view, potentially uncovering risks that a more lopsided approach might overlook.
The w=8.5 represents our most refined approach. This method involves learning with the most optimized weight, determined through the painstaking process of fine-tuning the weight ratio. The risk criterion score in this model benefits from the most balanced and nuanced perspective, carefully honed through this optimization process.
Upon establishing these methodologies, we conducted a comprehensive comparison. We juxtaposed the actual data from individual farm sessions and annual sessions against the outcomes predicted by all four approaches.
3. Results
In this section, a confusion matrix was derived by comparing the experimental results of the two sessions set in 2.4 with actual data regarding the HPAI cases. Performance was compared using classification evaluation metrics such as the F1 score and accuracy.
Table 5 displays the results of the average of 47 experimental outcomes from individual farm sessions, while Table 6 represents the overall results of the experiments for the annual sessions. Surprisingly, both sessions showed significant improvements in all the w=1, w=485, and w=8.5 experiments compared to the conventional method of culling by rule [16]. This resulted in an accuracy of 84.19%, greatly surpassing the conventional method’s accuracy of 10.37%. It was also observed that false-positive decreased by 83.61%, leading to a reduction in unnecessary culling.
4. Discussion
This research introduces an integrated methodology focused on the precision of farm risk evaluations within HPAI quarantine zones. By drawing on a diverse set of variables, the model achieves a comprehensive risk assessment. These variables include geographical details, livestock facility factors, meteorological data, and epidemiological insights. Together, they form an intricate blend that not only ensures a reliable evaluation of farm risks but also highlights the versatility of the approach [26].
A significant feature of this research is the incorporation of the SVM classification model. Renowned for its exceptional generalization capabilities, SVM proves invaluable even when working with limited datasets [27]. The ability of the model to provide a nuanced assessment of farm risks is further enhanced by addressing data imbalances. This is achieved through class-specific weight adjustments, amplifying the overall efficacy of the model.
From an economic standpoint, the model presents a departure from conventional methods. While conventional approaches often call for the blanket culling of animals within a quarantine zone, this research suggests a more discerning strategy. By focusing on the risks associated with individual farms, this methodology reduces unnecessary culling. This approach not only prioritizes animal welfare but also leads to significant cost savings [28].
5. Conclusions
The study suggests that by harnessing technology to pinpoint animals for culling, unnecessary culling can be substantially reduced. When considering guidelines based on expert advice for identifying various livestock diseases, it is evident that this model might be suitable for addressing diseases such as foot and mouth disease and African swine fever. This underscores the adaptability of this model and its relevance for tackling a range of animal health issues. The pivotal takeaway from the research is a needed shift in perspective: instead of the prevailing belief that “more control is always better,” smart and science-based control emerged as the optimal approach.
Author Contributions
Conceptualization, K.M.J.; methodology, K.M.J. and J.J.; validation, J.J.; formal analysis, K.M.J. and J.J.; investigation, K.M.J. and J.J. and C.-M.L. and D.S.Y.; writing—original draft preparation, K.M.J. and J.J.; writing—review and editing, C.-M.L. and D.S.Y.; visualization, J.J.; supervision, K.M.J. and D.S.Y.; project administration, K.M.J.; funding acquisition, K.M.J. and C.-M.L. All authors have read and agreed to the published version of the manuscript.
Funding
This work was supported by Korean Institute of Planning and Evaluation for Technology in Food, Agriculture and Forestry (IPET) through Animal Disease Management Technology Development Program, funded by Ministry of Agriculture, Food and Rural Affairs (MAFRA) (no.322002-02)
Institutional Review Board Statement
Not applicable.
Informed Consent Statement
Not applicable.
Data Availability Statement
The raw data concerning the farms showcased in this study are available subject to the permission of the relevant institutions.
Acknowledgments
Special thanks to Jeonnam Provincial Government, Korean Livestock Health Control Association for their help during the study.
Conflicts of Interest
The authors declare no conflict of interest.
References
- Lambert, Sébastien and Bauzile, Billy and Mugnier, Amélie and Durand, Benoit and Vergne, Timothée and Paul, Mathilde C. A systematic review of mechanistic models used to study avian influenza virus transmission and control. arXiv 2023, arXiv:2303.00394, . [CrossRef]
- Lucido, Abel G and Smith, Robert J and Lao, Angelyn R. Periodic culling outperforms isolation and vaccination strategies in controlling Influenza A H5N6 outbreaks in the Philippines. arXiv 2020, arXiv:2002.10130.
- Seymour, Rowland G and Kypraios, Theodore and O’Neill, Philip D and Hagenaars, Thomas J. A Bayesian nonparametric analysis of the 2003 outbreak of highly pathogenic avian influenza in the Netherlands. Journal of the Royal Statistical Society Series C: Applied Statistics 2021, 70.5, 1323–1343, . [CrossRef]
- Choi, Woo Yong and Song, Kyu Ye and Lee, Chan Woo. AI4AI: Quantitative Methods for Classifying Host Species from Avian Influenza DNA Sequence. arXiv 2018, arXiv:1802.09197.
- Valdez, Lucas Daniel and Vassallo, Lautaro and Braunstein, Lidia Adriana. Epidemic control in networks with cliques. Physical Review E 2023, 107.5, 054304, . [CrossRef]
- Singh, Sarabjeet and Schneider, David J and Myers, Christopher R. The structure of infectious disease outbreaks across the animal-human interface. arXiv 2013, arXiv:1307.4628.
- Kojaku, Sadamori and Hébert-Dufresne, Laurent and Mones, Enys and Lehmann, Sune and Ahn, Yong-Yeol. The effectiveness of backward contact tracing in networks. Nature physics 2021, 17.5, 652–658, . [CrossRef]
- Niu, Shuai and Yin, Qing and Song, Yunya and Guo, Yike and Yang, Xian. Label dependent attention model for disease risk prediction using multimodal electronic health records. In 2021 IEEE International Conference on Data Mining (ICDM); pp. 449–458.
- Mesinovic, Munib and Watkinson, Peter and Zhu, Tingting. Explainable AI for clinical risk prediction: A survey of concepts, methods, and modalities. arXiv 2023, arXiv:2308.08407.
- Rapp, Michael and Kulessa, Moritz and Loza Mencía, Eneldo and Fürnkranz, Johannes. Correlation-based discovery of disease patterns for syndromic surveillance. Front. Big Data 2022, 4, 784159, . [CrossRef]
- Cooney, Philip and White, Arthur. Utilizing Expert Opinion to inform Extrapolation of Survival Models. arXiv 2021, arXiv:2112.02288.
- Rusek, Janusz and Tajduś, Krzysztof and Firek, Karol and Jędrzejczyk, Adrian. Bayesian networks and Support Vector Classifier in damage risk assessment of RC prefabricated building structures in mining areas. In 2020 5th International Conference on Smart and Sustainable Technologies (SpliTech); pp. 1–8.
- Ahmad, Saleem and Koh, Kyeyoung and Yoo, Daesung and Suh, Gukhyun and Lee, Jaeil and Lee, Chang-Min. Impact of inland waters on highly pathogenic avian influenza outbreaks in neighboring poultry farms in South Korea. Journal of Veterinary Science 2022, 23.3, . [CrossRef]
- Yoo, Dae-sung and Chun, Byung Chul and Hong, Kwan and Kim, Jeehyun. Risk Prediction of Three Different Subtypes of Highly Pathogenic Avian Influenza Outbreaks in Poultry Farms: Based on Spatial Characteristics of Infected Premises in South Korea. Front. Vet. Sci. 2022, 9, 897763, . [CrossRef]
- EOM, Chi-Ho and PAK, Sun-Il and BAE, Sun-Hak. Analysis of Potential Infection Site by Highly Pathogenic Avian Influenza Using Model Patterns of Avian Influenza Outbreak Area in Republic of Korea. Journal of the Korean Association of Geographic Information Studies 2017, 20.2, 60–74.
- Ministry of Agriculture, Food and Rural Affairs. (2022). “AI Emergency Action Guidelines (SOP)”. Available online: https://www.mafra.go.kr/sn3hcv_v2023/skin/doc.html?fn=AD2F803A-4839-AD0A-53D4-46957505D0B3.hwp&rs=/sn3hcv_v2023/atchmnfl/bbs/202310 (accessed on 17 October 2023).
- Seo, I-H and Lee, I-B. CFD application for estimation of airborne spread of HPAI (highly pathogenic avian influenza). In Ist International Symposium on CFD Applications in Agriculture 1008; pp. 57–62, . [CrossRef]
- Korea National Spatial Data Infrastructure Portal. (2023). Available online: http://www.nsdi.go.kr/lxportal/?menuno=2679 (accessed on 17 October 2023).
- Korea Public Data Portal. (2023). Available online: https://www.data.go.kr/ (accessed on 17 October 2023).
- Korea Meteorological Administration. (2023). Real-time weather conditions [Data file retrieved from KMA Weather Data API]. Available online: https://apihub.kma.go.kr/ (accessed on 17 October 2023).
- Jeonnam Provincial Office of Animal Disease Control. (2023). Data on Farm basic information in Jeonnam. Jeonnam Provincial Government.
- Zheng, Shuai and Ding, Chris. Minimal support vector machine. arXiv 2018, arXiv:1804.02370.
- Morales, Iván Ramírez and Cebrián, Daniel Rivero and Blanco, Enrique Fernández and Sierra, Alejandro Pazos. Early warning in egg production curves from commercial hens: A SVM approach. Comput. Electron. Agric. 2016, 121, 169–179, . [CrossRef]
- Pal, Mahesh. Support vector machines/relevance vector machine for remote sensing classification: A review. arXiv 2011, arXiv:1101.2987.
- Mishra, Swapnil and Berah, Tresnia and Mellan, Thomas A and Unwin, H Juliette T and Vollmer, Michaela A and Parag, Kris V and Gandy, Axel and Flaxman, Seth and Bhatt, Samir. On the derivation of the renewal equation from an age-dependent branching process: An epidemic modelling perspective. arXiv 2020, arXiv:2006.16487.
- Elsobky, Yumna and Nganwa, David and El Afandi, Gamal and Byomi, Ahmed and Reddy, Gopal and Abdalla, Ehsan. A quantitative risk assessment to evaluate the efficacy of mitigation strategies to reduce highly pathogenic avian influenza virus, subtype H5N1 (HPAI H5N1) in the Menoufia governorate, Egypt. BMC Veterinary Research 2021, 17.1, 210, . [CrossRef]
- Zhang, Xiaoni. Enterprise Supply Chain Risk Assessment Based on the Support Vector Machine Algorithm and Fuzzy Model. Secur. Commun. Networks 2022, 2022, . [CrossRef]
- Bolzoni, Luca and De Leo, Giulio A. A cost analysis of alternative culling strategies for the eradication of classical swine fever in wildlife. Environment and Development Economics 2007, 12.5, 653–671.
Figure 1.
Each map contains six examples of farms subject to analysis. (a)–(f) on each map are poultry farms, the red dots on each of the six maps are the analysis target farms, the red circles are the analysis farms within a 3000m radius, and the yellow dots are the nearby analysis farms.
Figure 1.
Each map contains six examples of farms subject to analysis. (a)–(f) on each map are poultry farms, the red dots on each of the six maps are the analysis target farms, the red circles are the analysis farms within a 3000m radius, and the yellow dots are the nearby analysis farms.
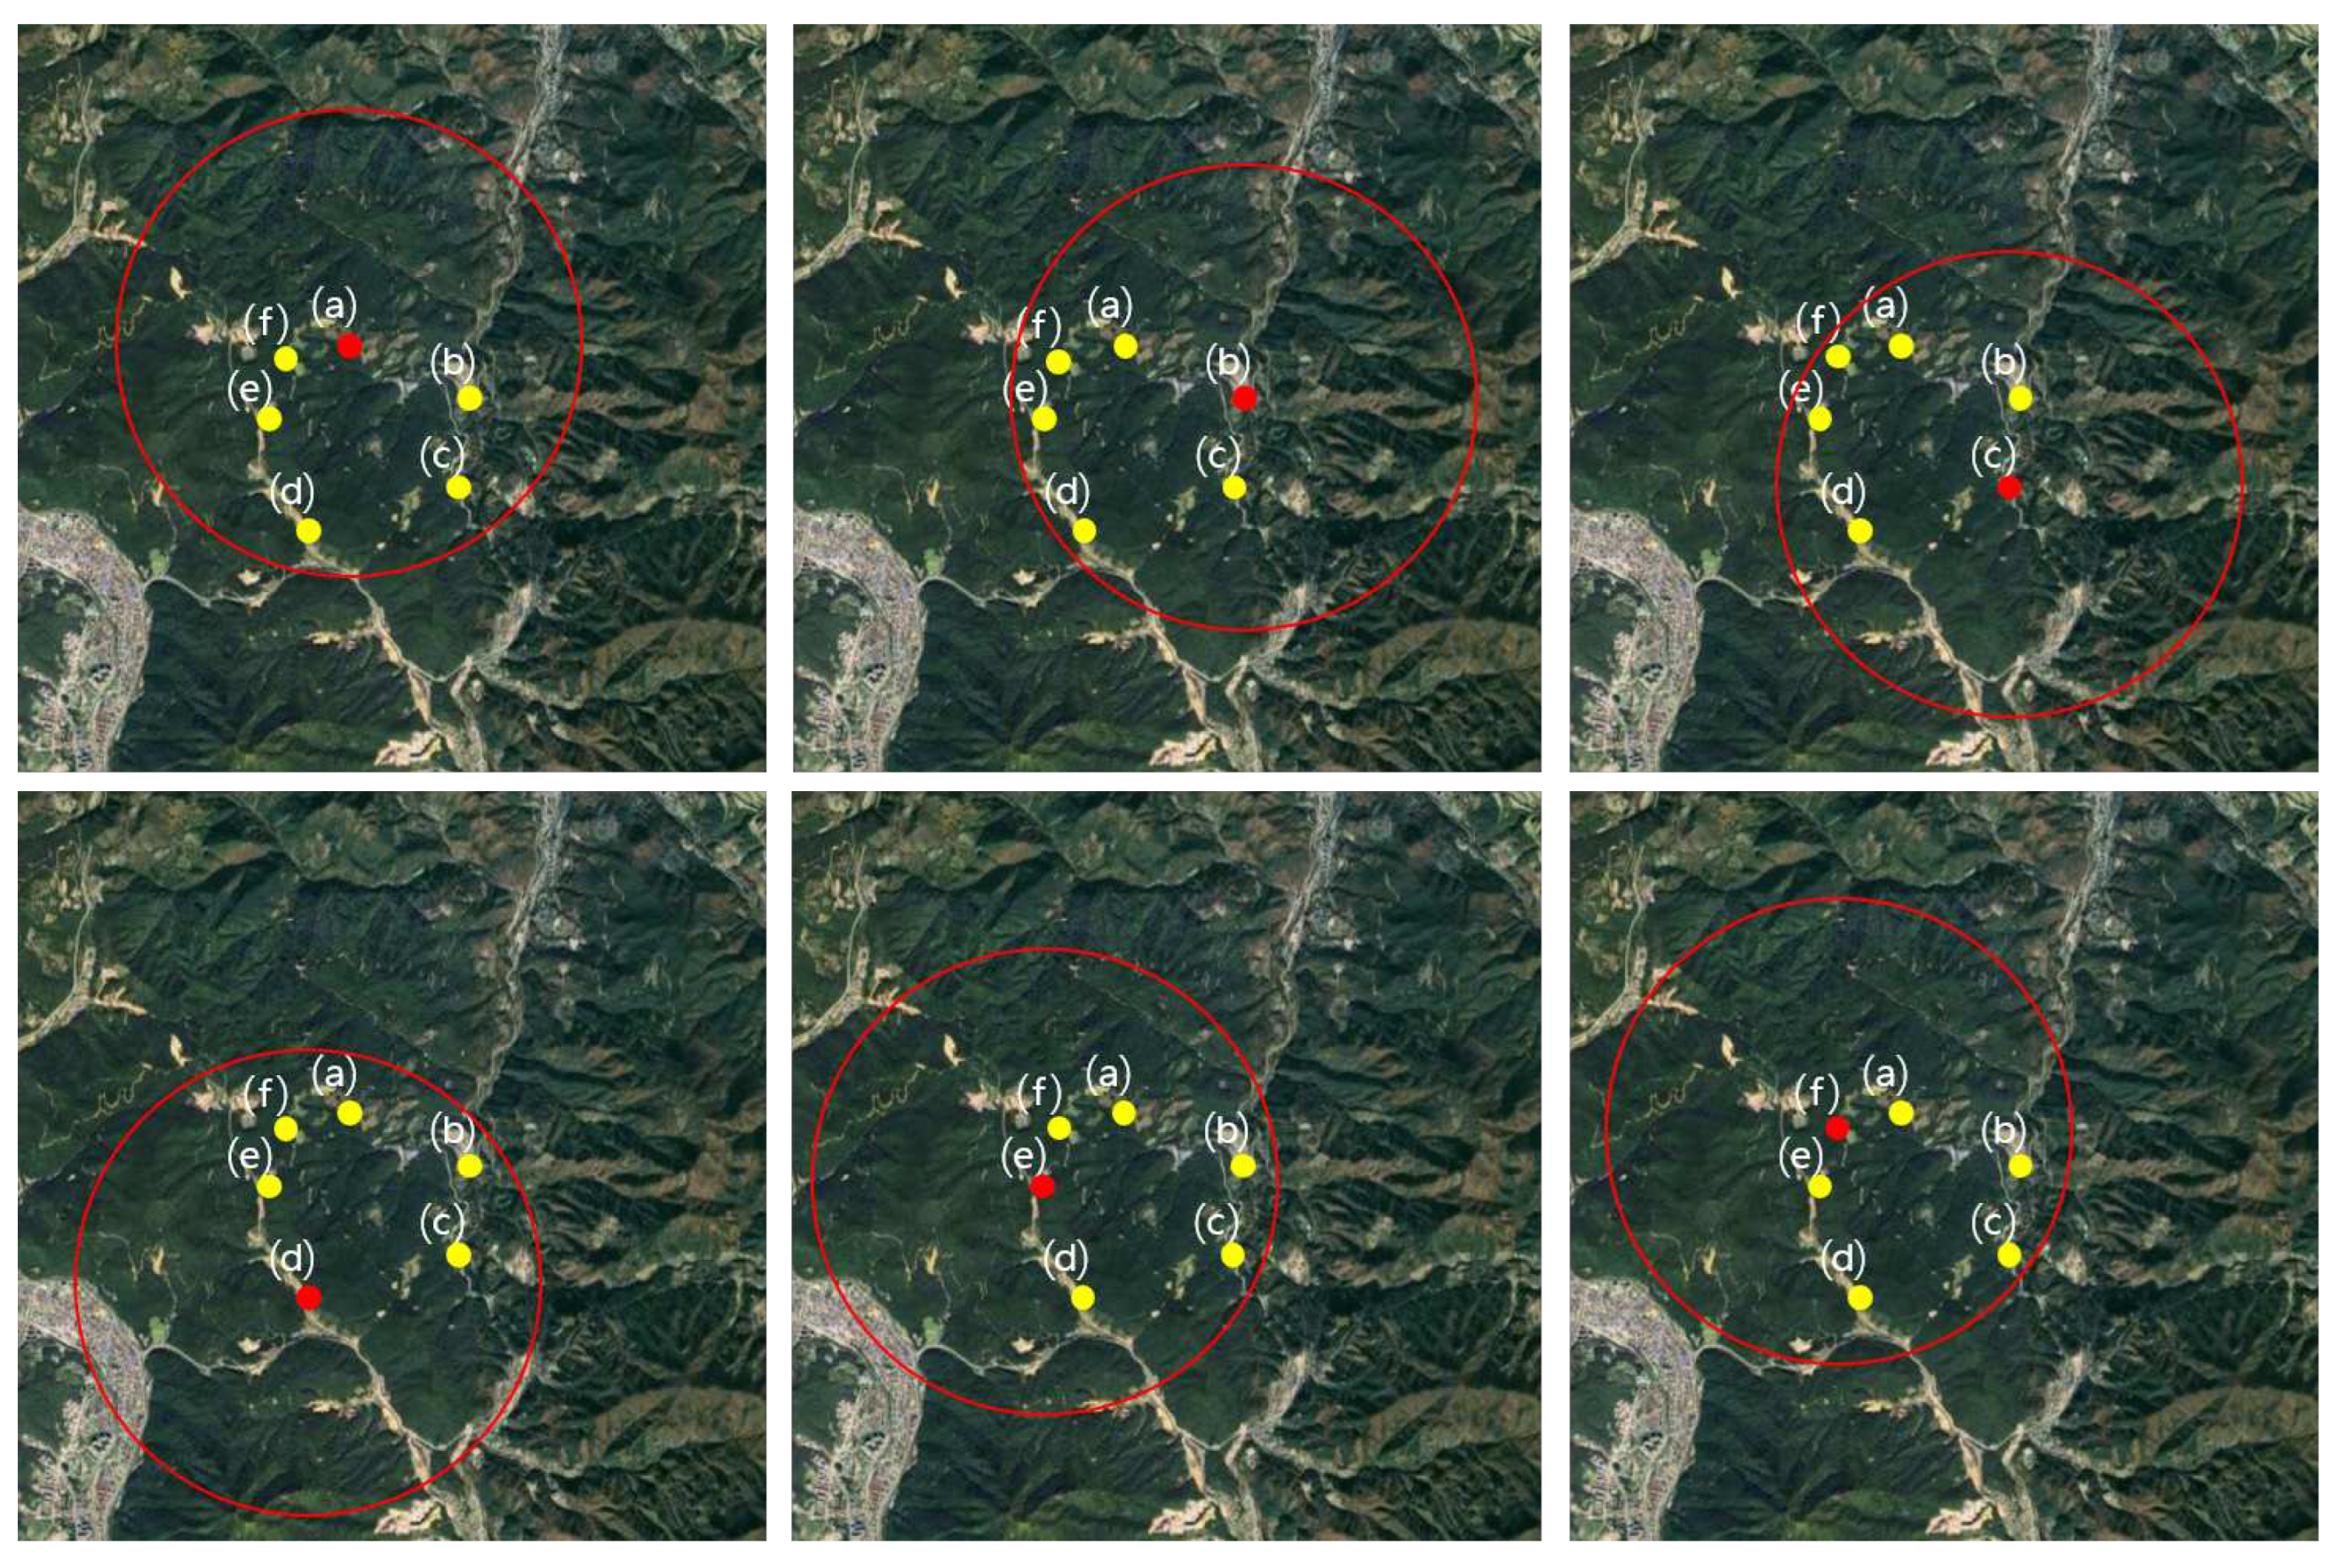
Figure 2.
Example of the process of constructing Training data by merging final evaluation score data and past occurrence history data.
Figure 2.
Example of the process of constructing Training data by merging final evaluation score data and past occurrence history data.
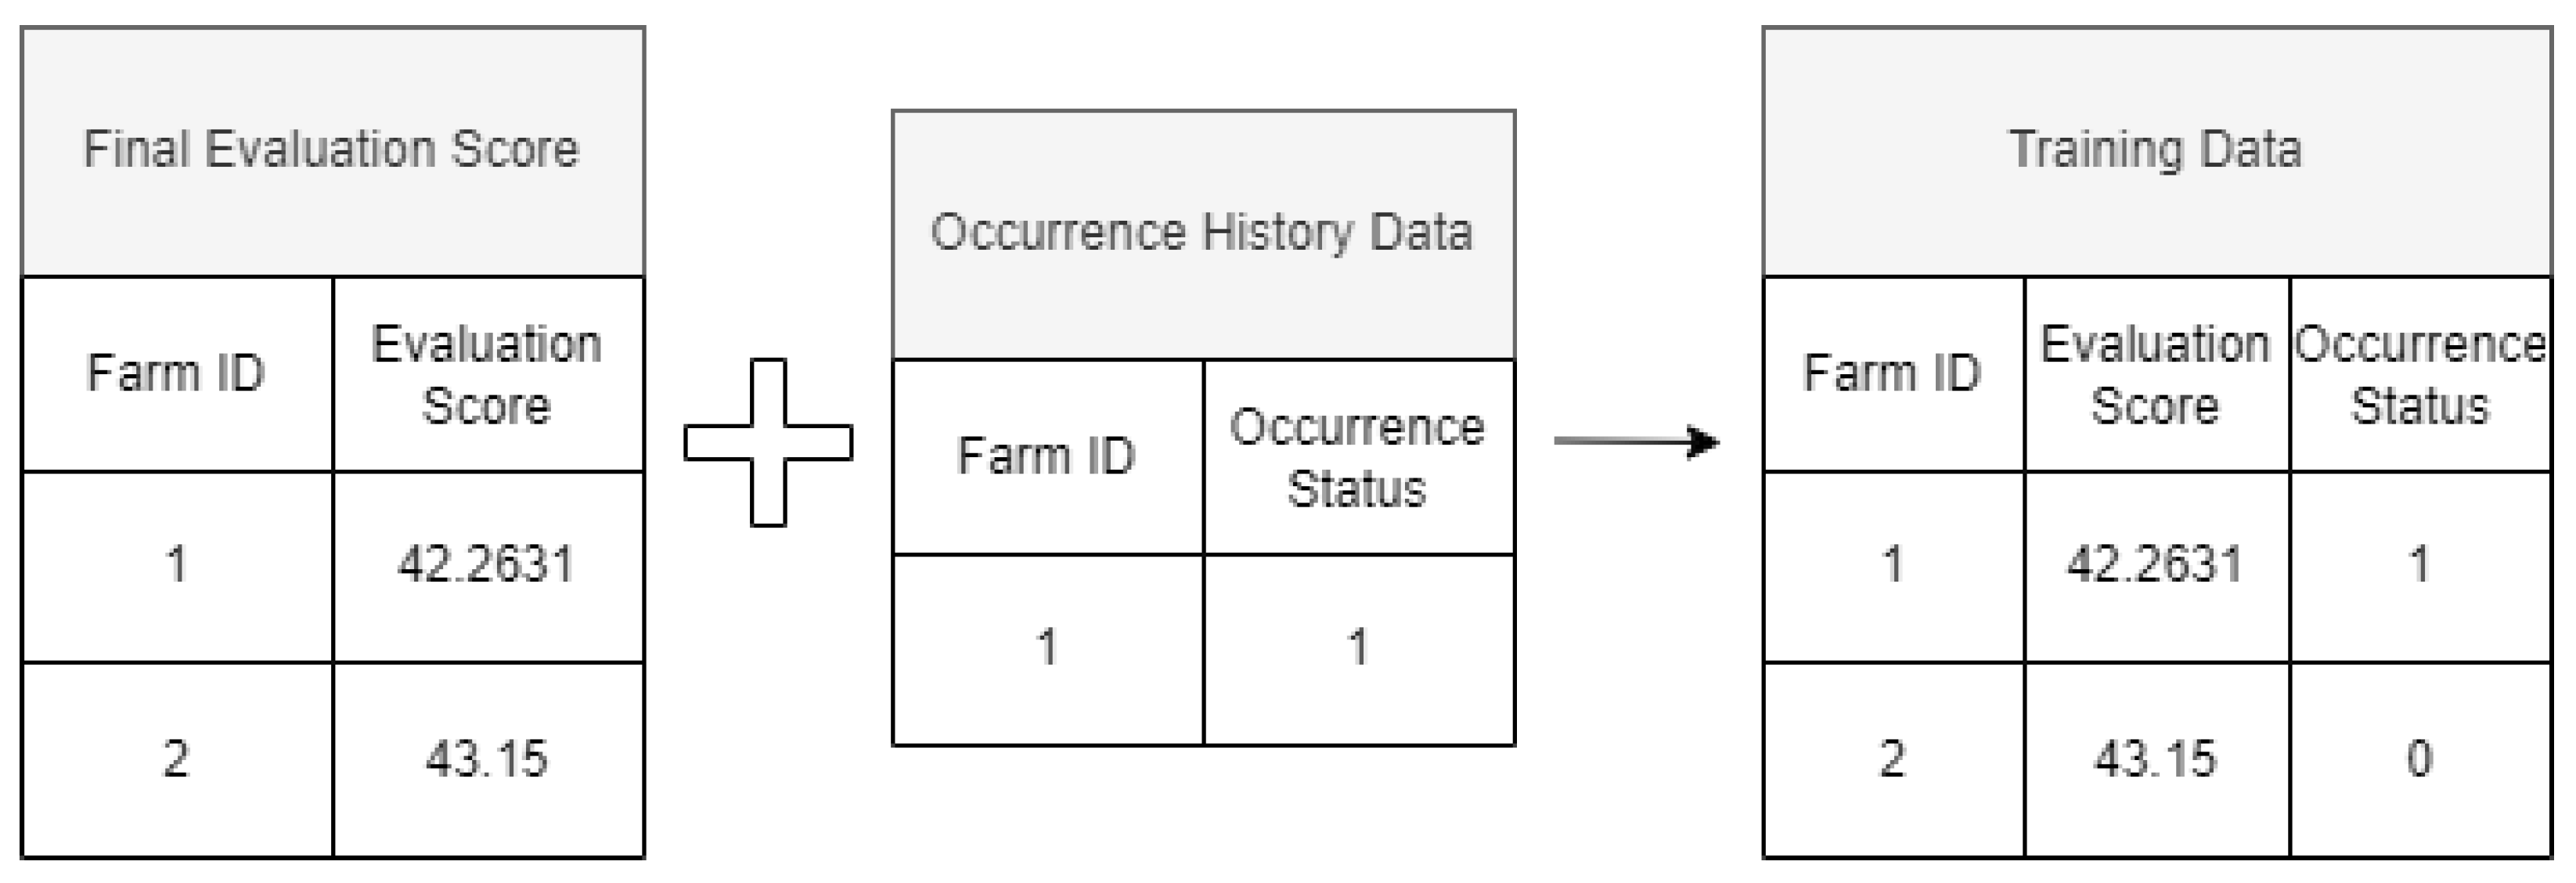
Figure 3.
Example of the process of deriving a criterion score by dividing training data into feature data and target data.
Figure 3.
Example of the process of deriving a criterion score by dividing training data into feature data and target data.
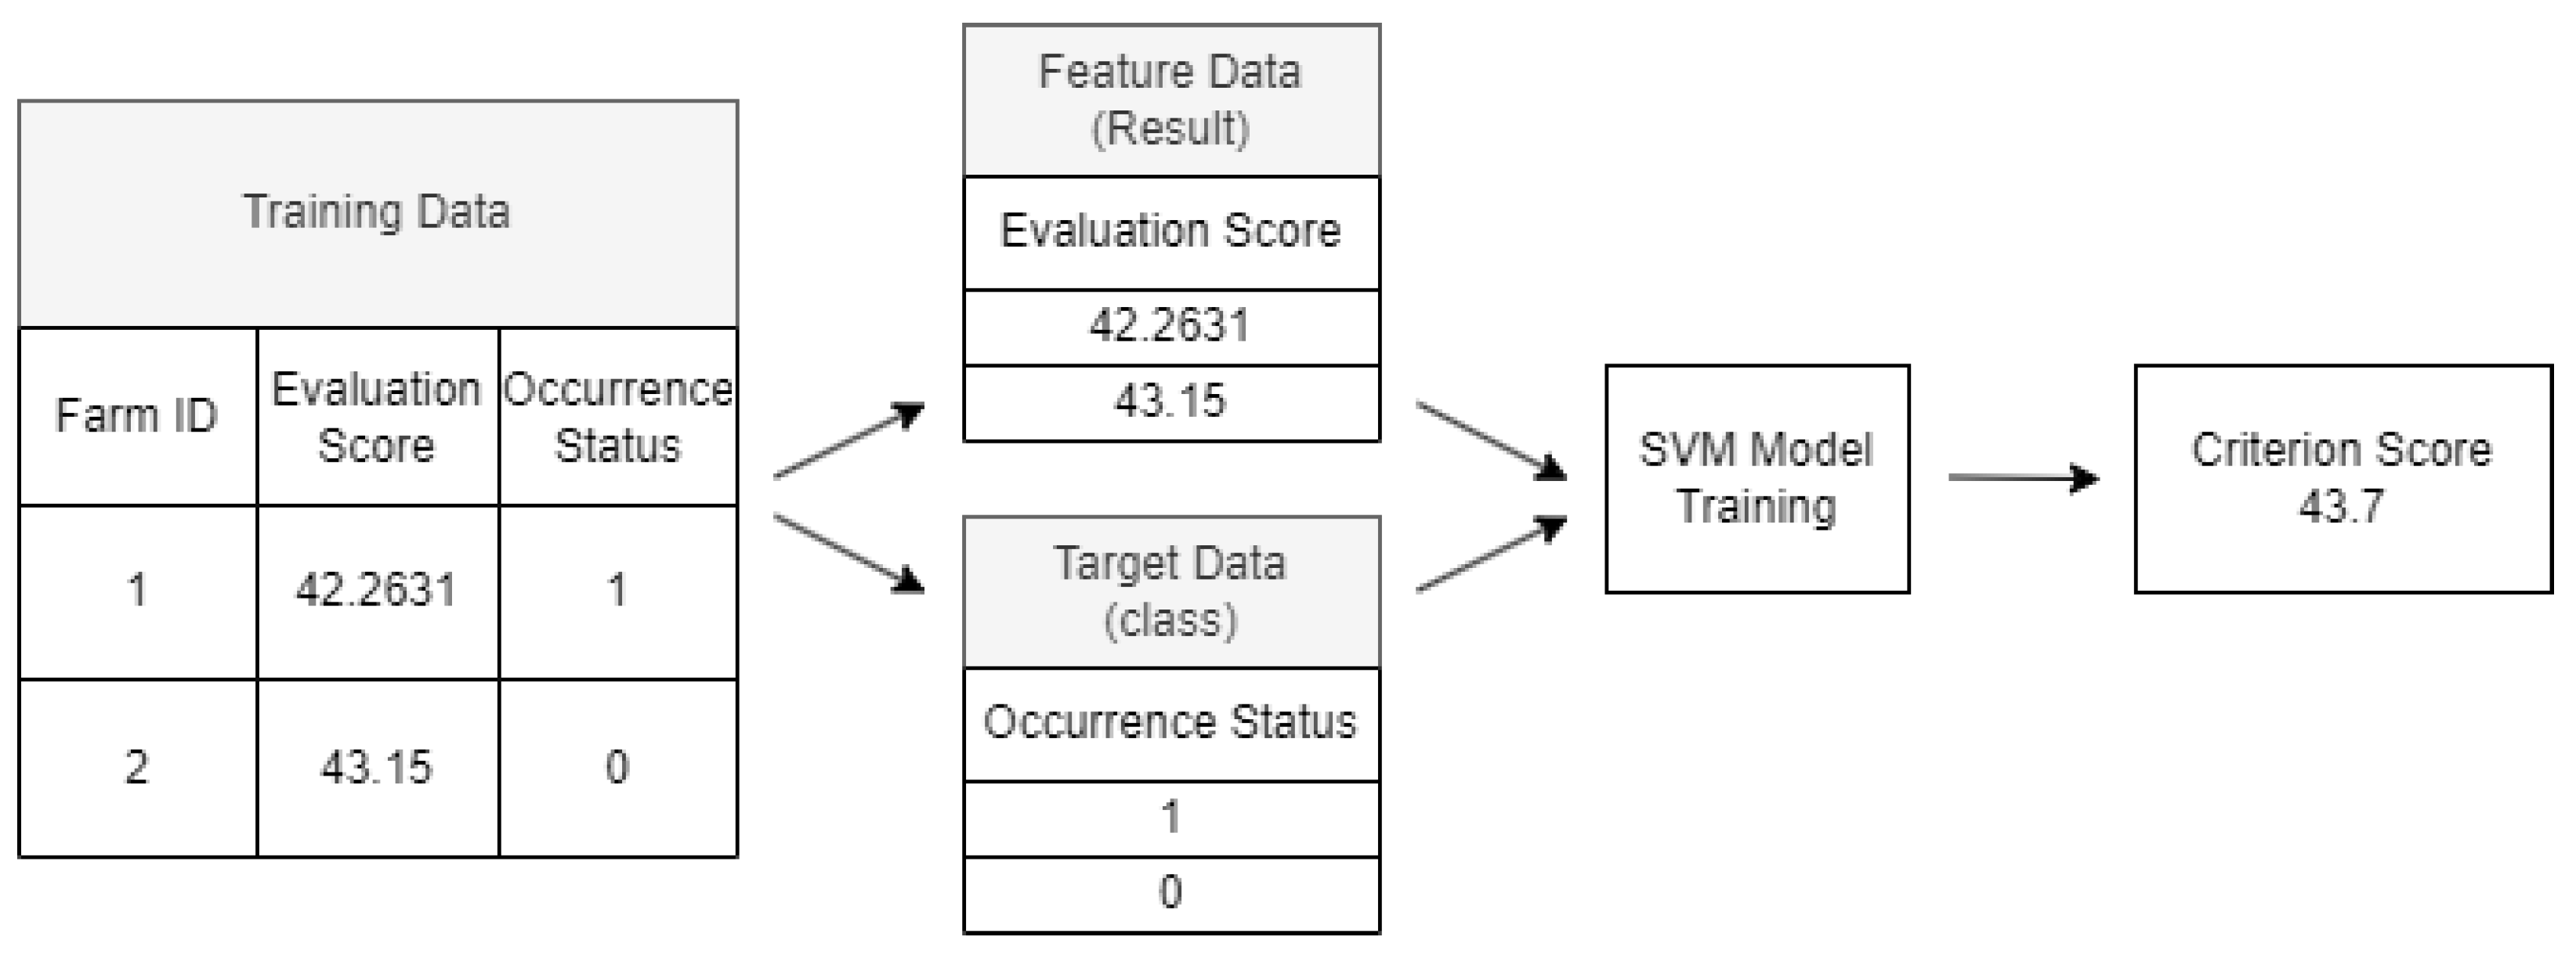
Figure 4.
SVM model learned by setting the weights for each class to be the same (a) and SVM model learned by deriving the optimal weights (b).
Figure 4.
SVM model learned by setting the weights for each class to be the same (a) and SVM model learned by deriving the optimal weights (b).
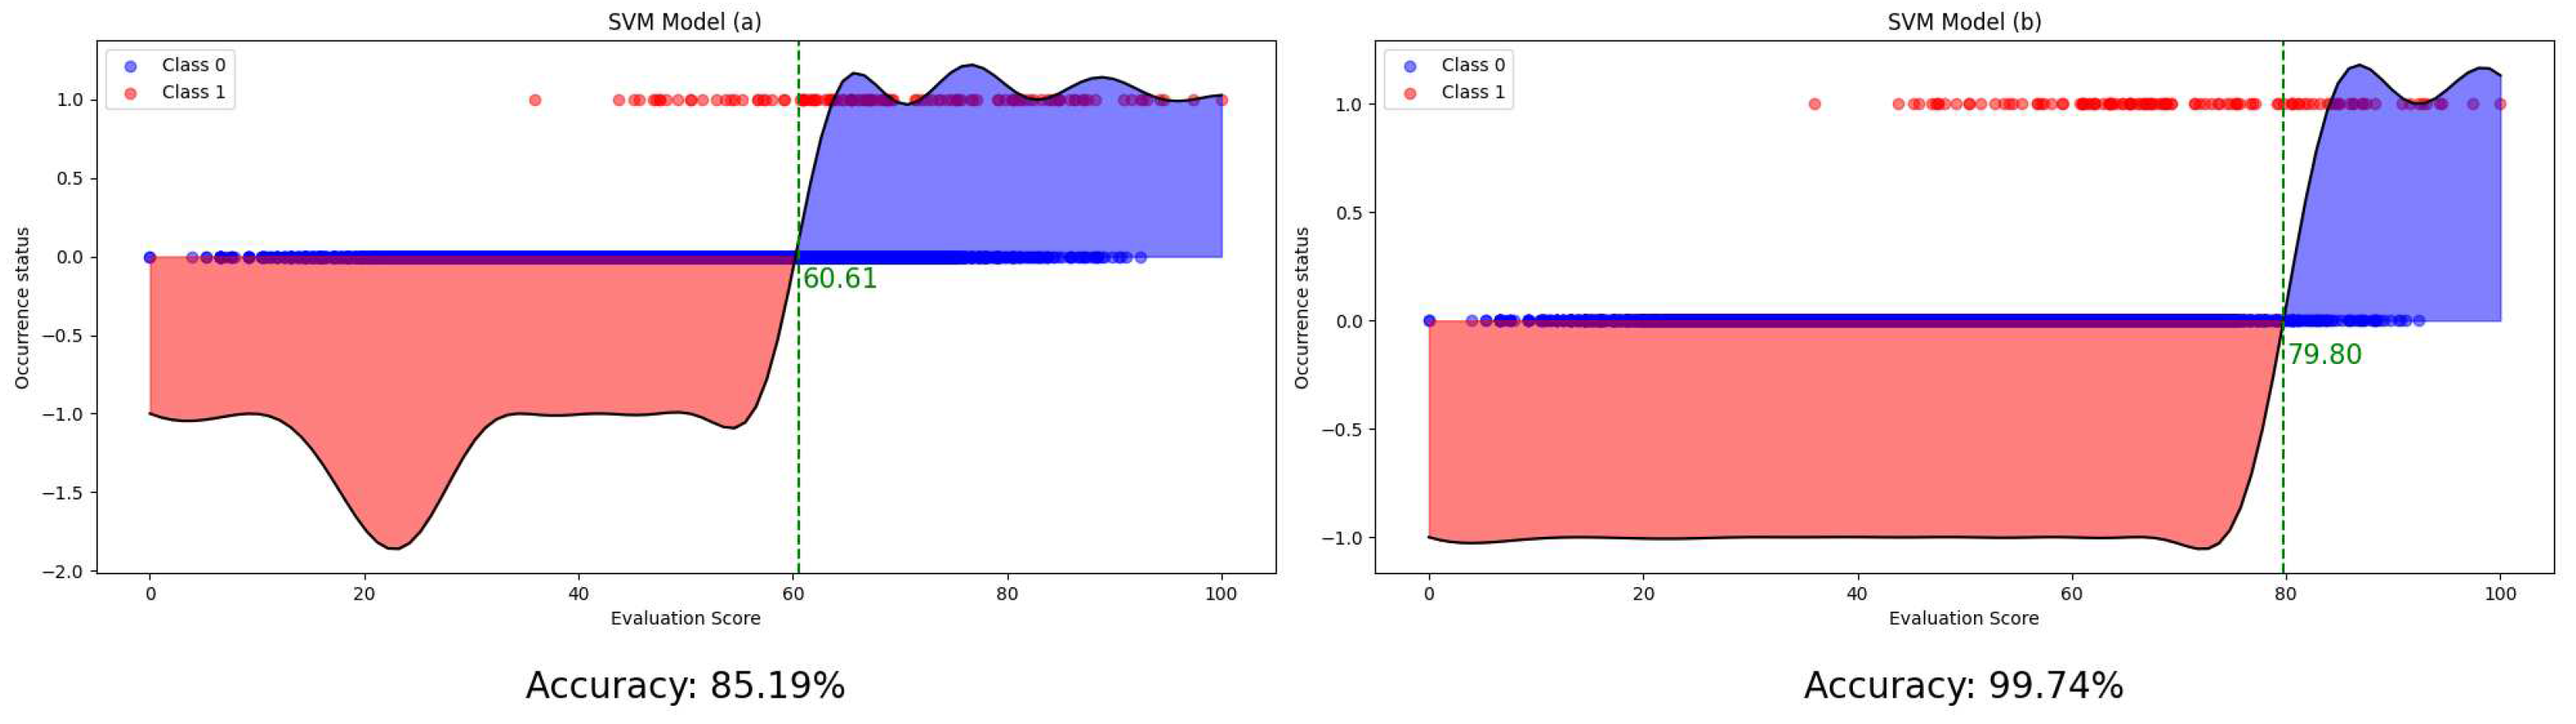

Table 1.
Decision rules related to geographical information for HPAI quarantine zone designation.
| Highly Pathogenic Avian Influenza (HPAI) Farm Culling Criteria | Score | ||
|---|---|---|---|
| Terrain | Mountain range | In cases where there are mountain ranges or terrains with an altitude of 50m or higher blocking the direct path between the farm under analysis and the nearby farm. |
-10 |
| If the farm under analysis is located in the mountains or a mountain is within 100m proximity. |
+3 | ||
| River ratio | When the proportion of national rivers or local rivers within 3km of the farm under analysis is 3% or higher. |
+5 | |
| When the proportion of national rivers or local rivers within 3km of the farm under analysis is between 2% and 3%. |
+2 | ||
| When the proportion of national rivers or local rivers within 3km of the farm under analysis is between 1% and 2%. |
+1 | ||
| When the proportion of national rivers or local rivers within 3km of the farm under analysis is 1% or less. |
-2 | ||
Table 2.
Decision rules related to the status around farms for designating HPAI quarantine zones.
| Highly Pathogenic Avian Influenza (HPAI) Farm Culling Criteria | Score | ||
|---|---|---|---|
| Status around the farm | Road proximity | In cases where the distance between the farm under analysis and the surrounding road (with 2 or more lanes) is within 1km. |
+5 |
| In cases where the distance between the farm under analysis and the surrounding road (with 2 or more lanes) is between 1km and 3km. |
+2 | ||
| In cases where the distance between the farm under analysis and the surrounding road (with 2 or more lanes) exceeds 3km. |
-3 | ||
| Population density | When the population density of the administrative area where the farm under analysis is located is 100 or more per 1 km2. |
+5 | |
| When the population density of the administrative area where the farm under analysis is located is 50 or more per 1 km2. |
+2 | ||
| When the population density of the administrative area where the farm under analysis is located is 30 or more per 1 km2. |
+1 | ||
| When the population density of the administrative area where the farm under analysis is located is 20 or fewer per 1 km2. |
-2 | ||
| Farm density | When the combined number of poultry and duck farms in the administrative area of the farm under analysis is 1 or more per 1 km2. |
+10 | |
| When the combined number of poultry and duck farms in the administrative area of the farm under analysis is between 0.5 and 0.1 per 1 km2. |
+5 | ||
| When the combined number of poultry and duck farms in the administrative area of the farm under analysis is between 0.3 and 0.5 per 1 km2. |
+2 | ||
| When the combined number of poultry and duck farms in the administrative area of the farm under analysis is 0.3 or fewer per 1 km2. |
-2 | ||
| Farmland ratio | When the proportion of farmland within 3km of the farm under analysis is 30% or more. |
+5 | |
| When the proportion of farmland within 3km of the farm under analysis is between 20% and 30%. |
+2 | ||
| When the proportion of farmland within 3km of the farm under analysis is between 10% and 20%. |
+1 | ||
| When the proportion of farmland within 3km of the farm under analysis is 10% or less. |
-2 | ||
| Traditional market | When the distance between the analysis target farm and the market is less than 1km. |
+5 | |
| When the distance between the analyzed farm and the market is more than 1km and less than 2km. |
+3 | ||
| When the distance between the analysis target farm and the market is more than 2km and less than 5km. |
+2 | ||
| When the distance between the analysis target farm and the market exceeds 5km. |
-1 | ||
Table 3.
Decision rules related to breeding information, infectious disease information, meteorological information, epidemiological information, and ecological environment information for designating HPAI quarantine zones.
Table 3.
Decision rules related to breeding information, infectious disease information, meteorological information, epidemiological information, and ecological environment information for designating HPAI quarantine zones.
| Highly Pathogenic Avian Influenza (HPAI) Farm Culling Criteria | Score | ||
|---|---|---|---|
| Breed | Breeding type | In the case where the farm under analysis raises breeding chickens. | +0 |
| In the case where the farm under analysis raises meat chickens. | +0 | ||
| In the case where the farm under analysis raises laying hens. | +5 | ||
| In the case where the farm under analysis raises breeding ducks. | +20 | ||
| In the case where the farm under analysis raises meat ducks. | +15 | ||
| Epidemic information | Analyzing nearby farm distances | If the distance between the farm under analysis and the nearby farm is within 500m. |
+30 |
| If the distance between the farm under analysis and the nearby farm is 500m 3km. |
+5 | ||
| If the distance between the farm under analysis and the nearby farm is 3km 10km. |
+2 | ||
| If the distance between the farm under analysis and the nearby farm exceeds 10km. |
-5 | ||
| Weather | Temperature | If the temperature on the day of analysis is below 0℃. | +7 |
| If the temperature on the day of analysis is 0℃ 15℃. | +5 | ||
| If the temperature on the day of analysis is 15℃ 20℃. | +3 | ||
| If the temperature on the day of analysis is 20℃ 30℃. | +0 | ||
| If the temperature on the day of analysis exceeds 30℃. | -10 | ||
| Wind direction | If the wind blows from the nearby farm under analysis towards the farm under analysis at an average speed of 3.3 m/s or more on the day of analysis. |
+5 | |
| Epidemiological history | Analysis farm occurrence history | In the case where the farm under analysis has had one occurrence of HPAI in the past 5 years. |
+10 |
| In the case where the farm under analysis has had two occurrences of HPAI in the past 5 years. |
+20 | ||
| In the case where the farm under analysis has had three occurrences of HPAI in the past 5 years. |
+40 | ||
| Ecological environment | Distance from migratory bird habitat | If the distance between the farm under analysis and the main migratory bird habitat is within 15km. |
+7 |
| If the distance between the farm under analysis and the main migratory bird habitat is 15 30km. |
+3 | ||
| If the distance between the farm under analysis and the main migratory bird habitat exceeds 30km. |
-3 | ||
Table 4.
Final evaluation score calculated with each farm being analyzed once from (a) to (f) in Figure 1.
Table 4.
Final evaluation score calculated with each farm being analyzed once from (a) to (f) in Figure 1.
| Farm Name | Evaluation Score | Final Evaluation Score |
|---|---|---|
| (a) | =45, =30, =48, =32, =38 | |
| (b) | =50, =54, =55, =60, =58 | |
| (c) | =12, =16, =18, =20, =9 | |
| (d) | =50, =54, =55, =60, =58 | |
| (e) | =88, =76, =74, =79, =85 | |
| (f) | =33, =35, =50, =48, =39 |
Table 5.
Individual farm session comprehensive evaluation index.
| Experiment Method | Recall | Precision | Accuracy | F1 score |
|---|---|---|---|---|
| Conventional Method | 1 | 0.1037 | 0.1037 | 0.1817 |
| Proposed Method (w=1) | 0.7865 | 0.4252 | 0.8408 | 0.5046 |
| Proposed Method (w=485) | 0.9851 | 0.1805 | 0.4537 | 0.2829 |
| Proposed Method (w=8.5) | 0.839 | 0.489 | 0.8419 | 0.5619 |
Table 6.
Session evaluation metrics by year.
| Year of Occurrence | Experiment Method | Recall | Precision | Accuracy | F1 score |
|---|---|---|---|---|---|
| ]4*2014 | Conventional Method | 1 | 0.093023 | 0.093023 | 0.17 |
| Proposed Method (w=1) | 0.75 | 0.222222 | 0.732558 | 0.343 | |
| Proposed Method (w=485) | 1 | 0.145455 | 0.453488 | 0.254 | |
| Proposed Method (w=8.5) | 0.75 | 0.222222 | 0.732558 | 0.343 | |
| ]4*2015 | Conventional Method | 1 | 0.134043 | 0.134043 | 0.236 |
| Proposed Method (w=1) | 0.952381 | 0.437956 | 0.829787 | 0.6 | |
| Proposed Method (w=485) | 1 | 0.225806 | 0.540426 | 0.368 | |
| Proposed Method (w=8.5) | 0.904762 | 0.431818 | 0.82766 | 0.585 | |
| ]4*2016 | Conventional Method | 1 | 0.060241 | 0.060241 | 0.114 |
| Proposed Method (w=1) | 1 | 0.138889 | 0.626506 | 0.244 | |
| Proposed Method (w=485) | 1 | 0.104167 | 0.481928 | 0.189 | |
| Proposed Method (w=8.5) | 1 | 0.138889 | 0.626506 | 0.244 | |
| ]4*2017 | Conventional Method | 1 | 0.054348 | 0.054348 | 0.103 |
| Proposed Method (w=1) | 1 | 0.714286 | 0.978261 | 0.833 | |
| Proposed Method (w=485) | 1 | 0.076923 | 0.347826 | 0.143 | |
| Proposed Method (w=8.5) | 1 | 0.714286 | 0.978261 | 0.833 | |
| ]4*2020 | Conventional Method | 1 | 0.02381 | 0.02381 | 0.047 |
| Proposed Method (w=1) | 1 | 0.111111 | 0.809524 | 0.2 | |
| Proposed Method (w=485) | 1 | 0.034483 | 0.333333 | 0.067 | |
| Proposed Method (w=8.5) | 1 | 0.125 | 0.833333 | 0.222 | |
| ]4*2021 | Conventional Method | 1 | 0.057143 | 0.057143 | 0.108 |
| Proposed Method (w=1) | 1 | 0.4 | 0.914286 | 0.571 | |
| Proposed Method (w=485) | 1 | 0.090909 | 0.428571 | 0.167 | |
| Proposed Method (w=8.5) | 1 | 0.4 | 0.914286 | 0.571 | |
| ]4*2022 | Conventional Method | 1 | 0.097436 | 0.097436 | 0.178 |
| Proposed Method (w=1) | 0.368421 | 0.466667 | 0.897436 | 0.412 | |
| Proposed Method (w=485) | 0.894737 | 0.114865 | 0.317949 | 0.204 | |
| Proposed Method (w=8.5) | 0.631579 | 0.461538 | 0.892308 | 0.533 | |
| ]4*2023 | Conventional Method | 1 | 0.030303 | 0.030303 | 0.059 |
| Proposed Method (w=1) | 1 | 0.333333 | 0.939394 | 0.5 | |
| Proposed Method (w=485) | 1 | 0.037037 | 0.212121 | 0.071 | |
| Proposed Method (w=8.5) | 1 | 0.285714 | 0.924242 | 0.444 |
Disclaimer/Publisher’s Note: The statements, opinions and data contained in all publications are solely those of the individual author(s) and contributor(s) and not of MDPI and/or the editor(s). MDPI and/or the editor(s) disclaim responsibility for any injury to people or property resulting from any ideas, methods, instructions or products referred to in the content. |
© 2023 by the authors. Licensee MDPI, Basel, Switzerland. This article is an open access article distributed under the terms and conditions of the Creative Commons Attribution (CC BY) license (http://creativecommons.org/licenses/by/4.0/).
Copyright: This open access article is published under a Creative Commons CC BY 4.0 license, which permit the free download, distribution, and reuse, provided that the author and preprint are cited in any reuse.


