
Submitted:
18 October 2023
Posted:
20 October 2023
You are already at the latest version
Abstract
Haemonchus contortus (H. contortus) is a gastrointestinal parasite affecting small ruminants, leading to a significant decline in animal productivity. In this study, we developed a nanovaccine by encapsulating the recombinant protein rHcES-15, derived from the excretory/secretory products of H. contortus, within biodegradable poly (D, L-lactide-co-glycolide) (PLGA) nanoparticles (NPs). To construct the nanovaccine, PLGA NPs were prepared using a modified double emulsion solvent evaporation technique. Scanning electron microscopy (SEM) illustrated successful encapsulation of rHcES-15 within PLGA NPs, with a size ranging between 350-400 nm. The encapsulation efficiency (EE) of the antigen in the nanovaccine was determined to be 72%. A total of forty experimental mice were divided into five groups, receiving the nanovaccine on day 0 and being humanely sacrificed at the end of the 14-day trial. The stimulation index (SI) from mice vaccinated with the nanovaccine indicated an amplified lymphocyte proliferation and a significant increase in anti-inflammatory cytokines (IL-4, IL-10, and IL-17). Furthermore, the percentages of T-cells (CD4+, CD8+) and dendritic cell phenotypes (CD83+, CD86+) were substantially upregulated in mice immunized with the nanovaccine compared to control groups and the rHcES-15 group. Similarly, higher levels of antigen-specific serum immunoglobulins (IgG1, IgG2a, IgM) were observed in response to the nanovaccine compared to both the antigenic (rHcES-15) and control groups. In conclusion, the data strongly supports the notion that encapsulation of rHcES-15 within PLGA NPs effectively stimulates immune cells in vivo, ultimately augmenting antigen-specific adaptive immune responses against H. contortus. This discovery highlights the promising potential of the nanovaccine, justifying additional investigations to ascertain its efficacy finally.
Keywords:
Haemonchus contortus
; rHcES-15
; PLGA
; nanoparticles
; vaccination
; mice
1. Introduction
Haemonchus contortus (H. contortus) is accountable for significant economic losses due to its voracious blood-sucking behavior, particularly in abomasum of small ruminants [1]. Infection of this worm results in anemia, diarrhea, weight loss, edema, lethargy, and ultimately, death in affected animals [2]. Anti-parasitic drugs targeting this worm typically encounter resistance from gastrointestinal nematodes (GIN) resistance [3]. Consequently, there is substantial interest among scientists in developing new approaches, such as selective breeding and vaccination, as alternative methods of prevention against H. contortus infection [1,4].
GIN such as H. contortus releases substantial volume of excretory/secretory proteins (ESPs) during their developmental stages both in vitro and within their host animals (Sheep/Goat) [5]. These ESPs exhibit the capacity to either circulate within the extracellular region or be localized to and discharged from the cell surface of the host organism [6]. Subsequently, compared to other cellular components, these proteins are more susceptible to the action of drugs [7]. Additionally, due to their immunogenic properties [8], ESPs present promising targets for therapeutic intervention against parasitic infections [9]. Two smaller-sized proteins (ES-15, ES-24) have been isolated and purified from H. contortus excretory/secretory proteins (HcESPs) in vitro [10,11,12]. Furthermore, immunization with ESPs of low molecular weight triggered hypersensitivity responses in genetically resistant sheep [13] and incited immune responses of the Th2 type [14,15]. Moreover, it was reported that during interaction with goat peripheral blood mononuclear cells (PBMCs) and dendritic cells (DC), rHcES-15 prompted differentiation and proliferation of these cells, inducing notable immunomodulatory functions. [16,17]. This finding provides valuable insight supporting the utilization of this antigen in the ongoing study.
One strategy in the realm of vaccine development involves incorporating potent adjuvants aimed at augmenting vaccine immunogenicity to instigate a robust immune response against diverse pathogens, such as Toxoplasmosis [18] and Leishmaniasis [19] in animal subjects. In the absence of adjuvants, intricate biological molecules like proteins (antigens) and their constituents demonstrate diminished immunological activity during the formulation of vaccines [20]. However, the amalgamation of an adjuvant with the antigen holds the potential to enhance the immunological response [21]. Studies have revealed an 82% improvement in the efficacy of purified antigen when used in conjunction with adjuvants in vaccine formulations [22]. Nonetheless, certain adjuvants possess the propensity to induce significant inflammation, potentially hindering their application in human subjects due to associated side effects [23].
Nanoparticles (NPs) constructed from biodegradable and biocompatible polymers, notably PLGA, have proven to be secure and efficacious as adjuvants in drug delivery. They efficiently encapsulate antigens, contributing to the development of controlled-release NP vaccines targeting parasitic infections in murine models [24,25]. The investigations of these polymeric materials in both vaccine and drug delivery studies have demonstrated significant variances in their capacity to modulate immune responses specific to antigens [26,27].
In our present investigation, we utilized a nanovaccine formulation containing the antigen rHcES-15, encapsulated within PLGA nanoparticles. This formulation was administered subcutaneously to Institute of Cancer Research (ICR) mice. The ensuing immune response elicited by the nanovaccine was meticulously evaluated and compared against rHcES-15 in its non-encapsulated state. Our analysis revealed a heightened secretion of cytokines and antibodies, increased proliferation of lymphocytes, and amplified multiplication of immune cells (T cells and DCs) in response to the nanovaccine. This validates the immunogenic potential of both the biopolymer, PLGA, and the antigen.
2. Material and Method
2.1. Ethics Declaration
The experimental procedures were conducted following approval from the Science and Technology Agency of Jiangsu Province (Approval No. SYXK (SU) 2010-0005). Animal experimentation strictly adhered to the guidelines stipulated by the Animal Welfare Council of China. Diligent efforts were taken to minimize any distress experienced by the animals, and regular health assessments were performed throughout the duration of the experiments.
2.2. Reagents and Chemicals
PLGA (lactic acid: glycolide 65:35, Mw = 40,000-75,000), polyvinyl alcohol (PVA, Mw = 31,000-50,000), and Concanavalin A were sourced from Sigma Aldrich (St. Louis, MO, USA). The Enhanced Cell Counting Kit-8 was procured from Beyotime Biotech (Shanghai, China PR), and the BCA Protein Assay Kit was obtained from CW Biotech (Beijing, China PR). Heat-inactivated fetal bovine serum (FBS), Roswell Park Memorial Institute medium (RPMI 1640), and penicillin and streptomycin solutions were acquired from Gibco (Carlsbad, CA, USA). Antibodies, namely PE rat anti-mouse CD83 (clone: Michel-19), PE rat anti-mouse CD86 (clone: GL1), APC hamster anti-mouse CD11c (clone: HL3), PE rat anti-mouse CD4 (clone: RM4-5), PE rat anti-mouse CD8a (clone: 53-6.7), and APC hamster anti-mouse CD3e (clone: 145-2C11), were sourced from Bio-legend (San Diego, CA, USA). The purified recombinant HcES-15 proteins and pET-32a expressed in the BL21 (E. coli) prokaryotic expression system were obtained from the Laboratory of Molecular Parasitology and Immunology, Nanjing Agricultural University, China [16].
2.3. Mice
Forty female ICR mice, aged 8-10 weeks with a body weight of 18-20g, were obtained from the Experimental Animal Center of Jiangsu (SCXK 2017–0001) [27]. The mice were raised in a specific pathogen-free (SPF) environment with access to sterilized food and water ad libitum.
2.4. Optimization of the Working Concentration of Polyvinyl Alcohol (PVA)
In the process of preparing PLGA nanoparticles, it is imperative to ascertain the concentration of Polyvinyl Alcohol (PVA) (Sigma Aldrich, St. Louis, MO, USA) due to its crucial role as a constituent in PLGA [28]. Consequently, a thorough investigation into the optimal working concentration of polyvinyl alcohol (PVA) was conducted prior to commencing the nanoparticle preparation. Three distinct concentrations of PVA were employed: 1%, 4%, and 6% to testify the optimal concentration of PVA. The morphological and size characterization of the resulting PLGA nanoparticles under these specified PVA concentrations were analyzed using scanning electron microscopy (JEOL, Akishima-shi, Tokyo, Japan).
2.5. Synthesis of rHcES15 Antigen-Loaded and Blank PLGA NPs
To synthesize PLGA NPs, the double emulsion method (w/o/w) was employed as described previously [24] with modifications under sterile conditions. Briefly, rHcES-15 recombinant protein (1mg/mL) was dissolved in a 6% PVA solution to form the inner aqueous phase. Subsequently, an organic phase consisting of 5% PLGA in methylene chloride (50mg PLGA in 1 ml methylene chloride) was prepared. The inner aqueous phase and the organic phase were mixed to create a w/o emulsion using an ultrasonic processor (JY92-IIN, Scientz Biotechnology, Ningbo, Zhejiang, China PR) for 4 minutes (40w, 5s, 5s) in an ice bath. This w/o emulsion was then introduced into the aqueous phase (containing 6% PVA) and subjected to further sonication under the same conditions to obtain the final emulsion (w/o/w).
Additionally, the organic solvent from the emulsion was evaporated under magnetic stirring at 800 rpm for 4-5 hours in a fume cabinet at room temperature (RT). The obtained antigen-loaded NPs were separated from the solution of NPs by centrifugation at 22,000 × g for 45 min at 4 °C. Following this, the supernatant was gathered to calculate protein loading efficiency utilizing the BCA protein assay kit. The remaining precipitate of NPs was washed twice with ultrapure water and was freeze-dried (Labconco™, Thermo Fisher Scientific, Waltham, MA, USA) for 24 hours and stored at -80 oC for next experiment.
The process for producing empty PLGA nanoparticles mirrored the method for generating rHcES-15 loaded PLGA nanoparticles, excluding the incorporation of the rHcES-15 protein. Sterile PBS was used in the primary emulsion formation to prepare blank NPs to serve as a negative control in further experiments.
2.6. Characterization of rHcES-15 Antigen-Loaded PLGA NPs
2.6.1. Encapsulation Efficiency (EE), Loading Capacity (LC), and in vitro Cumulative Release (CR) of rHcES-15 Antigen
The supernatants collected post-washing of the nanoparticles were employed to compute the protein encapsulation efficiency (EE) and loading capacity (LC) of rHcEs-15 using the BCA protein assay kit, using the subsequent equations [27,29]. The protein loading capacity of rHcES15+PLGA was calculated indirectly by estimating the difference between the initial amount of protein used for loading PLGA NPs and protein left in supernatant.
EE = (total protein - unbound protein)/total protein × 100%
LC = loaded protein/total mass of nano-vaccine × 100%
To examine the kinetic study of the antigen, we also determine the cumulative release of rHcES-15 in vitro. PLGA NPs released rHcES-15 in solution and it was evaluated by observing changes of free antigen (rHcES-15). Briefly, lyophilized NPs (3mg) were disseminated in 150 µL of PBS (pH 7.4) in a glass container which was put on the shaker bath (37 oC, 120 rpm). The suspension underwent centrifugation at 12,000 rpm for 15 minutes. Afterward, 60µL of the supernatant was carefully withdrawn and promptly replaced with an equal volume of fresh PBS at specific time points (0, 1, 3, 5, 7, 9, 11, 13, 15, 17, 19, and 21 days). Subsequently, the BCA Protein Assay Kit was utilized to measure the concentration of unbound rHcES-15 protein in the supernatants. All experimental procedures were conducted in triplicate.
2.6.2. SEM for Determination of Shape, Size, and Measurement of Zeta Potential of NPs
The size and morphology of rHcES-15+PLGA NPs were determined through a scanning electron microscope (SEM, JEOL IT-100, S-4800 N, Tokyo, Japan). The antigen-loaded NPs were filled into aluminum stubs (powder form) that were already coated with platinum. The zeta potential of the nanoparticles was measured using a zeta potential analyzer (Zeta plus, Brookhaven Instruments Co, NY, USA). All zeta potential measurements were carried out at 25°C under an electric field of 11.00 V/cm [30].
2.6.3. The Integrity of Antigen-Loaded NPs
To evaluate the integrity of the antigen-loaded NPs, suspensions containing the antigen were heat-digested at 95°C for 20 minutes and then loaded at RT into a gel. Each sample consisted of 20 µL, and 5 µL was used for molecular weight markers (Thermo Fisher Scientific, Shanghai, China PR, 10-170 kDa). Electrophoresis was carried out at a constant voltage of 120 V for 90 minutes using a Bio-Rad 300 power pack (Bio-Rad, Hercules, CA, USA). The sodium dodecyl sulfate–polyacrylamide gel electrophoresis (SDS-PAGE) gel was subsequently stained with 0.025% Coomassie Brilliant Blue to visualize the antigen bands [31].
2.7. Mice Immunization
Forty ICR mice were randomly allocated into five groups of eight animals and vaccinated at 0 days. All experimental mice were killed humanely on the 14th day. Among all groups, PBS, pET-32a, and PLGA NP groups were set as control groups, while rHcES-15 and rHcES-15+PLGA NP (nanovaccine) groups were considered as experimental (treatment) groups. Subcutaneous (SC) injections containing 1 mL of vaccine (rHcES-15 antigen entrapped in PLGA NPs) with a total of 20μg rHcES-15 protein were injected at multiple places of mice following the method described earlier [21]. The details of the vaccination protocol are provided in Table 1.
2.8. Examination of Clinical Manifestations and Localized Reactions
Examination of clinical manifestations and localized responses was conducted to determine if the adjuvant antigen delivery systems employing nanoparticles could induce any abnormal changes in mice during the research trial. We observed and documented necropsy lesions, clinical signs, and neurological manifestations in five different groups of mice.
2.9. Antigen-Specific Serum Antibodies Assays
Blood samples were obtained from the mice prior to their sacrificial procedure on the 14th day, aligning with the methodology described in a preceding study [32]. The concentrations of antigen-specific antibodies (IgM, IgG2a, IgG1) in mouse sera were measured using mouse ELISA kits obtained from Heng Yuan, Shanghai, China PR, following the manufacturer’s instructions. In summary, 96-well microtiter plates were coated with rHcES-15 (20 µg/mL). After washing thrice with PBS (0.01 M) containing 0.05% Tween-20 (PBST), the wells were blocked using 5% non-fat dry skim milk powder (SMP) in PBST for 2 hours at 37°C. Following this, 100 µL of serum samples (diluted 1:50 in PBST-5% SMP) were added and incubated for 1 hour at 37°C. The plates were then treated with HRP-conjugated anti-mouse IgG1, IgG2a, and IgM antibodies (diluted to 1:3000 in blocking buffer from Sigma Aldrich, St. Louis, MO, USA) for 1 hour at 37°C to determine antibody levels and isotype analysis. Tetra-methyl benzidine (Sigma-Aldrich, St. Louis, MO, USA) substrate was employed to develop colors, and the results were observed using a spectrophotometer at an absorbance of 450 nm. All serum samples were evaluated in triplicate.
2.10. In vitro Measurement of Cytokines by ELISA
The levels of cytokines, including IL-4, IL-10, IL-17, IFN-γ, and TGF-β, in the serum of distinct mouse groups were determined using ELISA kits sourced from Heng Yuan, Shanghai, China PR. The measurements were conducted in accordance with the manufacturer’s instructions.
2.11. Evaluation of Splenic Lymphocyte Proliferation Assay
In order to measure the proliferative capacity of the splenic lymphocytes of the all mice, a lymphocytic proliferation assay was performed [33]. On the 14th day, the mice were euthanized humanely, and spleen lymphocytes, along with antigen-presenting cells (APC), were aseptically isolated using the Mouse Spleen Lymphocyte Isolation Kit (TBD, Tianjin, China PR). Briefly, the cells concentration was adjusted to 1 ×10⁷ cells/mL in the RPMI-1640 culture medium (CM) and incubated in 6-wells cell culture plates overnight. Next, cell supernatants (T and B cells) were collected and their concentrations adjusted to 1×10⁶ cells/mL. Subsequently, 1×10⁶ cells in 100 µL of culture medium (CM) supplemented with 10% heat-inactivated fetal calf serum (FCS), 100 U/mL penicillin, and 100 mg/mL streptomycin were added to each well of round-bottom 96-well culture plates. The cells were then stimulated with rHcES-15 (4 µg/mL) and incubated for an additional 72 hours under 5% CO2 at 37°C. Furthermore, CM-treated samples with concanavalin A (ConA, Sigma Aldrich, St. Louis, MO, USA) and without rHcES-15 were used as positive and blank controls, respectively [26]. Lymphocyte proliferation induced by the antigen (rHcES-15) in the harvested cells was evaluated using the Enhanced Cell Counting Kit-8 (CCK-8, Beyotime, Shanghai, China PR) as per the manufacturer’s instructions. The absorbance at a wavelength of 450 nm (A450 value) was recorded using a microtiter ELISA reader (Thermo Scientific Multiskan FC, Waltham, MA, USA). The outcomes were expressed as the stimulation index (SI) calculated using the following equation [25]:
where At represents the mean A450 value of the specific test group, and Ac represents the mean A450 value of the blank control group.
SI (%)=At/Ac×100
2.12. Analysis of Lymphocyte Phenotypes by Flow Cytometry
Flow cytometry was performed as described earlier [25] to evaluate the percentage of CD4+ and CD8+ T cells present in spleens of all experimental mice. The method for isolating T and B cells from immunized mice followed the same procedure as in the splenic lymphocyte proliferation assay. To determine the percentages of CD4+ and CD8+ T cells, the cells were stained with Hamster anti-CD3e-APC, Rat anti-CD4-PE, Hamster anti-CD3e-APC, and Rat anti-CD8a-PE antibodies (Biolegend, San Diego, CA, USA). The stained cells were then analyzed using a fluorescence-activated cell sorting machine (BD Biosciences, Franklin Lakes, NJ, USA).
2.13. Determination of DC Phenotypes by Flow Cytometry
Spleens were extracted from the experimental mice, and aseptic isolation of splenic cells was carried out using the Spleen Lymphocytes Isolation Kit. Briefly, the splenic lymphocytes were incubated in RPMI-1640 medium in 6-well culture plates overnight. Then, the supernatant of cells which containing non-adhering cells was discarded, and the wells of the cell plates were washed thrice with PBS. Following that, adherent cells were gently and thoroughly pipetted. After centrifugation and washing, the cells were stained with Hamster anti-CD11c-APC, Rat anti-CD83-PE, Hamster anti-CD11c-APC, and Rat anti-CD86-PE to assess the percentages of CD83+ and CD86+ on DCs. The stained cells were analyzed using flow cytometry on FACS Caliber (BD Biosciences, Franklin Lakes, NJ, USA).
2.14. Statistical Study
All experiments were performed in triplicates, and the data obtained were presented as mean ± standard error of the mean (SEM). Differences between groups were assessed using one-way analysis of variance (ANOVA), and the significance levels were indicated as follows: * p < 0.05, ** p < 0.01, and *** p < 0.001. FACS data analysis was conducted using Flow Jo version 10 software (version 10, Franklin Lakes, NJ, USA).
3. Results
3.1. Determination of Optimum PVA Concentration
The morphology and dimensions of PLGA NPs with varying PVA concentrations (1%, 4%, and 6%) were examined using SEM. The results revealed that NPs prepared with 6% PVA displayed a relatively smaller particle size, typically around 350 nm (Figure 1A). In contrast, the particle size and shape of PLGA NPs produced with 1% and 4% PVA were larger and non-uniform compared to those formulated with 6% PVA (Supplementary Figure 1). Consequently, for subsequent experiments, 6% PVA was considered to be the most suitable choice among the three tested PVA concentrations.
3.2. The Characterization of Antigen-Loaded NPs
According to SEM results, the appearance of NPs was smooth and it revealed that the sizes of NPs were ideally uniform ranges from 350-400 nm (Figure 1A,B) with 6% PVA. Furthermore, the zeta potential value of NPs was 35 ± 1.9 mV (Figure 1C).
A 12% separating gel was employed in SDS-PAGE to examine the integrity of rHcES-15 (with or without PLGA NPs). The figure clearly indicates that the NPs formulation process did not alter the molecular weight (Mw) of rHcES-15, displaying bands at approximately 33 kDa in size (Figure 1D). The kinetic study of rHcES-15 antigen was assessed in vitro as a cumulative release assay shown in Figure 1E. About 72% antigen was released from PLGA after 21 days. With these results, it is easy to predict that NPs might play an effective role in antigen delivery with stability and small particle size.
3.3. Monitoring Clinical Signs and Local Reactions Caused by the Nanovaccine
Throughout the experiment, we did not observe any neurological signs, clinical manifestations, or necropsy lesions in mice immunized with either rHcES-15 or rHcES-15+PLGA. These results highlight the high safety profile of PLGA NPs in experimental mice.
3.4. Evaluation of Serum Antibodies Level Induced by the Nanaovaccine
Antibodies, also known as immunoglobulins, are a crucial component of the immune system in eukaryotes [34]. In this experiment, concentrations of IgM, IgG1, and IgG2a and of sera collected from different mice were determined by ELISA as illustrated in Figure 2. The levels of IgG1 in group rHcES-15, and rHcES-15+PLGA NPs were significantly higher as compared to PBS (blank control), pET-32a, and also considerably higher than PLGA alone NPs groups (* p < 0.05, ** p < 0.01). Likewise, mice injected with the antigen and nanovaccine (rHcES-15+PLGA NPs) exhibited significantly higher levels of IgG2a and IgM compared to the PBS, pET-32a, and PLGA NPs groups (* p < 0.05, ** p < 0.01).
Relatively, nanovaccine produced a significantly increased (*p < 0.05) quantity of immunoglobulins (IgG1, IgM) when compared with rHcES-15 (Figure 2A,C).
3.5. Cytokines Secreted by rHcES-15 Antigen and Nanovaccine
According to obtained results, the sera from mice immunized with rHcES-15 and rHcES-15+PLGA NPs produced a higher concentration of IL-4 and IL-10 when compared with control groups (* p < 0.05, *** p < 0.001). Similarly, the levels of both cytokines in the rHcES-15+PLGA NPs group were enhanced considerably (** p < 0.01) when compared with rHcES-15 group (Figure 3A,B).
Compared to the PBS group, both the rHcES-15 and rHcES-15+PLGA NPs groups showed significant increases in IL-17 levels. Furthermore, IL-17 secretions were significantly enhanced in these groups compared to the pET-32a and PLGA NPs groups (* p < 0.05, ** p < 0.01, *** p < 0.001). Moreover, group of mice that received nanovaccine induced more IL-17 (* p < 0.05) than the rHcES-15 group (Figure 3C).
Significantly decreased production of TGF-β was observed (* p < 0.05) in both treatment groups (rHcES-15, and rHcES-15+PLGA NPs) when compared to the PBS, pET-32a, and PLGA NPs group (Figure 3D). Like TGF-β, there was a low level of, however, the non-significant IFN-γ secretion found in experimental groups than the control groups (Figure 3E).
3.6. Nanovaccine Induced the Splenic Lymphocytes Proliferation
Splenic lymphocytes were isolated from all experimental mice, and their proliferative responses, particularly to rHcES-15, were evaluated as depicted in Figure 4. According to the stimulation index (SI), the most substantial proliferation values were observed in the positive control (ConA), rHcES-15+PLGA NPs, and rHcES-15 groups when compared with PBS, pET-32a, and PLGA NPs groups (* p < 0.05, *** p < 0.001). Notably, the positive control (ConA) exhibited the highest value compared to rHcES-15 and rHcES-15+PLGA NPs.
3.7. Nanovaccine Promoted CD4+ and CD8+ T cells Activation
The percentages of CD4+ and CD8+ T cells in the lymphocytes of each group were assessed using flow cytometry (Figure 5). The treatment groups displayed significantly higher percentages of CD3e+CD4+ and CD3e+CD8a+ cells in comparison to the PBS, pET-32a, and PLGA NPs groups (** p < 0.01, *** p < 0.001). Specifically, the rHcES-15+PLGA NPs group exhibited a noticeable increase (* p < 0.05) in CD3e+CD4+ cells when compared to the rHcES-15 group (Figure 5A,C). The values of CD4+ in PLGA NPs group were high as compared to PBS and pET32a possibly due to their adjuvant activity, however, it was lower than antigen (rHcES-15) and nanovaccine (rHcES-15+PLGA NPs group). The results also demonstrated that mice which immunized with nanovaccine (rHcES-15+PLGA NPs) produced more CD8a+ (* p < 0.05) than rHcES-15 (Figure 5B,D).
3.8. Nanovaccine Increased the Activation and Maturation of DCs Phenotypes
Flow cytometry was employed to evaluate the interaction between the antigen-loaded NPs and DCs, as well as the modulation of DC phenotypes. The percentages of CD83+ and CD86+ cells were determined in different groups of mice (Figure 6). The results demonstrated significant enhancements in the percentage of CD11c+CD83+ and CD11c+CD86+ cells for both rHcES-15 and rHcES-15+PLGA NPs compared to the PBS, pET-32a, and PLGA NPs groups (* p < 0.05, ** p < 0.01, *** p < 0.001). Furthermore, in comparison to rHcES-15, the rHcES-15+PLGA NPs group exhibited higher percentages of CD11c+CD83+ cells (** p < 0.01).
4. Discussion
In tropical, warm, and humid regions across the globe, the presence of H. contortus infection poses a significant challenge for domestic livestock [35]. This nematode actively secretes a diverse range of excretory/secretory proteins (ESPs) into the host environment, capable of modulating the host immune system either through modulation or suppression of its functions [36]. A subset of these HcESPs includes low molecular weight ES antigens, which play a crucial role in regulating a specific immune response against this helminth infection in the host [37]. Generally, purified proteins exhibit lower immunogenicity and thus necessitate the assistance of an effective adjuvant to induce a robust immune response [38]. Hence, we employed biodegradable polymers in the form of PLGA NPs as an adjuvant to carry rHcES-15, aiming to investigate its potential in stimulating both Th1 and Th2 immune responses against haemonchosis. Mice immunized with antigen-loaded NPs demonstrated an enhanced antigen-specific antibody titer, elevated cytokine levels in sera, increased percentages of T cells and DCs, and heightened lymphocyte proliferation [27]. These findings strongly suggest that the recombinant antigen of H. contortus (rHcES-15) combined with PLGA NPs presents an appealing prospect for therapeutic application.
The primary limitation associated with PLGA-based NPs is their diminished LC, representing the proportion of the loaded drug or antigen quantity concerning the total NP quantity. Although PLGA-based NPs generally exhibit a high EE, achieving substantial drug loading is a challenge [39]. In our investigation, we observed a LC of 25±1.1 and a relatively high EE of 72.37±3.51 for PLGA NPs (Table 2). Scientific literature suggests that the optimal size for NPs, facilitating efficient uptake by DCs, should be less than 500 nm [40]. Correspondingly, PLGA NPs of 350 nm size displayed superior internalization and activation of DCs compared to larger particles [41]. Aligning with previous research, we determined the appropriate size of rHcES-15+PLGA NPs suitable for efficient DC uptake.
In the recent study, it has been shown that mice, upon immunization with NPs loaded with the antigen, exhibit elevated levels of antibodies and a potent lymphoproliferative response in comparison to control groups and the antigen administered alone (rHcES-15). The heightened levels of antigen-specific IgG subtypes were linked to the host’s defense against H. contortus challenge [42]. Similar outcomes were reported by other researchers in previous experiments involving different nematodes [43,44]. These observations suggest that this recombinant protein holds promise as an effective candidate for a nanovaccine targeting H. contortus infection. Previous research has highlighted the diverse functions of ESPs from various helminths, primarily influencing the development of host immune cells [45,46]. In our current investigation, we observed a robust lymphoproliferative response induced by both rHcES-15 alone and the nanovaccine (rHcES-15+PLGA NP), as depicted in Figure 4. This phenomenon may be associated with an upsurge in IgG1 production.
Precise signaling molecules govern intercellular communication within the immune system. These entities, namely cytokines and chemokines, hold pivotal roles in orchestrating immune responses [47]. Th1 cells, for instance, release IFN-γ, a regulator of cellular immune responses against microbial invasions. IFN-γ also plays a key role in Th1/Th2 cell differentiation. On the other hand, IL-4 dictates the type of immunity and pathogenesis during nematode invasion [48]. Notably, during H. contortus infection, IL-4 secretion prevails, aligning with a Th2 type of immune response [49]. The anti-inflammatory cytokine IL-10, known as a master regulator, exerts a dampening effect on immunity and mitigates tissue damage stemming from inflammation, an indispensable aspect for host defense [50]. In concordance with prior investigations on rHcES-15 [16], our study reveals that rHcES-15 inhibits IFN-γ secretion (although insignificantly), maintaining a stable Th1/Th2 environment during the host-parasite interaction. This is accompanied by amplified IL-4 and IL-10 secretions in mice immunized with the nanovaccine, a subject that needs further investigation and discussion.
Th17 cells are responsible for the secretion of the IL-17 cytokine, a significant player functionally linked to the pathogenesis of diverse helminths and categorized as a modulator of tissue inflammation [51]. Moreover, there was a notable increase in IL-17 secretion observed in goat PBMCs when infected with rHcES-15 in vitro [16]. TGF-β plays a pivotal role in regulating cellular activities such as cell proliferation, growth, differentiation, pro-inflammatory responses, and various immunomodulatory functions [52,53]. The secretion levels of TGF-β and IL-10 are influenced by factors such as the extent of infection, parasite developmental stage, and host genetics [54]. In our current study, a significant decline was observed in the secretion level of TGF-β in our experimental groups (rHcES-15, rHcES-15+PLGA NPs). These outcomes suggest that the cellular immune response induced by this antigen primarily encompasses a blend of Th1 and Th2 immune responses.
As documented in this study, the simultaneous administration of the helminth antigen (rHcES-15) and polymeric NPs resulted in an upregulation of effector cytokines. This heightened expression can be attributed to the increased presentation of MHC molecules facilitated by dendritic cells (DCs). Activation of DCs serves as a crucial stimulus for priming both CD4+ and CD8+ T cells [55]. A prior investigation demonstrated that liposome stimulation of CD8a+ T cells effectively induced cross-priming of CD8a+ T cells in mice [56], and improved the survival of CD4+ T cells [57]. In line with the aforementioned study, our findings revealed a more robust proliferation of activated T cells in the immunized mice compared to the control groups (Figure 5). Earlier studies have also reported significant proliferation of CD4+ and CD8+ T cells in response to H. contortus antigens administered in host animals [13,27,42,58]. These collective results imply that rHcES-15, in conjunction with the adjuvant effect of PLGA NPs, significantly contributes to the induction of both cellular and humoral immunity in vivo.
Dendritic cells (DCs) hold a pivotal role in antigen presentation and triggering the adaptive immune response induced by vaccines [59]. Their fundamental function lies in presenting antigens as foreign entities, processing them through DC maturation, and presenting antigen peptides to CD4+ or CD8+ T cells through the MHC-II or MHC-I pathways, respectively [60]. Our investigation delved into the characteristics of rHcES-15 and PLGA NPs utilizing splenic DCs (CD11c+CD83+, CD11c+CD86+). A previous study highlighted the significant role of rHcEs-15 in the maturation and differentiation of monocyte-derived DCs in goats [17]. As depicted in Figure 6, the administration of the nanovaccine to mice effectively stimulated DCs, illustrating a substantial distinction when compared to the controls and antigen (rHcES-15) groups. Hence, we deduced that employing a combination of PLGA NPs and rHcES-15 might represent a superior approach for vaccinating animals as opposed to using the antigen or solely PLGA.
5. Conclusions
Our findings clearly demonstrate that immunization with nanovaccine (rHcES-15+PLGA NPs) can provoke potent immune responses against H. contortus infection. We have documented a significant increase in the production levels of specific antibodies and cytokines in the sera of mice subjected to immunization. The nanovaccine notably boosted the percentages of T cells and facilitated the maturation of dendritic cells (DCs), and promoted a substantial proliferation of lymphocytes. Notably, the results underscore that the nanovaccine can induce a markedly enhanced immune response in comparison to the rHcES-15 antigen alone.
Authors’ contributions
LXR and YRF directed the project and participated in the coordination and management of the study. MWH performed the laboratory tests and the data analysis and wrote the manuscript. MH, and ME provided some ideas about the experimental design. WQQ, AH, and SAL obtained blood samples and isolated the cells. LMM, YRF, SXK, and XLX provided new analytical reagents and tools. All authors read and approved the final manuscript.
Funding
This work was funded by grants from The National Key Research and Development Program of China (Grant No.2017YFD0501200), the National Natural Science Foundation of China (31872464), State Key Laboratory of Pathogenesis, Prevention and Treatment of High Incidence Diseases in Central Asia Fund (SKL-HIDCA-2022-20) and the Priority Academic Program Development of Jiangsu Higher Education Institutions (PAPD).
Data Availability Statement
The datasets supporting the conclusions of this article are included in the article.
Acknowledgments
We gratefully thank Javaid Ali Gadahi for his valuable suggestions.
Conflicts of Interest
The authors declare that they have no competing interests.
Abbreviations
H contortus: Haemonchus contortus, HcESPs: excretory/secretory products of H. contortus, HcES-15: H. contortus 15 kDa excretory/secretory protein, rHcES-15: recombinant H. contortus 15 kDa excretory/secretory protein, DCs: dendritic cells, PBMC: peripheral blood mononuclear cells, PBS: phosphate buffered saline, SDS-PAGE: sodium dodecyl sulfate-polyacrylamide gel electrophoresis, RT: room temperature, FCS: fetal calf serum, PLGA: poly (lactic-co-glycolic acid, APC: antigen-presenting cells, Mw: molecular weight, PVA: polyvinyl alcohol, LC: loading capacity, EE: encapsulation efficiency, SEM: scanning electron microscope, CM: culture medium.
References
- Albuquerque:, A.C.A.; Bassetto, C.C.; Almeida, F.A.; Hildersley, K.A.; McNeilly, T.N.; Britton, C.; Amarante, A.F.T. Differences in Immune Responses to Haemonchus Contortus Infection in the Susceptible Ile de France and the Resistant Santa Ines Sheep under Different Anthelmintic Treatments Regimens. Vet. Res. 2019. [Google Scholar] [CrossRef]
- Brik, K.; Hassouni, T.; Elkharrim, K.; Belghyti, D. A Survey of Haemonchus Contortus Parasite of Sheep from Gharb Plain, Morocco. Parasite Epidemiol. Control 2019, 4, e00094. [Google Scholar] [CrossRef]
- Toscano, J.H.B.; Okino, C.H.; dos Santos, I.B.; Giraldelo, L.A.; von Haehling, M.B.; Esteves, S.N.; de Souza Chagas, A.C. Innate Immune Responses Associated with Resistance against Haemonchus Contortus in Morada Nova Sheep. J. Immunol. Res. 2019, 2019, 1–10. [Google Scholar] [CrossRef]
- Wang, C.; Li, F.; Zhang, Z.; Yang, X.; Ahmad, A.A.; Li, X.; Du, A.; Hu, M. Recent Research Progress in China on Haemonchus Contortus. Front. Microbiol. 2017. [Google Scholar] [CrossRef]
- Lu, M.; Tian, X.; Zhang, Y.; Wang, W.; Tian, A.L.; Aimulajiang, K.; Liu, L.; Li, C.; Yan, R.; Xu, L.; et al. Protection Studies of an Excretory–Secretory Protein HcABHD against Haemonchus Contortus Infection. Vet. Res. 2021, 52, 1–16. [Google Scholar] [CrossRef]
- Marcilla, A.; Martin-Jaular, L.; Trelis, M.; de Menezes-Neto, A.; Osuna, A.; Bernal, D.; Fernandez-Becerra, C.; Almeida, I.C.; del Portillo, H.A. Extracellular Vesicles in Parasitic Diseases. J. Extracell. Vesicles 2014, 3. [Google Scholar] [CrossRef]
- Gahoi, S.; Singh, S.; Gautam, B. Genome-Wide Identification and Comprehensive Analysis of Excretory/Secretory Proteins in Nematodes Provide Potential Drug Targets for Parasite Control. Genomics 2019. [Google Scholar] [CrossRef] [PubMed]
- Yatsuda, A.P.; Krijgsveld, J.; Cornelissen, A.W.C.A.; Heck, A.J.R.; De Vries, E. Comprehensive Analysis of the Secreted Proteins of the Parasite Haemonchus Contortus Reveals Extensive Sequence Variation and Differential Immune Recognition. J. Biol. Chem. 2003. [Google Scholar] [CrossRef] [PubMed]
- Garg, G.; Ranganathan, S. Helminth Secretome Database (HSD): A Collection of Helminth Excretory/Secretory Proteins Predicted from Expressed Sequence Tags (ESTs). BMC Genomics 2012, 13 Suppl 7, S8. [Google Scholar] [CrossRef]
- Schallig, H.D.F.H.; Leeuwen, M.A.W. Van; Verstrepen, B.E.; Cornelissen, A.W.C.A. Molecular Characterization and Expression of Two Putative Protective Excretory Secretory Proteins of Haemonchus Contortus 1. 1997, 88, 203–213. [Google Scholar] [CrossRef] [PubMed]
- Schallig, H.D.F.H.; Van Leeuwen, M.A.W.; Cornelissen, A.W.C.A. Protective Immunity Induced by Vaccination with Two Haemonchus Contortus Excretory Secretory Proteins in Sheep. Parasite Immunol. 1997. [Google Scholar] [CrossRef]
- Vervelde, L.; Leeuwen, M.A.W.V.A.N.; Kruidenier, M.; Kooyman, F.N.J.; Huntley, J.F.; Die, I.V.A.N. Protection Studies with Recombinant Excretory / Secretory Proteins of Haemonchus Contortus. 2002, 189–201. [Google Scholar] [CrossRef]
- Gill, H.S.; Watson, D.L.; Brandon, M.R. Monoclonal Antibody to CD4+ T Cells Abrogates Genetic Resistance to Haemonchus Contortus in Sheep. Immunology 1993. [Google Scholar]
- Miller, H.R.P. The Protective Mucosal Response against Gastrointestinal Nematodes in Ruminants and Laboratory Animals. Vet. Immunol. Immunopathol. 1984. [Google Scholar] [CrossRef]
- Sher, A.; Coffman, R.L. Regulation of Immunity to Parasites by T Cells and T Cell-Derived Cytokines. Annu. Rev. Immunol. 1992. [Google Scholar] [CrossRef]
- Ehsan, M.; Gadahi, J.A.; Hasan, M.W.; Haseeb, M.; Ali, H.; Yan, R.; Xu, L.; Song, X.; Zhu, X.-Q.; Li, X. Characterization of Haemonchus Contortus Excretory/Secretory Antigen (ES-15) and Its Modulatory Functions on Goat Immune Cells In Vitro. Pathogens 2020, 9, 162. [Google Scholar] [CrossRef]
- Hasan, M.W.; Haseeb, M.; Ehsan, M.; Gadahi, J.A.; Wang, Q.; Memon, M.A.; Aleem, M.T.; Lakho, S.A.; Yan, R.F.; Xu, L.X.; et al. The Immunogenic Maturation of Goat Monocyte-Derived Dendritic Cells and Upregulation of Toll-like Receptors by Five Antigens of Haemonchus Contortus in Vitro. Res. Vet. Sci. 2021, 136, 247–258. [Google Scholar] [CrossRef] [PubMed]
- Jongert, E.; Roberts, C.W.; Gargano, N.; Förster-Wald, E.; Petersen, E. Vaccines against Toxoplasma Gondii: Challenges and Opportunities. Mem. Inst. Oswaldo Cruz 2009. [Google Scholar] [CrossRef] [PubMed]
- Okwor, I.; Uzonna, J. Vaccines and Vaccination Strategies against Human Cutaneous Leishmaniasis. Hum. Vaccin. 2009. [Google Scholar] [CrossRef] [PubMed]
- Schijns, V.; Fernández-Tejada, A.; Barjaktarović, Ž.; Bouzalas, I.; Brimnes, J.; Chernysh, S.; Gizurarson, S.; Gursel, I.; Jakopin, Ž.; Lawrenz, M.; et al. Modulation of Immune Responses Using Adjuvants to Facilitate Therapeutic Vaccination. Immunol. Rev. 2020, 296, 169–190. [Google Scholar] [CrossRef] [PubMed]
- Danesh-Bahreini, M.A.; Shokri, J.; Samiei, A.; Kamali-Sarvestani, E.; Barzegar-Jalali, M.; Mohammadi-Samani, S. Nanovaccine for Leishmaniasis: Preparation of Chitosan Nanoparticles Containing Leishmania Superoxide Dismutase and Evaluation of Its Immunogenicity in BALB/c Mice. Int. J. Nanomedicine 2011. [Google Scholar]
- Palatnik-de-Sousa, C.B. Vaccines for Leishmaniasis in the Fore Coming 25 Years. Vaccine 2008, 26, 1709–1724. [Google Scholar] [CrossRef]
- Handman, E. Leishmaniasis: Current Status of Vaccine Development. Clin. Microbiol. Rev. 2001. [Google Scholar] [CrossRef]
- Li, P.; Asokanathan, C.; Liu, F.; Khaing, K.K.; Kmiec, D.; Wei, X.; Song, B.; Xing, D.; Kong, D. PLGA Nano/Micro Particles Encapsulated with Pertussis Toxoid (PTd) Enhances Th1/Th17 Immune Response in a Murine Model. Int. J. Pharm. 2016. [Google Scholar] [CrossRef]
- Zhang, N.Z.; Xu, Y.; Wang, M.; Chen, J.; Huang, S.Y.; Gao, Q.; Zhu, X.Q. Vaccination with Toxoplasma Gondii Calcium-Dependent Protein Kinase 6 and Rhoptry Protein 18 Encapsulated in Poly(Lactide-Co-Glycolide) Microspheres Induces Long-Term Protective Immunity in Mice. BMC Infect. Dis. 2016. [Google Scholar] [CrossRef]
- Salvador, A.; Sandgren, K.J.; Liang, F.; Thompson, E.A.; Koup, R.A.; Pedraz, J.L.; Hernandez, R.M.; Loré, K.; Igartua, M. Design and Evaluation of Surface and Adjuvant Modified PLGA Microspheres for Uptake by Dendritic Cells to Improve Vaccine Responses. Int. J. Pharm. 2015, 496, 371–381. [Google Scholar] [CrossRef]
- Hasan, M.W.; Haseeb, M.; Ehsan, M.; Gadahi, J.A.; Naqvi, M.A.-H.; Wang, Q.Q.; Liu, X.; Lakho, S.A.; Yan, R.; Xu, L.; et al. Nanoparticles (PLGA and Chitosan)-Entrapped ADP-Ribosylation Factor 1 of Haemonchus Contortus Enhances the Immune Responses in ICR Mice. Vaccines 2020, 8, 726. [Google Scholar] [CrossRef]
- Wang, Q. Nanoparticles of Chitosan / Poly ( D, L-Lactide-Co- Glycolide ) Enhanced the Immune Responses of Haemonchus Contortus HCA59 Antigen in Model Mice. 2021, 3125–3139. [Google Scholar] [CrossRef]
- Liang, X.; Duan, J.; Li, X.; Zhu, X.; Chen, Y.; Wang, X.; Sun, H.; Kong, D.; Li, C.; Yang, J. Improved Vaccine-Induced Immune Responses: Via a ROS-Triggered Nanoparticle-Based Antigen Delivery System. Nanoscale 2018. [Google Scholar] [CrossRef]
- Gilavand, F.; Marzban, A.; Ebrahimipour, G.; Soleimani, N.; Goudarzi, M. Designation of Chitosan Nano-Vaccine Based on MxiH Antigen of Shigella Flexneri with Increased Immunization Capacity. Carbohydr. Polym. 2020. [Google Scholar] [CrossRef]
- Zupančič, E.; Curato, C.; Paisana, M.; Rodrigues, C.; Porat, Z.; Viana, A.S.; Afonso, C.A.M.; Pinto, J.; Gaspar, R.; Moreira, J.N.; et al. Rational Design of Nanoparticles towards Targeting Antigen-Presenting Cells and Improved T Cell Priming. J. Control. Release 2017, 258, 182–195. [Google Scholar] [CrossRef]
- Sun, G.G.; Wang, Z.Q.; Liu, C.Y.; Jiang, P.; Liu, R.D.; Wen, H.; Qi, X.; Wang, L.; Cui, J. Early Serodiagnosis of Trichinellosis by ELISA Using Excretory-Secretory Antigens of Trichinella Spiralis Adult Worms. Parasites and Vectors 2015. [Google Scholar] [CrossRef]
- Luo, L.; Qin, T.; Huang, Y.; Zheng, S.; Bo, R.; Liu, Z.; Xing, J.; Hu, Y.; Liu, J.; Wang, D. Exploring the Immunopotentiation of Chinese Yam Polysaccharide Poly(Lactic-Co-Glycolic Acid) Nanoparticles in an Ovalbumin Vaccine Formulation in Vivo. Drug Deliv. 2017. [Google Scholar] [CrossRef]
- Nicholson, L.B. The Immune System. Essays Biochem. 2016, 60, 275–301. [Google Scholar] [CrossRef]
- Lu, M.; Tian, X.; Yang, Z.; Wang, W.; Tian, A.-L.; Li, C.; Yan, R.; Xu, L.; Song, X.; Li, X. Proteomic Analysis Revealed T Cell Hyporesponsiveness Induced by Haemonchus Contortus Excretory and Secretory Proteins. Vet. Res. 2020, 51, 65. [Google Scholar] [CrossRef]
- Sun, Y.; Yan, R.; Muleke, C.I.; Zhao, G.; Li, X. Recombinant Galectins of Haemonchus Contortus Parasite Induces Apoptosis in the Peripheral Blood Lymphocytes of Goat. 2007, 13, 387–392. [Google Scholar] [CrossRef]
- Schallig, H.D.F.H.; Van Leeuwen, M.A.W.; Cornelissen, A.W.C.A. Protective Immunity Induced by Vaccination with Two Haemonchus Contortus Excretory Secretory Proteins in Sheep. Parasite Immunol. 1997, 19, 447–453. [Google Scholar] [CrossRef]
- Heegaard, P.M.H.; Dedieu, L.; Johnson, N.; Le Potier, M.F.; Mockey, M.; Mutinelli, F.; Vahlenkamp, T.; Vascellari, M.; Sørensen, N.S. Adjuvants and Delivery Systems in Veterinary Vaccinology: Current State and Future Developments. Arch. Virol. 2011, 156, 183–202. [Google Scholar] [CrossRef]
- Danhier, F.; Ansorena, E.; Silva, J.M.; Coco, R.; Le Breton, A.; Préat, V. PLGA-Based Nanoparticles: An Overview of Biomedical Applications. J. Control. Release 2012, 161, 505–522. [Google Scholar] [CrossRef]
- Foged, C.; Brodin, B.; Frokjaer, S.; Sundblad, A. Particle Size and Surface Charge Affect Particle Uptake by Human Dendritic Cells in an in Vitro Model. In Proceedings of the International Journal of Pharmaceutics; 2005. [Google Scholar]
- Joshi, V.B.; Geary, S.M.; Salem, A.K. Biodegradable Particles as Vaccine Delivery Systems: Size Matters. AAPS J. 2013, 15, 85–94. [Google Scholar] [CrossRef]
- Yan, R.; Sun, W.; Song, X.; Xu, L.; Li, X. Vaccination of Goats with DNA Vaccine Encoding Dim-1 Induced Partial Protection against Haemonchus Contortus: A Preliminary Experimental Study. Res. Vet. Sci. 2013, 95, 189–199. [Google Scholar] [CrossRef]
- Tsuji, N.; Kasuga-aoki, H.; Isobe, T. Cloning and Characterisation of a Highly Immunoreactive 37 KDa Antigen with Multi-Immunoglobulin Domains from the Swine Roundworm Ascaris Suum Q. 2002, 32, 1739–1746. [Google Scholar] [CrossRef]
- Kiel, M.; Hunt, P.; Kongsuwan, K.; Josh, P.; Jones, A.; Windon, R. Identification of Immuno-Reactive Proteins from a Sheep Gastrointestinal Nematode, Trichostrongylus Colubriformis, Using Two-Dimensional Electrophoresis and Mass Spectrometry. Int. J. Parasitol. 2007, 37, 1419–1429. [Google Scholar] [CrossRef]
- Barbosa, A.P.; Campos, D.M.B.; Semerene, A.R.; Teixeira, A.R.L.; Santana, J.M. Lagochilascaris Minor Third-Stage Larvae Secrete Metalloproteases with Specificity for Fibrinogen and Native Collagen. Microbes Infect. 2006, 8, 2725–2732. [Google Scholar] [CrossRef]
- Benjathummarak, S.; Kumsiri, R.; Nuamtanong, S.; Kalambaheti, T.; Waikagul, J.; Viseshakul, N.; Maneerat, Y. Third-Stage Gnathostoma Spinigerum Larva Excretory Secretory Antigens Modulate Function of Fc Gamma Receptor I-Mediated Monocytes in Peripheral Blood Mononuclear Cell Culture. Trop. Med. Health 2016, 44, 5. [Google Scholar] [CrossRef]
- Matzinger, P. The Danger Model: A Renewed Sense of Self. Science (80-. ). 2002, 296, 301–305. [Google Scholar] [CrossRef]
- Uchikawa, R.; Matsuda, S.; Arizono, N. Suppression of Gamma Interferon Transcription and Production by Nematode Excretory-Secretory Antigen during Polyclonal Stimulation of Rat Lymph Node T Cells. Infect. Immun. 2000, 68, 6233–6239. [Google Scholar] [CrossRef]
- Shakya, K.P.; Miller, J.E.; Horohov, D.W. A Th2 Type of Immune Response Is Associated with Increased Resistance to Haemonchus Contortus in Naturally Infected Gulf Coast Native Lambs. Vet. Parasitol. 2009. [Google Scholar] [CrossRef]
- Iyer, S.S.; Cheng, G. Role of Interleukin 10 Transcriptional Regulation in Inflammation and Autoimmune Disease. Crit. Rev. Immunol. 2012, 32, 23–63. [Google Scholar] [CrossRef]
- Dong, C. Differentiation and Function of Pro-Inflammatory Th17 Cells. Microbes Infect. 2009, 11, 584–588. [Google Scholar] [CrossRef]
- Li, M.O.; Wan, Y.Y.; Sanjabi, S.; Robertson, A.-K.L.; Flavell, R.A. Transforming Growth Factor-Β Regulation of Immune Responses. Annu. Rev. Immunol. 2005, 24, 99–146. [Google Scholar] [CrossRef]
- Morissette, R.; Schoenhoff, F.; Xu, Z.; Shilane, D.A.; Griswold, B.F.; Chen, W.; Yang, J.; Zhu, J.; Fert-Bober, J.; Sloper, L.; et al. Transforming Growth Factor-ß and Inflammation in Vascular (Type IV) Ehlers-Danlos Syndrome. Circ. Cardiovasc. Genet. 2014, 7, 80–88. [Google Scholar] [CrossRef]
- Grencis, R.K.; Humphreys, N.E.; Bancroft, A.J. Immunity to Gastrointestinal Nematodes: Mechanisms and Myths. Immunol. Rev. 2014. [Google Scholar] [CrossRef]
- Varypataki, E.M.; Silva, A.L.; Barnier-Quer, C.; Collin, N.; Ossendorp, F.; Jiskoot, W. Synthetic Long Peptide-Based Vaccine Formulations for Induction of Cell Mediated Immunity: A Comparative Study of Cationic Liposomes and PLGA Nanoparticles. J. Control. Release 2016. [Google Scholar] [CrossRef]
- Palucka, K.; Banchereau, J. Dendritic-Cell-Based Therapeutic Cancer Vaccines. Immunity 2013, 39, 38–48. [Google Scholar] [CrossRef]
- Hervas-stubbs, S.; Olivier, A.; Boisgerault, F.; Thieblemont, N.; Dc, W.; Leclerc, C. Absence of CD4 + T-Cell Help TLR3 Ligand Stimulates Fully Functional Memory CD8 ϩ T Cells in the Absence of CD4 ϩ T-Cell Help. 2013, 109, 5318–5326. [Google Scholar] [CrossRef]
- Yanming, S.; Ruofeng, Y.; Muleke, C.I.; Guangwei, Z.; Lixin, X.; Xiangrui, L. Vaccination of Goats with Recombinant Galectin Antigen Induces Partial Protection against Haemonchus Contortus Infection. Parasite Immunol. 2007, 29, 319–326. [Google Scholar] [CrossRef]
- Banchereau, J.; Steinman, R.M. Dendritic Cells and the Control of Immunity. Nature 1998, 392, 245–252. [Google Scholar] [CrossRef]
- Silva, J.M.; Videira, M.; Gaspar, R.; Préat, V.; Florindo, H.F. Immune System Targeting by Biodegradable Nanoparticles for Cancer Vaccines. J. Control. Release 2013. [Google Scholar] [CrossRef]
Figure 1.
The surface characteristics, dimension, and zeta potential of antigen-loaded nanoparticles (NPs) were evaluated using sodium dodecyl sulfate–polyacrylamide gel electrophoresis (SDS-PAGE), demonstrating the antigen’s integrity post-incorporation into the polymeric matrix. The morphology of the NPs was examined at a magnification of 10,000x. Subsection A showcases scanning electron microscopy (SEM) images of rHcES-15+PLGA NPs with 6% PVA. Subsection B presents the size distribution of the antigen-loaded NPs, while subsection C illustrates their zeta potential. Subsection D describes SDS-PAGE (12% separating gel) analysis conducted to investigate the binding of rHcES-15 with PLGA NPs. Lane M corresponds to the standard protein molecular weight marker, Lane 1 to rHcES-15, and Lane 2 to PLGA NPs with bound rHcES-15. Lastly, subsection E exhibits the in vitro release profile of the antigen from PLGA NPs at pH 7.4 and 37°C over 21 days, expressed as a percentage of antigen release.
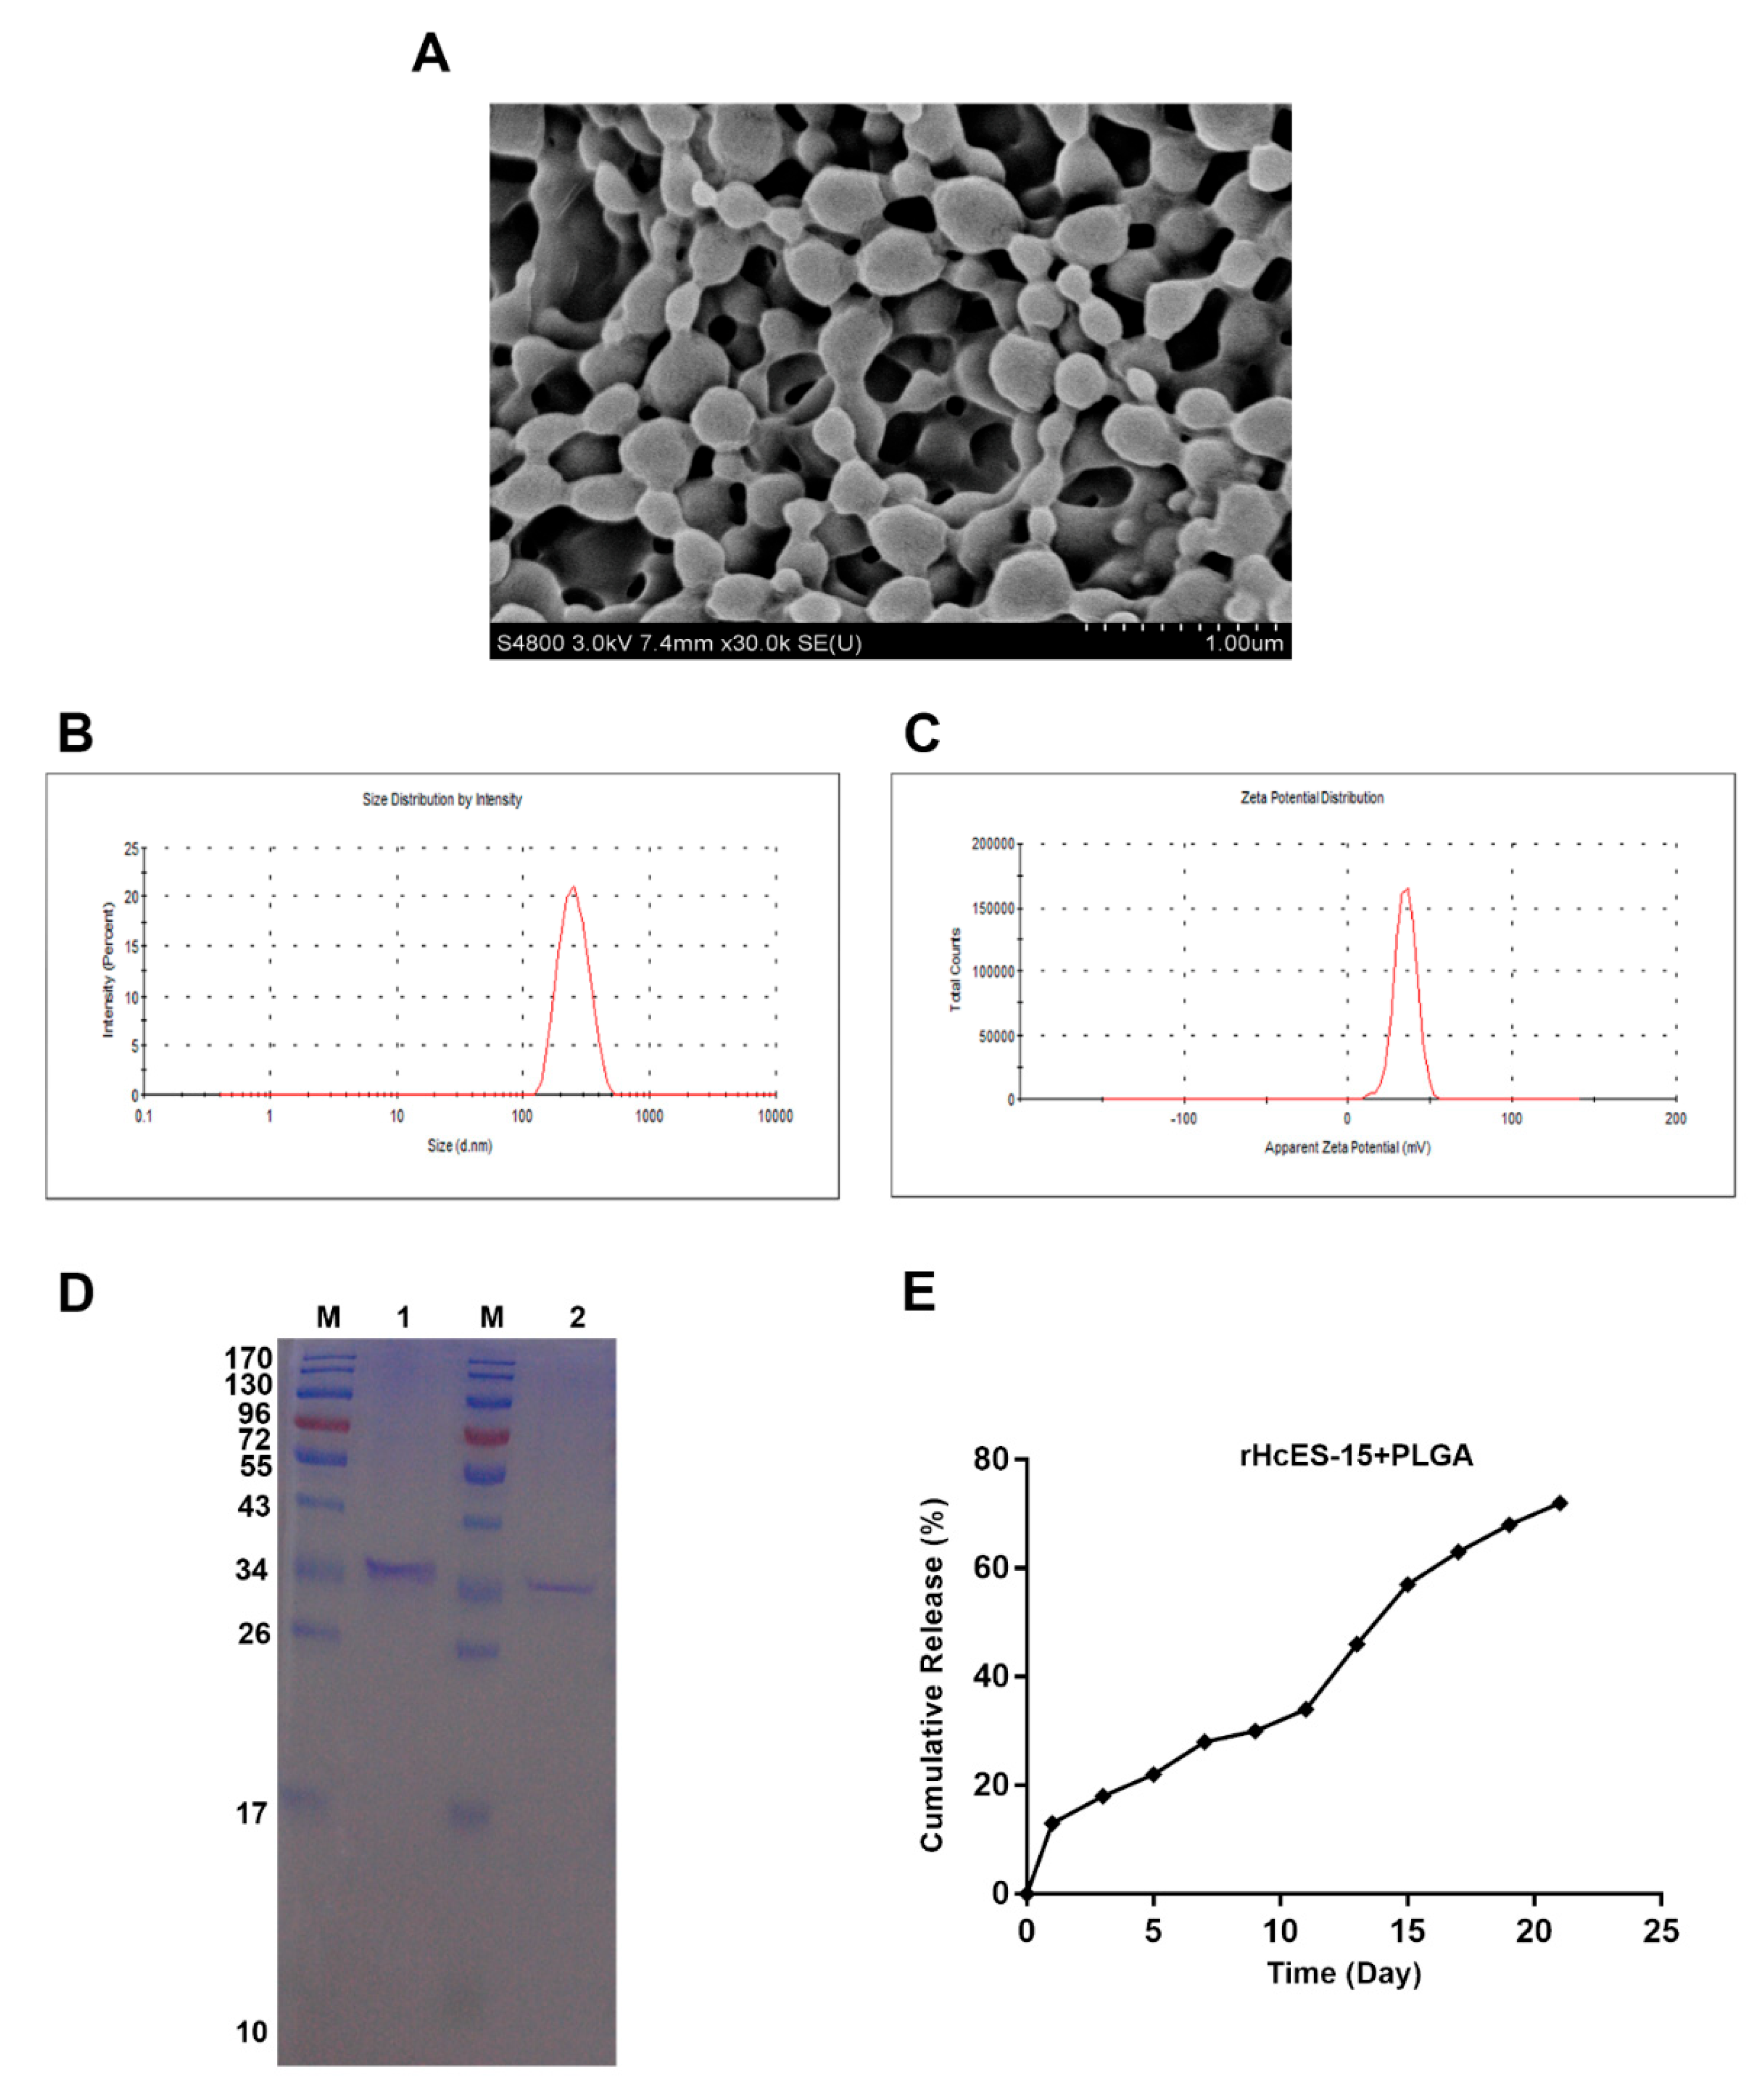
Figure 2.
The influence of both the antigen and antigen-loaded nanoparticles (NPs) on serum antibodies (IgG1, IgG2a, IgM) in mice was assessed using ELISA. The presented data is a representative of triplicate experiments, denoted as statistical significance at levels * p < 0.05, ** p < 0.01, and *** p < 0.001.
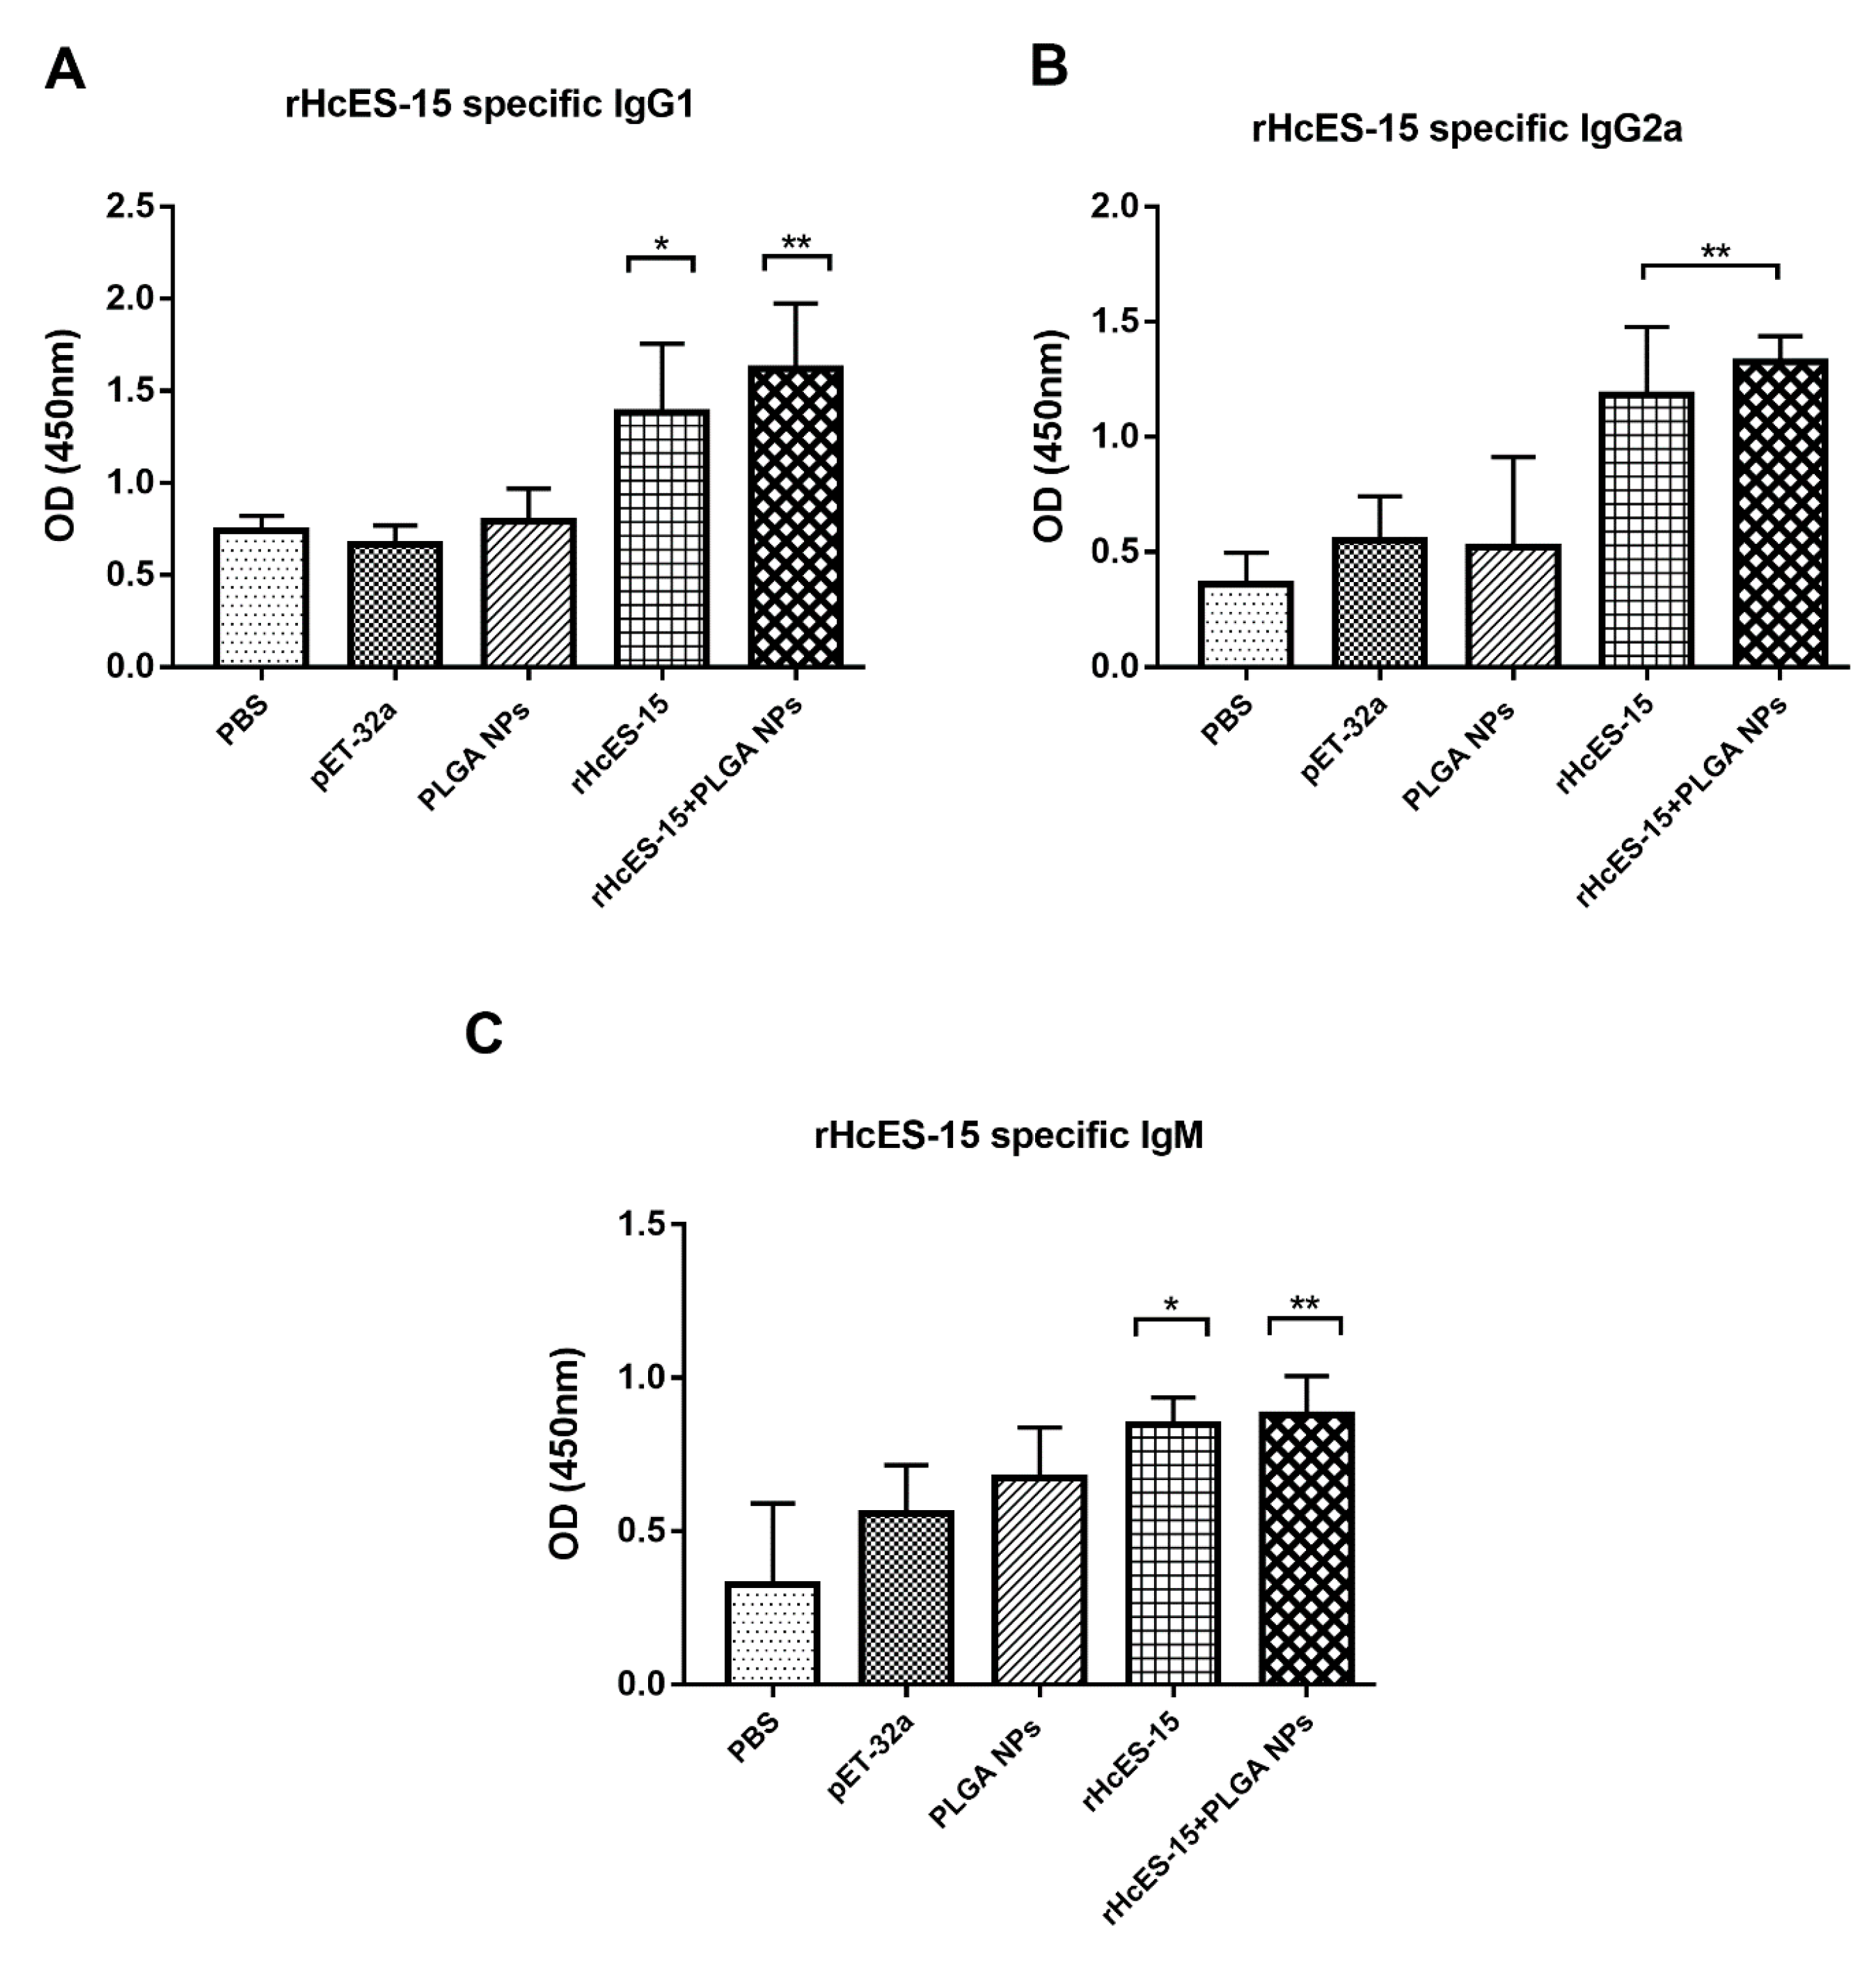
Figure 3.
Cytokine expression levels were ascertained via ELISA in the sera of mice following vaccination with distinct antigen delivery systems. Eight mice (n = 8) received a single immunization with the antigen and nanovaccine on day 0. Panels A through E represent IL-4, IL-10, IL-17, IFN-γ, and TGF-β, respectively. The presented data is a representative of independent triplicate experiments, with statistical significance indicated as * p < 0.05, ** p < 0.01, and *** p < 0.001.
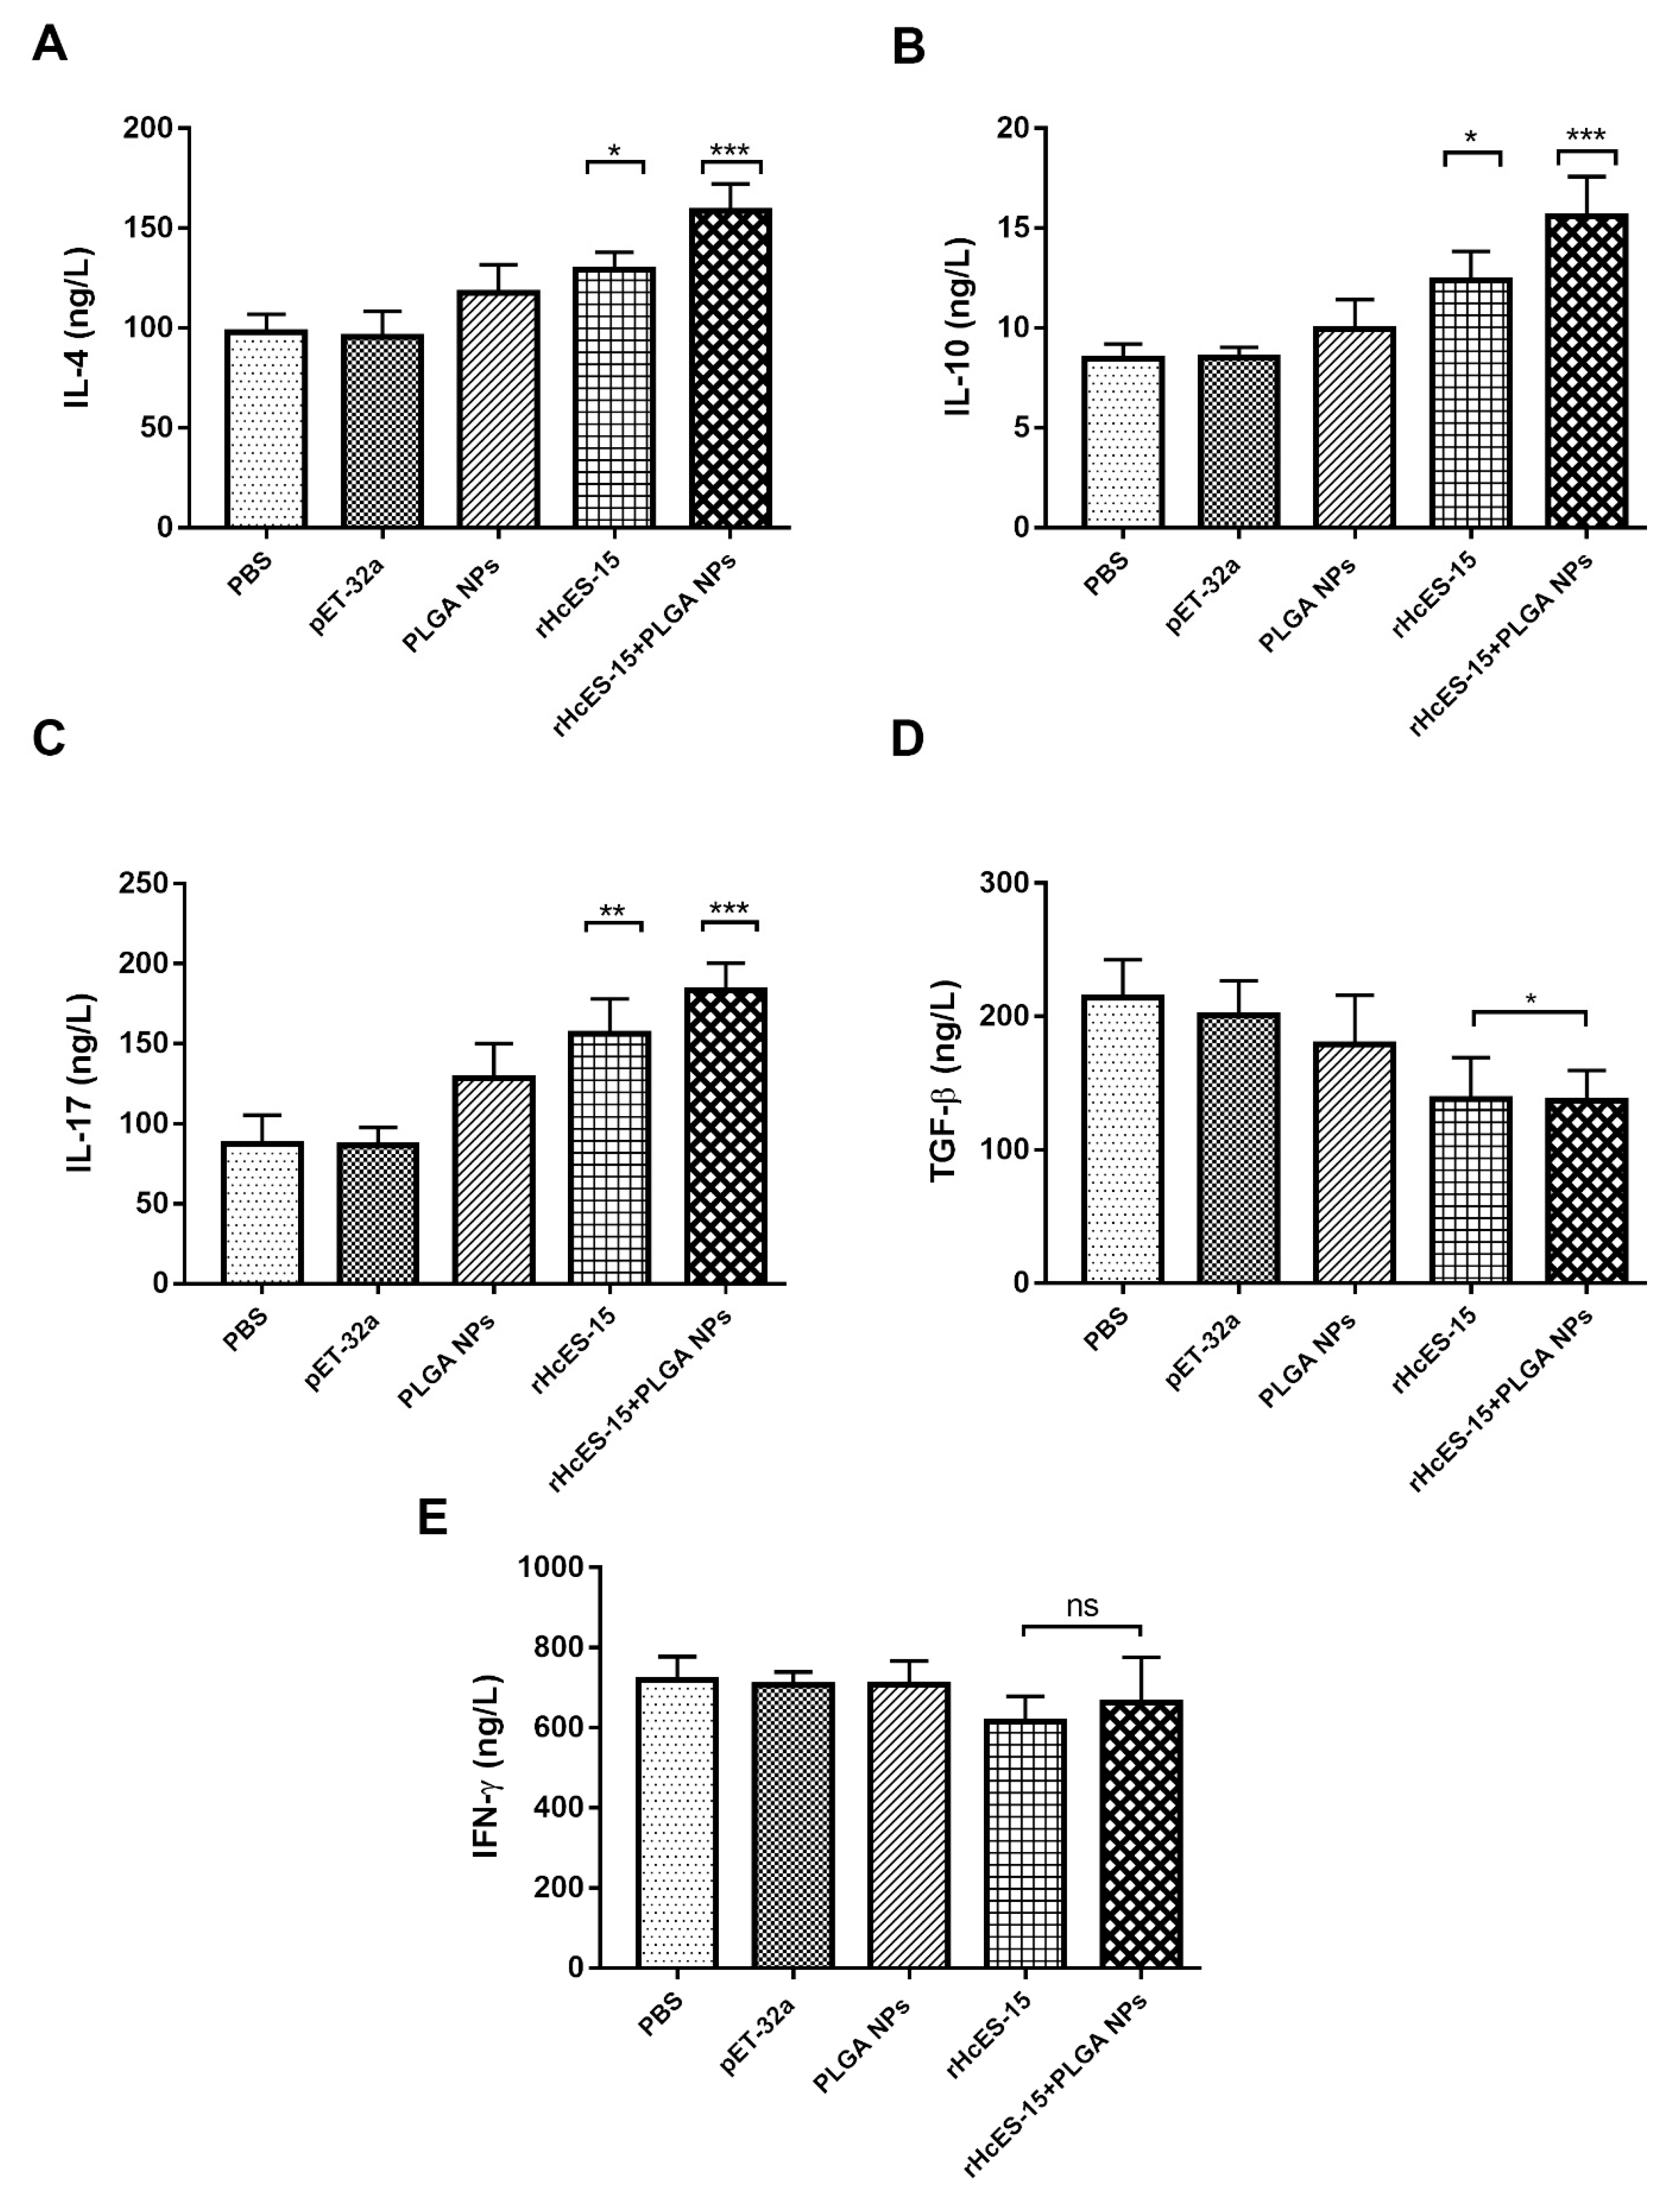
Figure 4.
The proliferation index of splenocytes from different immunized mice was assessed following in vitro stimulation with various treatments. The data provided is an aggregate of three independent experiments, and the presented values indicate the means ± SEM (* p < 0.05, *** p < 0.001).
Figure 4.
The proliferation index of splenocytes from different immunized mice was assessed following in vitro stimulation with various treatments. The data provided is an aggregate of three independent experiments, and the presented values indicate the means ± SEM (* p < 0.05, *** p < 0.001).

Figure 5.
The alterations in the proportions of CD4+ and CD8+ T cells within different mouse groups were quantified through flow cytometry analysis. Figure 5 illustrates the impact of distinct treatments on CD4+ and CD8+ T cell proportions (panels A and B). In panels A and B, a1 and b1 represent the PBS group (blank control), a2 and b2 depict the pET-32a vector protein group, a3 and b3 represent the PLGA NPs group, a4 and b4 represent the rHcES-15 group, and a5 and b5 represent the rHcES-15+PLGA NPs group. The graphical representation of CD4+ and CD8+ T cell percentages across all groups is depicted in Figure 5, panels C and D. The findings presented here are derived from a singular experiment, indicative of three independent experiments (* p < 0.05, ** p < 0.01, *** p < 0.001).

Figure 6.
Flow cytometry analysis was utilized to investigate how different antigen delivery systems influence maturation and antigen presentation in splenic dendritic cells. The levels of CD11c+CD83+ and CD11c+CD86+ expression in splenic dendritic cells were assessed across five groups (Figure 6A,B). In panels A and B, a1 and b1 represent the PBS group (blank control), a2 and b2 depict the pET-32a vector protein group, a3 and b3 represent the PLGA NPs group, a4 and b4 represent the rHcES-15 group, and a5 and b5 represent the rHcES-15+PLGA NPs group. The data is presented as the mean ± SEM and is representative of triplicate experiments (* p < 0.05, ** p < 0.01, *** p < 0.001).
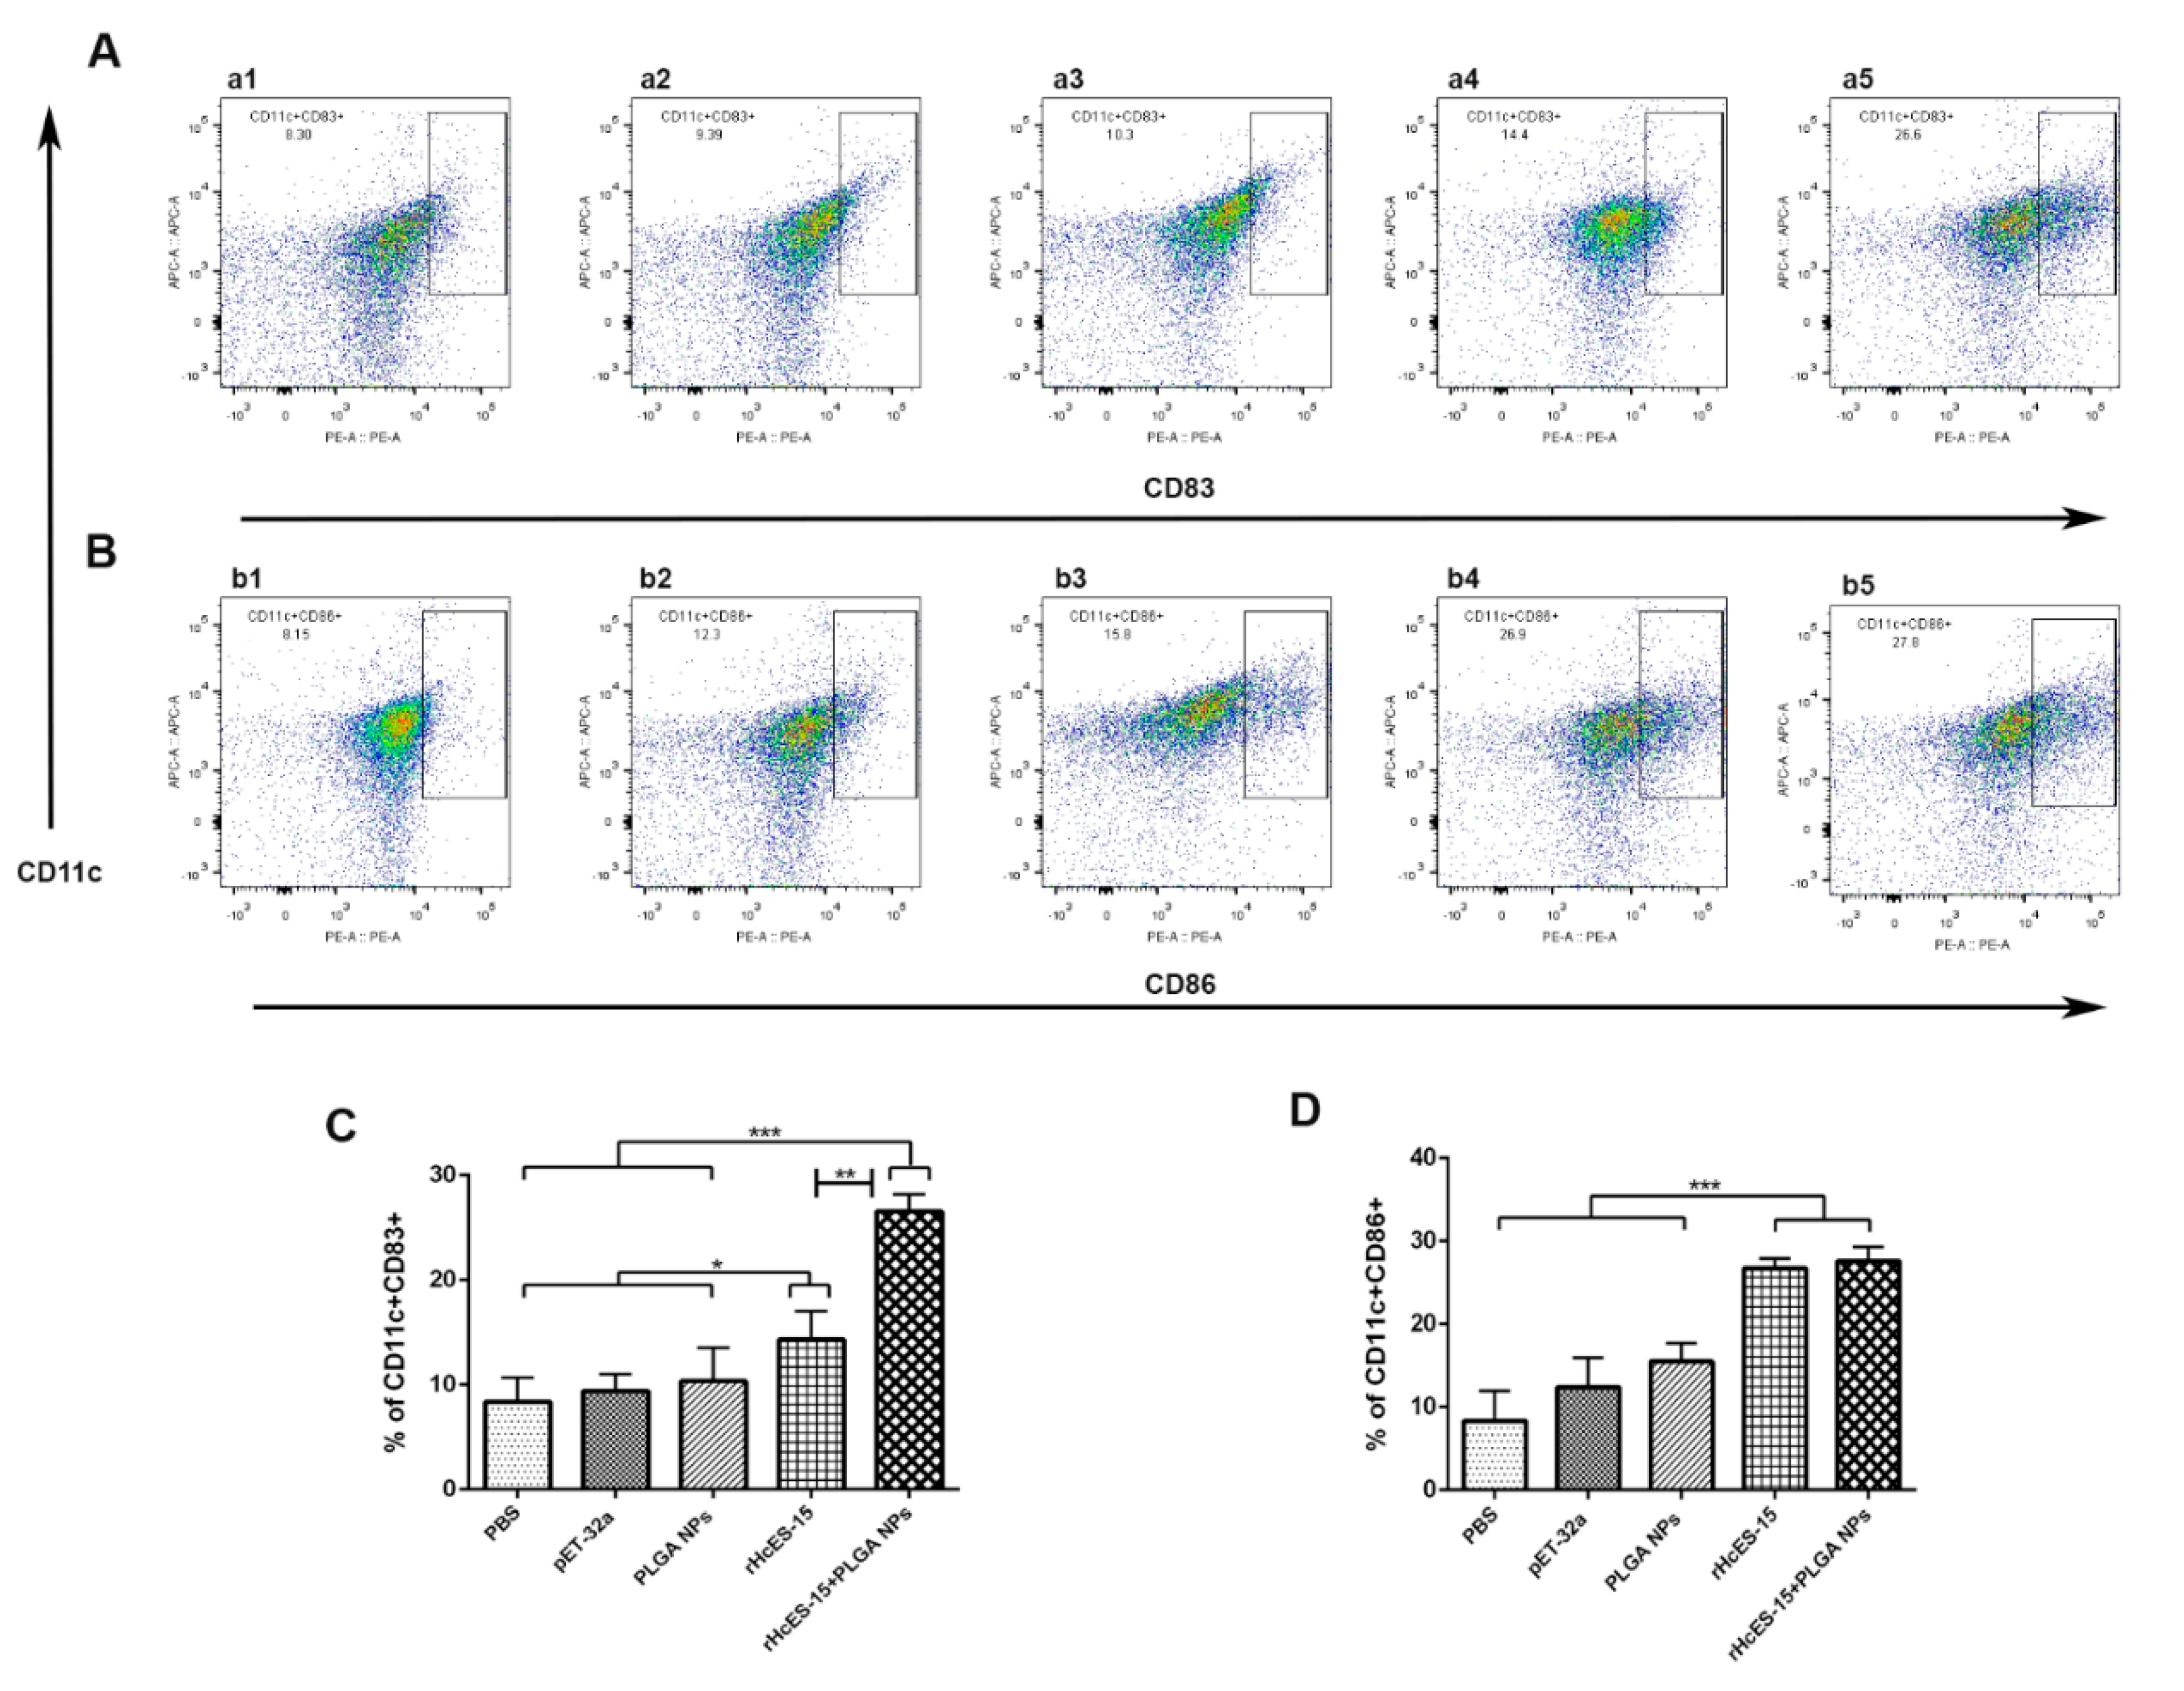

Table 1.
Nature and composition of the different materials injected into ICR mice to evaluate the type of immune response.
Table 1.
Nature and composition of the different materials injected into ICR mice to evaluate the type of immune response.
| Groups | Inoculations | Injection at 0 Day | Purpose |
|---|---|---|---|
| 1 | PBS | 1 | Blank control |
| 2 | pET-32a | 1 | Negative control |
| 3 | PLGA NPs | 1 | To compare PLGA NPs |
| 4 | rHcES-15 | 1 | To determine immunogenicity of rHcES-15 |
| 5 | rHcES-15+PLGA | 1 | To determine immunogenicity of rHcES-15 with the adjuvant activity of PLGA NPs |
Table 2.
Characterization of Recombinant Antigen (rHcES-15) loaded PLGA NPs. Data are presented as the mean ± SD (n=3).
Table 2.
Characterization of Recombinant Antigen (rHcES-15) loaded PLGA NPs. Data are presented as the mean ± SD (n=3).
| Antigen+NPs | Size (nm) | LCa (%) | EEb (%) | Zeta Potential (mV) |
|---|---|---|---|---|
| rHcES-15+PLGA NPs | 350±40 | 25±1.1 | 72.37±3.51 | 35 ± 1.9 |
LCa = (total protein − unbound protein) / total dry weight of Nano-vaccine × 100%. EEb = (total protein − unbound protein) / total protein × 100%.
Disclaimer/Publisher’s Note: The statements, opinions and data contained in all publications are solely those of the individual author(s) and contributor(s) and not of MDPI and/or the editor(s). MDPI and/or the editor(s) disclaim responsibility for any injury to people or property resulting from any ideas, methods, instructions or products referred to in the content. |
© 2023 by the authors. Licensee MDPI, Basel, Switzerland. This article is an open access article distributed under the terms and conditions of the Creative Commons Attribution (CC BY) license (http://creativecommons.org/licenses/by/4.0/).
Copyright: This open access article is published under a Creative Commons CC BY 4.0 license, which permit the free download, distribution, and reuse, provided that the author and preprint are cited in any reuse.


