
Submitted:
06 October 2023
Posted:
09 October 2023
You are already at the latest version
Abstract
The high protein content of several microalgal species makes them attractive and unconventional for applications in the food and pharmaceutical industries. Due to microalgae's robust cell wall, cell rupture is necessary to improve the extraction of their intracellular proteins. Thus, choosing a suitable cell-breaking treatment before protein extraction is a vital downstream processing step. Additionally, it is necessary to use an effective technique for monitoring and measuring the impact of rupture treatments on microalgal cell walls. In our study, Tetradesmus obliquus cells were disrupted by three different mechanical rupture methods: high-pressure homogenization (HPH), ultrasound (US), and ball milling (BM). The ruptured biomass cells were counted, and soluble proteins were extracted and quantified. The cell counting technique did not detect differences between intact and damaged cells after BM treatment because the dye (erythrosine B) did not permeate the microalgae biomass accurately. The US treatment promoted the highest yield of total protein extraction (19.95%). The yields of protein extraction of T. obliquus with HPH (15.68%) and BM (14.11%) were significantly (p value ≤ 0.05) lower than that achieved in the US treatment. The increase in the number of extraction steps increased the protein recovery. Thus, the content of extracted soluble protein was a reliable indirect index for a quantitative comparison of the cell disruption level.
Keywords:
ball milling
; high-pressure homogenization
; ultrasonication
; cell counting
1. Introduction
Microalgae are a group of highly diverse organisms with morphological, reproductive, physiological, and ecological characteristics. Microalgae biomass can be applied in the cosmetics industry, wastewater treatment, energy production, and human and animal nutrition. In the food segment, microalgae have gained interest because they are an unconventional source of proteins, presenting the advantages of not being dependent on the climate and propensity for growth in any region [1]. Microalgae can be produced in areas unsuitable for growing traditional crops due to their high capacity to adapt to the environment, not competing with food production sites [2].
Microalgal biomass contains metabolites for industrial use, such as proteins, lipids, vitamins, enzymes, pigments, mineral salts, antioxidants, and antibiotics. Additionally, short- and long-term feeding tests have demonstrated that some microalgae are safe for humans [3,4,5,6,7].
The high protein content of microalgae makes them a potentially attractive and unconventional source of sustainable green protein and bioactive peptides for human nutrition, animal feed, and aquaculture. Depending on the species, microalgal protein content can reach 60% to 70% [8]. Proteins extracted from microalgae have nutritional quality compared to proteins of plant origin [2]. Additionally, their composition of essential amino acids is in the quantities recommended by the Food and Agriculture Organization/FAO [1].
Approximately 70% of microalgal proteins are intracellularly located and adhere to the cell wall. Thus, the cells must be ruptured to extract or release these components [9]. Cell disruption, as one of the first downstream stages for microalgae biotechnological platforms, promotes the permeabilization or complete breakage of the membrane and wall of cells, allowing solvent access to intracellular biomolecules [10]. Consequently, selecting a suitable cell-breaking treatment before protein extraction is crucial for downstream processing.
Mechanical cell rupture methods, such as high-pressure homogenization, ball milling, and sonication, have been used [11,12,13,14] because they provide good cell wall disintegration efficiency and do not use chemical reagents. Since the downstream steps represent a large part of the operational costs to the production chain, cell lysis technologies must be low-cost and energy-efficient, improving product quality and yield [10,15]. Moreover, an effective technique is necessary for monitoring and measuring the impact of treatment on microalgal cell disruption. Accordingly, this study aimed (i) to investigate the effect of three different disruption methods, high-pressure homogenization, ball milling, and ultrasound, on Tetradesmus obliquus cells, (ii) to identify the majority of protein in the protein-rich extracts, and (iii) to evaluate the color parameters of the protein-rich extracts. These protein-rich extracts are useful for studying protein techno-functionalities. Tetradesmus spp. is among microalgae, a Brazilian native species abundant in aquatic environments. They present a sizeable morphological variation within each species, show a high growth rate, and contain 30% to 40% protein on a dry-mass basis [8,13,16].
2. Materials and Methods
2.1. Tetradesmus obliquus biomass processing
The Tetradesmus obliquus strain was previously isolated from freshwater reservoirs and cultivated in BG11 culture medium [17,18]. The biomass was separated from the growing medium, concentrated to 6 mass %, frozen, and stored at -10 °C [19]. The microalgal biomass was a gentle gift from the Biofuels Laboratory at the Universidade Federal de Viçosa, Brazil. The frozen biomass was thawed for fractionation, washed with deionized water, filtered in an organza fabric filter medium to remove impurities, packed in containers, and frozen (GE, Brazil) at -80 °C. The frozen biomass was freeze-dried (LS 3000, Terroni, Brazil), giving rise to dry biomass, reaching a final moisture content of 8 mass %. The dry biomass was then sheared through a 59 mm stainless steel sieve (Tyler 28). The resulting fine powder, with standardized granulometry, was refrigerated at 8 °C until use.
2.2. Composition of the Tetradesmus obliquus microalgae
The macronutrient composition of dried Tetradesmus obliquus biomass was characterized by moisture [20], ashes [20], lipids with the Folch method [21], and protein with the Kjeldahl method [20] and a nitrogen factor of 5.89 [22]. The carbohydrate content was calculated by difference (Carbohydrate% = 100% – ashes% - lipids% - proteins%).
2.3. Separation and identification of proteins from the microalgae Tetradesmus obliquus
- Molecular mass profile
The molecular mass distribution of T. obliquus proteins was determined by SDS‒PAGE methodology. Microalgal biomass samples containing known amounts of proteins were kept at 25.0 °C under stirring overnight. The suspensions were processed and subjected to polyacrylamide gel electrophoresis using a 10% gel (0.75 mm) composed of a separation gel (10% acrylamide) and a stacking gel (5% acrylamide) in a 7 x 10 x 0.1 cm Mini-Protean III tank (Bio-Rad, USA). The microalgal biomass was initially suspended for solubilization in 1 mL of 25 mM Tris-HCl buffer (pH 7.5), and biomass suspensions were prepared with concentrations of 20, 40, and 50 μg of protein. Then, each biomass suspension was (a) mixed with buffer composed of 10% glycerol, 5% β-mercaptoethanol, 2.3% SDS, and Tris-HCl pH 6.8, (b) heated at 95 °C for 5 min, (c) centrifuged (Centrifuge 5430, Eppendorf, Germany), and (d) cooled to room temperature (± 25 °C). A 21 μL aliquot of each suspension was transferred into the gel channels. The molecular mark (5 μL) used was the prestained standards Precision Plus ProteinTM (Bio-Rad, USA) with molecular masses ranging from 10 to 200 kDa.
- Identification by mass spectrometry (MALDI-TOF)
Regions of the gel containing the protein bands with greater intensity and better separation were manually cut into cubes of approximately 1.0 mm3. The selected protein bands and a blank were processed with the in-gel digestion technique. Then, the peptide molecular masses were identified using the Shevchenko et al. [23] methodology. This protocol included the removal of Coomassie G-250 brilliant blue dye, digestion with the enzyme trypsin, and extraction and concentration of the peptides. Subsequently, 1 μL of the peptide samples was mixed with 3 μL of the ɑ-cyano-4-hydroxycinnamic acid matrix (5 μg/mL in 50% acetonitrile and 0.1% TFA) in the well of the steel plate (MTP Anchor Chip TM 600/384 TF, Bruker Daltonics®). MALDI-TOF-MS (laser ionization mass spectrometry) was used to analyze the molecular masses of the peptides originating from protein digestion. External calibration was performed with peptide calibration standard II (Bruker Daltonics®, USA) containing the peptides bradykinin (757 Da), angiotensin II (1046 Da), angiotensin I (1296 Da), P substance (1347 Da), bombesin (1619 Da), ACTH clip 1-17 (2093 Da), ACTH clip 18-39 (2465 Da), and somatostatin (3147 Da). The spectrograms were stored to identify the peptides by comparing their molar masses with those deposited in the SwissProt database using MASCOT software (www.matrixscience.com).
2.3. Biomass cell disruption
Three different disruption methods were evaluated:
- Mechanical disruption by ball mill: The freeze-dried biomass was mechanically disrupted in a ball mill (model MR350, Tecnal Equipamentos Científicos, Brazil) using 10 g of biomass batches for 25 min, following Vieira et al. [16]. The disrupted biomass was kept at 20 °C until use.
- Mechanical disruption by ultrasound: The freeze-dried biomass was mechanically disrupted by ultrasound after resuspension in distilled water (5.0% w/v), following Silva et al. [24] with adaptations. The suspensions were mechanically stirred (IKA, RW20 digital, Germany) at 25.0 °C overnight and disrupted in a tip sonicator (Sonics, VCX 500, USA) at 20 kHz frequency and 98% amplitude for 6 min of ultrasonication. The cells were disrupted under cooling in an ice bath to avoid overheating the system. After disruption, cell suspensions were frozen, freeze-dried (Terroni, LS 3000, Brazil), and stored at 20 °C until use.
- Mechanical disruption by high-pressure homogenization: The microalgal biomass was suspended in distilled water (1.5% w/v) and processed in a homogenizer (Alitec, A100, Brazil) at 350 bar, according to Shene et al. [25]. The number of passes of the suspensions in the homogenizer was 25, and the suspension was cooled to avoid compound degradation due to the temperature increase. The homogenized samples were collected, frozen, freeze-dried (Terroni, LS 3000, Brazil), and stored at 20 °C until use.
2.4. Cell disruption indicators
- Evaluation of the cell disruption level through cell counting
A 100 μL volume of the working solution was added to 100 μL of the disrupted cell suspension to count ruptured biomass cells, according to Gminski et al. [26]. The working solution was prepared by diluting 0.1 mL of erythrosine B solution in 5 mL of potassium phosphate buffer. Erythrosine B solution was prepared using an aqueous solution of 10 g/L erythrosine B and a potassium phosphate buffer solution formed with 43.9 g/L dipotassium phosphate (K2HPO4) and 15.52 g/L monopotassium phosphate (KH2PO4).
The working solution and ruptured biomass cells were added, submitted to a mechanical stirrer (IKA, RW20 digital, Germany), and rested for 10-15 minutes. Samples were removed and poured using a pipette, placed on a standard Neubauer hemocytometer (10 μL), and observed under an optical microscope (BX53, Olympus Corporation, Japan) at 100x objectives for cell counting. Intact cells appeared green and/or magenta, while dead or damaged cells were stained red. The cells were counted in five quadrants in the Neubauer camera. The cell break degree (% of cells) of the disrupted biomass represents the level of physical destruction of cells and was calculated according to Equation 1.
- Evaluation of the cell disruption level through the amount of extracted soluble protein
The effect of microalgal cell disruption on protein extraction was evaluated using the amount of the total hydrosoluble protein extracted [3]. The disrupted biomass in each treatment was suspended in distilled water at a concentration of 10.0% w/v and then magnetically stirred for 24 h. The pH of the microalgal suspension was adjusted to 10, and the suspension was magnetically stirred (MA 502/D, Marconi, Brazil) at 1500 rpm for 2 h at 25 °C. The mixture was centrifuged at 5000 × g for 5 min (centrifuge 5430, Eppendorf, Germany), and the supernatant with soluble proteins was collected. For a better protein extraction yield, the residual biomass (pellet) was resuspended in deionized water, and the pH was adjusted again to 10. This extraction procedure was repeated, resulting in 3 sequential extractions.
The soluble protein content in each extraction procedure was quantified by Lowry’s methodology [27] using bovine serum albumin (fraction V powder, Sigma‒Aldrich, USA) to prepare the standard curve. The percentage of protein recovery from the biomass, or the protein yield, was determined as described by [28] using Equation 2. All extractions were performed in triplicate.
where C is the hydrosoluble protein concentration (mg/mL) in each extract, and V is the final volume of the protein extract (mL). Pi is the protein content of the microalgal freeze-dried feedstock (mg), which was disrupted with base hydrolysis [16].
The mass of the concentrate of the total extracted protein was determined by gravimetry after freeze-drying (L101, Liobras, Brazil). All extractions were performed in triplicate.
The protein content (%) of each freeze-dried extract was calculated by Equation 3.
The color parameters of each freeze-dried extract were determined on a CR-10 colorimeter (Konica Minolta, Japan). The color was evaluated by the CIELab color space method, determining the yellowness (b), redness (a), and lightness (L*) values.
The freeze-dried extracts were evaluated by scanning electron microscopy (SEM). The samples were covered with gold (15 nm thick) (Quorum, Q150RS, UK) (Berger et al. 2016) and analyzed under an LEO 1430 VP scanning electron microscope (Carl Zeiss, UK) at 20 kV.
2.5. Statistical Analysis
The results of the microalgal cell disruption indicators were submitted to analysis of variance (ANOVA), and the Tukey test determined significant differences (p < 0.05) between treatments. The results are represented as the means ± standard deviations, and the measurements were performed in triplicate.
3. Results
The proximate composition (w/w) of the T. obliquus biomass was 40.29 ± 0.24% proteins, 18.33 ± 0.03% ashes, 7.87 ± 0.10% moisture, 4.23 ± 0.21% lipids, and 29.28% carbohydrates.
The results of the electrophoretic analysis of proteins in homogenized samples of T. obliquus in SDS‒PAGE gel are shown in Figure 1.
The extracts with different protein concentrations presented peptide bands with molecular masses varying between 31 and 200 kDa. All samples showed an equal number of bands, but some bands were clearer. The best separation between the bands occurred with the sample from line 2 (40 µg of protein extract), and the bands with the highest intensity were located in the molecular mass range between 45 and 66.2 kDa.
Among the proteins expressed in the electrophoretic analysis, the protein in letter A of Figure 1 shows the highest intensity and best separation. The corresponding band was cut from the gel and digested with the trypsin enzyme as described in the identification methodology. After tryptic digestion, the molecular mass of the peptides was determined using an Ultraflex III MALDI TOF-TOF mass spectrometer (Bruker Daltonics). This analysis provides the spectrum shown in Figure 2 with the mass/charge ratio of the peptides from the letter A protein.
The large enzyme ribulose bisphosphate carboxylase (RuBisCO), with a molecular mass of 52.574 kg/mol, was identified after comparing the masses of peptides arising from protein band digestion with the molecular masses of peptides from protein cleavage available in the SwissProt database using MASCOT software.
Figure 3 indicates a greater homology (score = 80) of the microalgae Tetradesmus obliquus and the microalgae Acutodesmus oblíquos, which belong to the same genus as the organism studied, Tetradesmus sp. [29].
Figure 4 (A-D) shows the morphological photomicrographs of the microalgae cell after mechanical disruption, in which Figure 4A represents the control sample, i.e., the microalgae cells without mechanical disruptions. The control sample showed major cells with a green intact ellipsoidal appearance. Ball mill samples presented grouped cells with a major green color, making it impossible to count the individual cells. High-pressure homogenization showed green and red cells, reaching 78.51 ± 1.97% of ruptured cells, while ultrasound samples showed the highest number of disrupted cells (80.17 ± 0.54%).
Figure 5 shows the protein recovery in each extraction for the ultrasound (US), high-pressure homogenization (HPH), and ball mill (BM) treatments. The highest value of total protein extraction efficiency was obtained for US disruption (19.95%), while HPH and BM showed similar protein recoveries of 15.68% and 14.11%, respectively, with no significant difference between them (p value ≤ 0.05). The main protein separation occurred in the first extraction stage. It was highest for the US treatment (16.02%), and HPH and BM showed similar protein separation levels of 10.87% and 10.37%, respectively. In the second extraction, 2.47% to 3.22% of proteins were separated from the biomasses, while in the third extraction, 0.77% to 2.09% of proteins were separated from the biomasses.
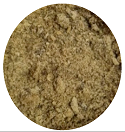
Table 1 shows the results for protein mass yield (%) (g of protein of powder extract/100 g of dried microalgae), % of protein of extracts (g of protein of powder extract/100 g of extract), the visual appearance of protein extracts, and colorimetric parameters of protein extracts. The mass yields of the US, HPH, and BM treatments were 20.8%, 17.1%, and 16.1%, respectively. All samples showed lightness with a yellow tone (b+) and red traces (a+). The protein extract obtained from the HPH treatment showed the highest color parameters. Its lightness and yellow color can also be observed in visual appearance images.
Figure 6 shows the microstructure of microalgae protein powders on SEM analysis. The samples showed a variety of particle types, including irregular particles, elongated particles, and oversized particle agglomerates sticking to each other. Pores were not observed on the particle surface. BM protein powder (Figure 6A and 6D) showed sheet-like structures with large particle sizes, irregular geometry shapes, and particle sizes larger than those of HPH (Figure 6B and 6E) and US (Figure 6C and 6F) protein powders.
4. Discussion
4.1. Composition of T. obliquus biomass
The microalgal biomass showed a high content of proteins (40.29 ± 0.24% w/w), agreeing with previous literature data for Tetradesmus spp. [13,19,24,30]. Thus, T. obliquus biomass is a strategic ingredient for the food industry, both in nutritional terms [3] and as a raw material for obtaining protein isolates and concentrates [24,30].
The high ash content found (18.33 ± 0.03 w/w) is probably due to the absorption by the organisms of substantial amounts of minerals available in culture media [17]. Since minerals can somewhat negatively affect the applicability of biomass and protein concentrates, the mineral content may be reduced. A suggestion is adding washing steps into biomass production to solubilize salts, especially phosphates and calcium [31].
The observed low lipid content (4.23 ± 0.21%), compared with reported literature for T. obliquus lipid contents [13,16,30], is probably due to the culture media composition and harvest conditions [13]. Carbohydrates were the second major component in biomass (29.28%), including fiber and glycogen. The total carbohydrate content was obtained using the difference between 100% and the other compound contents (proteins, moisture, ash, and lipids); thus, this value considers the sampling error found in other analyses.
4.2. Identification of T. obliquus protein extract
The electrophoretic bands with higher intensities corresponded to proteins with molecular masses between 45 and 66.2 kDa (Figure 1). The greatest intensity was close to 60 kDa. Bands with lower intensity were also observed, as indicated by the arrows in Figure 1, corresponding to molecular masses of 147.61 kDa, 126.53 kDa, 106.52 kDa, 102.72 kDa, and 83.34 kDa. The bands for molecular masses greater than 200 kDa represent protein aggregates. The diversity in protein composition can be explained by the fact that microalgae do not accumulate distinct proteins as an N source [32].
The large enzyme RuBisCO was identified as the band between 45 and 66.2 kDa with the help of MALDI-TOF MS. MALDI-TOF MS is a mass spectrometric technique widely used in the chemotaxonomy of microorganisms, allowing the analysis of proteins, peptides, and other biomolecules due to its low ionization energy. The chemotaxonomy is mainly based on the differences in the spectral patterns obtained for each organism [34]. Protein identification is considered valid if more than two peptides are matched and the MASCOT software score is greater than, or equal to, the significance threshold (p <0.05) [35].
Among the identified proteins, Figure 3 indicates a greater homology (score = 80) of the microalgae T. obliquus and the microalgae Acutodesmus oblíquos than with other organisms listed in the protein ranking. The microalga Acutodesmus oblíquos belongs to the same genus as the organism studied, Tetradesmus sp. [29].
RuBisCO is present in plastids and chloroplasts of plants, algae, and cyanobacteria. It catalyzes two reactions: the carboxylation of D-ribulose 1,5-bisphosphate, the primary event in carbon dioxide fixation, and the oxidative fragmentation of the pentose substrate in the photorespiration process. Both simultaneous reactions compete for the same active site [33].
4.3. Cell rupture and protein extraction from T. obliquus
- Evaluation of the cell disruption level through cell counting
The optical microscopic examination of cells is a common technique to measure the cell breaking level. Figure 4A shows the control sample used in the disruption studies. It comprises cells of T. obliquus not subjected to any disruption treatment, also named original T. obliquus cells in the present work. The control sample showed an ellipsoidal shape, with a concave or linear fusiform contour and cells grouped in numbers of 4 or 8, the cenobia. Even the control sample showed the presence of cells with a reddish color, suggesting that some of the cells may have been damaged or ruptured. This behavior is probably due to cell disintegration and membrane permeabilization of microalgal species with a rigid cell wall, such as T. obliquus [19], during freeze-drying [36]
A ball mill (BM) is a simple method for disrupting the cell walls of different microorganisms [37]. However, Figure 4B indicates that the BM treatment did not effectively disrupt the microalgal cells. The biomass submitted to BM treatment showed strong agglomeration. In the BM treatment, the microalgal biomass was placed inside a closed chamber in the presence of small steel spheres with vigorous agitation. Due to shear force, kinetic energy is transferred to biomass to break the cells. This behavior hinders the dye’s permeation in the medium, making differentiating intact and damaged cells impossible. Furthermore, it was not possible to determine the percentage of ruptured cells.
Bunge et al. [38] observed complete cell disruption of the bacterium Arrhrobacter sp. in a stirred BM, in which the enzymes were released without any degradation by using small grinding balls. The energy for cell rupture is well utilized when the disintegration rate correlates with a specific energy. Schuller et al.[39] used BM to extract lutein and β-carotene from wet and lyophilized biomass of Tetraselmis sp. The break with wet biomass glass beads best responded to the extractive treatments. However, the literature reported promising results for BM mechanical disruption with dried biomass [13,16].
The high-pressure homogenization (HPH) of the microalgal cells revealed significant differences between the treatment and control samples (Figure 4C) and broken fragments (parts with a redder color) of the cell wall. The percentage of ruptured cells reached 78.51 ± 1.97%. In the HPH process, cell disruption is achieved through the high-pressure impact (shear forces) of the accelerated fluid jet on the homogenizer stationary valve surface and hydrodynamic cavitation from the pressure drop-induced shear stress [10]. Thus, HPH is especially suitable for emulsification processes.
Dias et al. [12] used HPH, followed by solvent extraction, to simultaneously extract lipids and carotenoids from Rhodosporidium toruloides biomass without any harvesting technique. The combined use of HPH and solvent extraction promoted higher extraction than conventional solvent extraction. Günerken et al. [10] argue some disadvantages of the HPH process, such as nonselective intracellular compound releases, difficulties in breaking rigid cell walls, generation of superfine cell debris, not a mild technique, and inability to isolate fragile functional compounds. However, among the different cell disruption techniques, HPH is easily scalable.
Figure 4D shows that the ultrasound (US) treatment exhibited the highest number of red cells compared to the BM and HPH treatments, suggesting that US effectively disrupted the microalgal biomass. The percentage of ruptured cells was 80.17 ± 0.54%. Ultrasound is a physical treatment based on bubble cavitation that uses sound waves to propagate pressure fluctuations, induces cavitation, and promotes nonspecific cell-surface barrier disruption [40]. The wall structure and size of the cells are critical factors affecting cell disruption efficacy in ultrasonic processing. Concerning the wall structure, microalgae with cellulose carbohydrate-based cell walls typically show more resistance against ultrasound than cell walls mainly composed of hydroxyproline-rich glycoproteins [41]. According to Do Carmo Cesário et al. [19], the T. obliquus cell wall is filled predominantly with fibrous material and has three well-defined layers, making breaking down even more challenging.
Spiden et al. [42] used the cell counting technique to evaluate Saccharomyces cerevisiae cell disruption after HPH treatment. According to the authors, an interval between 10 and 30 min was necessary to perform the cell count, depending on the sample volume and the cell concentration. Due to cell debris, reliable automated cell counting is not always possible. These observations show that a study of cell counting is insufficient to understand cell disruption, and an effective technique for monitoring and measuring the impact of treatment on microalgae cell disruption is necessary. Thus, protein extraction yield under different rupture treatments is another parameter to evaluate cell breaking.
- Evaluation of the cell disruption level through the amount of extracted soluble protein
The resistance of cell walls to disruption is a barrier hindering the efficient removal of intracellular components and may interfere with the accuracy of compound quantification [39]. Thus, the more intracellular compounds recovered after cell breaking, the greater the efficiency of the disruption method. According to Safi et al. [43], the amount of protein in the aqueous supernatant was a technique appropriate for evaluating the degree of cell disruption in three species of microalgae: M. aeruginosa, C. pyrenoidosa, and C. reinhardtii.
According to Figure 5, the number of extraction steps positively affected protein recovery. The ultrasound treatment resulted in the highest total protein extraction yield (19.95%). This result agrees with the behavior of cell disruption observed by optical microscopy after US treatment, in which most cells were red-colored, and the number of disrupted cells (80.17%) was the highest. Therefore, the efficiency of US treatment is evident in disrupting the cell wall, allowing protein extraction from microalgae cells.
The US treatment for cell disruption is based on the emission of high-frequency wave sounds (up to 15–20 kHz) in liquid. These sound waves create gas bubbles that achieve a critical size, collapsing and releasing large amounts of energy [44]. Cells adjacent to collapsing cavitation bubbles are broken, while cells located farther away from bubble cavitation also experience a smaller local energy flux [45]. Thus, the cell disruption power extends beyond the effect on the cell wall, reaching other microalgae cell organelles.
Furthermore, it is emphasized that acoustic cavitation occurs by increasing the local temperature [44], and this temperature rise might destroy target compounds, especially proteins. As proteins can be used as a techno-functional ingredient in food systems, the protein extraction process must occur without drastic conditions that could make them nonfunctional [9]. González-Fernandez et al. [46] reported temperatures up to 85 °C when 100.7 MJ/kg of energy was supplied to Scenedesmus biomass through US treatment for 15 min. The authors suggested that thermal effects might have accounted for cell disruption of Scenedesmus biomass. US treatment needs to be optimized to avoid thermal overexposure of biomass; once cell disruption is achieved, more energy is absorbed or scattered by the cell debris [47]. Cooling is usually used to prevent overexposure during or after ultrasound operation.
Recently, Delran et al. [11] verified that a low-frequency ultrasound of 20 kHz was adequate for breaking Tetraselmis suecica cells at a power of 120 W and 60 min ultrasonication, allowing the extraction of 90% of the total proteins. Compared with the literature, the low protein extraction (19.95%) observed in our US study could be explained by the intensity of cell rupture. Do Carmo Cesário et al. [19] observed the presence of proteins in the nucleus and cytoplasmic regions of T. obliquus by histochemistry tests. Therefore, mechanical treatments should collapse different parts of microalgae cells to achieve protein extraction.
Lupatini et al. [48] studied the US-assisted extraction of algal proteins from Spirulina platensis. The authors found that sonication degraded the cell wall entirely or partially, providing a valuable technique to extract proteins and carbohydrates. The optimized percentage of protein extracted was 75.76%. The ultrasound bath conditions used were 30 °C, 37 Hz, and 100% sonication amplitude for 35 min of sonication. Keris-Sem et al. [49] applied US treatment to disintegrate microalgal cells and extract components other than protein. The authors achieved higher protein, carbohydrate, and lipid extraction efficiency using an ultrasonic energy intensity of 0.4 kWh/L. Soto Sierra et al. [50] achieved a maximized yield of Chlamydomonas reinhardtii protein using autolysin coupled with sonication.
The results observed in Figure 5 show that the amounts of protein extracted from T. obliquus with HPH and BM treatments were lower than that achieved with US treatment.
Katsimichas et al. [51] reported protein extraction from Chlorella pyrenoidosa after HPH treatment. The application of 800 bar of pressure and a four-pass treatment caused maximization of protein recovery of 382.0 mg proteins/g dry biomass. In our study, the pressure was lower, at 350 bar. Safi et al. [43] noted HPH as a more efficient cell disruption technique than manual grinding, ultrasonication, and alkaline treatment for extracting proteins from Nannochloropsis oculata, Chlorella vulgaris, and Haematococcus pluvialis, a green microalgae with rigid cell walls. The biomass at 2% dry weight was disrupted by HPH working with two passes at 2700 bar.
In our tests, HPH effectively broke the T. obliquus cell wall, as demonstrated by optical microscopy (Figure 4C) and by disrupted counting (78,51%). Additionally, the HPH protein extract showed a remarkable light color (Table 1), showing potential for food ingredient application. Most likely, fewer chlorophyll pigments were extracted in the HPH mechanical treatment. HPH allowed greater protein extraction and was ineffective in breaking other microalgae organelles, suggesting that higher pressures can contribute to greater protein recovery efficiency [43].
Zhang et al. [14] studied the effect of US, HPH, and their combination on the efficiency of biomolecule extraction from Parachlorella kessleri. The authors verified that applying a preliminary US treatment with 10% dry matter and a final HPH treatment with 1% dry matter increases extraction efficiency and decreases energy consumption.
Since parts of the cellular fragments came together and formed large aggregates, it was not possible to quantify the disruption effect with ball mill treatment using the cell counting method; however, it was possible to determine the disruption effects through the extraction of soluble proteins. The protein extraction yield of T. obliquus with BM treatment was 14.11% (Figure 5), in which the protein showed particles with larger sizes and irregular shapes, including sheet-like structures, as seen in Figure 6. The changes in morphology could significantly affect the functional properties of microalgae protein extract. Despite the low yield found, ball milling and HPH are the preferred methods for industrial-scale microalgae cell disruption [10].
5. Conclusions
The content of extracted soluble protein was a reliable indirect index to measure the level of cell disruption. Optical cell counting was not an optimal indicator to monitor cell disruption, although it is a common technique for determining cell concentration in microbial cultures. Microalgal disruption under different mechanical treatments could be evaluated using the extracted protein content combined with the cell counting technique. Ultrasound treatment performed better in microalgal cell breaking than high-pressure homogenization and ball mill treatments. However, the efficiency of the extraction of protein must be improved. Combining conventional techniques, e.g., ultrasonication with high-pressure homogenization, may reduce the energy demand of mechanical disruption methods and provide better protein extraction yield.
Author Contributions
Conceptualization, C.A.S.S., K.V.M.S., J.R.M.J., M.A.M., M.O.L. and J.S.R.C.; methodology, C.A.S.S., K.V.M.S., S.R.C., J.R.M.J., R.C.S., E.B.O., M.A.M., M.O.L. and J.S.R.C.; formal analysis, C.A.S.S., K.V.M.S., S.R.C., J.R.M.J., R.C.S., M.O.L. and J.S.R.C.; investigation, K.V.M.S., S.R.C., J.R.M.J. and M.O.L.; resources, C.A.S.S., R.C.S., E.B.O., M.A.M. and J.S.R.C.; data curation, C.A.S.S., K.V.M.S., S.R.C., M.O.L. and J.S.R.C.; writing—original draft preparation, C.A.S.S., K.V.M.S. and J.S.R.C.; writing—review and editing, C.A.S.S. and J.S.R.C.; visualization, C.A.S.S., K.V.M.S., S.R.C., J.R.M.J., R.C.S., E.B.O., M.A.M., M.O.L. and J.S.R.C.; supervision, C.A.S.S., J.R.M.J., R.C.S., M.O.L. and J.S.R.C.; project administration, C.A.S.S., E.B.O., M.A.M. and J.S.R.C.; funding acquisition, C.A.S.S., R.C.S., E.B.O., M.A.M. and J.S.R.C. All authors have read and agreed to the published version of the manuscript.
Funding
This research was financially supported by the Brazilian agencies Fundação de Amparo à Pesquisa do Estado de Minas Gerais (Fapemig), Conselho Nacional de Desenvolvimento Científico e Tecnológico (CNPq), Financiadora de Estudos e Projetos (Finep), and Coordenação de Aperfeiçoamento de Pessoal de Nível Superior – Brazil (CAPES) – Finance Code 001 and by Petróleo Brasileiro S.A. (Petrobras).
Institutional Review Board Statement
Not applicable.
Informed Consent Statement
Not applicable.
Data Availability Statement
The data presented in this study are available upon request from the corresponding author.
Acknowledgments
We are grateful to the Núcleo de Análise de Biomoléculas (NuBioMol) and the Laboratório de Biocombustíveis at the Universidade Federal de Viçosa (UFV), Viçosa, Brazil, for providing the facilities for the conduction of the experiments and data analysis.
Conflicts of Interest
The authors declare no conflict of interest.
References
- Waghmare, A.G.; Salve, M.K.; LeBlanc, J.G.; Arya, S.S. Concentration and Characterization of Microalgae Proteins from Chlorella Pyrenoidosa. Bioresour. Bioprocess. 2016, 3, 16. [Google Scholar] [CrossRef]
- Kumar, R.; Hegde, A.S.; Sharma, K.; Parmar, P.; Srivatsan, V. Microalgae as a Sustainable Source of Edible Proteins and Bioactive Peptides – Current Trends and Future Prospects. Food Research International 2022, 157, 111338. [Google Scholar] [CrossRef] [PubMed]
- Silva, M.E.T.D.; Correa, K.D.P.; Martins, M.A.; Da Matta, S.L.P.; Martino, H.S.D.; Coimbra, J.S.D.R. Food Safety, Hypolipidemic and Hypoglycemic Activities, and in Vivo Protein Quality of Microalga Scenedesmus Obliquus in Wistar Rats. Journal of Functional Foods 2020, 65, 103711. [Google Scholar] [CrossRef]
- Sengupta, S.; Koley, H.; Dutta, S.; Bhowal, J. Hypocholesterolemic Effect of Spirulina Platensis (SP) Fortified Functional Soy Yogurts on Diet-Induced Hypercholesterolemia. Journal of Functional Foods 2018, 48, 54–64. [Google Scholar] [CrossRef]
- Bigagli, E.; Cinci, L.; Niccolai, A.; Tredici, M.R.; Biondi, N.; Rodolfi, L.; Lodovici, M.; D’Ambrosio, M.; Mori, G.; Luceri, C. Safety Evaluations and Lipid-Lowering Activity of an Arthrospira Platensis Enriched Diet: A 1-Month Study in Rats. Food Research International 2017, 102, 380–386. [Google Scholar] [CrossRef]
- Niccolai, A.; Bigagli, E.; Biondi, N.; Rodolfi, L.; Cinci, L.; Luceri, C.; Tredici, M.R. In Vitro Toxicity of Microalgal and Cyanobacterial Strains of Interest as Food Source. J Appl Phycol 2017, 29, 199–209. [Google Scholar] [CrossRef]
- Serban, M.-C.; Sahebkar, A.; Dragan, S.; Stoichescu-Hogea, G.; Ursoniu, S.; Andrica, F.; Banach, M. A Systematic Review and Meta-Analysis of the Impact of Spirulina Supplementation on Plasma Lipid Concentrations. Clinical Nutrition 2016, 35, 842–851. [Google Scholar] [CrossRef]
- Becker, E.W. Microalgae for Human and Animal Nutrition. In Handbook of Microalgal Culture; Richmond, A., Hu, Q., Eds.; Wiley, 2013; pp. 461–503. [Google Scholar]
- Grossmann, L.; Ebert, S.; Hinrichs, J.; Weiss, J. Effect of Precipitation, Lyophilization, and Organic Solvent Extraction on Preparation of Protein-Rich Powders from the Microalgae Chlorella Protothecoides. Algal Research 2018, 29, 266–276. [Google Scholar] [CrossRef]
- Günerken, E.; D’Hondt, E.; Eppink, M.H.M.; Garcia-Gonzalez, L.; Elst, K.; Wijffels, R.H. Cell Disruption for Microalgae Biorefineries. Biotechnology Advances 2015, 33, 243–260. [Google Scholar] [CrossRef]
- Delran, P.; Frances, C.; Peydecastaing, J.; Pontalier, P.-Y.; Guihéneuf, F.; Barthe, L. Cell Destruction Level and Metabolites Green-Extraction of Tetraselmis Suecica by Low and Intermediate Frequency Ultrasound. Ultrasonics Sonochemistry 2023, 98, 106492. [Google Scholar] [CrossRef]
- Dias, C.; Nobre, B.P.; Santos, J.A.L.; Lopes Da Silva, T.; Reis, A. Direct Lipid and Carotenoid Extraction from Rhodosporidium Toruloides Broth Culture after High Pressure Homogenization Cell Disruption: Strategies, Methodologies, and Yields. Biochemical Engineering Journal 2022, 189, 108712. [Google Scholar] [CrossRef]
- Amorim, M.L.; Soares, J.; Vieira, B.B.; Batista-Silva, W.; Martins, M.A. Extraction of Proteins from the Microalga Scenedesmus Obliquus BR003 Followed by Lipid Extraction of the Wet Deproteinized Biomass Using Hexane and Ethyl Acetate. Bioresource Technology 2020, 307, 123190. [Google Scholar] [CrossRef] [PubMed]
- Zhang, R.; Grimi, N.; Marchal, L.; Lebovka, N.; Vorobiev, E. Effect of Ultrasonication, High Pressure Homogenization and Their Combination on Efficiency of Extraction of Bio-Molecules from Microalgae Parachlorella Kessleri. Algal Research 2019, 40, 101524. [Google Scholar] [CrossRef]
- Handbook of Microalgal Culture: Biotechnology and Applied Phycology, 1st ed.; Richmond, A., Ed.; Wiley, 2003; ISBN 978-0-632-05953-9. [Google Scholar]
- Vieira, B.B.; Soares, J.; Amorim, M.L.; Bittencourt, P.V.Q.; De Cássia Superbi, R.; De Oliveira, E.B.; Dos Reis Coimbra, J.S.; Martins, M.A. Optimized Extraction of Neutral Carbohydrates, Crude Lipids and Photosynthetic Pigments from the Wet Biomass of the Microalga Scenedesmus Obliquus BR003. Separation and Purification Technology 2021, 269, 118711. [Google Scholar] [CrossRef]
- Covell, L.; Machado, M.; Vaz, M.G.M.V.; Soares, J.; Batista, A.D.; Araújo, W.L.; Martins, M.A.; Nunes-Nesi, A. Alternative Fertilizer-Based Growth Media Support High Lipid Contents without Growth Impairment in Scenedesmus Obliquus BR003. Bioprocess Biosyst Eng 2020, 43, 1123–1131. [Google Scholar] [CrossRef] [PubMed]
- Rocha, R.P.; Machado, M.; Vaz, M.G.M.V.; Vinson, C.C.; Leite, M.; Richard, R.; Mendes, L.B.B.; Araujo, W.L.; Caldana, C.; Martins, M.A.; et al. Exploring the Metabolic and Physiological Diversity of Native Microalgal Strains (Chlorophyta) Isolated from Tropical Freshwater Reservoirs. Algal Research 2017, 28, 139–150. [Google Scholar] [CrossRef]
- Do Carmo Cesário, C.; Soares, J.; Cossolin, J.F.S.; Almeida, A.V.M.; Bermudez Sierra, J.J.; De Oliveira Leite, M.; Nunes, M.C.; Serrão, J.E.; Martins, M.A.; Dos Reis Coimbra, J.S. Biochemical and Morphological Characterization of Freshwater Microalga Tetradesmus Obliquus (Chlorophyta: Chlorophyceae). Protoplasma 2022, 259, 937–948. [Google Scholar] [CrossRef] [PubMed]
- Association of Official Analytical Chemists. Official Methods of Analysis, 18th ed.Gaithersburg, MD, USA, 2005. [Google Scholar]
- Folch, J.; Lees, M.; Sloane Stanley, G.H. A Simple Method for the Isolation and Purification of Total Lipides from Animal Tissues. J Biol Chem 1957, 226, 497–509. [Google Scholar] [CrossRef]
- Afify, A.E.-M.M.R.; El Baroty, G.S.; El Baz, F.K.; Abd El Baky, H.H.; Murad, S.A. Scenedesmus Obliquus: Antioxidant and Antiviral Activity of Proteins Hydrolyzed by Three Enzymes. Journal of Genetic Engineering and Biotechnology 2018, 16, 399–408. [Google Scholar] [CrossRef]
- Shevchenko, A.; Tomas, H.; Havli, J.; Olsen, J.V.; Mann, M. In-Gel Digestion for Mass Spectrometric Characterization of Proteins and Proteomes. Nat Protoc 2006, 1, 2856–2860. [Google Scholar] [CrossRef]
- Silva, M.E.T.D.; Leal, M.A.; Resende, M.D.O.; Martins, M.A.; Coimbra, J.S.D.R. Scenedesmus Obliquus Protein Concentrate: A Sustainable Alternative Emulsifier for the Food Industry. Algal Research 2021, 59, 102468. [Google Scholar] [CrossRef]
- Shene, C.; Monsalve, M.T.; Vergara, D.; Lienqueo, M.E.; Rubilar, M. High Pressure Homogenization of Nannochloropsis Oculata for the Extraction of Intracellular Components: Effect of Process Conditions and Culture Age. Eur. J. Lipid Sci. Technol. 2016, 118, 631–639. [Google Scholar] [CrossRef]
- Gminski, R.; Decker, K.; Heinz, C.; Seidel, A.; Könczöl, M.; Goldenberg, E.; Grobéty, B.; Ebner, W.; Gieré, R.; Mersch-Sundermann, V. Genotoxic Effects of Three Selected Black Toner Powders and Their Dimethyl Sulfoxide Extracts in Cultured Human Epithelial A549 Lung Cells in Vitro. Environ Mol Mutagen 2011, 52, 296–309. [Google Scholar] [CrossRef] [PubMed]
- Lowry, O.H.; Rosebrough, N.J.; Farr, A.L.; Randall, R.J. PROTEIN MEASUREMENT WITH THE FOLIN PHENOL REAGENT. Journal of Biological Chemistry 1951, 193, 265–275. [Google Scholar] [CrossRef] [PubMed]
- Anjos, L.; Estêvão, J.; Infante, C.; Mantecón, L.; Power, D.M. Extracting Protein from Microalgae (Tetraselmis Chuii) for Proteome Analysis. MethodsX 2022, 9, 101637. [Google Scholar] [CrossRef] [PubMed]
- Hegewald, E.; Wolf, M. Phylogenetic Relationships of Scenedesmus and Acutodesmus (Chlorophyta, Chlorophyceae) as Inferred from 18S rDNA and ITS-2 Sequence Comparisons. Plant Systematics and Evolution 2003, 241, 185–191. [Google Scholar] [CrossRef]
- Lima, V.S.; De Oliveira, D.R.B.; Da Silva, C.A.S.; Santana, R.D.C.; Soares, N.D.F.F.; De Oliveira, E.B.; Martins, M.A.; Coimbra, J.S.D.R. Stabilization of Oil–Water Emulsions with Protein Concentrates from the Microalga Tetradesmus Obliquus. J Food Sci Technol 2023, 60, 797–808. [Google Scholar] [CrossRef]
- Martins, P.L.; Reis, A.; Duarte, L.C.; Carvalheiro, F. Effective Fractionation of Microalgae Biomass as an Initial Step for Its Utilization as a Bioenergy Feedstock. Energy Conversion and Management: X 2022, 16, 100317. [Google Scholar] [CrossRef]
- Schwenzfeier, A.; Wierenga, P.A.; Gruppen, H. Isolation and Characterization of Soluble Protein from the Green Microalgae Tetraselmis Sp. Bioresource Technology 2011, 102, 9121–9127. [Google Scholar] [CrossRef]
- Wei, L.; Wang, Q.; Xin, Y.; Lu, Y.; Xu, J. Enhancing Photosynthetic Biomass Productivity of Industrial Oleaginous Microalgae by Overexpression of RuBisCO Activase. Algal Research 2017, 27, 366–375. [Google Scholar] [CrossRef]
- Mello, R.V.; Meccheri, F.S.; Bagatini, I.L.; Rodrigues-Filho, E.; Vieira, A.A.H. MALDI-TOF MS Based Discrimination of Coccoid Green Microalgae (Selenastraceae, Chlorophyta). Algal Research 2017, 28, 151–160. [Google Scholar] [CrossRef]
- Irrgang, A.; Weise, C.; Murugaiyan, J.; Roesler, U. Identification of Immunodominant Proteins of the Microalgae Prototheca by Proteomic Analysis. New Microbes and New Infections 2015, 3, 37–40. [Google Scholar] [CrossRef] [PubMed]
- Sang, Y.; Wang, J.; Zhang, Y.; Gao, H.; Ge, S.; Feng, H.; Zhang, Y.; Ren, F.; Wen, P.; Wang, R. Influence of Temperature during Freeze-Drying Process on the Viability of Bifidobacterium Longum BB68S. Microorganisms 2023, 11, 181. [Google Scholar] [CrossRef] [PubMed]
- Balasundaram, B.; Skill, S.C.; Llewellyn, C.A. A Low Energy Process for the Recovery of Bioproducts from Cyanobacteria Using a Ball Mill. Biochemical Engineering Journal 2012, 69, 48–56. [Google Scholar] [CrossRef]
- Bunge, F.; Pietzsch, M.; Müller, R.; Syldatk, C. Mechanical Disruption of Arthrobacter Sp. DSM 3747 in Stirred Ball Mills for the Release of Hydantoin-Cleaving Enzymes. Chemical Engineering Science 1992, 47, 225–232. [Google Scholar] [CrossRef]
- Schüler, L.M.; Santos, T.; Pereira, H.; Duarte, P.; Katkam, N.G.; Florindo, C.; Schulze, P.S.C.; Barreira, L.; Varela, J.C.S. Improved Production of Lutein and β-Carotene by Thermal and Light Intensity Upshifts in the Marine Microalga Tetraselmis Sp. CTP4. Algal Research 2020, 45, 101732. [Google Scholar] [CrossRef]
- Azencott, H.R.; Peter, G.F.; Prausnitz, M.R. Influence of the Cell Wall on Intracellular Delivery to Algal Cells by Electroporation and Sonication. Ultrasound in Medicine & Biology 2007, 33, 1805–1817. [Google Scholar] [CrossRef]
- Liu, S.; Rouquié, C.; Lavenant, L.; Frappart, M.; Couallier, E. Coupling Bead-Milling and Microfiltration for the Recovery of Lipids and Proteins from Parachlorella Kessleri: Impact of the Cell Disruption Conditions on the Separation Performances. Separation and Purification Technology 2022, 287, 120570. [Google Scholar] [CrossRef]
- Spiden, E.M.; Scales, P.J.; Kentish, S.E.; Martin, G.J.O. Critical Analysis of Quantitative Indicators of Cell Disruption Applied to Saccharomyces Cerevisiae Processed with an Industrial High Pressure Homogenizer. Biochemical Engineering Journal 2013, 70, 120–126. [Google Scholar] [CrossRef]
- Safi, C.; Ursu, A.V.; Laroche, C.; Zebib, B.; Merah, O.; Pontalier, P.-Y.; Vaca-Garcia, C. Aqueous Extraction of Proteins from Microalgae: Effect of Different Cell Disruption Methods. Algal Research 2014, 3, 61–65. [Google Scholar] [CrossRef]
- Corrêa, P.S.; Morais Júnior, W.G.; Martins, A.A.; Caetano, N.S.; Mata, T.M. Microalgae Biomolecules: Extraction, Separation and Purification Methods. Processes 2020, 9, 10. [Google Scholar] [CrossRef]
- Soto-Sierra, L.; Stoykova, P.; Nikolov, Z.L. Extraction and Fractionation of Microalgae-Based Protein Products. Algal Research 2018, 36, 175–192. [Google Scholar] [CrossRef]
- González-Fernández, C.; Sialve, B.; Bernet, N.; Steyer, J.P. Comparison of Ultrasound and Thermal Pretreatment of Scenedesmus Biomass on Methane Production. Bioresource Technology 2012, 110, 610–616. [Google Scholar] [CrossRef] [PubMed]
- Tan, X.; Zhang, D.; Parajuli, K.; Upadhyay, S.; Jiang, Y.; Duan, Z. Comparison of Four Quantitative Techniques for Monitoring Microalgae Disruption by Low-Frequency Ultrasound and Acoustic Energy Efficiency. Environ. Sci. Technol. 2018, 52, 3295–3303. [Google Scholar] [CrossRef] [PubMed]
- Lupatini, A.L.; De Oliveira Bispo, L.; Colla, L.M.; Costa, J.A.V.; Canan, C.; Colla, E. Protein and Carbohydrate Extraction from S. Platensis Biomass by Ultrasound and Mechanical Agitation. Food Research International 2017, 99, 1028–1035. [Google Scholar] [CrossRef] [PubMed]
- Keris-Sen, U.D.; Sen, U.; Soydemir, G.; Gurol, M.D. An Investigation of Ultrasound Effect on Microalgal Cell Integrity and Lipid Extraction Efficiency. Bioresource Technology 2014, 152, 407–413. [Google Scholar] [CrossRef]
- Sierra, L.S.; Dixon, C.K.; Wilken, L.R. Enzymatic Cell Disruption of the Microalgae Chlamydomonas Reinhardtii for Lipid and Protein Extraction. Algal Research 2017, 25, 149–159. [Google Scholar] [CrossRef]
- Katsimichas, A.; Karveli, I.; Dimopoulos, G.; Giannakourou, M.; Taoukis, P. Kinetics of High Pressure Homogenization Assisted Protein Extraction from Chlorella Pyrenoidosa. Innovative Food Science & Emerging Technologies 2023, 88, 103438. [Google Scholar] [CrossRef]
Figure 1.
Electrophoretic analysis of T. obliquus protein extract (PEXT) using 10% polyacrylamide gel, stained with Coomassie brilliant blue G-250. The samples were MM (marker for molecular mass); band 1 (20 µg of PEXT); band 2 (40 µg of PEXT); band 3 (50 µg of PEXT); band 4 (20 µg of PEXT - repeat); band 5 (40 µg of PEXT - repeat); and band 6 (50 µg of PEXT - repeat).
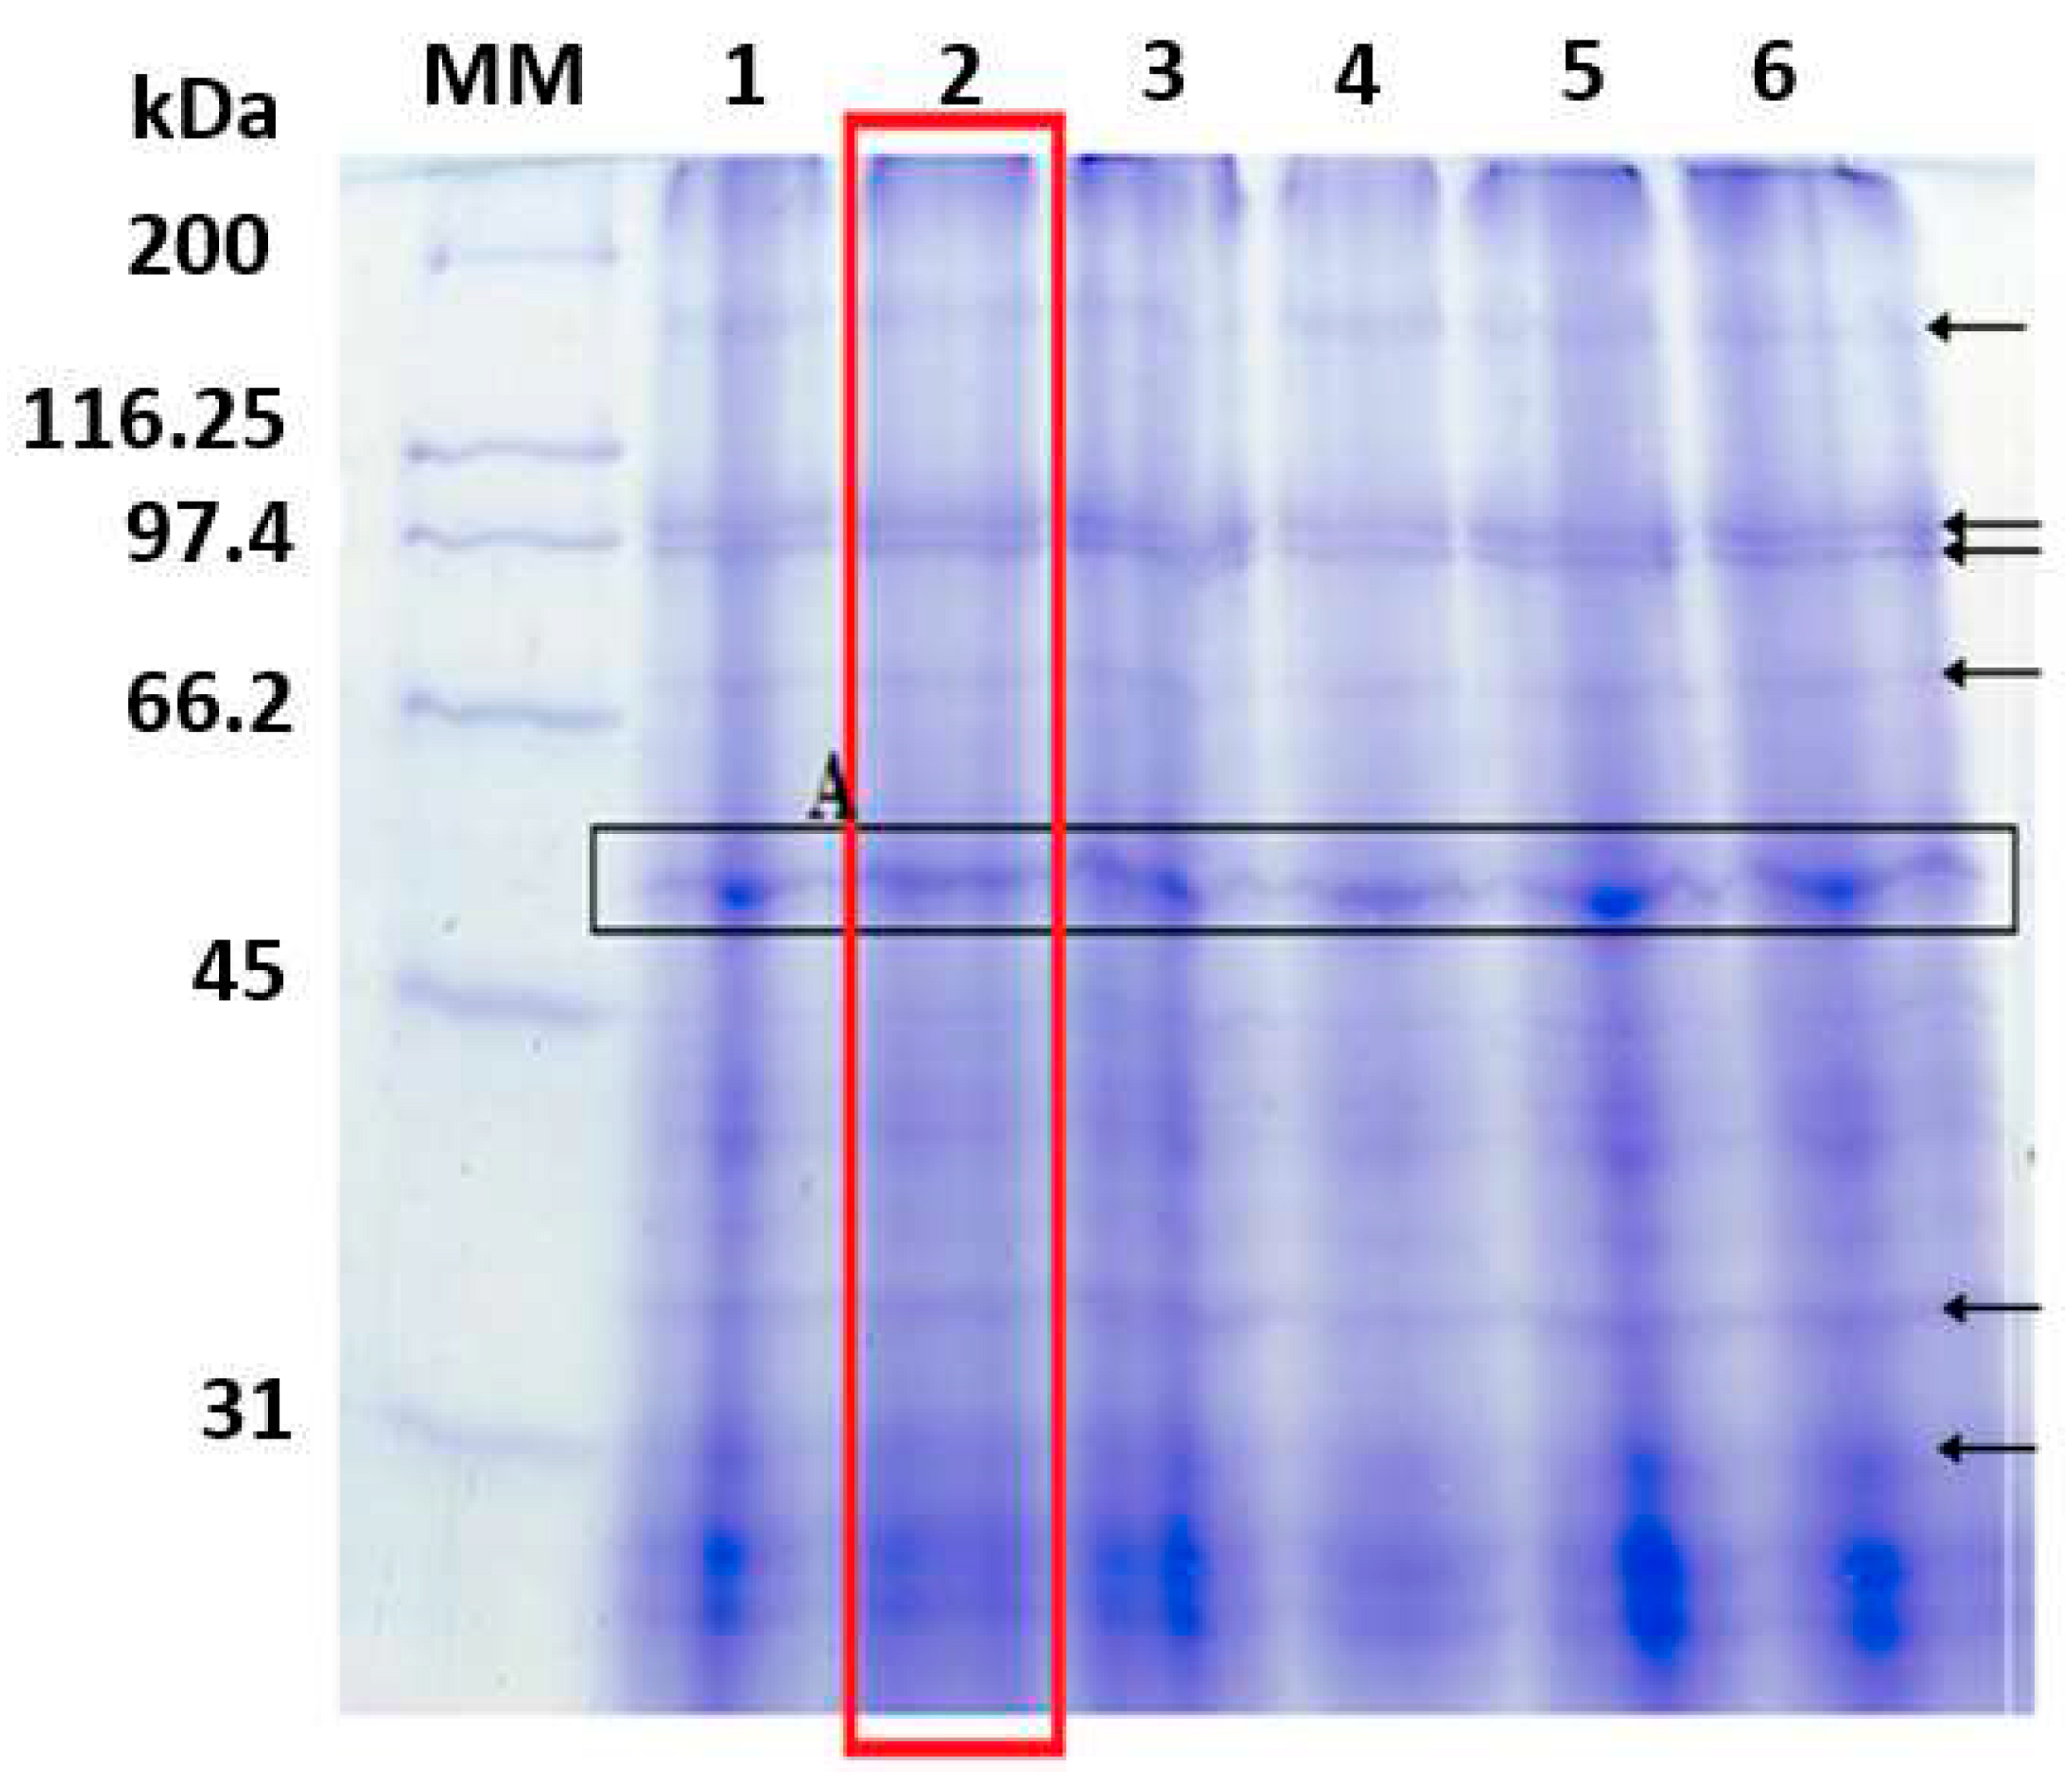
Figure 2.
MALDI-TOF-MS1: Mass spectrogram obtained after tryptic digestion of band A.
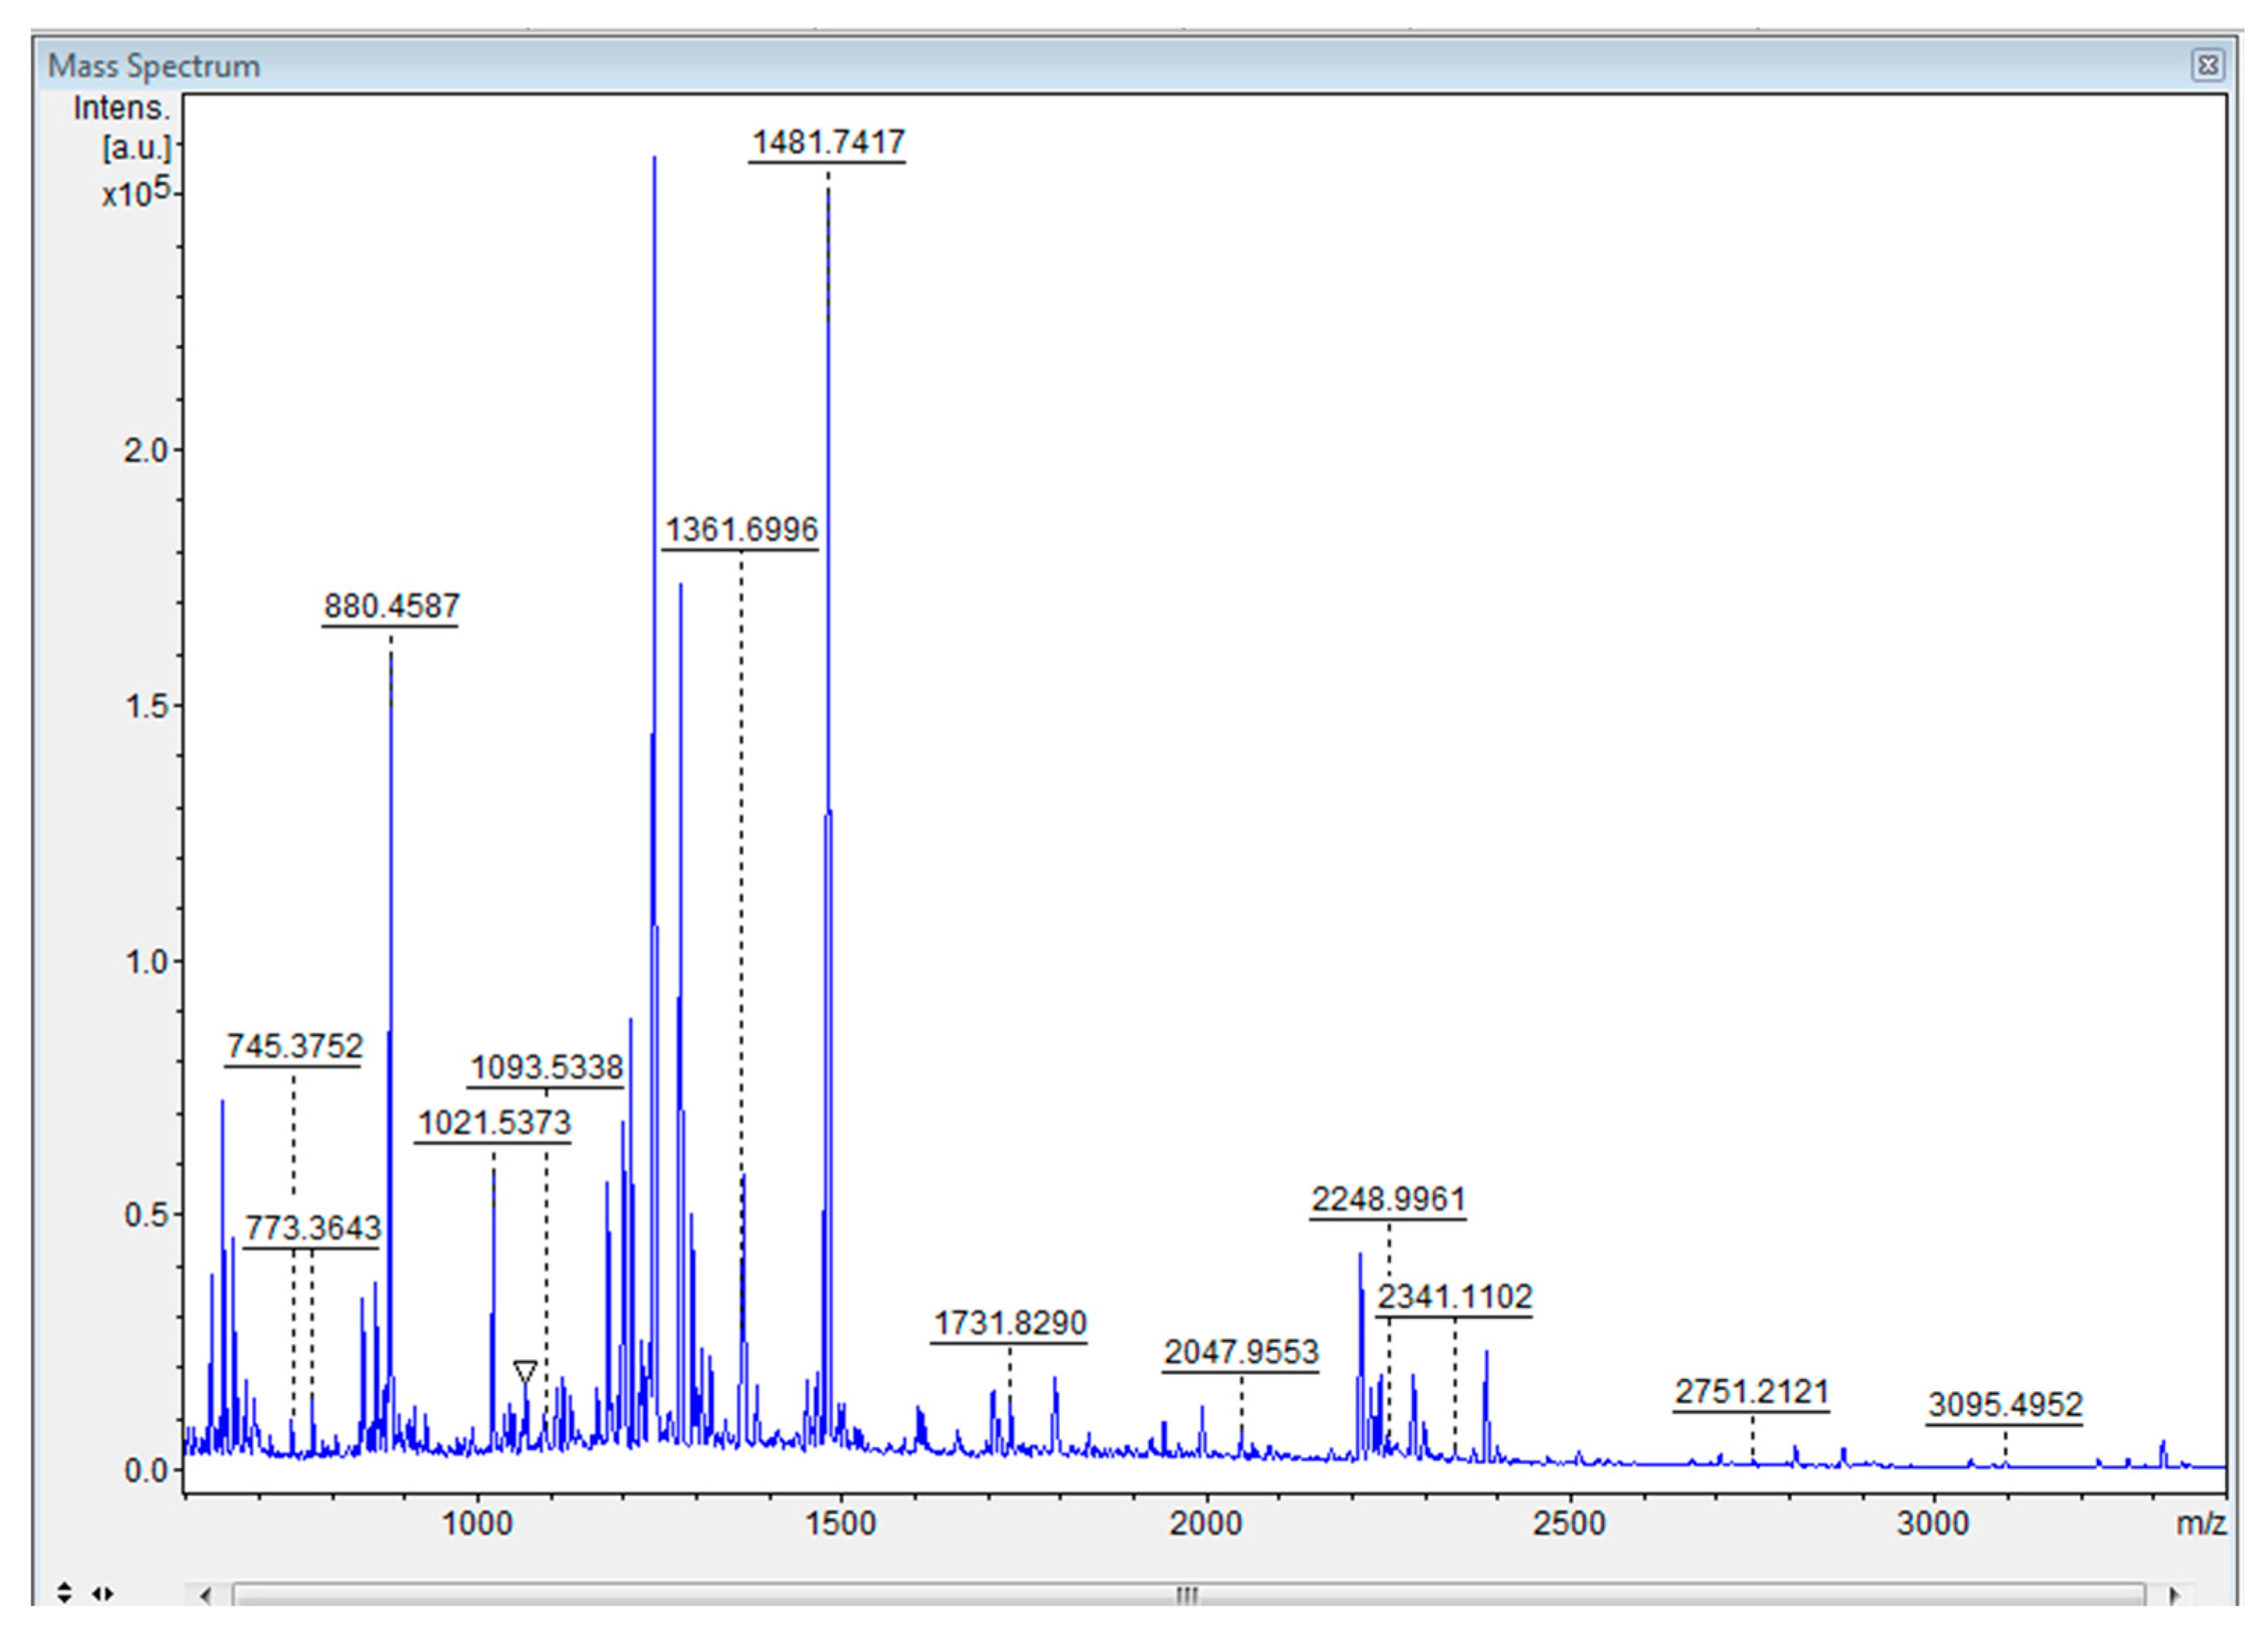
Figure 3.
Results of the SwissProt database (MASCOT software) concerning the studied Tetradesmus obliquus protein.
Figure 3.
Results of the SwissProt database (MASCOT software) concerning the studied Tetradesmus obliquus protein.
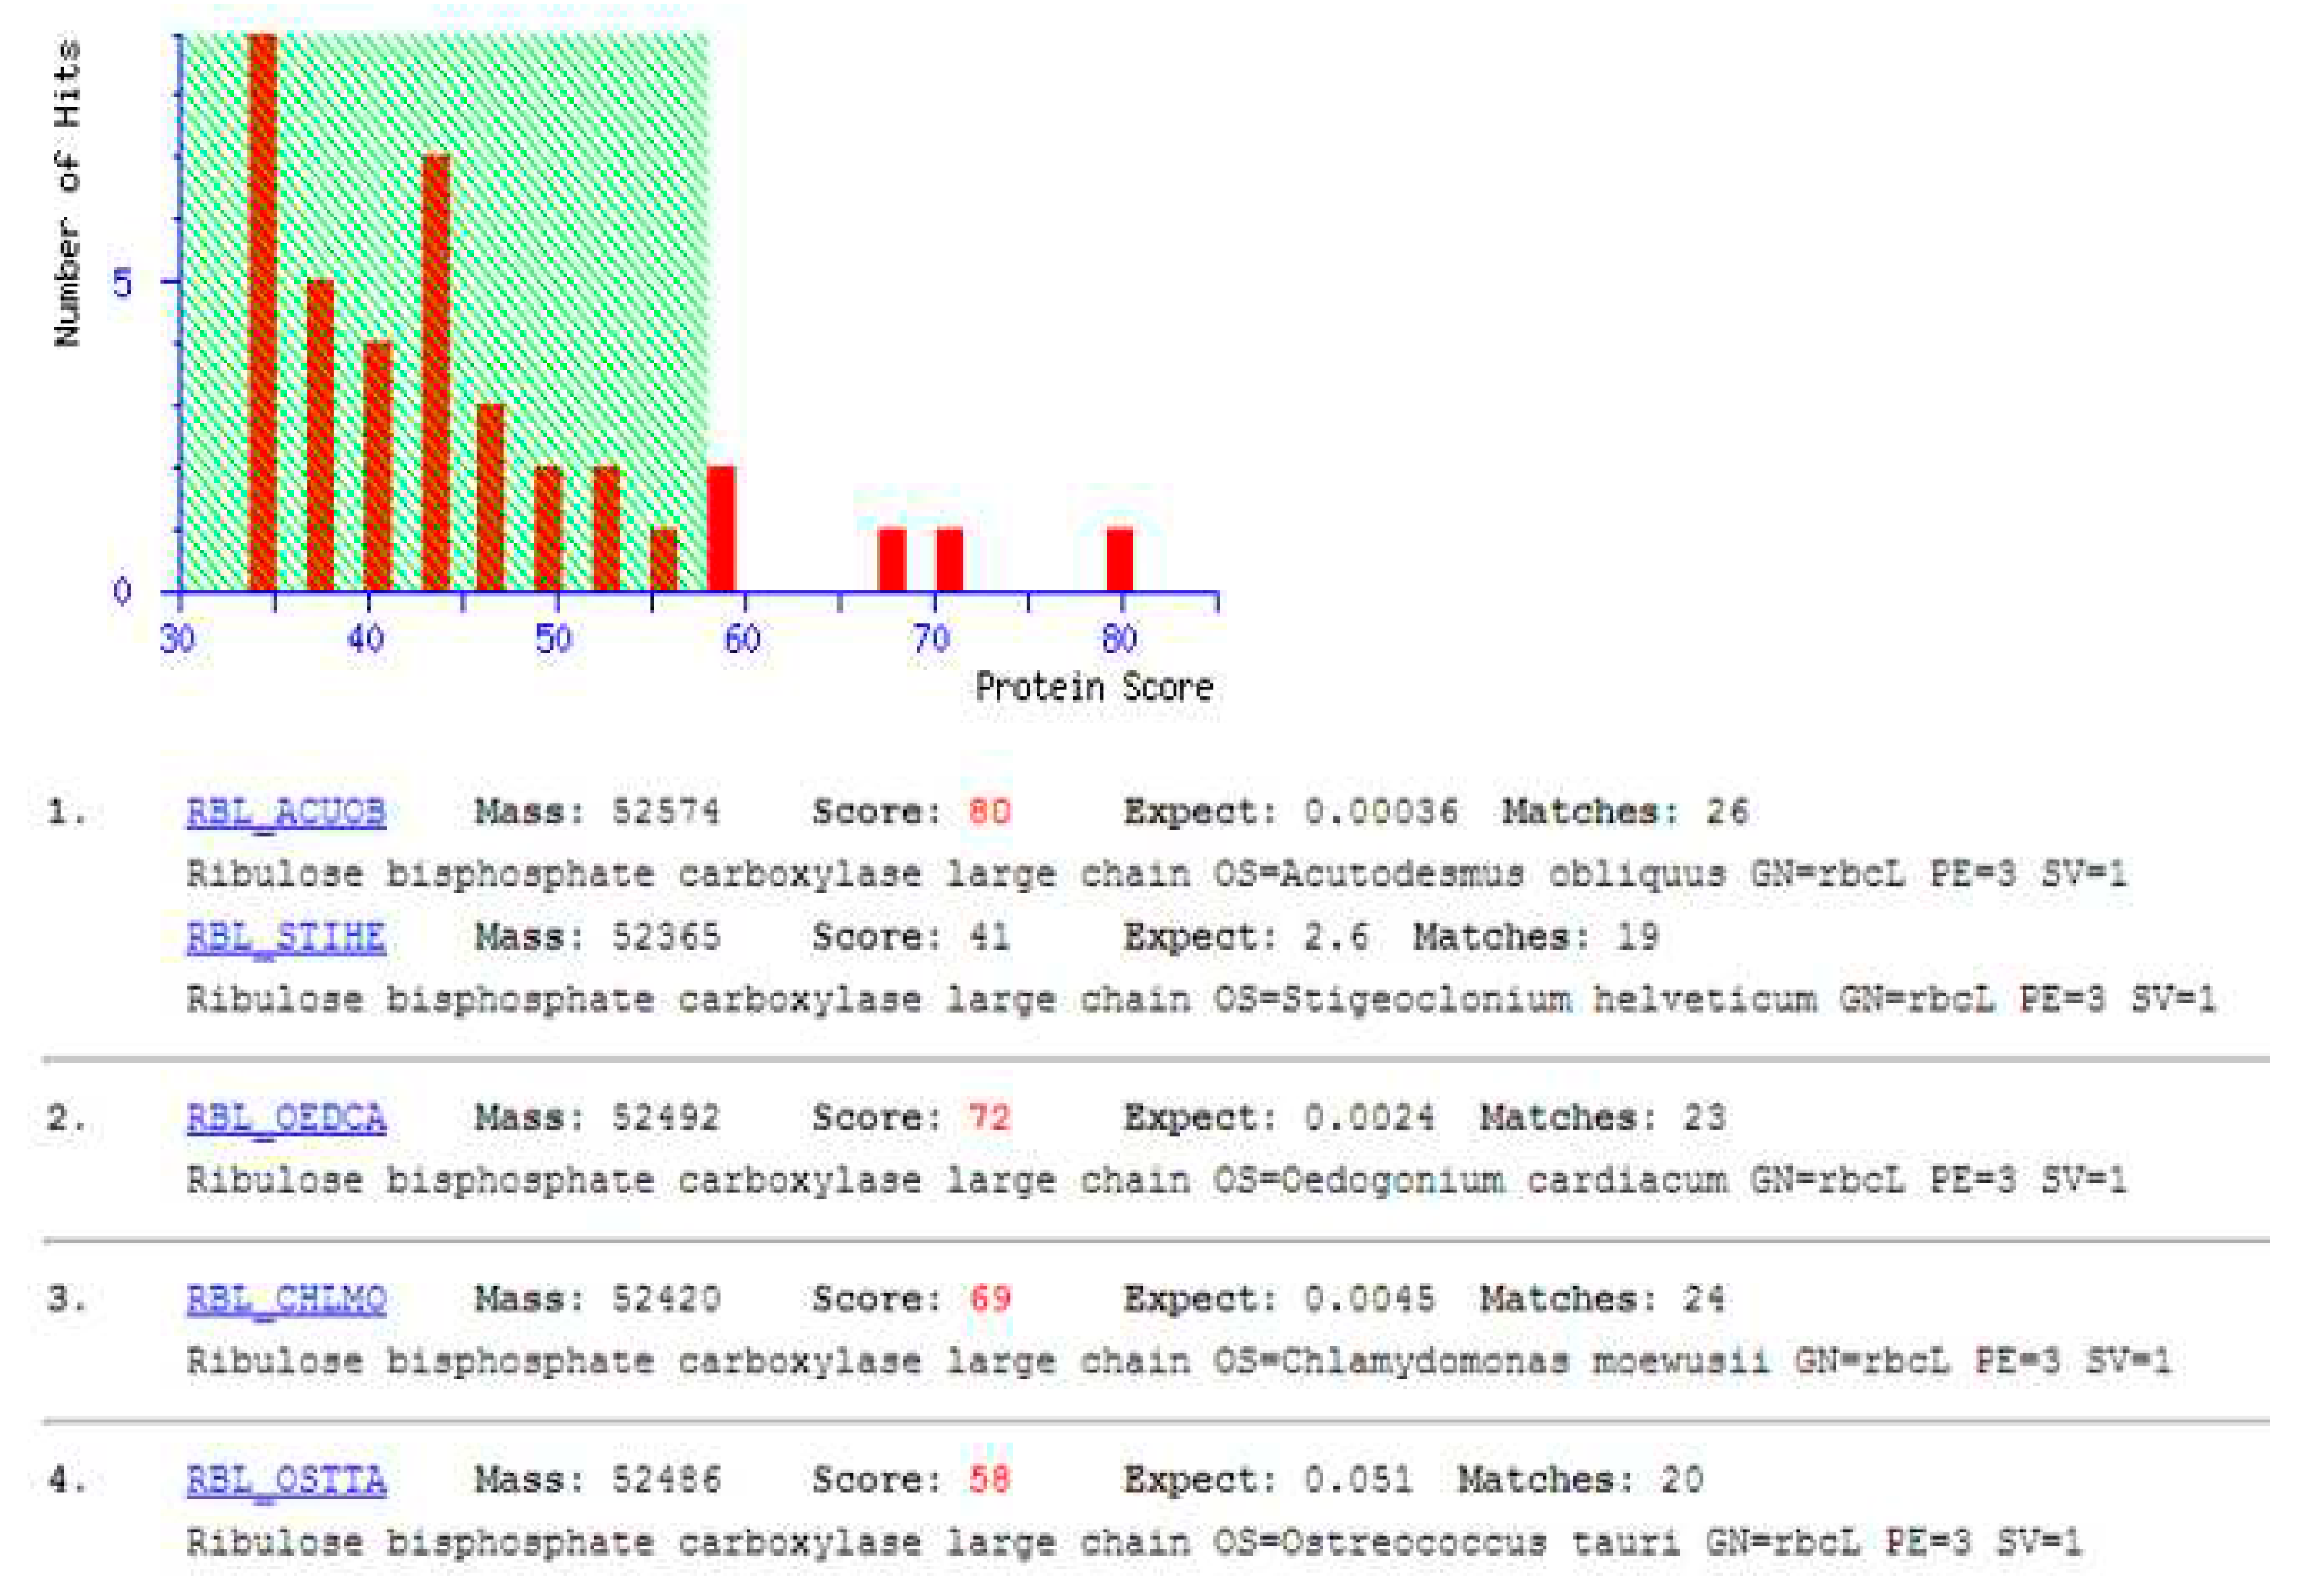
Figure 4.
Optical microscopy images of ruptured T. obliquus cells at 100X magnification. (A) Control sample (reference: without application of treatment for cell disruption). The samples were treated with (B) a ball mill (BM), (C) high-pressure homogenization (HPH), and (D) ultrasound (US). Intact cells appeared green and/or magenta, while dead or damaged cells were stained red.
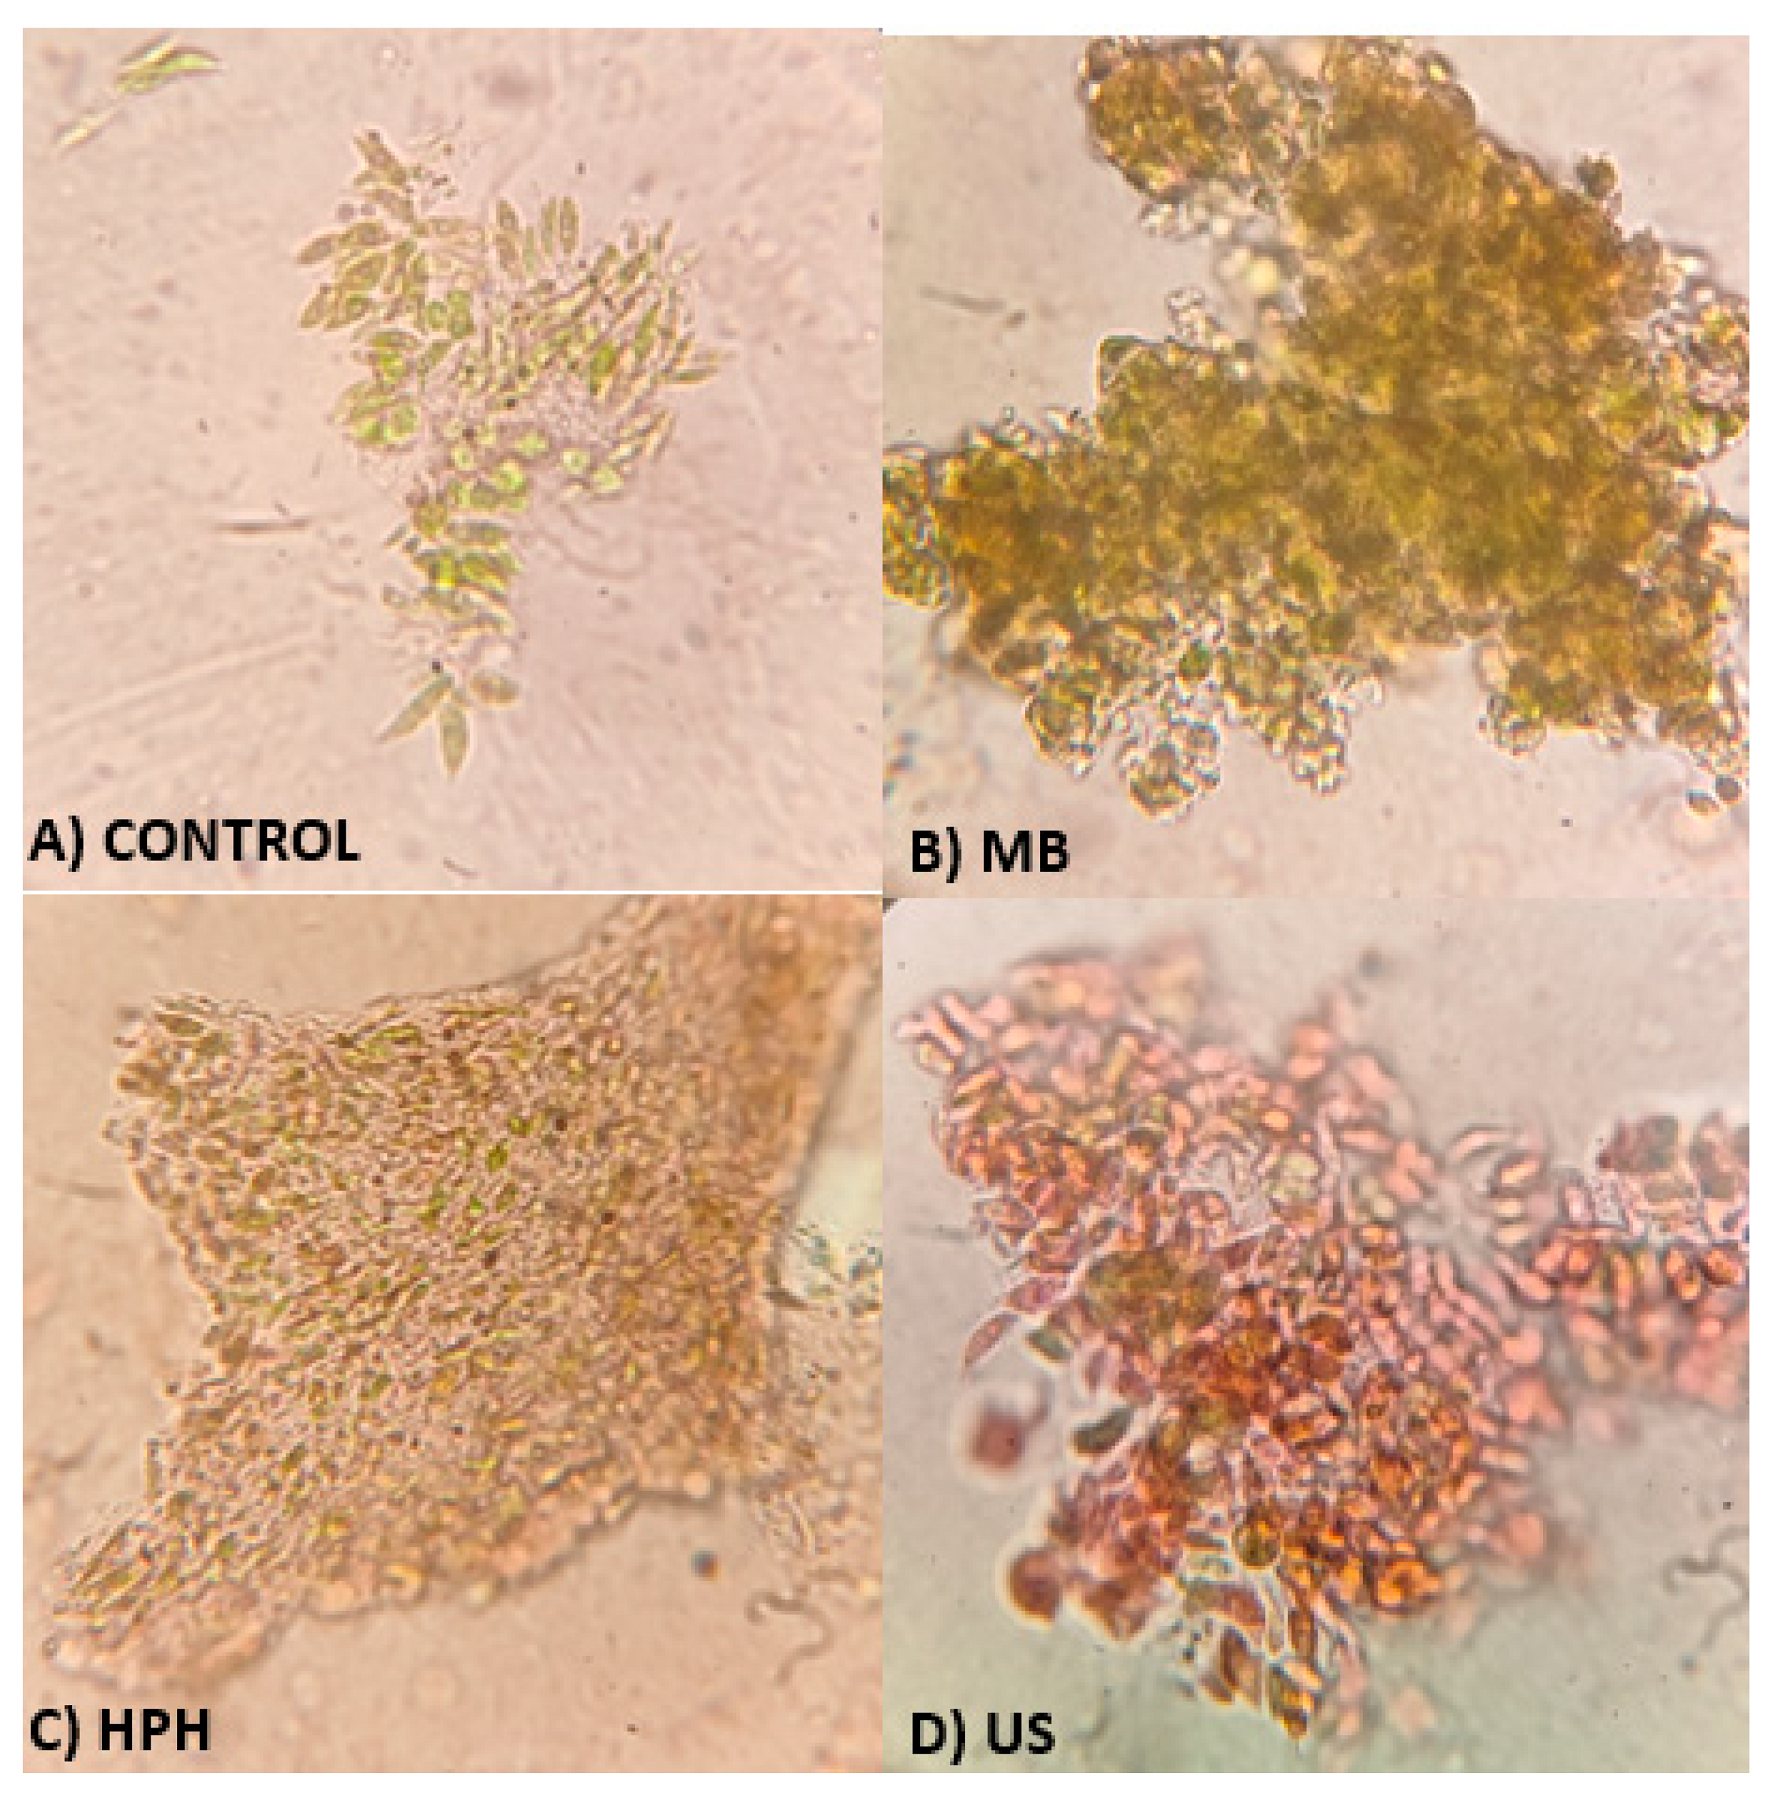
Figure 5.
Protein amount recovered (Equation (3)) after T. obliquus cell breaking as a percentage of the total protein content. Disruption treatments of biomass: ball mill (BM), high-pressure homogenization (HPH), and ultrasound (US). Different letters indicate a significant difference (p < 0.05). Capital letters indicate differences among cell disruption treatments in the same extraction step. Lowercase letters indicate the difference between each extraction step and the total extraction for the same cell disruption treatment. The results are expressed as the mean, and bars indicate the standard deviation (n = 3).
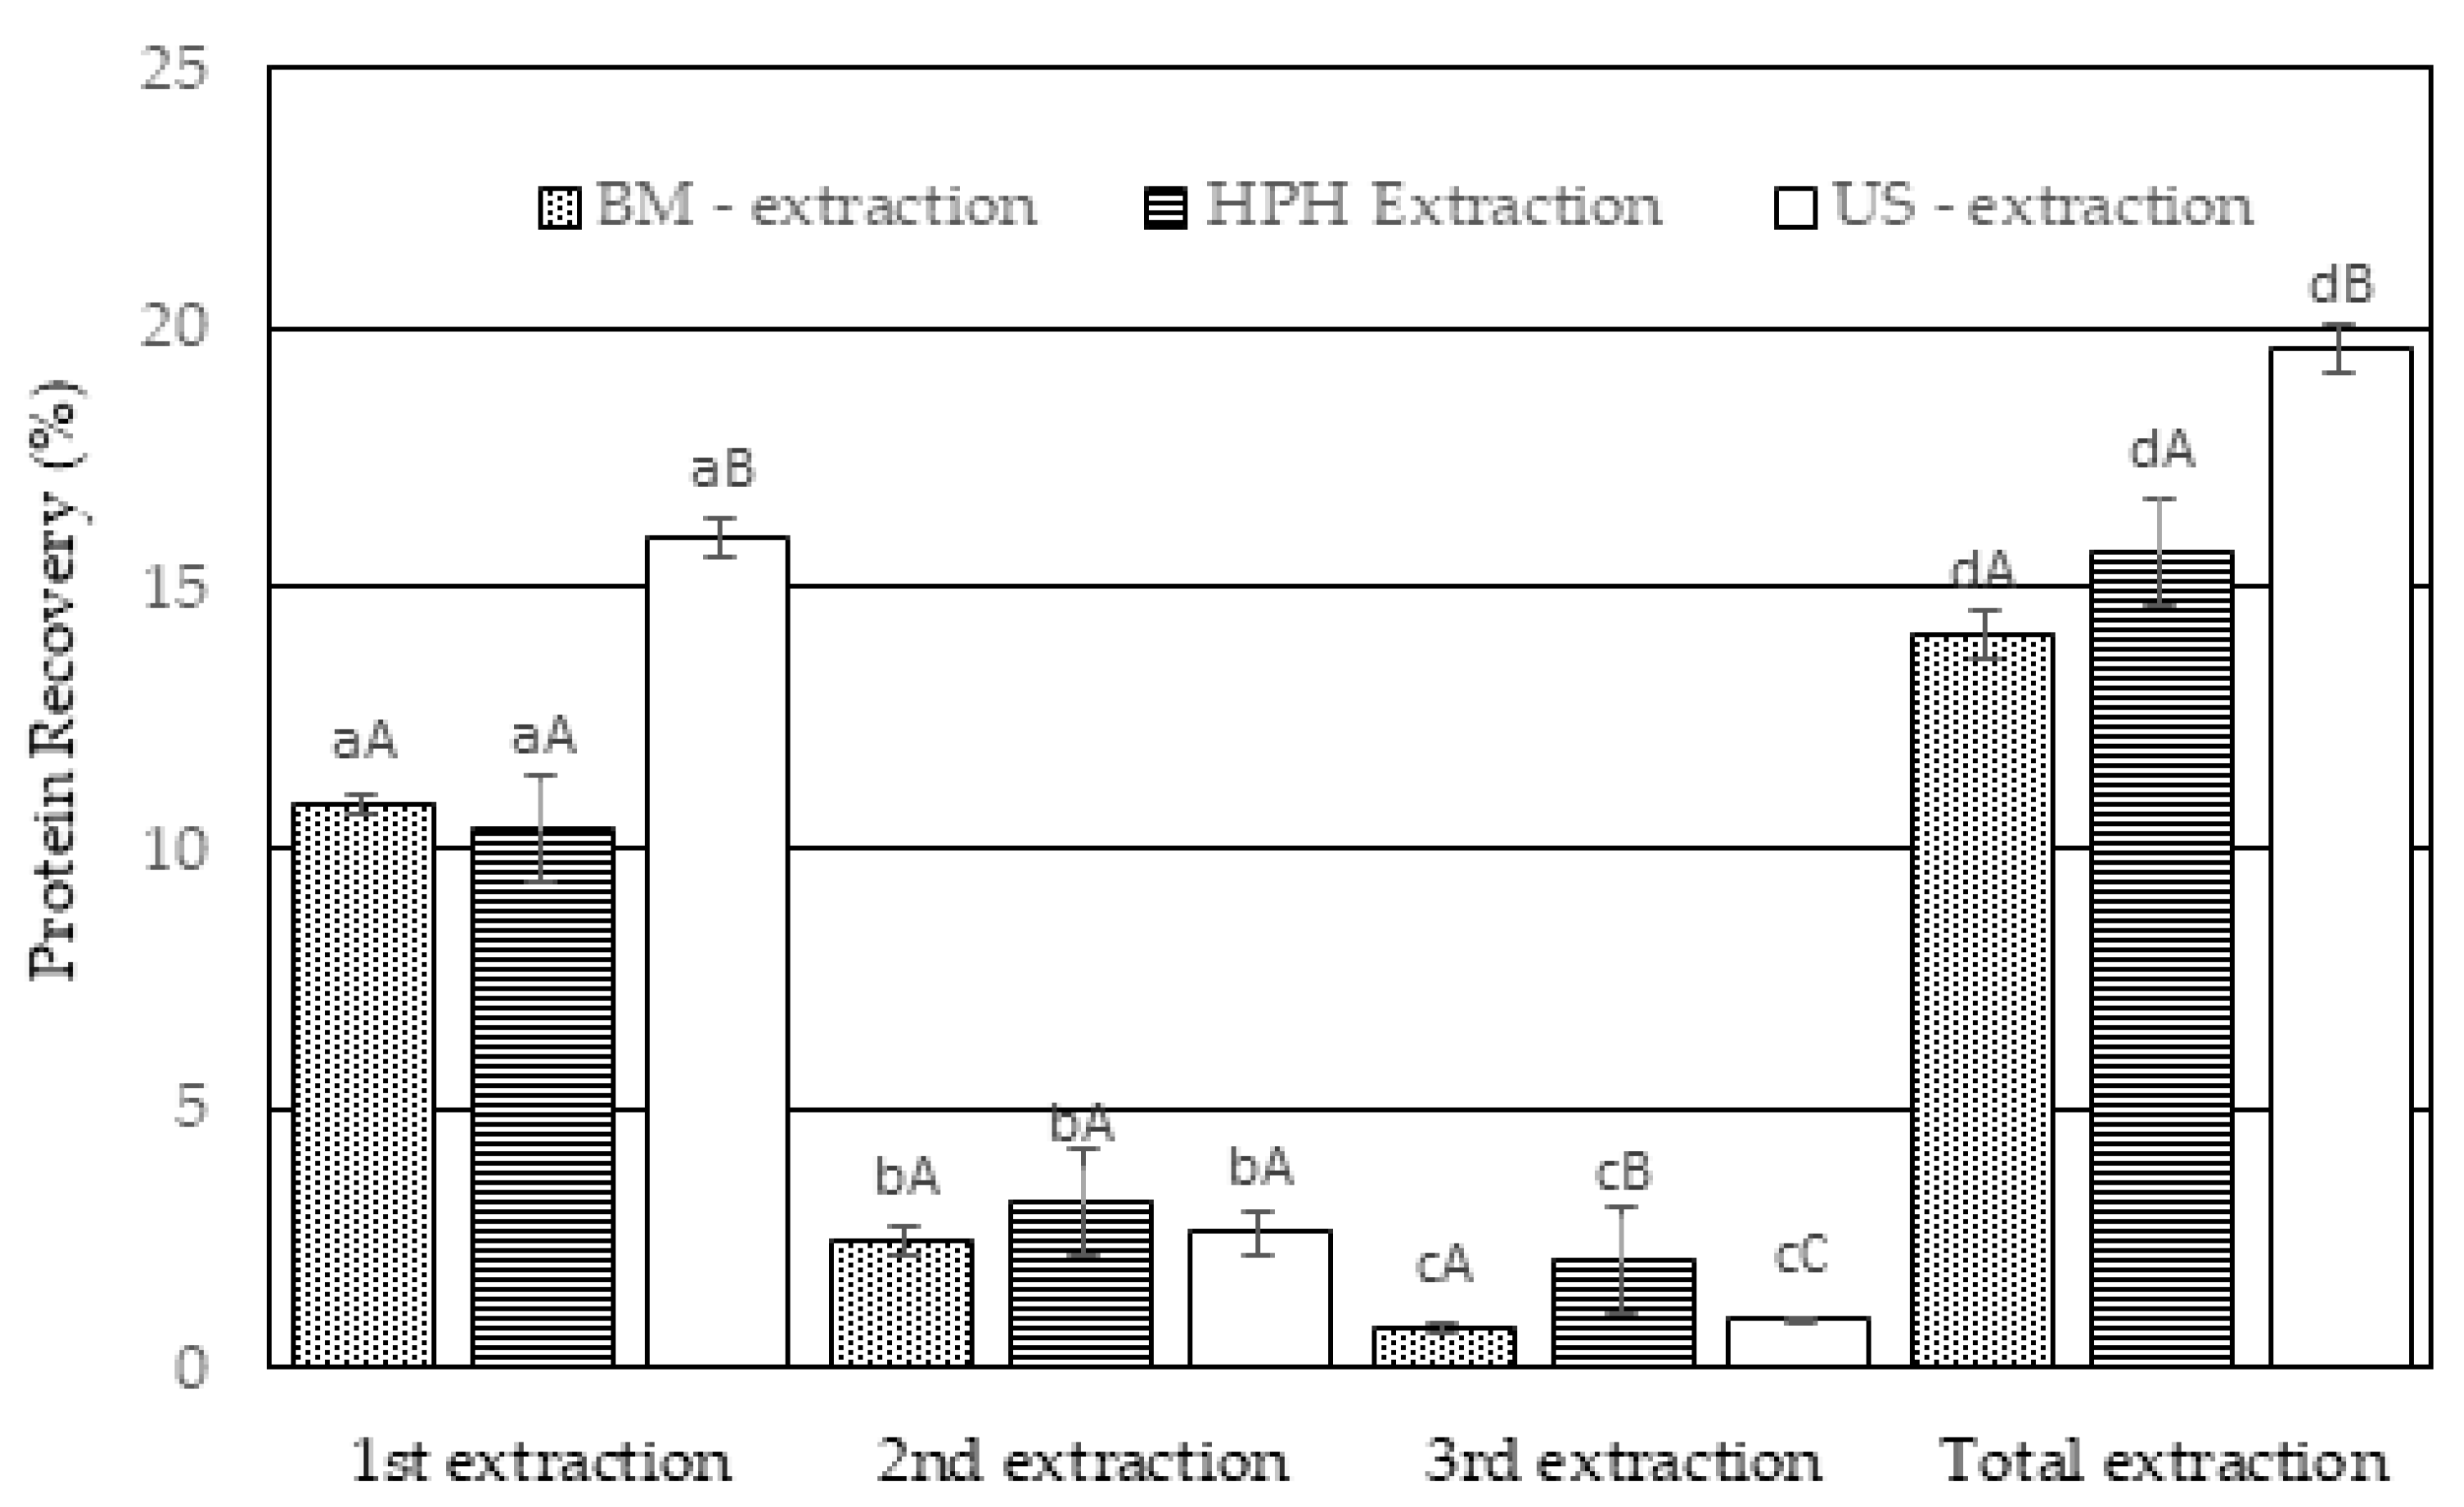
Figure 6.
Scanning electron micrographs for protein extracts obtained by mechanical disruption by ball mill (BM) treatments with magnifications of 200× (A) and 1000× (D); high-pressure homogenization (HPH) with magnifications of 200× (B) and 1000× (E); ultrasound (US) with magnifications of 200× (C) and 1000× (F).
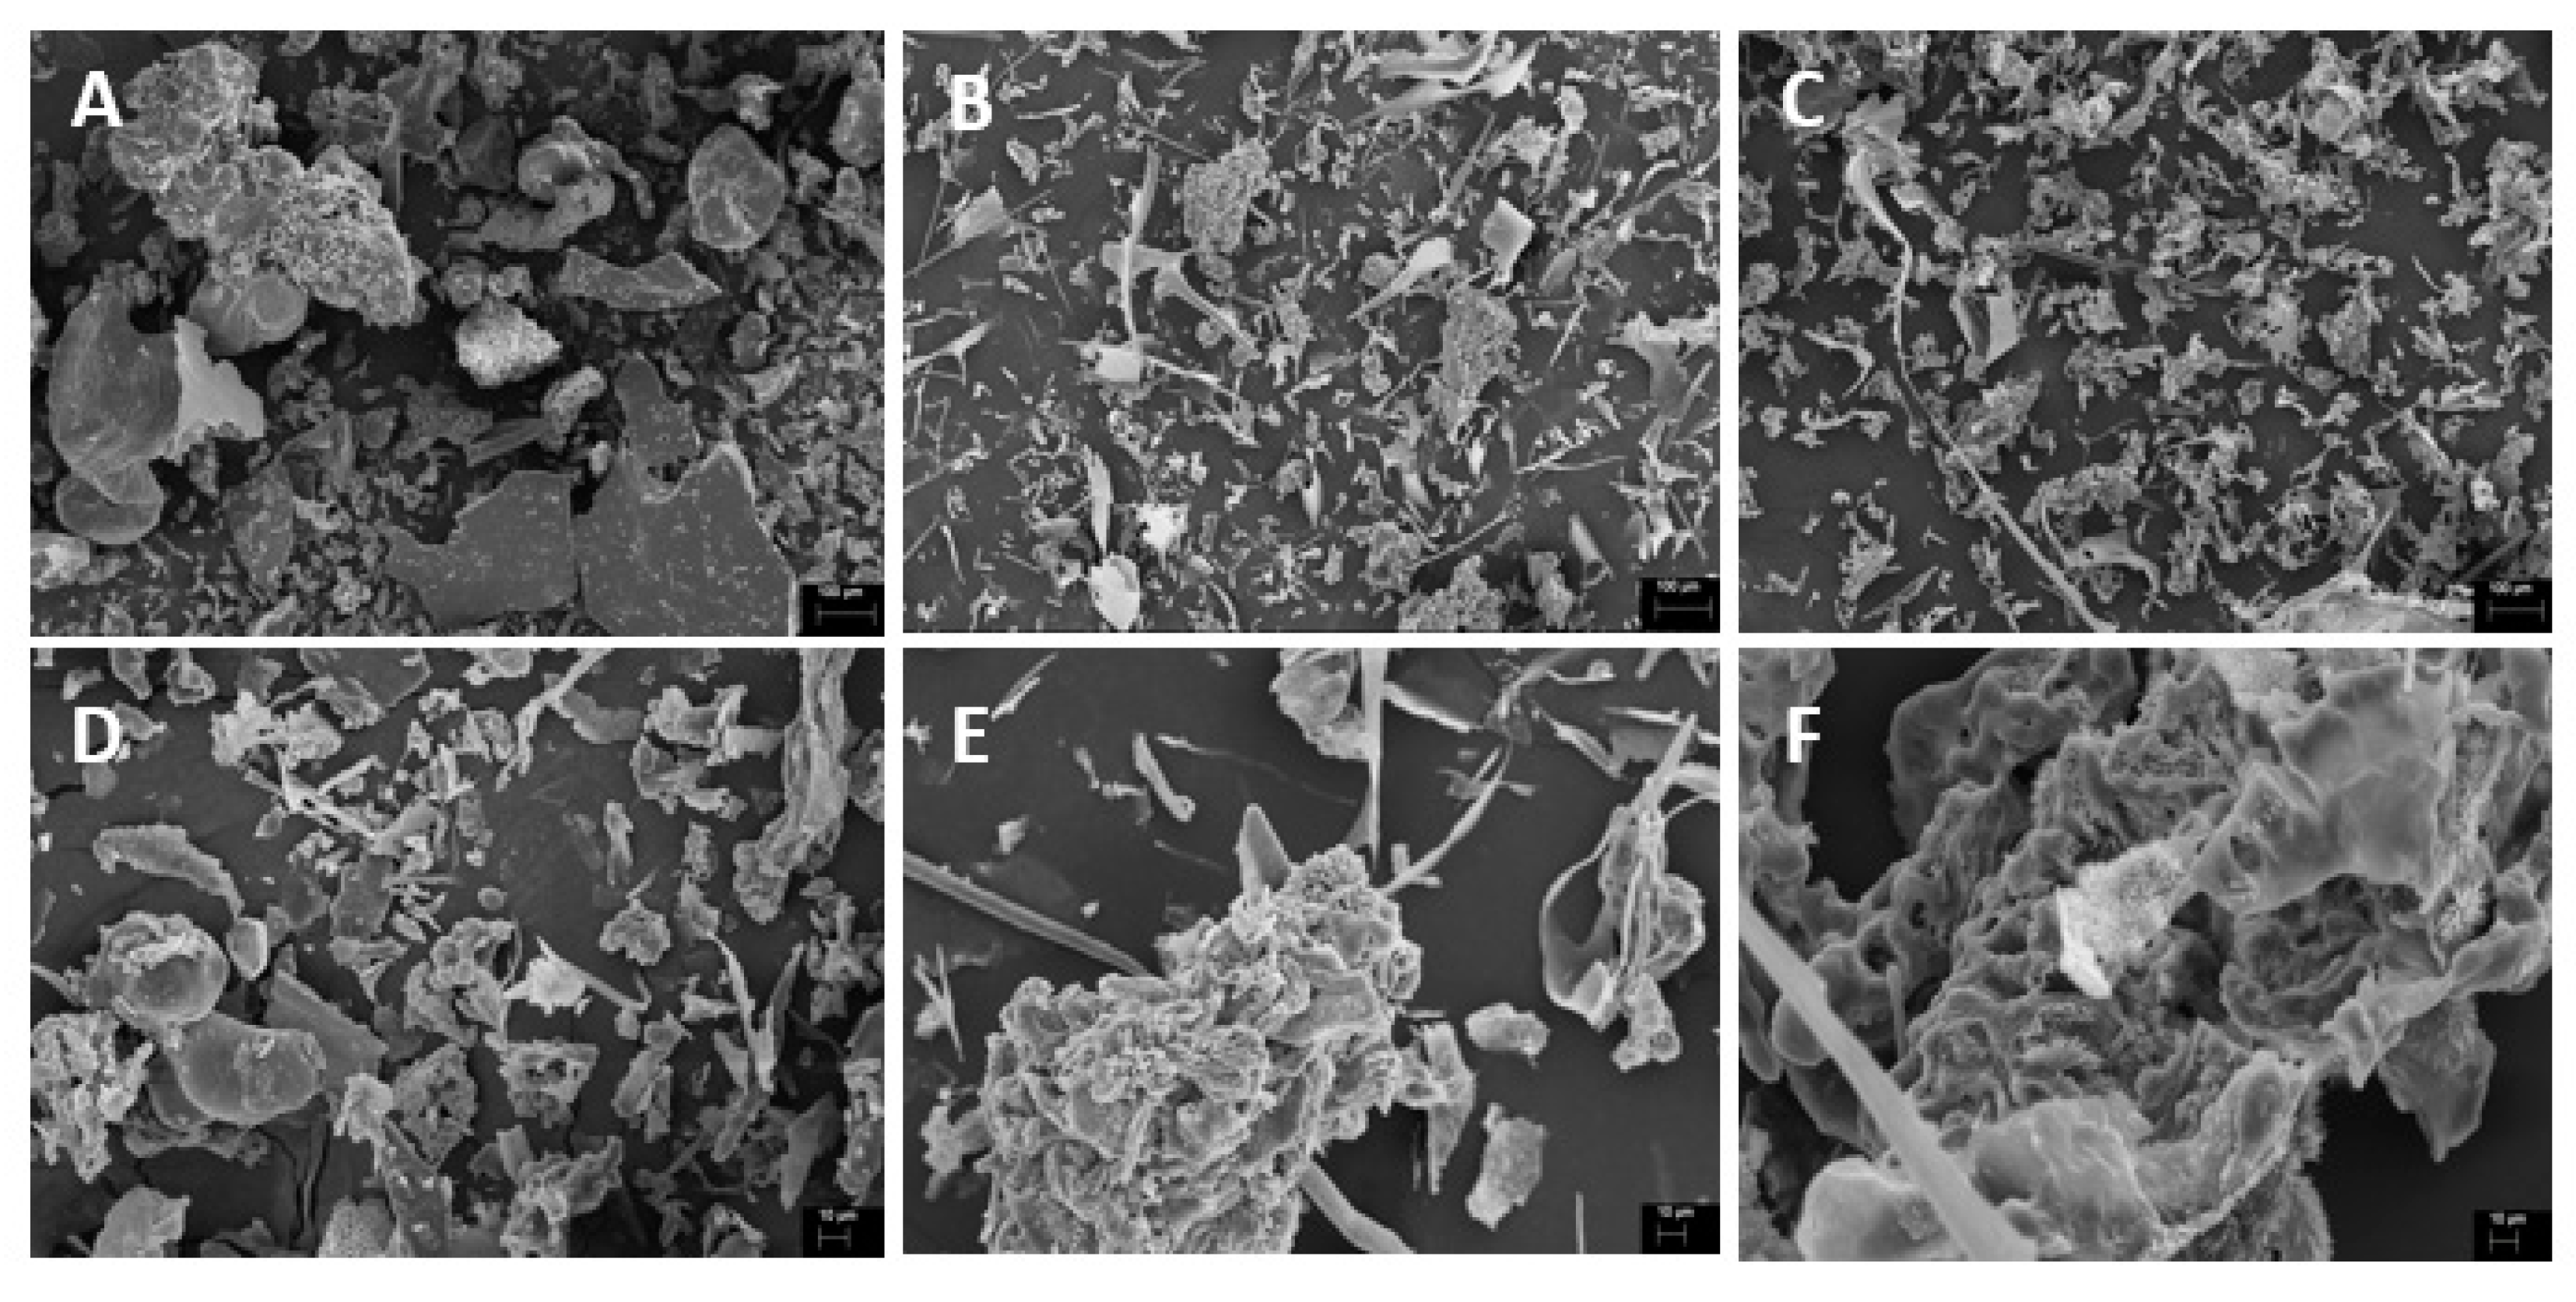

Table 1.
Protein mass yield % (g of protein of powder extract/100 g of dried microalgae), % protein of extracts (g of protein of powder extract/100 g of extract), color parameters for protein extracts: L* denotes lightness and ranges from 0 (black) and 100 (white), a(+) red, a(-) green, b(+) yellow, and b(-) blue; and visual appearance.
| Characteristics | Ball mill | High-pressurehomogenization | Ultrasound |
| Protein mass yield (g/100 g) | 16.1 ± 1.3a | 17.1 ± 1.4b | 20.8 ± 0.8a |
| % Protein content (g/100 g) | 29.7 ± 1.2a | 29.1 ± 0.6a | 30.7 ± 0.4b |
| L* | 46.4 ± 0.46a | 52.0 ± 0.76c | 46.1 ± 0.26a |
| A | 4.73 ± 0.11a | 5.53 ± 0.17c | 4.98 ± 0.096b |
| B | 13.6 ± 0.40a | 17.6 ± 0.30c | 11.8 ± 0.29b |
| Visual appearance | 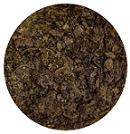 |
 |
 |
Means followed by the same letters in the same line do not differ according to the Tukey test at 5% probability.
Disclaimer/Publisher’s Note: The statements, opinions and data contained in all publications are solely those of the individual author(s) and contributor(s) and not of MDPI and/or the editor(s). MDPI and/or the editor(s) disclaim responsibility for any injury to people or property resulting from any ideas, methods, instructions or products referred to in the content. |
© 2023 by the authors. Licensee MDPI, Basel, Switzerland. This article is an open access article distributed under the terms and conditions of the Creative Commons Attribution (CC BY) license (https://creativecommons.org/licenses/by/4.0/).
Copyright: This open access article is published under a Creative Commons CC BY 4.0 license, which permit the free download, distribution, and reuse, provided that the author and preprint are cited in any reuse.


