Submitted:
06 October 2023
Posted:
07 October 2023
You are already at the latest version
Abstract
Plants of the golden Camellia group are not only high-quality camellia germplasm , but also a plant group with rich medicinal and nutritional value, which are used as food, cosmetics and traditional medicine in China. There are approximately 50 species in this group around the world, and more than 30 species of golden camelliaplants have been published in China. The leaves and flowers of these species have similar shapes, so they are often confused as species. Our study used simplified genome sequencing technology to construct a phylogenetic tree of plants in the Chinese golden Camellia group and describe the evolutionary relationships . At the same time, the secondary metabolic indexes of total phenols, total flavonoids, total anthocyanins and ellagic acid in the leaves were determined., and principal component clustering analysis was performed . The results showed that the chemical classification and genetic phylogenetic trees showed some of the same trends, indicating that Camellia chinensis can be used as Biomarkers for chemical type. The research results provide phylogenetic information for the genotype and performance diversity of golden camelliaregionally distributed in China. At the same time, molecular biology phylogenetic methods are used to understand or explain the characteristics of secondary metabolites of golden Camellia , and provide theoretical basis for the search and development of potential bioactive substances.
Keywords:
Camellia Sect.chrysantha
; dd-RAD
; chemotaxonomy
; TPC
; TFC
; TEC
; TEA
1. Introduction
The Camellia Sect.chrysantha is a group with yellow flowers in the genus Camellia of the family Theaceae. Its precious and rare yellow gene fills the gap in the yellow camellia coveted by horticulturists. It has essential ornamental value and scientific research value. It is known as the "Queen of the Tea Clan", "Giant Panda of the Plant World" and "Fantasy Yellow Flower Tea", It is also called "Oriental Magic Tea" abroad [1,2,3]. Since the discovery of golden camellia, it has been widely used in the hybrid breeding of yellow camellia and experimental research on cultivating excellent new varieties of hybrid camellia. Chinese experts and scholars have developed new varieties "Liaoyan Beauty", "Nayue Hongyan", "Xinhuang" and " "Jinbei Danxin" etc. [4,5]; Japanese horticulturalists have cultivated new varieties such as "しょこう", "きんぼし", and "きみこ" et al. [6,7], which has greatly enriched the new tea variety market. Golden Camellia is not only a high-quality camellia germplasm resource, but also a natural tea drink. It is one of the plants with the richest medicinal and nutritional value. The leaves and flowers of Golden Camellia are not only rich in active ingredients such as polyphenols, flavonoids, saponins and polysaccharides, but also rich in trace elements such as iron, selenium, copper, zinc, vanadium, natural organic germanium and other important health care effects on the human body [8,9,10]. "Guangxi Zhuang Autonomous Region Zhuang Medicine Quality Standards" (Volume 2) records: That golden camellia is slightly bitter and astringent, and has the functions of clearing away heat and detoxification, diuresis and swelling, lowering blood sugar, lowering cholesterol, preventing tumors, and anti-aging [11,12]. In 2010, the Ministry of Health approved Golden Camellia as a new resource of food, and it has been widely developed into scented tea, drinks, medicines, cosmetics, handicrafts, etc., and its products are sold well in domestic and foreign markets [13].
Golden camellia has won the research attention of scholars from all walks of life at home and abroad because of its unique golden petals and rich medicinal value. However, there are many varieties of Sect.Chrysantha, with different sources and large differences in quality, which is one of the main factors restricting the development of the industry [2]. Sect.Chrysantha plants are mainly distributed in southwestern my country and northern Vietnam, and are divided into two major ecological distributions: Karst and Non-Karst [14]; There are more than 50 species of this group in the world, and more than 30 species of golden Camellia plants have been published in my country. Still, this group is in There has been a long-standing controversy over classification [15]. The determination of species in traditional taxonomy is mainly based on the morphological characteristics of plants, such as stems, leaves, flowers, fruits, etc., which have the advantages of simplicity, convenience, and intuitiveness. However, because environmental conditions easily affect morphological characteristics, they cannot be used for identification. The morphological characteristics of the species are very minimal, and these characters are only suitable for the identifying samples with apparent differences between varieties. The flowers and leaves of the Sect.Chrysantha are very similar, and the identification between species often needs clarification; therefore, sometimes it leads to uncertainty or Incorrect taxonomy.
Modern molecular techniques provide powerful tools for solving taxonomic problems in plant groups, especially in describing individual species. Many researchers have carried out many genetic and taxonomic studies on golden Camellia plants using molecular markers such as RAPD, AFLP, SSR, ISSR, cpDNA, nDNA and so on. Shaoqing Tang used RAPD technology to analyze six 2-variant golden Camellia plants including Camellia nitidissima、Camellia nitidissima var.microcurpa and Camellia tunghinensis et al, C.pubipetala was merged into Camellia nitidissima var.microcurpa; Camellia nitidissima var. phaeopubisperma was incorporated into Camellia nitidissima [16]. Amplified fragment length polymorphism (AFLP) molecular markers were also used for cluster analysis, and it was concluded that Camellia huana is a good species; Camellia ptilosperma 、Camellia longruiensis, Camellia longgangensis, Camellia longgangensis var.grandis were merged into Camellia flavida [17]. Zheng Xiao used ISSR molecular marker technology to analyze the genetic relationships of 29 golden Camellia species from the Golden Camellia Park in Nanning, Guangxi, and clustered the 29 golden Camellia samples into three major groups. Among them, the Camellia achrysantha was in a separate category, and the Camellia terminalis and Camellia longzhouensis are grouped into one category, and other golden scented teas are grouped into one category; Camellia xiashiensis and Camellia micrantha are merged into Camellia limonia; Camellia longgangensis and Camellia ptilosperma are merged into the same species; Camellia longzhouensis is merged into one category; Camellia chrysanthoides are classified as separate species [18]. Hailing Chen used SSR molecular markers to conduct research on the genetic diversity and genetic structure of Camellia chrysanthoides and its related species [19]. Xuelin Lu used Chloroplast and nuclear DNA molecular techniques to analyze the phylogeography and conservation genetics of camellia (Theaceae) in southern Guangxi, China [20]. Su-JuanWei used phylogenetics to calculate the taxonomic information of yellow camellia plants in the Camellia family in China, and found that the phylogeny of dd-RAD, RNA-sep and Chloroplast Genome in the genus Camellia in China was inconsistent, and some developmental trees were not separated or had differences, making it difficult to distinguish, indicating that hybridization and introgression affect the inconsistency between nuclear genes and organelle genes of the genus Yellow Camellia [21]. In summary, some researchers have tried to analyze and study the relationships between plants in the Camellia Scet.chrysantha using single molecular markers or incomplete sampling. However, there is still a lack of morphological and molecular plant phylogeny of the Camellia Scet.chrysantha in China. consensus.
The Camellia Scet.chrysantha plant are mainly distributed in karst landforms, which have a high degree of habitat heterogeneity; they have a great impact on the evolution of Golden Camellia plants [14]. Species migrate from one area to another. Changes in the natural environment cause different changes in plant leaf and flower shapes. Hybridization and penetration interfere with the division of plants. The phenotype of a plant is the sum of the traits displayed by plants under certain environmental conditions. It is the result of the interaction between genes and the environment. It is a manifestation of plant adaptation to environmental variation and one of the main factors affecting plant survival. It reflects to a certain extent the genetic characteristics of the species [22]. Therefore, the development of molecular biology and chemical taxonomy may provide a comprehensive solution for the accurate identification and definition of these golden camellias. Chemotaxonomy, the practice of classifying plants based on their chemical composition; secondary metabolites and related biosynthetic pathways are often specialized and common in similar taxa, making them useful in taxonomic definition. In fact, as recommended by the Plant Working Group of the Consortium for the Barcode of Life (CBOL), plant barcodes of life have been used to provide information related to the taxonomic classification and phylogeny of closely related and distantly related plant species, for the detection and utilizati on of biodiversity, species identification and other aspects are of great significance [23].
Therefore, based on the above reasons, this study uses the combination of molecular biology + chemical taxonomy to carry out research on the newly emerging frontier field of evolutionary biology at the intersection of phytochemistry, plant taxonomy and plant systematics. Reduced-Representation Genome Sequencing (RRGS) technology was used to develop SNP and InDel markers to construct a plant phylogenetic tree of the Chinese golden Camellia group; at the same time, spectrophotometry and chromatography were used to determine the total phenolics and total phenolics of the golden Camellia group plants. For the determination of secondary metabolism indicators such as flavonoids, total anthocyanins and ellagic acid, principal component clustering analysis was performed based on the similarities and differences in plant secondary metabolite profiles. The research aims to provide phylogenetic information for the genotype and performance diversity of golden Camellia distributed regionally in China. It uses a combination of molecular markers and chemical classification to provide the most accurate classification of golden Camellia plants; at the same time, it uses the method of molecular biology phylogeny. To understand or explain the characteristics of secondary metabolites of plants in the Camellia Scet.chrysantha, or use the phylogenetic tree of species to explore the evolution rules of phytochemical characteristics of Camellia Scet.chrysantha, which can be used for the selection of yellow tea varieties and the identification of specific secondary metabolites. Provide theoretical basis for the search and development of potential bioactive substances.
2. Materials and Methods
2.1. Genetic Part
2.1.1. Test Materials
The test samples were collected from the golden camellia germplasm resource bank of Guangxi Institute of Botany (Table 1), and the sample species were identified by researcher Wei Xiao of Guangxi Institute of Botany. Collect a total of 90 samples from 30 species of golden camelliaplants (3 samples for each species). Collect 2-3 healthy and young fresh leaves from each plant, put them into tea bags and number them, and put them into tea bags. Stored in a sealed bag of color-changing silica gel in a dry state for use in dd-RAD sequencing.

Table 3.
Sample collection information and origin place.
| Nm. | Scientific Name | Code | Place of Origin | Habitat In Situ |
|---|---|---|---|---|
| 1 | Camellia achrysantha | ZD | Guangxi | Karst |
| 2 | Camellia chrysanthoides | BY | Guangxi | Karst |
| 3 | Camellia debaoensis | DB | Guangxi | Karst |
| 4 | Camellia euphlebia | XM | Guangxi | Non-Karst |
| 5 | Camellia fascicularis | YN | Yunnan | Karst |
| 6 | Camellia flavida | DH | Guangxi | Karst |
| 7 | Camellia huana | GZ | Guangxi | Karst |
| 8 | Camellia impressinervis | AM | Guangxi | Karst |
| 9 | Camellia libelofifilamenta | LR | Guangxi | Karst |
| 10 | Camellia limonia | NM | Guangxi | Karst |
| 11 | Camellia longgangensis | NG | Guangxi | Karst |
| 12 | Camellia longzhouensis | LZ | Guangxi | Karst |
| 13 | Camellia micrantha | XH | Guangxi | Karst |
| 14 | Camellia mingii | FN | Yunnan | Karst |
| 15 | Camellia multipetala | DD | Guangxi | Karst |
| 16 | Camellia multipetala var. patens | ZM | Guangxi | Karst |
| 17 | Camellia nitidissima | PT | Guangxi | Non-Karst |
| 18 | Camellia nitidissima var.microcurpa | XG | Guangxi | Karst |
| 19 | Camellia parvipetala | XB | Guangxi | Non-Karst |
| 20 | Camellia perpatua | SJ | Guangxi | Karst |
| 21 | Camellia pingguoensis | PG | Guangxi | Karst |
| 22 | Camellia pingguoensis var.terminalis | DS | Guangxi | Karst |
| 23 | Camellia ptilosperma | MZ | Guangxi | Karst |
| 24 | Camellia pubipetala | MB | Guangxi | Karst |
| 25 | Camellia quinqueloculosa | WS | Guangxi | Karst |
| 26 | Camellia rostrata | HG | Guangxi | Karst |
| 27 | Camellia tianeensis | TE | Guangxi | Karst |
| 28 | Camellia tunghinensis | DX | Guangxi | Non-Karst |
| 29 | Camellia wumingensis | WM | Guangxi | Karst |
| 30 | Camellia xiashiensis | XS | Guangxi | Karst |
2.1.2. DNA Extraction, Enzyme Digestion and Library Construction for Sequencing
Genomic DNA of 90 samples was extracted using a tissue DNA kit (OmegeBio-Tek, USA). DNA quality was assessed using 1% agarose gel electrophoresis and Nanodrop 2000 (ThermoFisher, USA) spectrophotometer. DNA was quantified using Qubit3.0 (ThermoFisher) to ensure that each sample met the following criteria: total mass value >3 μg, concentration >30ng/μl, and OD value of 260/OD value of 280=1.80–2.00. This study used dd-RAD technology to construct a RAD-seq library and performed paired-end 150 sequencing on the Illumina NovaSeq 6000 sequencing platform. The library construction and sequencing was entrusted to Beijing Biomarker Technologies Co., Ltd.
2.1.3. SNP Calling
The raw data (raw date) was obtained by sequencing on the Illumina NovaSeq 6000 platform, and FastQC software (https://www.bioinformatics.babraham.ac.uk/projects/fastqc/) was used to check the quality of the raw data to ensure that qualified raw data was obtained. Use the process_radtags program in Stacks v2.54 software to filter and correct the original data. Filter and delete reads with lower quality, containing adapter sequences, and N (unidentified bases) to obtain high-quality sequencing data (clean date). Use the populations module in Stacks software to filter and output SNP site information, according to the minimum allele frequency (MAF) of 0.05, the maximum missing rate (missing) of 0.5, and the maximum observed heterozygosity (maximum observed heterozygosity).) to a standard of 0.5 to filter SNP variant sites to remove samples with high mutation loss rates and abnormal ones; to obtain high-quality SNP data for subsequent research on genetic diversity and phylogenetic trees.
2.1.4. Genetics Analysis
Based on SNP, the population structure of the samples was analyzed through admixture software, and clustering was performed assuming that the number of clusters (K value) of the samples was 1-10. SPAGeDi software can be used to estimate the relative kinship between two individuals in a natural population. Using RAxML software, a phylogenetic tree of all samples was constructed based on the maximum likelihood method [24]. Use gcta software to perform PCA clustering on the samples, and combine the phylogenetic tree and genetic structure diagram obtained from the above analysis to view the stratification of the population. Use the vcf-tools program based on the sliding window method (the window is set to 3kb) to calculate the expected heterozygosity (He), nucleotide diversity (Nucleotide Diversity, Pi), and inbreeding coefficient (Inbreeding Coefficient of an Individual Relative to the Subpopulation, Fis), analysis of Shannon-Wiener diversity shannon_Index [25,26,27].
2.2. Chemical Profiling
2.2.1. Total Phenolic Content
The total phenols in the ground tea leaves of the golden camelliagroup were extracted with 70% methanol aqueous solution in a 70°C water bath. Folin's phenol reagent oxidized the -OH group in the tea polyphenols and showed blue color. The maximum absorption wavelength was 765 nm., using gallic acid as a calibration standard to quantify polyphenols [28,29]. Standard curve: y=0.0042x+0.0103, R2=0.9992.
2.2.2. Total Flavonoid Content
Flavonoids are a general term for a class of natural compounds with a benzopyran ring structure. This method utilizes flavonoids to perform a complex reaction with aluminum salts to generate a yellow complex under alkaline conditions, and its flavonoids are measured at a wavelength of 420 nm. Absorbance, within a certain concentration range, is directly proportional to the content of flavonoids. Compared with the rutin standard, the total flavonoid content in the test substance was determined [30,31]. Standard curve: y=0.0011x-0.0175, R2=0.9998.
2.2.3. Total Anthocyanin Content
Procyanidins themselves are colorless. Place them in an ampoule. Precisely add 6 mL of hydrochloric acid-n-butanol solution (4.2.1) and 0.2 mL of ferric ammonium sulfate solution (4.2.3). Mix well, seal it with sealing pliers, and place After heating in boiling water for 40 minutes, dark red anthocyanin ions can be generated. Use spectrophotometry to measure the anthocyanin ions generated during the hydrolysis of proanthocyanidins at a wavelength of 546 nm, and calculate the proanthocyanidin content in the sample [32,33]. Standard curve: y = 0.003x + 0.0076, R2 = 0.9995
2.2.4. Ellagic Acid Content
Accurately weigh 10g of fresh goldenrod tea leaves, add 100ml of deionized water, and beat with a high-speed tissue masher. Take 50ml of homogenate, add an equal volume of absolute ethanol, treat it in ultrasonic for 20 minutes, centrifuge at 10,000 rpm for 10 minutes, take the supernatant, add 50ml of 50% ethanol solution to the precipitate, repeat the above steps twice, and combine the supernatants, volume to 200ml. Filter with 0.45 μm filter membrane and store at 4°C for later use. Inject 20 μL of sample into a ZORBAX SB-C18 column (4.6 × 250 mm, 5 μm) using ethylbenzene-1.2% phosphoric acid (18:82) with a flow rate of 1 mL/min and a DAD lamp with a wavelength of 254 nm for detection [34,35]. Use the peak area on the standard curve to calculate the concentration of ellagic acid in the sample solution (1 μg/mL, 5 μg/mL, 10 μg/mL, 20 μg/mL, 50 μg/mL, 100 μg/mL).
2.2.5. Data Analysis
Each experiment was repeated three times, and Excel 2021 statistics were used; the data were compared with the means and standard errors of different variables using SPSS; the independent sample Duncan's t test was used, and the significance level was P<0.05. Use SPSS19.0 statistical software to perform cluster analysis [36,37]and construct a dendrogram; use origin2021 to create a principal component analysis graph [38].
3. Results and Discussion
3.1. SNP Calling Based on the Reference Genome
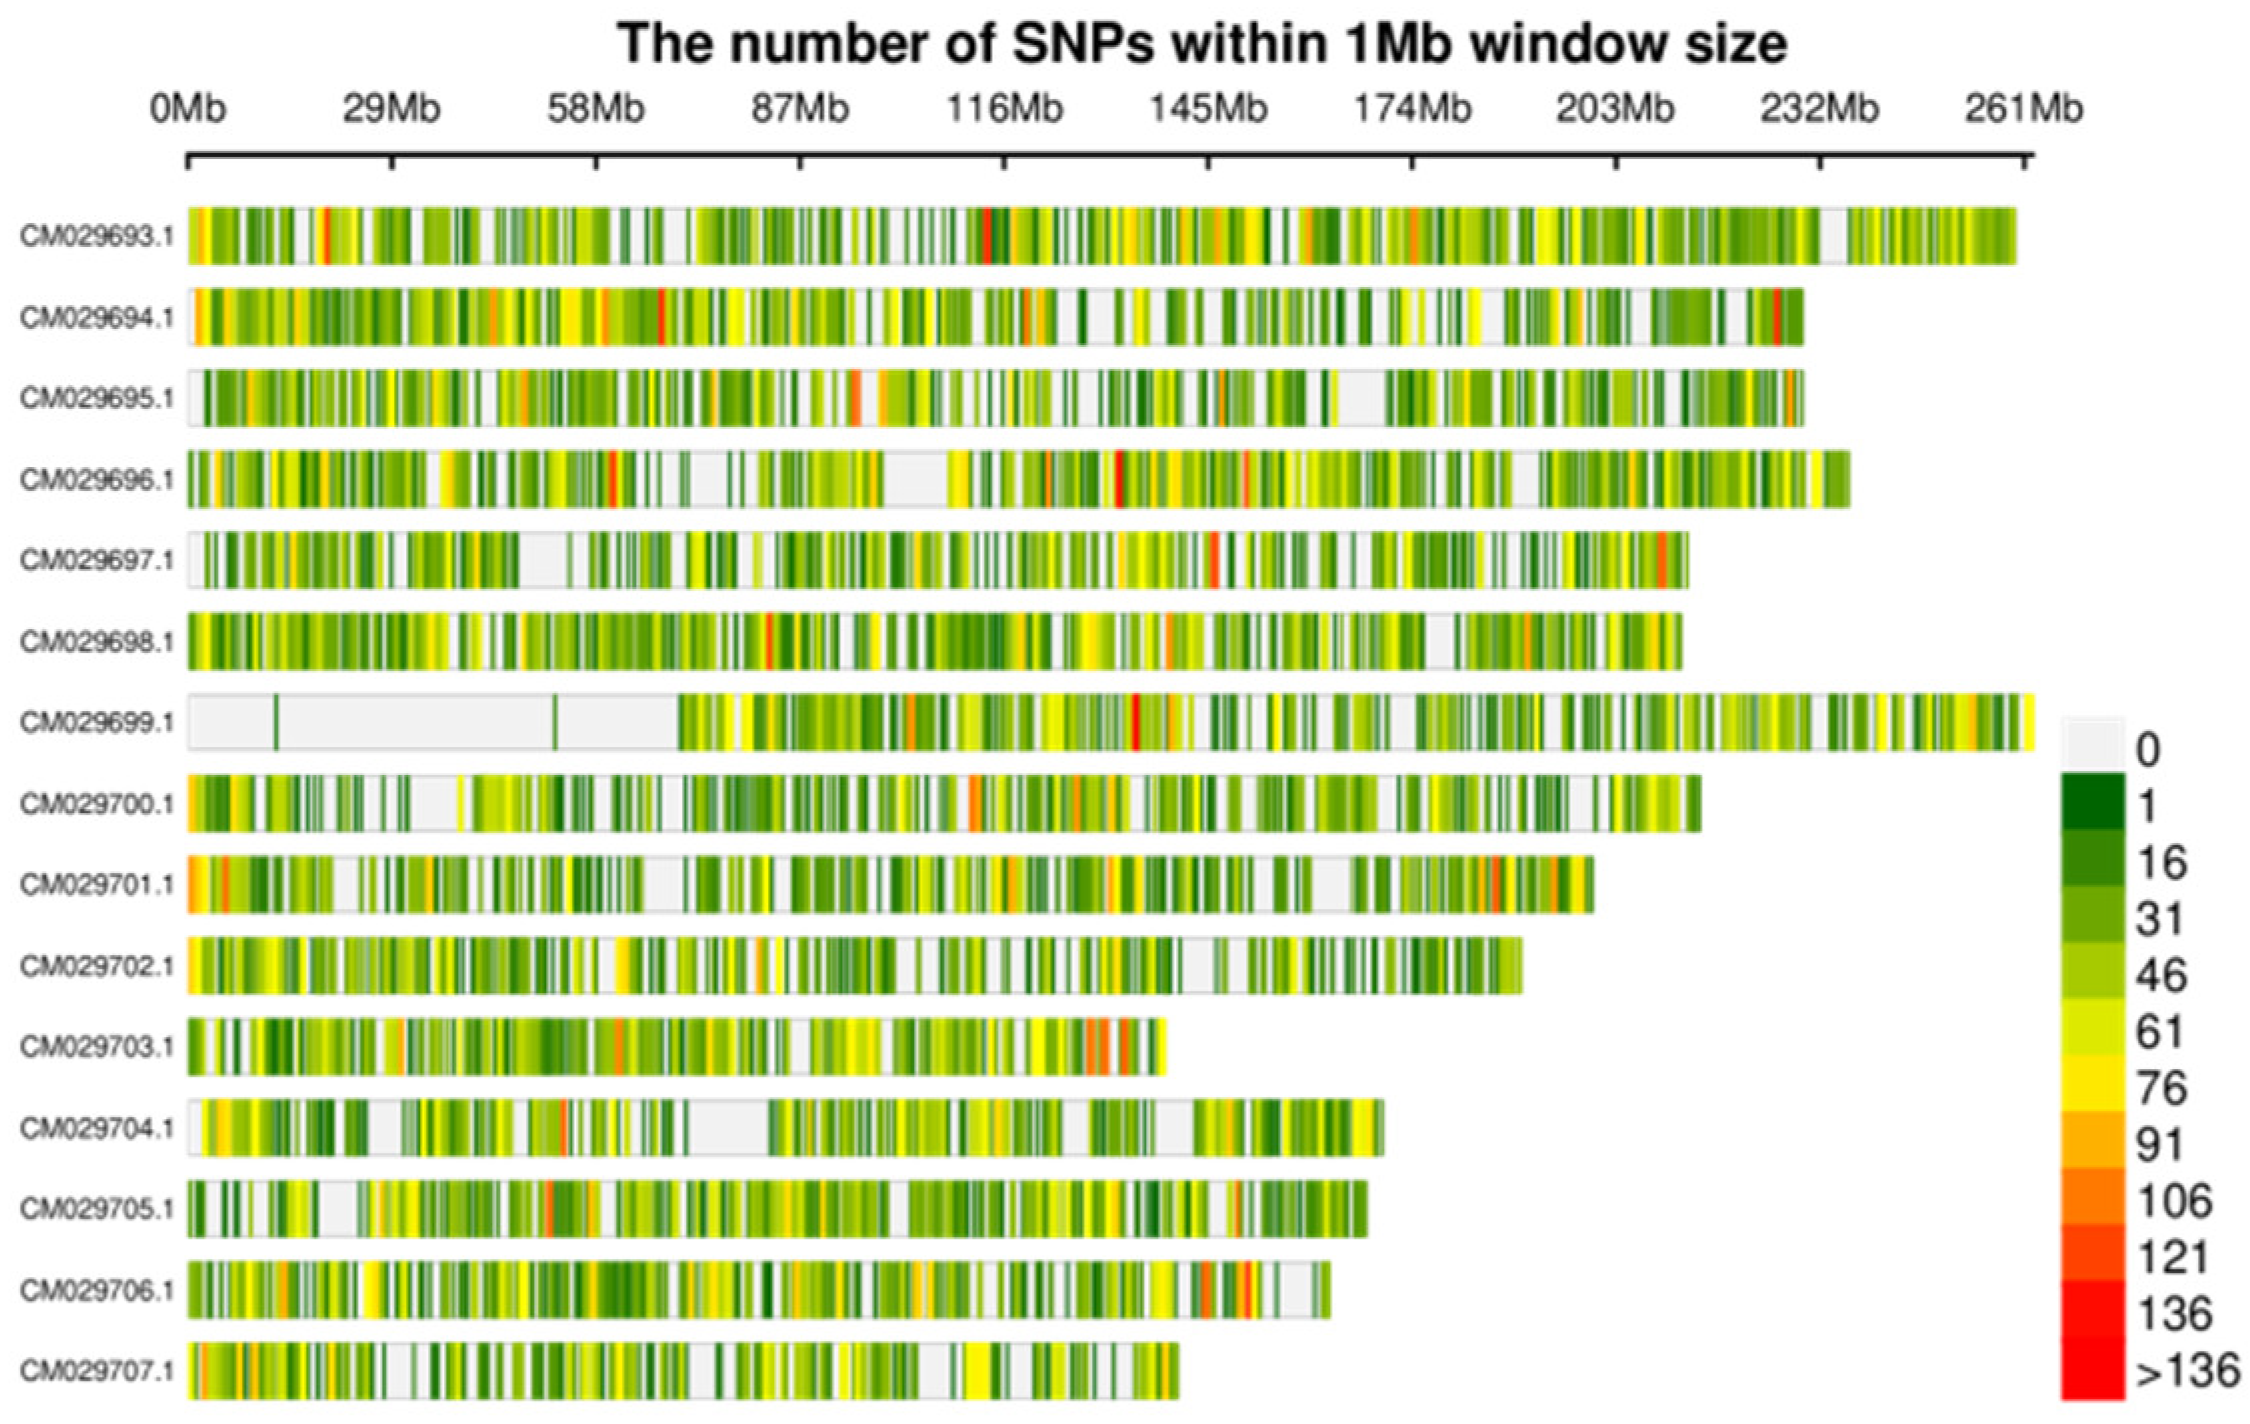
Completed library construction and sequencing of 90 samples (30 species), obtained an average of 200,000 tags per sample, and the average sequencing depth was no less than 10x, ensuring Q30 reached 80%. A total of approximately 564.31 Mbp Clean Reads and 141.78 Gbp Clean Data were obtained, with the Q30 average reaching 92.74%. Finally, we filtered and obtained 80,620 sites, including 75,548 SNPs and 5,072 InDels.
Figure 1.
The distribution of 75548 SNPs on the genome.
3.2. Genetic Relationship and Phylogenetic Analysis
Population genetic structure analysis can provide information on the origin and composition of an individual's lineage and is an important genetic relationship analysis tool. Based on SNP, the population structure of the samples was analyzed through admixture software [39], and clustering was performed assuming that the number of clusters (K value) of the samples was 1-10. And perform cross-validation on the clustering results, and determine the optimal number of clusters based on the valley value of the cross-validation error rate. The clustering situation with K value of 1-10 and the cross-validation error rate corresponding to each K value are shown in the figure below. The optimal K value of this project is 1, which means that there is only one ancestral lineage in all samples, that is, 30 Camellia species. All belong to the same ancestor. Kinship itself is a relative value that defines the genetic similarity between two specific materials and the genetic similarity between any materials. The SPAGeDi [40] software can be used to estimate the relative kinship between two individuals in a natural population. It can be seen from the Kinship clustering heat map 2a that Camellia debaoensis, Camellia mingii and Camellia fascicularis have high genetic similarity; the PCA of the three species also clustered together (Figure 2b). The genetic similarity between Camellia nitidissima and Camellia rostrata is high; the genetic distance between Camellia tianeensis and Camellia pingguoensis is similar; the genetic similarity between Camellia hauna and Camellia libelofilamenta ; the genetic similarity between Camellia wumingensis and Camellia terminalis higher, PCA also clusters together. Camellia parvipetala, Camellia micrantha and Camellia xiashiensis have high genetic similarity and are clustered together with Camellia limonia and Camellia multipetala. Camellia longzhouensis, Camellia longgangensis var. patens, Camellia perpetua and Camellia achrysantha have relatively high genetic degrees and are clustered together by PCA.
As can be seen from Figure 2c, based on the maximum likelihood method, a phylogenetic tree of all samples was constructed, which intuitively displays the classification of the samples. The phylogeny based on whole-genome data was well resolved, improving the level of resolution to species and within species, with at least 7 reticulation events in the plants of the Chinese Camellia Scet.chrysantha. In the nuclear-ddRAD tree, Camellia nitidissima, Camellia nitidissima var.microcurpa, Camellia euphlebia, Camellia tunghinensis, Camellia rostrata come together; Camellia limonia, Camellia xiashiensis, Camellia multipetala, Camellia parvipetala, Camellia micrantha come together; Camellia achrysantha, Camellia longzhouensis, Camellia multipetala var. Patens, Camellia perpatua, and Camellia quinqueloculosa are grouped together; Camellia debaoensis, Camellia fascicularis, Camellia mingii, Camellia pingguoensis var.terminalis and Camellia wumingensis; among them, Camellia debaoensis, Camellia fascicularis, and Camellia mingii are closely related. Camellia impressinervis, Camellia longgangensis, and Camellia ptilosperma are closely related and are grouped together. Camellia flavida, Camellia huana, Camellia libelofifilamenta, Camellia pingguoensis, Camellia tianeensis are grouped together. Camellia pubipetala and Camellia chrysanthoides with thin leaves are one branch.
The ddRAD technology was used to better classify the plants of the Camellia Scet.chrysantha; the research results are different from Wei's grouping of the golden Camellia group into 10 reticular events. Because the plants of the Camellia Scet.chrysantha are all diploid, the hybridization rate between species is relatively low. High, reproductive barriers are weak, and hybridization and introgression affect the nuclear gene results of Camellia Scet.chrysantha, so further verification is needed to accurately infer the grid time.Compared with the results of Wei's research, the species clustering results of the Camellia Scet.chrysantha are mostly consistent. Camellia nitidissima, Camellia tunghinensis, Camellia nitidissima var.microcurpa and Camellia euphlebia are clustered together, Camellia limonia, Camellia multipetala, Camellia parvipetala, Camellia micrantha are clustered together. clustered together with Camellia xiashiensis, Camellia pingguoensis var.terminalis and Camellia wumingensis are clustered together, Camellia hauna, Camellia libelofilamenta and Camellia pingguoensis clustered together; Camellia impressinervis, Camellia longgangensis, Camellia ptilosperma comes together. Camellia perpetua, Camellia achrysantha, Camellia quinqueloculosa, and Camellia longgangensis var. patens are clustered together; Camellia chrysanthoides and Camellia pubipetala are clustered together. However, the difference is that our research shows that Camellia longzhouensis is a group with Camellia perpetua, Camellia achrysantha, Camellia quinqueloculosa, Camellia longgangensis var. patens and Camellia longzhouensis. In terms of morphological characteristics. The leaf shape and flower characteristics of the Camellia longzhouensis and Camellia longgangensis var. patens are also relatively similar, while the leaf characteristics of Camellia chrysanthoides are quite different from them, and the leaves are thinner (Figure 3). Camellia multipetala is a branch with Camellia limonia, Camellia parvipetala, Camellia micrantha its flower color is white with yellow, the flowers are small, and the flower characteristics are relatively similar (Figure 4). The clustering of Camellia rostrata and Camellia nitidissima is inconsistent with the study of Wei [21]; this may be related to the number of samples collected. There are very few wild resources of Camellia rostrata, and only 5 strains were found. Based on the simplified genome data, we have better interpreted the phylogenetic relationships of the Chinese golden Camellia plants and established their interspecific relationships; combined with the external morphological analysis results, we provide more information and scientific basis for the classification of the Chinese Camellia Scet.chrysantha plants.
3.3. Comparison of Genetic Diversity between Karst and Non-Karst
Camellia Scet.chrysantha plants are widely distributed in karst landforms, and the phenotypic characteristics of plants are affected by the combined effects of genetic genes and the environment. Research on the genetic diversity of golden Camellia plant species in karst and non-karst areas will help reveal the factors influencing the phenotypic characteristics of Camellia Scet.chrysantha plants. The Shannon-Wiener diversity index is an index used to investigate the diversity (α-diversity) of plant communities in local habitats. It can also be used to measure the polymorphism of SNP sites; the PI value is between 0 and 1. Larger values represent higher diversity, and smaller values represent lower diversity. As can be seen from Figure 5, the genetic diversity index of golden Camellia species in non-karst areas is higher than that in karst areas; golden Camellia species in non-karst areas maintain higher genetic diversity. Selection elimination analysis was conducted based on two indicators: Fst and PI. The window (3kb sliding window along the genome) where Fst between different subgroups is greater than 0.25 and log2 (PI ratio) is greater than 1 or less than -1 is subject to strong selection. Regions of stress that are related to differentiation between different subpopulations, and genes distributed in these regions may be related to phenotypic differences between the two populations. As can be seen from Figure 5, golden Camellia genes in karst areas are selected by the karst natural environment, and polymorphisms are eliminated in order to adapt to the special karst habitats; the genetic diversity of areas where species are selected and eliminated is significantly reduced.
3.4. Chemical Activity and Cluster Analysis of Plant Leaves of Camellia sinensis Group
3.4.1. Chemical Profiles Content Comparative Analysis
Phenols and flavonoids are secondary metabolites of plants that contain at least one aromatic ring and a hydroxyl group; these compounds play an important physiological role in preventing the action of free radicals [41,42]; therefore, they can be used as preventive agents in the human body. A good source of cardiovascular disease [43,44], cancer [45,46,47], diabetes [48], weight loss and lipid lowering [49,50] and neurodegenerative diseases [51,52]. Using gallic acid and rutin as standards, the total phenolic content (TPC) and total flavonoid content (TFC) of each extract were determined using a colorimetric method. The results show that the active ingredients of golden camellia with karst distribution and non-karst distribution are quite different. The average contents of total phenols, total flavonoids, total proanthocyanidins and ellagic acid of golden camellia with karst distribution are 2.339g/100g and 0.035g/100g respectively, 2.640g/100g, 4.891g/100g; all significantly higher than the average contents of total phenols (1.471), total flavonoids (0.026), total proanthocyanidins (0.616), and ellagic acid (2.189) in non-karst distributed golden camellia.
The total phenolic content and total flavonoid content of the leaves of the golden camellia group plants vary greatly. The highest total phenolic content is Camellia mingii (4.563±0.049g/100g), followed by Camellia achrysantha (4.203±0.004g/100g). 100g); the lowest contents are Camellia tunghinensis and Camellia huana, both 0.600g/100g. In terms of total flavonoids, the performance is inconsistent with the total phenolic content. Among the 21 species of golden camellia tea group, the highest total flavonoid content is Camellia pubipetala (10.718±0.010g/100g), followed by Camellia quinqueloculosa (8.133±0.044g/100g) and Camellia flavida (7.013±0.003g/100g), and the lowest content is Camellia tunghinensis (0.368±0.001g/100g).
Proanthocyanidin (PC) is a mixture of bioflavonoids with a special molecular structure. Oligomeric proanthocyanidin (OPC) is currently internationally recognized as an effective natural antioxidant that scavenges free radicals in the human body. It is a biological flavonoid with a special molecular structure. Flavonoids are natural antioxidants that are effective in scavenging free radicals in the human body [53,54]. The trend is similar to that of TFC. The highest ones are Camellia impressinervis (6.560±0.058g/100g), Camellia quinqueloculosa (5.720±0.012g/100g), Camellia flavida (4.943±0.009g/100g), and Camellia pubipetala (4.460±0.058 g/100g), the lowest content is Camellia tunghinensis (0.004±0.001g/100g).
Ellagic acid is a natural polyphenol component widely present in various soft fruits, nuts and other plant tissues. The color reaction between ellagic acid and ferric chloride turns blue, and it turns yellow when exposed to sulfuric acid. Ellagic acid has a significant inhibitory effect on chemical-induced carcinogenesis and various other cancers, especially on colon cancer, esophageal cancer, liver cancer, lung cancer, tongue and skin tumors, etc.; it is mainly used in pharmaceuticals, additives for health foods and cosmetics, with high potential economic value [55,57]. The one with the highest ellagic acid content is Camellia limonia (0.090±0.001); followed by Camellia chrysanthoides (0.083±0.003), Camellia achrysanth (a0.072±0.001), Camellia perpatua (0.071±0.0003), Camellia euphlebia (0.070±0.001); The lowest contents were Camellia tunghinensis (0.002±0.0003) and Camellia huana (0.002±0.0011), which showed a similar trend to TOC.
Table 1.
Total phenolic content (TPC), total flavonoid content (TFC), total anthocyanin content (TAC) and Ellagic acid content (TEA) in methanolic extracts of 21 Golden Camellias.
Table 1.
Total phenolic content (TPC), total flavonoid content (TFC), total anthocyanin content (TAC) and Ellagic acid content (TEA) in methanolic extracts of 21 Golden Camellias.
| Species | TPCg/100g | TEAg/100g | TACg/100g | TFCg/100g |
|---|---|---|---|---|
| C.mingii | 4.563±0.049m | 0.048±0.001g | 3.950±0.006n | 4.064±0.003i |
| C.fascicularis | 1.603±0.009d | 0.036±0.001ef | 1.743±0.005i | 6.970±0.012o |
| C.wumingensis | 2.310±0.015g | 0.024±0.0003cd | 3.450±0.006m | 4.661±0.002l |
| C.tunghinensis | 0.600±0.012a | 0.002±0.0003a | 0.004±0.001a | 0.368±0.001a |
| C.rostrata | 1.217±0.045b | 0.028±0.001de | 0.479±0.001c | 1.083±0.003b |
| C.quinqueloculosa | 3.220±0.047k | 0.001±0.0003a | 5.720±0.012q | 8.133±0.044s |
| C.pubipetala | 2.807±0.003i | 0.002±0.001ab | 4.460±0.058o | 10.718±0.010t |
| C.pingguoensis | 1.403±0.004c | 0.039±0.017fg | 0.790±0.005d | 1.530±0.003c |
| C.pingguoensis var.terminalis | 1.803±0.003e | 0.061±0.001h | 0.937±0.002e | 1.874±0.010d |
| C.perpatua | 3.253±0.029k | 0.071±0.0003h | 2.430±0.005k | 4.437±0.033j |
| C.nitidissima var.microcurpa | 0.617±0.017a | 0.002±0.0003ab | 0.213±0.009b | 2.594±0.004f |
| C.nitidissima | 1.410±0.006c | 0.006±0.0003ab | 0.801±0.006d | 2.614±0.002f |
| C.longzhouensis | 2.405±0.003h | 0.045±0.0003fg | 2.282±0.002j | 5.352±0.002m |
| C.limonia | 2.070±0.035f | 0.090±0.001i | 1.315±0.003g | 4.573±0.001k |
| C.impressinervis | 2.810±0.006i | 0.002±0.0003a | 6.560±0.058s | 7.590±0.006q |
| C.huana | 0.600±0.006a | 0.002±0.0011ab | 0.004±0.0003a | 2.2763±0.003e |
| C.flavida | 3.016±0.017j | 0.011±0.001ab | 4.943±0.009p | 7.013±0.003p |
| C.euphlebia | 2.403±0.004h | 0.070±0.001h | 1.044±0.001f | 3.587±0.007h |
| C.debaoensis | 1.403±0.004c | 0.014±0.001bc | 1.467±0.005h | 5.838±0.002n |
| C.chrysanthoides | 2.805±0.006i | 0.083±0.003i | 3.276±0.018l | 5.840±0.026n |
| C.achrysantha | 4.203±0.004l | 0.072±0.001h | 3.500±0.012m | 3.497±0.012g |
Notes: Different letters in the same column represent results with a statistical difference, according to Student t-test (p < 0.05).
3.4.2. Principal Component Cluster Analysis
As can be seen from Table 2, two principal components were extracted based on the principal component eigenvalue being greater than 1. The first principal component (PC1) has an eigenvalue of 2.359 and a variance contribution rate of 59.0%. The second principal component (PC2) has an eigenvalue of 1.235. The variance contribution rate is 30.9%. The cumulative variance contribution rate of the two principal components reaches 90%, reflecting 90% of the information of the original evaluation index.
Figure 6.
Principal component analysis diagram of four active ingredients.
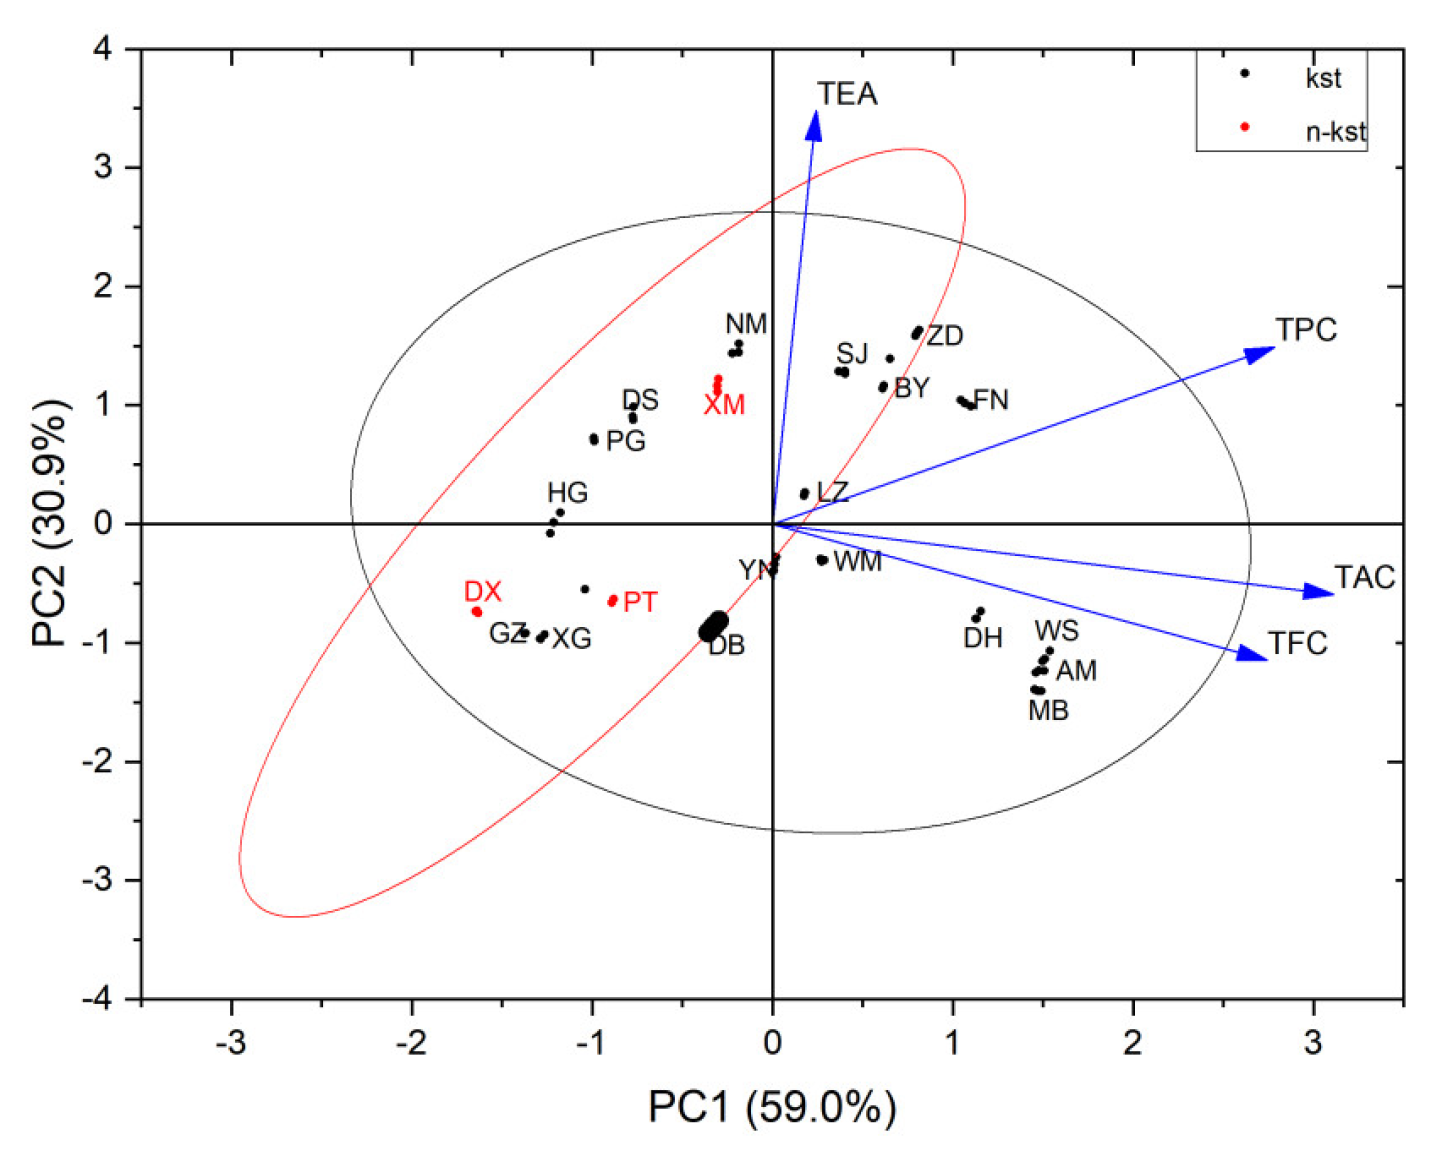
Using the content of 4 effective active ingredients in the leaves of Camellia Scet.chrysantha plants as parameter combinations, cluster analysis was performed on 21 species of golden Camellia. The results showed (Figure 7) that the dendrogram results were significantly consistent and corresponding relationship with the molecular clustering of Camellia Scet.chrysantha plants. When the distance coefficient is 5, the overall classification can be divided into 7 categories. The first category includes Camellia fascicularis, Camellia debaoensis,Camellia pubipetala, Camellia longzhouensis, and Camellia chrysanthoides; the second category includes Camellia nitidissima var.microcurpa and, Camellia hauna; the third category includes Camellia euphlebia and Camellia nitidissima; the fourth category includes Camellia quinqueloculosa, Camellia flavida, Camellia wumingensis, and Camellia impressinervis; this kind of plant’s nutrient content has the highest relative nutritional value among all kinds of golden camellia species. Category 5 includes Camellia mingii and Camellia achrysantha; Category 6 includes Camellia pingguoensisa, Camellia terminalis, Camellia rostrata, and Camellia perpetua; Category 7 was Camellia tunghinensis has relatively low phytonutrient content and relatively low medicinal value. The research results of cluster analysis of chemical active ingredients also prove the classification relationship of dd-RAD: the clustering relationship between Camellia fascicularis and Camellia debaoensis is relatively close; the relationship between Camellia nitidissima, Camellia limonia and Camellia euphlebia Consistent; Camellia wumingensis and Camellia impressinervis are clustered in the same way; Camellia pingguoensis, Camellia pingguoensis var.terminalis and Camellia pubipetala are clustered together as a whole and are consistent. Based on cluster analysis of four active ingredients, the similarity rate with Min Tianlu's classification system is relatively high [58]. The classification relationship of Camellia nitidissima, Camellia euphlebia, and Camellia nitidissima var.microcurpa is similar, and the classification relationship of Camellia flavida and Camellia hauna is similar. Similarly, Camellia pingguoensis var.terminalis, as a variant of Camellia pingguoensis, can be defined as a species; Camellia tunghinensis is a separate category. The diversity and particularity of species will inevitably lead to the diversity and particularity of the types of phytochemical components, and the diversity of phytochemical components will inevitably lead to the diversity and particularity of biological activities. The distribution of secondary metabolites in the tree of life is If it is selective, it will definitely show certain phylogenetic signals [59,60]. Therefore, we can analyze and evaluate the evolutionary relationships between plant groups through the distribution characteristics of secondary metabolites on evolutionary branches on the plant phylogenetic tree (or tree of life), providing evidence for plant classification and phylogenetic evolution.
4. Conclusions
Compared with previous RAPD, AFLP and SSR molecular marker methods, the development of SNP markers based on dd-RAD sequencing technology has higher feasibility and reliability in taxonomic research on Camellia section chrysantha, and is an ideal research that is not limited by the reference genome. method. We successfully used dd-RAD sequencing technology to develop 75,548 high-quality SNPs and 5,072 InDels from the sample population. Using the SNP genetic information developed by ddRAD-seq, we conducted a genetic relationship and phylogenetic analysis of 30 species of Camellia section chrysantha from China; the study found that the Chinese golden camelliagroup can be divided into 7 reticular taxa,That is, Camellia nitidissima, Camellia nitidissima var.microcurpa, Camellia euphlebia, Camellia tunghinensis, Camellia rostrata come together; Camellia limonia, Camellia xiashiensis, Camellia multipetala, Camellia parvipetala, Camellia micrantha come together; Camellia achrysantha, Camellia longzhouensis, Camellia multipetala var. Patens, Camellia perpatua, and Camellia quinqueloculosa are grouped together; Camellia debaoensis, Camellia fascicularis, Camellia mingii, Camellia pingguoensis var.terminalis, and Camellia wumingensis; among them, Camellia debaoensis, Camellia fascicularis, and Camellia mingii are closely related. Camellia impressinervis, Camellia longgangensis, and Camellia ptilosperma are closely related and are grouped together. Camellia flavida, Camellia huana, Camellia libelofifilamenta, Camellia pingguoensis, Camellia tianeensis are grouped together. Camellia pubipetala and Camellia chrysanthoides are one branch. Combined with chemical classification research, cluster analysis of 21 species of Camellia section chrysantha also proved the classification relationship of dd-RAD: The first category includes Camellia fascicularis, Camellia debaoensis,Camellia pubipetala, Camellia longzhouensis, and Camellia chrysanthoides; the second category includes Camellia nitidissima var.microcurpa and, Camellia hauna; the third category includes Camellia euphlebia and Camellia nitidissima; the fourth category includes Camellia quinqueloculosa, Camellia flavida, Camellia wumingensis, and Camellia impressinervis; this kind of plant’s nutrient content has the highest relative nutritional value among all kinds of golden camellia species. Phylogenetic signal refers to the similarity between related traits evolved in similar groups on the phylogenetic tree, that is, the correlation of evolution of similar groups and the similarity of traits. Phylogenetic signal can be divided into high and low. When the phylogenetic signal is high, it means that the traits between similar taxa are similar. According to the phylogenetic information of genetic and chemical phenotypes, the specific secondary metabolites of golden Camellia show a clustered distribution pattern in specific groups. One group is Camellia pubipetala, Camellia longzhouensis, Camellia chrysanthoides, and Camellia debaoensis, Camellia fascicularis; the other group is Camellia quinqueloculosa, Camellia impressinervis, Camellia flavida, Camellia wumingensis; these two groups are the plant leaf parts of the golden camellia group with high potential medicinal value Plant groups have important development potential and application prospects.
Author Contributions
Conceptualization, X.W.; methodology, R.Z.; validation, J.T.; formal analysis, Y.Y. and R.Z.; investigation, F.C. and F.W. (sampling), Y.Y. and Y.J. (sequencing), J.T. (data analysis); writing—original draft preparation, J.T.; writing—review and editing, J.T.; visualization, X.W. and J.T; supervision, J.T and R.Z.; funding acquisition, X.W. All co-authors have reviewed and approved the final version of the manuscript for publication.
Funding
This study was supported by the projects of National Natural Science Foundation of China (No. 32160091 and No. 32060248); National key research and development program (No. 2022YFF1300703), Chinese Academy of Sciences ‘Light of West China’ Program (2022). Guangxi Forestry Science and Technology Promotion Demonstration Project (2023LYKJ03 and [2022]GT23); Guangxi Key Laboratory of Plant Functional Phytochemicals Research and Sustainable Utilization Independent project (No. ZRJJ2022-2). Guilin Innovation Platform and Talent Plan (20210102-3). Guilin City Technology Application and Promotion Plan (20220134-3).
Institutional Review Board Statement
Not applicable.
Informed Consent Statement
Not applicable.
Data Availability Statement
All data cited in the study are publicly available.
Conflicts of Interest
The authors declare no conflict of interest. This research was part of the dissertation submitted by the first author in partial fulfilment of a Ph.D. degree. All authors have provided.
References
- Wei X, Jiang SY, Jiang YS,Tang H, Cao HL. Research progress of rare and endangered plant Camellia nitidissima. Fujian forestry science and technology 2006, 33, 169–174. [Google Scholar]
- Gao, H. Construction of golden camellia fingerprint map and screening of excellent germplasm, Minzu University of China,PhD thesis, 2023.
- Shi, YT. Research on the conservation genetics of Camellia debaoensis and Camellia mingii based on simplified genome sequencing technology.Guangxi Normal University, MA thesis, 2023.
- Huang XN, Qi Y, Ye PM, Jiang CJ, Li GE, Li ZH. Research on the Breeding of Two New Golden Camellia Hybrid Varieties. Anhui Agricultural Sciences 2021, 16, 54–56. [Google Scholar]
- Registration of new camellia varieties (Part 1), Chinese flower gardening.2010:44-47.
- Hakoda N, Pedigree and breeding status of yellow camellia. Report of Horticultural Culture Institute of Huiquan Women's College: Horticultural culture 2006, 3, 43–69.
- Nishikawa H, Tanabe R, Takahashi. K. Deep mountain landscape and golden tea growing environment in Kye Hung County, North Central Vietnam. Landscape Technical Reports Collection, 2, 42-43., Reiko Tanabe, Kazuya Takahashi. Deep mountain landscape and golden tea growing environment in Kye Hung County, North Central Vietnam. Landscape Technical Reports Collection 2023, 2, 42–43. [Google Scholar]
- Tang JM, Shi YC, Liao YQ, Fan JS, Wei JQ Wen XY, Wei X. Analysis of nutritional components of Camellia nitidissima. Guihaia 2017, 37, 1176–1181. [Google Scholar]
- Chen YX, Lv SJ, Wei JB. Research progress on the chemical composition and pharmacological effects of Camellia nitidissima. Guangxi Traditional Chinese Medicine 2013, 1, 4–6. [Google Scholar]
- Niu GJ, Xin JH, Zhu S, Wang WH, Chen QY, Liang YC. Determination of active ingredients and antioxidant activity of Camellia nitidissima. Journal of Forestry and Environment 2015, 35, 165–168. [Google Scholar]
- Cao F & Fan, LL. Research progress of Golden Camellia. China Pharmaceutical Industry 2013, 22, 95–96. [Google Scholar]
- Deng GY, Yang ZD, Lu TL. Overview of research on yellow Camellia in China. Guangxi Agricultural Biosciences 2000, 19, 126–130. [Google Scholar]
- 13. Golden Flower Tea series of tea snacks sell well at home and abroad. Modern Marketing (Business Edition) .
- Zhu XL,Tang JM, Qin HZ, Bai KD, Chen ZY, Zou R., Chai SF. Contrasting Adaptation Mechanisms of Golden Camellia Species to Different Soil Habitats Revealed by Nutrient Characteristics.2022,1511-1511.
- Ye CX, & Xu ZR. Research on golden camellia Formation. Journal of Sun Yat-sen University: Natural Science Edition 1992, 31, 68–77. [Google Scholar]
- Tang SQ, Shi SH, Chen YQ, Qu LH, Zhang HD. RAPD analysis and taxonomic significance of Golden Camellia and related species. 2: Journal of Sun Yat-sen University (Natural Science Edition),1998, 1998.
- Tang SQ, Du LF, Wang Y. AFLP analysis of the golden camellia Camellia genus. Wuhan Botany Research 2004, 22, 44–48. [Google Scholar]
- Xiao Z, Li JY, Li ZH, Huang LD, Fan AQ, Jiang CJ. Using ISSR analysis of genetic relationships among Camellia species. Forestry Science Research 2014, 1, 71–76. [Google Scholar]
- Chen, HL. Study on the genetic diversity and genetic structure of Camellia chrysanthoides and its related species,Guangxi Normal University, MA thesis, 2019.
- Lu XL, Chen HL, Wei SJ, Tang SQ.Chloroplast and nuclear DNA analyses provide insight into the phylogeography and conservation genetics of Camellia nitidissima (Theaceae) in southern Guangxi, China.2022, (1),8.
- Wei, SJ. , Liufu, YQ., Zheng, HW., Chen HL., Lai YC., Liu Y, Tang SQ. Using phylogenomics to untangle the taxonomic incongruence of yellow-flowered Camellia species (Theaceae) in China. Journal of Systematics and Evolution 2022, 5, 748–763. [Google Scholar]
- Zhang, YZ. Distribution patterns of secondary metabolites in the tree of life of seed plants. Yunnan University, PhD thesis.2020.
- Le VA, Mai Nga T, X, Nhi Nguyen T, Nguyen KO. Genotypic and Phenotypic Diversity of Endemic Golden Camellias Collected from the North of Vietnam, Chemistry & Biodiversity 2023, 20, e202200843.
- Alexander D H, Novembre J, Lange K. Fast model-based estimation of ancestry in unrelated individuals. Genome research 2009, 19, 1655–1664. [Google Scholar] [CrossRef]
- Zhu, XL. , Zou R, Qin HZ., Chai SF., Tang JM., Li YY, Wei, X. Genome-wide diversity evaluation and core germplasm extraction in ex situ conservation: A case of golden Camellia tunghinensis. Evolutionary Applications.,2023,16.
- Kang HM, Sul JH, Service SK, Zaitlen NA, Kong SY, Freimer NB, Sabatti C, Eskin E. Variance component model to account for sample structure in genome-wide association studies. Nat. Genet. 2010, 42, 348–354. [Google Scholar] [CrossRef] [PubMed]
- Lipka AE, Tian F, Wang Q, Peiffer J, Li M, Bradbury PJ, Gore MA, Buckler ES, Zhang Z. GAPIT: Genome association and prediction integrated tool. Bioinformatics 2012, 28, 2397–2399. [Google Scholar] [CrossRef]
- Bradbury P J, Zhang Z, Kroon D E l. TASSEL: Software for association mapping of complex traits in diverse samples. Bioinformatics 2007, 23, 2633–2635. [Google Scholar] [CrossRef] [PubMed]
- Zhang WP, Zhang ZY, Wang YP, Jiang W. Study on extraction process of polyphenols in Camellia nitidissima. Chinese cosmetics,2003,114-120.
- Piyawan P, Pensri T, Chutharat T, Kaewta D, Víctor C. Development of a Digital Microscope Spectrophotometric System for Determination of the Antioxidant Activity and Total Phenolic Content in Teas. 2021, 2727–2735.
- Zhang P, Yu B, Zou CP, Huang LLi, Zhao CY, & Sun YB. Research progress on biological functions and extraction and separation methods of flavonoids in Camellia sinensis. Guangdong Agricultural Sciences 2019, 46, 13–20. [Google Scholar]
- Wang LL, Lin QX, Song ZS & Chen L. Spectrophotometric determination of total flavonoid content in tea. Journal of Tea,2021,1-6.
- Wu YY, Hou DY, Hui RH. Determination of proanthocyanidin content in Tie Guanyin tea and tea stem. Journal of Anshan Normal University, 2012,30-33.
- OrtegaVidal J, RuizMartos LSS & Altarejos J. Proanthocyanidins in Pruning Wood Extracts of Four European Plum (Prunus domestica L.) Cultivars and Their hLDHA Inhibitory Activity.2023,e202200931-e202200931.
- Deng, WJ. Study on the conversion law of free ellagic acid and the determination method of raspberry content. Pharmacy Today, 2023,431-434.
- Wang JL, Zhao LY, Wu WL, Li WL & Zhang CH. Change law of ellagic acid in blackberry fruit and 119 its correlation with quality index. Southern Chinese fruit trees. 2023, 154–159.
- WangA un, Huang XL, Liang XJ, Wei XJ, Li KX, Ma JL. Comparison of leaf active ingredient content of 11 species of Camellia sinensis group. Economic Forestry Research,2018,110-114.
- Li XM, Li CN, Lu JS, Huang ZW, Cui XQ, Zhang ZB, Bu CY. Analysis and evaluation of flower active components of six yellow Camellia group plants. Food Research and Development,2020,33-37.
- Zhu CH,Tang JM, Jiang HL, Zou R, Qin HZ, Chai SF, Wei X. Evaluation of nutritional value of Guangxi Yuliang Tiankeng characteristic plant stem Huashan pomelo. Journal of Guangxi Academy of Sciences,2020,109-116.
- Hardy O J, Vekemans X. SPAGeDi: a versatile computer program to analyse spatial genetic structure at the individual or population levels. Molecular ecology notes 2002, 2, 618–620. [Google Scholar] [CrossRef]
- Wei X, Haung XX, Jiang YS, Tang H, Qi XX, Chen ZY. Comparison of the antioxidant activity of three plant extracts from the Golden Camellia group. Chinese Journal of Traditional Chinese Medicine 2011, 36, 639–641. [Google Scholar]
- Jiang LN, Li JY, Fan ZQ, Tong R, Mo RH, Li Z, Jiang CJ. Analysis of polyphenol components in flowers of Golden Camellia plants. Forestry Science Research 2020, 33, 117–126. [Google Scholar]
- Zhang HL, Yu QT, Wu QX, & Qin XM. Research on online screening of antioxidant substances and in vivo antioxidant activity of Yellow Camellia flavonoids based on the action of iron ions combined with high-performance liquid chromatography. Natural Product Research and Development 2022, 32, 719–726. [Google Scholar]
- Yan DM, & Yao AD. Research on the antioxidant properties of Camellia nitidissima polyphenols. Journal of Henan University of Technology: Natural Science Edition 2009, 30, 42–45. [Google Scholar]
- Duan XX, Tang XL, Su JJ, Wang Y, Li Y, Yang C, Fu JY. Study on the inhibitory effect of Camellia nitidissima on liver cancer induced by diethylnitrosamine in rats. Journal of Medical Research 2006, 35, 14–16. [Google Scholar]
- Nong CL Chen YX, He XK, Wei JB. Experimental study on the in vitro anti-tumor activity of total flavonoids of Camellia nitidissima. Chinese Journal of Cancer Prevention and Treatment 2013, 4, 324–327. [Google Scholar]
- Wang ZL, Guo YJ, Zhu YY, Chen L, Wu T, Liu DB, Du HZ. Study on the mechanism of the effective part of Camellia nitidissima inhibiting epidermal growth factor receptor (EGFR) against non-small cell lung cancer. China Journal of Traditional Chinese Medicine 2021, 46, 5362–5371. [Google Scholar]
- Tian XC, Qin XM, Lin HJ, Yang JZ, Wei L. Study on the physical and chemical properties of Camellia nitidissima polysaccharides. Journal of Chinese Food Science 2011, 8, 47–52. [Google Scholar]
- Wei L, Qin XM, Lin HJ, Ning EC, Yang H. Study on the hypolipidemic function of Camellia nitidissima polysaccharide. Food Science and Technology 2008, 33, 247–249. [Google Scholar]
- Zhang, HL. Effect and mechanism of golden camellia flavonoids on food-borne obesity, Guangdong Ocean University,PHD Thesis,2020.
- Tsoi B, Gao C,Yan SY,Du QH,Yu H,Li P, Shen JG. Camellia nitidissima Chi extract promotes adult hippocampal neurogenesis and attenuates chronic corticosterone-induced depressive behaviours through regulating Akt/GSK3β/CREB signaling pathway. Journal of Functional Foods,2022,95.
- An L, Zhang W, Ma GW, Wang YS. Neuroprotective effects of Camellia nitidissima Chi leaf extract in hydrogen peroxide-treated human neuroblastoma cells and its molecule mechanisms. 2022,4782-4793.
- Zhang YW, Zhao L, Tan W. Advances in the application of plant proanthocyanidins. Chinese fruits and 168 vegetables,2023,24-28+41.
- Liu H, Sun J, Fei XW, Yu HL, Cui YF, Song LL. Research progress on physiological efficacy and analysis of proanthocyanidins. Food research and development 2023, 211–217.
- Zeng W, Gu ZL. Research progress on the pharmacological effects of ellagic acid. Journal of Changshu Institute of Technology,2023,72-77.
- Yu WD, Liu M, Song P. Research progress on biological activity and analysis of ellagic acid, Bioprocessing 2023, 21, 83–90.
- Xia ML Yin YX, Xiao YT, Zheng SZ, Tan B, Wang L, Chen JS. Research progress on the physiological functions of ellagic acid and its application in animal production. Feed Research, 2023,149-154.
- Min TL, & Zhang WJ. Taxonomic issues of the Ancient Tea Group and golden camellia Group. Yunnan Botanical Research 1993, 1, 1–15. [Google Scholar]
- Wu, Q. Study on the phylogeny of Camellia and the variation of its characteristic secondary metabolites, Anhui Agricultural University, PhD thesis,2023.
- Zhong CS, Lin YL, Liu SC, Chen Yukun & Lai ZX. Research progress on secondary metabolites of Camellia nitidissima. Horticulture and seedlings,2014,58-62.
Figure 2.
Genetic relationships and phylogenetic tree of plants in the Camellia Scet.chrysantha.
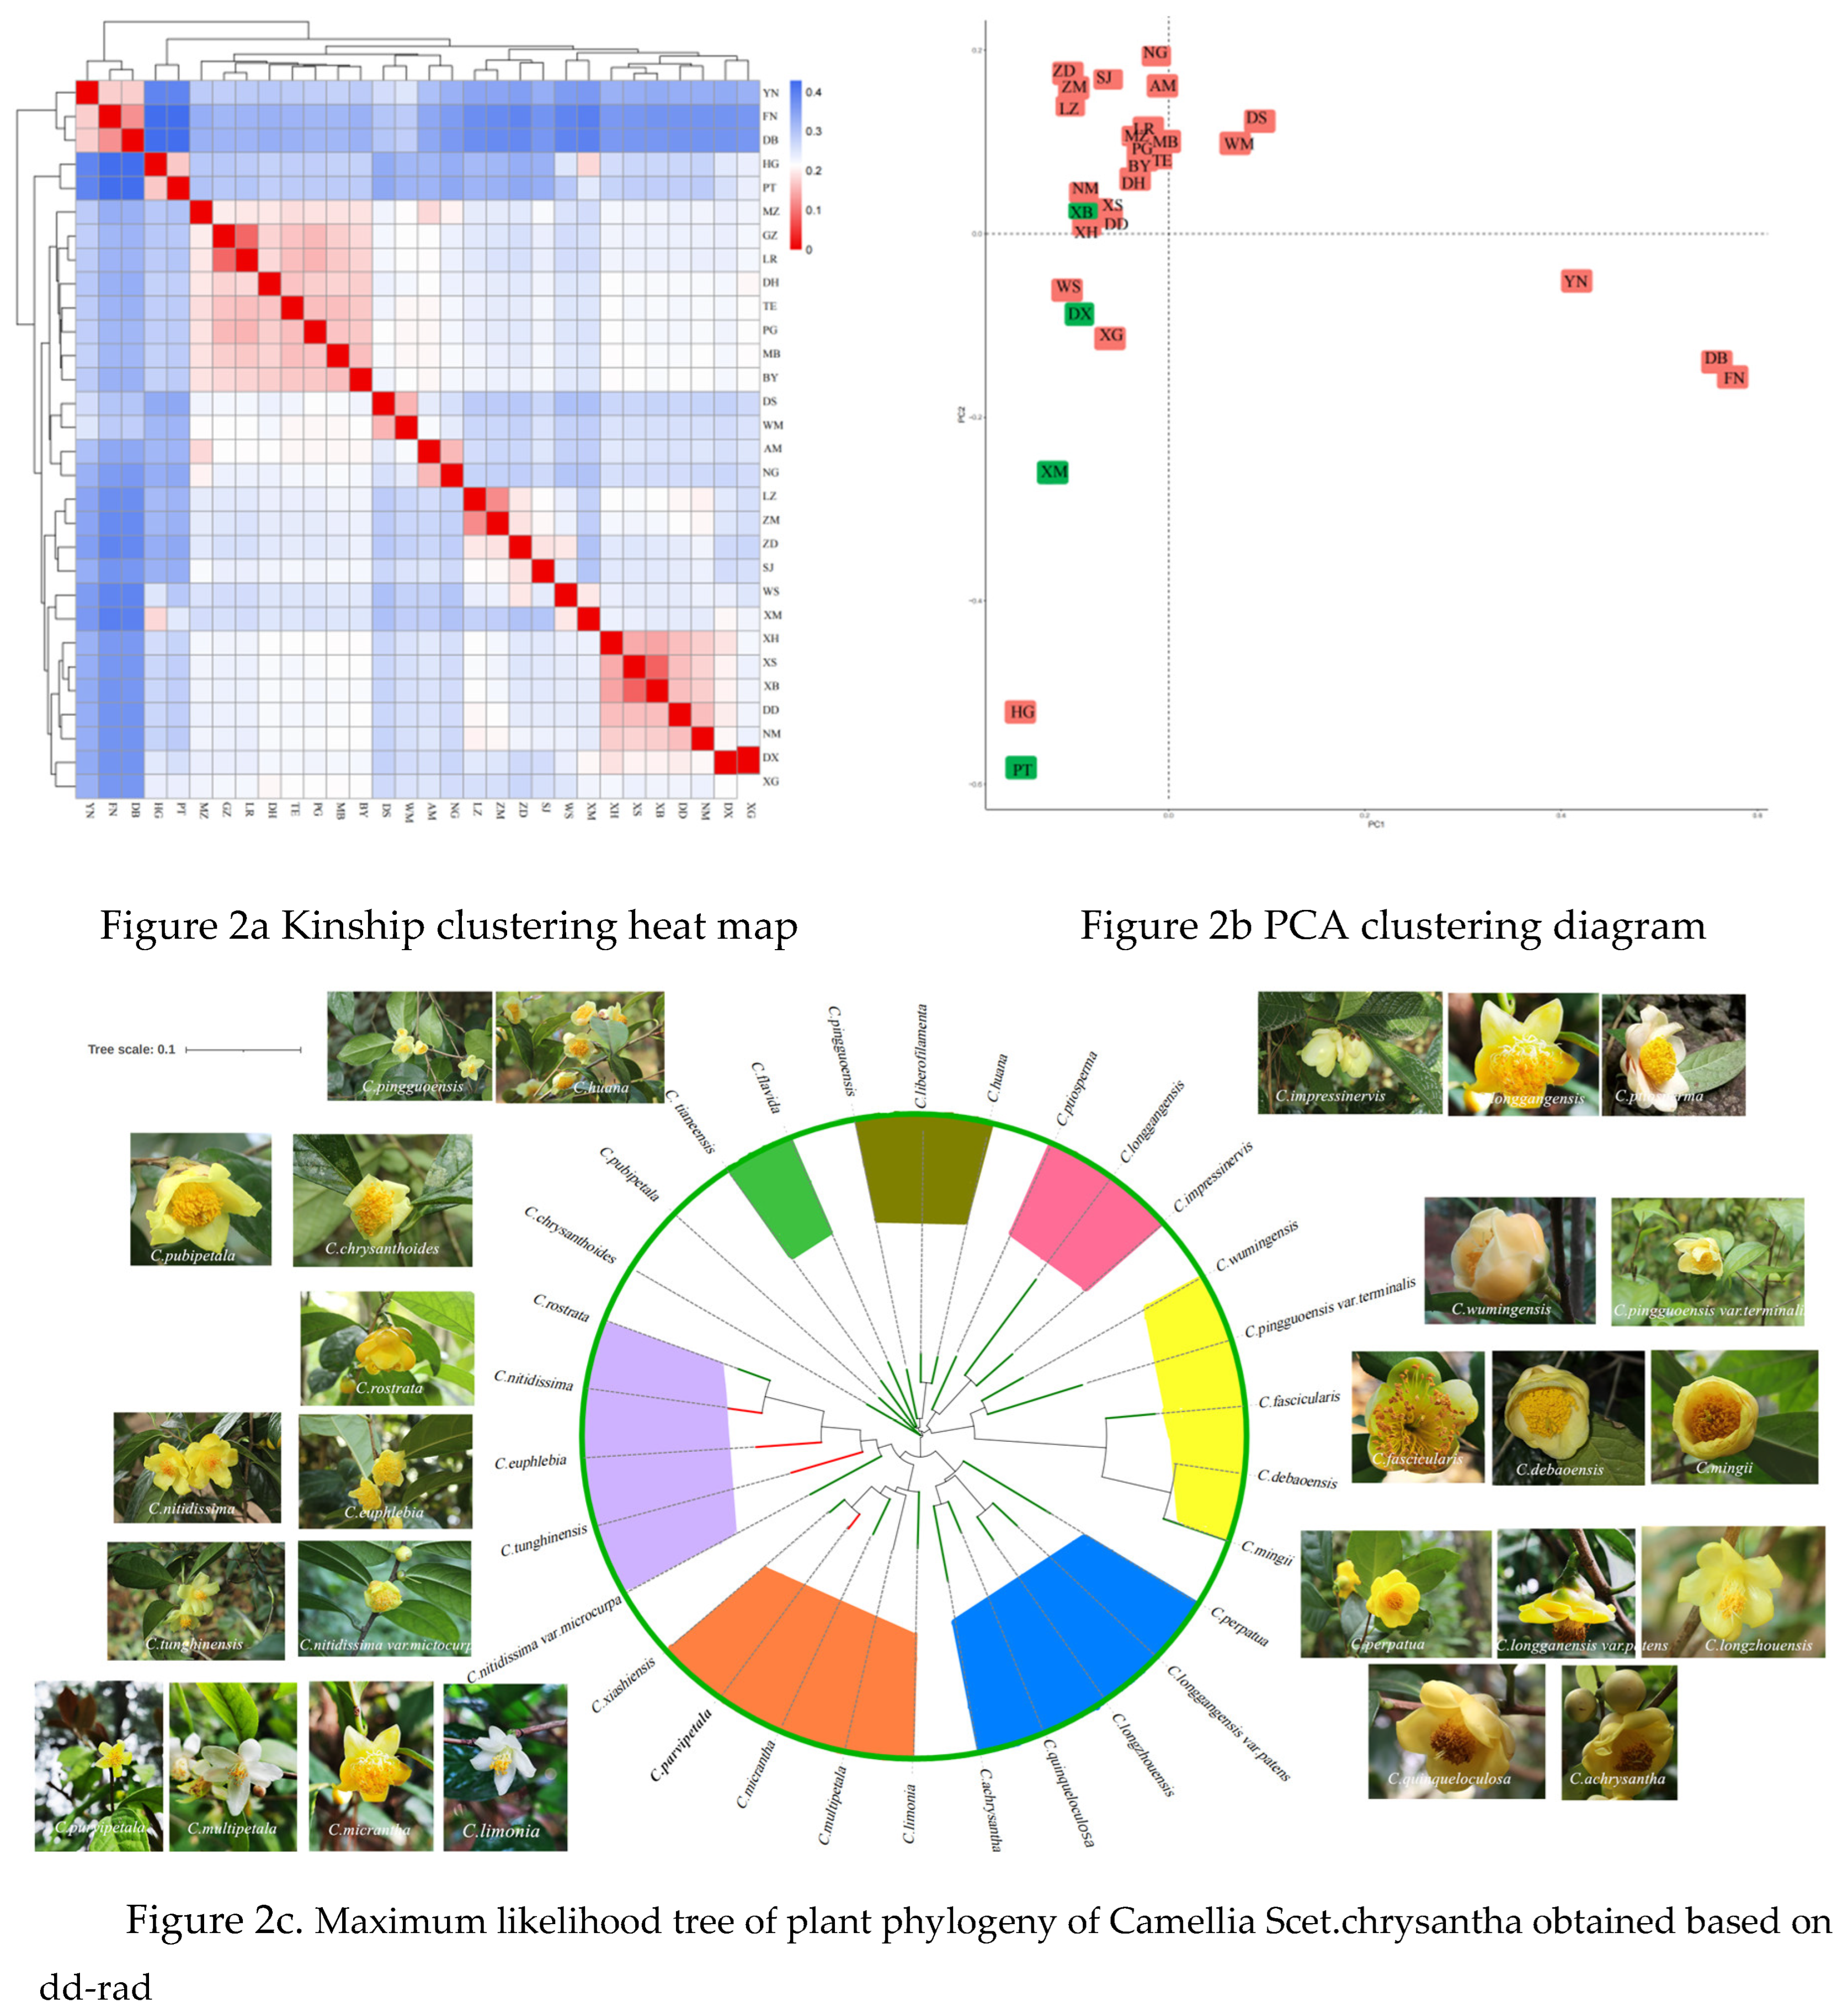
Figure 3.
Comparison of biological characteristics of Camellia longzhouensis and Camellia longgangensis var. Patens, Camellia quinqueloculosa, Camellia chrysanthoides.
Figure 3.
Comparison of biological characteristics of Camellia longzhouensis and Camellia longgangensis var. Patens, Camellia quinqueloculosa, Camellia chrysanthoides.
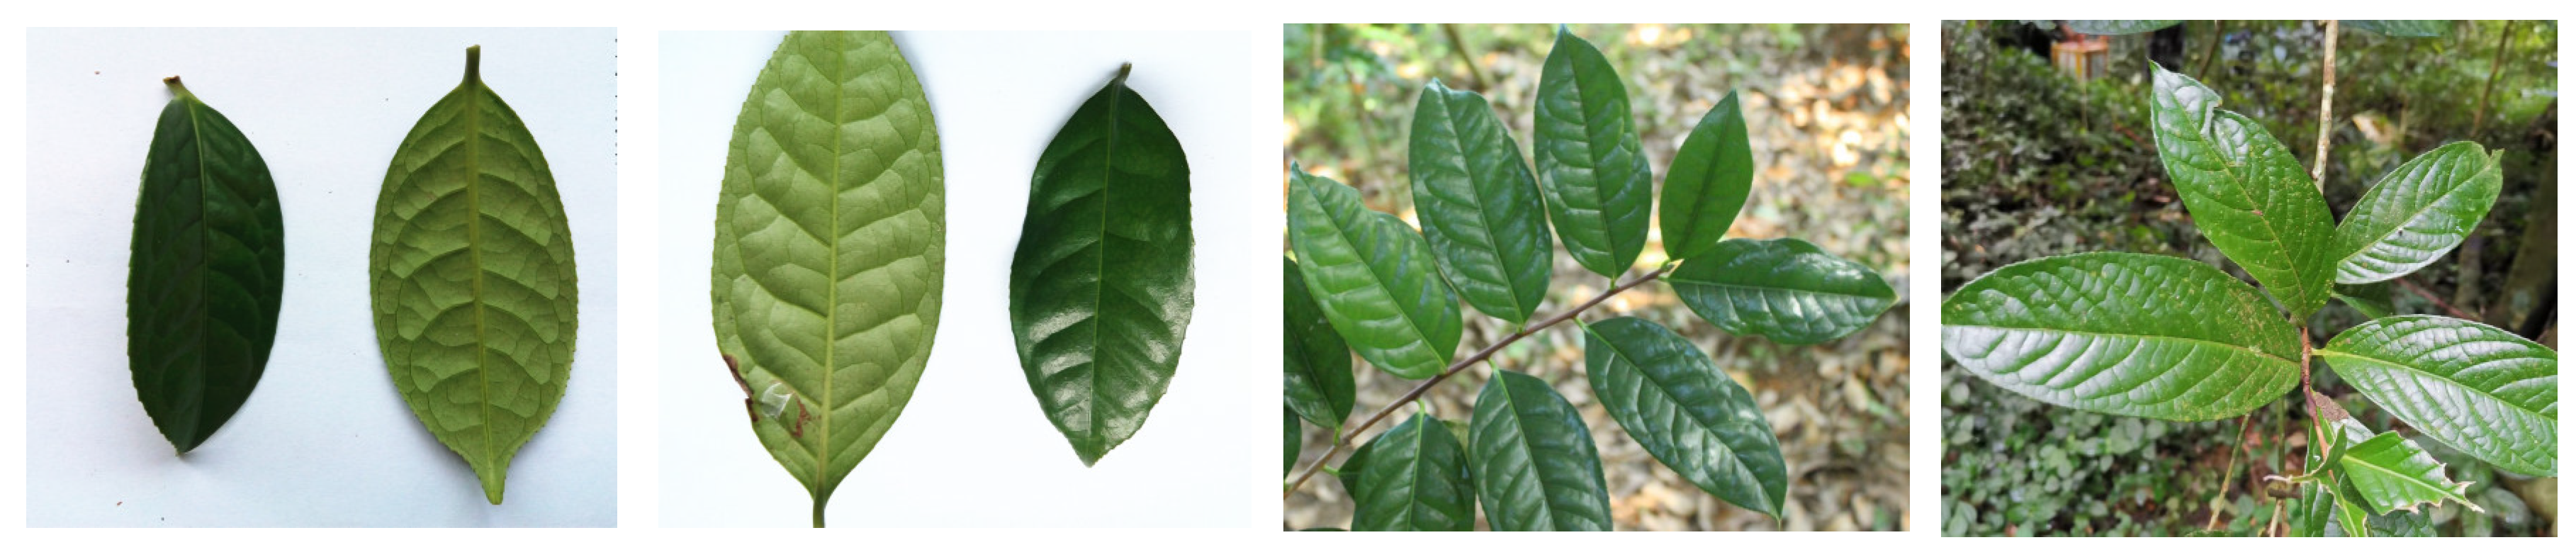
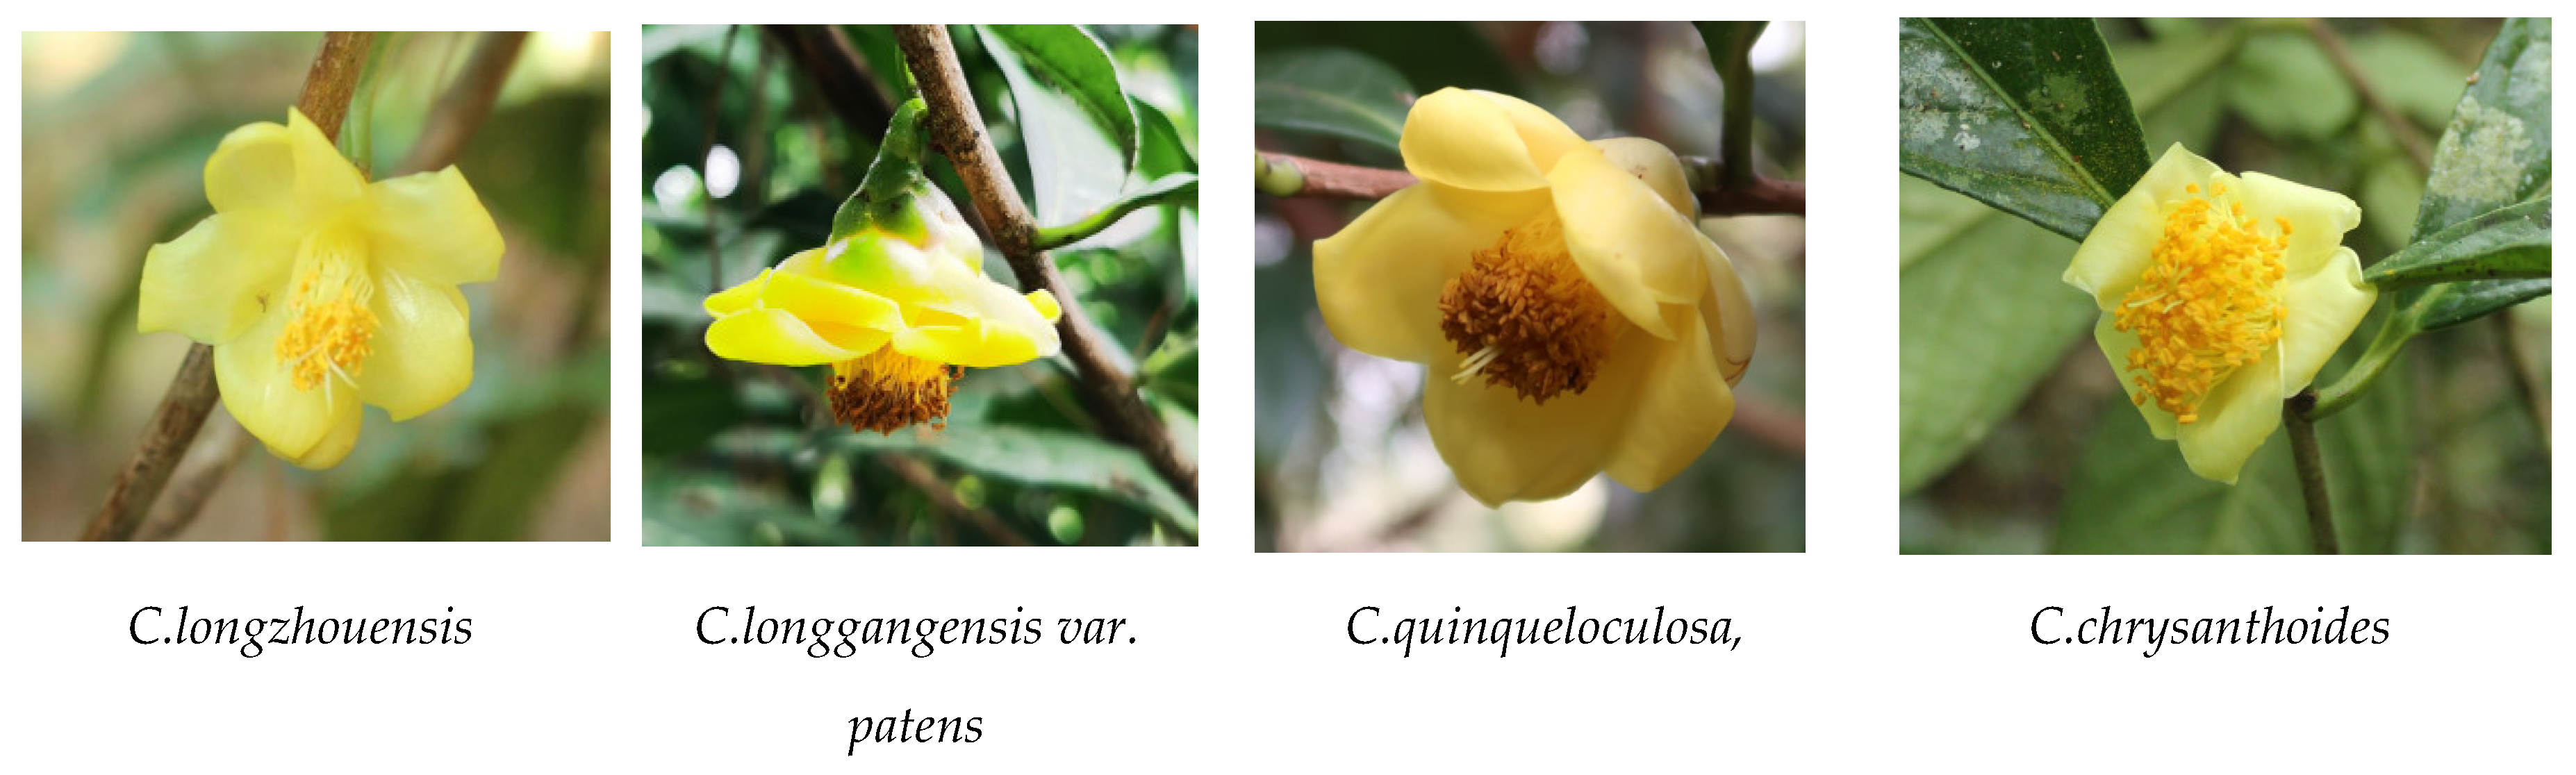
Figure 4.
Comparison of floral characteristics of Camellia multipetala, Camellia limonia, Camellia parvipetala, Camellia micrantha.
Figure 4.
Comparison of floral characteristics of Camellia multipetala, Camellia limonia, Camellia parvipetala, Camellia micrantha.
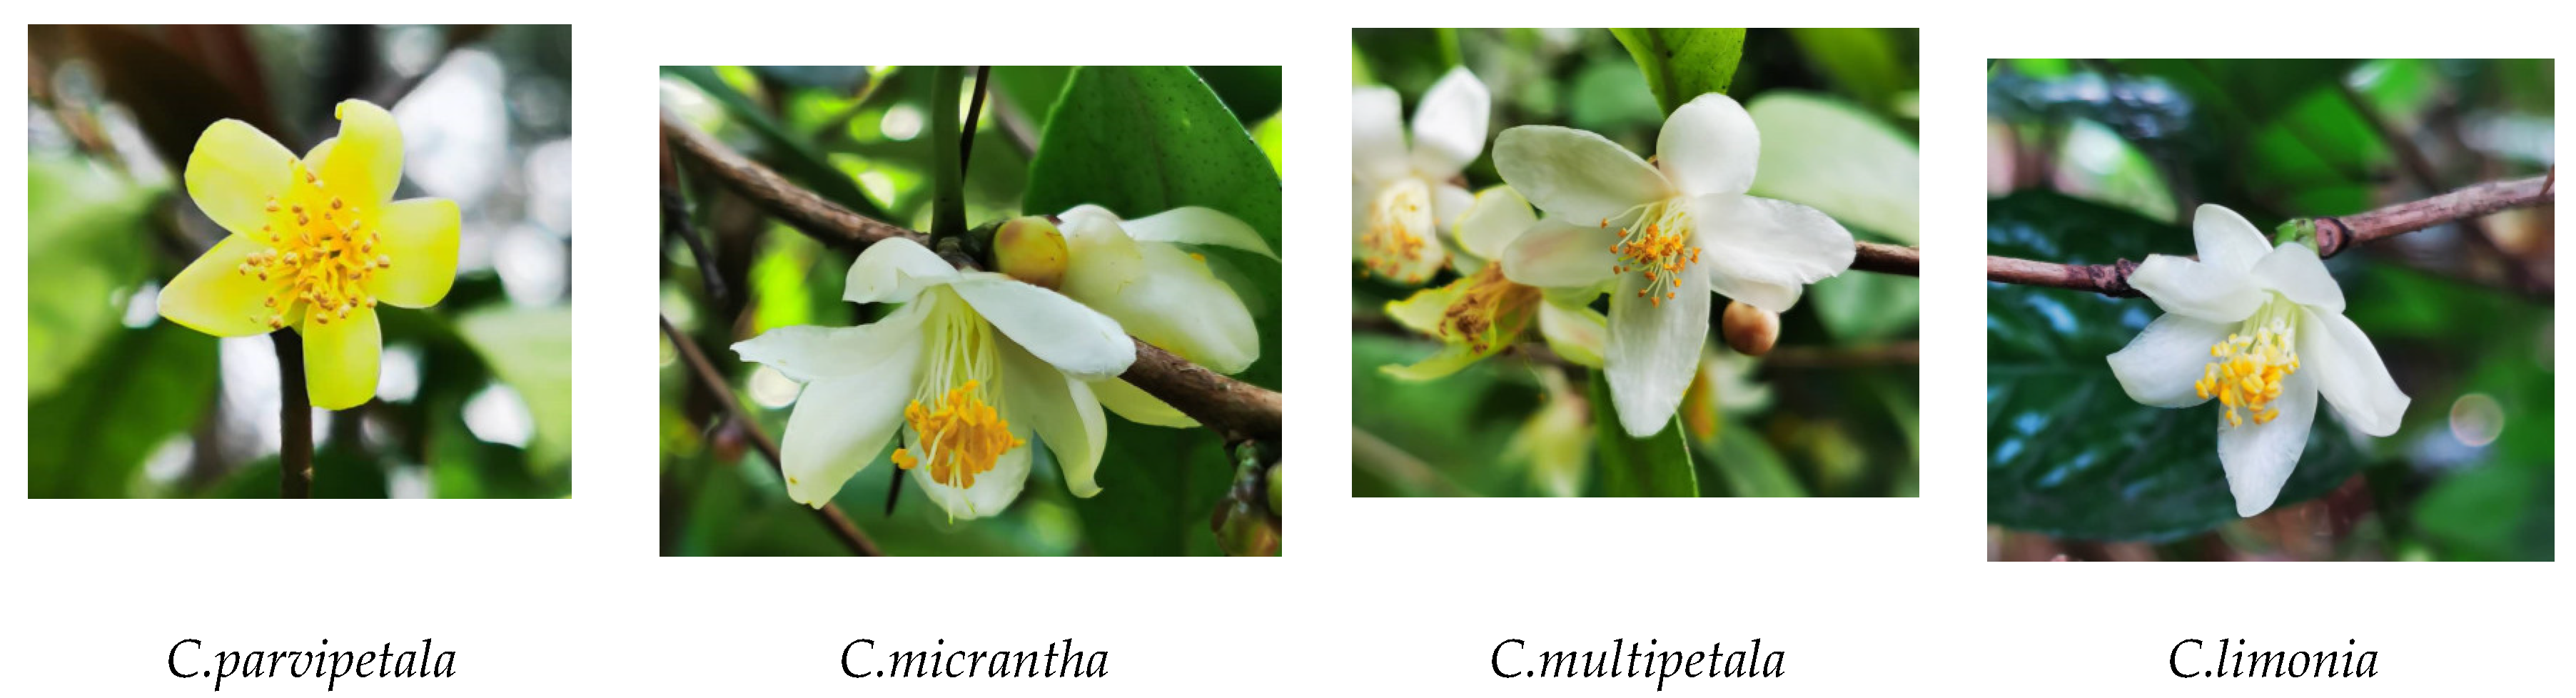
Figure 5.
Comparison of genetic diversity of golden Camellia taxa distributed in karst and non-karst areas.
Figure 5.
Comparison of genetic diversity of golden Camellia taxa distributed in karst and non-karst areas.
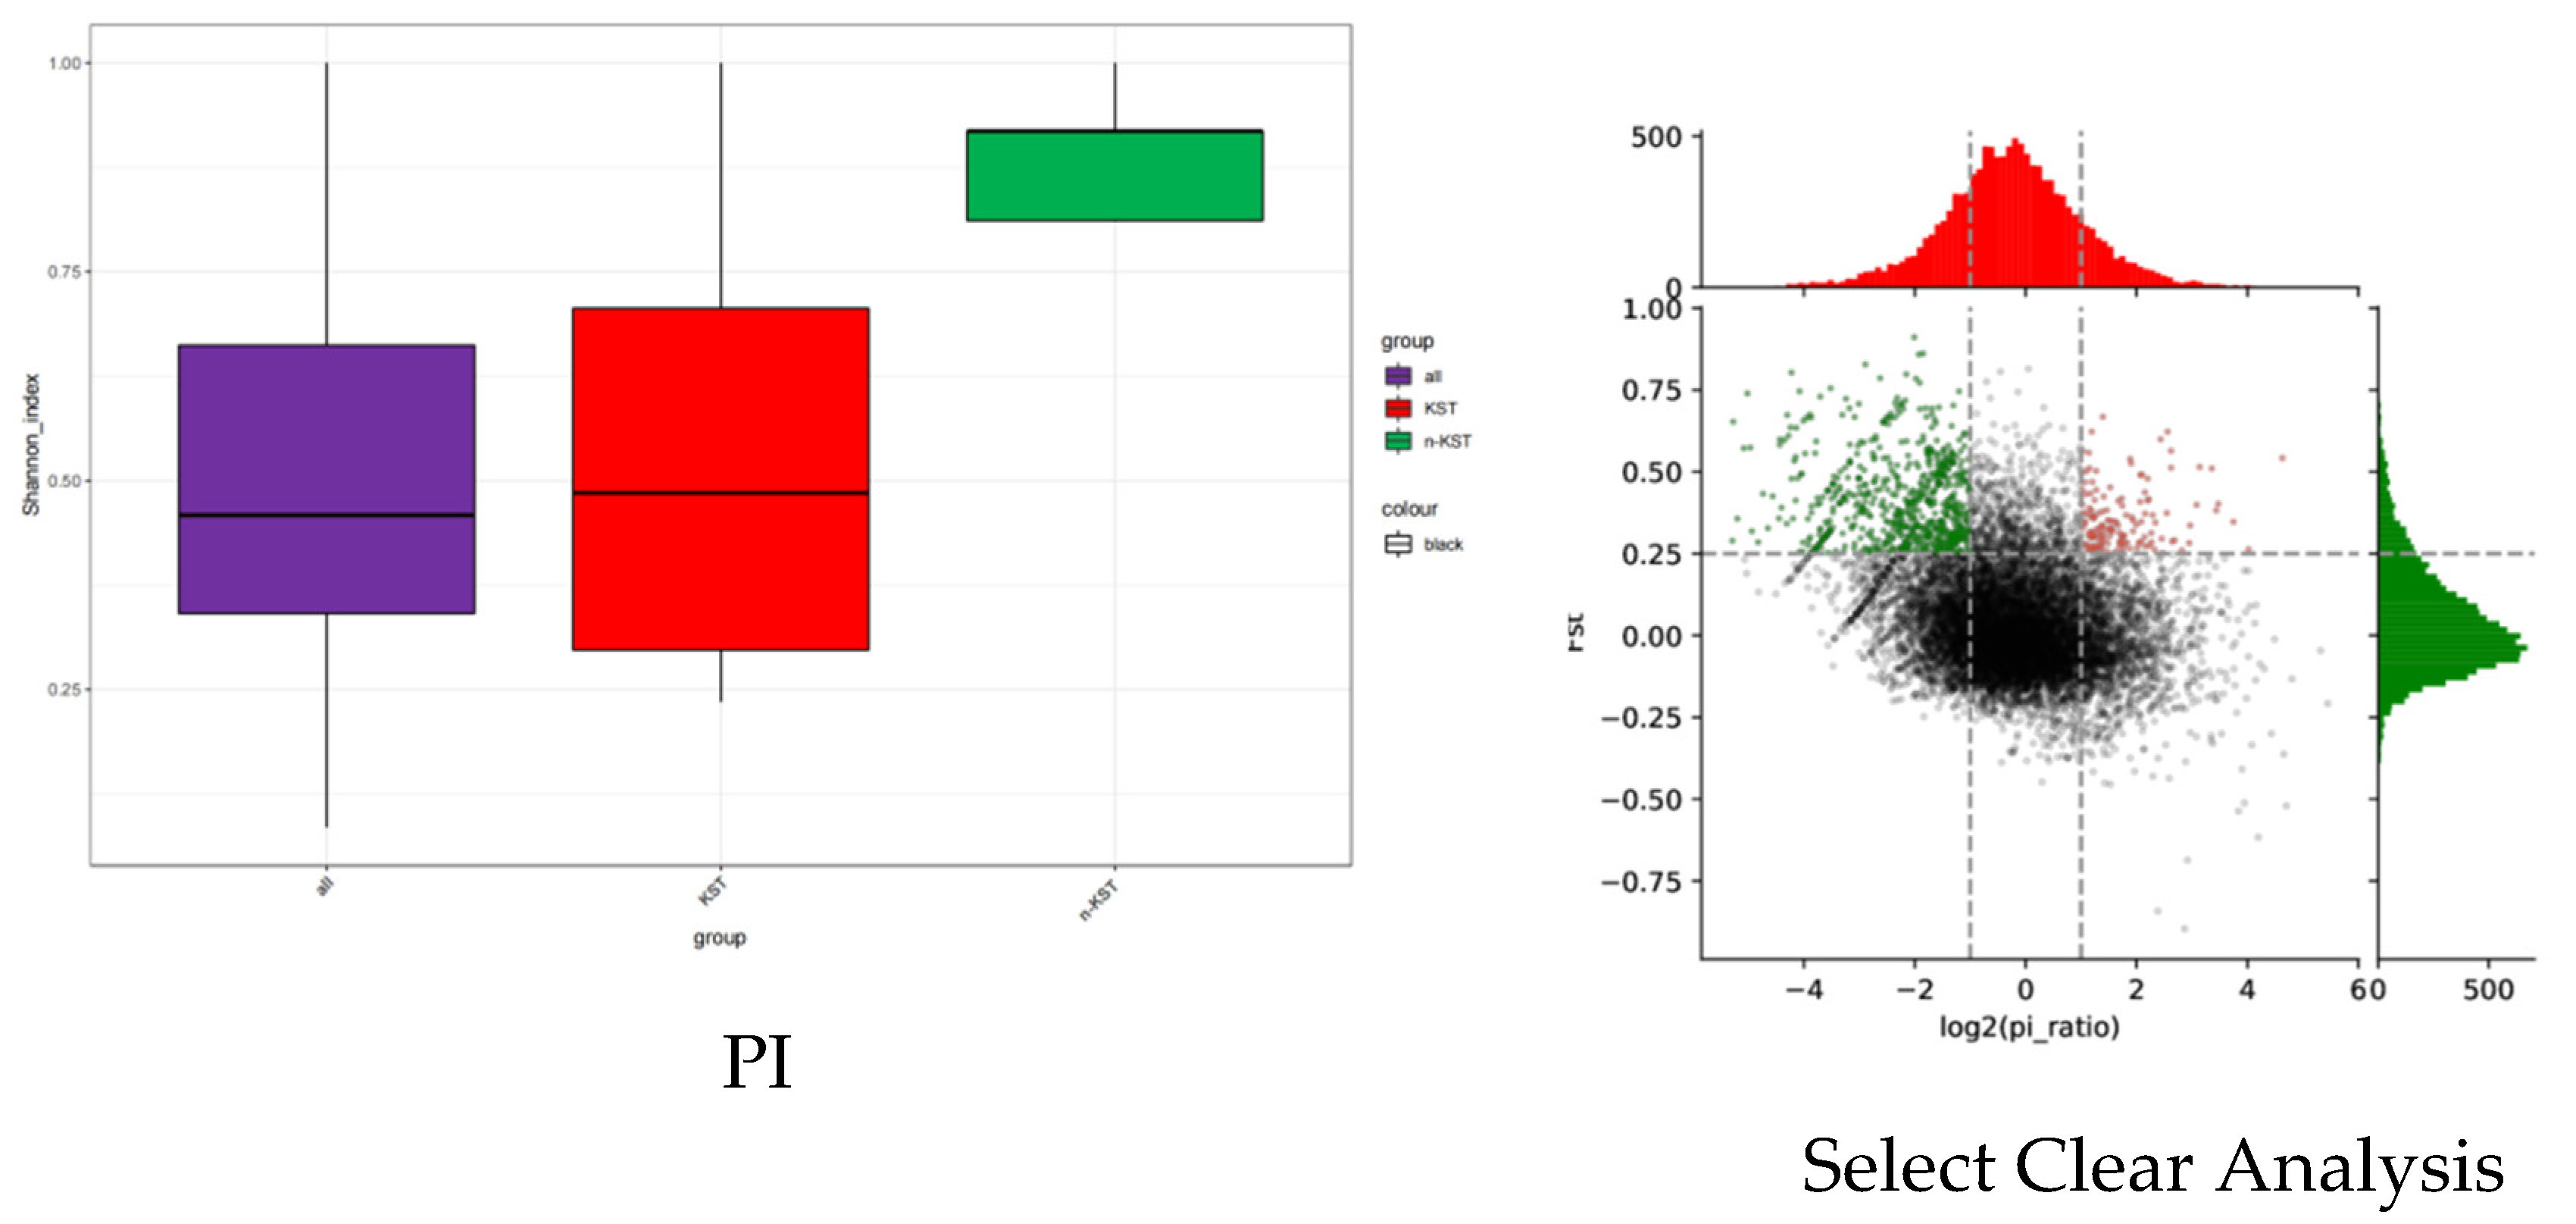
Figure 7.
Cluster analysis on 21 species of Camellia Sect.Chrysantha.
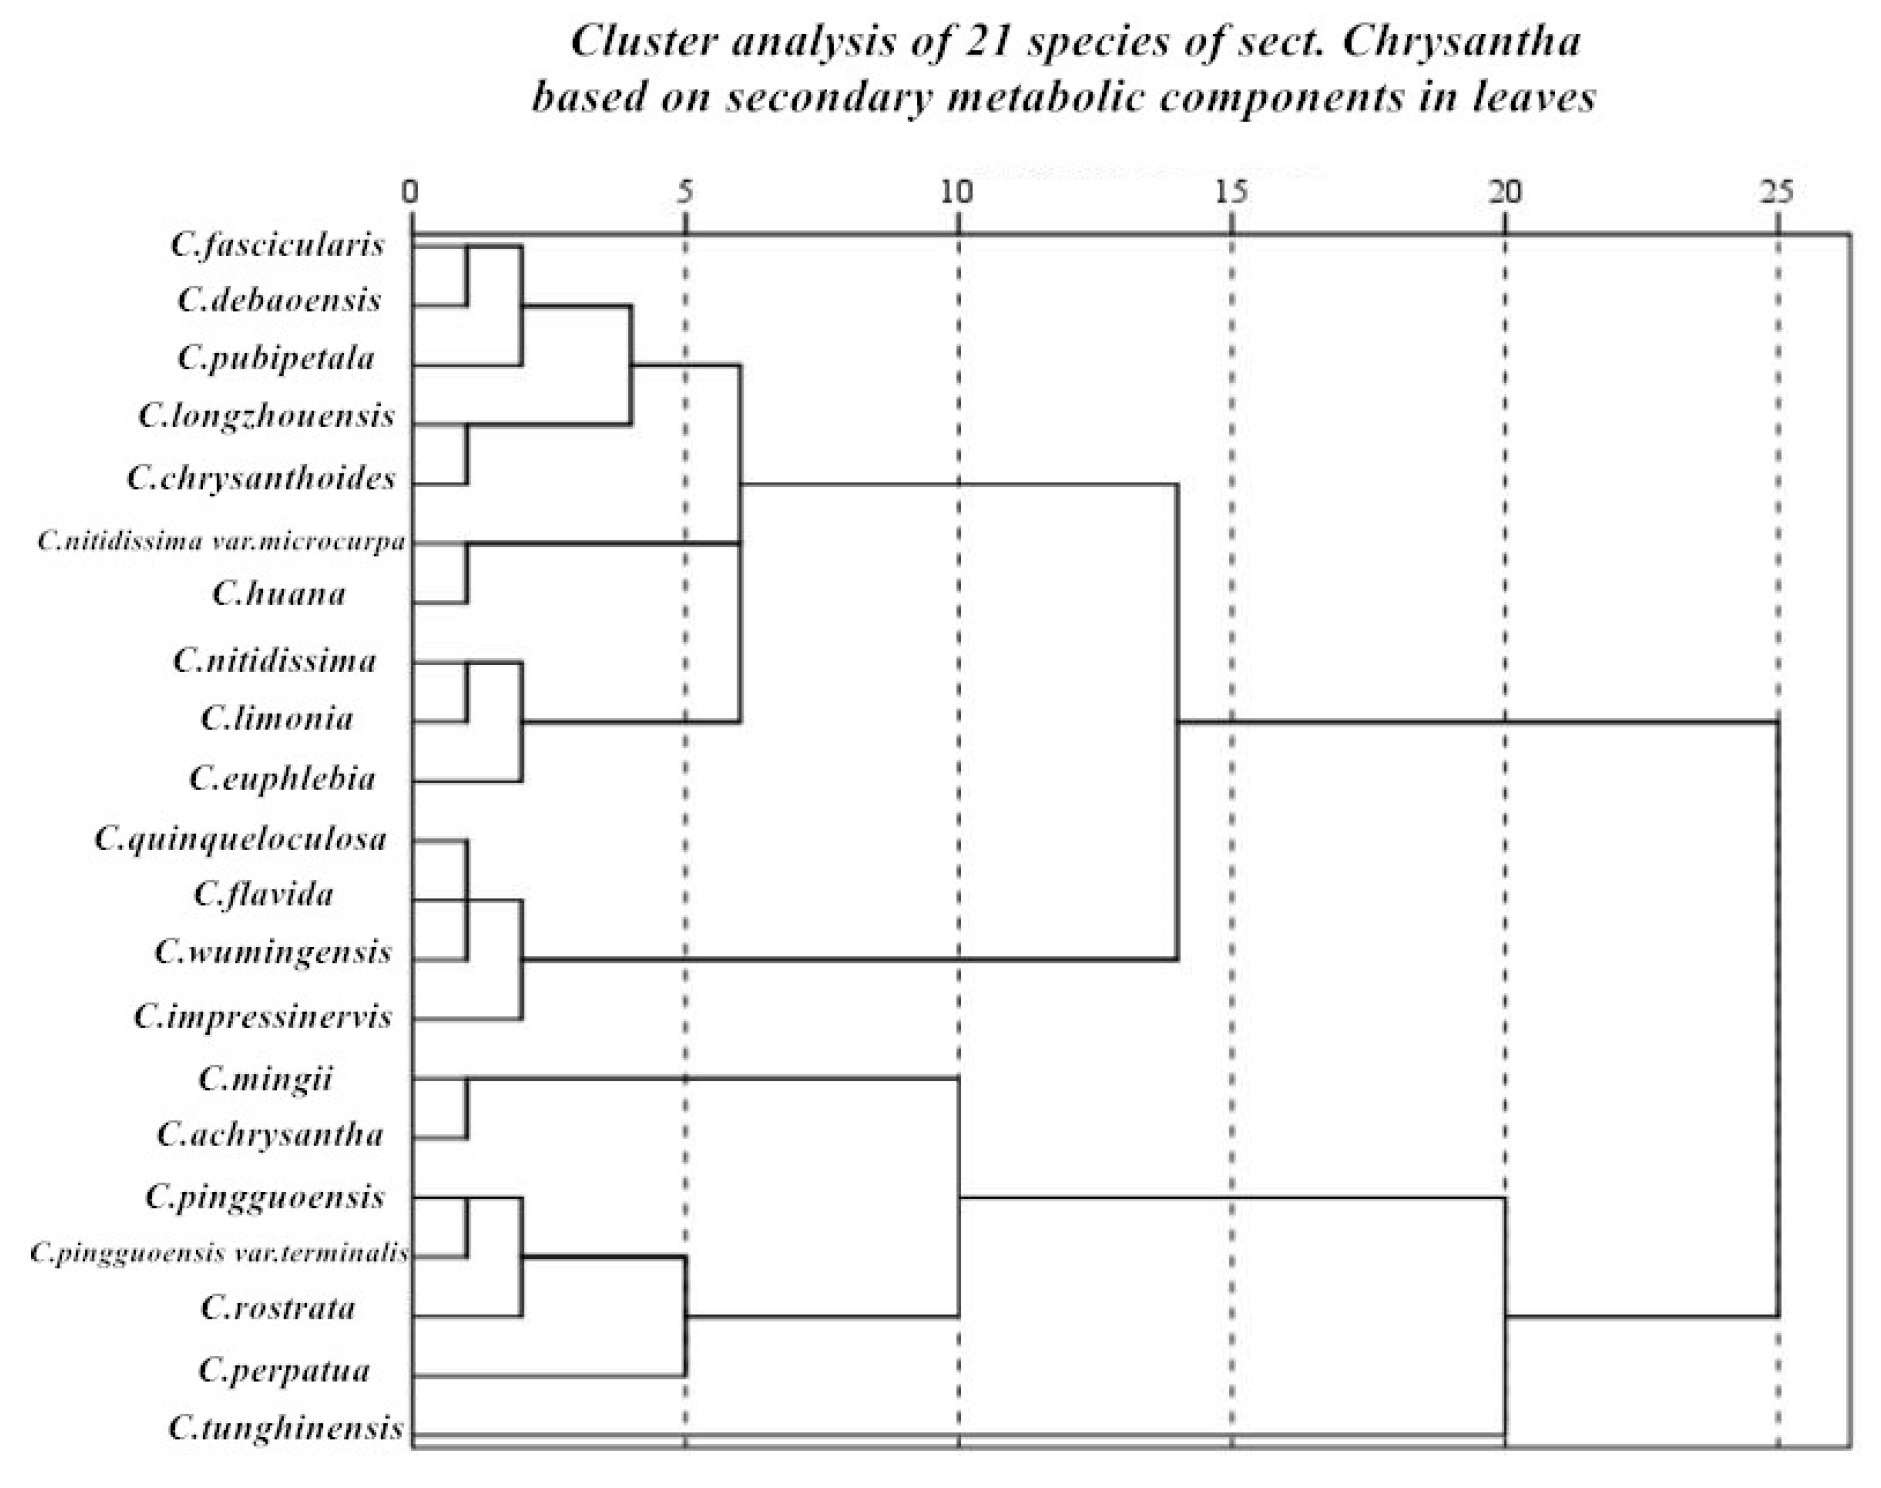
Table 2.
Variance analysis of active ingredient contents in 21 species of Sect.Chrysantha leaves.
| Sum of Squares | Degrees Freedom | Mean Squared | F | |
| TPC | 73.887 | 20 | 3.694 | 2611.273 |
| TEA | 0.056 | 20 | 0.003 | 67.339 |
| TAC | 228.147 | 20 | 11.407 | 10434.302 |
| TFC | 410.428 | 20 | 20.521 | 33039.545 |
Disclaimer/Publisher’s Note: The statements, opinions and data contained in all publications are solely those of the individual author(s) and contributor(s) and not of MDPI and/or the editor(s). MDPI and/or the editor(s) disclaim responsibility for any injury to people or property resulting from any ideas, methods, instructions or products referred to in the content. |
© 2023 by the authors. Licensee MDPI, Basel, Switzerland. This article is an open access article distributed under the terms and conditions of the Creative Commons Attribution (CC BY) license (http://creativecommons.org/licenses/by/4.0/).
Copyright: This open access article is published under a Creative Commons CC BY 4.0 license, which permit the free download, distribution, and reuse, provided that the author and preprint are cited in any reuse.


