Submitted:
06 October 2023
Posted:
09 October 2023
Read the latest preprint version here
Abstract
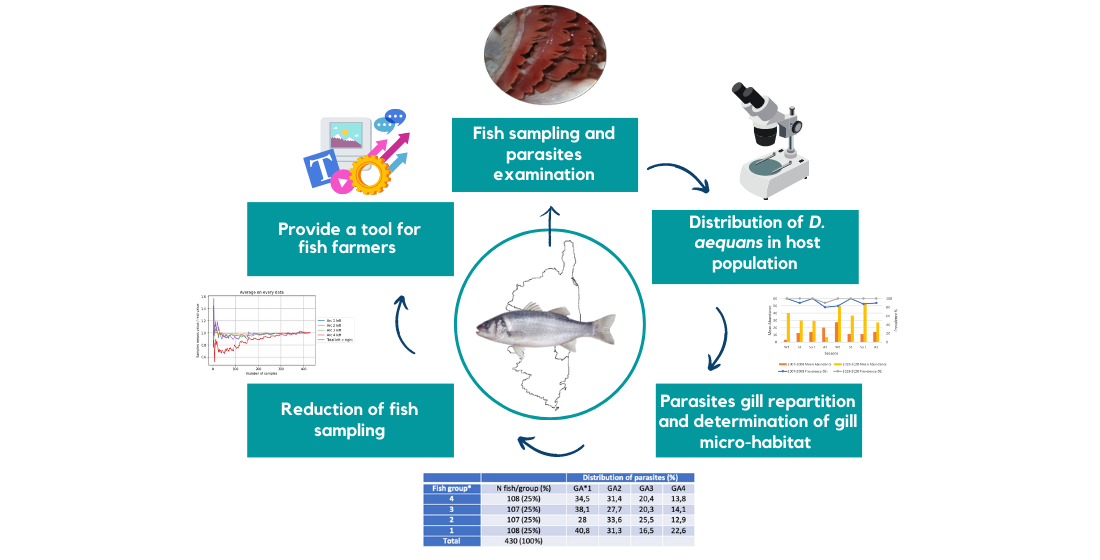
This work focused on Diplectanum aequans, a gill parasite of Dicentrarchus labrax. Analyzes allowed us to detect factors regulating parasites distribution on Corsican fish-farms, and to highlight the ecological structure of D. aequans communities on gills of fish. The study of parasite distribution showed that bigger fish appear more parasitized and that the infection dynamics of D. aequans can be explained by several factors such as biotic factors or farm environment conditions. The study of gill repartition of D. aequans showed that parasites tend to have a homogeneous distribution with no statistically significant difference in infection between two sides on each fish. However, the distribution of the number of parasites on gill arches varies according to the total number of parasites. Results differ depending on infection degree and host weight. When parasites are numerous, the individuals are distributed on the gill arches according to an antero-posterior gradient, while with low rates of infection, the parasites are randomly distributed on the 4 arches. The spatial distribution of D. aequans appears to be determined by the differential action of water flow through gill arch and the size of anterior arches. We also proposed a tool in order to reduce the sampling effort and allow optimal exploitation for fish farmers.
Keywords:
aquaculture
; disease control
; Monogenea
; Plathyelminths
; population dynamics
; ecological study
; sampling effort
1. Introduction
Culture marine fish species represents a considerable economical source in the Mediterranean area [1,2,3]. However, infectious diseases are the major impediment to the development of aquaculture and are often the most significant cause of economic losses.
The European sea-bass Dicentrarchus labrax is the most important cultured marine fish species raised in Corsica, which is the first French producing region of adult fish from mariculture. The production cycle of D. labrax is well-known and differ from the other countries [4]. Corsican fish farmers use marine cage culture and have chosen to be a part been of a sustainable aquaculture model since 2006 (low densities, no antibiotic treatments, longer breeding time). Marine cage culture has several advantages than intensive farming because fish evolve in an environment close to the natural environment. However, disease outbreaks cause by pathogens, including Monogenean flatworms, can occur extremely rapidly, resulting in a reduction of fish health or significant mortalities on a very short time. Massive infections have been already observed in fish farms from the Mediterranean basin and heavy mortalities were also reported in Corsican fish farms [5,6,7].
Earlier studies have shown that D. labrax can be a long-term host of the genus Diplectanum, especially Diplectanum aequans (Wagener 1857) Diesing 1858 (Monogenea, Diplectanidae). It had been since long time identified on the gills of cultured fish from Mediterranean countries [8,9,10,11,12]. D. aequans is known to have negative effects on their hosts [13,14,15]. It can be responsible of extensive mucus hypersecretion and swelling especially on the apical portions of the secondary gill lamellae. This effect is revealed by an hyperplasia of the gills tissue around the haptor fixation and hemorrhages on the hook insertion points [12,16]. In addition, chronic infections make fish more vulnerable to environmental conditions and more susceptible to secondary pathogens. Some individuals, weakened by parasitic infection, may provide a breeding ground for secondary bacterial infections or viruses. Monogeneans can also be responsible of a mechanical blockage of water flow and gas exchange by the entangled mass of flatworms causing severe respiratory disturbances leading to fish death [5]. In our previous studies, we have already highlighted seasonal variations in D. aequans distribution and host-age dependent occurrence of parasites. D. aequans had highest biological parasitic indices in winter and fall, and the oldest fish appeared to be more parasitized.
This work is a part of a context of sustainable aquaculture and the objective are to exchange knowledge and pool research efforts with Corsica fish farmers, based on an ecosystem approach to aquaculture and contributing to the development of a blue economy, respectful of ecosystems and their biodiversity. Specifically, the objectives are: (i) to establish a comparison between two parasitological surveys with a ten-year interval in order to understand the evolution of D. aequans populations (ii) to analyze the structure of monogenean populations (iii) to study gill repartition of monogeneans and determine gill micro-habitat according to preferential gradients (iiii) to purpose a predictive tool that would reduce sampling effort and allow optimal exploitation for fish farmers.
2. Materials and methods
2.1. Fish Sampling and parasites examination
Two separate parasitological surveys were conducted in 2007-2008 and 2019-2020 on three Corsican fish farms. Among the fish intended for sale and consumption, we have recovered a total of 430 common sea bass D. labrax for analysis. We sampled ten specimens per seasons for farm 1 and farm 2, and five to ten specimens for farm 3. Names of fish farms are not revealed for reasons of confidentiality: each farm is designated by a number (Figure 1). The fish were randomly collected from marine cages and immediately killed by fish farmers before any utilization. No approval from the ethic committee of the Research Ministry is thus necessary. The fish were placed individually in plastic bags after fishing, and maintained on ice until dissection.
Before dissection, biometrical measures (weight, length), sex and maturity stage of each specimen were recorded. Body surface (skin, fins) and gills cavities were observed.
Gill arches were carefully removed and studied in fresh conditions. Arches were separated (four right, four left), immersed in Petri dishes containing 37‰ NaCl solution and individually examined. Once the general observation is complete, the gill filaments are “combed” using fine pliers in order to remove mucus. This mucus is then distributed in the petri dish to facilitate the search for parasites. In order to have consistent and significant results we collected our samples still in the same cage for each farm throughout the study. Parasites were examined alive in fresh conditions and fixed in 75% ethanol solution labelled and stored in the laboratory collection. Parasite determination were made using a light microscope according to morphological description done in previous studies [8,16].
Measurements of water temperature were collected daily from fish-farmers (public data). A seasonally mean temperature was calculated for each farm (Table 1).
2.2. Statistical analyses
Parasite distribution was studied by season for all sampling years. The level of parasite infection expressed as prevalence (proportion of infected hosts), abundance (mean number of parasites of both infected and uninfected fish) and mean intensity (mean number of parasites of infected hosts) were calculated and applied according to Bush et al. [17]. Comparison of prevalence values according seasons were performed with a chi-square test (χ2) using R software. Non-parametric Mann–Whitney U test (two groups) and Kruskal–Wallis test (more than two groups) were used to test statistical significance differences in mean abundance and mean intensity of parasites according seasons, to determine the influence of host weight (and size) on D. aequans distribution and to compare parasites distribution on gill arches [18,19]. Four weight classes were determined: WFS1 [100–250], WFS2 ]250-450], WFS3 ]450-650], WFS4 ]>650]. They include fish from the lightest (WFS1) to the heaviest (WFS4). The level of significance for all statistical tests was set at p<0.05. Calculations were performed using Systat 12 and Xlstat 2021.2.2
Linear models and convergence equations were used to describe differences in parasite loading using Python 3.5.2 (numpy 1.18.1, pandas 0.24.2).
3. Results
During the study, we collected a total of 8 609 monogeneans. D. aequans was the only monogenean species identified on gill arches of cultured sea bass used for this work. Parasites occurred in all farms during all the years studied.
3.1. Distribution of D. aequans in host population
First, we highlight the link between the weight of fish and the parasite load. A linear curve model allowed us to distinguish 4 groups based on fish size and weight (quartiles), with each the same number of fish. The four groups are constituted by 25% (107 or 108 specimens) of the total number of fish considered in this study (430 specimens). Parasitic indices were compared from these 4 groups (Figure 2).
Prevalence values of parasitized fish are more important in WFS2 and WFS3. However, abundance and mean intensities values revealed an increasing from the group constituted by the lightest fish (WFS1) to the group constituted by the heaviest fish (WFS4) despite a high standard deviation (Table 2).
A comparison of the level of parasitic infection was made between the 2007-2008 and 2019-2020 periods for each farm. The following results show higher number of parasites during the second period (2019-2020) except for farm 3.
Farm 1 (Figure 3A,B). Values of prevalence of infected fish varied from 80 to 100% during all seasons of survey periods. These values were significantly higher during the period 2019-2020 with the increase being statistically significant (χ2, p<0.05) (Table 3). During the first period (2007-2008), highest means abundance and intensity values were recorded during late autumn and winter months, with a peak infection occurring every other winter. In contrast, the second study highlights highest rates of infection in winter as in summer. Mann-Whitney U test showed significant differences between the two survey periods (p<0.05) (Table 3).
Farm 2 (Figure 3C,D). Cumulative prevalence values over the two survey periods ranged from 60 to 100, and follow the same trend with no statistical difference (χ2, p>0.05) (Table 4). Highest means abundance and intensity values were recorded during winter months in 2007-2008, while results of second period revealed highest rates of infection during summer but these differences were insignificant (Mann-Whitney U test, p>0.05) (Table 4). Values observed in summer 2019, with a higher peak, are higher than in summer 2020 and show variability in intensities from one year to another.
Farm 3 (Figure 3E,F). Prevalence values ranged to 33 to 100%, with curves that follow almost the same trend except for spring 2019-2020. Significant differences between prevalence values of the two periods were revealed (χ2, p<0.005) (Table 5). The highest means abundance and intensity values are observed in autumn and winter during the first period (2007-2008) where the lowest are recorded in spring. The second period follows the same trend with a parasitic peak shifted from winter to spring for the second year. No statistical differences were observed between the two periods of survey (Mann-Whitney U test, p>0.05).
3.2. Parasite distribution on gills
Differences between gill arches were tested on data of the three farms during the two periods. The differences were not found to be significant between the number of parasites on the left and right gill arches from same fish. D. aequans showed an equilibrate distribution with no statistically significant difference in infection (Mann-Whitney U test, p=0.68) (Table 6).
However, finer analysis at the level of each gill arches revealed that the distribution of the number of parasites varies according to the total number of parasites and host weight (Table 7). When parasites are numerous (on biggest fish, Fish group 3 and 4), the individuals are distributed on the gill arches according to an antero-posterior gradient. Gill arches 1 (GA1) and 2 (GA2) had the highest parasite abundance and the population spreads on a decreasing gradient. The number of parasites decreases from GA1 to GA4. In contrast, the parasites appear to be randomly distributed on the 4 arches on smaller fish with low rates of infection (Fish group 1 and 2). These difference in distribution were statistically significant (Mann-Whitney U test, p<0.05).
Our observations also revealed that juveniles are preferentially localized at the base of the gill filaments and were isolated, while adults are mainly localized at the end of the filament and aggregated in groups of 4 to 5 individuals. Our data allow us to observe that regardless of the groups and treatments performed, the number of parasites present on the left gill arches is equivalent to the number of parasites present on the right arches. These results, while clear at the scale of a sample set, can be highly variable at the individual level. Thus, it does not seem humanly possible to determine the number of parasites present on the right side of a given fish knowing the number of parasites present on the left side and conversely. A set of machine learning algorithms was also tested for this purpose but the results were inconclusive on this study.
In addition, it seems interesting for future campaigns to determine whether the number of samples can be reduced while maintaining the observation of similar results.
We therefore propose to recalculate the previous analyses from sub-samples in order to compare them with the results of the total sample and to judge the number of samples that would have been necessary to obtain the latter. Figure 4 shows the change in the ratio of the mean number of parasites in the sub-sample to the mean of all samples based on the number of samples selected for all farms and years (totals and on the left arcs only for legibility). A value of 1 therefore corresponds to equivalent results between total population and sub-sample. It can be observed that from about 300 samples out of 430 all the results are very close to the results obtained on all the samples.
However, due to the random nature of sub-sampling, these results may vary. It is then necessary to perform a large number of replicates in order to calculate the probability of observing these results correctly according to the number of samples. Our sampling campaign consisted of a sampling of 10 fish per farm per sampling date. Thus, in the following analysis, we propose to test the reduction in sampling effort by reducing the number of fish taken per sampling day (from 1 to 10, that is, the present value of the sampling plan). In order to automate the likelihood judgment of replicates, we also propose to set different threshold values (5, 10 and 15%), thus allowing to calculate the probability of obtaining the same results at this threshold value according to the number of fish collected. Figure 5 shows the results obtained with different threshold values set at 5 (Figure 5a), 10 (Figure 5b) and 15% (Figure 5c). It is observed that with a sampling of 9 fish per day of sampling, it is safe to obtain the same value of the number of total parasites to within 5% (i.e., for an X value, there is a 100% chance of getting a value between [0.95 X, 1.05 X]). However, the values observed on arcs 1, 2 and 3 are equivalent to about 5% only between 80 and 85% of the time.
4. Discussion
The present study is a useful tool considered like a cultured fish population long-term monitoring. Various patterns of parasitic dynamic in response to seasonal factors or site sampling have been reported. Environmental factors (including temperature and salinity) associated with biotic factors (such as physiological changes in the host) are the most frequent causes suggest to explained fluctuations of parasitic infections [20,21,22,23,24]. D. aequans was collected only on D. labrax. He was not found on the other species reared in same farms.
4.1. Distribution of D. aequans in host population
Results showed that bigger fish appear to be more parasitized. This positive correlation between fish age (and therefore size) and parasitic abundance has already been demonstrated in various ectoparasite studies [25,26]. In addition, large mortalities in older cultured sea-bass caused by pathogens have been observed in the Mediterranean basin [25]. However, there appears to be no minimum weight for D. labrax to develop a parasitic infection. Experiments conducted by Silan and Maillard [27] demonstrated that 15-day alevins could be parasitized with D. aequans larvae.
Similarly, to other organisms, aquatic parasites have specific temperature optima for completion of their life cycles [28]. In 2007-2008 survey, trends showed that D. aequans had highest mean intensity values during late autumn and winter for all farms studied, corresponding with a decrease of water temperature. Minimum values were recorded during summer months. Similar results with parasitic infection occurring during winter season were also revealed in Spain [29]. However, results for 2019-2020 showed that mean intensity values of D. aequans do not follow the same trend, with maximum values recorded during spring and summer months. These fluctuations in rates of infections showed that water temperature, which generates a definite seasonal cycle, has a great influence on the population dynamics of parasites. Previous studies highlighted the influence of temperature on the incubation time. D. aequans eggs subjected to different temperatures (between 15 and 23°C) showed different hatching times. The time is in the order of 7 to 15 days at 15-16°C versus 5 to 7 days at 20-21°C. 4 to 5 days are sufficient beyond 21°C [27,30]. These results have been confirmed by Cecchini et al. [12], which mentioned that all developmental stages of D. aequans are temperature dependent. As the temperature increase, the time to reach sexual maturity become shorter. In case of our study, the range extension and high prevalence of D. aequans follow seasonally warm winters in Corsica, associated with warmer sea surface temperature that permit overwinter survival. This may be accentuated by having several generations. If the optimal conditions are extended in the season, they are likely to provide a longer window for parasitic infections and this may lead to more generations of parasites over the seasonal cycle [31,32]. Changes in water temperature over the past 5 years can explain this phenomenon [33]. The Mediterranean has been indicated among the region most sensitive to climate change [34,35,36,37]. Temperature increase measured in the coastal regions during the last decades, especially in Corsica, is somewhat larger than at the global scale, with a global increase of 1.1°C in 27 years (0.04°C per year) [30,38,39,40]. Results for 2019-2020 showed also that high rates of infection with D. aequans are still observed in winter. Seasonal changes in population of D. aequans could be also the sign of a parasitic adaptation [29,41]. Climate warming can affect host–pathogen interactions by increasing pathogen development rates, transmission and number of generation times per year, directly through the ambient environment or indirectly via effects on host parameters [31,42,43,44,45,46,47].
It would seem also that the northwest of the Mediterranean Sea is becoming saltier: the salinity of the deep waters of the Gulf of Leo is increasing at the rate of 0.007 psu/decade [47]. Mladineo [30] mentioned that salinity is an important environmental factor involved on D. aequans development. Less saline locations near river have considerably lower prevalence and abundances values. This can explain our results for farm 3, which is located in a zone of shallow depth, near a freshwater supply. The contributions of continental fresh water generate vertical stratifications that can modify the parameters of temperature and salinity rates. Moreover, the presence of the Copepoda Lernanthropus kroyeri, only collected on farm 3, can suggest a direct interspecific competition explaining lower rates of D. aequans. Copepods require concentrations in salt less important than monogeneans [48,49].
Many authors showed that high densities living conditions and the closeness from a cage to other one can facilitate parasite infestation [50,51,52]. However, this parameter cannot be considered here because densities in cages rarely exceed 20 kg/m3. Corsican fish farmers have made the choice to have fewer fish in the cages to produce better. The 10-year decline now makes it possible to say that lower densities ensure best production and more economic returns, with less mortalities. Hudson et al. [52] also reported that the rate of encounter between hosts and a pathogen can be lower with low densities, resulting in slower rate of infestation. D. aequans appear to be highly specific for sea-bass [10] and our first study highlighted that wild fish collected around cages were not parasitized with this parasite species. We can therefore rule out the hypothesis of a parasitic transfer resulting from the presence of wild fish around fish cages. We can then assume that the alevins were already infested with parasites when they were transferred to the open sea cages. This has already been highlighted in Italian fish-farms. Ravenni [53] demonstrated that larvae and alevins of D. labrax can be infected with D. aequans in hatcheries, with closed water circuit systems.
4.2. Parasite distribution on gills
The difference between the number of parasites on the right and left gills was not significant. Our results are consistent with previous studies on D. aequans distribution on fish gills [54,55]. All gill arches were colonized in all groups of fish (smaller and bigger). D. aequans occurs in four gills arches but his distribution is not uniform, depending on abundance of parasites.
Our results revealed that the distribution of the number of parasites varies according to the total number of parasites and host weight. The parasites appear to be randomly distributed on the 4 arches on smaller fish with low rates of infestation, while in larger fish parasites are mainly reported on gill arches 1 and 2 for according to an antero-posterior gradient (1>2>3>4). This preferential distribution can be explained by the centrifugal migration of individuals over the next branchial arch as the number of parasites increases. Microhabitat distribution appear to be intensity dependent [56].
In fact, previous studies reported that highest parasites abundance were more frequently identified on the first and middle gill arches and lowest on the fourth gill arch, which is the smallest one [57]. Some authors revealed that monogeneans distribution is correlated with the area on some gill arches that allows more parasites to attach to them [58,59]. Our study revealed that for smaller fish (with lower rates of infestation), parasites have an equal statistical distribution, with a random pattern on the four gill arches. Simkova et al. [60] explain that such low levels of infestation result from the fact that niches are always available on the gill biotope. In contrast, the specific gradient identified on bigger fish (with higher rates of infestation) showed that arches 1 and 2 were most infested due to the large colonizing gill surface. This gradient also may be the result of parasite interactions. It can be explained by the fact that D. aequans could have an interspecific competition for space, food and reproduction on available gill surface [61].
Some authors showed that the spatial distribution of Monogenea is also determined by the differential action of water flow through the gill arches [62,63]. Also, differences in water current over all the four gills have been considered to be important in determining the distribution of parasites on the gills [64,65,66]. Gobbin et al. [67] mentioned that parasites were distributed along a specific gradient in order to promote exposure of egg clutches to water flow.
The results obtained in order to reduce the sampling effort and allow optimal exploitation for fish farmers show many things. We found that by accepting a 10% difference, 8 fish per sample is sufficient to obtain results similar to those of a full study. However, it is important to ensure that a reduction in sampling effort does not impact the results of the different sites and years of observation. A careful optimization of fish sampling can ensure a good quality of collected data with limited sampling effort. On the other hand, having equivalent intensity values between the left and the right gills shows that only one side could be analyzed to reduce the sampling effort. Other statistical tests must therefore be carried out to confirm our hypothesis. It should also be taken into account that even if the results are equivalent, the reduction in the number of samples inevitably leads to a lower robustness of the statistical analyses. It is therefore up to the scientist to judge the relevance of reduction of sampling effort in relation to these observations. In fact, sampling efforts may vary depending on the survey objectives.
Author Contributions
Conceptualization: Laetitia MASALA-ANTONELLI and Quentin GODEAUX; Formal analysis: Laetitia MASALA-ANTONELLI and Quentin GODEAUX; Funding acquisition: Laetitia MASALA-ANTONELLI; Investigation: Laetitia MASALA-ANTONELLI, Quentin GODEAUX and Yann QUILICHINI; Methodology: Laetitia MASALA-ANTONELLI and Quentin GODEAUX; Project administration: Laetitia MASALA-ANTONELLI and Yann QUILICHINI; Software: Nicolas POIRON-GUIDONI and Paul-Antoine BISGAMBIGLIA; Validation: Laetitia MASALA-ANTONELLI, Nicolas POIRON-GUIDONI, Paul-Antoine BISGAMBIGLIA and Yann QUILICHINI; Writing-original draft: Laetitia MASALA-ANTONELLI; Writing–review and editing: Yann QUILICHINI. All authors have read and agreed to the published version of the manuscript.
Funding
This research was funded by the Syndicat des Aquaculteurs Corses, Mare & Stagni Corsi, as part of a research collaboration with the University of Corsica.
Institutional Review Board Statement
Ethical review and approval were not necessary since the fish used in this study were dead and obtained from the aquaculture sector, destined for human consumption.
Data Availability Statement
The raw data which supports this study are available from the corresponding author at reasonable request.
Acknowledgments
we are grateful to Corsican fish-farmers for providing us fish sampling.
Conflicts of Interest
The authors declare no conflict of interest.
References
- F.A.O. The state of world fisheries and aquaculture. Published by FAO. Rome, 2020; p. 244.
- Lanza, G.R.; Wilda, K.M.; Bunluesin, S.; Panich-Pat, T. Green Aquaculture: designing and developing aquaculture systems integrated with phytoremediation treatment options. Phytoremediation. 2017, 5, 307–323. [Google Scholar]
- Massa, F.; Onofri, L.; Fezzardi, D. Aquaculture in the Mediterranean and the Black Sea: a Blue Growth perspective. Nunes PALD, Svensson LE, Markandy A (Eds). Handbook on the Economics and Management of Sustainable Oceans, Edward Elgar Publishing, Cheltenham and Northampton, UK, 2017; pp. 93–123.
- Mare & Stagni Corsi. Syndicat des Aquaculteurs Corses. Cahier des charges Label Rouge LA 01-11« Bar d’aquaculture marine ». 2011, p. 29.
- Lia, R.P.; Zizzo, N.; Tinelli, A.; Lionetti, C.; Cantacessi, C.; Otranto, D. Mass mortality in wild greater amberjack (Seriola dumerili) infected by Zeuxapta seriolae (Monogenea: Heteraxinidae) on the Jonian Sea. Bull. Eur. Ass. Fish. Pathol. 2007, 27, 108–111. [Google Scholar]
- Merella, P.; Cherchi, S.; Garippa, G.; Fioravanti, M.L.; Gustinelli, A.; Salati, F. Outbreak of Sciaenacotyle panceri (Monogenea) on cage-reared meagre Argyrosomus regius (Osteichtyes) from the western Mediterranean Sea. Dis. of Aquat. Org. 2009, 86, 169–173. [Google Scholar] [CrossRef] [PubMed]
- Ternengo, S.; Agostini, S.; Quilichini, Y.; Euzet, L.; Marchand, B. Intensive infestations of Sciaenocotyle pancerii (Monogenea, Microcotylidae) on Argyrosomus regius (Asso) under fish farming conditions. J. Fish. Dis. 2010, 33, 89–92. [Google Scholar] [CrossRef]
- Antonelli, L. Impact du parasitisme sur la pisciculture en Corse. Suivi des parasitoses et étude des transferts de parasites depuis la faune sauvage vers les poissons élevés en mer ouverte. Thèse, Université de Corse, Pasquale Paoli, 2010.
- Antonelli, L.; Marchand, B. Metazoan parasites of the European sea bass Dicentrarchus labrax (Linnaeus 1758) (Pisces: Teleostei) from Corsica. In: Health and Environment in Aquaculture. Edited by Edmir Daniel Carvalho, Gianmarco Silva David and Reinaldo J. Silva, InTech, 2012; pp. 43–62.
- Dezfuli, B.S.; Giari, L.; Simoni, E.; Menegatti, R.; Shinn, A.P.; Manera, M. Gill histopathology of cultured European sea bass, Dicentrarchus labrax (L.), infected with Diplectanum aequans (Wagener 1857) Diesing 1958 (Diplectanidae: Monogenea). Parasitol. Res. 2007, 100, 107–113. [Google Scholar] [CrossRef]
- Bragoni, G.; Romestand, B.; Trilles, J.P. Parasitoses à Cymothoidiens chez le loup Dicentrarchus labrax Linnaeus (1758) en élevage. 1. Ecologie parasitaire dans le cas de l’étang de Diana (Haute-Corse) (Isopoda, Cymothoidae). Crustaceana. 1984, 44, 47–51. [Google Scholar]
- Cecchini, S.; Saroglia, M.; Berni, P.; Cognetti-Varriale, A.M. Influence of temperature on the life cycle of Diplectanum aequans (Monogenea, Diplectanidae), parasitic on sea bass, Dicentrarchus labrax (L.). J. Fish. Dis. 1998, 21, 73–75. [Google Scholar] [CrossRef]
- Massimo, M.; Volpatti, D.; Galeotti, M.; E Bron, J.; Beraldo, P. New insights into the host parasites interactions of Amyloodiniosis in European sea-bass: a multi modal approach. Pathogens 2022, 11, 62. [Google Scholar] [CrossRef]
- Merella, P.; Garippa, G.; Salati, F. Parasites of cage cultured European sea bass Dicentrarchus labrax and gilthead sea bream Sparus aurata from Sardinia (western Mediterranean): first results. Parassitologia. 2006, 48, 290. [Google Scholar]
- Muniesa, A.; Basurco, B.; Aguilera, C.; Furones, D.; Reverté, C.; Sanjuan-Vilaplana, A.; Jansen, M.D.; Brun, E.; Tavorpanich, S. Mapping the knowledge of the main diseases affecting sea bass and sea bream in Mediterranean. Transbound. Emerg. Dis. 2020, 67, 1089–1100. [Google Scholar] [CrossRef]
- Oliver, G. Study of Diplectanum aequans (Wagener, 1957) Diesing, 1858 (Monogenea, Monopisthocotylea, Diplectanidae) with a scanning electronic microscope. Z. Parasitenkd. 1976, 51, 91–98. [Google Scholar] [CrossRef]
- Bush, A.O.; Lafferty, K.D.; Lotz, J.M. Parasitology meets ecology on its own terms: Margolis et al. revisited. J. Parasitol. 1997, 83, 575–583. [Google Scholar] [CrossRef] [PubMed]
- Dagnelie, P. Analyses statistiques à plusieurs variables, Presses agronomiques de Gembloux, Bruxelles. 1975.
- Sprent, P. Pratique des statistiques non paramétriques, Institut National de la Recherche Agronomique, Paris. 1992.
- Gonzalez-Lanza, C.; Alvarez-Pellitero, P.; Sitjà-Bobadilla, A. Diplectanidae (Monogenea) infestations on sea bass, Dicentrarchus labrax (L.), from the Spanish area. Histopathology and population dynamics under culture conditions. Parasitol. Res. 1991, 77, 307–314. [Google Scholar] [CrossRef] [PubMed]
- Antonelli, L.; Quilichini, Y.; Marchand, B. Sparicotyle chrysophrii (Van Beneden and Hesse 1863) (Monogenea: Polyopisthocotylea) parasite of cultured Gilthead sea-bream Sparus aurata (Linnaeus 1758) (Pisces: Teleostei) from Corsica: ecological and morphological study. Parasitol. Res. 2010, 107, 389–398. [Google Scholar] [CrossRef] [PubMed]
- Antonelli, L.; Quilichini, Y.; Marchand, B. Biological study of Furnestinia echeneis Euzet and Audouin 1959 (Monogenea: Monopisthocotylea: Diplectanidae), parasite of cultured Gilthead sea-bream Sparus aurata (Linnaeus 1758) (Pisces: Teleostei) from Corsica. Aquaculture. 2010, 307, 179–186. [Google Scholar] [CrossRef]
- Antonelli, L.; Foata, J.; Quilichini, Y.; Marchand, B. Influence of season and site location on European cultured sea bass parasites in Corsican fish farms using indicator species analysis (IndVal). Parasitol. Res. 2016, 115, 561–568. [Google Scholar] [CrossRef]
- Winger, A.C.; Kanck, M.; Kristoffersen, R.; Knudsen, R. Seasonal dynamics and persistence of Gyrodactylus salaris in two riverine anadromous Arctic charr populations. Environ. Biol. Fish. 2008, 83, 117–123. [Google Scholar] [CrossRef]
- Cable, J.; Van Oosterhout, C. The impact of parasites on the life history evolution of guppies (Poecilia reticulate): the effects of host size on parasite virulence. Int. J. Parasitol. 2007, 13, 1449–1458. [Google Scholar] [CrossRef]
- Poulin, R.; Rohde, K. Comparing the richness of metazoan ectoparasite communities of marine fishes: controlling for host phylogeny. Oecologia. 1997, 110, 278–28. [Google Scholar] [CrossRef]
- Silan, P.; Maillard, C. Biologie comparée du développement et discrimination des Diplectanidae ectoparasites du Bar (Teleostei). Ann. Sci. Nat. Zool. Biol. Ani. 1989, 10, 31–45. [Google Scholar]
- Marcogliese, D.J. Implications of climate change for parasitism of animals in the aquatic environment. Can. J. Zool. 2001, 79, 1331–1352. [Google Scholar] [CrossRef]
- Gonzalez-Lanza, C.; Alvarez-Pellitero, P.; Sitjà-Bobadilla, A. Diplectanidae (Monogenea) infestations on sea bass, Dicentrarchus labrax (L.), from the Spanish area. Histopathology and population dynamics under culture conditions. Parasitol. Res. 1991, 77, 307–314. [Google Scholar] [CrossRef] [PubMed]
- Mladineo, M. Monogenean parasites in Adriatic cage-reared fish. Acta. Adriat. 2004, 45, 65–73. [Google Scholar]
- Callaway, R.; Shinn, A.P.; Grenfell, S.E.; Bron, J.E.; Burnell, G.; Cool, E.J.; Crumlish, M.; Culloty, S.; Davidson, K.; Ellis, R.P.; Flynn, K.J. Review of climate change impacts on marine aquaculture in the UK and Ireland. Aquat. Conserv: Mar. Freshw. Ecosyst. 2012, 22, 389–421. [Google Scholar] [CrossRef]
- Karvonen, A.; Rintamäki, P.; Jokela, J.; Valtonen, E.T. Increasing water temperature and disease risks in aquatic systems: climate change increases the risk of some, but not all, diseases. Int. J. Parasitol. 2010, 40, 1483–1488. [Google Scholar] [CrossRef]
- Gobert, S.; Fullgrabe, L.; Lejeune, P.; Marengo, M. Climate change and fisheries: the case study of Corsica, an ideal reference station in the Mediterranean Sea. Aquac. Fish. Stud. 2020, 2, 1–2. [Google Scholar]
- Adloff, F.; Somot, S.; Sevault, F.; Jordà, G.; Aznar, R.; et al. Mediterranean Sea response to climate change in an ensemble of twenty first century scenarios. Clim. Dyn. 2015, 45, 2775–2802. [Google Scholar] [CrossRef]
- Bianchi, C.N.; Caroli, F.; Guidetti, P.; Morri, C. Seawater warming at the northern reach for southern species: Gulf of Genoa, NW Mediterranean. J. Mar. Biol. Ass. U.K. 2018, 98, 1–12. [Google Scholar] [CrossRef]
- Giorgi, F. 2006. Climate change hot-spots. Geophys. Res. Lett. 2006, 33-L08707, 1–4. [Google Scholar]
- Piroddi, C.; Coll, M.; Liquete, C.; Macias, D.; Greer, K.; Buszowski, J.; Steenbeek, J.; Danovaro, R. , Christensen, V. Historical changes of the Mediterranean Sea ecosystem: modelling the role and impact of primary productivity and fisheries changes over time. Sci. rep. 2017, 7, 44491. [Google Scholar] [CrossRef]
- Parry, M.L.; Canziani, O.F.; Palutokof, J.P.; Van der Linden, P.J.; Hanson, C.E. IPCC. 2007. Climate change 2007: Impacts, Adapatation and Vulnerability. Contribution of Working Group II to the Fourth Assessment Report of the Intergovernmantal Panel on Climate Change. Cambrdige University Press, Cambridge, U.K., 2007; pp. 976.
- Kapsenberg, L.; Alliouane, S.; Gazeau, F.; Mousseau, L.; Gattuso, J.P. Costal ocean acidification and increasing total alkalinity in the Northwestern Mediterranean sea. Ocean Sci. 2017, 13, 411–426. [Google Scholar] [CrossRef]
- Scavia, D.; Field, J.C.; Boesch, D.F.; Buddemeier, R.W.; Burkett, V.; Cayan, D.R.; Fogarty, M.; Harwell, M. Climate change impacts on the US coastal and marine ecosystems. Estuaries. 2002, 25, 149–196. [Google Scholar] [CrossRef]
- Antonelli, L.; Foata, J.; Quilichini, Y.; Marchand, B. Influence of season and site location on European cultured sea bass parasites in Corsican fish farms using indicator species analysis (IndVal). Parasitol. Res. 2016, 115, 561–568. [Google Scholar] [CrossRef] [PubMed]
- Harvell, C.D.; Mitchell, C.E.; Ward, J.R.; Altize,r S. ; Dobson, A.P.; Ostfeld, R.S.; Samuel, M.D. Climate warming and diseases risks for territorial and marine biota. Science. 2002, 5576, 2158–2162. [Google Scholar] [CrossRef] [PubMed]
- Rodhain, F. Modifications climatiques : impact potentiel sur la santé, l’exemple des maladies à vecteur. Bull. Assoc. Anc. Elèves Inst. Pasteur. 2000, 162, 8–14. [Google Scholar]
- Marcogliese, D.J. 2008. The impact of climate change on the parasites and infectious diseases of aquatic animals. Rev.- Off. Int. Epizoot. 2008, 27, 467–84. [Google Scholar] [CrossRef]
- Studer, A.; Thieltges, D.W.; Poulin, R. Parasites and global warming: net effects of temperature on an intertidal host-parasite system. Mar. Ecol. Prog. Ser. 2010, 415, 11–22. [Google Scholar] [CrossRef]
- Lloret, J.; Palomera, I.; Salat, J.; Solé, I. Impact of fresh-water input and wind on landings of anchovy (Engraulis encrasicolus) and sardine (Sardina pilchardus) in shelf-waters surrounding the Ebre (Ebro) River delta (north-western Mediterranean). Fish. Oceanogr. 2004, 13, 102–110. [Google Scholar] [CrossRef]
- Godwin, S.C.; Fast, M.D.; Kuparinen, A.; Medcalf, K.E.; Hutchings, J.A. Increasing tempeartures accentuate negative fitness consequences of a marine parasite. Sci. rep. 2020, 10, 18467. [Google Scholar] [CrossRef]
- Aminot, A.; Kerouel, R. Hydrologie des écosystèmes marins: paramètres et analyses. Collection Méthodes d’analyse en milieu marin, 2004, IFREMER, p. 336.
- Devreker, D.; Souissi, S.; Winkler, G.; Forget-Leray, J.; Leboulenger, F. Effects of salinity, temperature and individual variability on the reproduction of Eurytemora affinis (Copepoda; Calanoida) from the Seine estuary: A laboratory study. J. Exp. Mar. Biol. Ecol, 2009, 368, 113–123. [Google Scholar] [CrossRef]
- Krkosek, M. Host densities thresholds and disease control for fisheries and aquaculture. Aquacul. Environ. Interact. 2010, 1, 21–32. [Google Scholar] [CrossRef]
- Farhaduzzaman, A.M.; Hanif, A.; Khan, S.; Osma, M.H.; Shovon, N.H.; Rahman, K.; Ahmed, S.B. Perfect stocking density ensures best production and economic returns in floating cages aquaculture system. J. of Aquac. Res. Development. 2020, 11, 1–7. [Google Scholar]
- Hudson, P.J.; Rizzoli, A.; Grenfell, B.T.; Heesterbeek, H.; Dobson, A.P. The ecology of wildlife diseases. Oxford University Press, Oxford. 2001, p. 216.
- Ravenni, G. Infestation by Diplectanum aequans (Wagener 1857) Diesing 1858 in cultured sea bass (Dicentrarchus labrax L.). Riv. Ital. Piscic-Ittiopatol. 1983, 167–176. [Google Scholar]
- Lambert, A.; Maillard, C. Gill repartition of two Monogenea: Diplectanum aequans (Wagener 1857) Diesing 1958 and D. laubieri Lambert and Maillard 1974 (Monogenea, Monopisthocotylea) simultaneous parasites of the sea bass Dicentrarchus labrax. Ann. Parasitol. Hum. Comp. 1975, 50, 691–9. [Google Scholar] [CrossRef] [PubMed]
- Cognetti-Varriale, A.M.; Castelli, A.; Cecchini, S.; Saroglia, M. Distribution of Diplectanum aequans (Monogenea) on the gills of intensively reared seabass (Dicentrarchus labrax, L.). Bull. Eur. Ass. Fish Pathol. 1992, 13, 13. [Google Scholar]
- Yang, T.; Liu, J.; Gibson, D.I.; Dong, A. Spatial distributions of two species of monogeneans on the gills of Siganus Fuscescens (Houttuyn) and their seasonal dynamics in caged versus wild caught-hosts. J. Parasitol. 2006, 95, 933–940. [Google Scholar] [CrossRef]
- Bagge, A.M.; Sasal, P.; Valtonen, E.T.; Karvonen, A. Infracommunity level aggregation in the monogenean communities of crucian carp (Carassius Carassius). Parasitology. 2005, 131, 367–372. [Google Scholar] [CrossRef]
- Koskivaara, M.; Valtonen, E.T.; Vuori, K.M. Microhabitat distribution and coexistence of Dactylogyrus species (Monogenea) on the gills of roach. Parasitology. 1991, 104, 273–281. [Google Scholar] [CrossRef]
- Tombi, J.; Bilong Bilong, C.F. Distribution of gill parasites of the freshwater fish Barbus martorelli Roman, 1971 (Teleostei: Cyprinidae) and tendency to inverse intensity evolution between Myxosporidia and Monogenea as a function of the host age. Rev. élev. méd. vét. Pays trop. 2004, 57, 71–76. [Google Scholar] [CrossRef]
- Simková, A.; Verneau, O.; Gelnar, M.; Morand, S. Specificity and specialization of congeneric Monogenans parasiting Cyprinid. Evolution. 2006, 60, 1023–1037. [Google Scholar]
- Morand, S.; Simková, A.; Matějusová, I.; Plaisance, L.; Verneau, O.; Desdevises, Y. Investigating patterns may reveal processes: evolutionary ecology of ectoparasitic monogeneans. Int. J. Parasitol. 2002, 32, 111–119. [Google Scholar] [CrossRef] [PubMed]
- Oliva, M.E.; Luque, J.L. 1998. Distribution patterns of Microcotyle nemadactylus (Monogenea) on gill filaments of Cheilodatylus variegatus (Teleostei). Mem. Inst. Oswaldo Cruz. 1998, 93, 477–478. [Google Scholar] [CrossRef]
- Tombi, J.; Akoumba, J.F.; Bilong Bilong, C.F. The monogenean community on the gills of Oreochromis niloticus from Melen fish station in Yaounde, Cameroon. Int. J. Mod. Biol. Res. 2014, 2, 16–23. [Google Scholar]
- Arme, C.; Halton, D.W. Observations on the occurrence of Diclidophora merlangi (Trematoda:Monogenea) on the gills of whiting, Gadus merlangus. J. of Fish. Biol. 1972, 4, 27–32. [Google Scholar] [CrossRef]
- Gutiérrez, P.A.; Martorelli, S.R. Seasonality, distribution, and preference sites of Demidospermus valenciennesi Gutiérrez et Suriano, 1992 (Monogenea: Ancyrocephalidae) in catfish. Res. Rev. Parasitol. 1994, 54, 259–261. [Google Scholar]
- Hanek, G.; Fernando, C.H. Spatial distribution of gill parasites of Lepomis Gibbosus (L.) and Ambloplites rupestris (Raf.). Can. J. Zool. 2011, 56, 1235–1240. [Google Scholar] [CrossRef]
- Gobbin, T.P.; Vanhove, P.M.; Seehausen, O.; Maan, M.E. Microhabitat distributions and species interactions of ectoparasites on the gills of cichlid fish in Lake Victoria, Tanzania. Int. J. Parasitol. 2021, 51, 201–214. [Google Scholar] [CrossRef]
Figure 1.
Location of Corsican fish farms studied.
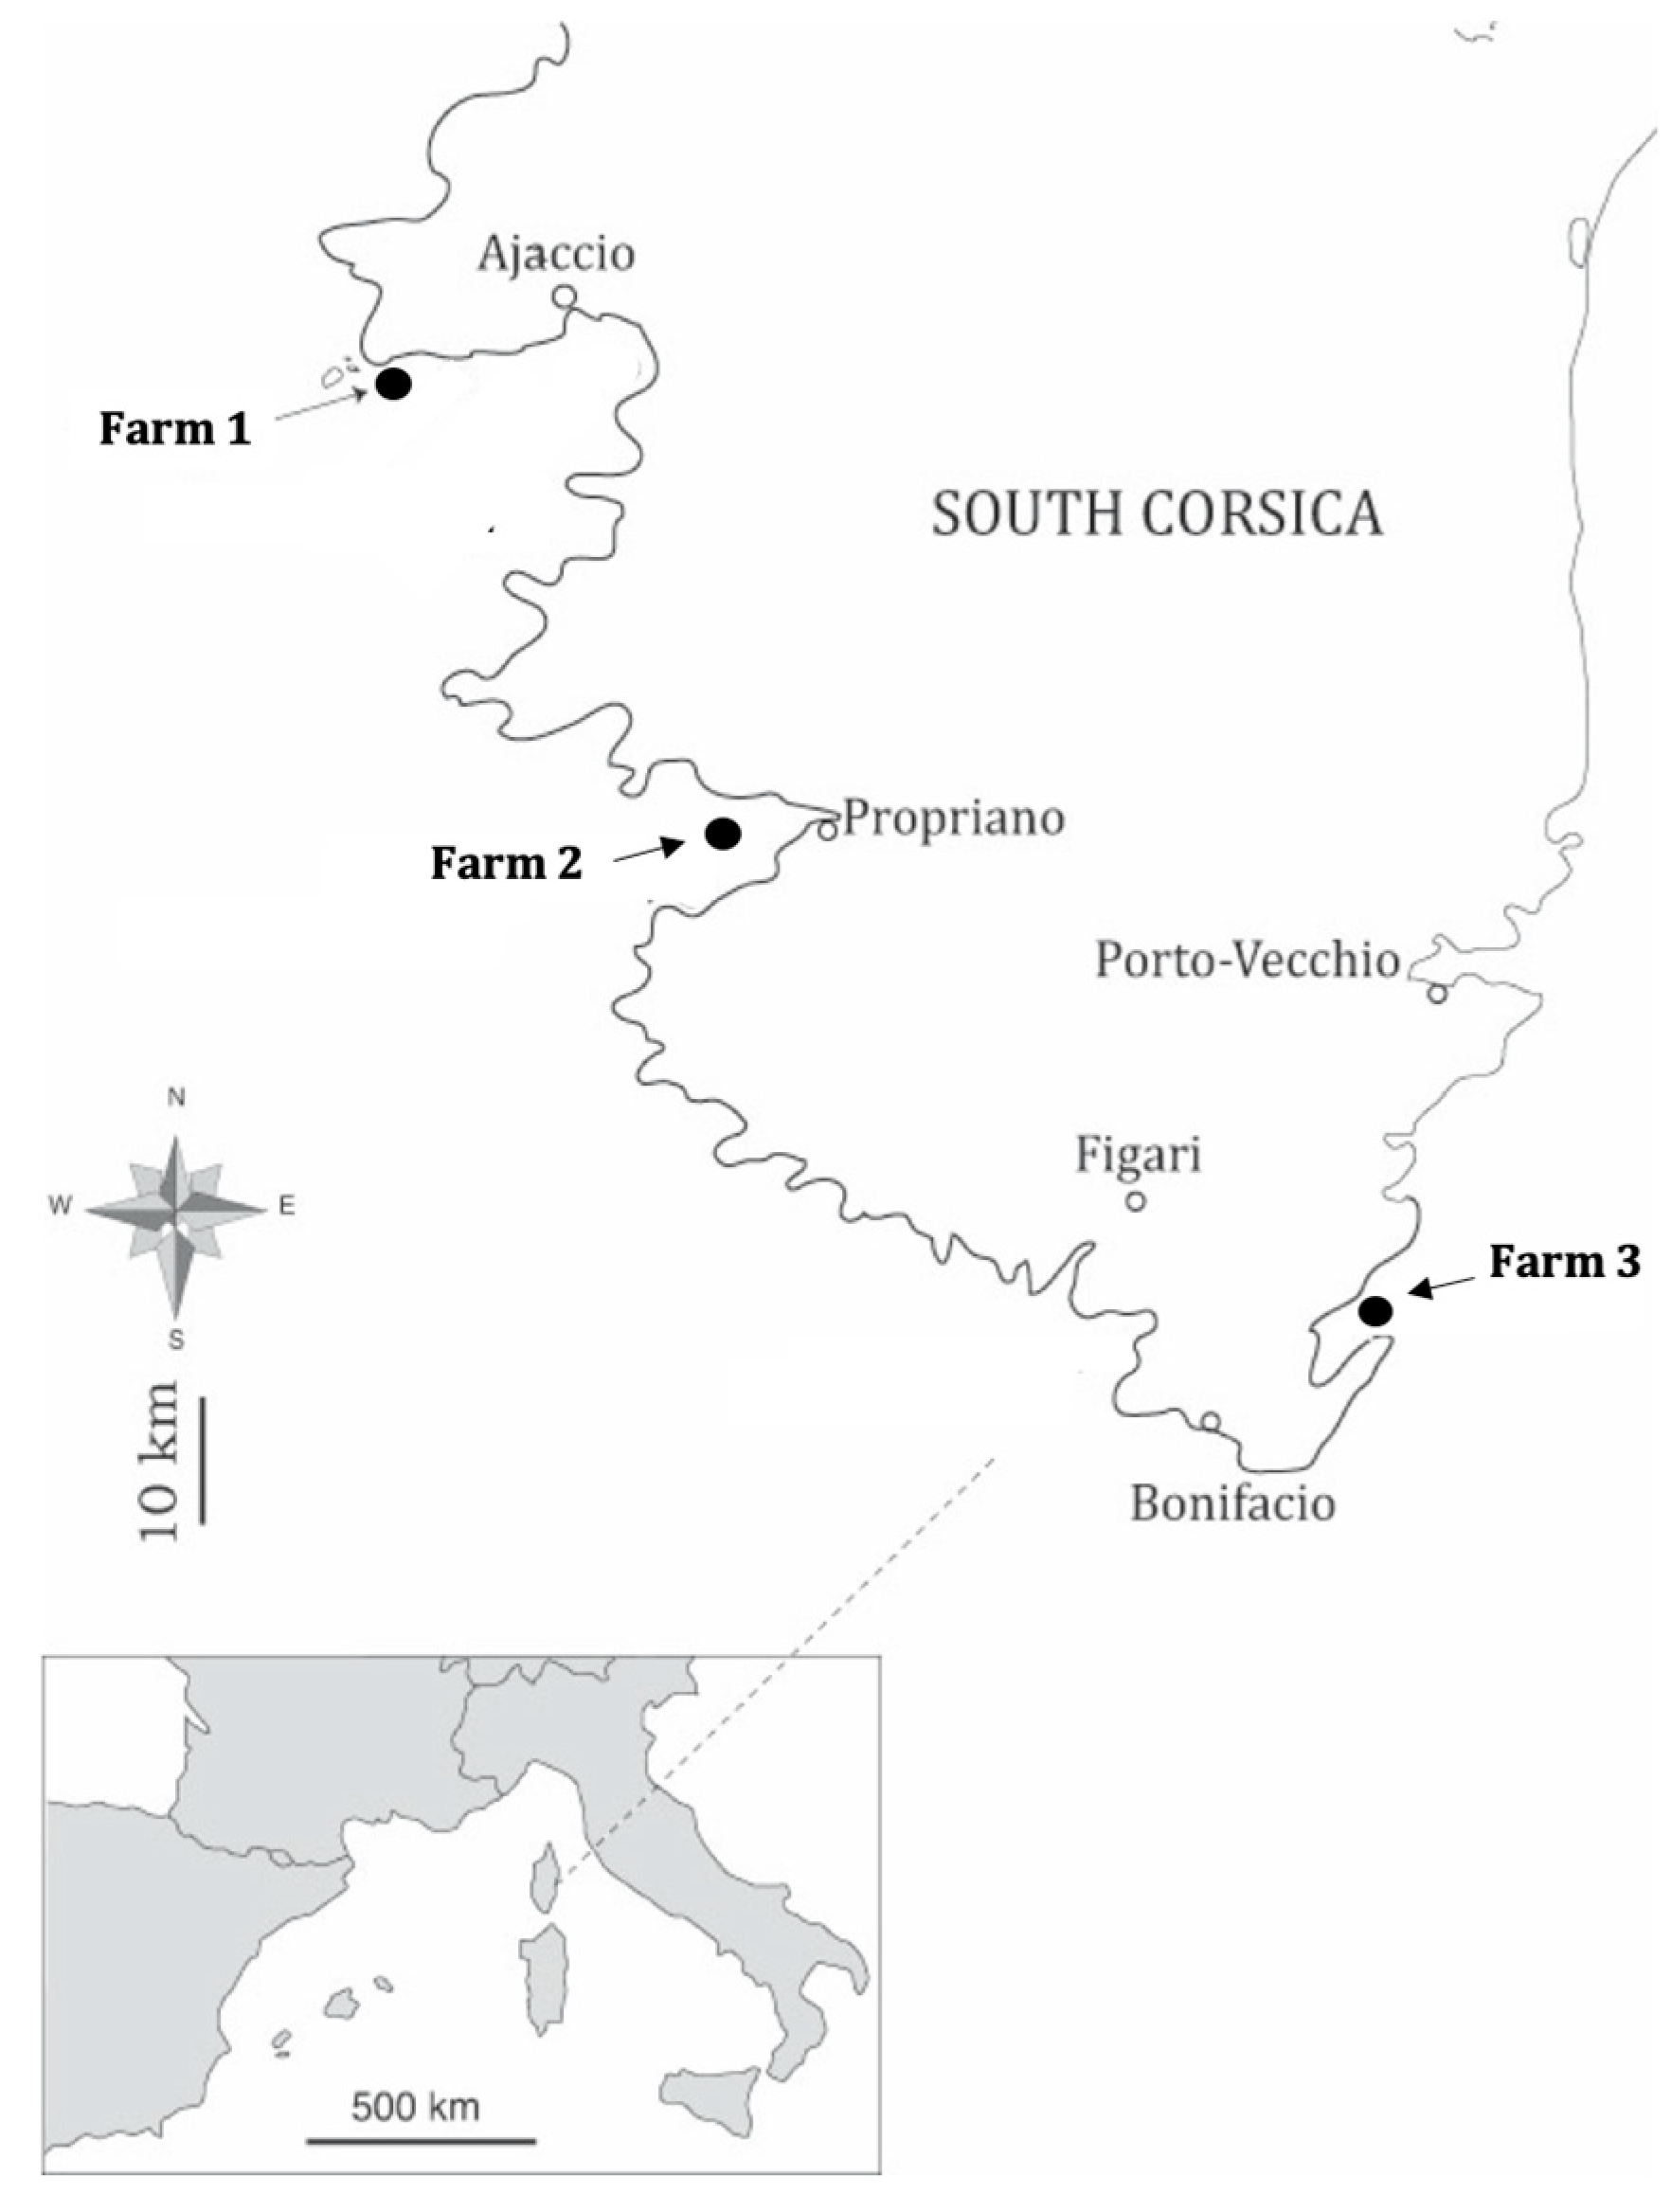
Figure 2.
Relationship between fish weight (g) and size (cm).
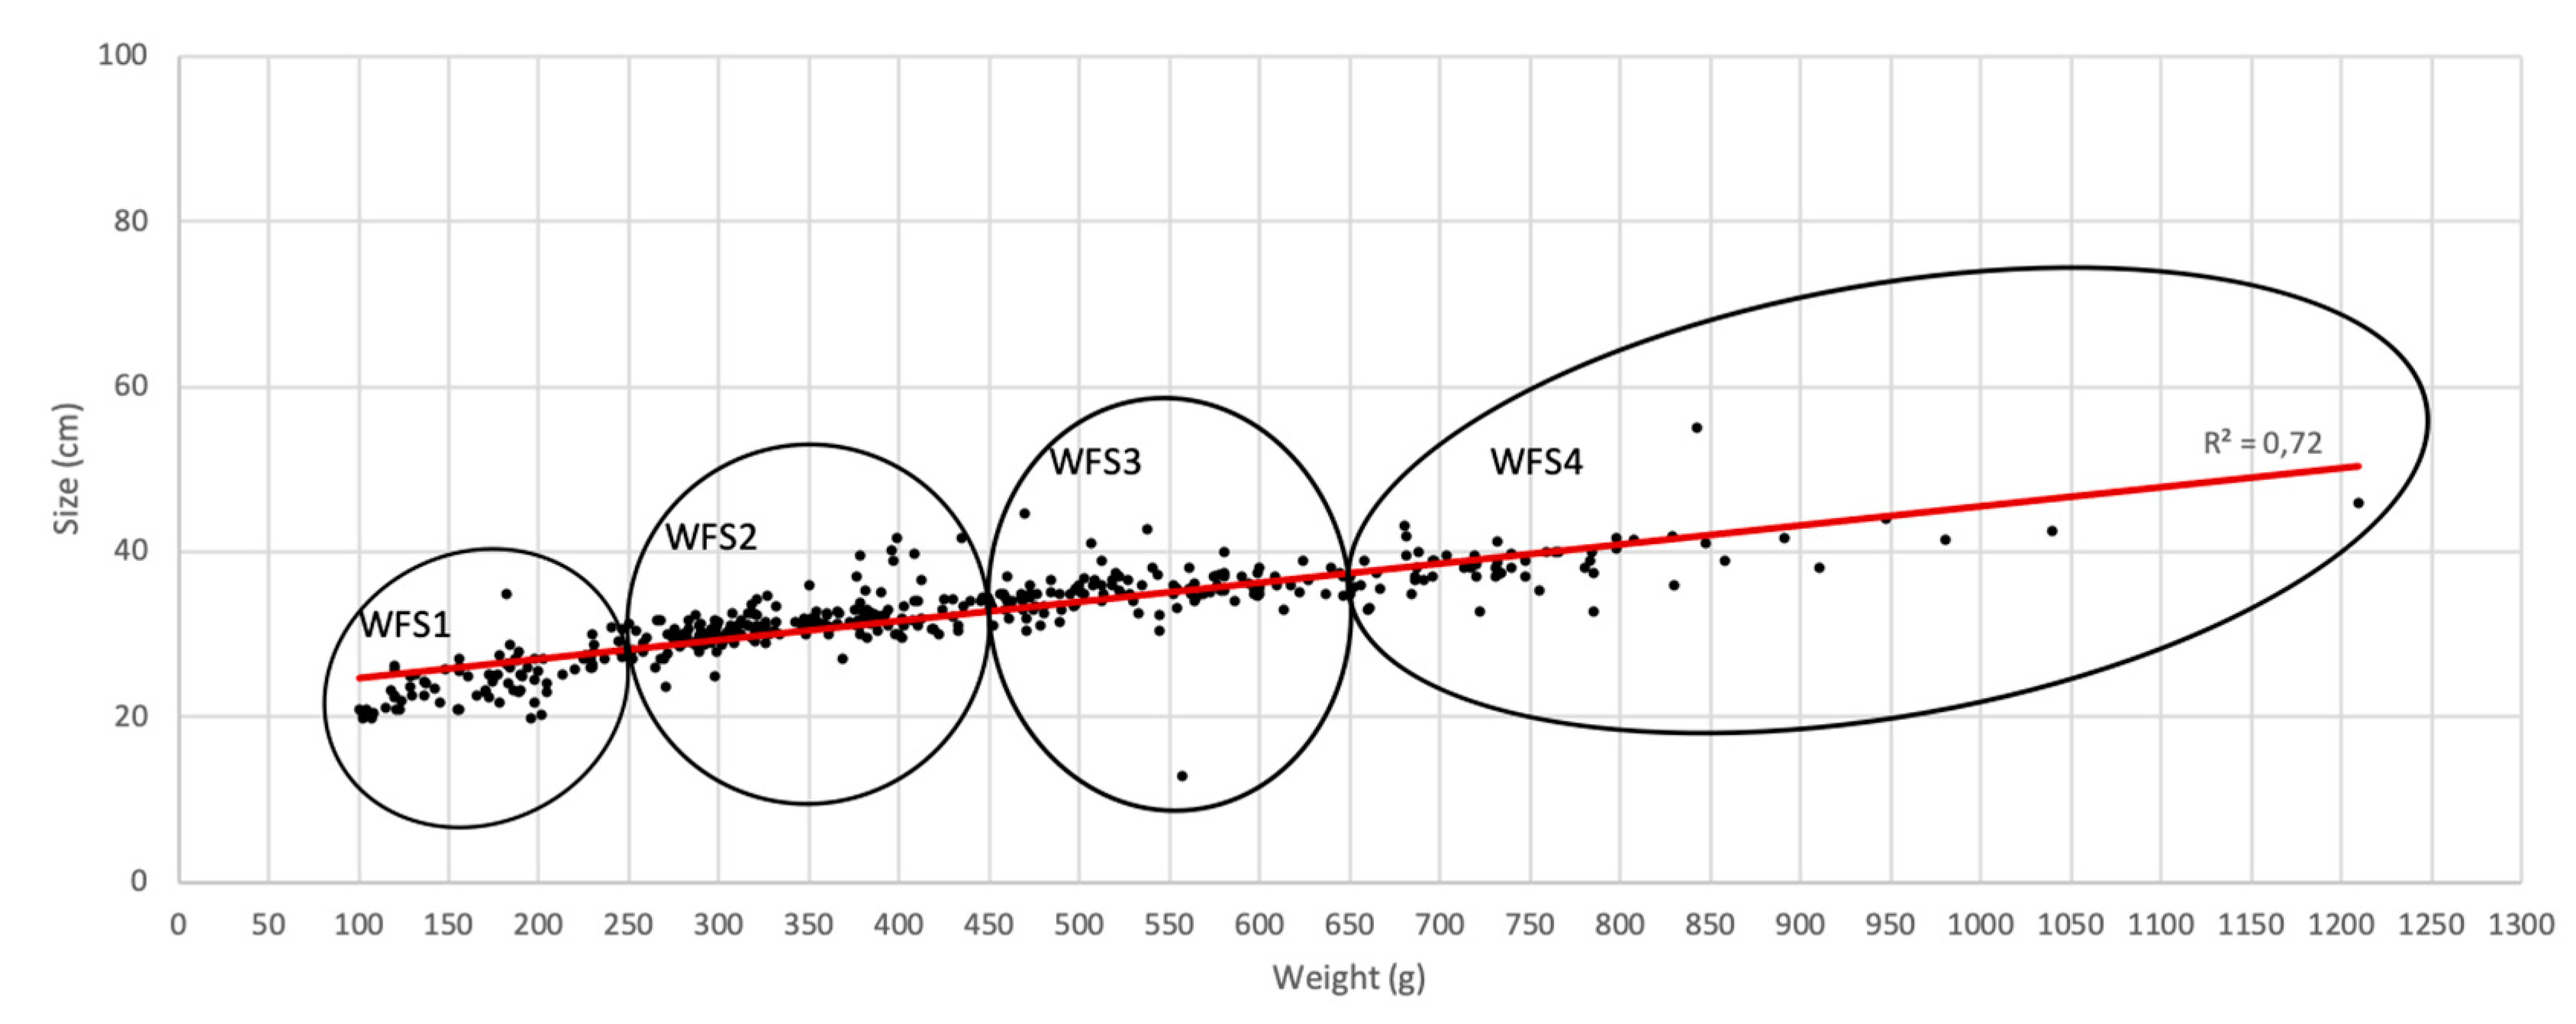
Figure 3.
Seasonal comparison of prevalence, mean abundance and mean intensity values of D. aequans between two parasitological studies for fish farm. A, B: farm 1; C, D: farm 2; E, F: farm 3. W: winter, S: spring, Su: summer, A: autumn, 1: first parasitological study (2007-2008), 2: second parasitological study (2019-2020).
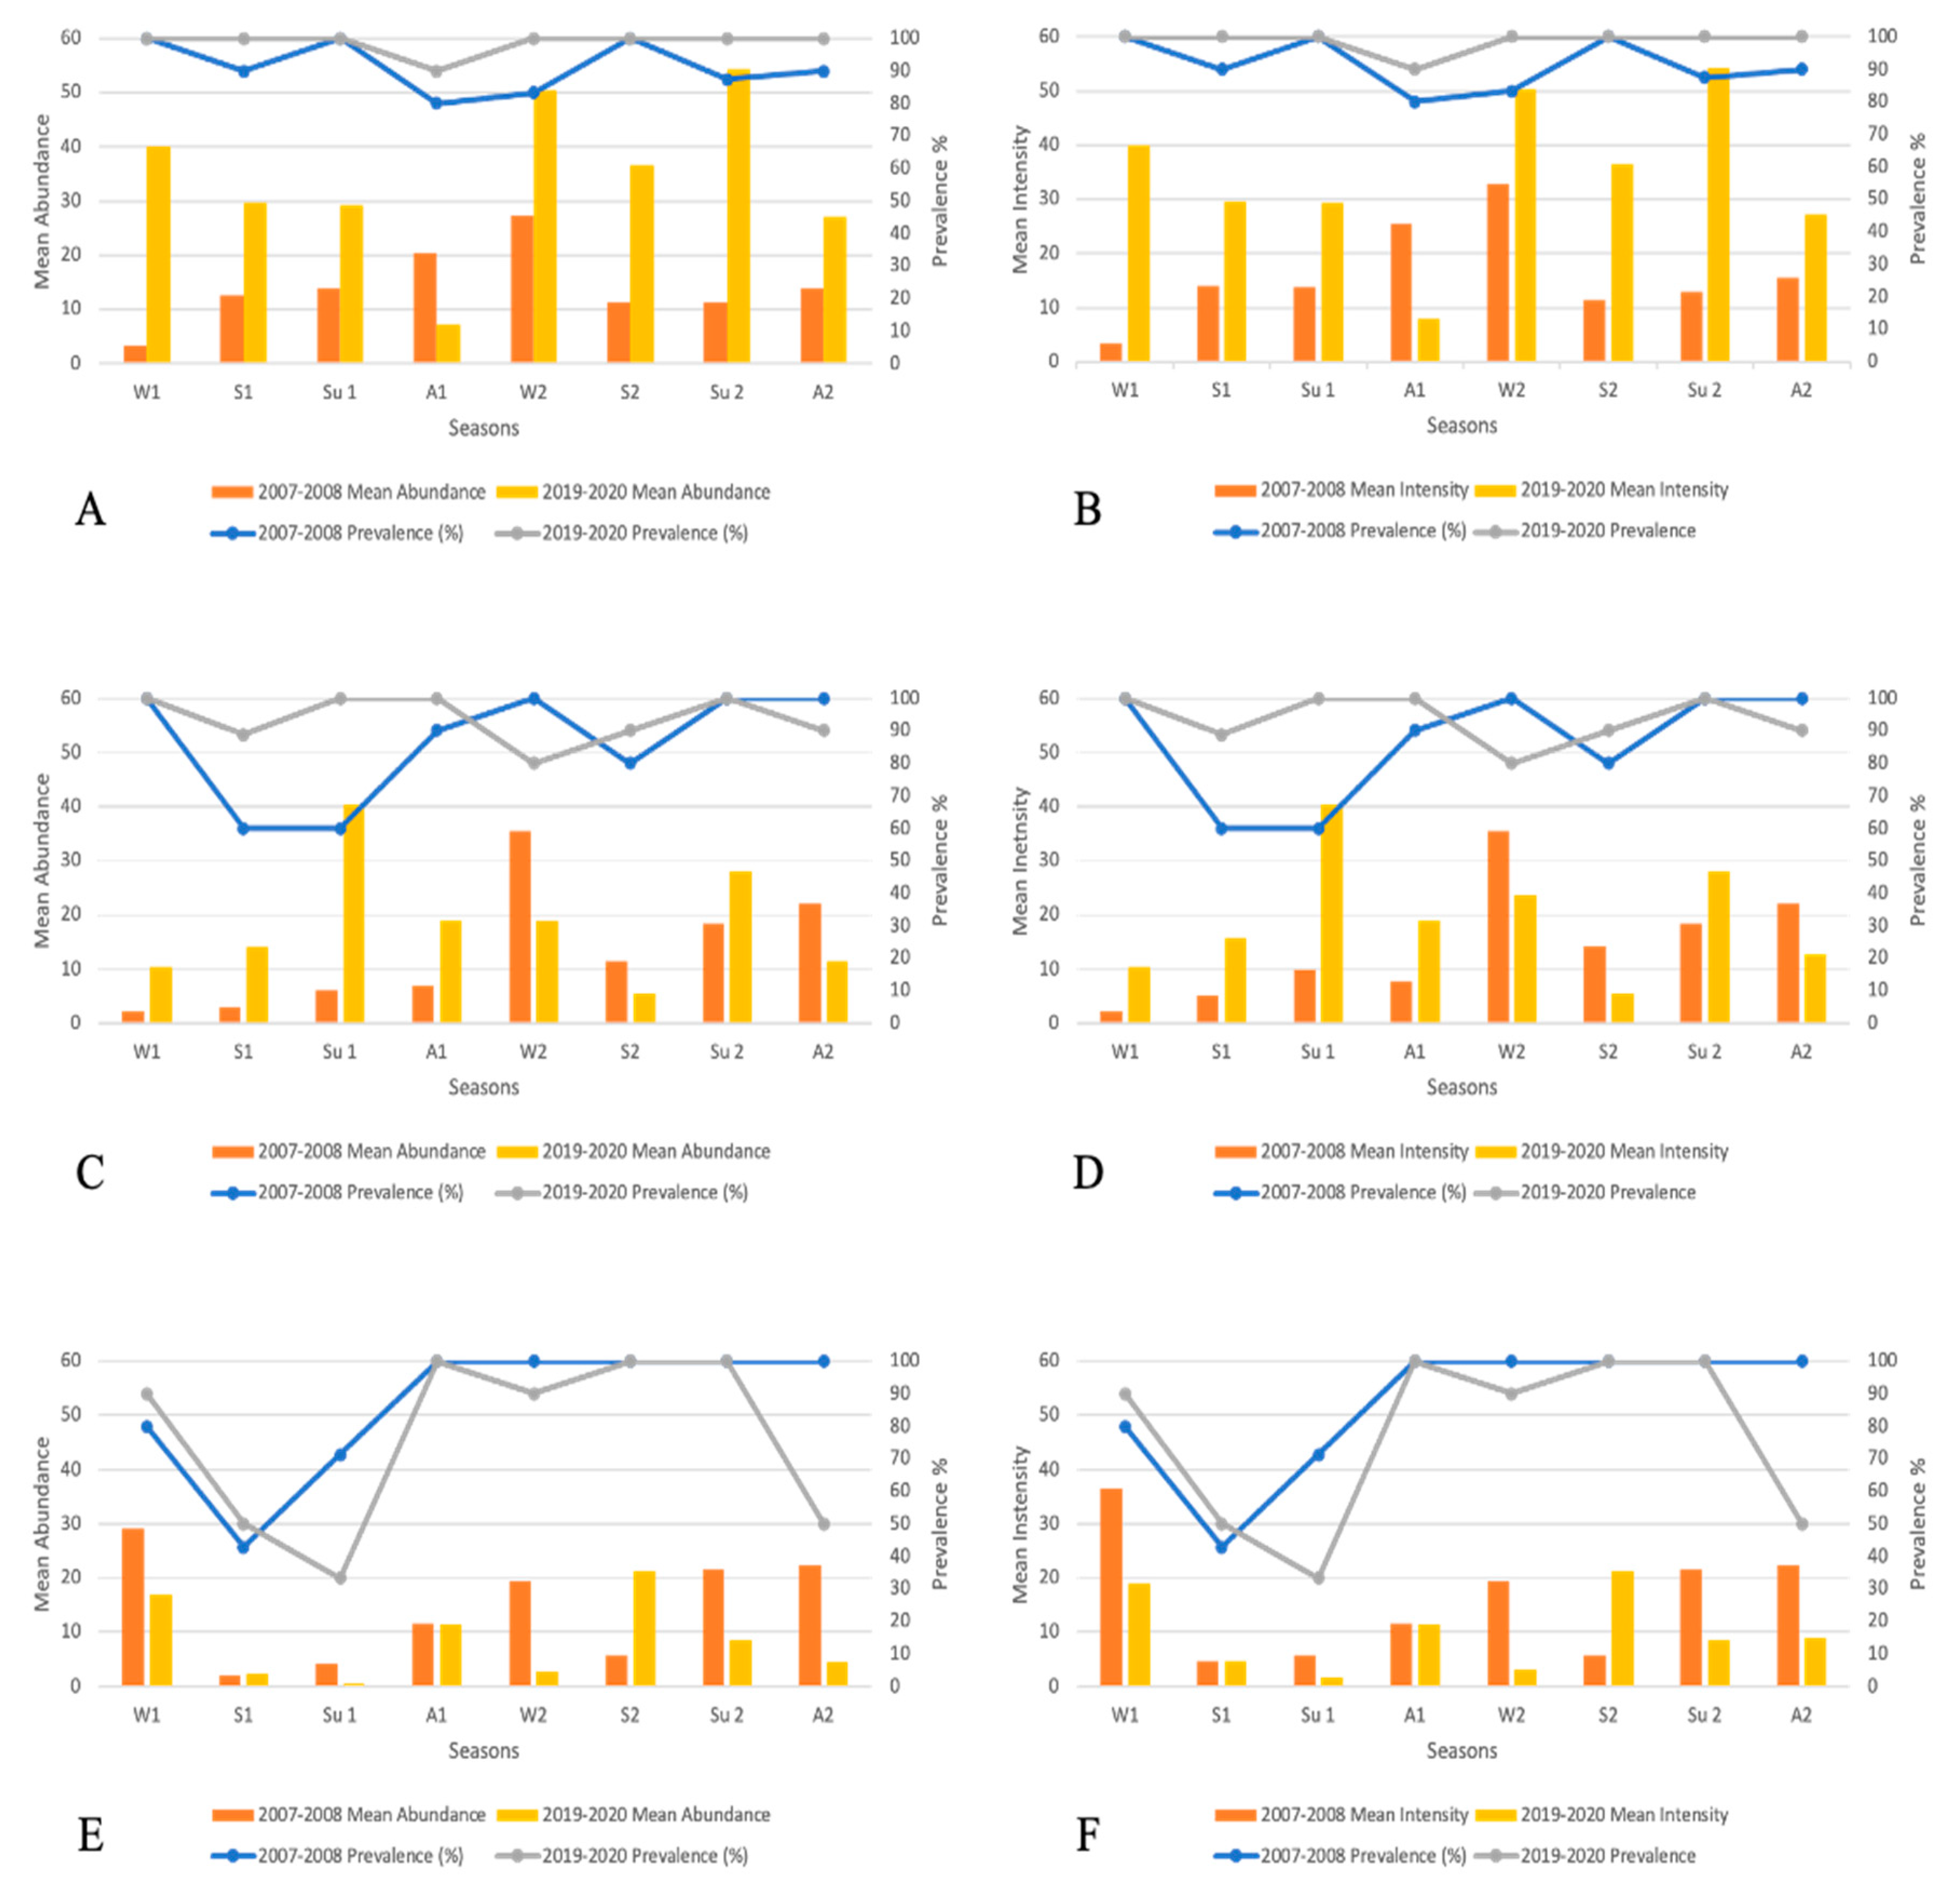
Figure 4.
Change in the ratio of the mean number of parasites in the subsample to the mean of all samples based on the number of samples selected for all farms and years (totals and on the left arches).
Figure 4.
Change in the ratio of the mean number of parasites in the subsample to the mean of all samples based on the number of samples selected for all farms and years (totals and on the left arches).
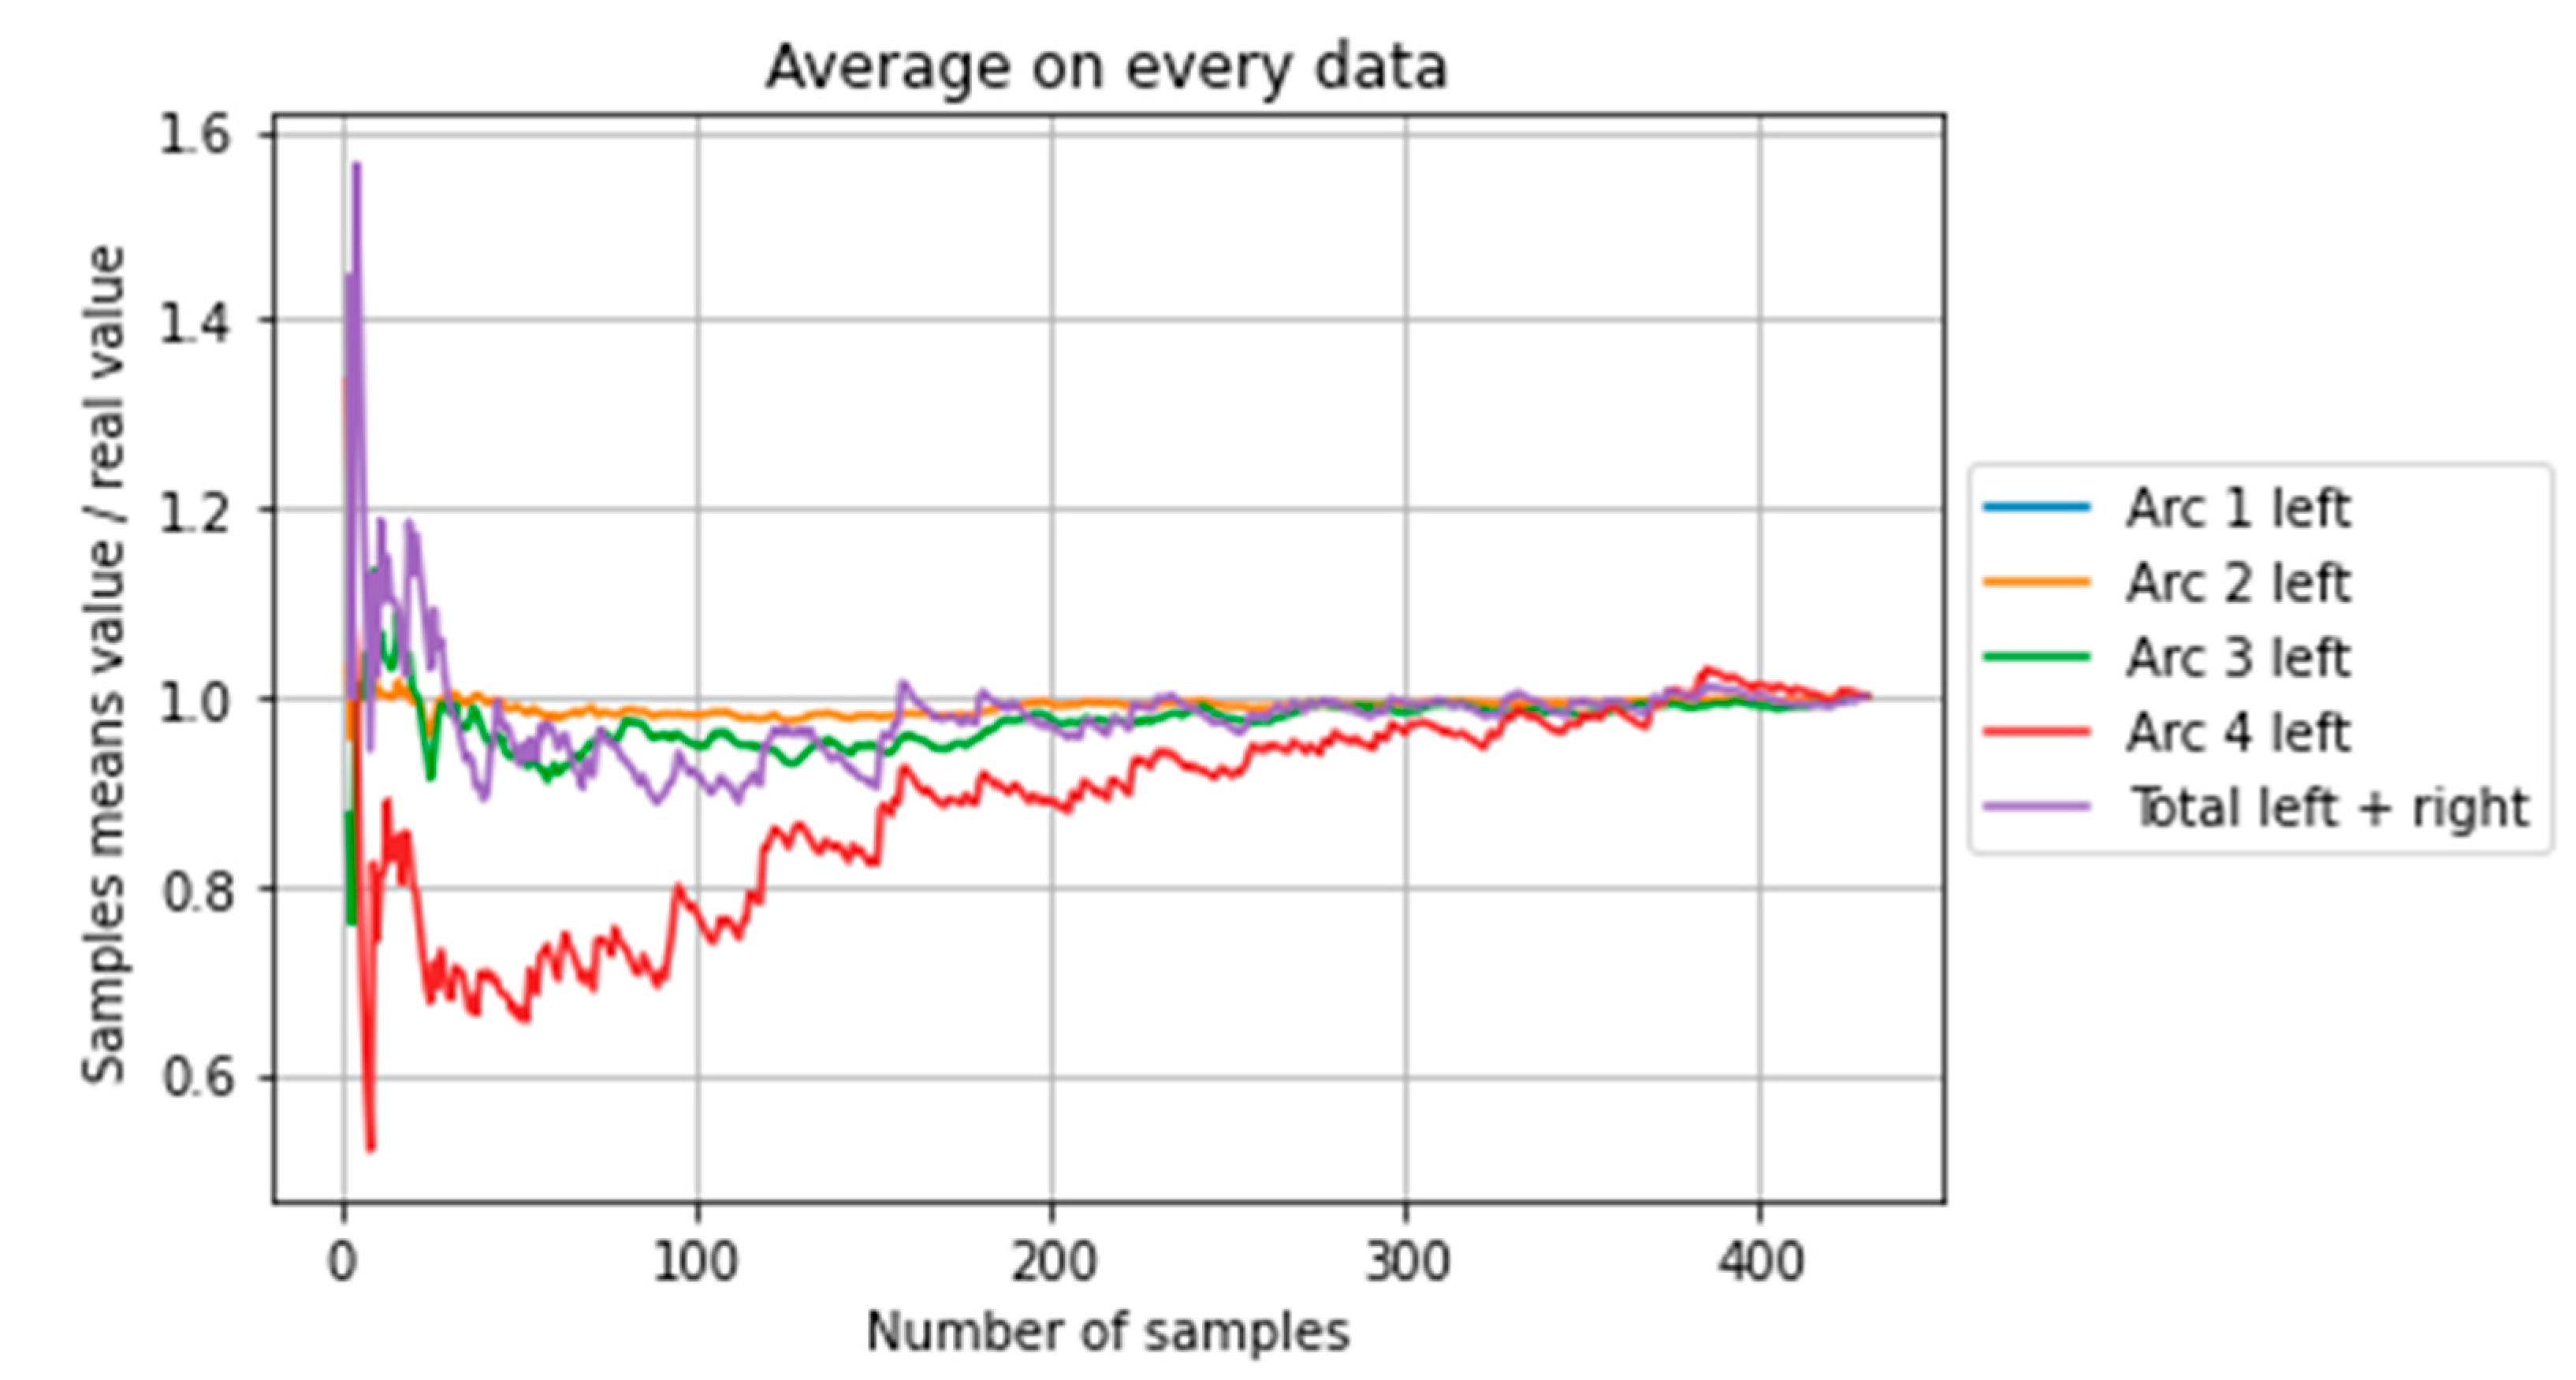
Figure 5.
Reduction of sampling effort test by reducing the number of fish taken per sampling day (from 1 to 10) at different thresholds values (5, 10 and 15%).
Figure 5.
Reduction of sampling effort test by reducing the number of fish taken per sampling day (from 1 to 10) at different thresholds values (5, 10 and 15%).
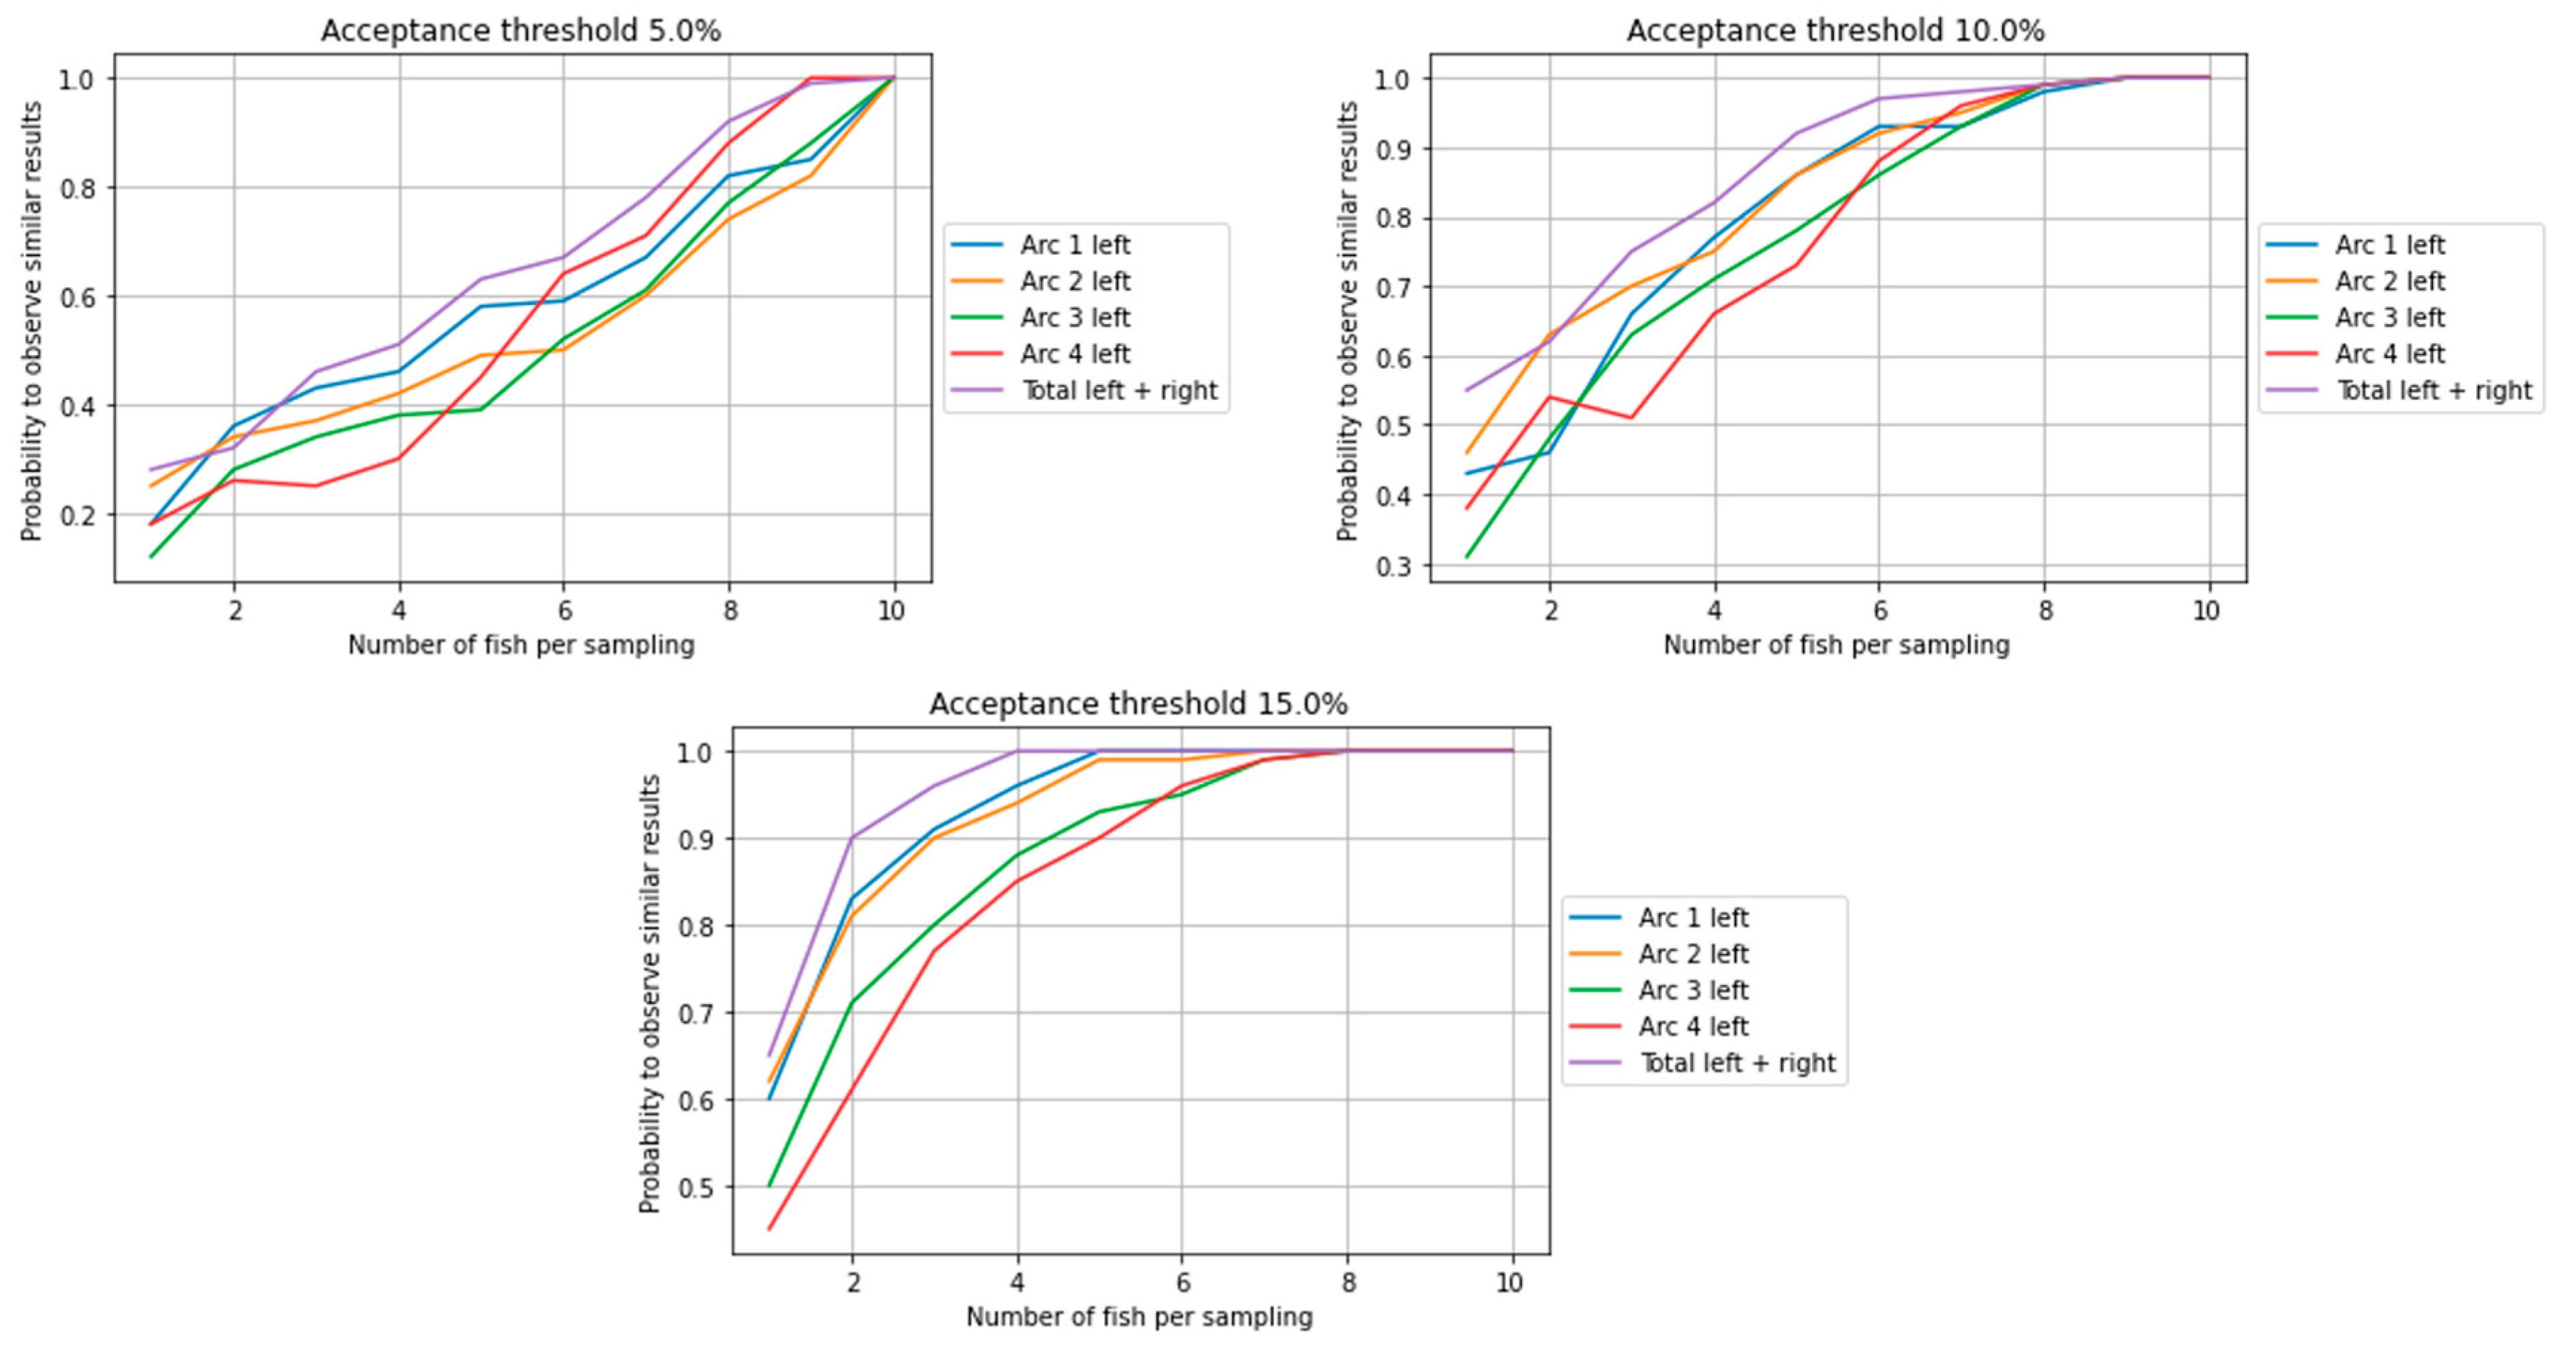

Table 1.
Mean seasonal temperatures (T) recorded during parasitological surveys (°C). W: winter, S: spring, Su: summer, A: autumn.
Table 1.
Mean seasonal temperatures (T) recorded during parasitological surveys (°C). W: winter, S: spring, Su: summer, A: autumn.
| Farm 1 | Farm 2 | Farm 3 | Mean T(°C) | ||
|---|---|---|---|---|---|
| 2007 | W | 14.2 | 14.1 | 14.1 | 14.13 |
| S | 17.1 | 20.3 | 20.6 | 19,33 | |
| Su | 25.5 | 22.4 | 24.3 | 24,1 | |
| A | 17.7 | 21.7 | 21.5 | 20,3 | |
| Mean T (°C) | 18.63 | 19.63 | 20.13 | ||
| 2008 | W | 13.7 | 13.5 | 13.3 | 13.5 |
| S | 18.8 | 20.5 | 20.8 | 20.03 | |
| Su | 24.8 | 24.9 | 24.8 | 24.83 | |
| A | 21 | 20.4 | 22.6 | 21.33 | |
| Mean T (°C) | 19.6 | 19.8 | 20.4 | ||
| 2019 | W | 14 | 14.5 | 14 | 14.2 |
| S | 15 | 18.1 | 19.8 | 17.63 | |
| Su | 26 | 26.2 | 28.2 | 26.8 | |
| A | 21 | 23.1 | 24 | 22.7 | |
| Mean T (°C) | 19 | 20.5 | 21.5 | ||
| 2020 | W | 14 | 14 | 15.7 | 14.6 |
| S | 18 | 19 | 19.6 | 18.9 | |
| Su | 25 | 28 | 27 | 26.7 | |
| A | 18 | 24 | 23.8 | 21.9 | |
| Mean T (°C) | 18.8 | 21.3 | 21.5 |
Table 2.
Ecological indices of D. aequans found on D. labrax of Corsican fish-farms according to the weight. N: number of fish, SD: standard deviation, WFS: Weight Fish Set.
Table 2.
Ecological indices of D. aequans found on D. labrax of Corsican fish-farms according to the weight. N: number of fish, SD: standard deviation, WFS: Weight Fish Set.
| Fish group [Weight (g)] | N fish/group (%) | Prevalence (%) | Mean abundance (± SD) | Mean intensity (± SD) |
|---|---|---|---|---|
| WFS*4 ]543-1210] | 108 (25%) | 75 | 21.4 (± 21.7) | 24.1 ± (22.8) |
| WFS3 ]381-543] | 107 (25%) | 81 | 19.5(± 21.7) | 21.3 ± (22.6) |
| WFS2 ]278-381] | 107 (25%) | 79 | 19.1 (± 21.8) | 21.1 ± (22.8) |
| WFS1 [100-278] | 108 (25%) | 66 | 14.6 (± 19.8) | 17.2 ± (21.3) |
Table 3.
Ecological indices of D. aequans for farm 1. χ2: chi-square test, p: significance level, SD: standard deviation, U test: Mann-Whitney U test.
Table 3.
Ecological indices of D. aequans for farm 1. χ2: chi-square test, p: significance level, SD: standard deviation, U test: Mann-Whitney U test.
| Prevalence | Abundance | Intensity | ||||||
|---|---|---|---|---|---|---|---|---|
| χ2 | (p) | Mean | ±SD | U test (p) | Mean | ±SD | U test (p) | |
| 2007-2008 | 4.74 | 0.029 | 16.07 | 4.93 | 0.026 | 18.24 | 5.87 | 0.02 |
| 2019-2020 | 33.52 | 15.8 | 33.63 | 15.58 | ||||
Table 4.
Ecological indices of D. aequans for farm 2. χ2: chi-square test, p: significance level, SD: standard deviation, U test: Mann-Whitney U test.
Table 4.
Ecological indices of D. aequans for farm 2. χ2: chi-square test, p: significance level, SD: standard deviation, U test: Mann-Whitney U test.
| Prevalence | Abundance | Intensity | ||||||
|---|---|---|---|---|---|---|---|---|
| χ2 | (p) | Mean | ±SD | U test (p) | Mean | ±SD | U test (p) | |
| 2007-2008 | 2.09 | 0.148 | 14.96 | 11.47 | 0.38 | 16.17 | 10.55 | 0.46 |
| 2019-2020 | 19.67 | 11.58 | 20.77 | 11.36 | ||||
Table 5.
Ecological indices of D. aequans for farm 3. χ2: chi-square test, p: significance level, SD: standard deviation, U test: Mann-Whitney U test.
Table 5.
Ecological indices of D. aequans for farm 3. χ2: chi-square test, p: significance level, SD: standard deviation, U test: Mann-Whitney U test.
| Prevalence | Abundance | Intensity | ||||||
|---|---|---|---|---|---|---|---|---|
| χ2 | (p) | Mean | ±SD | U test (p) | Mean | ±SD | U test (p) | |
| 2007-2008 | 4.66 | 0.031 | 11.48 | 8.27 | 0.26 | 12.35 | 7.3 | 0.32 |
| 2019-2020 | 7.34 | 7.22 | 8.5 | 6.6 | ||||
Table 6.
Mean abundance of D. aequans according distribution on gill arches on all fish analyzed. GA: gill arches, SD: standard deviation, U test: Mann-Whitney U test.
Table 6.
Mean abundance of D. aequans according distribution on gill arches on all fish analyzed. GA: gill arches, SD: standard deviation, U test: Mann-Whitney U test.
| Mean abundance (± SD) | ||
|---|---|---|
| Left (L) | Right (R) | |
| GA1 | 3.37 (±5,02) | 3.17 (± 4,55) |
| GA2 | 2.91 (± 4.07) | 2.81 (± 4.13) |
| GA3 | 2.07 (±3.21) | 1.81 (± 2.8) |
| GA4 | 1.37 (±2.75) | 1.14 (± 2.35) |
| Total | 9.71 (±12.28) | 8.99 (±11.45) |
| U test | p=0.68 | |
Table 7.
Prevalence values of D. aequans (%) on D. labrax gill arches. *Fish group: 1 (smallest fishes) to 4 (biggest fishes), GA: gill arches.
Table 7.
Prevalence values of D. aequans (%) on D. labrax gill arches. *Fish group: 1 (smallest fishes) to 4 (biggest fishes), GA: gill arches.
| Distribution of parasites (%) | |||||
|---|---|---|---|---|---|
| Fish group* | N fish/group (%) | GA*1 | GA2 | GA3 | GA4 |
| 4 | 108 (25%) | 34,5 | 31,4 | 20,4 | 13,8 |
| 3 | 107 (25%) | 38,1 | 27,7 | 20,3 | 14,1 |
| 2 | 107 (25%) | 28 | 33,6 | 25,5 | 12,9 |
| 1 | 108 (25%) | 40,8 | 31,3 | 16,5 | 22,6 |
| Total | 430 (100%) | ||||
Disclaimer/Publisher’s Note: The statements, opinions and data contained in all publications are solely those of the individual author(s) and contributor(s) and not of MDPI and/or the editor(s). MDPI and/or the editor(s) disclaim responsibility for any injury to people or property resulting from any ideas, methods, instructions or products referred to in the content. |
© 2023 by the authors. Licensee MDPI, Basel, Switzerland. This article is an open access article distributed under the terms and conditions of the Creative Commons Attribution (CC BY) license (http://creativecommons.org/licenses/by/4.0/).
Copyright: This open access article is published under a Creative Commons CC BY 4.0 license, which permit the free download, distribution, and reuse, provided that the author and preprint are cited in any reuse.


