
Submitted:
15 September 2023
Posted:
19 September 2023
You are already at the latest version
Abstract
The main commercial variety of coffee is the Coffea arabica specie, however, it is very susceptible to damage caused by nematodes, for this reason scions of the C. arabica specie are used on ro-busta (Coffea canephora) rootstocks to improve tolerance to these microorganisms, because they modify the organoleptic, nutraceutical and nutritional characteristics. The objective of this work was to assess the effect of five roasting degrees on commercial beans (light, medium light, medi-um, medium, medium dark and dark) in two varieties of Coffea arabica species (Colombia and Costa Rica) and their respective scions on C. canephora of the Romex variety. The scion of the Co-lombia variety with the medium dark roast had the highest concentration of caffeine, while the coffee beans of the Costa Rica variety with the light roast grade had the highest concentration of chlorogenic acid (5-CQA), while the highest acrylamide content was found in the scion of the Co-lombia variety with the medium light roast beans and nutritional content differs considerably between varieties, however, there is similarity between roasting degrees. The degree of roasting, variety and scion of coffee influences the organoleptic, nutraceutical and nutritional content of the coffee infusion.
Keywords:
coffea arabica
; roasting degrees
; scion
; nutraceuticals
; acrylamide
; caffeine
; minerals
1. Introduction
Caffeine-containing beverages, such as coffee, are consumed worldwide daily to improve cognitive functions. Approximately 3 billion cups of coffee are consumed every day, translated into an economic value of approximately US $ 200 billion per year (Mahmus et al., 2020; Samper et al., 2017).
Coffee crops are very important globally given that they have a high economic impact in developing countries (Villalta-Villalobos & Gatica-Arias, 2019) and therefore constitute a cornerstone for the tropical countries' economies in Latin America (Rahn et al., 2018), representing a multi-billion dollar sector that encompasses a long value chain, from the farmer to the consumer, being the second most consumed beverage worldwide (ICO, 2023).
It is estimated that, throughout the 2022 period, the world’s coffee production was 170.5 billion of 60-kilogram bags, implying an increase of about 5.5 million regarding the global consumption of this beverage reported on the previous season (Statista, 2023).
In addition to the important economic aspects, coffee has medical applications with health benefits. Several studies have shown that coffee consumption for extended periods of time, influences against the development of type two myelitis diabetes (Higdon & Frei, 2006). Some chemical compounds that are characteristic of coffee include caffeine and chlorogenic acids, among others (Amr et al., 2021). Caffeine-rich coffee was also found to show an apoptotic effect on cancer cells and function as a chemopreventive agent (Jabir et al., 2018).
Coffee flavor is a quality determination, it is considered the main attribute of sensory quality, whereas some chemical substances that are not volatile, are present in green coffee which are subject to drastic changes during the roasting process being responsible for the distinctive flavor serving as precursors, i.e. free sugars, carbohydrates, chlorogenic acid, trigonelline, proteins and lipids (Ribeiro et al., 2009).
It is also very important to monitor the identification of contaminants that are generated in the processing of coffee, specifically if there is the presence of some chemical substances posing a health risk (Aguas et al., 2006), such as the acrylamide formation, which is an unsaturated amide formed when heating foods to 120°C and that are rich in carbohydrates through the Maillard reaction, which is the reaction of the amino acid asparagine mainly with glucose and fructose that are reduced sugars (Cagliero et al., 2016; Fonseca-García et al., 2014). This is the case with coffee, where acrylamide is naturally produced during the bean roasting process (Morales and Mesias, 2015).
Roasted coffee exerts an antioxidant action since it is rich in melanoidins that are generated during the roasting process (Esquivel & Jiménez, 2012). In addition to the antioxidant activity of chlorogenic acids, they have been associated with the prevention of cancer, diabetes (Kamiyama et al., 2015), they regulate blood pressure and therefore prevent hypertension (Loader et al., 2017).
Nutrients perform essential functions in plant metabolism as activators of enzymatic reactions, constituents of organic structures, and osmoregulation (Bustos et al., 2008). These vary due to causes such as plant growth and their availability in the soil, resulting in an increased concentration or nutrient dilution in plant tissues (Sadeghian & Salamanca, 2015).
According to ICO (2023), out of the diverse coffee varieties that exist, the two most important are Coffea arabica which is Arabica coffee, this variety accounts for more than 60% of world production and Coffea canephora better known as Robusta coffee. Other varieties are cultivated on a much smaller scale, and they are the Liberica coffee (Coffea liberica) and the Excelsa coffee (Coffea dewevrei).
Worldwide, Mexico ranks eleventh place in coffee production and more than three million people depend on coffee production. Total coffee production is grown in 14 Mexican states (SIACON-SAGARPA, 2023; SADER, 2023). Approximately 96% of the coffee produced in Mexico is Arabica, while 4% is Robusta. However, Arabica varieties are more susceptible to coffee rust, a pest that has affected the coffee sector in the country since 2012, which has caused a reduction in production of more than 50% between 2012 and 2016 (CEDRESSA, 2019) in addition to nematodes, which are capable of reducing yields from 15% to 60% in Coffea arabica species (ICO, 2023; Cepeda-Siller et al., 2020; ANACAFÉ, 2017).
For this reason, in Mexico, the cultivation of Arabica varieties with greater rust resistance has been started, such as the coffee variety Colombia (Coffea arabica) presents resistance to coffee rust and has as its progenitors the variety Caturra, of the species Coffea arabica and the hybrid Timor (Federacióna Nacional de Cafeteros, 1997) as well as the variety of coffee Costa Rica, which is the result of the hybridization of Timor with Caturra, as main character it presents resistance to coffee rust, has high yields, adapts to warm zones and acid soils (https: //varieties. worldcoffeeresearch.org/en).
For the control of nematodes, grafts of arabica varieties (susceptible) have been used on less susceptible robusta coffee rootstocks, which has resulted in a successful strategy in the control of this pest (Sánchez-González & Muñoz, 2022).
This study analyzed the content of acrylamide, caffeine, chlorogenic acids, and minerals in coffee beans from Colombia, Colombia Injerto, Costa Rica, and Costa Rica Injerto at five different roasting levels in order to determine whether quality variables differ between the varieties and grafts.
2. Materials and Methods
Plant Material and Experimental Conditions: The study was conducted using coffee beans from plants of the varieties Colombia, Colombia Graft, Costa Rica, and Costa Rica Graft, planted in the congregation La Laja, municipality of Tlaltetela, Veracruz, Mexico (19° 17' 10.8" N, 96° 56' 51.9" W and altitude of 1250 m). Plants were cultivated under manageable shading, with approximately 70% of solar radiation, using the traditional selective plantation method (sowing, fertilizing, and pruning), with 2000 to 2500 shrubs ha-1 in cambisol type soils.
Roast Levels: The coffee beans were roasted (Table 1) in an MT-1 fluid bed roaster (Trejo; Zacatlán, Puebla, Mexico), with a capacity of 5 to 7 kg, following the protocol established by the Specialty Coffee Association of America (SCAA, 2020). The roasting levels were light, medium light, medium, medium dark and dark. The measured variables were initial humidity (%), initial and final temperatures (oC), initial weight (g), first and second cracks (roasting curve), and temperature increase (5°C every 30 seconds).
5-CQA and caffeine concentrations: The analysis of Chlorogenic acid (5-CQA) was performed on an HPLC system (Dionex, ICS 3000; San Jose, CA, USA) equipped with a UV/VIS detector at a wavelength of 325 nm with an isocratic mobile phase composed of 75 % HPLC grade water and 25% H3PO4-acidified methanol at a flow rate of 1.2 mL min–1, using an Acclaim™ 120 C18 5 mm 4.6 × 150 mm reversed phase column (ThermoFisher®, Sunnyvale, CA, USA ) and a ZORBAX C18 5 μm, 10 × 2 mm column (Agilent technologies, Santa Clara, CA, USA), with a variation of the DIN 10767 method (German Institute for Standardization, 1992). Caffeine concentration was determined by a variation of NMX-F-182-SCFI-2011 (Secretaría de Economía, 2011). Results were expressed as a percentage of dry matter weight (% PMS).
Caffeine was extracted using a thermoreactor (Hach, DRB200; Loveland, CO, U.S.A) at 135 °C for 5 min. Quantification was performed in a Dionex ICS 3000 HPLC equipped with a UV/vis detector at a wavelength of 272 nm with an isocratic mobile phase composed of 75 % HPLC-grade water and 25 % H3PO4-acidified methanol applying a flow rate of 1. 5 mL min-1 on a 120 C18 5 mm 4.6 × 150 mm column (ThermoFisher® model Acclaim™, Sunnyvale, CA, USA) with H3PO4; samples were made in triplicate. Results were expressed as a percentage of dry matter weight (% PMS).
Calibration curves for chlorogenic acids and caffeine, were performed with eight concentration points (0, 0.1, 0.08, 0.065, 0.05, 0.04, 0.02, and 0.005 %) in duplicate to check the linearity of the methods. For the calibration curves, chlorogenic acid, 95% CAS 327-97-9 (Sigma-Aldrich; Saint Louis, MO, USA) and ≥ 95% CAS 58-08-2 C1778 (Sigma-Aldrich Saint Louis, MO, USA) and caffeine ≥ 99 % CAS 58-08-2 C1778 (Sigma-Aldrich Saint) were used respectively.
Mineral analysis: The concentration of nutrients P, K, Ca, Mg, Fe, Cu, Zn, Mn, and B were determined with coupled plasma induction atomic emission spectrophotometry (Agilent ICP-AES, model 725-ES; Victoria, Australia), and the N content was measured using the micro-Kjeldahl method. Results were expressed in g kg–1 for macronutrients and mg kg–1 for micronutrients.
Experimental design: A completely randomized design with the factorial arrangement was used, where the study factors were genotype (four levels: Coffea arabica L. var. Colombia and Costa Rica as well as their respective grafts, which were grafted on Coffea canephora P. var. Romex), resulting in 20 treatments. For each treatment, four replicates were performed.
Statistical analysis: With the resulting data, it was performed an ANDEVA with Tukey's comparison test (p£0.05) with the SAS statistical package (SAS Institute, 2011).
3. Results
In a study analyzing the concentration of caffeine in the beans of four different varieties of coffee, it was found that there was a significant statistical difference between treatments. The variety Colombia graft registered the highest concentrations of caffeine, surpassing the other varieties in descending order, the Costa Rica, Costa Rica graft, and Colombia, which presented the lowest contents of caffeine (Figure 1).
Means ± SE with different letters in each bar indicate significant statistical differences (p ≤ 0.05).
When analyzing the caffeine content in coffee beans with different roasting levels, the highest caffeine content in coffee beans was positively correlated with the highest roasting level, decreasing until the dark roast (Figure 2).
The Costa Rica variety of coffee beans had the highest chlorogenic acid content, exceeding Colombia, Colombia Graft, and Costa Rica varieties, which decreased their chlorogenic acid contents according to the order in which they were harvested (Figure 3).
The highest level of chlorogenic acid was found in lightly roasted coffee beans, and the level of chlorogenic acid gradually declined with increased roast levels, ranging from light roasts to medium roasts, medium dark roasts, and dark roasts (Figure 4).
The contents of acrylamide in coffee beans, had their highest concentrations in the variety Colombia Graft and these contents gradually decreased from the variety Colombia Graft to Colombia, Costa Rica Graft, and Costa Rica, this variety had concentration levels 50% below than the variety Colombia Graft (Figure 5).
The medium light roast level in coffee beans presented the highest acrylamide contents, while the lowest contents were found in coffee beans with the dark roast level (Figure 6).
Upon analysis on the effect of the interaction factor variety by roasting level, there were no significant statistical differences in nitrogen contents for the coffee varieties Colombia, Colombia Graft, and Costa Rica in the five roasting levels, however, the variety Costa Rica Graft deviates from this trend by presenting the highest contents of nitrogen in coffee beans with dark roast level and the lowest with medium roast. Regarding the content of phosphorus, potassium, and magnesium there were statistical differences between treatments in the four varieties and with the five roast levels, as for calcium the highest contents of this nutrient (0.010±0.000 a). 010±0.000 a) were found in coffee beans of the Colombia variety with medium dark roast level and the lowest contents (0.006±0.000) were found in the coffee varieties Colombia Graft and Costa Rica with medium and dark roast levels, respectively (Table 2).
Upon analysis of the micronutrient content, by the effect of the interaction factor coffee variety by roast level, there were significant statistical differences between treatments, and the highest concentrations of Fe (17676.00±902.98a) were found in the Colombia variety with a light roast level, Cu (1510. 66±37.90 a) Costa Rica with Medium roast, Zn (34.07±0.93 a) in the Colombia variety with medium roast and Mn (34.07±0.93 a) in the Colombia variety with Dark roast, the case of Bo is excluded from this trend, since there were no significant statistical differences between treatments (Table 3).
4. Discussion
The amount of caffeine contained in a cup of coffee is quite different, depending on its origin or blend and brewing method, but in general, Robusta coffees contain approximately twice as much caffeine as Arabica species coffees (FDA, 2023).
The roasting level is a parameter in the quality of the product, although there is no agreement on the relationship between control in the parameters and those indicative of color, which is why the comparison between data is difficult (Dias & Benassi, 2015). Roasting coffee beans involves chemical changes in their content (De Luca et al., 2016). During this process, reactions are carried out between components that are present in the beans. Where the decrease of polysaccharides, proteins, chlorogenic acids, and trigonelline stands out, ocurring a degradation of sucrose, ash increases, and melanoidins are created (Puerta, 2011).
The increase of caffeine in darker roasting levels could be mainly because of the thermostability of caffeine and the loss of mass of thermolabile compounds during the roasting process (Mehaya, &. Mohammad, 2020). Probably the increase in temperature reduces the water content in coffee beans, helping to release volatile and thermostable compounds such as caffeine, this decrease probably results from the sublimation of caffeine at higher temperatures during roasting (Macrae, 1985).
The difference between pure lines and grafting could be because, in grafts, RNA molecules are highly transmissible between adjacent cells and throughout the plant utilizing the plant plasmodesmata (Lucas et al., 2001), an example of this is found by Kim et al. (2001) where they observed in grafts the long-distance movement of mRNA from the stock into scion induces a visible change in the morphology of the leaves of the latter, hinting that the translocated RNAs were functional. Therefore, it has been proposed that if the mRNAs transferred from the stock carrier have complete retrotransposons, they can be transcribed to produce cDNA and reintegrated into the scion, which would generate genetic changes (Liu, 2006).
Coffee beans have significant amounts of chlorogenic acids that considerably influence the quality of coffee, as well as its aroma and flavor (Rahn et al., 2013; Brigitta et al., 2016). A cup of coffee can contain 200 to 550 mg of phenolic compounds (Natella & Scaccini, 2012), and in roasted coffee, there can be up to 14% chlorogenic acids (Somporn et al., 2011). Chlorogenic acid, which is present in coffee beans, has high beneficial potential in humans, as it has high antioxidant, hypoglycemic, antiviral, hepatoprotective, and nutraceutical capacity (Somporn et al., 2011; Monteiro & Farah, 2012; Tfouni et al., 2013; Janissen & Huynh, 2018).
Several studies have shown that, during the roasting process of coffee beans, CGA levels decrease, because the high temperatures used during coffee roasting could lead to the breakdown of carbon-carbon bonds of chlorogenic acids, causing a degradation and isomerization of chlorogenic acids (Ayelign & Sabally, 2013). Among the hydroxycinnamic acids, 5-CQA acid is found in greater proportion in coffee beans; however, the arabica variety is the one with the lowest 5-CQA acid content.
Edaphoclimatic conditions of cultivation, such as altitude, affect the characteristics of coffees as well as their composition (Guyot et al., 1996), where free cinnamic acids, such as caffeic and p-coumaric, are released when the beans are roasted, these free cinnamic acids will vary according to the roasting temperature and time (Clifford & Clifford, 1999).
Although no empirical evidence is available to date, the differences between pure and grafted varieties are probably due to mRNA translocation from rootstocks to scion; this possibility is theoretically feasible (Wu et al., 2013).
Inter-specific transfer of somatic cells at the graft union has been documented (Thysenn et al., 2012). Furthermore, Stegemann and Bock, (2009) observed that the green fluorescent protein (GFP) marker encoded in plastids was transferring from one grafted tobacco plant to another at the graft union. It is important to remark that, in the observed cases, plastidial genome transfer was shown at the junctions close to the graft. However, although the mechanism responsible for the intercellular DNA exchange is relatively unknown, nucleic acids such as microRNAs are known to spread systemically through the phloem involving medium-dark. In grafts, plasmodesmata are probably responsible for the lateral transport of genes, even though they normally only allow the passage of small molecules (Rusk, 2009).
In 1994, the International Agency for Research on Cancer (IARC) classified acrylamide as probably carcinogenic for humans in classification 2A due to its broad spectrum of toxic effects; however, in 2002, the University of Stockholm supported Swedish researchers in alerting to the fact that some foods undergo thermal processing at temperatures exceeding 100°C and contain high amounts of acrylamide, and this is the specific case of roasting coffee beans, which is carried out at temperatures ranging from 150 to 250 °C, the temperature at which acrylamide has the optimum conditions for its formation (Claus et al., 2008).
The Coffea genus represents about 70 species, outstanding among them Coffea arabica L., (arabica coffee) and Coffea canephora (robusta coffee), due to their high global economic importance, these are the two most important species because they account for three-quarters of the world's coffee production (Cid, 2016).
Pohl et al. (2013) mention a variation in coffee beans' nutritional content based on their geographical origin. In fact, Oliveira et al. (2015) found differences between countries and continents, in the mineral profiles of coffee bean samples and considered the above because Brazil and Mexico are among the first 10 coffee-producing countries worldwide (Statista, 2023).
The roasting process of coffee beans is an operation that causes physical, chemical, and sensory changes (Nakilcioğlu-Taş & Ötleş, 2019). According to Pohl et al. (2013), the elemental analysis does not allow retrieving information about the speciation forms in which elements might be present in solid coffee and coffee brew, however, Vitorino et al. (2001) mention that the quality of the coffee beverage is directly related to the chemical composition of the roasted coffee beans, which in turn is influenced by the composition of the coffeé kernel, which in turn depends on the variety, origin, climate and post-harvest processes of the coffee.
By reducing sugars and fragmentation products, such as melanoidin and their acid precursors, many volatile and non-volatile compounds are formed, due to the Maillard reaction, which has a lower activation energy and is favored when reactive nitrogen compounds, such as amino acids and free amino groups in proteins and peptides, are present (Illy & Viani, 2005).
Pohl et al. (2013) mention that various elements can be divided into macronutrients (Ca, K, Mg, Na, S, P) and micronutrients (Cl, Co, Cr, Cu, Fe, Mn, Mo, Ni, Se, Sr, Zn) have been reported in green, roasted, and instant coffee.
The nutrient contents in green and roasted Arabica coffees are very different, with roasted coffee beans having higher concentrations of K, Na, Ca, Mg, and Fe than unprocessed coffee (Filho et al. 2007). Martin et al. 1998a, 1999 stated that the P and Cu content of green and roasted robusta coffee is often higher than the arabica coffee, but green and roasted beans have higher Mn content.
The concentration of nutrients is diverse, and this is associated with the influence of the origin, variety, and type of coffee (dos Santos & de Oliveira, 2001; Vega-Carrillo et al. 2002; Zaidi et al. 2006; Grembecka et al. 2007; dos Santos et al., 2010; Ashu & Chandravanshi, 2011). Within the nutrients of natural coffees, K presents the highest values, followed by P, Mg, S, Ca, and Na (Jaganyi and Madlala, 2000; dos Santos & de Oliveira, 2001; Suseela et al. 2001; Vega-Carrillo et al. 2002; Tagliaferro et al. 2006; Zaidi et al. 2006; Grembecka et al. 2007; Ashu & Chandravanshi, 2011).
When brewing coffee, many elements are released and become available in the beverage, therefore, the leachability of elements is very different for different types of coffee (Grembecka et al. 2007; Ashu & Chandravanshi, 2011; Oliveira et al. 2012). Frankova et al. (2009) have found that the brewing method influences the elements' content. In roasted and ground coffees, extraction efficiencies are intermediate for Cr (50.9-63.4%), Al (1.9-64.0%), Zn (8.6,61.5%), Co (25.7.49.8%), Ni (29.4-44.7%) and Mn (18.5-38.7%), while the lowest is for Iron (5.6-13.2%) and Copper (2.6-8.2%) (Rajwanshi et al., 1997; Grembecka et al., 2007; Frankova et al., 2009; Ashu & Chandravanshi, 2011).
Acid soils with high Iron and Aluminum contents cause cups with intermediate and high quality, while cups with low quality are associated with moderately acid soils and high levels of Cu and Zn (Suárez et al., 2015), and Fe has a positive influence on fragrance, contrary to Cu, which hurts the acidity of the beverage (Rosas et al., 2008).
5. Conclusions
The coffee beans of the Colombia variety presented the highest concentrations of caffeine, while the Costa Rica variety had the highest concentrations of chlorogenic acids, but the Colombia Graft variety presented the highest concentrations of acrylamide, while the nutritional content of all roasted coffee varieties was very similar.
Chlorogenic acids, acrylamide, and caffeine levels increase from light to medium roasting. The increase in roasting temperatures resulted in the degradation of the phenolic compounds in the beans. It is thus evident that the degree of roasting and the variety of beans have a direct effect on these compounds.
Author Contributions
Conceptualization, T.M.-G.; O.C.-C., methodology, T. M.-G., T. G.-H., M.C. P.-S., J.E.B-M., A.V.-P., O. C.-C and T.M.-G.; supervision A.V.-P., J.J.-G., and O.C. -C.; writing-original draft preparation, O.C.-C., T.M.-G., and M.C.P-S.; writing review and editing, G.V.-V., O.C. -C. and M.E.M.-L., M.C.P.-C. All authors have read and agreed to the last version of the manuscript.
Funding
This research received no external funding.
Acknowledgments
To CONACYT for the research grant (No. 445756) and to the "La Laja" finca, Tlaltetela, Veracruz, for the donated plant material.
Conflicts of Interest
The authors declare no conflict of interest.
References
- Aguas PC, Fitzhenry MJ, Giannikopoulos G, Varelis P. (2006). Analysis of acrylamide in coffee and cocoa by isotope dilution liquid chromatography-tandem mass spectrometry. Anal Bioanal. Chem. Aug;385(8):1526-31. [CrossRef]
- Alcántar G. G. y M. Sandoval V. (1999). Manual de Análisis Químico de Tejido Vegetal: Guía de Muestreo, Preparación, Análisis e Interpretación. Publicación Especial Núm. 10. Sociedad Mexicana de la Ciencia del Suelo. Chapingo. Estado de México, México. 156 p.
- Amr A., Ahmed Z., Mohamed A. F. (2021). Chemometrics-based aroma profiling for revealing origin, roasting indices, and brewing method in coffee seeds and its commercial blends in the Middle East, Food Chemistry. Volume 349. ISSN 0308-8146. [CrossRef]
- Ashu R, Chandravanshi BS. (2011). Concentration levels of metals in commercially available Ethiopian roasted coffee powders and their infusions. Bull Chem Soc Ethiop 25:11-24. [CrossRef]
- Awwad, S.; Issa, R.; Alnsour, L.; Albals, D.; Al-Momani, I. (2021). Quantification of Caffeine and Chlorogenic Acid in Green and Roasted Coffee Samples Using HPLC-DAD and Evaluation of the Effect of Degree of Roasting on Their Levels. Molecules 2021, 26, 7502. [CrossRef]
- Ayelign, A.; Sabally, K. (2013). Determination of chlorogenic acids (CGA) in coffee beans using HPLC. Am. J. Res. Commun. 1, 78–91.
- Bertuzzi T., Martinelli, E., Mulazzi, A., and Rastelli, S. (2020). Acrylamide determination during an industrial roasting process of coffee and the influence of asparagine and low molecular weight sugars. Food Chemistry, 303, 125372. [CrossRef]
- Bremner J. M. (1965). Total nitrogen. In: Methods of Soil Analysis. Part 2. Chemical and Microbiological Properties. R. C. Dinauer (ed.). American Society of Agronomy. Madison, WI, USA. pp:1149-1178.
- Bustos F., M. E. González, P. Donoso, V. Gerding, C. Donoso y B. Escobar (2008) Efecto de distintas dosis de fertilizante de liberación controlada (Osmocote®) en el desarrollo de plantas de coigüe, raulí y ulmo. Bosque 29:155-161.
- Cagliero C, Nan H, Bicchi C, Anderson JL. Matrix-compatible sorbent coatings based on structurally-tuned polymeric ionic liquids for the determination of acrylamide in brewed coffee and coffee powder using solid-phase microextraction. J Chromatogr A. 2016 Aug 12;1459:17-23. [CrossRef]
- Cepeda Siller, M., Ochoa Fuentes, Y. M., Cerna Chávez, E., Garrido Cruz, F., González Ruíz, A., & Hernández Juárez, A. (2020). Efectividad de extractos biológicos y químicos comerciales para el control de nematodos en cafeto en Chiapas. Revista mexicana de ciencias agrícolas, 11(7), 1461-1468. [CrossRef]
- Cid, M. C., M. P., de P. (2016). Coffee: Analysis and Composition. Encyclopedia of Food and Health, Academic Press, 225-231. [CrossRef]
- Clarke, D. B., Kelly, J., and Wilson, L. A. (2002). Assessment of performance of laboratories in determining acrylamide in crisp bread. J. AOAC Int., 85, 1370-1373.
- Claus, A., Carle, R., & Schieber, A. (2008). Acrylamide in cereal products: A review. Journal of Cereal Science, 47(2), 118-133. [CrossRef]
- Clifford, M. y Clifford, M.N. (1999). Chlorogenic acids and other cinnamates-nature, occurrence, dietary burden. J. Sci. Food Agric., 79, 362-372. [CrossRef]
- De Luca, S., De Filippis, M., Bucci, R., Magrì, A. D., Magrì, A. L., & Marini, F. (2016). Characterization of the effects of different roasting conditions on coffee samples of different geographical origins by HPLC-DAD, NIR and chemometrics. Microchemical Journal, 129, 348-361. [CrossRef]
- Dias, R. C. E., & Benassi, M. D. T. (2015). Discrimination between Arabica and Robusta Coffees Using Hydrosoluble Compounds: Is the Efficiency of the Parameters Dependent on the Roast Degree? Beverages, 1(3), 127–139. [CrossRef]
- Dos Santos EJ, de Oliveira E. (2001). Determination of mineral nutrients and toxic elements in Brazilian soluble coffee by ICP-AES. J Food Comp Anal 14:523–531. [CrossRef]
- Dos Santos JS, dos Santos MLP, Conti MM. (2010). Comparative study of metal contents in Brazilian coffees cultivated by conventional and organic agriculture applying principal component analysis. J Braz Chem Soc 21:1468–1476. [CrossRef]
- Esquivel, P., and V. Jiménez. (2012). Functional properties of coffee and coffee by-products. Food Res. Int. 46:488-495. [CrossRef]
- Fathy M. Mehaya, Ayman A. Mohammad. (2020). Thermostability of bioactive compounds during roasting process of coffee beans, Heliyon, Volume 6, Issue 11, 2020. [CrossRef]
- Filho VRM, Polito WL, Neto JAG. (2007). Comparative studies of the sample decomposition of green and roasted coffee for determination of nutrients and data exploratory analysis. J Braz Chem Soc 18:47-53. [CrossRef]
- FDA, 2023. https://agris.fao.org/agris-search/search.do?recordID=US8629072.
- Federación Nacional de Cafeteros. Sistema de Información Cafetera. Encuesta Nacional Cafetera. Informe Final. Santafé de Bogotá. FEDERACAFÉ. 1997. 178 p.
- Fonseca-García L., Calderón-Jaimes L. S., Rivera M. E. (2014). Antioxidant Capacity And Total Phenol Content In Coffee And Coffee By-Products Produced And Marketed In Norte De Santander (Colombia). Productos Naturales. ISSN: 0121-4004. Vol. 21no.3.
- Frankova A, Drabek O, Havlik J, Szakova J, Vanek A. (2009). The effect of beverage method on aluminium content in coffee infu- sions. J Inorg Biochem 103:1480-1485.
- Guyot, B., Gueule, D., Manez, J.C., Perriot, J.J., Giron, J. y Villain, L. (1996). Influence de l’altitude et de l’ombrage sur la qualité des cafés Arabica, Plant. Rech. Dévelop., 3, 272-283.
- Grembecka M, Malinowska E, Szefer P. (2007). Differentiation of market coffee and its infusions in view of their mineral composition. Sci Total Environ 383:59-69. [CrossRef]
- Higdon J. V., and Frei B. (2006). Coffee and Health: A Reviewof Recent Human Research. Critical Reviews in Food Science and Nutrition,46:101-123 Taylor and Francis Group. ISSN: 1040-8398. [CrossRef]
- IARC. (1994). Acrylamide. IARC Monographs on the Evaluation of Carcinogenic Risks to Humans Volume 60 Some Industrial Chemicals, 389-433.
- ICO. (2017). Seminars and Workshops. International Coffee Organization. http://www.ico.org/workshop.asp.
- Illy, A., & Viani, R. (2005). Espresso coffee: The science of quality (2nd ed). Elsevier Academic. https:// www.elsevier.com/books/espresso-coffee/illy/978-0- 12-370371-2.
- Jabir N. R., Khan F. H., Tabrez S. (2018). Cholinesterase targeting by polyphenols: A therapeutic approach for the treatment of Alzheimer’s disease. CNS Neurosci Ther; 24:75 3-76 2. [CrossRef]
- Jaganyi D, Vanmare J, Clark T. (1999). Kinetic study of mineral ion extraction from Kenyan Arabica coffee. J Sci Food Agric 79:323-326.
- Janissen, B., T. Huynh. (2018). Chemical composition and value-adding applications of coffee industry byproducts: A review. Resour. Conserv. Recyc., 128: 110-117. [CrossRef]
- Lucas WJ, Yoo BC, Kragler F. (2001). RNA as a long-distance information macromolecule in plants. Nat Rev Mol Cell Biol 2: 849-857. [CrossRef]
- Liu Y. (2006). Historical and modern genetics of plant graft hybridization. Adv Genet 56: 101-129.
- Kamiyama M., J. K. Moon, H. W. Jang and T. Shibamoto. (2015). Role of degradation products of chlorogenic acid in the antioxidant activity of roasted coffee. Journal of Agricultural and Food Chemistry 63:1996-2005. [CrossRef]
- Kim M, Canio W, Kessler S, Sinha N. (2001). Developmental changes due to long-distance movement of a homeobox fusion transcript in tomato. Science 293: 287–289. [CrossRef]
- Loader T. B., C. G. Taylor, P. Zahradka and P. J. H. Jones. (2017). Chlorogenic acid from coffee beans: evaluating the evidence for a blood pressure-regulating health claim. Nutrition Reviews, 75:114-133. [CrossRef]
- Macrae, R. (1985). Nitrogenous compounds. In: Coffee, Volume 1: Chemistry (edited by R.J. Clarke & R. Macrae). Pp. 115-152. London: Elsevier Applied Science.
- Martin M. J., Pablos F., Gonzalez A. G. (1998a). Characterization of green coffee varieties according to their metal content. Anal Chim. Acta 358:177-183.
- Martin MJ, Pablos F, Gonzalez AG. (1999). Characterization of arabica and robusta roasted coffee varieties and mixture resolution according to their mineral content. Food Chem 66:365-370.
- Mahamud R., Ramamohanarao K., Buyya R. (2020). Application Management in Fog Computing Environments: A Taxonomy, Review and Future Directions. ACM Computing SurveysVolume 53 Issue 4 Article No: 88 pp 1-43. [CrossRef]
- Marta Mesías M., Morales F. J. (2015). Acrylamide in commercial potato crisps from Spanish market: Trends from 2004 to 2014 and assessment of the dietary exposure, Food and Chemical Toxicology, Volume 81, Pages 104-110, ISSN 0278-6915. [CrossRef]
- Monteiro, M. C., A. Farah. (2012). Chlorogenic acids in Brazilian Coffea arabica cultivars from various consecutive crops. Food Chem., 134: 611-614. [CrossRef]
- Natella F., and Scaccini C. (2012). Role of coffee in modulation of diabetes risk, Nutrition Reviews, Volume 70, Issue 4, 1 April 2012, Pages 207–217. [CrossRef]
- Nakilcioğlu-Taş, E., & Ötleş, S. (2019). Physical characterization of Arabica ground coffee with different roasting degrees. Anais Da Academia Brasileira de Ciências, 91(2). e20180191. [CrossRef]
- Oliveira M, Casal S, Morais S, Alves C, Dias F, Ramos S, Mendes E, Delerue-Matos C, Oliveira BPP. (2012). Intra and interspecific mineral composition variability of commercial coffees and coffee substitutes. Contribution to mineral intake. Food Chem 130:702-709.
- Oliveira Marta, Sandra Ramos, Cristina Delerue-Matos, Simone Morais. (2015). Espresso beverages of pure origin coffee: Mineral characterization, contribution for mineral intake and geographical discrimination. Food Chemistry. Volume 177, pp 330-338. [CrossRef]
- Puerta, G. I. (2011). Composición química de una taza de café. Avances Técnicos Cenicafé, 414, 1–12. http://hdl. handle.net/10778/340.
- Pohl, P., Stelmach, E., Welna, M. (2013). Determination of the Elemental Composition of Coffee Using Instrumental Methods. Food Anal. Methods 6, 598-613 (2013). [CrossRef]
- Rajwanshi P, Singh V, Gupta MK, Kumar V, Shrivastav R, Ramanamurthy M, Dass S. (1997). Studies on aluminium leaching from cook- ware in tea and coffee and estimation of aluminium content in toothpaste, baking powder and paan masala. Sci Total Environ 193:243-249.
- Rahn E., Vaast P., Läderach P., van Asten P., Jassogne L., Ghazoul J. (2018). Exploring adaptation strategies of coffee production to climate change using a process-based model, Ecological Modelling, Volume 371, Pages 76-89, ISSN 0304-3800. [CrossRef]
- Ribeiro J. S., Augusto F., Salva T. J. G., Thomaziello R. A., Ferreira M. M. C. (2009). Prediction of sensory properties of Brazilian Arabica roasted coffees by headspace solid phase microextraction-gas chromatography and partial least squares. Anal Chim Acta 23;634(2):172-9. [CrossRef]
- Rosas A.J., Escamilla P.E., Ruiz R.O. (2008). Relación de los nutrimentos del suelo con las características físicas y sensorales del café orgánico. Terra Latin. 26: 375-384.
- Rusk, N. (2009). Grafting as a potent molecular tool. Nat Methods 6, 484. [CrossRef]
- Sadeghian K. S. y A. Salamanca J. (2015). Micronutrientes en frutos y hojas de café. Cenicafé 66:73-87.
- Samper, L.; Giovannucci, D.; Vieira, L. (2017). The Powerful Role of Intangibles in the Coffee Value Chain. 2017. Available online: https://ideas.repec.org/p/wip/wpaper/39.html (accessed on 5 March 2023).
- Sánchez-González, E., & Muñoz, J. (2022). MANEJO DE Meloidogyne incognita MEDIANTE INJERTO DE Coffea arabica en Coffea canephora, OXAMILO Y Trichoderma atroviride. Ciencia Agropecuaria, (34), 23-47.
- SAS Institute (2011) 9.3 User’s Guide. SAS/STAT®. SAS Institute Inc. Cary, NC, USA. 178 p.
- SE, Secretaría de Economía (2011) Declaratoria de Vigencia de la Norma Mexicana NMX-F-182-SCFI-2011, Café-Determinación del Contenido de Cafeína-Método por Cromatografía Líquida de Alta Resolución (Método de Referencia). Diario Oficial de la Federación. México, D. F. 06 de junio de 2011.
- Somporn, C., A. Kamtuo, P. Theerakulpisut, S. Siriamornpun. (2011). Effect of shading on yield, sugar content, phenolic acids and antioxidant property of coffee beans (Coffea arabica L. cv. Catimor) harvested from north-eastern Thailand. J. Sci. Food Agric., 92: 1956-1963. [CrossRef]
- Stegemann S, Bock R. (2009). Exchange of genetic material between cells in plant tissue grafts. Science 324: 649-651. [CrossRef]
- Suárez S.J.C., Rodríguez B.E.H., Duran B.E.H. (2015). Efecto de las condicones de cultivo, las caractriticas químicas del suelo y el manejo de grano en los atributos sensoriales de café (Coffea arabica L.) en taza. Acta Agron. 64: 342-348.
- Suseela B, Bhalke S, Vinod Kumar A, Tripathi RM, Sastry VN. (2001). Daily intake of trace metals through coffee consumption in India. Food Addit Contam 18:115–120.
- Tagliaferro FS, de Nadai Fernandes EA, Bacchi MA. (2006). Quality assessment of organic coffee beans for the preparation of a candidate reference material. J Radioanal Nucl Chem 269:371-375. [CrossRef]
- Temis-Pérez A.L., López-Malo A., Sosa-Morales M.E. (2011). Producción de café (Coffea arabica L.): cultivo, beneficio, plagas y enfermedades. Temas Selectos de Ingeniería de Alimentos 5: 54-74.
- Thyssen G, Svab Z, Maliga P. (2012). Cell-to-cell movement of plastids in plants. Proc Natl Acad Sci USA 109: 2439-2443.
- Tfouni, S. A. V., L.B. Carreiro, C.R.A. Teles, R.P.Z. Furlani, K.M.V.A.B. Cipolli, M.C.R. Camargo. (2013). Caffeine and chlorogenic acids intake from coffee brew: influence of roasting degree and brewing procedure. Int. J. Food Sci. Technol., 49: 747-752, 2013. [CrossRef]
- Variação de características físicas e químicas de café arábica durante a torra parte II: Características Químicas. En Consórcio Pesquisa Café e Desenvolvimento do Café (Organizador), II Simpósio de Pesquisa dos Cafés do Brasil, Vitória, Espírito Santo, Brasil. http://www.sbicafe.ufv.br/ handle/123456789/1244.
- Vega-Carrillo HR, Iskander FY, Manzanares-Acuna E. (2002). Elemental content in ground and soluble/instant coffee. J Radioanal Nucl Chem 252: 75-80. [CrossRef]
- Villalta-Villalobos J., and Gatica-Arias A. (2019). Una mirada en el tiempo: mejoramiento genético de café mediante la aplicación de la biotecnología 1 Agronomía Mesoamericana, vol. 30, núm. 2. Universidad de Costa Rica. Programa Cooperativo Centroamericano para el Mejoramiento Cultivos y Animales. [CrossRef]
- Vitorino, M. D., Franca, A. S., Oliveira, L. S., & Andrade, F. M. (2001). Variação de características físicas e químicas de café arábica durante a torra parte II: Características Químicas. En Consórcio Pesquisa Café e Desenvolvimento do Café (Organizador), II Simpósio de Pesquisa dos Cafés do Brasil, Vitória, Espírito Santo, Brasil. http://www.sbicafe.ufv.br/ handle/123456789/1244.
- Wu R, Wang X, Lin Y, Ma Y, Liu G, et al. (2013). Inter-Species Grafting Caused Extensive and Heritable Alterations of DNA Methylation in Solanaceae Plants. PLOS ONE 8(4): e61995. [CrossRef]
- Zaidi JH, Fatima I, Arif M, Qureshi IH. (2006). Determination of trace elements in coffee beans and instant coffee of various origins by INAA. J Radioanal Nucl Chem 267:109-112. [CrossRef]
- https://varieties.worldcoffeeresearch.org/es/varieties/costa-rica-95.
Figure 1.
Caffeine concentration in beans of four coffee varieties.
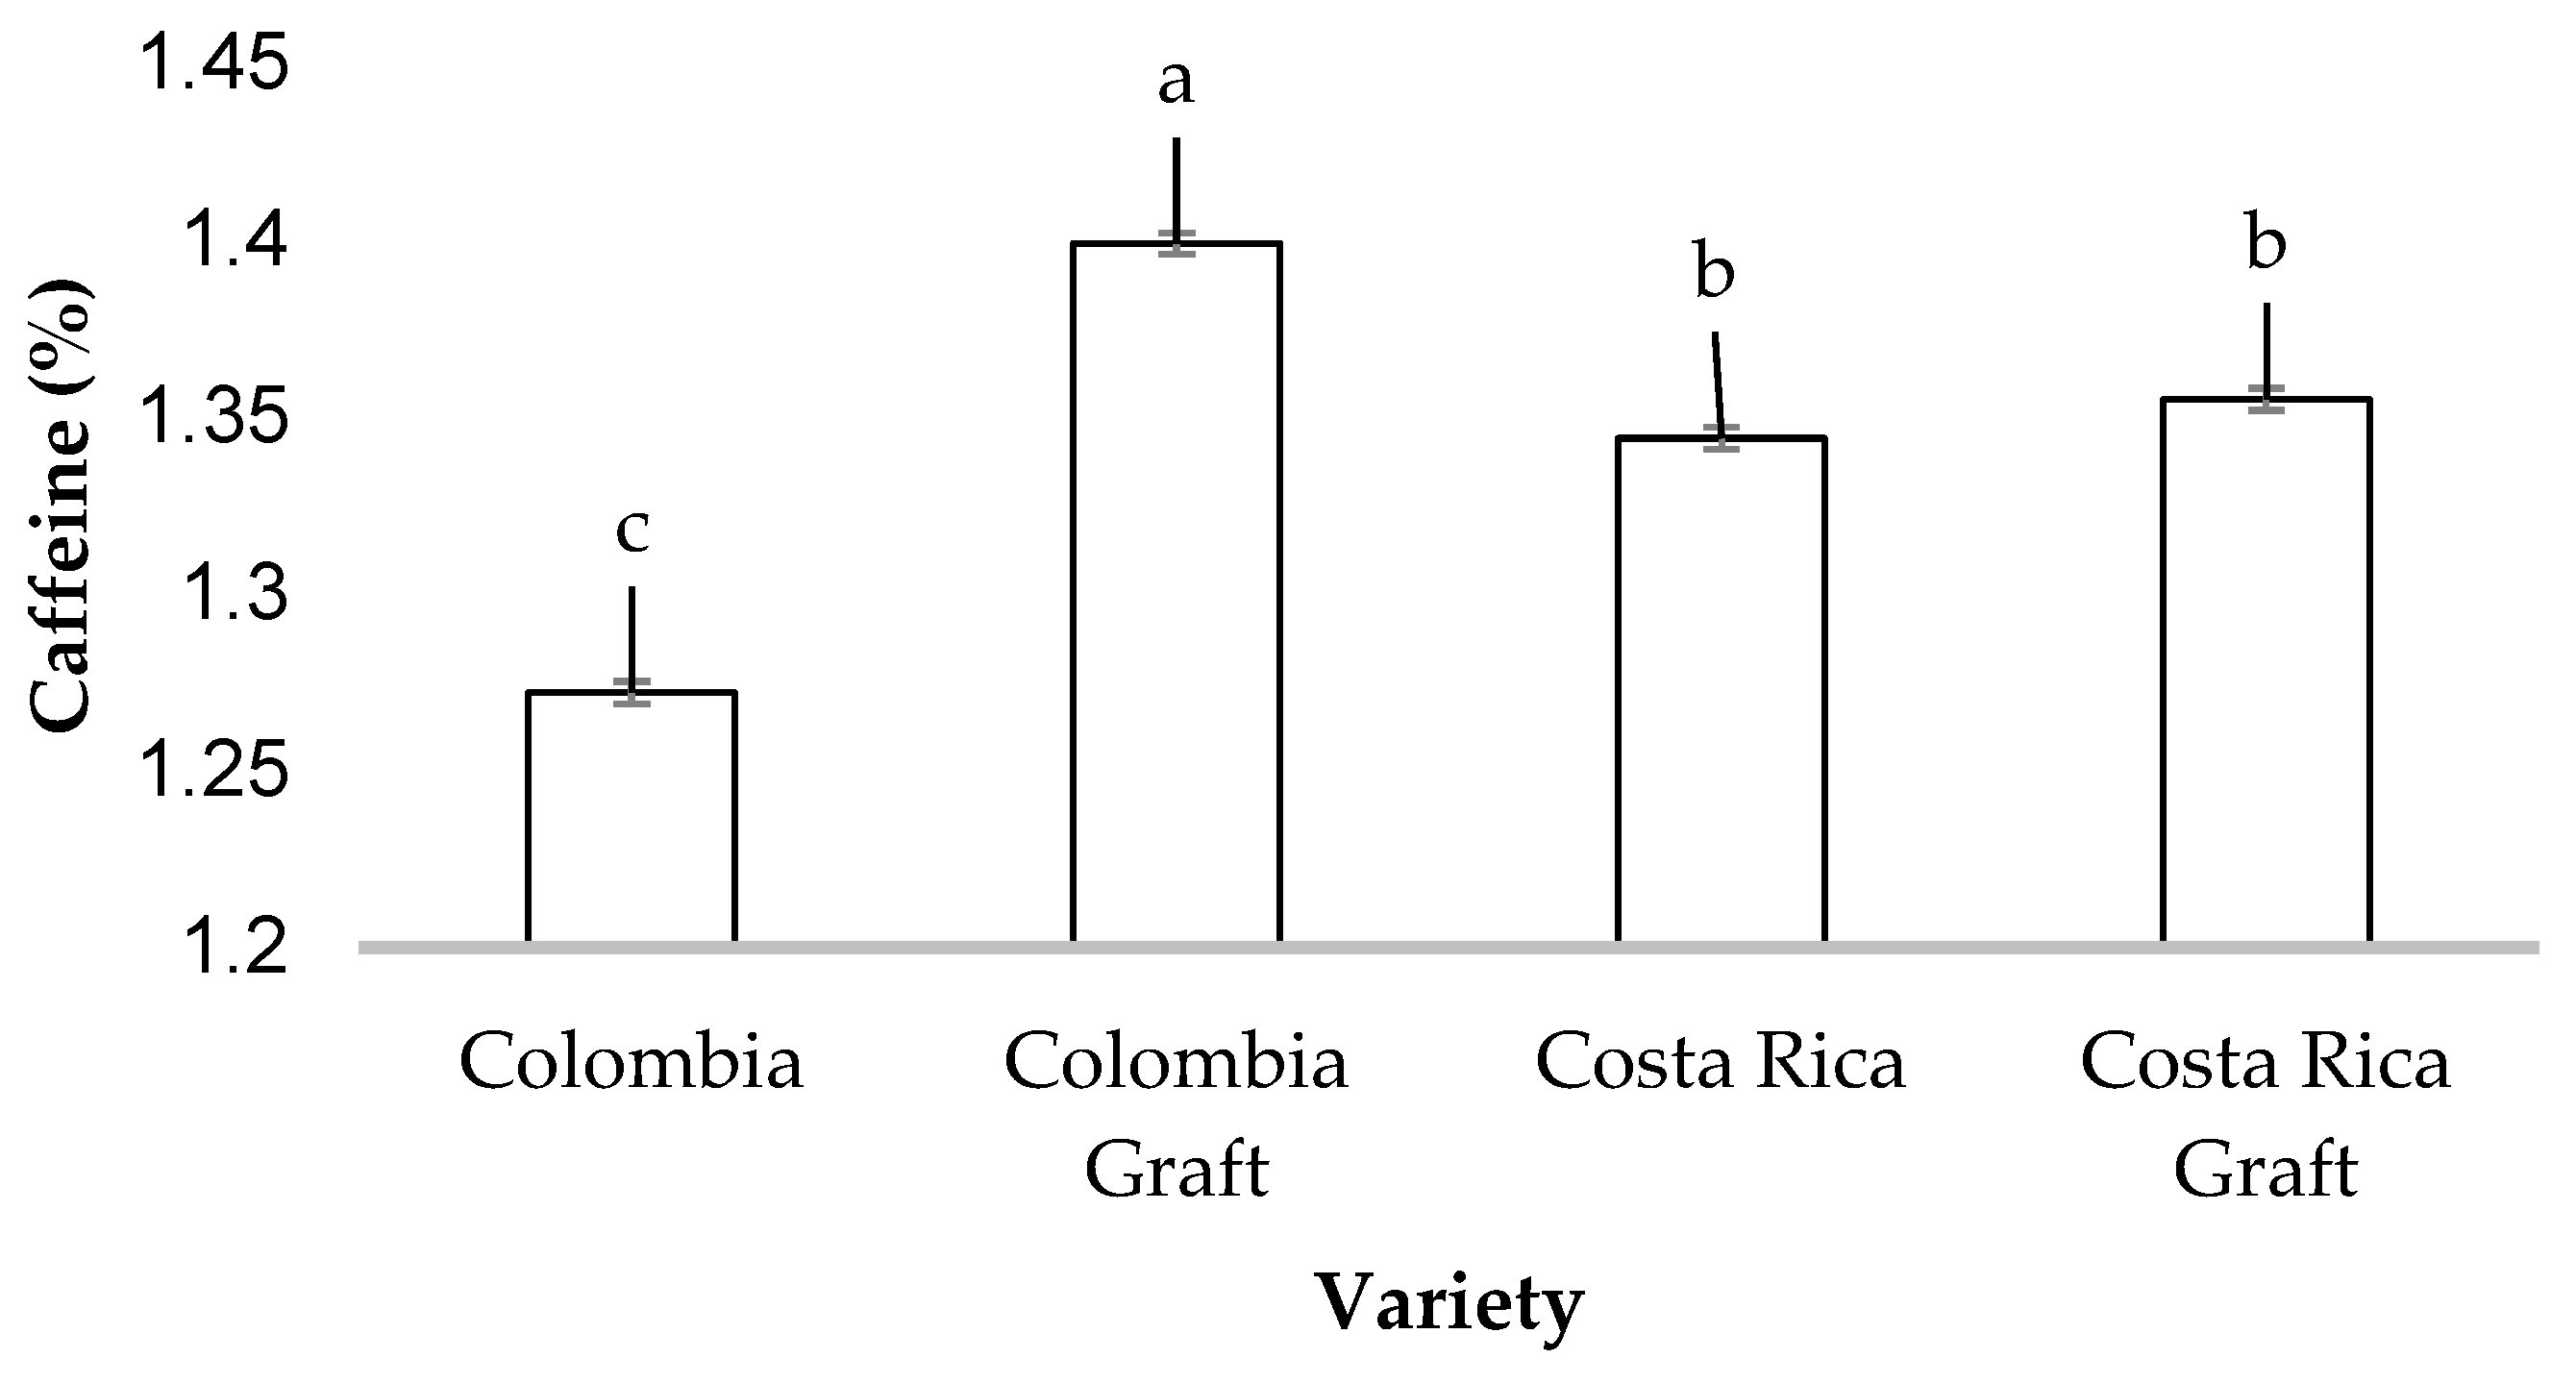
Figure 2.
Caffeine concentration in coffee beans with five different levels of roasting. Means ± SE with different letters in each bar indicate significant statistical differences (p ≤ 0.05).
Figure 2.
Caffeine concentration in coffee beans with five different levels of roasting. Means ± SE with different letters in each bar indicate significant statistical differences (p ≤ 0.05).
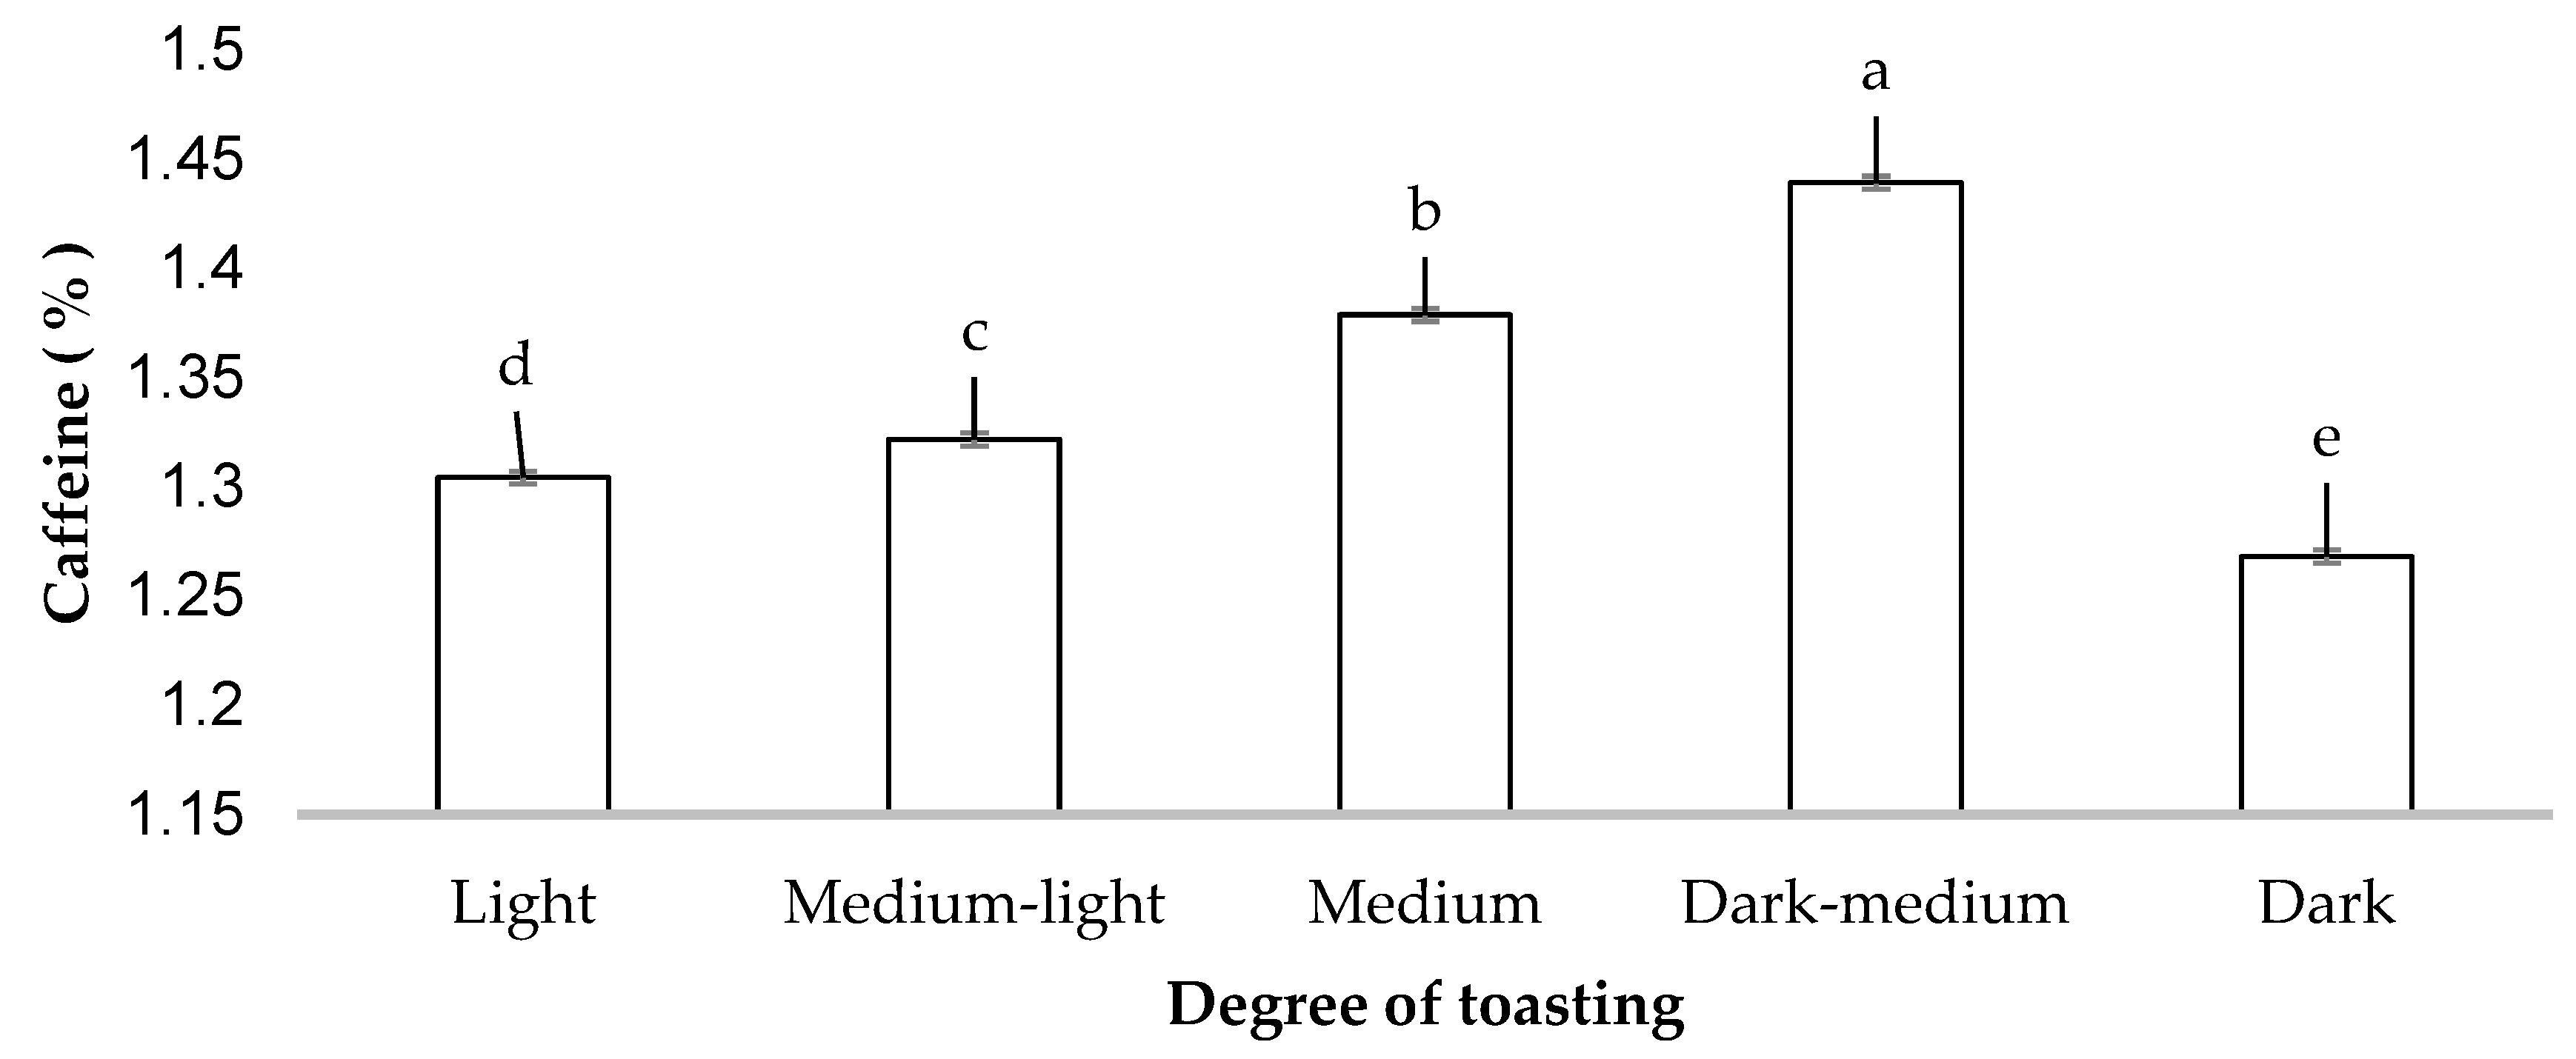
Figure 3.
Chlorogenic acid (5-CQA) concentration in beans of four coffee varieties. Means ± SE with different letters in each bar indicate significant statistical differences (p ≤ 0.05).
Figure 3.
Chlorogenic acid (5-CQA) concentration in beans of four coffee varieties. Means ± SE with different letters in each bar indicate significant statistical differences (p ≤ 0.05).
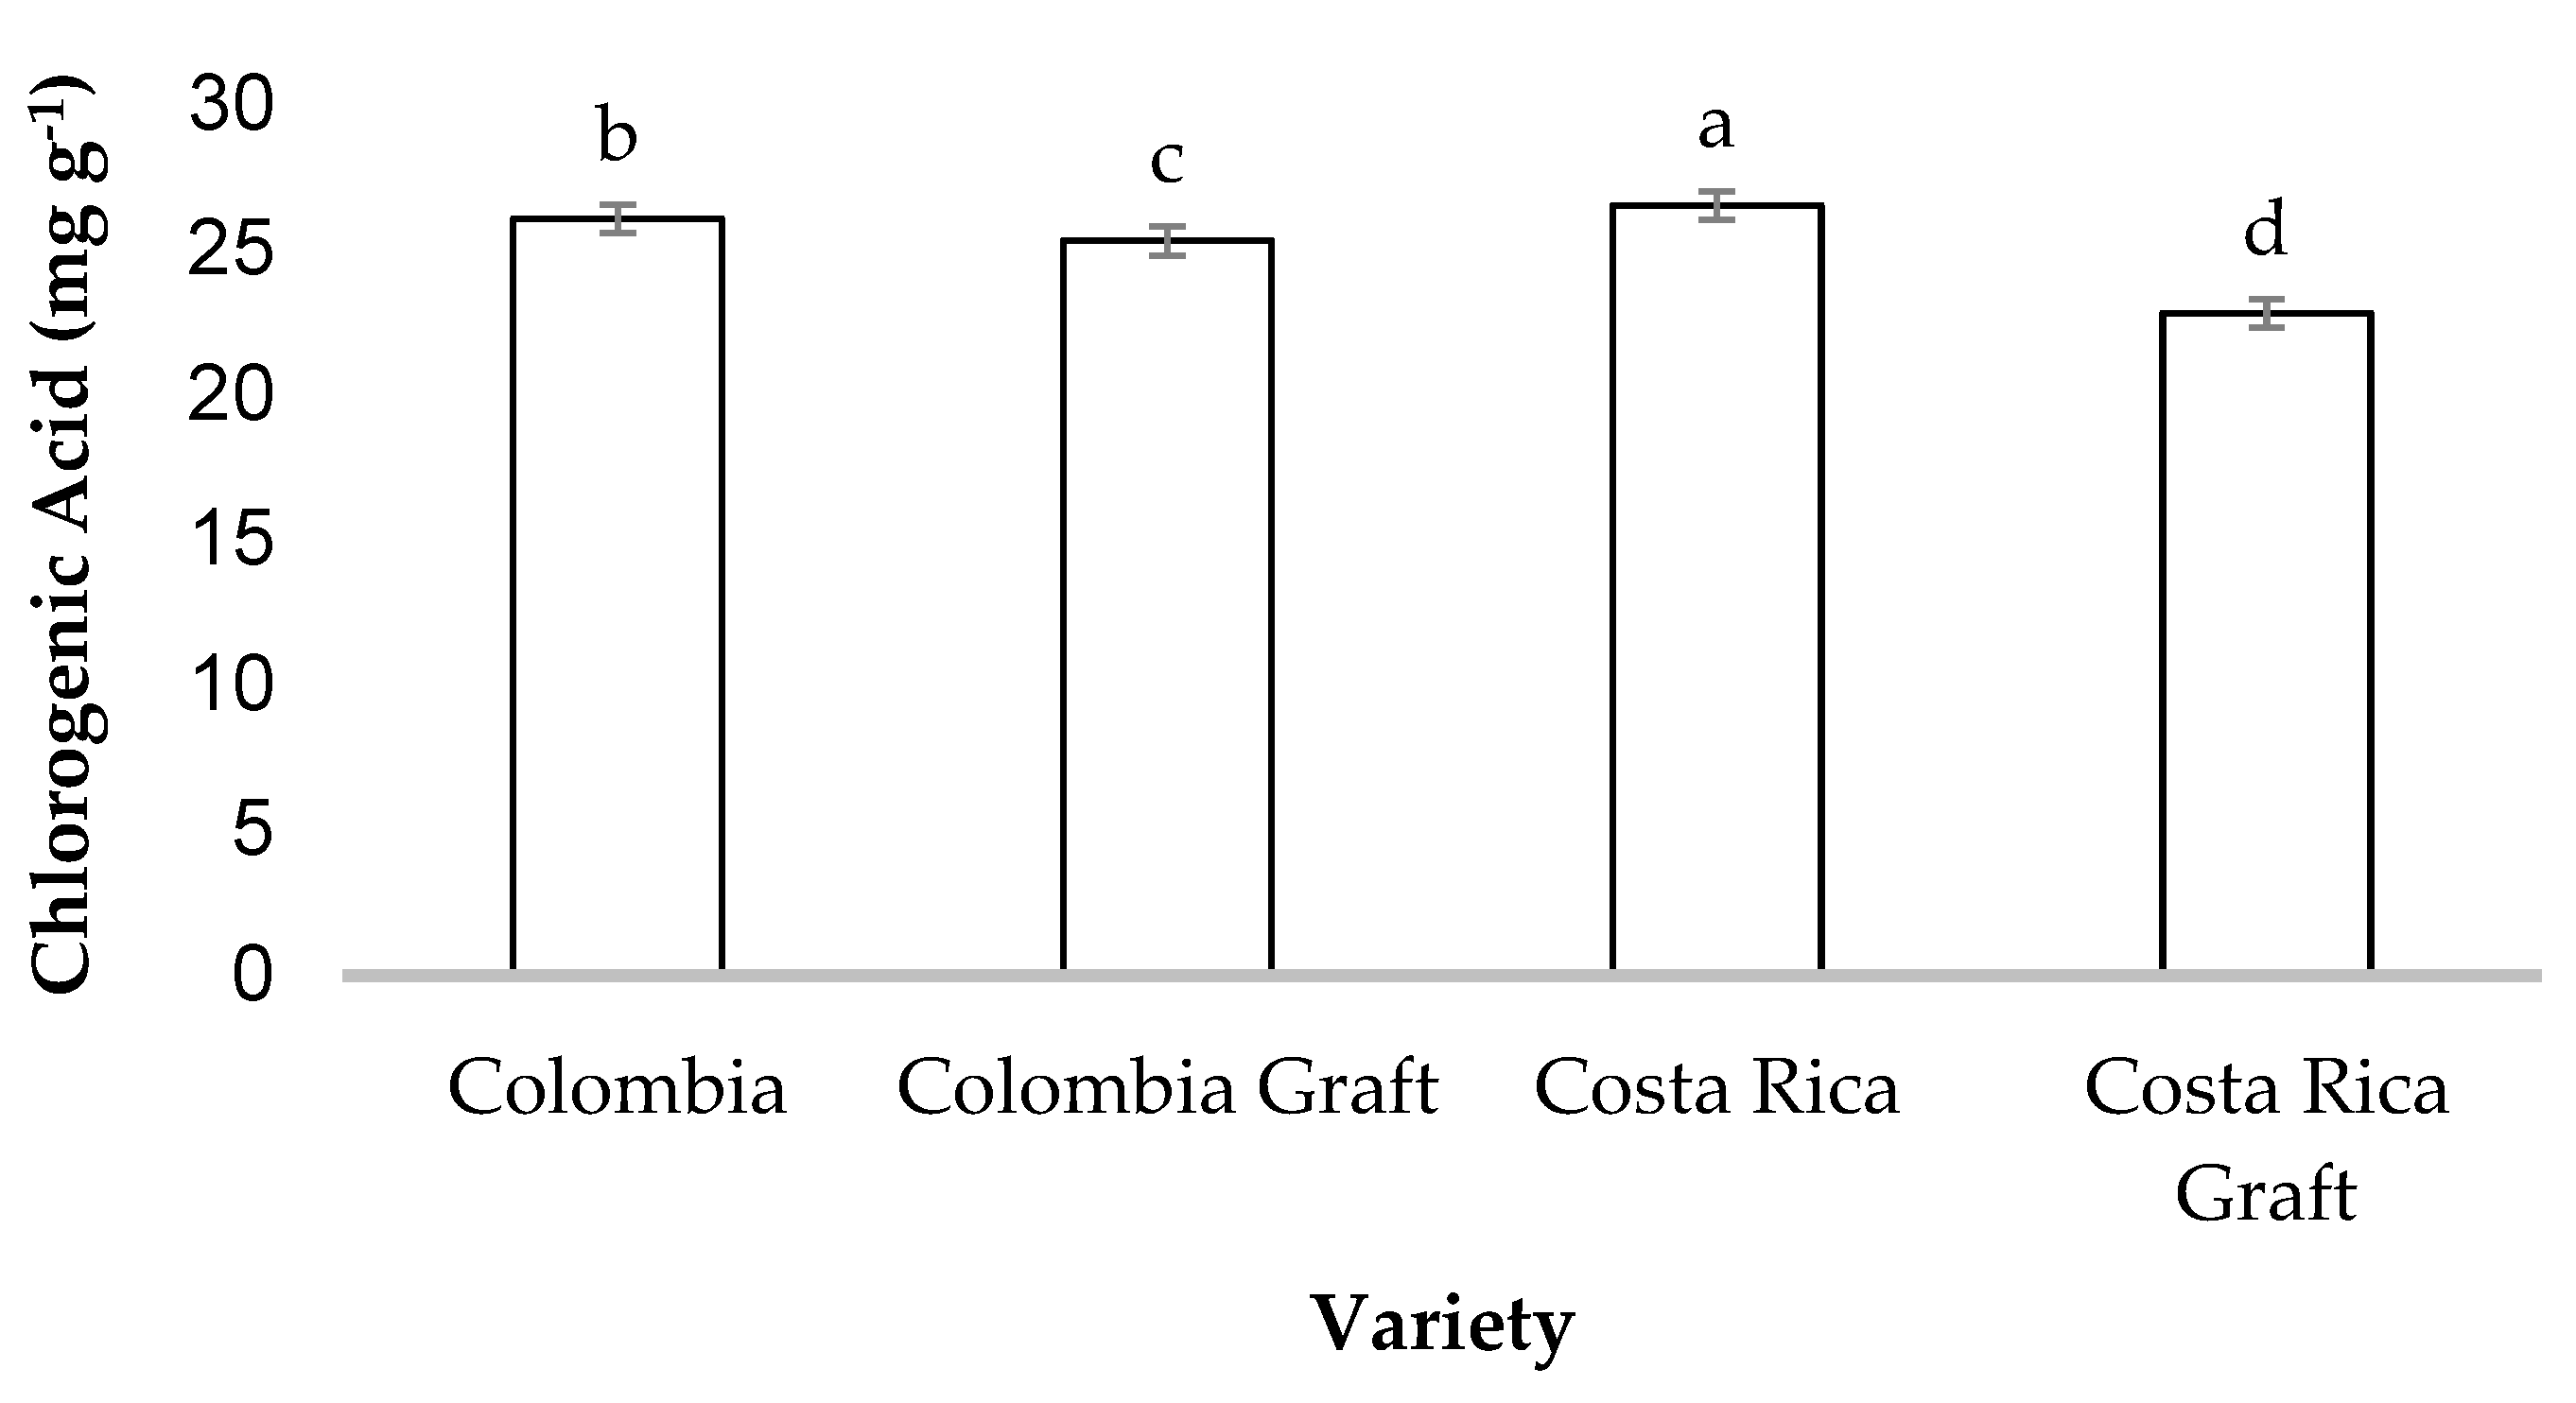
Figure 4.
Chlorogenic acid concentration in coffee beans at five different roasting levels. Means ± SE with different letters in each bar indicate significant statistical differences (p ≤ 0.05).
Figure 4.
Chlorogenic acid concentration in coffee beans at five different roasting levels. Means ± SE with different letters in each bar indicate significant statistical differences (p ≤ 0.05).
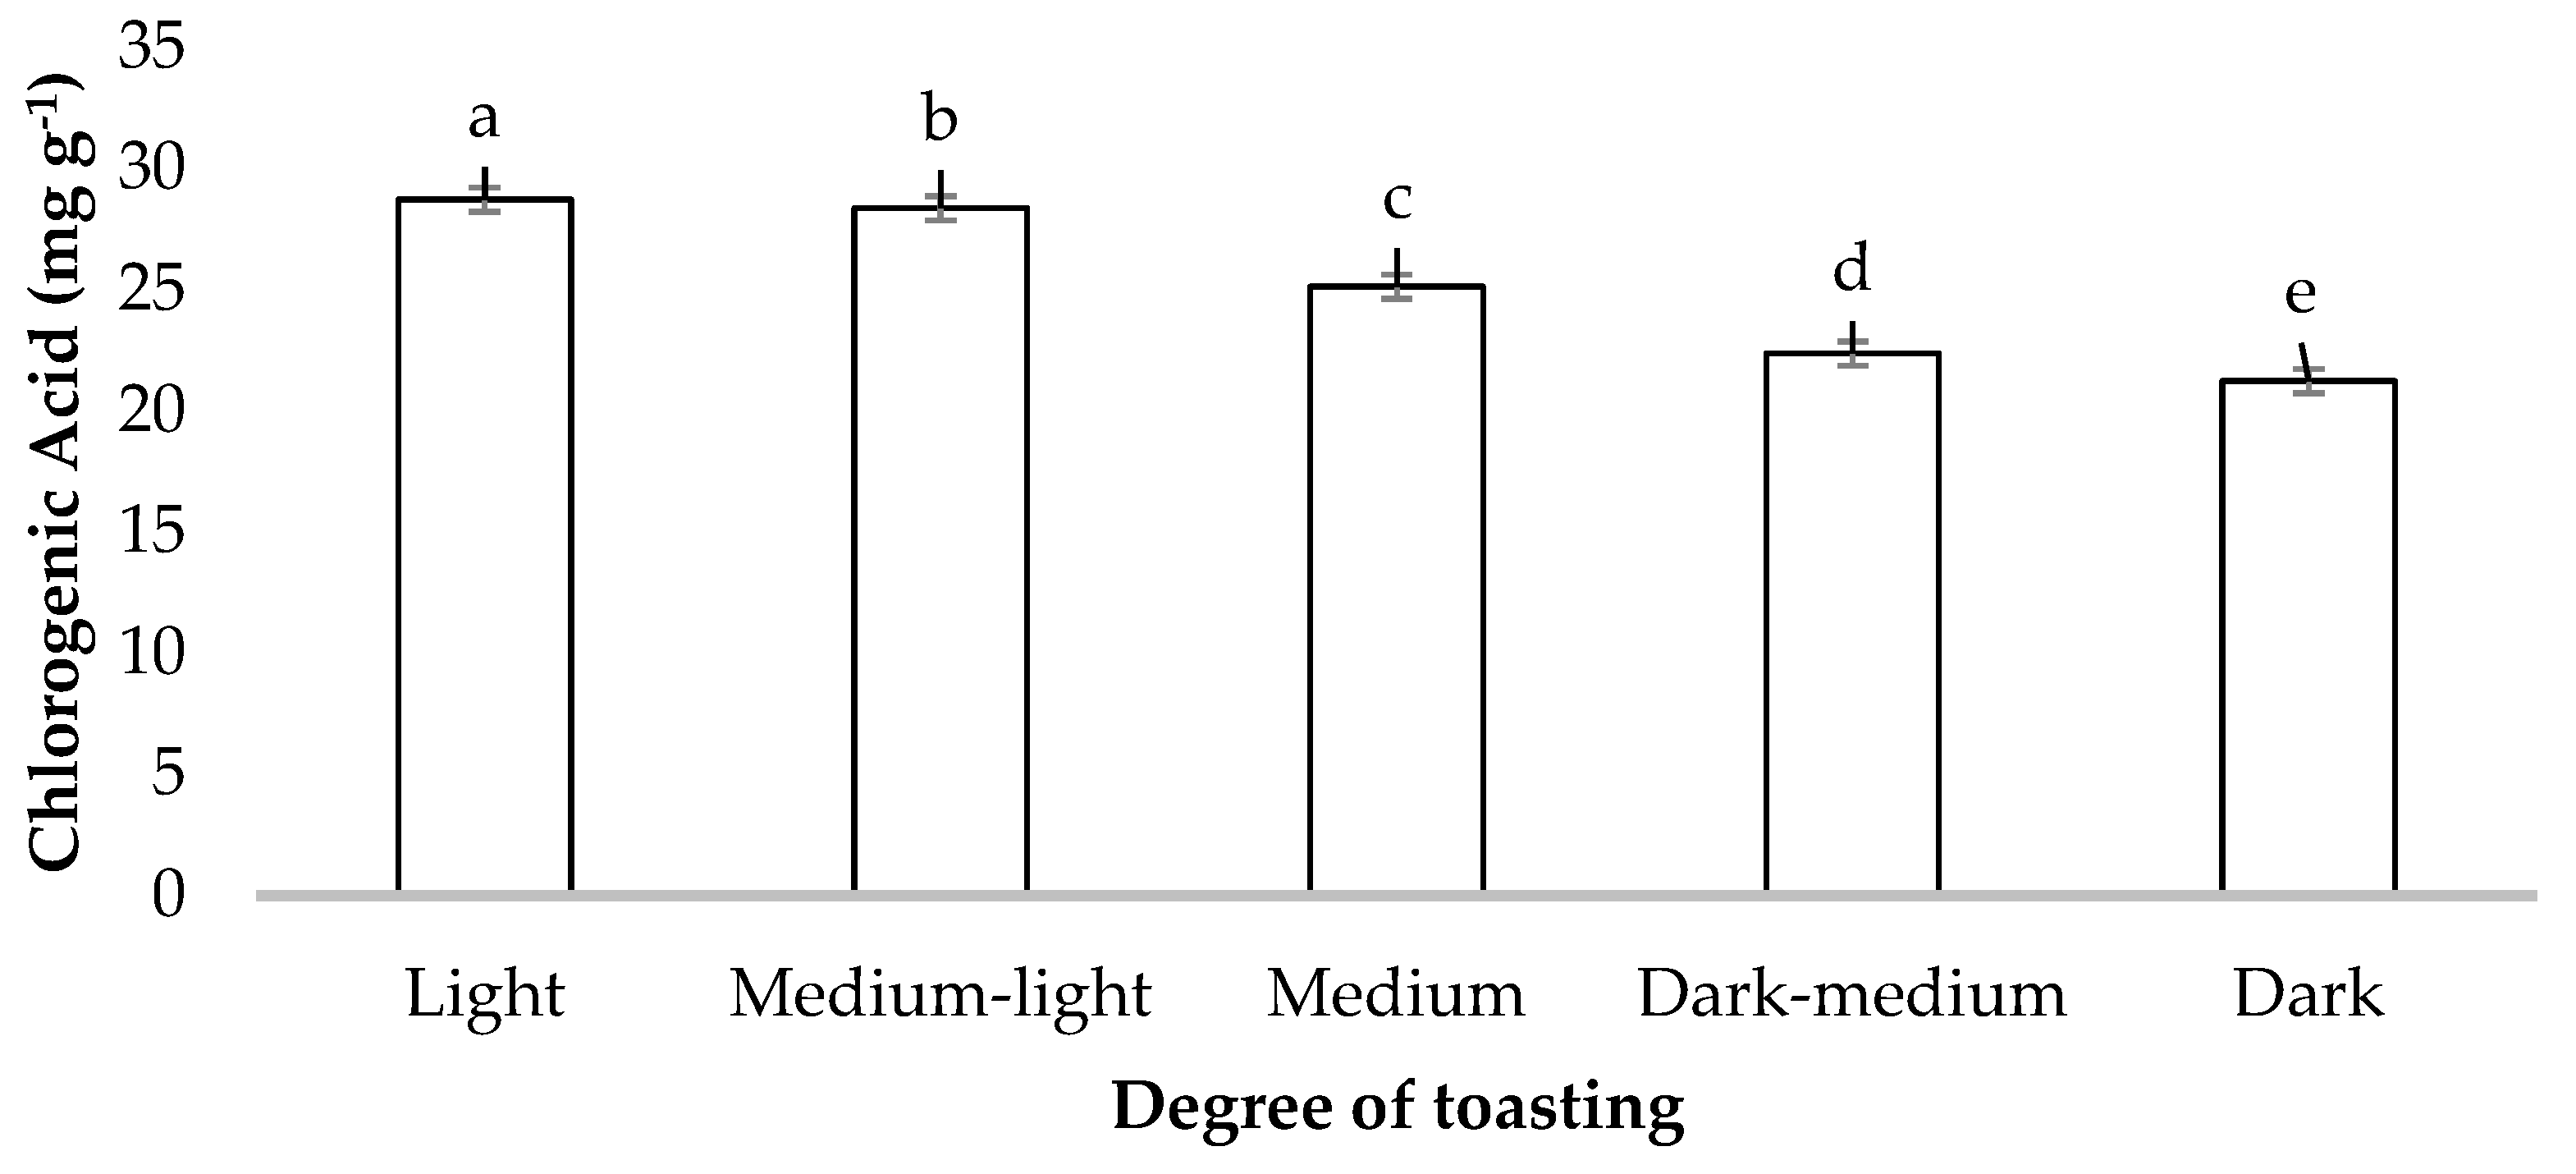
Figure 5.
Acrylamide concentration in beans of four coffee varieties. Means ± SE with different letters in each bar indicate significant statistical differences (p ≤ 0.05).
Figure 5.
Acrylamide concentration in beans of four coffee varieties. Means ± SE with different letters in each bar indicate significant statistical differences (p ≤ 0.05).
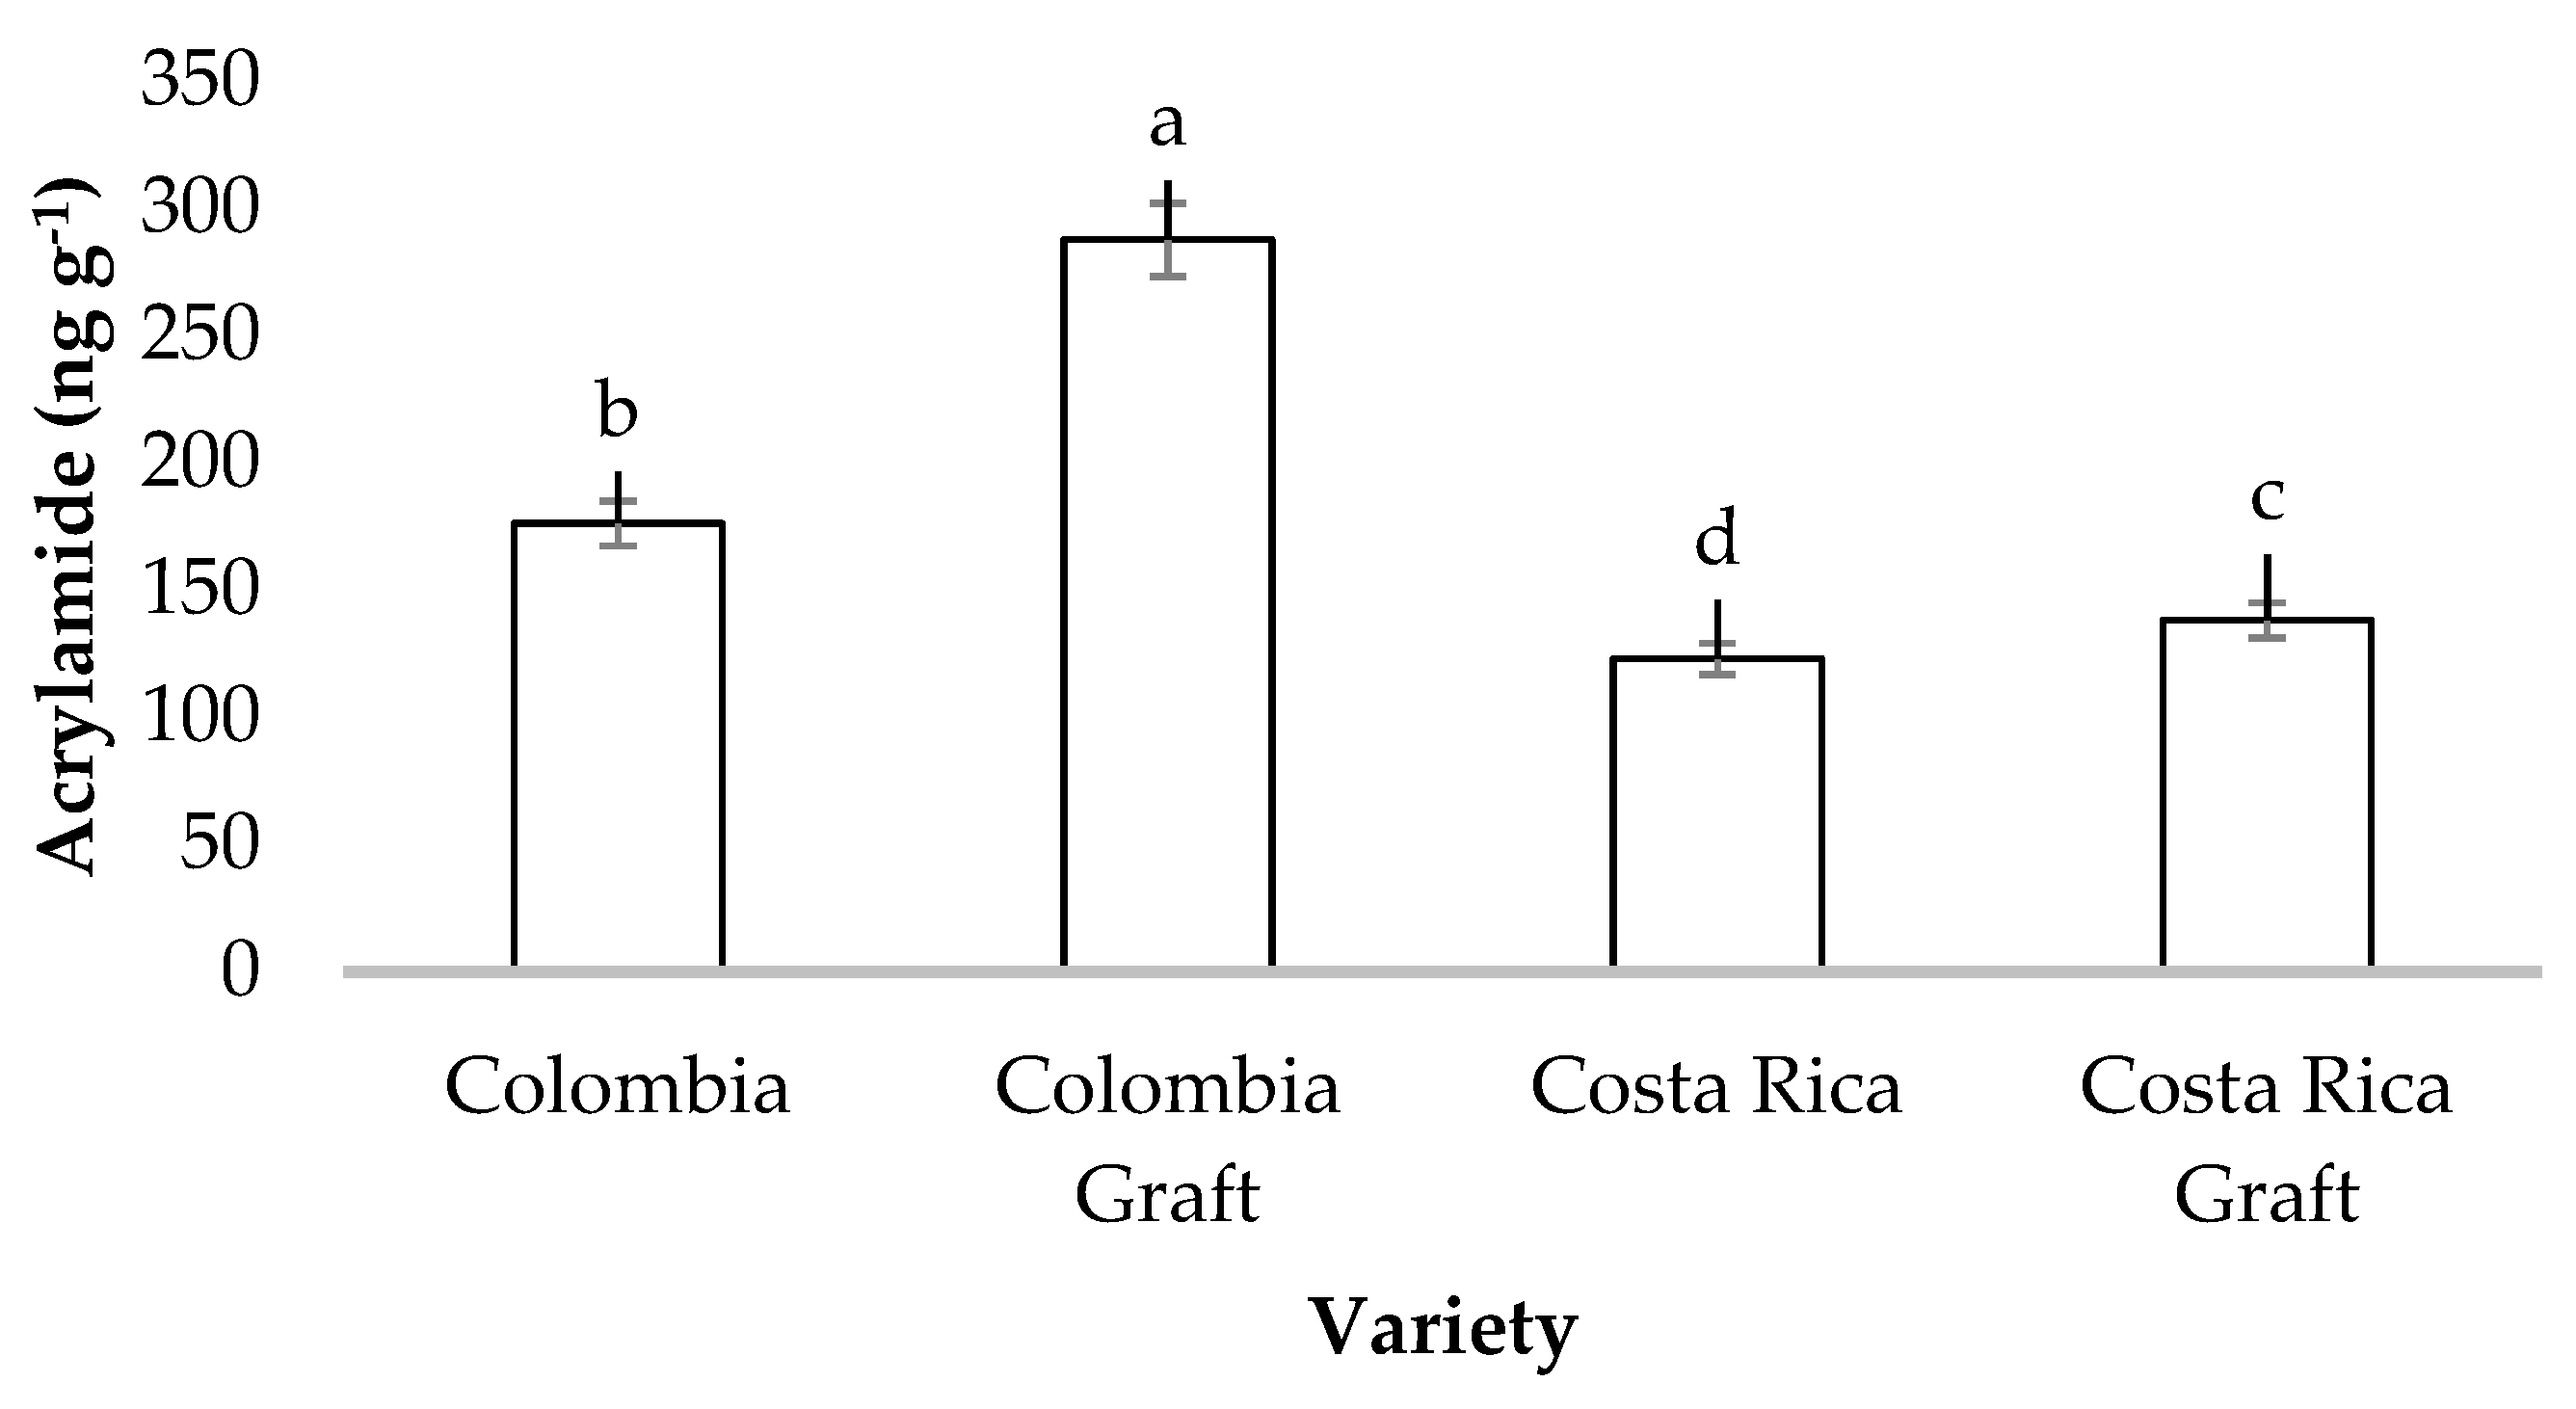
Figure 6.
Acrylamide content in coffee beans with five different degrees of roasting. Means ± SE with different letters in each bar indicate significant statistical differences (p ≤ 0.05).
Figure 6.
Acrylamide content in coffee beans with five different degrees of roasting. Means ± SE with different letters in each bar indicate significant statistical differences (p ≤ 0.05).
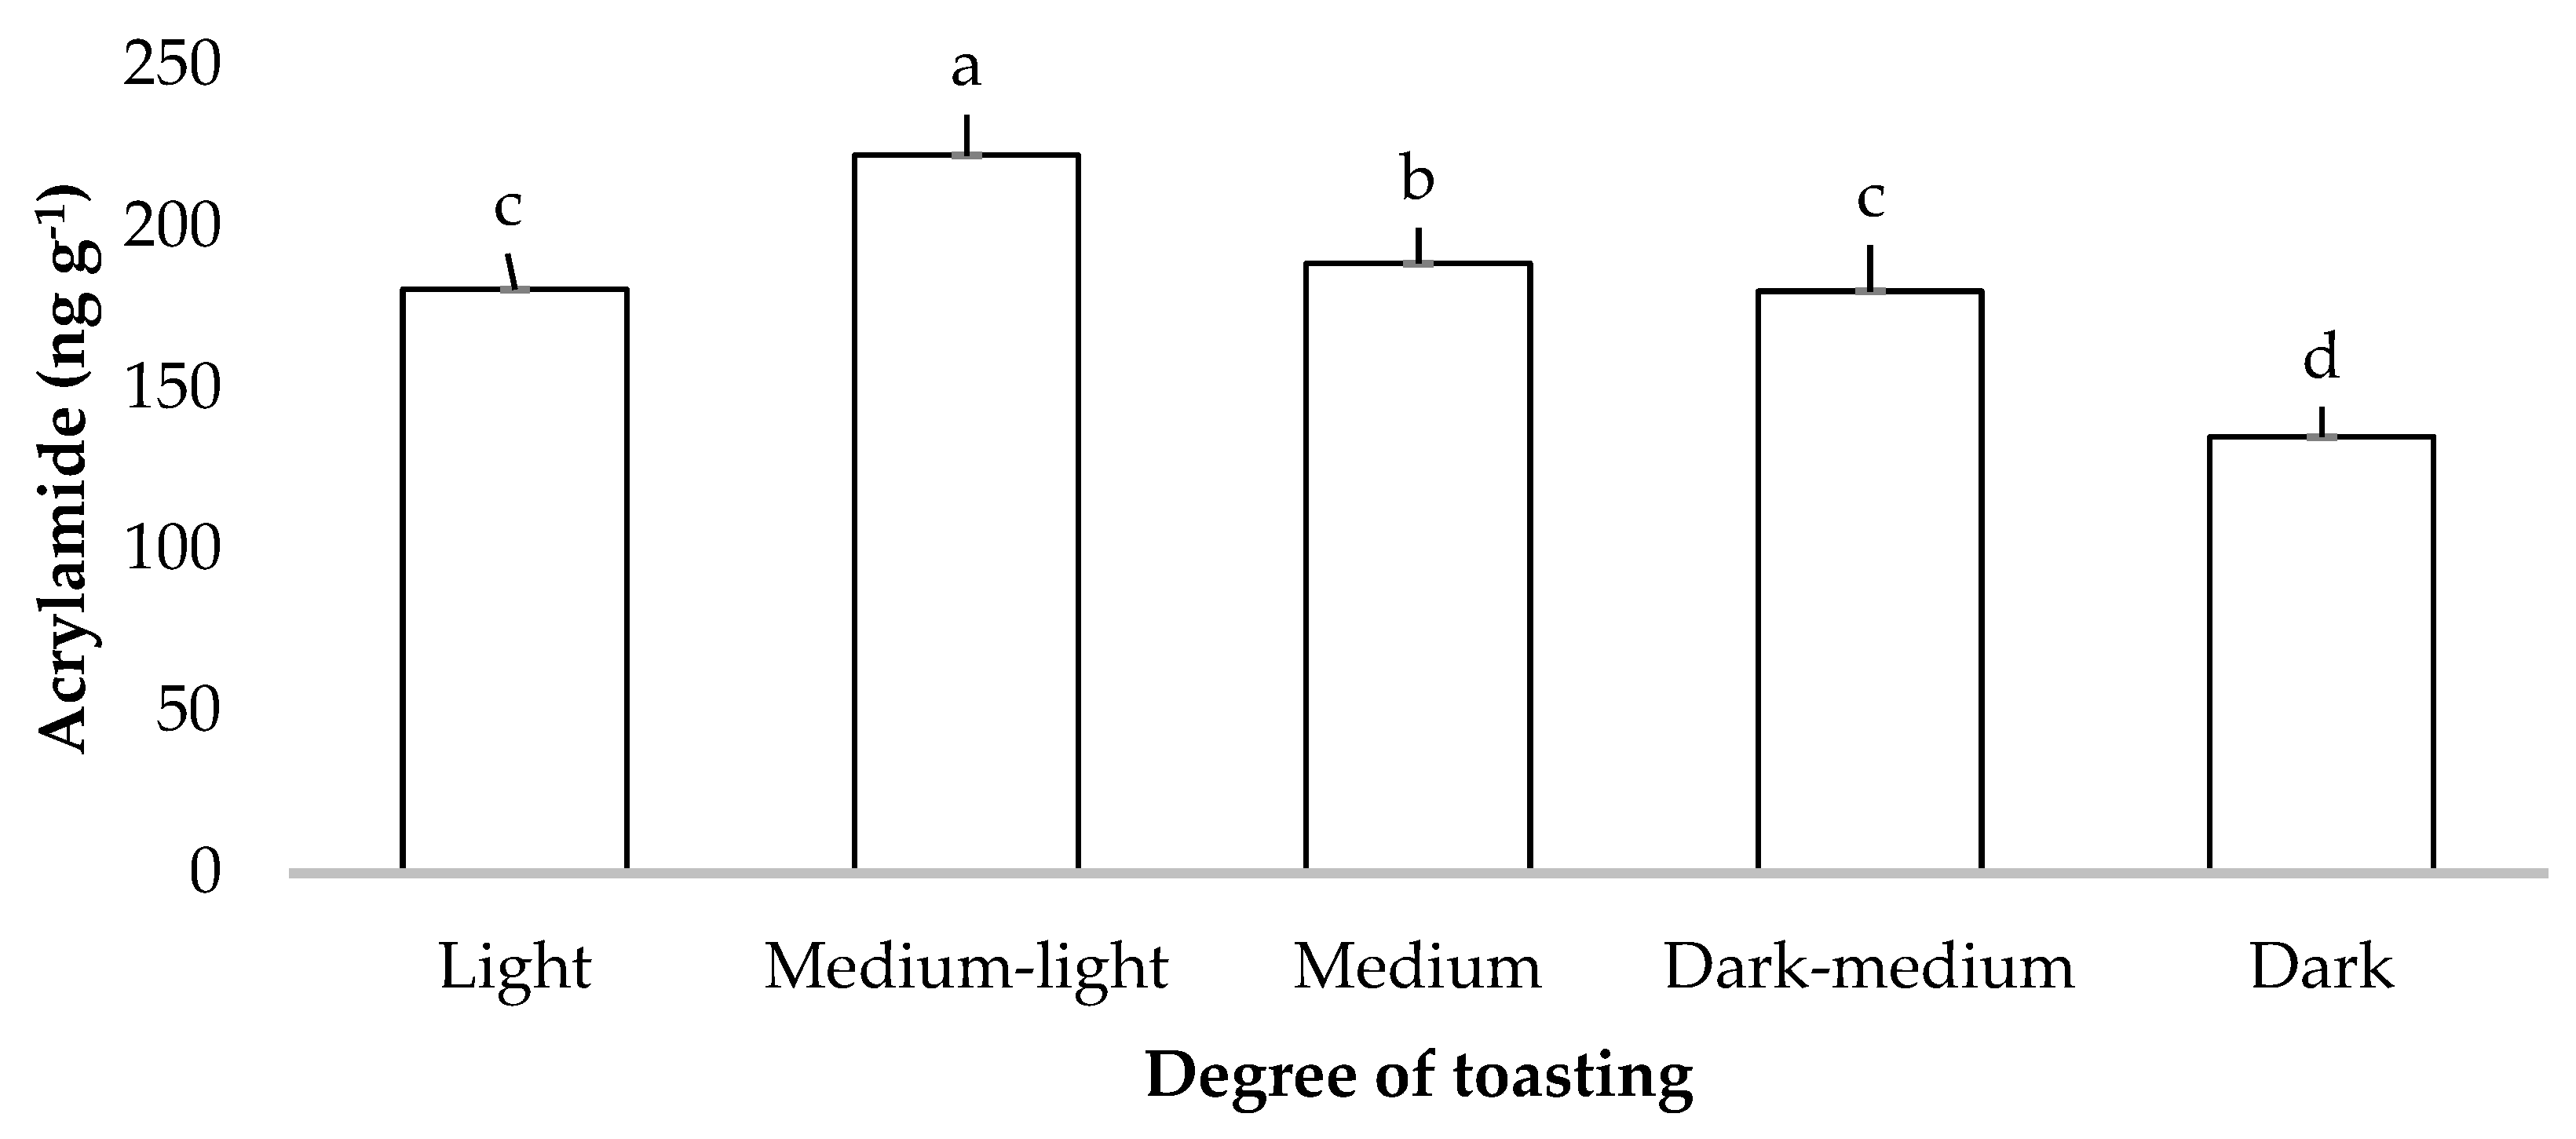

Table 1.
Conditions of coffee beans with five roast levels.
| Roast level | |||||
|---|---|---|---|---|---|
| Conditions | Light | Medium-light | Medium | Dark-medium | Dark |
| Charge temperature (°C) | 150 | 150 | 160 | 190 | 220 |
| Final temperature (°C) | 174.81 | 180-190 | 190-210 | 200-220 | 230-240 |
| Initial weight (g) | 1,000.00 | 1,000.00 | 1,000.00 | 1,000.00 | 1,000.00 |
| Agtron Color (Å) | 75-70 | 70-65 | 65-58 | 58-45 | 45-35 |
| Initial Humidity (%) | 12 | 12 | 12 | 12 | 12 |
Table 2.
Concentración de macronutrimentos por la interacción de variedad y grados de tostado en gtranos de café.
Table 2.
Concentración de macronutrimentos por la interacción de variedad y grados de tostado en gtranos de café.
| Variedad | Degree of toasting | N | P | K | Ca | Mg |
|---|---|---|---|---|---|---|
| g kg-1 | ||||||
| Colombia | Light | 18.2875±1.646 bcde | 0.015±0.000 abcd | 0.876±0.041 a | 0.008±0.000 bc | 0.042±0.133 a |
| Medium-light | 20.475±1.646 abcd | 0.015±0.000 abcd | 0.937±0.041 a | 0.008±0.000 bcd | 0.036±0.133 a | |
| Medium | 22.225±1.646 abcd | 0.016±0.000 abcd | 0.945±0.041 a | 0.007±0.000 bcde | 0.043±0.133 a | |
| Dark-medium | 22.400±1.646 abcd | 0.015±0.000 bcd | 0.941±0.041 a | 0.010±0.000 a | 0.071±0.133 a | |
| Dark | 17.675±1.646 cde | 0.015±0.000 abcd | 0.970±0.041 a | 0.007±0.000 cde | 0.471±0.133 a | |
| Colombia Graft | Light | 18.200±1.646 bcde | 0.015±0.000 abcd | 1.060±0.041 a | 0.007±0.000 cde | 0.044±0.133 a |
| Medium-light | 21.700±1.646 abcd | 0.015±0.000 bcd | 0.877±0.041 a | 0.007±0.000 cde | 0.040±0.133 a | |
| Medium | 24.150±1.646 abc | 0.016±0.000 abcd | 0.929±0.041 a | 0.006±0.000 de | 0.044±0.133 a | |
| Dark-medium | 21.350±1.646 abcd | 0.015±0.000 abcd | 0.982±0.041 a | 0.007±0.000 bcde | 0.062±0.133 a | |
| Dark | 25.725±1.646 abc | 0.016±0.000 abcd | 1.041±0.041 a | 0.006±0.000 de | 0.038±0.133 a | |
| Costa Rica | Light | 21.175±1.646 abcd | 0.015±0.000 abcd | 0.985±0.041 a | 0.007±0.000 cde | 0.044±0.133 a |
| Medium-light | 20.388±1.646 abcd | 0.015±0.000 bcd | 0.942±0.041 a | 0.009±0.000 ab | 0.092±0.133 a | |
| Medium | 24.325±1.646 abc | 0.014±0.000 d | 0.881±0.041 a | 0.006±0.000 e | 0.036±0.133 a | |
| Dark-medium | 26.075±1.646ab | 0.015±0.000 bcd | 0.970±0.041 a | 0.007±0.000 cde | 0.085±0.133 a | |
| Dark | 18.375±1.646 abcd | 0.015±0.000 dc | 0.933±0.041 a | 0.006±0.000 de | 0.048±0.133 a | |
| Costa Rica Graft | Light | 19.863±1.646 abcd | 0.017±0.000 abc | 0.897±0.041 a | 0.007±0.000 cde | 0.064±0.133 a |
| Medium-light | 15.750±1.646 de | 0.018±0.000 abc | 1.008±0.041 a | 0.007±0.000 bcde | 0.102±0.133 a | |
| Medium | 10.763±1.646 e | 0.018±0.000 abc | 0.968±0.041 a | 0.008±0.000 bcde | 0.060±0.133 a | |
| Dark-medium | 26.513±1.646 a | 0.018±0.000 ab | 0.995±0.041 a | 0.007±0.000 cde | 0.043±0.133 a | |
| Dark | 23.713±1.646 abcd | 0.016±0.000 abcd | 1.014±0.041 a | 0.007±0.000 cde | 0.048±0.133 a | |
Means ± SE with different letters in each column indicate significant statistical differences (p ≤ 0.05).
Table 3.
Concentración de micronutrimentos por la nteracción de variedad y grados de tostado en granos de café.
Table 3.
Concentración de micronutrimentos por la nteracción de variedad y grados de tostado en granos de café.
| Variedad | Degree of toasting | Fe | Cu | Zn | Mn | B |
|---|---|---|---|---|---|---|
| mg kg-1 | ||||||
| Colombia | Light | 17676.00±902.98 a | 1214.45±37.90 c | 28.07±0.93 bcde | 1333.09±36.84 abc | 2.14±1.20 a |
| Medium-light | 14830.00±902.98 abc | 1245.56±37.90 bc | 28.908±0.93 bcd | 1277.63±36.84 abc | 1.41±1.20 a | |
| Medium | 15753.00±902.98 abc | 1302.38±37.90 bc | 34.07±0.93 a | 1309.83±36.84 abc | 2.51±1.20 a | |
| Dark-medium | 15444.00±902.98 abc | 1356.38±37.90 abc | 31.31±0.93 abc | 1378.24±36.84 abc | 2.33±1.20 a | |
| Dark | 16741.00±902.98 ab | 1365.49±37.90 abc | 31.18±0.93 abc | 1541.23±36.84 a | 1.12±1.20 a | |
| Colombia Graft | Light | 13579.00±902.98 abc | 1239.24±37.90 bc | 26.74±0.93 cdef | 1265.73±36.84 bc | 2.85±1.20 a |
| Medium-light | 14491.00±902.98 abc | 1265.17±37.90 bc | 26.24±0.93 def | 1271.03±36.84 abc | 2.74±1.20 a | |
| Medium | 15280.00±902.98 abc | 1316.97±37.90 abc | 26.09±0.93 def | 1257.51±36.84 bc | 0.00 ±1.20 a | |
| Dark-medium | 14243.00±902.98 abc | 1372.35±37.90 abc | 28.03±0.93 bcde | 1313.82±36.84 abc | 0.51±1.20 a | |
| Dark | 16192.00±902.98 abc | 1370.34±37.90 abc | 35.06±0.93 a | 1329.59±36.84 abc | 0.15±1.20 a | |
| Costa Rica | Light | 13560.00±902.98 abc | 1303.38±37.90 bc | 30.37±0.93 abcd | 1231.61±36.84 bc | 0.42±1.20 a |
| Medium-light | 15025.00±902.98 abc | 1315.15±37.90 abc | 28.41±0.93 bcd | 1187.46±36.84 bc | 0.25±1.20 a | |
| Medium | 13760.00±902.98 abc | 1194.96±37.90 c | 27.36±0.93 bcde | 1091.69±36.84 c | 3.18±1.20 a | |
| Dark-medium | 14265.00±902.98 abc | 1296.80±37.90 bc | 31.71±0.93 ab | 1162.51±36.84 bc | 1.22±1.20 a | |
| Dark | 15102.00±902.98 abc | 1417.83±37.90 ab | 31.17±0.93 abc | 1274.55±36.84 abc | 0.38±1.20 a | |
| Costa Rica Graft | Light | 11993.00±902.98 c | 1245.71±37.90 bc | 19.69±0.93 g | 1203.32±36.84 bc | 2.87±1.20 a |
| Medium-light | 12698.00±902.98 bc | 1322.50±37.90 abc | 20.11±0.93 g | 1210.01±36.84 bc | 2.35±1.20 a | |
| Medium | 14580.00±902.98 abc | 1510.66±37.90 a | 23.43±0.93 efg | 1391.90±36.84 ab | 1.89±1.20 a | |
| Dark-medium | 15038.00±902.98 abc | 1418.01±37.90 ab | 22.31±0.93 fg | 1302.97±36.84 abc | 3.15±1.20 a | |
| Dark | 14620.00±902.98 abc | 1365.60±37.90 abc | 20.75±0.93 g | 1230.55±36.84 bc | 1.97±1.20 a | |
Means ± SE with different letters in each column indicate significant statistical differences (p ≤ 0.05).
Disclaimer/Publisher’s Note: The statements, opinions and data contained in all publications are solely those of the individual author(s) and contributor(s) and not of MDPI and/or the editor(s). MDPI and/or the editor(s) disclaim responsibility for any injury to people or property resulting from any ideas, methods, instructions or products referred to in the content. |
© 2023 by the authors. Licensee MDPI, Basel, Switzerland. This article is an open access article distributed under the terms and conditions of the Creative Commons Attribution (CC BY) license (http://creativecommons.org/licenses/by/4.0/).
Copyright: This open access article is published under a Creative Commons CC BY 4.0 license, which permit the free download, distribution, and reuse, provided that the author and preprint are cited in any reuse.


