
Submitted:
18 September 2023
Posted:
19 September 2023
You are already at the latest version
Abstract
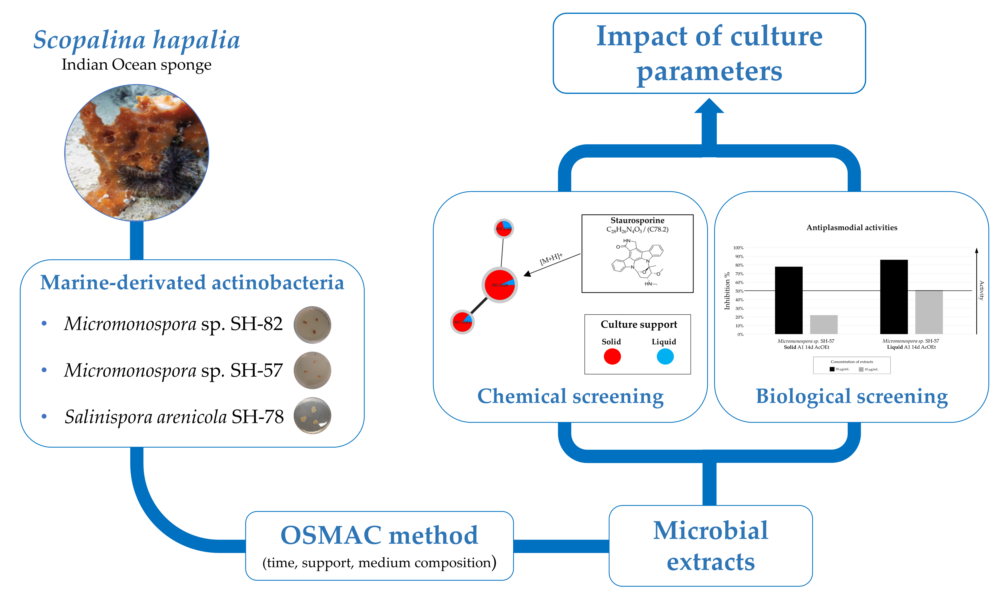
Actinobacteria are known for their production of bioactive specialized metabolites, but still under-exploited due to silent biosynthetic gene clusters (BGCs) not expressed in conventional laboratory cultures conditions. In this study, three marine-derived actinobacteria were cultured using the one strain many compounds method (OSMAC) to explore the real potential of these microorganisms. Salinispora arenicola (SH-78) and two Micromonospora sp. (SH-82 and SH-57) were grown under varying parameters such as time, medium composition, and culture support. The microbial extracts produced were chemically screened by high-resolution analysis (HRMS/MS). The data were used to build ion identity molecular networks (IIMN) and annotate the specialized metabolites detected. A selection of extracts was biologically screened for their cytotoxic and antiplasmodial activities. The IIMNs and the annotations produced were used to assess the impact of culture parameters on the metabolomic diversity of the selected actinobacteria and highlight the presence of unique molecules to specific culture conditions. Micromonospora sp. SH-57 produced a greater quantity of metabolites in liquid culture, with higher associated biological activity. The method employed allowed to explore deeper the specialized metabolites production and to identify the best culture conditions to produce bioactive natural products.
Keywords:
OSMAC method
; marine-derived actinobacteria
; molecular network
; natural product
; specialized metabolites
; cytotoxic activity
; antiplasmodial activity
1. Introduction
Non-communicable diseases are the leading cause of global deaths, including cardiovascular diseases, cancers, chronic respiratory diseases, and diabetes [1]. Poor countries face higher mortality from communicable diseases like HIV and malaria [2,3], with African countries accounting for 95% of malaria cases, primarily affecting children under 5 years old [3]. The increasing global incidence and mortality of diseases such as cancers [4], coupled with drug resistance [3,5], necessitates the search for new treatments to fight these diseases, some of which still remain incurable.
Research continues to explore biodiversity, particularly in the marine environment, to discover new natural products which are well-known sources of biologically active compounds [6,7]. Within this biological diversity, actinobacteria represent one of the most important microbial class for the discovery of new bioactive molecules [8,9,10]. Actinobacteria can be found in diverse sources such as sediments or holobionts [8]. Some of these microorganisms are exclusively isolated from marine habitats [11] highlighting their adaptability to various environments. They are able to produce a wide variety of specialized metabolites, traditionally referred to as “secondary metabolites, and are considered as the major source of naturally occurring antibiotics [12,13]. They also produce molecules with various activities such as anticancer, antiviral or antifungal [12,13,14]. The obligate marine genus Salinispora produces a multitude of bioactive compounds [10,15], among them staurosporine and its analogues demonstrated various antitumor activities [16,17].
Despite the large number of bioactive microbial metabolites currently isolated, advances in microbial genomics demonstrated a significant difference between the number of specialized metabolite biosynthetic gene clusters (BGCs) and the number of metabolites chemically isolated by researchers [18]. For example, the Aspergillus. nidulans fungi has an estimated production capacity of over 40 metabolites, of which only 50% have been identified [19,20]. This difference comes from silent or cryptic BGCs, not always expressed under laboratory culture conditions. This is probably due to the lack of stimuli that are difficult to identify and reproduce, in comparison with the original environment [18,21]. The investigation of microbial specialized metabolites is therefore limited. In order to explore the maximum potential of microorganisms, researchers have developed various techniques based on molecular or cultural approaches to express these silent BGCs [22,23]. Among these, the OSMAC (One Strain Many Compounds) method is one of the most frequently used. It aims at modifying various parameters, which can be physical (type of culture support or time), or chemical (composition of the medium or pH) or which can be the use of chemical or biological elicitors [22,23]. These changes induced the production of a higher number of microbial metabolites [22,23] and have led to the discovery of new bioactive molecules [24,25]. A study on marine derived fungi cultivated under different conditions (different media and culture support) proved their influence on the chemical profile and anticancer activity of microbial extracts [26].
This article presents the impact of culture parameters on the metabolic diversity of microbial extracts and their associated biological activities. Three microbial strains, Salinispora arenicola (SH-78), and two Micromonospora sp. (SH-82 and SH-57), isolated from the microbiota of the marine sponge Scopalina hapalia ML-263 [27] were studied. The work focused on a microbial group known for its production of specific and bioactive metabolites: actinobacteria [8,10,12]. An OSMAC culture strategy was set up to evaluate the impact of culture parameters such as time, support for growth or culture medium composition on the production of microbial metabolites. The extracts obtained from the cultures were chemically analyzed by LC-HRMS/MS and the data were processed by a workflow allowing the creation of ion identity molecular networks (IIMN) [28]. Using Cytoscape 3.9.1 software [29], these networks enabled the influence of culture parameters to be visualized graphically. Bioinformatics tools such as the Global Natural Products Social Molecular Networking (GNPS) platform [30], SIRIUS 5.7.2 software [31,32] and the ISDB-DNP tool (In Silico DataBase-Dictionary of Natural Products) [33] refine with timaR package [34] were used to annotate the microbial metabolites detected in the extracts. A selection of extracts was tested for their cytotoxic and antiplasmodial activities in order to assess the impact of culture conditions on biological activity and correlate them with chemical diversity. The results of the study indicate that the impact of culture parameters depended on the species studied and varied in relation to the microbial metabolites targeted. In the case of the Micromonospora sp. SH-57 strain, liquid culture showed greater potential for the discovery of new bioactive molecules. For Micromonospora sp. SH-82, the A1 medium allowed the detection of a higher number of specialized metabolites, and the longer culture time was also of superior interest.
2. Results
Culture parameters
The three microbial strains, Micromonospora sp. SH-82, Micromonospora sp. SH-57, and Salinispora arenicola SH-78, were grown by varying different culture parameters. Firstly, the culture duration was altered to 7, 14, and 21 days. The impact of the type of culture medium was also investigated, involving both solid and liquid media. Lastly, two media with distinct compositions, A1 and MB, were employed. Subsequently, these different cultures were extracted using organic solvents.
HPLC-DAD-CAD
The ethyl acetate (AcOEt) microbial extracts obtained from the different culture conditions were analyzed by HPLC-DAD-CAD. Prior to analysis, the samples were standardized to a concentration of 10 mg/mL and compared to a culture blank corresponding to the same conditions but without the microorganisms inoculation. These analyses were carried out to assess the richness of microbial metabolites using a universal detector. The results showed the presence of numerous peaks in the culture blank. Amberlite, the resin used, captures both microbial compounds and also the culture medium components. Therefore, only peaks specific to the microbial extracts were considered and the signal intensity observed is expressed in pA. Table S.1 presents the number of visible peaks (height > 5 pA) and peaks considered as major (> 30 pA), originating exclusively from microbial extracts. Tables S.2, S.4 and S.6 provide details of these peaks, with their retention times and intensities, for each strain and culture condition. These analyses provide quantitative data that will guide future efforts on microbial metabolites isolation.
Molecular network and annotation
To evaluate the impact of culture conditions on the chemical diversity of microbial extracts, IIMN [28] were generated using the GNPS platform [30]. These graphical representations are composed of numerous nodes representing the precursor ions of compounds, specific to the different microbial extracts, after substraction of the culture blank. By employing the ion identity workflow, the numerous mono and multi-charged adducts generated through high-resolution analysis can be identified and grouped into a single node corresponding to a specific metabolite. This approach significantly reduces the size and complexity of the networks. Despite the quality and precision of the workflow, molecular networks still present certain limitations, mainly related to the detection threshold. To determine the presence of different nodes in each extract, a meticulous manual verification of each precursor ion was performed, enabling to obtain more robust statistics.
Molecular networks make it easier to identify the distribution and specialization of microbial metabolites as a function of culture condition. Each parameter has been associated with a specific color to quickly visualize the origin of ions in each condition. The node size is proportional to the sum of precursor ion intensities in the samples, and the links between nodes are proportional to their spectral similarities. The nodes were annotated using automated bioinformatics tools such as the GNPS platform [30], the SIRIUS 5.7.2 software [31] and the ISDB timaR tool [33,34]. This approach enabled the potential identification of known metabolites from the database and provided an idea of possible structures when no metabolite was referenced. The main annotations are presented in the form of histograms, to quickly visualize the proportion of the precursor ion in each culture condition. These histograms describe the percentage of the area intensity of precursor ion used for these annotations in each extract.
In conclusion, summary tables of annotations were generated for each strain, indicating the name of the compound or its InChiKey, condensed digital representation of the International Chemical Identifier (InChI) and the area intensity of the precursor ion from data MZmine [35] preprocessing observed in the different culture condition. Additionally, supplementary tables are provided in the appendix, giving further details about these annotations. They include information such as the m/z with the associated adduct, the chemical class, and the percentage of similarity resulting from the different bioinformatics tools. A similarity percentage of 100% and score of 1 represent the highest level of spectral similarity for the SIRIUS software, the GNPS platform and the ISDB timaR tool respectively. For some metabolites, both tools led to the same identification, reinforcing the relevance of this annotation.
Biological activity
A selection of microbial extracts, produced in sufficient quantities, was tested for their biological activities. Antiplasmodial activity evaluated the percentage of inhibition of microbial extracts against the Plasmodium falciparum 3D7 strain. Two extracts concentrations were tested: 50 µg/mL and 10 µg/mL. The extracts were considered remarkable if the inhibition percentage was above 50% for the latter concentration. For these extracts, the concentration required to inhibit the growth of the parasite culture by 50% (IC50) was measured. The extracts were qualified as promising if their IC50 was below 15 µg/mL. The second targeted activity was the cytotoxic activity. The tests measured the viability of two cell lines, HCT-116 (colorectal cancer) and MDA-MB-231 (breast cancer), in the presence of the microbial crude extracts. These cell lines are commonly used as models in the search for new therapeutic molecules [36,37]. Two extracts concentrations were tested: 10 µg/mL and 1 µg/mL, and they were considered promising if the viability percentage was below 50% at a concentration of 1 µg/mL.
2.1. Micromonospora sp. SH-82
In order to assess the impact of culture conditions on the metabolic diversity of Micromonospora sp. SH-82, the strain was cultured on two types of support, at different time points and with varying media composition. Microbial crude extracts were obtained by solvent extraction and analyzed to evaluate the influence of the culture parameters on the production of bioactive metabolites.
2.1.1. Influence of culture support and time
Micromonospora sp. SH-82 was cultivated on two different support culture media, liquid and solid at three times 7, 14, or 21 days using A1 medium.
2.1.1.1. HPLC-CAD-DAD Analysis
Table S.1 reveals a minimum of 13 peaks detected in the HPLC-CAD chromatograms of all extracts, highlighting a significant richness of metabolites. The main observation is an increased number of visible and major peaks over time, particularly after day 14 in solid support cultures. A higher number of major compounds (12) was observed for the solid culture at 21 days compared to the liquid culture (7). Table S.2 supports these findings with peak details. In the extract from solid culture on A1 medium for 21 days, five peaks (P 82.5, P 82.10, P 82.12, P 82.15 and P 82.26) had heights exceeding 70 pA, whereas only one peak for liquid culture at the same time. The increase of peak height was observed over the culture duration for both liquid and solid media. For example, compound P 82.15 exhibited heights of 54, 114 and 132 pA at 7, 14 and 21 days, respectively, in extracts from solid cultures. Five peaks (P 82.17, P 82.18, P 82.20, P 82.21 and P 82.22) were detected exclusively in the extracts from liquid culture, and four peaks (P 82.1, P 82.2, P 82.3 and P 82.23) from solid culture.
2.1.1.2. Molecular network and annotations
Figure 1.a illustrates the ion identity molecular network resulting from high-resolution analysis of extracts obtained from different cultures of Micromonospora sp. SH-82, highlighting the influence of the culture support and time. The network includes a total of 315 nodes, 43% of which are grouped into 24 clusters containing more than 2 nodes, while the remaining nodes are represented individually. Two significant clusters (>50 nodes) are observed in this network.
The molecular network exhibits homogeneous distribution of nodes between the culture supports, solid are represented in red and liquid in blue. Figure 1.b, which presents the percentage of nodes corresponding to each culture support confirms this annotation. The top diagram shows that 67% are common to both supports and the 33% of unique nodes are almost evenly distributed between each support. The other two diagrams provide a detailed view of the nodes for each support over time. It is observed that the number of nodes increases over time, particularly in the solid medium. Only 61% of the nodes are observed at 7 days, while 98% and 96% of the nodes are present at 14 and 21 days, respectively. The figure 1.c illustrates a zoom on three clusters of interest, with annotated nodes. The first cluster represents the megalomicins, with 7 nodes annotated to this family. The majority of annotated nodes shared between the two supports, there are also unique nodes specific to the solid medium that could not be identified. The middle cluster represents the erythromycins, with erythromycin D (C 82.9, m/z 704.4586 [M+H]+, C36H65NO12) showing the highest sum precursor ion intensity. The last cluster exhibits the erythronolides family, and the annotated nodes were observed under all studied extracts. Figure 2 presents the main annotations in the form of histograms. It represents the proportion attributed to each culture conditions according to the sum of precursor ion areas used for these annotations.
Figure 2 demonstrates that the precursor ions, used to make the annotations are generally visible in all the extracts. A difference in intensity is observed based on the type of megalomicin. For megalomicin A (C 82.1, m/z 877.5648 [M+H]+, C44H80N2O15), the precursor ion intensity percentage is significantly higher in solid cultures, accounting for 95%, primarily originating from the 21-day culture (64%). On the other hand, for megalomicin C1 and C2, the indicated percentage is higher in liquid cultures. For the other presented annotations, the distribution is homogeneous between solid and liquid supports, with one exception: Erythromycin B (C 82.10, m/z 718.4717 [M+H]+, C37H67NO12) is only observed in the extracts derived from solid cultures starting from 14 days.
2.1.1.3. Biological activity
A selection of the extracts of Micromonospora sp. SH-82 was evaluated for their antiplasmodial and cytotoxic activities. The first extracts that were analyzed came from solid A1 medium cultures at 14 days and 21 days. Figure 3.a presents the results of the antiplasmodial activity against the Plasmodium falciparum 3D7 strain. The cytotoxic activities were tested in two cell lines, HCT-116 and MDA-MB-231, and are shown in Figure 3.b and Figure 3.c, respectively.
The results for both biological activities demonstrate a difference between the culture time. Both extracts exhibit significant antiplasmodial activity (Figure 3.a), with an inhibition percentage greater than 50% at 10 µg/mL. The extract from the 21-day culture has a lower IC50 (5.06 ± 0.95 µg/mL), compared with the extract from the 14-day culture (11.31 ± 1.18 µg/mL), making it more promising. Both extracts did not show very promising results for cytotoxic activities. Lower cell viability against the MDA-MB-231 cell line (Figure 3.c) was observed for the extract derived from 21-day culture. Both tests indicate that culture duration has a significant influence on biological activity.
The other extracts of Micromonospora sp. SH-82 analyzed for their biological activities were produced from solid and liquid cultures at 14 days. Figure 4 illustrating the two biological activities and presented in the same graphical format as in Figure 3.
The results for antiplasmodial activities, presented Figure 4.a, show a similar activity between solid and liquid extracts. The extract derived from the solid culture demonstrates IC50 of 11.31 ± 1.18 µg/mL and that from liquid culture 9.73 ± 4,07 µg/mL. Figure 4.b and 4.c presents anticancer activity, and a lower cell viability is observed for both cell lines tested with the extract derived from the solid culture at a concentration of 10 µg/mL compared to liquid culture. However, this observation does not hold when the tested concentration is 1 µg/mL.
2.1.2. Influence of culture medium and support
For this experimental part, Micromonospora sp. SH-82 was cultivated on two different culture medium composition, A1 and MB medium, and on two types of supports, solid and liquid medium at 14 days.
2.1.2.1. HPLC-CAD-DAD Analysis
Table S.1 presents the number of peaks detected by HPLC-CAD for the different microbial extracts. At 14 days, an increased number of visible peaks is observed for the A1 medium, regardless of the culture support. However, the extract from the liquid culture on MB shows a higher number of major compounds compared to the extract derived from A1 liquid culture. Table S.2 shows the details of these peaks, four specific peaks (P 82.1, P 82.2, P 82.3, and P 82.26) are visible only in the extracts obtained from the cultures on solid A1 medium and liquid MB medium. Typically, the peaks heights are higher in the extract from A1 solid medium.
2.1.2.2. Molecular network and annotations
Figure 5.a illustrates the ion identity molecular network obtained from high-resolution analysis of microbial extracts obtained from different cultures of Micromonospora sp. SH-82, highlighting the influence of the culture medium and support. The network comprises a total of 253 nodes, 57% of which are grouped into clusters (> 2 nodes). The two main clusters observed in Figure 1.a are also present in Figure 5.a but contain fewer nodes.
The blue and red color, representing the extract from culture on A1 medium, is predominant in the molecular network. The diagram on top in Figure 5.b, which described the percentage of nodes corresponding to each medium composition confirmed this observation. 94% of the nodes are observed in the extracts from the A1 medium, and 32% are unique to this medium, indicating a higher metabolic diversity. Regarding the influence of the support, the diagrams below show that for the A1 medium, there is homogeneous distribution of nodes between the two supports, whereas for the MB medium, 99% of the nodes are present in the liquid medium, 52% being unique to it. The figure 5.c showed a zoom on three clusters of interest, with annotated nodes. The same clusters as in Figure 1.c are presented, and the colors representing the medium A1 predominate in the different clusters. Figure 6 presents the main annotations in the form of histograms. It represents the proportion attributed to each culture conditions according to the sum of precursor ion areas used for these annotations.
Figure 6 shows that the majority of precursor ion areas primarily originates from the extracts of culture A1. A lower proportion is also observed from the extracts of MB culture, indicating the presence of ions for the majority of annotated compounds in all culture conditions. The node annotated as Erythromycin B (C 82.10, m/z 718.4717 [M+H]+, C37H67NO12) is only present in the extract derived from the solid A1 culture. The node corresponding to Norerythromycin (C 82.15, m/z 706.4521 [M+H]+, C35H63NO13) was predominantly observed in the extract from the liquid MB culture.
2.1.2.3. Biological activity
The two extracts from the culture solid on A1 and MB medium of Micromonospora sp. SH-82 at 14 days were evaluated for their antiplasmodial and cytotoxic activities. Figure 7 present the results of the target biological activities and the same legend as in Figure 3 has been reproduced.
For the antiplasmodial activity (Figure 7.a), the extract from the A1 culture medium exhibits higher inhibition percentages. However, the IC50 measurement indicates a lower value of 6.03 ± 2.10 µg/mL for the extract from the MB culture medium, indicating a stronger antiplasmodial activity for this extract. As for the cytotoxic activity (Figure 7.b and Figure 7.c), the extracts did not show significant differences or very promising activities.
2.1.3. Overview annotations
To facilitate the rapid identification of the metabolites annotated in the various extracts of Micromonospora sp. SH-82, according to the different culture parameters studied, a synthesis table is presented (Table 1). It details all the annotations and provides informations such as the raw formula, the compound name or its InChiKey, and the precursor ion area intensity from data preprocessing observed in the different condition. Table S.3 provides additional chemical details for each annotation.
Table 1 shows a total of 21 nodes that were successfully annotated, belonging to three major compound families: erythromycins, erythronolides, and megalomicins. During these analyses, microbial metabolites produced by Micromonospora sp. SH-82 formed a large number of doubly charged ions not shown in Figure 1.a. Figure S1 presents the cluster of megalomicin doubly charged ions, not manually corrected, and demonstrating their high intensity. This highlights the importance of data preprocessing to avoid information loss. The network reveals the significant production of doubly charged ions, indicating the complexity in studying these metabolites and the potential presence of ions representing novel megalomicins that may not have been detected or annotated. The example of the megalomicins family presented in Table 1 supports the observation that the culture time plays a role in metabolite production. In this case, the maximum intensity area is primarily observed for the extracts derived from cultures at 21 days. The node annotated as 13-Deethyl-13-methylerythromycin (C 82.11, m/z 690.4431 [M+H]+, C36H65NO12) exhibits higher precursor ion area intensity for the extracts derived from liquid cultures on medium A1. Figure S.2 displays a zoomed-in view of the cluster region encompassing this annotation, revealing the presence of numerous other nodes predominantly colored in blue, which could indicate a favored occurrence on solid support.
2.2. Micromonospora sp. SH-57
To evaluate the influence of culture conditions on the metabolic diversity of Micromonospora sp. SH-57, the strain was cultivated with different culture parameters. The type of support, the culture time and the composition of the media were studied. Microbial crude extracts obtained after solvent extraction were analyzed.
2.2.1. Influence of culture support and time
Micromonospora sp. SH-57 was cultivated on two distinct support culture media, liquid and solid at three duration 7, 14, or 21 days using A1 medium.
2.2.1.1. HPLC-CAD-DAD Analysis
Table S.1 presents the number of peaks detected by HPLC-CAD for the microbial extracts obtained from Micromonospora sp. SH-57 studied. A number of peaks ranging from 4 to 10 are observed for all the extracts, significantly lower compared to Micromonospora sp. SH-82 studied under the same culture conditions. The two main differences observed for the extracts of Micromonospora sp. SH-57 are an increased number of visible compounds over time, reaching a maximum at 21 days. For the extract derived from liquid culture, four peaks were observed at 14 days of culture, and ten peaks were observed at 21 days, with two major peaks. An increase of four compounds (P 57.2, P 57.3, P 57.4, P 57.9) compared with that from solid culture at the same time were observed (Table S.4) and the last three are only visible in the extract from the 21-day culture. In this extract the intensity of the peaks is greater than in the rest, indicating the possible presence of a higher quantity of microbial compounds.
Figure 8.a shows the ion identity molecular network resulting from high-resolution analysis of microbial extracts obtained from different cultures of Micromonospora sp. SH-57, highlighting the influence of the culture support and time. The network includes a total of 250 nodes, 40% of which are grouped into 24 clusters (>2 nodes).
The color blue, representing the extract from liquid cultures, is predominant in the Figure 8.a. The top Venn diagram in Figure 8.b, illustrating the percentage of nodes as a function of the culture support, confirms this observation. Almost all the nodes are visible in the extracts from the liquid support (99%), and half of them (54%) are specific to it. The diagrams below presenting details of culture times show, that for 21-day cultures the majority of nodes are visible, with 99% of total nodes for solid medium and 95% for liquid medium. These diagrams show that as culture time increases, the number of nodes increases on all support media. The figure 8.c illustrates a zoom on three clusters of interest, with annotated nodes. The cluster located in the top-left corresponds to imidazopyrimidines compounds. All nodes have been annotated, with an example being the 2-Deoxy-N6-methyladenosine (C 57.1, m/z 266,1245 [M+H]+, C11H15N5O3). In this cluster, the dark blue color predominates, indicating a greater presence of precursor ions from the 21-day liquid culture extract. In the large clusters (12 nodes) on top-right in Figure 8.a, three nodes were annotated as carbazoquinocin derivatives. The large cluster located below could not be precisely annotated, indicating the possible presence of new metabolites. Figure 9 presents the main annotations in the form of histograms. It represents the proportion attributed to each culture conditions according to the sum of precursor ion areas used for these annotations.
Figure 9 demonstrates that the majority of precursor ion areas originates from extracts derived from liquid cultures, highlighted by the blue color. Here, the 21-day liquid culture extract shows the highest percentages, ranging from a minimum of 30% to a maximum of 100%. The first series of histograms on the left represents the annotations for the imidazopyrimidine group. The three annotations come from the different extracts studied, with a predominance of extracts from liquid culture. A suffered compound (C57.5, m/z 280.1225 [M+H]+, C12H17N5OS) was observed. The three annotations that follow also feature suffered compounds, with unique node present in the extract from liquid culture. The last three annotations represent carbazoquinocins, here with carbazoquinocin E (C57.15, m/z 324.1958 [M+H]+, C21H25NO2) only visible in the extract from the 21-day liquid culture. These results underline the importance of support and culture time on the presence of microbial metabolites for the Micromonospora sp. SH-57 strain.
2.2.1.3. Biological activity
Extracts of Micromonospora sp. SH-57 came from solid and liquid A1 medium cultures at 14 days were evaluated for their antiplasmodial and cytotoxic activities. Figure 10.a presents the results of the antiplasmodial activity against the Plasmodium falciparum 3D7 strain. The results for the cytotoxic activities in two cell lines, HCT-116 and MDA-MB-231, were displays in Figure 10.b and Figure 10.c, respectively.
The results of both tests show the impact of the culture support on biological activity. In Figure 10.a, the extract obtained from solid culture presents a percentage inhibition of 22% at 10 µg/mL, while the extract obtained from liquid culture exhibits a percentage inhibition of over 50%. IC50 was therefore measured at 12.06 ± 1.93 µg/mL. For anticancer activity, the two extracts show relatively similar results, with a slightly higher activity observed again for the liquid culture extract. For the latter extract, a percentage viability of 40 ± 2% is observed for the HCT-116 cell line (Figure 10.b) at 1 µg/mL, indicating promising activity.
2.2.2. Influence of culture medium and support
Micromonospora sp. SH-57 strain was cultivated using on two different media composition, A1 and MB medium, on two types of supports, solid and liquid at 14 days.
2.2.1.1. HPLC-CAD-DAD Analysis
Table S.1 presents the number of peaks detected by HPLC-CAD in the microbial extracts from this different culture of Micromonospora sp. SH-57. A slight difference between the two medium composition was observed, particularly in the solid support where only one peak is visible in the MB medium, while four peaks are observable in the A1 medium. Table S.4, highlighting the difference between the two culture supports, in the liquid support, a unique compound (C57.1) is observed for this culture duration, while another unique compound (C57.6) is observed in the solid support.
2.2.1.2. Molecular network and annotations
Figure 11.a presents the ion identity molecular network obtained from high-resolution analysis of microbial extracts obtained from different cultures of Micromonospora sp. SH-57, highlighting the influence of the culture medium and support. The network comprises a total of 117 nodes, 38% of which are grouped into 13 clusters (> 2 nodes).
The standard blue color, representing the extract from liquid culture on A1 medium, is predominant in the molecular network. The same main clusters were observed as in part 2.2.1. The top Venn diagram, shown in figure 11.b, illustrates the percentage of nodes as a function of growing medium. Almost all nodes (94%) are present in medium A1, and more than half (57%) are unique to it. Details of nodes for each medium as a function of support are shown in the diagrams below. As in section 2.2.1, there is a high percentage of nodes in the liquid medium A1 (98%), with 46% of nodes specific to the liquid medium. This increased percentage in the liquid medium is even more pronounced in the MB medium, where 86% of nodes are found exclusively for this support medium, confirming the impact of the culture support for Micromonospora sp. SH-57. Figure 11.c provides a zoom of the same clusters of interest as in Figure 8.c, with the smaller cluster on the right due to the strong presence of nodes in the extract from liquid culture at 21 days. The middle cluster represents isomers annotated as Indole-3-carbinol (C57.10, m/z 130.0653 [M+H-H2O]+, C9H9NO) only visible in extracts from medium A1. Figure 12 presents the main annotations in the form of histograms. It represents the proportion attributed to each culture conditions according to the sum of precursor ion areas used for these annotations.
The standard blue color predominates in all histograms, representing over 65% of the total percentage in 8 out of the 10 presented annotations. The first three annotations are consistent across the various extracts studied. The following three annotations show sulfur-containing compounds, indicating the impact of the support, as they are present in all extracts from liquid cultures with a unique annotation (C57.8, m/z 375.1949 [M+H]+, C17H30N2O5S) for this support. Annotations C57.10, C57.11, and C57.13 highlight the importance of the culture medium, as they are exclusively present in the extract from A1 medium.
2.2.3. Overview annotations
For the rapid identification of the metabolites annotated in the various extracts of Micromonospora sp. SH-57, according to the different culture parameters studied, a synthesis table is presented (Table 2). It details all the annotations and provides the same information as Table 1. Table S.5 provides additional chemical details for each annotation.
Table 2 shows a total of 17 nodes that were successfully annotated, belonging different chemical class like: indoles and derivatives, imidazomyrimidines or benzopyrans. Sulfur-containing compounds were successfully annotated in the various studied extracts (C57.5 to C57.9). The investigation of intensity variations in precursor ion areas revealed a significant impact of two parameters: time and culture support. The observed intensity increases over time, reaching its maximum at 21 days regardless of the support. The latter parameter demonstrates the most substantial influence, as all annotations were observed in the extracts from liquid A1 cultures. Additionally, an increase in intensity and annotations was observed for the extracts from liquid cultures compared to solid cultures, regardless of the medium. The extract obtained from A1 liquid culture at 21 days exhibited the highest intensity for nearly all conducted annotations.
2.3. Salinispora arenicola SH-78
In order to evaluate the impact of culture conditions on the metabolic diversity of Salinispora arenicola SH-78, this strain was cultured by varying different parameters. The support culture and incubation time were modified. Microbial crude extracts were obtained using first ethyl acetate followed by methanol for extraction. These different extracts were then analyzed to assess the impact of these parameters.
2.3.1. Influence of culture support
Salinispora arenicola SH-78 was cultured for 14 days on both solid and liquid A1 medium. The ethyl acetate extracts obtained were then subjected to detailed analysis.
2.3.1.1. HPLC-CAD-DAD Analysis
Table S.1 presents the number of peaks detected by HPLC-CAD in the extracts of Salinispora arenicola SH-78. 7 and 8 peaks are observed respectively, for these two types of cultures. However, a significant difference is observed in the extract from the liquid culture, where two major compounds are distinguished. This observation is confirmed by Table S.6, which provides details on these peaks. Among the two predominant compounds, one is specific to the liquid culture (P 78.6).
2.3.1.2. Molecular network and annotations
Figure 13.a shows the ion identity molecular network resulting from high-resolution analysis of this microbial extracts obtained from Salinispora arenicola SH-78. The network contains a total of 272 nodes, with 57% grouped into 26 clusters (>2 nodes), while the remaining nodes are represented individually.
The blue nodes, representing the extract from the liquid culture support, is predominant in the molecular network. Figure 13.b presents a Venn diagram illustrating the percentage of nodes based on the culture support. The majority of nodes (69%) are shared between both supports. There is also a significant percentage of unique nodes from to the liquid culture (26%). Figure 13.c shows a zoom on different clusters of interest, with annotated nodes. The cluster located in the top-left corresponds to the staurosporine cluster (C 78.2, m/z 467.2085 [M+H]+, C28H26N4O3), the red color predominates, indicating a greater presence of precursor ions in the solid culture extract. Two other clusters are represented here, those of saliniketals and rifamycins families. The two largest clusters in the molecular network, shown in Figure S3, could not be clearly annotated, suggesting the possible presence of new metabolites. Figure 14 shows histograms representing the main annotations. It represents the proportion attributed to each culture conditions according to the sum of precursor ion areas used for these annotations.
The first group of histograms on the left displays the annotations for the staurosporine cluster. A predominance of red color is observed, indicating that the majority of precursor ion areas come from the solid culture. The middle group representing the rifamycins, a higher proportion of intensities is observed from the extract derived from the liquid culture. With the presence of two unique ion specific to the liquid support has been identified as 34a-deoxy-rifamycin W (C78.7, m/z 640.3113 [M+H]+, C35H45NO10) and 20-hydroxyrifamycin S (C78.12, m/z 712.2971 [M+H]+, C37H45NO13). Finally, in the histograms on the right representing an annotation of the family of salinilactones mainly observed in liquid culture.
2.3.2. Influence of culture time
To assess the impact of culture time, solid cultures on A1 medium were carried out for periods of 7, 14 and 21 days, and the ethyl acetate extracts obtained were analyzed.
2.3.2.1. HPLC-CAD-DAD Analysis
Table S.1 shows the number of peaks detected in chromatograms for this different microbial extracts. The analyses revealed a constant number of visible peaks for the different times, with a total of 7 compounds observed. However, a small increase in peak height was observed for the 14 days culture compared with the others, as shown in detail in Table S.6.
2.3.2.2. Molecular network and annotations
Figure 15.a shows the ion identity molecular network resulting from the analysis of this extracts. The network contains a total of 150 nodes, 38% of which are clustered. Compared to the previous network Figure 13.a, this network is smaller due to the data processing parameters applied and the large number of ions detected in the liquid extracts.
There is a slight dominance of the red color, representing the 14-day culture. The Venn diagram (Figure 15.b) indicates that the majority of nodes (67%) are common to all three culture times, while 16% of nodes are only observed at 14 days. A zoom on three clusters (Figure 15.c) shows the same characteristic families as in Figure 13.c. Precursor ions are present in all extracts for all families, except for one node in the rifamycin cluster. The main annotations made for these extracts are presented in the histograms of Figure 16. It represents the proportion attributed to each culture conditions according to the sum of precursor ion areas used for these annotations.
A higher proportion of precursor ions is observed in the 14-day extract, particularly for the rifamycin family where each annotation is represented by more than 70% of the total intensity for this extract. For the staurosporine’s annotation (C 78.2, m/z 467.2085 [M+H]+, C28H26N4O3), a higher precursor ion area intensity is observed from the 7-day culture.
2.3.3. Influence of culture solvent
Two solvents ethyl acetate (AcOEt) and methanol (MeOH) were used to perform a successive double extraction. The aim was to evaluate whether the use of a second solvent allowed the extraction of additional metabolites, or the recovery of metabolites already extracted by ethyl acetate. This double extraction was carried out on the culture in solid A1 medium for 14 days.
2.3.3.1. Molecular network and annotations
Figure 17.a illustrates the ion identity molecular network resulting from the analysis of extracts obtained. This network consists of a total of 155 nodes, which 45% of them are clustered (>2 nodes).
A predominance of red color, representing ethyl acetate extract, is observed. The Venn diagram (Figure 17.b) shows that only 38% of the nodes are common to both solvents. As 45% of the nodes are unique to ethyl acetate extract, this indicates greater richness in this extract. However, zooming in on the clusters of interest (Figure 17.c) reveals the presence of nodes previously annotated in the two previous extracts studied. Figure 18 presents histograms of the observed annotations representing the percentages attributed to each culture conditions according to the sum of precursor ion areas used for these annotations.
For the annotations presented Figure 18, the majority (70%) of precursor ion areas come from the AcOEt extract except for one. Within the staurosporine family, a greater presence of the precursor ion annotated as 4'-N-methyl-5'-hydroxy-staurosporine (C 78.4, m/z 497.2192 [M+H]+, C29H28N4O4) is observed in the methanolic extract, which may indicate a greater extraction of this metabolite for this solvent.
2.3.3.2. Biological activity
The extracts studied, obtained from ethyl acetate and methanol extraction of Salinispora arenicola SH-78 culture on solid A1 medium for 14 days, were evaluated for their antiplasmodial and cytotoxic activities (Figure 19).
2.3.4. Overview annotations
For the rapid identification of the metabolites annotated in the various extracts of Salinispora arenicola SH-78, according to the different culture parameters studied, a synthesis table is presented (Table 3). It details all the annotations and provides the same information as Table 1. Table S.7 provides additional chemical details for each annotation.
A total of 23 nodes were annotated and presented in Table 3, providing information on the presence and distribution of microbial metabolites in the analyzed extracts. Different chemical class were observed like indoles derivatives or macrolactams. For the large majority of annotations, the maximum intensity observed comes from the extract obtained from A1 liquid culture for 14 days. Two unique nodes (C78.7 and C78.12) from this extract were annotated as derivatives of rifamycin. Regarding the staurosporine family, higher intensities were observed in the extracts from solid cultures, particularly for a unique ion identified as 4'-demethyl-Af-formyl-7V-hydroxy-staurosporine (C78.4, m/z 497.1825 [M+H]+, C28H24N4O5), and also for 4'-N-methyl-5'-hydroxy-staurosporine (C78.3, m/z 497.2192 [M+H]+, C29H28N4O4), with the observed intensity being higher in the methanolic extract compared to the ethyl acetate extract. The salinilactones were annotated solely with the ISDB timaR tool, and the intensities are predominantly observed in the extract obtained from liquid culture. 70% of the sum of intensities observed in MZmine comes from this extract.
3. Discussion
Researchers are continuing their efforts to discover novel bioactive molecules in response to numerous public health challenges [3,4,5]. Among the potential sources, microorganisms, particularly actinobacteria, offer a wide range of molecules with unique structures and remarkable biological activities [8,9,10]. However, the search for new molecules of microbial origin can be complex and costly, partly due to certain biosynthetic gene clusters (BGCs) not being expressed under laboratory conditions [18,21] and the predominant compounds already identified are often re-isolated [23,38]. To overcome these challenges, scientists have adapted various molecular and cultural approaches to express these “silent” BGCs [18,19,20,21,22,23]. One of these methods, known as OSMAC (One Strain Many Compounds), involves varying different culture parameters, to express the full metabolic potential of microorganisms [23]. This method has already demonstrated its effectiveness in discovering promising new molecules [22]. In this study, the impact of culture parameters such as culture duration, support culture, and medium composition on the metabolic diversity and biological activity of extracts from three marine-derived actinobacteria isolated from an Indian Ocean sponge, Scopalina hapalia (ML-263) was evaluated. By analyzing these factors, the aim is to identify the optimal culture parameters to discover new bioactive molecules with significant therapeutic potential.
Different chemical and biological analyses were conducted to assess the impact of culture parameters on the metabolic diversity and biological activity of the microbial extracts. HPLC-DAD-CAD chemical analyses revealed a significant presence of compounds originating from the culture medium. The initial use of amberlite aimed to increase the proportion of microbial metabolites in the extracts, thereby facilitating the identification of major compounds and future isolation work of metabolites [39]. Subsequently, HRMS/MS analyses were performed, enabling the construction of an Ion Identity Molecular Network (IIMN) [28] and the annotation of detected microbial metabolites. These potential identifications were achieved using various bioinformatic tools, including the GNPS platform [30], the SIRIUS software [31], and the ISDB tool coupled with timaR [33,34], by comparing the spectral data of the extracts to various databases. Annotations were considered relevant when multiple tools converged towards the same identification, corroborated by the literature. The impact of culture parameters on the bioactivity of microbial extracts was evaluated through two activity tests: cytotoxicity on HCT-116 and MDA-MB-231 cell lines (colon and breast cancer models [36,40]) and antiplasmodial activity against the Plasmodium falciparum 3D7 strain. Detecting biological activities in these crude extracts would be even more promising, considering the low proportion of microbial metabolites compared to the compounds originating from the culture medium.
The strain Micromonospora sp. SH-82 was the first to be studied to assess the impact of culture conditions on the production of microbial metabolites. The parameters studied included the incubation time, the culture support, and the composition of the medium. HPLC-CAD analyses showed that the culture time increased the number of compounds, especially those considered major (>30 pA) in the extracts from both culture supports on medium A1. This trend was more pronounced for the extracts from solid culture on medium A1 after 14 days. Regarding the impact of the support, the visible peaks on the chromatogram were relatively close, but table S.2 detailing the observed peaks showed higher values for the solid support, indicating a greater quantity of microbial metabolites. Conversely, the culture in liquid MB medium appeared more favorable for this strain than solid culture.
HRMS/MS analyses confirmed the culture time influenced the metabolic diversity, with an increase in the number of nodes, potentially representing microbial metabolites, over time. For extracts from solid A1 cultures, the percentage of nodes exceeded 90% after 14 days, whereas it was only 60% for 7 days. These results demonstrate the importance of extending the culture time for Micromonospora sp. SH-82. A relatively homogeneous distribution of nodes was observed for extracts from both types of culture supports on medium A1. Each support culture presented unique nodes, representing 13% for the solid support and 20% for the liquid support of the total nodes in the IIMN (Figure 1.a). Therefore, it is interesting to test both culture supports to cover a maximum of potential metabolites. Regarding the influence of the medium composition, extracts from medium A1 showed the majority of nodes in IIMN (Figure 5), with 32% of unique nodes specific to this medium, suggesting a better chemical diversity for this medium. The annotations obtained for this strain highlighted the presence of three major families of molecules: megalomicins, erythromycins, and erythronolides. Among the 21 annotations made, 7 of them were identified using two distinct bioinformatic tools, leading to the same identification. This concordance reinforces the reliability of these annotations, and among them, 4 correspond to megalomicins. This family of macrolide antibiotics was isolated in 1969 from Micromonospora megalomicea [41]. The study conducted by Useglio et al. (2010) on the in vivo bioconversion of erythromycin C to megalomicin A [42], and the description of biosynthetic pathways like erythromycin D from the METACYC® database [43], confirm the annotations presented in Figure 2. The precursors identified in these previous studies support the annotations made, such as the detection of 6-deoxyerythronolide B. This concordance of information, including consensus annotations, the presence of these molecules in biosynthetic pathways, and the source species, strengthens the identification of these microbial metabolites. The majority of annotations are visible in all extracts (Table 1) but with different precursor ion areas intensities. The extract derived from the solid A1 culture at 21 days exhibits the majority of maximal intensities, suggesting more favorable conditions for the detection of specialized metabolites. This extract also includes unique annotations and numerous unannotated nodes present in the megalomicin cluster, potentially corresponding to unknown derivatives. However, the cluster presented in Figure S2 shows ions mainly originating from extracts derived from liquid cultures, highlighting the importance of conducting both types of cultures to increase the diversity of produced metabolites. The chemical analyses revealed the combined impact of culture support and culture duration present on the chemical diversity of therefore microbial extracts.
The culture parameters also influenced the bioactivity of the selected microbial extracts, all of which exhibited promising antiplasmodial activity, with variations depending on the parameters. The annotated megalomicins in our samples have previously shown antiplasmodial activity in a study by Goodman et al. (2012) against two strains of Plasmodium falciparum [44], which could explain this promising activity. The increase chemical diversity observed in culture time is correlated with an increase biological activity. The IC50 values of 5.06 ± 0.95 µg/mL and 11.31 ± 1.18 µg/mL were measured for the extracts derived from solide cultures A1 at 14 days and 21 days, respectively. The impact of the culture support on biological activity is less pronounced, which is consistent with the chemical results. Finally, the extract derived from the MB medium culture, with low chemical diversity, exhibits a slightly more interesting IC50 than the extract from the A1 medium. This discrepancy could be influenced by the proportions of bioactive metabolites, the ionization of molecules, or the influence of components in the culture medium. A previous study conducted by Farinelle et al. (2021) also revealed variability in the biological activities of extracts from fungi cultured in six different media, without necessarily establishing a correlation with the quantity of metabolites [45]. Regarding cytotoxic activity, the extracts of Micromonospora sp. SH-82 did not show significant activity. The variations in activity were similar to those observed for antiplasmodial activities, with a slight increase for the 21-day extract, a modest increase for the solid support extract compared to the liquid support extract, and a similar activity observed for both A1 and MB media composition.
Micromonospora sp. SH-57 was also studied to assess the impact of culture conditions on microbial metabolite production. The same parameters were investigated, including incubation time, culture support, and medium composition. The culture time also showed an increase in the number of visible peaks in the HPLC-CAD analyses. The study by Armin et al. (2021) demonstrated the influence of culture time on siderophore production in actinobacteria, Streptomyces ciscaucasicus [46], supporting the importance of culture time. The culture support had a significant influence on the number and intensity of observed peaks, with liquid culture being more favorable. The extract derived from 21-day liquid culture on A1 medium exhibited all detected peaks, often at maximum intensities. This favorable support is also confirmed with MB medium, which is less interesting for microbial metabolite production than A1 medium.
The HRMS-MS analyses corroborated the previous observations, indicating that an increased culture time, along with the use of liquid support and A1 medium, provides the best combination for obtaining a large number of metabolites, consistent with the number of nodes present in the different molecular networks (Figure 8 and Figure 11). Among the annotations made for this strain, 5 were obtained using two distinct bioinformatic tools, including carbazoquinocin. These molecules were isolated in 1995 from Streptomyces violaceus [47], and several nodes within the cluster were annotated to this same family, reinforcing their identifications. Another consensus annotation was Aloesol, a chromone isolated from rhubarb [48], and a compound with similar structure was also isolated from a Micromonospora sp. [49]. The annotated compound as 2-Deoxy-N6-methyladenosine, showed a similarity percentage of 93% (Table S.5) with the SIRIUS annotation tool, and a similar compound isolated from a Streptomyces, Aristeromycin [50], was also proposed by the tool. The annotations obtained for this strain are less precise and not strongly correlated with the literature, unlike the Micromonospora sp. SH-82 strain. Considering the potential identifications made and the challenges related to annotation, isolating the metabolites from this strain would be very interesting to discover new structures and improve the overall network annotations. The variations in intensity of the precursor ion areas used for these annotations are consistent with the HPLC-CAD analyses. An increase in intensity is observed over time, particularly in the case of liquid support and medium A1. The extract from the 21-day culture in liquid A1 contains all annotations with maximum intensities and sometimes unique peaks, highlighting its major interest compared to other conditions.
The biological activity tests conducted on two extracts from solid and liquid cultures at 14 days on medium A1 reveal a correlation between chemical diversity and biological activity. The extract from the liquid culture shows promising antiplasmodial activity compared to the solid culture, with a measured IC50 of 12.06 ± 1.93 µg/mL. However, the anticancer activity is not very promising for both extracts, though an increase in activity is observed in the liquid culture, especially against the MDA-MB-231 cell line. Despite the limitation of a low quantity of microbial metabolites revealed by the HPLC-CAD analysis, observable biological activities suggest potential promise for the pure molecules. The described biological activities may originate from various annotated molecules, such as chromones [51] , carbazoquinocins [52], or purine derivatives [53], which exhibit known biological activities.
The last studied strain was Salinispora arenicola SH-78, described in the literature as a model microorganism for its of production original and bioactive metabolites [15]. The culture parameters studied included incubation times of 7, 14, and 21 days for solid cultures in A1 medium, culture support (liquid or solid) cultures in A1 medium for 14 days, and the use of two successive solvents, ethyl acetate and methanol, for extracting the metabolites from the latter. HPLC-CAD analyses did not show significant differences in the number of visible peaks for the different solid cultures. However, a slight increase in peak intensity was observed in the extract from the liquid culture compared to the solid culture.
HRMS-MS analyses confirmed the culture support influenced the metabolic diversity, with an increase in the number of nodes for the extract derived from the liquid culture. Figure 13.b demonstrates that 95% of the nodes are found in the liquid culture extract, with 26% being unique. This impact of the culture support was also demonstrated in the study by Crüsemann et al. (2017), which compared 35 Salinispora strains on solid and liquid A1 medium [54]. In their study, the solid support appeared to be more favorable for the production of a large number of microbial metabolites. The divergence from our results could be attributed to the study of different Salinispora species, which have significant interspecific differences [55], or the use of amberlite resin, which influences the production of microbial metabolites [39]. The results demonstrated a significant increase in the number of nodes over time, particularly from 14 days, with 98% of nodes detected compared to only 61% at 7 days. This impact is supported by the study of Crüsemann et al. (2017), which demonstrated an increase in the number of nodes up to 28 days for liquid cultures of Salinispora arenicola CNH-877 in ISP2 medium [54]. The study of using two successive solvents, ethyl acetate and methanol, demonstrated that the first solvent extracted the majority of metabolites. However, 55% of the nodes were also present in the second extract, with 17% being unique, illustrating the benefit of using two different solvents to increase the quantity and diversity of metabolites. Crüsemann et al. (2017) also showed the advantage of using 3 different solvents to broaden the range of extracted molecules [54]. The annotations revealed the presence of several metabolites from different families, some of which are well-known in the literature as being produced by Salinispora sp., such as staurosporines, saliniketals, ryfamicins, and salinilactones [11,15,56]. Three annotations led to the same identification by the different bioinformatics tools, namely OH-staurosporine, staurosporine, and rifamycin S. The consensus annotations, the study of biosynthetic pathways [57], and the literature reinforce the identification of these microbial metabolites. Despite thorough investigation, the two main clusters (Figure S3) could not be clearly identified. Therefore, it would be relevant to proceed with the isolation and identification of these compounds due to the promising potential of Salinispora sp. [15]. Within the cluster of staurosporines (Figure 1.c), a stronger intensity of precursor ion peaks is observed for the extract derived from solid support culture. Among this family, the node annotated as 4'-demethyl-Af-formyl-7V-hydroxy-staurosporine exhibits its highest intensity in the methanolic extract, reinforcing the relevance of using different solvents. For other annotations, the maximum intensity is predominantly derived from the extract originating from liquid culture, as indicated by the nodes annotated as salinilactones. These results demonstrate that the optimal parameters may vary depending on the type of targeted molecules.
The biological activities described in this study were conducted on the extracts obtained through successive extraction with ethyl acetate and methanol from cultures on A1 medium for 14 days. Both extracts feature remarkable activities, especially the cytotoxic activity against the two cell lines. This activity may be attributed to the presence of staurosporine and its derivatives, present in both extracts, as demonstrated by Jimenez et al. (2012) [58] and Xiaol et al. (2018) [16].
The present study has highlighted the impact of culture parameters on the metabolic diversity and biological activity of different marine-derived actinobacteria. Despite their similarity, differences in the influence of culture conditions have been observed among each strain, and variations in intensity have also been demonstrated depending on the specific metabolite families. Among the parameters studied, the culture medium is already well known to be a major factor influencing the production of specialized metabolites [24]. Additionally, less studied parameters such as incubation time and culture support have also shown significant effects. This study could be combined with a strain prioritization approach to select the most promising bacteria from a large strain collection. Prioritization can be achieved using genomic, chemical, or biological approaches [59,60,61]. To optimize the selection of strains and culture parameters, microplate cultures offer the advantage of working with a large number of microorganisms and rapidly evaluating the effects of various parameters, such as the culture medium [54]. This approach would allow combining the selection of promising microorganisms with the identification of optimal culture conditions, while facilitating rapid biological and chemical screening. After culturing the selected strains under the best conditions, more precise adjustments of parameters could be considered to enhance the chemical diversity or targeted metabolite production, as demonstrated in the study by Jezkova et al. (2021) [62]. These combined approaches could accelerate the discovery of new bioactive molecules and optimize their production for therapeutic or industrial purposes.
4. Materials and Methods
4.1. Biological material (Sponge/Microbial strains)
In 2013, a sponge sample of Scopalina hapalia ML-263 was collected between 2 and 10 m depth on the southwest coast of Mayotte, an island in the Indian Ocean (GPS coordinates 12◦57.624' S; 45◦04.697' E). Nicole de Voogd of the Naturalis Biodiversity Center (Leiden, The Netherlans) carried out the identification of the sponge.
A microbial collection of one hundred and twenty-four strains was created from Scopalina hapalia ML-263 [27]. The identifications were carried out by the company Genoscreen and three actinomycetes, Micromonospora sp. (SH-82 and SH-57) and Salinispora arenicola (SH-78) were selected for this study (Table 4).
4.2. Cultivation of strains using the “One Strain Many Compounds” (OSMAC) method
The OSMAC approach used in this study varied the selected culture parameters such as incubation time (7, 14, 21 days), medium composition (A1BFe+C and Marin Broth), and support type (solid and liquid cultures). The selected strains were all kept in storage cryotubes and then revived before pre-culturing, according to the protocol described in Le Loarer et al. (2023) [59]. Pre-cultures and final cultures were carried out in the same medium, to obtain the crude extracts.
A1BFe+C medium, simplified to A1 in the article, consists of 10 g soluble starch (ref. 417587, BD Difco, Le Pont de Claix, France), 33 g sea salts (Instant Ocean 16 kg, Aquarium system, Sarrebourg, France), 4 g yeast extract (ref. 212750, BD Bacto, Le Pont de Claix, France), 1 g CaCO3 (ref. 433185, Carlo Erba, Val de Reuil, France), 2 g peptone (ref. 211820, BD Bacto, Le Pont de Claix, France), 100 mg KBr (ref. 470735, Carlo Erba, Val de Reuil, France), 40 mg Fe2(SO4)3 (ref. 451926, Carlo Erba, Val de Reuil, France) and QSP distilled water to obtain 1 L of final medium. Marin Broth medium, simplified to MB, was made of 30 g Marin Broth powder (ref. 279110, BD Difco, Le Pont de Claix, France) and QSP distilled water for 1 L of final medium.
Solid cultures were produced by adding 20 g agar (ref. 281210, BD Difco, Le Pont de Claix, France) according to the protocol of Le Loarer et al. (2023) [59]. Incubation times were 7, 14 and 21 days. Solid cultures containing MB medium were incubated for 14 days only.
Liquid cultures were obtained by introducing 25 mL of the preculture into 500 mL of liquid A1 or MB medium, which contained 25 g sterile amberlite resin XAD-16 (ref. MFCD00145831, Sigma Aldrich, St. Louis, MI, USA). Liquid cultures were incubated at 28◦C in a thermostatically controlled incubator (ref. S-000121948, Infors FT, Bottmingen, Switzerland) under agitation speed of 180 rpm. Incubation times for the A1 cultures were 7, 14 and 21 days and 14 days for the MB medium. Table 5 summarises the main parameters applied to the strains cultures.
4.3. Microbials extracts preparation
As described in the study by Le Loarer et al. (2023) [33], after incubation, the XAD-16 amberlite resin and biomass were recovered, filtered, washed and dried. The set has been extracted for 2 hours in 100 mL ethyl acetate (AcOEt) (ref. 448252 RPE grade, CarloErba, Val de Reuil, France) and a second consecutive extraction with 100 mL of methanol (MeOH) (ref. 412383 HPLC + grade, CarloErba, Val de Reuil, France) was performed with the same time. The two extracts were evaporated using a rotavapor (Laborota 4000, Heidolph, Schwabach, Germany) to obtain the microbial crude extracts. The entirety of the extracts has been sent to our partner for high resolution analysis, while a limited subset has been chosen for biological activity testing, considering the quantity of available extracts.
4.4. Chemical Analysis
The chemical analyses carried out on the microbial extracts were similar as in the study by Le Loarer et al. (2023) [59].
4.4.1. HPLC-DAD-CAD analysis
The microbial dry extracts were resolubilised in acetonitrile (ACN) (analytical grade 99% purity, CarloErba, Val de Reuil, France), filtered on a 0.2 µm Minisart RC filter
(ref. 7764ACK, Sigma Aldrich, St. Louis, MI, USA) and standardised at a concentration of 10 mg/mL. They were analyzed by high performance liquid chromatography (HPLC) on Dionex Ultimate 3000 (Thermo Scientific, Waltham, MA, USA) coupled to a diode array UV (DAD) and charged aerosol detector (CAD). Separation was performed on a Phenomenex Gemini C18 analytical column (150 × 4.6 mm, 3 μm) (Phenomenex, Torrance, CA, USA) with two solvents, ACN (MS grade, CarloErba, Val de Reuil, France) (phase A) and milli-Q water (phase B) each containing 0.1% formic acid (FA) (analytical grade 99% purity, CarloErba, Val de Reuil, France). For the analysis, a linear gradient from 5 to 100% B was used for 30 min with a flow rate of 0.7 mL/min. The CAD signal provided quantitative data expressed in pA.
4.4.1. UHPLC-QTOF-MS/MS Analysis
Standardised microbial extracts were dissolved in 1 ml of methanol (LCMS grade, CarloErba, Val de Reuil, France) and filtered with 0,22 μm PTFE syringe filters (Restek, Bellefonte, PA, USA). A Dionex Ultimate 3000 UHPLC system (Thermo Scientific, Waltham, MA, USA) coupled to a Bruker Impact II QtoF mass spectrometer (Bruker, Billerica, MA, USA) was used for high resolution analysis. The separation was performed on a Phenomenex Kinetex phenyl hexyl analytical column (1.7 μm, 150 × 2.1 mm, 1. 7 µm) (Phenomenex, Torrance, CA, USA) with two solvents, ACN (MS grade, CarloErba, Val de Reuil, France) (phase A) and milli-Q water (phase B) each containing 0.1% formic acid (FA) (analytical grade 99% purity, CarloErba, Val de Reuil, France). Elution was done with a linear gradient from 0 to 100% B for 8 min with a flow rate of 0.5 mL/min. The main MS data acquisition parameters were: an acquisition in positive mode (ESI+; 20-40 eV) and in the range of 20 to 1200 Da for MS1 spectra, a colision energy of 40 eV, an acquisition speed of 4 Hz and the selection of the 5 major MS1 precursors for the recording of MS2 spectra.
4.5. Raw data processing, ion identity molecular network and annotations
The high-resolution MS data were all processed identically with the MZmine 3.6.0 software [35]. The main processing parameters applied were: a detection threshold for MS1 masses of 3E3 and 1E0 for MS2, the use of the ADAP chromatogram builder [63] and the local minimum resolver for the creation of feature tables. The alignment was performed with an m/z tolerance of 0.0050 Da and a retention time of 0.150 min. Adduct identification was performed using an m/z tolerance of 0.0050 Da. All parameters used for data processing are described in Table S7. The aligned feature table and MS1/MS2 mass spectra data file (.mgf) were exported and used for the creation of ion identity molecular networks and compound annotation.
The IIMN were obtained from files exported from MZmine 3.6.0 [35] and created using the feature base molecular networking workflow of the GNPS platform [28,30]. The parameters set for the molecular networks are shown in Table S8. Visualisation and graphical modifications were performed with Cytoscape 3.9.1 software [29]. The use of an appropriate graphic style allowed to display graphically the influence of the culture parameters on the chemical diversity of microbial extracts.
Prior to annotation, the molecular networks were manually curated for each node to verify the true absence or presence of specific features in the microbial extracts. This step enabled to obtain more robust statistics and a correction on the origin of the ion in the different samples. Feature annotation was performed by combining the results of different computational and automated pipelines, followed by manual inspection to refine and correct the feature annotation. The GNPS platform [30] was used to compare the MS2 spectra with several experimental spectral libraries, and the spectra were also compared with in silico spectral databases of natural products (ISDB) [33], and the results were refined using timaR 2.7.2 software [34] and the LOTUS database [64]. The SIRIUS 5.7.2 software (Lehrstuhl für Bioinformatik, Jena, Germany) [31] was used to predict the fragmentation pattern with CSI: fingerID module [32], to determine the raw formula of the features and to identify the chemical class with the CANOPUS module [65]. The chemical classes were completed by Classyfire [66], an open-access platform for identifying the chemical classes of molecules. These different tools provided different annotation scores for each, which were compared with each other and grouped together if they were consistent. Very good confidence was assessed when tools displayed the same annotation with a high score, and when the literature was also coherent.
4.6. Biological Activity Tests
Biological activity tests were performed on a selection of microbial extracts that had been produced in sufficient quantity. The anti-plasmodial activity on Plasmodium falciparum 3D7 and the cytotoxic activity on the HCT-116 and MDA-MB-231 cell lines were targeted. These tests were carried out by the partners of the European FEDER PHAR project, whose objective is to develop bioactive molecules from the biodiversity of the Indian Ocean region. The protocols for the activity tests are detailed in Le Loarer et al. (2023) [59].
The antiplasmodial activity was carried out by the Pharmacognosy laboratory of the University of Liege using in vitro cultures of the chloroquine-sensitive 3D7 strain of Plasmodium falciparum according to the procedure of Trager and Jensen [67]. Extracts showing greater than 50% inhibition at a concentration of 10 µg/mL were selected for measurement of their concentration required to inhibit the growth of the parasite culture by 50% (IC50).
The cytotoxic activity was performed by the Institut de Chimie des Substances Naturelles (ICSN, Paris, France) on human colorectal HCT-116 and mammary MDA-MB-231 carcinoma cells. The percentage viability index was calculated from three experiments on extracts concentrated at 10 and 1 µg/mL.
5. Conclusions
The objective of this study was to evaluate the impact of culture parameters on the metabolic diversity and biological activity of microbial extracts obtained from three marine-derived actinobacteria isolated from an Indian Ocean sponge, Scopalina hapalia (ML-263). The OSMAC method was implemented to conduct this study, varying the incubation time, culture support, and composition of the medium to obtain different microbial extracts. These extracts were subjected to chemical screening, using quantitative analysis, creation of ion identity molecular networks (IIMN), and annotation of metabolites using bioinformatics tools. Biological screening was carried out by testing microbial extracts for their anticancer and antimalarial activity. The selected optimal culture parameters will be used for large-scale cultures to isolate and characterize the metabolites of interest.
This study showed common observations among all strains while highlighting some specificities. Nevertheless, optimal parameters have been identified for each isolate. Increasing culture time promoted metabolites production in Micromonospora strains and the 21 days culture were appropriate for the detection a panel of compounds. These results are correlated with an increased number of nodes in the molecular network, as well as better biological activity for Micromonospora sp. SH-82. The use of A1 medium appears to be the most favorable for achieving greater metabolic diversity for both Micromonospora isolates. Notably, the Micromonospora sp. SH-57 strain exhibited significantly higher chemical diversity in this medium, particularly underscored by the IIMN. Finally, the influence of the culture support (liquid or solid) also varied depending on the strains. For the Micromonospora sp. SH-82 strain, the influence of the culture support on metabolite production was not very significant, indicating that this microorganism maintains a robust production regardless of the support used. In contrast, for the Micromonospora sp. SH-57 and Salinispora arenicola SH-78 strains, the use of a liquid support revealed significantly greater chemical diversity, coupled with higher biological activity for Micromonospora sp. SH-57. Undoubtedly, culture parameters can have a specific impact on the production of particular metabolites. The analysis of IIMN has revealed the presence or increase of certain types of compounds under specific conditions. As an example, Salinispora arenicola SH-78’s solid culture extracts exhibited higher intensities of the precursors ions identified as the staurosporine family, known as biologically active compounds.
This study, which assessed the impact of less explored culture parameters, such as time and nature of culture support, has successfully identified optimal parameters for these marine-derived actinobacteria, in the range of the studied conditions. These results highlight the importance of systematically exploring and carefully selecting culture conditions, whether to enhance metabolic diversity or optimize the production of specialized metabolites. It thus paves the way for larger-scale cultures for the isolation of microbial promising metabolites.
Supplementary Materials
The following supporting information can be downloaded at: Preprints.org, Figure S1 : Cluster of Micromonospora sp. SH-82 containing discharged ions representing the megalomicins. Figure S2 : Zoom-in on cluster of Micromonospora sp. SH-82 containing erythromycin annotation. Figure S3 : Zoom-in on two largest cluster of Salinispora arenicola SH-78 is not clearly annotated. Table S1 : Summary table of number of peaks (visible and major) observed for each microbial extract in HPLC-DAD-CAD analysis. Table S2 : Detailed of observed peaks in the HPLC-CAD chromatographic profiles of microbials extracts from Micromonospora sp. SH-82. Table S3 : Summary table of annotations from the Ion Identity Molecular Network of the different extracts of Micromonospora sp. SH-82. Table S4 : Detailed of observed peaks in the HPLC-CAD chromatographic profiles of microbials extracts from Micromonospora sp. SH-57. Table S5 : Summary table of annotations from the Ion Identity Molecular Network of the different extracts of Micromonospora sp. SH-57. Table S6 : Detailed of observed peaks in the HPLC-CAD chromatographic profiles of microbials extracts from Salinispora arenicola SH-78. Table S7: Summary table of annotations from the Ion Identity Molecular Network of the different extracts of Salinispora arenicola SH-78.
Author Contributions
Conceptualization, A.L.L., A.G.-B., M.F. (Mireille Fouillaud), M.F. (Michel Frédérich), J.B. and A.L. ; Methodology, A.L.L., A.G.-B. and M.F. (Mireille Fouillaud) ; software, A.L.L. ; formal analysis, A.L.L., A.G.-B, M.F. (Mireille Fouillaud), and A.L ; visualization, A.L.L., A.G.-B. and M.F. (Mireille Fouillaud) ; investigation, A.L.L., J.B. and A.L. ; data curation, A.L.L. ; writing—original draft preparation, A.L.L ; writing—review and editing, A.L.L., A.G.-B., M.F. (Mireille Fouillaud), L.D, J.B., M.F. (Michel Frédérich) and A.L. ; supervision, A.G.-B., M.F. (Mireille Fouillaud), L.D. and M.F. (Michel Frédérich) ; resources, A.G.-B. and M.F. (Mireille Fouillaud) ; project administration, A.G.-B. ; funding acquisition, A.G.-B. All authors have read and agreed to the published version of the manuscript.
Funding
This work was supported by European Regional Development Funds [GURDTI 2018-1828-0002370] (FEDER PHAR, EU-Région Réunion-French State national counterpart). Alexandre Le Loarer was a recipient of a fellowship from the Région Réunion.
Data Availability Statement
The molecular networks produced for this study are available with these IDs. IIMN of Micromonospora sp. SH-82: 820b3e2ec42546b8bd9d4da0aab3d1d0; c57e3cafc0294e1497a7d603a25efb50. IIMN of Micromonospora sp. SH-57 : b22f71bb29d5409c9547335e72b58e3b; cb81ad26159b41578d6e7ea860f07522. IIMN of Salinispora arenicola SH-78 : 1917bc9b3a50493b8183febb2fe7e608; 6b57aa3a965543a18c0e5132b73562fc; 7582705fe7fe49009b1b7a7ef3cad727.
Acknowledgments
The authors express our gratitude to Nicole de Voogd from the Naturalis Biodiversity Center for identifying the sponge and also to the regional platform MALLABAR at Institut Méditerranéen de Biodiversité et d’Ecologie marine et continentale IMBE in Marseille for conducting high-resolution chemical analyses.
Conflicts of Interest
The authors declare no conflict of interest.
References
- Non Communicable Diseases. Available online: https://www.who.int/news-room/fact-sheets/detail/noncommunicable-diseases (accessed on 19 April 2023).
- The Top 10 Causes of Death. Available online: https://www.who.int/news-room/fact-sheets/detail/the-top-10-causes-of-death (accessed on 19 April 2023).
- World Health Organization World Malaria Report 2021; World Health Organization: Geneva, 2021; ISBN 978-92-4-004049-6.
- Cancer (IARC), T.I.A. for R. on Global Cancer Observatory. Available online: https://gco.iarc.fr/ (accessed on 12 May 2023).
- Huemer, M.; Mairpady Shambat, S.; Brugger, S.D.; Zinkernagel, A.S. Antibiotic Resistance and Persistence-Implications for Human Health and Treatment Perspectives. EMBO Rep 2020, 21, e51034. [Google Scholar] [CrossRef]
- Newman, D.J.; Cragg, G.M. Natural Products as Sources of New Drugs over the Nearly Four Decades from 01/1981 to 09/2019. J Nat Prod 2020, 83, 770–803. [Google Scholar] [CrossRef] [PubMed]
- Lu, W.-Y.; Li, H.-J.; Li, Q.-Y.; Wu, Y.-C. Application of Marine Natural Products in Drug Research. Bioorg Med Chem 2021, 35, 116058. [Google Scholar] [CrossRef] [PubMed]
- Jose, P.A.; Maharshi, A.; Jha, B. Actinobacteria in Natural Products Research: Progress and Prospects. Microbiological Research 2021, 246, 126708. [Google Scholar] [CrossRef]
- Srinivasan, R.; Kannappan, A.; Shi, C.; Lin, X. Marine Bacterial Secondary Metabolites: A Treasure House for Structurally Unique and Effective Antimicrobial Compounds. Mar Drugs 2021, 19, 530. [Google Scholar] [CrossRef] [PubMed]
- Subramani, R.; Sipkema, D. Marine Rare Actinomycetes: A Promising Source of Structurally Diverse and Unique Novel Natural Products. Mar Drugs 2019, 17. [Google Scholar] [CrossRef] [PubMed]
- Bauermeister, A.; Velasco-Alzate, K.; Dias, T.; Macedo, H.; Ferreira, E.G.; Jimenez, P.C.; Lotufo, T.M.C.; Lopes, N.P.; Gaudêncio, S.P.; Costa-Lotufo, L.V. Metabolomic Fingerprinting of Salinispora From Atlantic Oceanic Islands. Front Microbiol 2018, 9, 3021. [Google Scholar] [CrossRef]
- Hassan, S.S.U.; Shaikh, A.L. Marine Actinobacteria as a Drug Treasure House. Biomed Pharmacother 2017, 87, 46–57. [Google Scholar] [CrossRef]
- Barka, E.A.; Vatsa, P.; Sanchez, L.; Gaveau-Vaillant, N.; Jacquard, C.; Klenk, H.-P.; Clément, C.; Ouhdouch, Y.; van Wezel, G.P. Taxonomy, Physiology, and Natural Products of Actinobacteria. Microbiol Mol Biol Rev 2015, 80, 1–43. [Google Scholar] [CrossRef]
- Bahrami, Y.; Bouk, S.; Kakaei, E.; Taheri, M. Natural Products from Actinobacteria as a Potential Source of New Therapies Against Colorectal Cancer: A Review. Front Pharmacol 2022, 13, 929161. [Google Scholar] [CrossRef]
- Jensen, P.R.; Moore, B.S.; Fenical, W. The Marine Actinomycete Genus Salinispora: A Model Organism for Secondary Metabolite Discovery. Nat Prod Rep 2015, 32, 738–751. [Google Scholar] [CrossRef] [PubMed]
- Xiao, F.; Li, H.; Xu, M.; Li, T.; Wang, J.; Sun, C.; Hong, K.; Li, W. Staurosporine Derivatives Generated by Pathway Engineering in a Heterologous Host and Their Cytotoxic Selectivity. J. Nat. Prod. 2018, 81, 1745–1751. [Google Scholar] [CrossRef] [PubMed]
- Park, B.; Abdel-Azeem, A.; Al-Sanea, M.; Yoo, K.; Tae, J.; Lee, S. Staurosporine Analogues from Microbial and Synthetic Sources and Their Biological Activities. CMC 2013, 20, 3872–3902. [Google Scholar] [CrossRef] [PubMed]
- Reen, F.J.; Romano, S.; Dobson, A.D.W.; O’Gara, F. The Sound of Silence: Activating Silent Biosynthetic Gene Clusters in Marine Microorganisms. Mar Drugs 2015, 13, 4754–4783. [Google Scholar] [CrossRef]
- Brakhage, A.A.; Schuemann, J.; Bergmann, S.; Scherlach, K.; Schroeckh, V.; Hertweck, C. Activation of Fungal Silent Gene Clusters: A New Avenue to Drug Discovery. Prog Drug Res 2008, 66, 1, 3–12. [Google Scholar] [CrossRef] [PubMed]
- Netzker, T.; Fischer, J.; Weber, J.; Mattern, D.J.; König, C.C.; Valiante, V.; Schroeckh, V.; Brakhage, A.A. Microbial Communication Leading to the Activation of Silent Fungal Secondary Metabolite Gene Clusters. Front Microbiol 2015, 6, 299. [Google Scholar] [CrossRef]
- Okada, B.K.; Seyedsayamdost, M.R. Antibiotic Dialogues: Induction of Silent Biosynthetic Gene Clusters by Exogenous Small Molecules. FEMS Microbiology Reviews 2017, 41, 19–33. [Google Scholar] [CrossRef]
- Pinedo-Rivilla, C.; Aleu, J.; Durán-Patrón, R. Cryptic Metabolites from Marine-Derived Microorganisms Using OSMAC and Epigenetic Approaches. Mar Drugs 2022, 20, 84. [Google Scholar] [CrossRef]
- Romano, S.; Jackson, S.A.; Patry, S.; Dobson, A.D.W. Extending the “One Strain Many Compounds” (OSMAC) Principle to Marine Microorganisms. Mar Drugs 2018, 16, 244. [Google Scholar] [CrossRef]
- Palma Esposito, F.; Giugliano, R.; Della Sala, G.; Vitale, G.A.; Buonocore, C.; Ausuri, J.; Galasso, C.; Coppola, D.; Franci, G.; Galdiero, M.; et al. Combining OSMAC Approach and Untargeted Metabolomics for the Identification of New Glycolipids with Potent Antiviral Activity Produced by a Marine Rhodococcus. Int J Mol Sci 2021, 22, 9055. [Google Scholar] [CrossRef]
- Zhang, X.; Chen, L.; Chai, W.; Lian, X.-Y.; Zhang, Z. A Unique Indolizinium Alkaloid Streptopertusacin A and Bioactive Bafilomycins from Marine-Derived Streptomyces sp. HZP-2216E. Phytochemistry 2017, 144, 119–126. [Google Scholar] [CrossRef] [PubMed]
- Fan, B.; Parrot, D.; Blümel, M.; Labes, A.; Tasdemir, D. Influence of OSMAC-Based Cultivation in Metabolome and Anticancer Activity of Fungi Associated with the Brown Alga Fucus Vesiculosus. Mar Drugs 2019, 17, 67. [Google Scholar] [CrossRef] [PubMed]
- Said Hassane, C.; Fouillaud, M.; Le Goff, G.; Sklirou, A.D.; Boyer, J.B.; Trougakos, I.P.; Jerabek, M.; Bignon, J.; de Voogd, N.J.; Ouazzani, J.; et al. Microorganisms Associated with the Marine Sponge Scopalina Hapalia: A Reservoir of Bioactive Molecules to Slow Down the Aging Process. Microorganisms 2020, 8, E1262. [Google Scholar] [CrossRef]
- Schmid, R.; Petras, D.; Nothias, L.-F.; Wang, M.; Aron, A.T.; Jagels, A.; Tsugawa, H.; Rainer, J.; Garcia-Aloy, M.; Dührkop, K.; et al. Ion Identity Molecular Networking for Mass Spectrometry-Based Metabolomics in the GNPS Environment. Nat Commun 2021, 12, 3832. [Google Scholar] [CrossRef]
- Shannon, P.; Markiel, A.; Ozier, O.; Baliga, N.S.; Wang, J.T.; Ramage, D.; Amin, N.; Schwikowski, B.; Ideker, T. Cytoscape: A Software Environment for Integrated Models of Biomolecular Interaction Networks. Genome Res 2003, 13, 2498–2504. [Google Scholar] [CrossRef] [PubMed]
- Wang, M.; Carver, J.J.; Phelan, V.V.; Sanchez, L.M.; Garg, N.; Peng, Y.; Nguyen, D.D.; Watrous, J.; Kapono, C.A.; Luzzatto-Knaan, T.; et al. Sharing and Community Curation of Mass Spectrometry Data with Global Natural Products Social Molecular Networking. Nat Biotechnol 2016, 34, 828–837. [Google Scholar] [CrossRef] [PubMed]
- Dührkop, K.; Fleischauer, M.; Ludwig, M.; Aksenov, A.A.; Melnik, A.V.; Meusel, M.; Dorrestein, P.C.; Rousu, J.; Böcker, S. SIRIUS 4: A Rapid Tool for Turning Tandem Mass Spectra into Metabolite Structure Information. Nat Methods 2019, 16, 299–302. [Google Scholar] [CrossRef]
- Dührkop, K.; Shen, H.; Meusel, M.; Rousu, J.; Böcker, S. Searching Molecular Structure Databases with Tandem Mass Spectra Using CSI:FingerID. Proc Natl Acad Sci U S A 2015, 112, 12580–12585. [Google Scholar] [CrossRef]
- Allard, P.-M.; Péresse, T.; Bisson, J.; Gindro, K.; Marcourt, L.; Pham, V.C.; Roussi, F.; Litaudon, M.; Wolfender, J.-L. Integration of Molecular Networking and In-Silico MS/MS Fragmentation for Natural Products Dereplication. Anal. Chem. 2016, 88, 3317–3323. [Google Scholar] [CrossRef]
- Rutz, A.; Dounoue-Kubo, M.; Ollivier, S.; Bisson, J.; Bagheri, M.; Saesong, T.; Ebrahimi, S.N.; Ingkaninan, K.; Wolfender, J.-L.; Allard, P.-M. Taxonomically Informed Scoring Enhances Confidence in Natural Products Annotation. Frontiers in Plant Science 2019, 10. [Google Scholar] [CrossRef]
- Pluskal, T.; Castillo, S.; Villar-Briones, A.; Orešič, M. MZmine 2: Modular Framework for Processing, Visualizing, and Analyzing Mass Spectrometry-Based Molecular Profile Data. BMC Bioinformatics 2010, 11, 395. [Google Scholar] [CrossRef] [PubMed]
- Rajput, A.; Dominguez San Martin, I.; Rose, R.; Beko, A.; LeVea, C.; Sharratt, E.; Mazurchuk, R.; Hoffman, R.M.; Brattain, M.G.; Wang, J. Characterization of HCT116 Human Colon Cancer Cells in an Orthotopic Model. Journal of Surgical Research 2008, 147, 276–281. [Google Scholar] [CrossRef] [PubMed]
- Welsh, J. Chapter 40 - Animal Models for Studying Prevention and Treatment of Breast Cancer. In Animal Models for the Study of Human Disease; Conn, P.M., Ed.; Academic Press: Boston, 2013; pp. 997–1018. ISBN 978-0-12-415894-8. [Google Scholar]
- Gaudêncio, S.P.; Bayram, E.; Lukić Bilela, L.; Cueto, M.; Díaz-Marrero, A.R.; Haznedaroglu, B.Z.; Jimenez, C.; Mandalakis, M.; Pereira, F.; Reyes, F.; et al. Advanced Methods for Natural Products Discovery: Bioactivity Screening, Dereplication, Metabolomics Profiling, Genomic Sequencing, Databases and Informatic Tools, and Structure Elucidation. Mar Drugs 2023, 21, 308. [Google Scholar] [CrossRef] [PubMed]
- Le Goff, G.; Adelin, E.; Cortial, S.; Servy, C.; Ouazzani, J. Application of Solid-Phase Extraction to Agar-Supported Fermentation. Bioprocess Biosyst Eng 2013, 36, 1285–1290. [Google Scholar] [CrossRef]
- Conn, P.M. Animal Models for the Study of Human Disease; Elsevier Science, 2013; ISBN 978-0-12-415894-8.
- Marquez, J.; Murawski, A.; Wagman, G.H.; Jaret, R.S.; Reimann, H. ISOLATION, PURIFICATION AND PRELIMINARY CHARACTERIZATION OF MEGALOMICIN. J. Antibiot. 1969, 22, 259–264. [Google Scholar] [CrossRef]
- Useglio, M.; Peirú, S.; Rodríguez, E.; Labadie, G.R.; Carney, J.R.; Gramajo, H. TDP-l-Megosamine Biosynthesis Pathway Elucidation and Megalomicin A Production in Escherichia Coli. Applied and Environmental Microbiology 2010, 76, 3869. [Google Scholar] [CrossRef]
- MetaCyc: Metabolic Pathways From All Domains of Life. Available online: https://metacyc.org/ (accessed on 27 July 2023).
- Goodman, C.; Useglio, M.; Peirú, S.; Labadie, G.; Mcfadden, G.; Rodriguez, E.; Gramajo, H. Chemobiosynthesis of New Antimalarial Macrolides. Antimicrobial agents and chemotherapy 2012, 57. [Google Scholar] [CrossRef]
- Farinella, V.F.; Kawafune, E.S.; Tangerina, M.M.P.; Domingos, H.V.; Costa-Lotufo, L.V.; Ferreira, M.J.P. OSMAC Strategy Integrated with Molecular Networking for Accessing Griseofulvin Derivatives from Endophytic Fungi of Moquiniastrum Polymorphum (Asteraceae). Molecules 2021, 26, 7316. [Google Scholar] [CrossRef]
- Armin, R.; Zühlke, S.; Grunewaldt-Stöcker, G.; Mahnkopp-Dirks, F.; Kusari, S. Production of Siderophores by an Apple Root-Associated Streptomyces Ciscaucasicus Strain GS2 Using Chemical and Biological OSMAC Approaches. Molecules 2021, 26, 3517. [Google Scholar] [CrossRef]
- Tanaka, M.; Shin-Ya, K.; Furihata, K.; Seto, H. Isolation and Structural Elucidation of Antioxidative Substances, Carbazoquinocins A to F. J. Antibiot. 1995, 48, 326–328. [Google Scholar] [CrossRef]
- Kashiwada, Y.; Nonaka, G.; Nishioka, I. Studies on Rhubarb (Rhei Rhizoma). V. Isolation and Characterization of Chromone and Chromanone Derivatives. Chem. Pharm. Bull. 1984, 32, 3493–3500. [Google Scholar] [CrossRef]
- Yeo, W.-H.; Yun, B.-S.; Kim, S.-S.; Park, E.-K.; Kim, Y.-H.; Yoo, I.-D.; Yu, S.-H. GTRI-02, a New Lipid Peroxidation Inhibitor from Micromonospora sp. SA246. J. Antibiot. 1998, 51, 952–953. [Google Scholar] [CrossRef] [PubMed]
- Kishi, T.; Muroi, M.; Kusaka, T.; Nishikawa, M.; Kamiya, K.; Mizuno, K. The Structure of Aristeromycin. Chemical & Pharmaceutical Bulletin 1972, 20, 940–946. [Google Scholar] [CrossRef]
- Patil, V.M.; Masand, N.; Verma, S.; Masand, V. Chromones: Privileged Scaffold in Anticancer Drug Discovery. Chemical Biology & Drug Design 2021, 98, 943–953. [Google Scholar] [CrossRef]
- Song, F.; Liu, D.; Huo, X.; Qiu, D. The Anticancer Activity of Carbazole Alkaloids. Archiv der Pharmazie 2022, 355, 2100277. [Google Scholar] [CrossRef]
- Uchiyama, N.; Tanaka, Y.; Kawamoto, T. Aristeromycin and DZNeP Cause Growth Inhibition of Prostate Cancer via Induction of Mir-26a. European Journal of Pharmacology 2017, 812, 138–146. [Google Scholar] [CrossRef]
- Crüsemann, M.; O’Neill, E.C.; Larson, C.B.; Melnik, A.V.; Floros, D.J.; da Silva, R.R.; Jensen, P.R.; Dorrestein, P.C.; Moore, B.S. Prioritizing Natural Product Diversity in a Collection of 146 Bacterial Strains Based on Growth and Extraction Protocols. J Nat Prod 2017, 80, 588–597. [Google Scholar] [CrossRef]
- Jensen, P.R.; Williams, P.G.; Oh, D.-C.; Zeigler, L.; Fenical, W. Species-Specific Secondary Metabolite Production in Marine Actinomycetes of the Genus Salinispora. Appl Environ Microbiol 2007, 73, 1146–1152. [Google Scholar] [CrossRef]
- Schlawis, C.; Harig, T.; Ehlers, S.; Guillen-Matus, D.G.; Creamer, K.E.; Jensen, P.R.; Schulz, S. Extending the Salinilactone Family. Chembiochem 2020, 21, 1629–1632. [Google Scholar] [CrossRef]
- Stratmann, A.; Schupp, T.; Toupet, C.; Schilling, W.; Oberer, L.; Traber, R. New Insights into Rifamycin B Biosynthesis: Isolation of Proansamycin B and 34a-Deoxy-Rifamycin W as Early Macrocyclic Intermediates Indicating Two Separated Biosynthetic Pathways. J Antibiot (Tokyo) 2002, 55, 396–406. [Google Scholar] [CrossRef]
- Jimenez, P.C.; Wilke, D.V.; Ferreira, E.G.; Takeara, R.; de Moraes, M.O.; da Silveira, E.R.; da Cruz Lotufo, T.M.; Lopes, N.P.; Costa-Lotufo, L.V. Structure Elucidation and Anticancer Activity of 7-Oxostaurosporine Derivatives from the Brazilian Endemic Tunicate Eudistoma Vannamei. Mar Drugs 2012, 10, 1092–1102. [Google Scholar] [CrossRef]
- Le Loarer, A.; Marcellin-Gros, R.; Dufossé, L.; Bignon, J.; Frédérich, M.; Ledoux, A.; Queiroz, E.F.; Wolfender, J.-L.; Gauvin-Bialecki, A.; Fouillaud, M. Prioritization of Microorganisms Isolated from the Indian Ocean Sponge Scopalina Hapalia Based on Metabolomic Diversity and Biological Activity for the Discovery of Natural Products. Microorganisms 2023, 11, 697. [Google Scholar] [CrossRef] [PubMed]
- Steele, A.D.; Teijaro, C.N.; Yang, D.; Shen, B. Leveraging a Large Microbial Strain Collection for Natural Product Discovery. J Biol Chem 2019, 294, 16567–16576. [Google Scholar] [CrossRef] [PubMed]
- Hindra; Huang, T. ; Yang, D.; Rudolf, J.D.; Xie, P.; Xie, G.; Teng, Q.; Lohman, J.R.; Zhu, X.; Huang, Y.; et al. Strain Prioritization for Natural Product Discovery by a High-Throughput Real-Time PCR Method. J Nat Prod 2014, 77, 2296–2303. [Google Scholar] [CrossRef] [PubMed]
- Jezkova, Z.; Binda, E.; Potocar, T.; Marinelli, F.; Halecky, M.; Branyik, T. Laboratory Scale Cultivation of Salinispora Tropica in Shake Flasks and Mechanically Stirred Bioreactors. Biotechnol Lett 2021, 43, 1715–1722. [Google Scholar] [CrossRef]
- Myers, O.D.; Sumner, S.J.; Li, S.; Barnes, S.; Du, X. One Step Forward for Reducing False Positive and False Negative Compound Identifications from Mass Spectrometry Metabolomics Data: New Algorithms for Constructing Extracted Ion Chromatograms and Detecting Chromatographic Peaks. Anal. Chem. 2017, 89, 8696–8703. [Google Scholar] [CrossRef]
- Rutz, A.; Sorokina, M.; Galgonek, J.; Mietchen, D.; Willighagen, E.; Gaudry, A.; Graham, J.G.; Stephan, R.; Page, R.; Vondrášek, J.; et al. The LOTUS Initiative for Open Knowledge Management in Natural Products Research. eLife 2022, 11, e70780. [Google Scholar] [CrossRef]
- Dührkop, K.; Nothias, L.-F.; Fleischauer, M.; Reher, R.; Ludwig, M.; Hoffmann, M.A.; Petras, D.; Gerwick, W.H.; Rousu, J.; Dorrestein, P.C.; et al. Systematic Classification of Unknown Metabolites Using High-Resolution Fragmentation Mass Spectra. Nat Biotechnol 2021, 39, 462–471. [Google Scholar] [CrossRef]
- Djoumbou Feunang, Y.; Eisner, R.; Knox, C.; Chepelev, L.; Hastings, J.; Owen, G.; Fahy, E.; Steinbeck, C.; Subramanian, S.; Bolton, E.; et al. ClassyFire: Automated Chemical Classification with a Comprehensive, Computable Taxonomy. Journal of Cheminformatics 2016, 8, 61. [Google Scholar] [CrossRef]
- Trager, W.; Jensen, J.B. Human Malaria Parasites in Continuous Culture. Science 1976, 193, 673–675. [Google Scholar] [CrossRef]
Figure 1.
Figure 1. (a) Ion Identity Molecular Network (IIMN) of microbial extracts from solid cultures at 7
(pink), 14 (red) and 21 days (maroon) and from liquid cultures of 7 (sky blue), 14 (standard blue) and
21 days (dark blue) of Micromonospora sp. SH-82. (b) Venn diagrams showing the percentage of nodes
as a function of culture parameters, depending on the culture support at the top and time details at
the bottom. (c) Zoom on clusters of interest with examples of annotations.
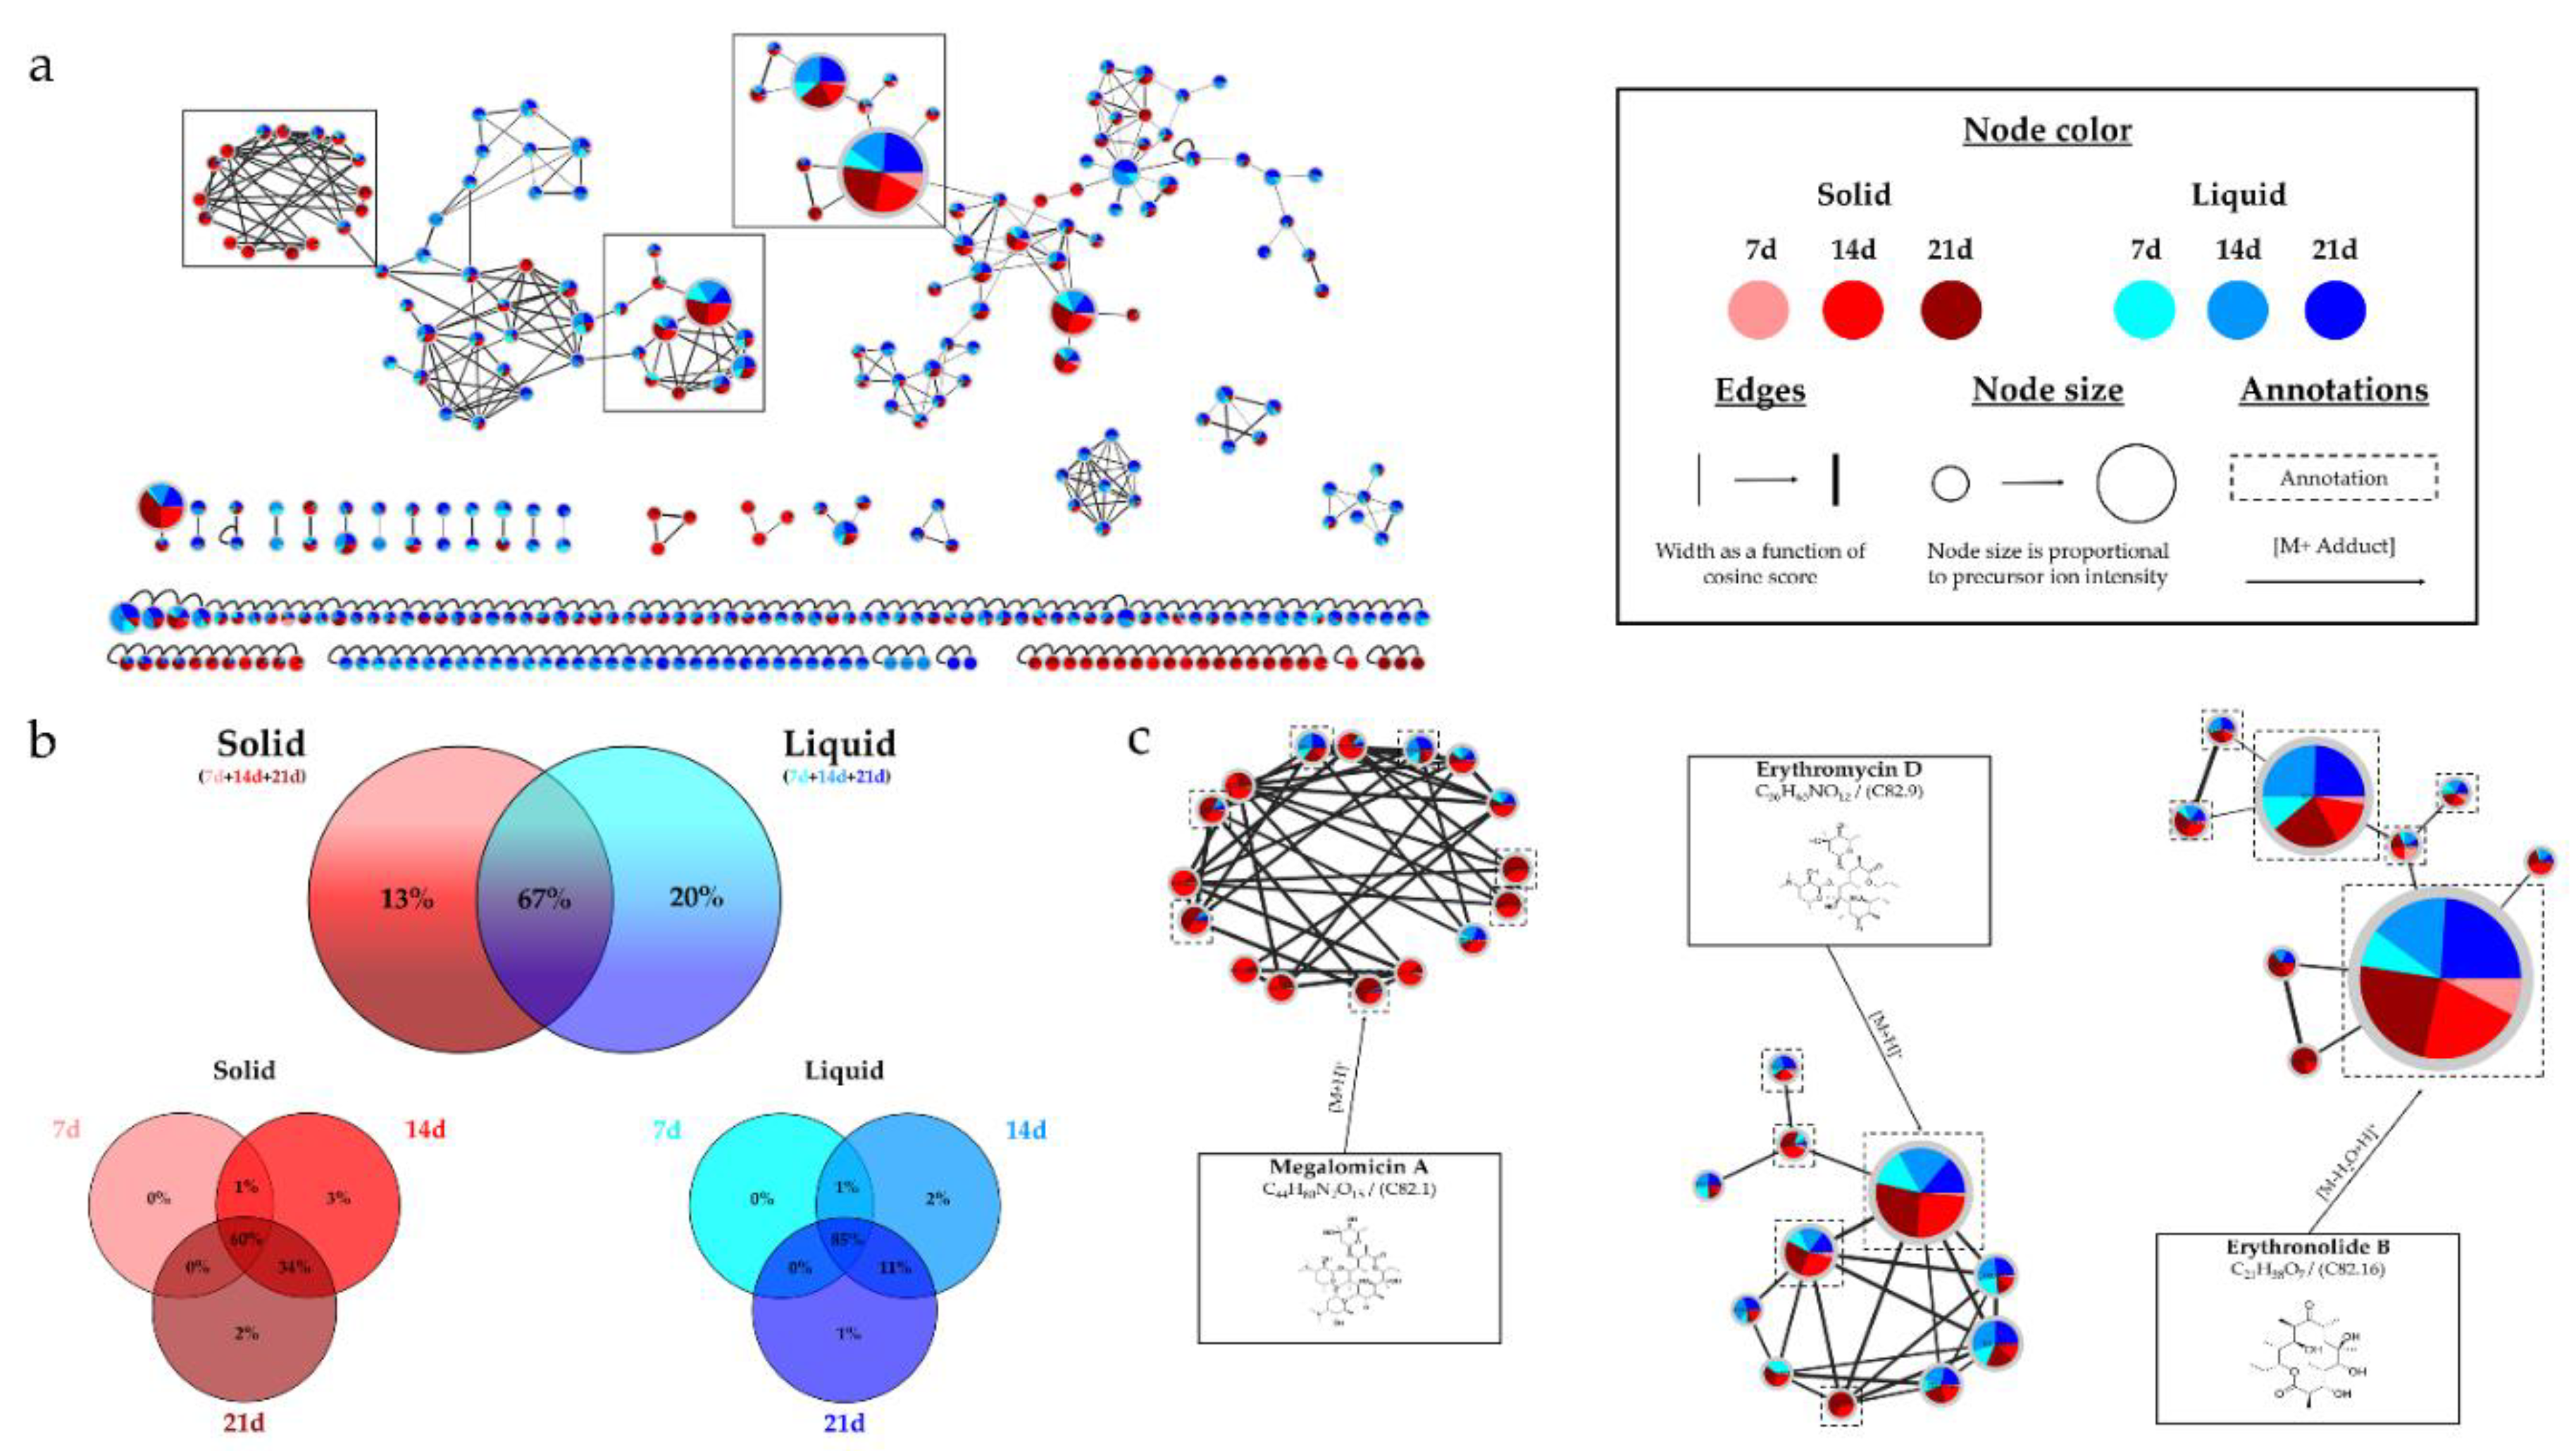
Figure 2.
Figure 2. Histograms representing the main annotations made in this network designed with extracts
from the solid and liquid culture of Micromonospora sp. SH-82 at different times (7, 14, 21 days).
Histograms presents the proportion attributed to each culture condition relative to the precursor ion
area intensities. Red gradient represents extract from solid culture. Pink: 7 days; Red: 14 days; Brown:
21 days. Blue gradient represents extract from solid culture. Sky blue: 7 days; Standard blue: 14 days;
Dark blue: 21 days.
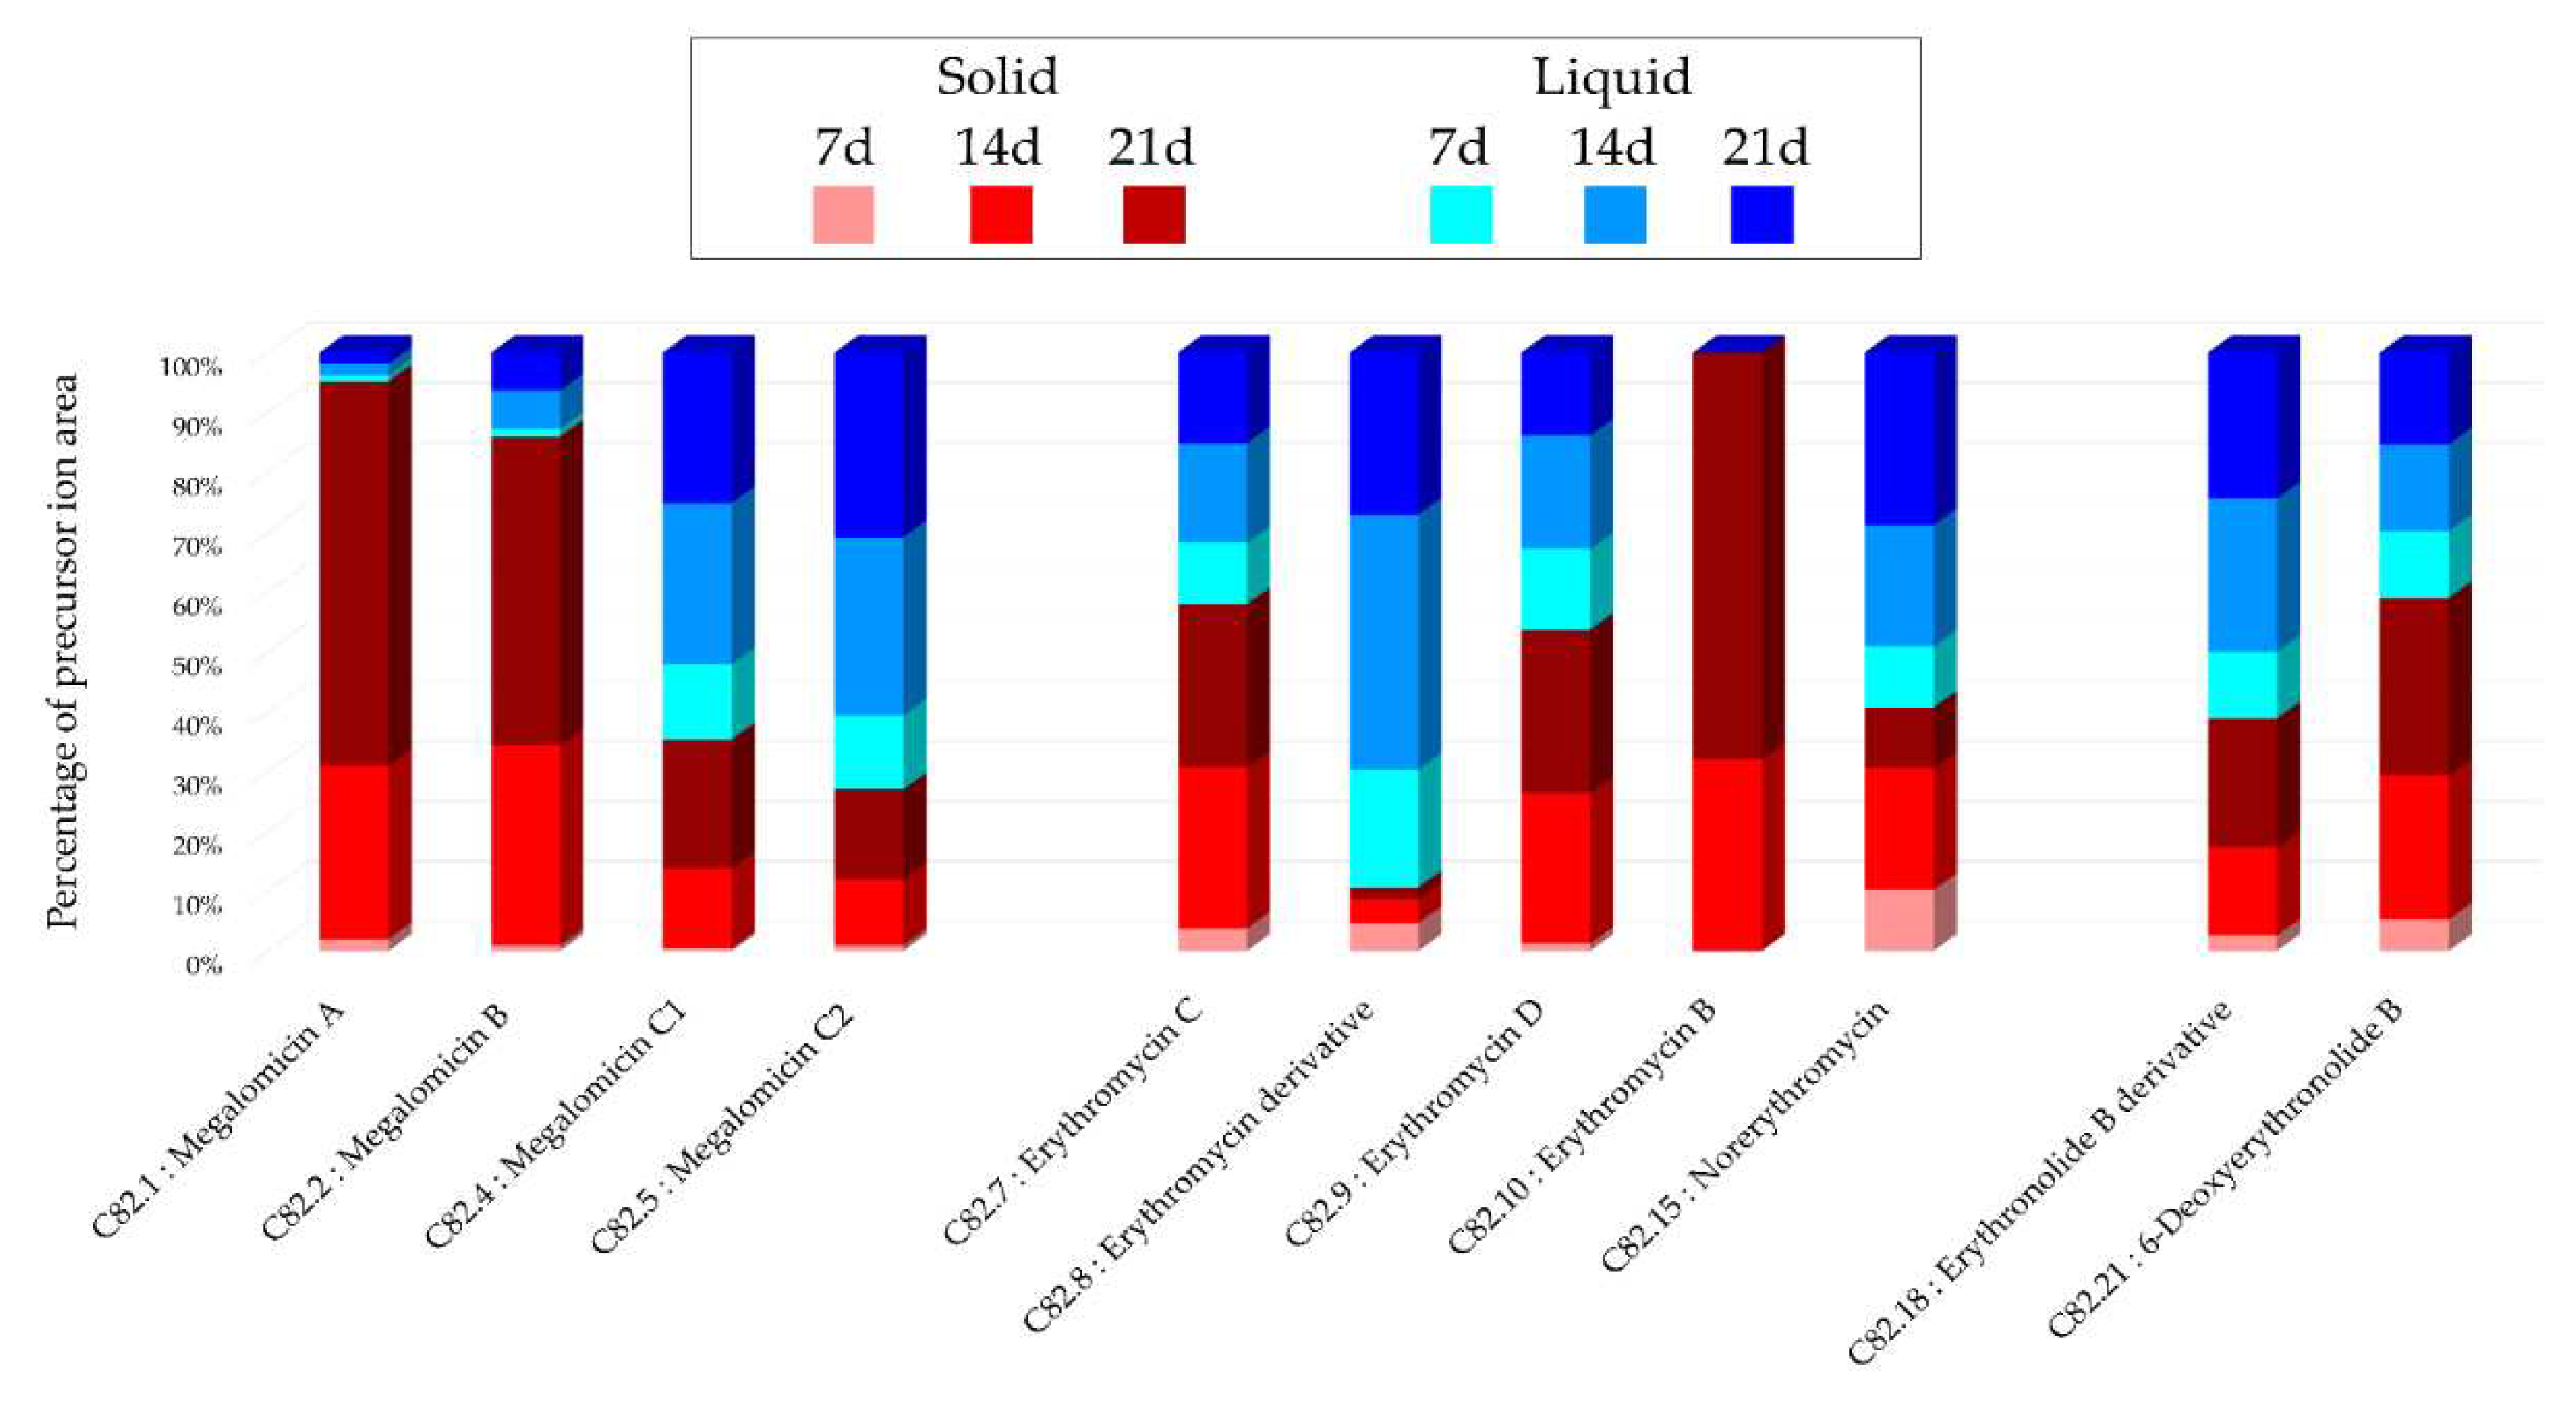
Figure 3.
Biological activity of Micromonospora sp. SH-82 extracts from culture A1 solid medium for 14 days and 21 days. (a) Antiplasmodial activities against P. falciparum strain 3D7, tested at 50 µg/mL (dark color) and 10 µg/mL (grey color). Cytotoxic activities against (b) HCT-116 cell line and (c) MDA-MB-231 cell line, tested at 10 µg/mL (dark color) and 1 µg/mL (grey color). The black lines indicate the threshold for considering the extract as promising, with different criteria: > 50% inhibition for antiplasmodial activity and < 50% viability for cytotoxic activity.
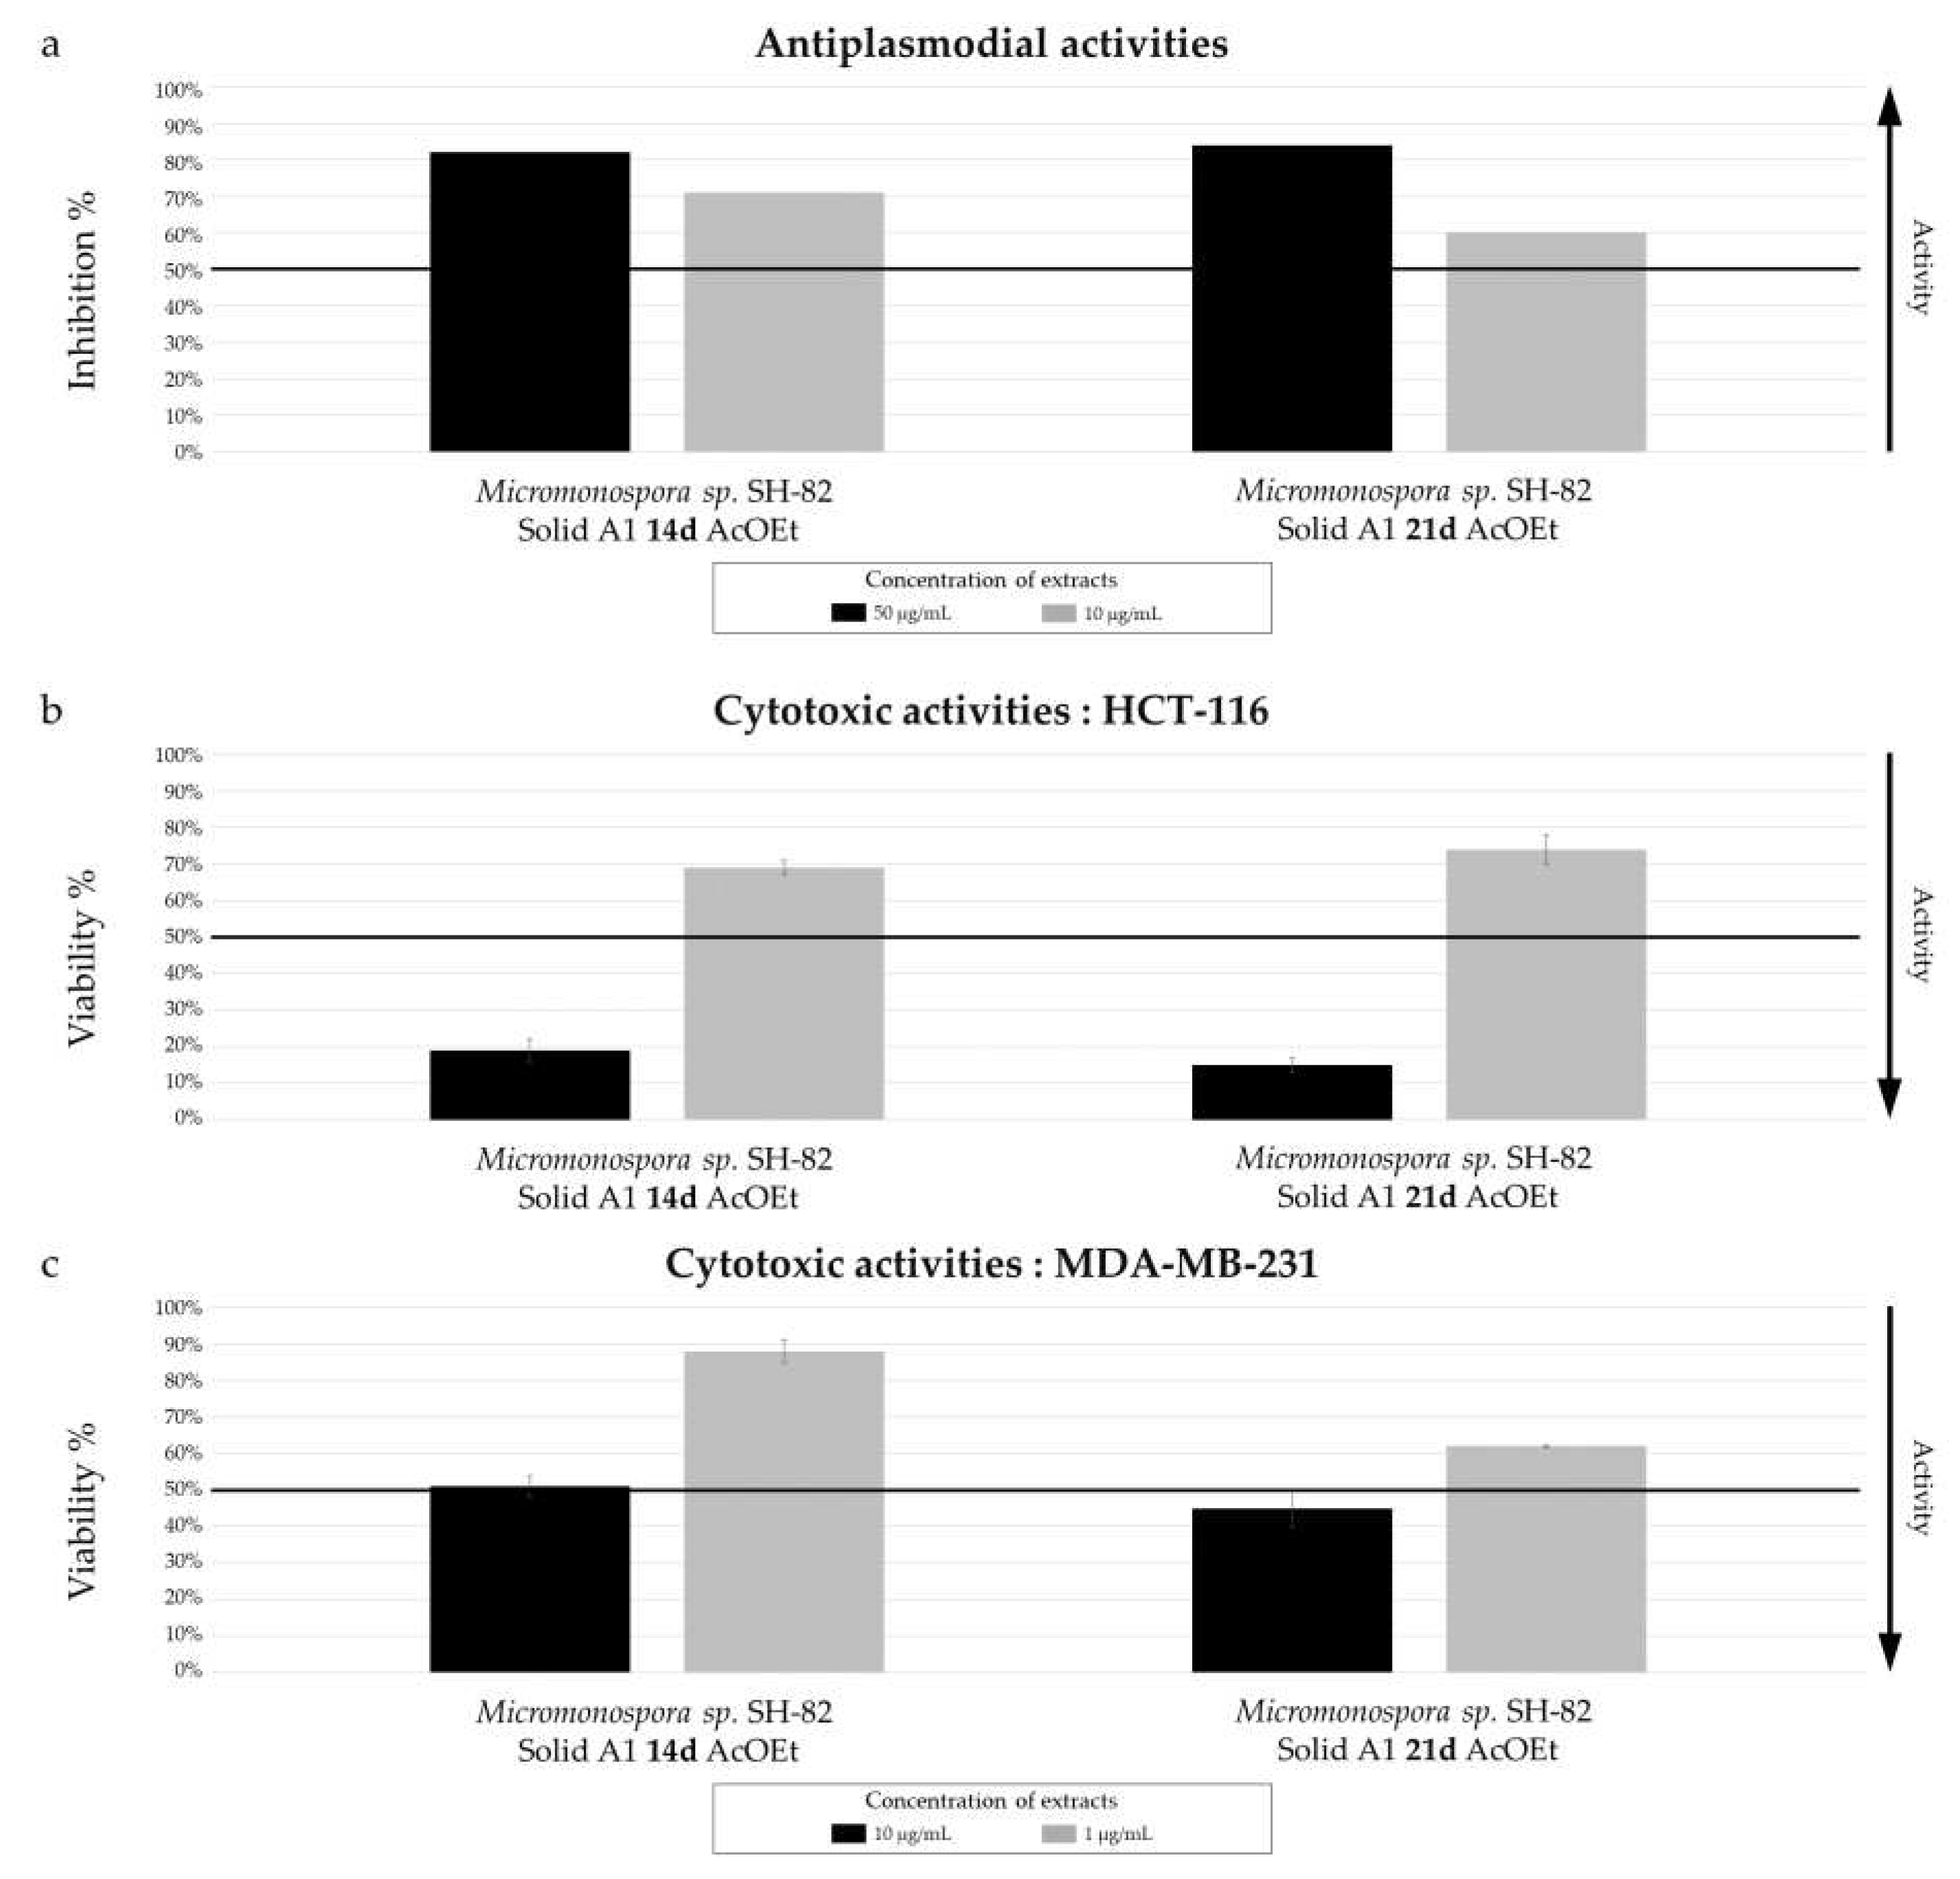
Figure 4.
Biological activity of Micromonospora sp. SH-82 extracts from culture on A1 solid and liquid medium for 14 days. (a) Antiplasmodial activities against P. falciparum strain 3D7, tested at 50 µg/mL (dark color) and 10 µg/mL(grey color). Cytotoxic activities against (b) HCT-116 cell line and (c) MDA-MB-231 cell line, tested at 10 µg/mL (dark color) and 1 µg/mL (grey color). The black lines indicate the threshold for considering the extract as promising, with different criteria: > 50% inhibition for antiplasmodial activity and < 50% viability for cytotoxic activity.
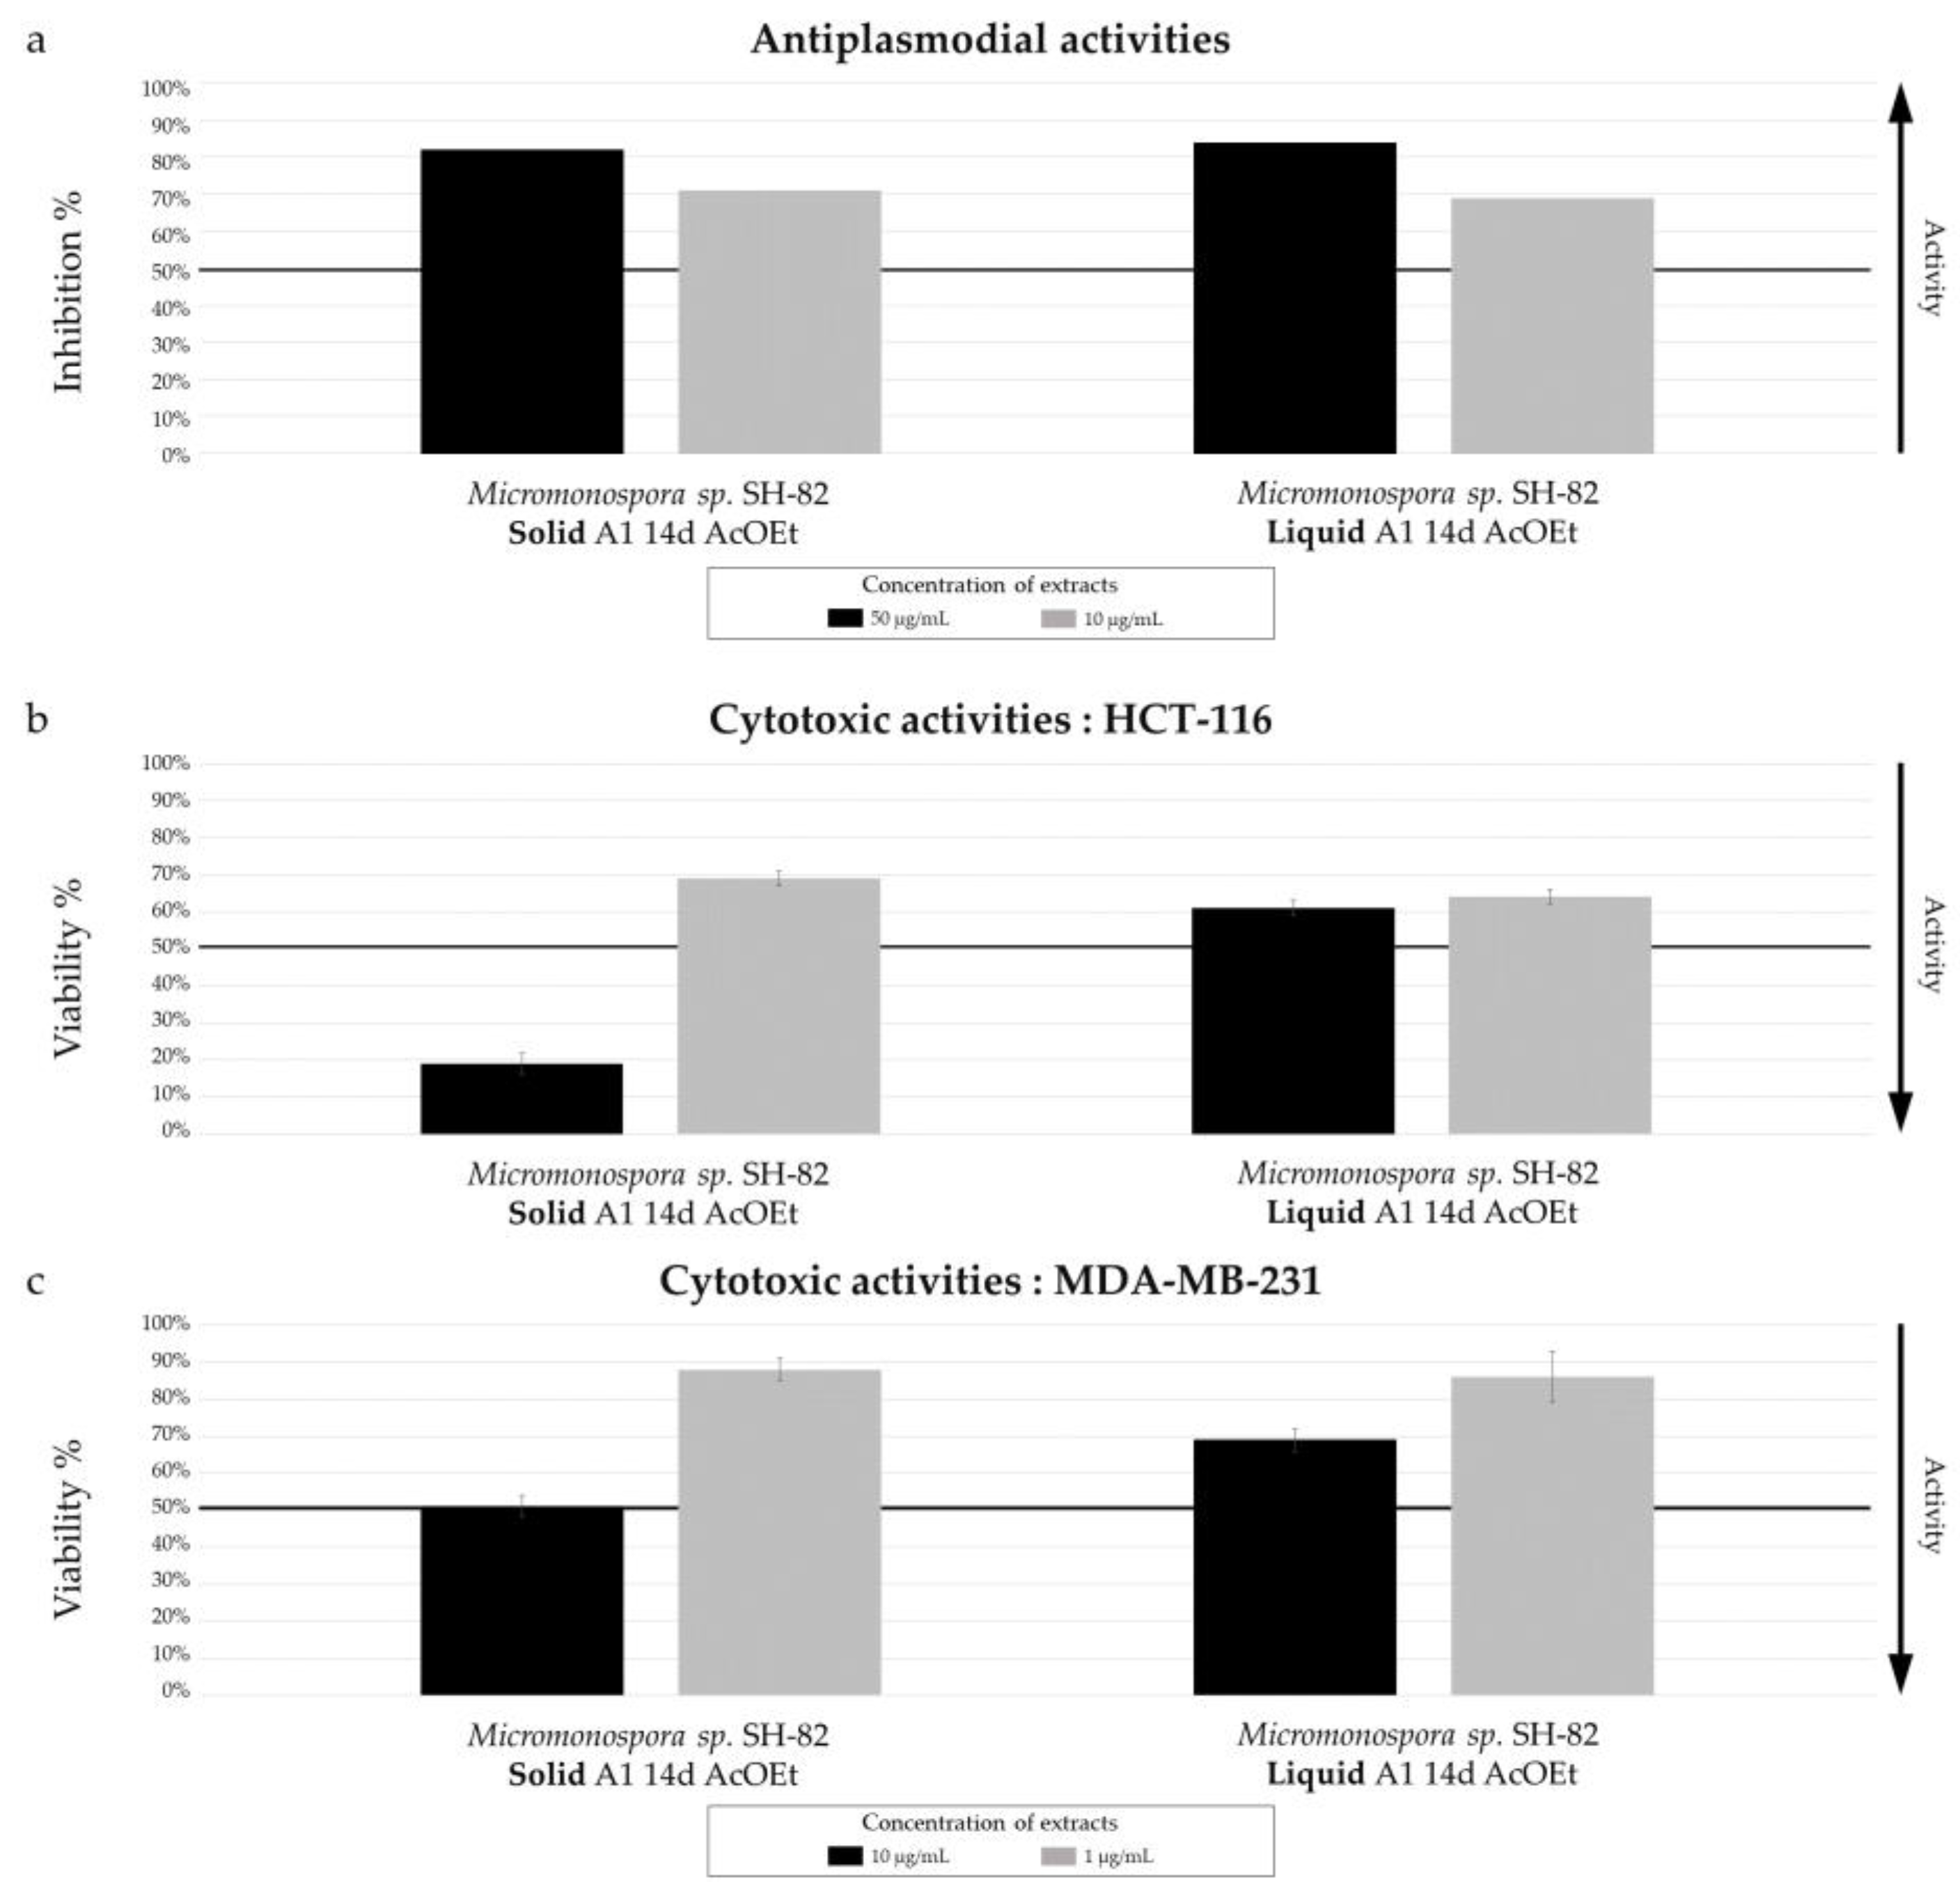
Figure 5.
(a) Ion Identity Molecular Network (IIMN) of microbial extracts from cultures of Micromonospora sp. SH-82 on A1 solid (red) and liquid (standard blue) medium and MB solid (orange) and liquid (purple) medium, at 14 days. (b) Venn diagrams showing the percentage of nodes as a function of culture parameters, depending on the culture medium composition at the top and support culture details at the bottom. (c) Zoom on clusters of interest with examples of annotations.
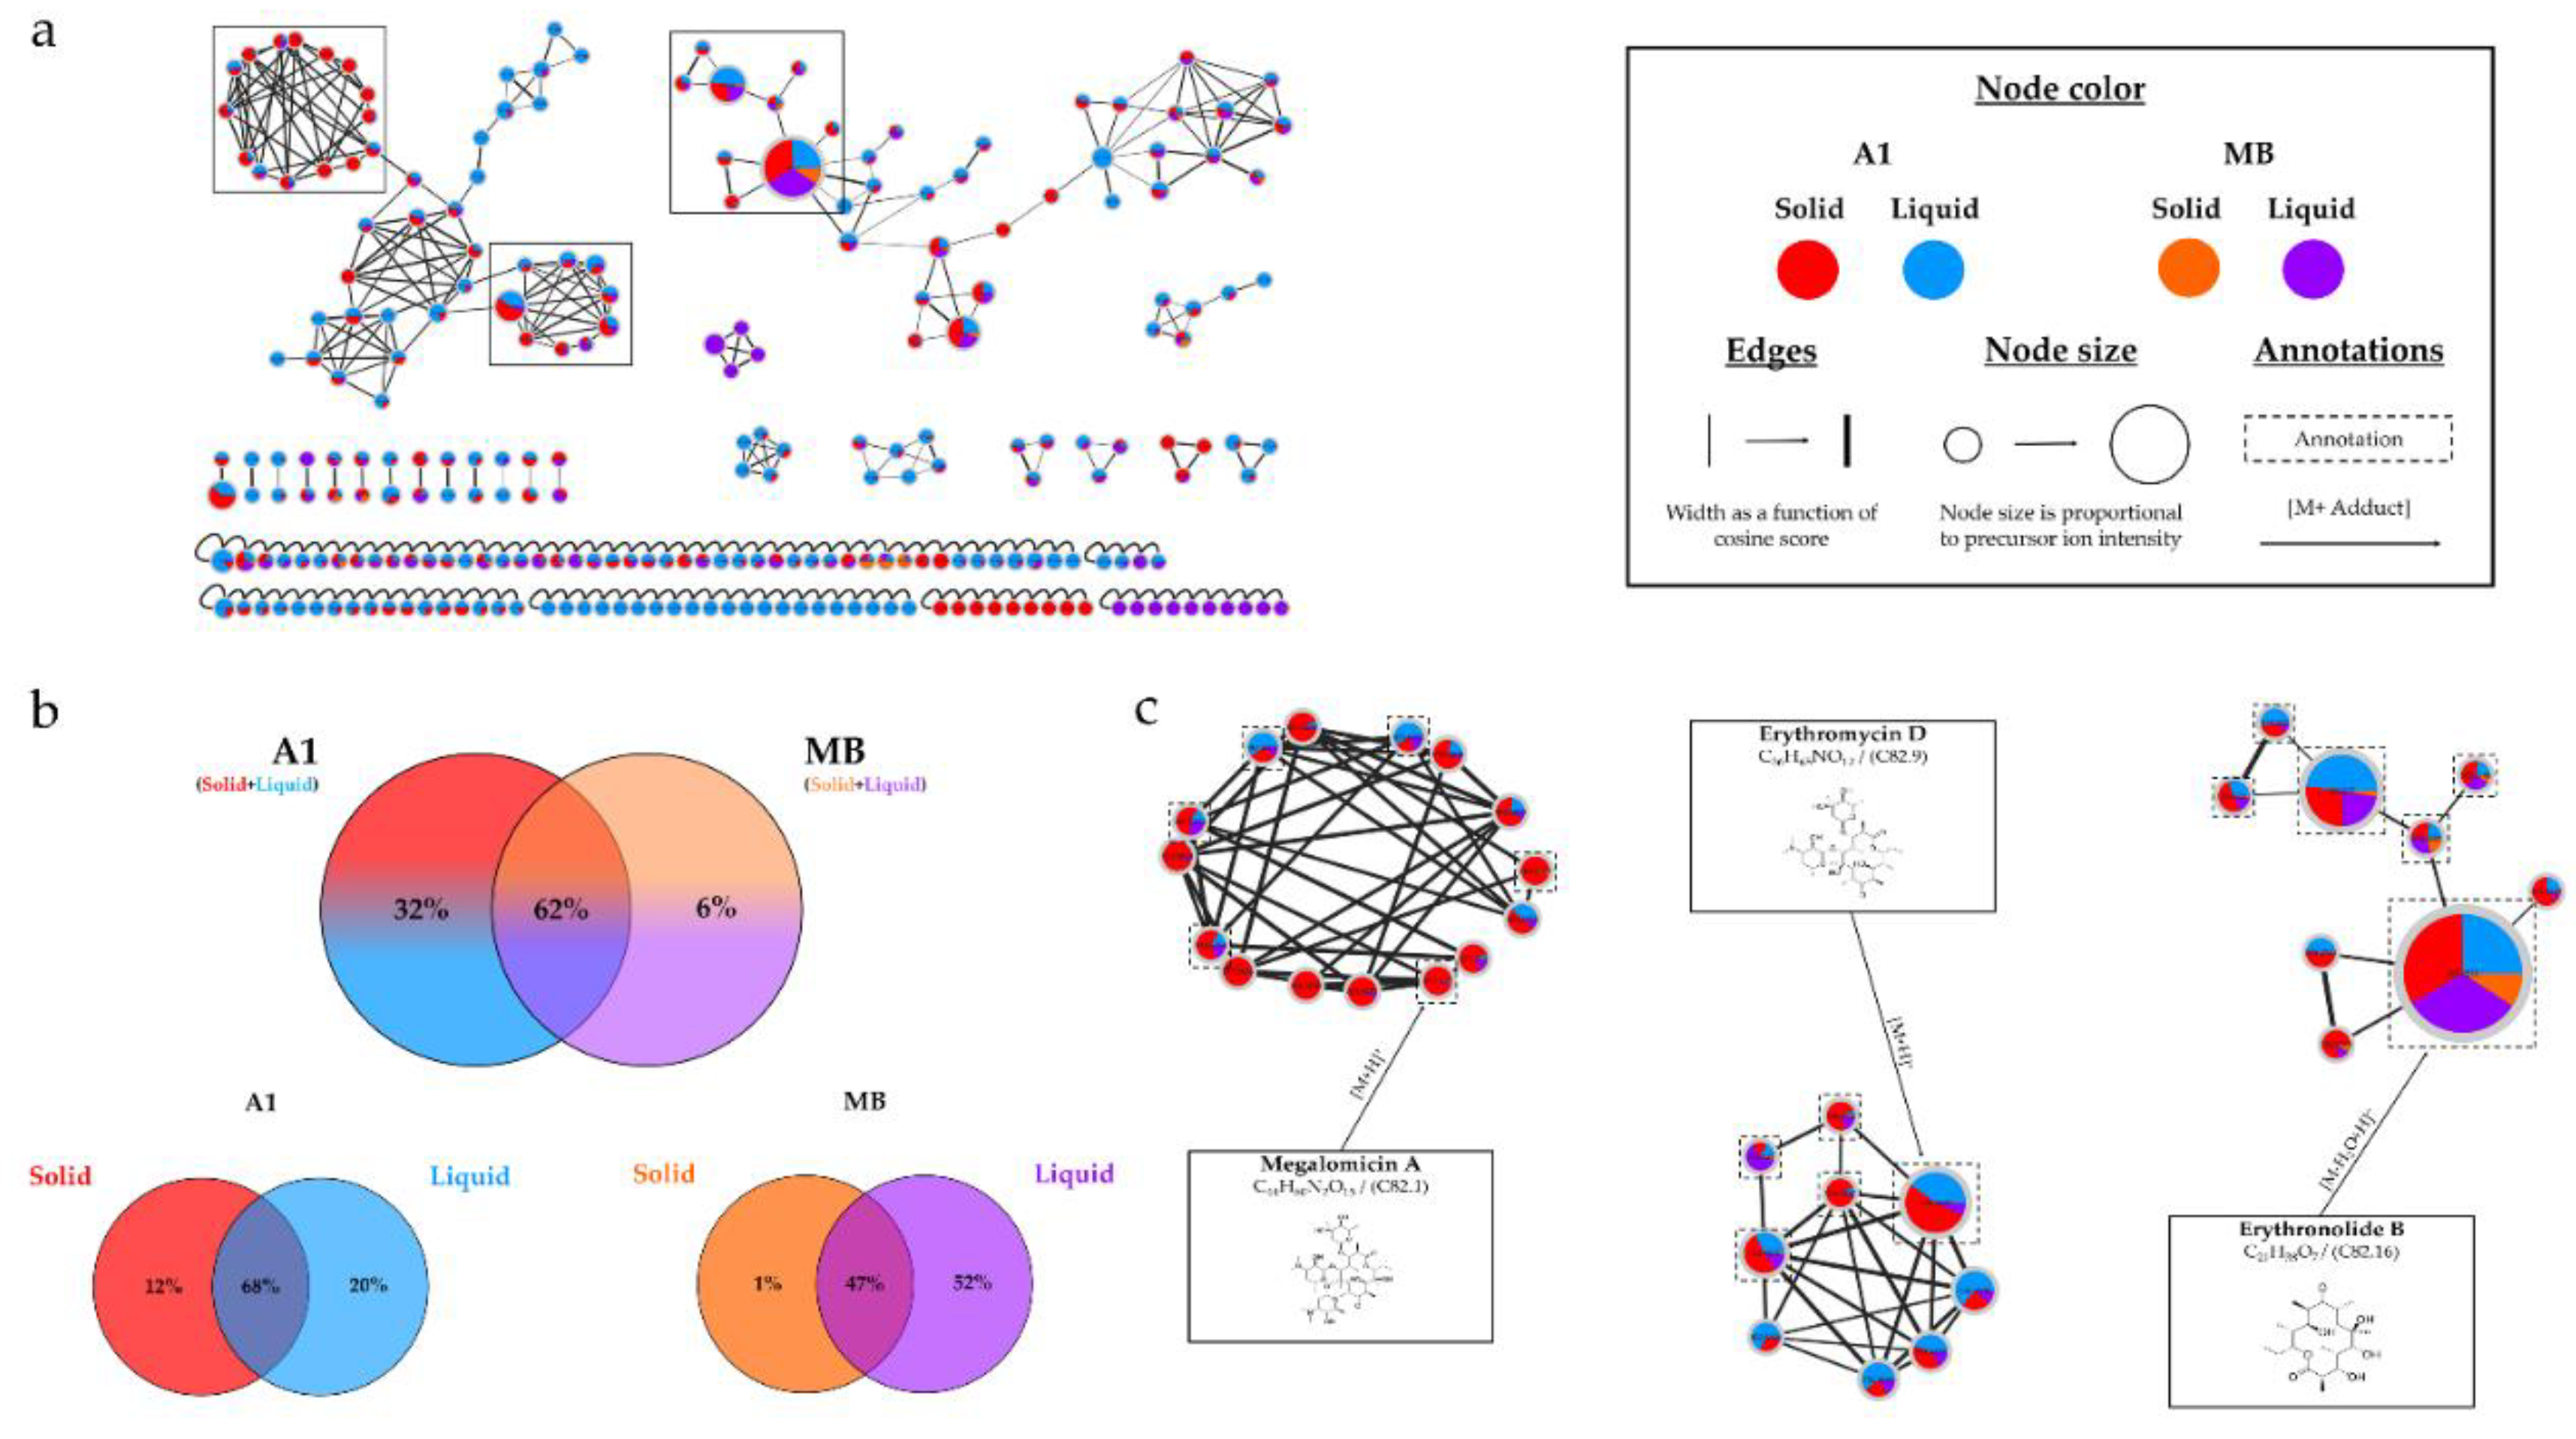
Figure 6.
Histograms representing the main annotations made in this network designed with extracts from the solid and liquid culture of Micromonospora sp. SH-82 at 14 days on A1 and MB medium. Histograms presents the proportion attributed to each culture condition relative to the precursor ion area intensities. Red: extracts from solid A1 culture; Blue: extracts from liquid A1 culture; Orange: extracts from solid MB culture; Purple: extracts from liquid A1 culture.
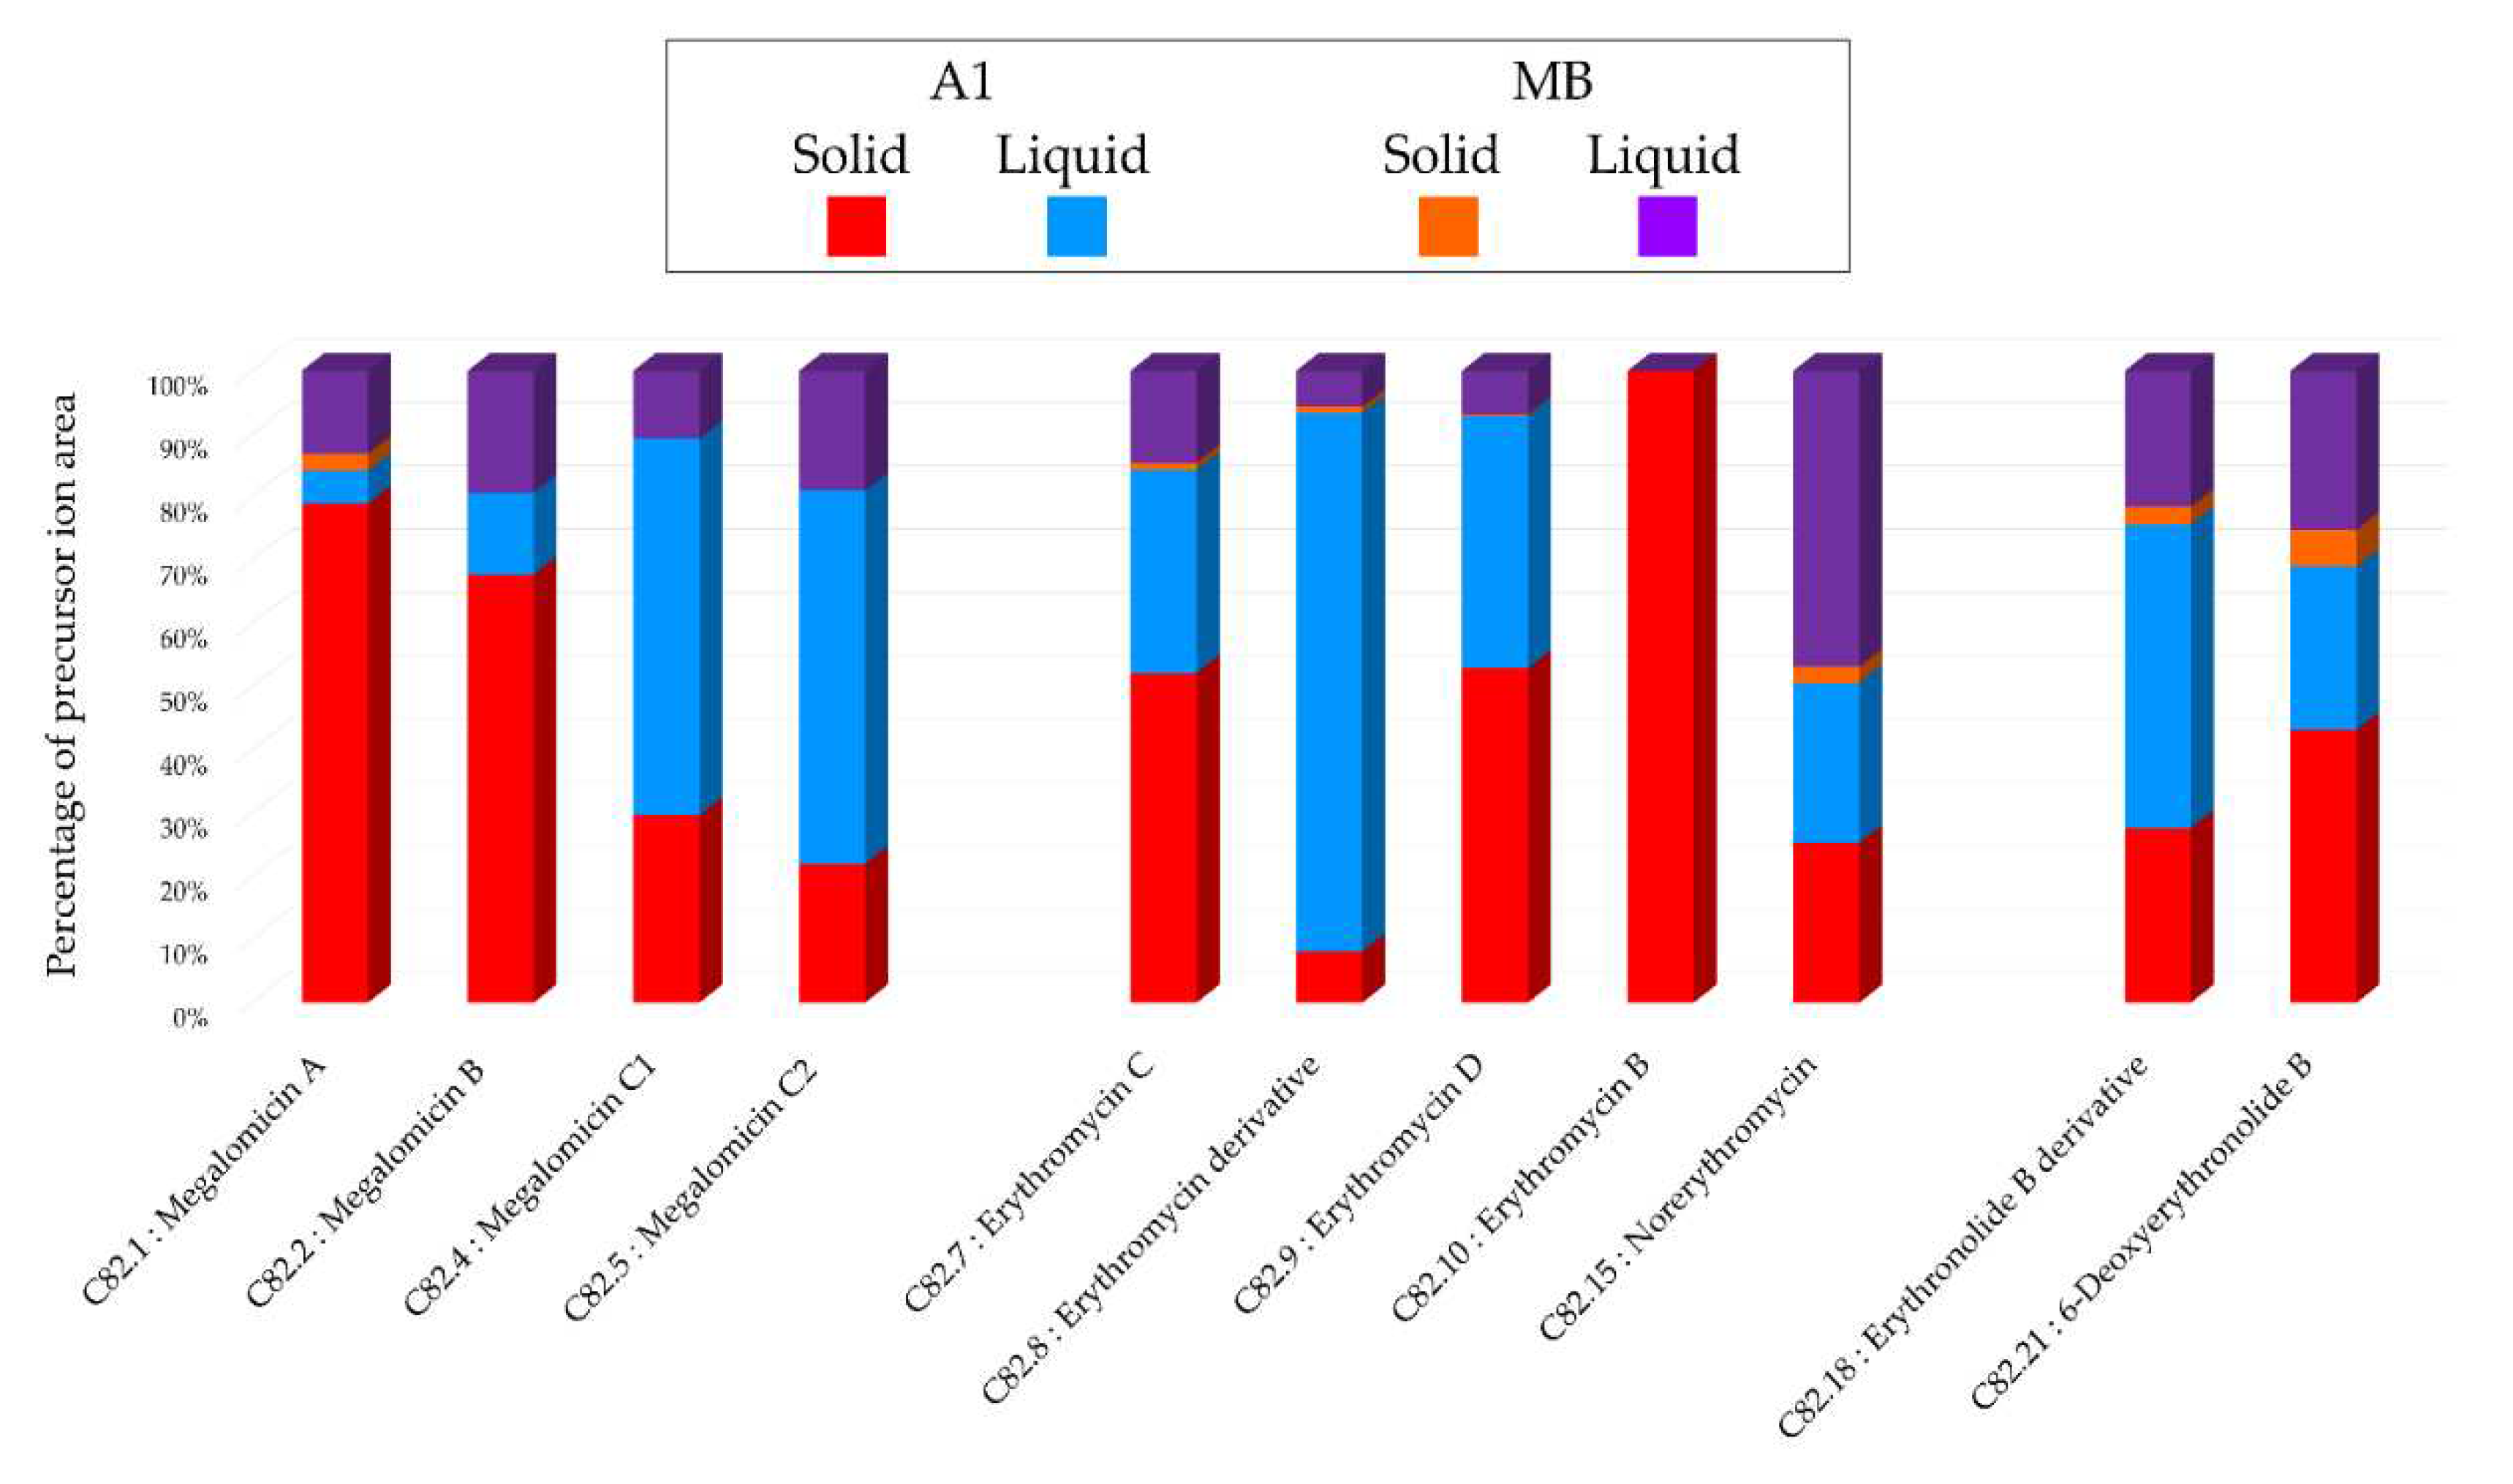
Figure 7.
Biological activity of Micromonospora sp. SH-82 extracts from culture on A1 and MB solid medium for 14 days. (a) Antiplasmodial activities against P. falciparum strain 3D7, tested at 50 µg/mL (dark color) and 10 µg/mL (grey color). Cytotoxic activities against (b) HCT-116 cell line and (c) MDA-MB-231 cell line, tested at 10 µg/mL (dark color) and 1 µg/mL(grey color). The black lines indicate the threshold for considering the extract as promising, with different criteria: > 50% inhibition for antiplasmodial activity and < 50% viability for cytotoxic activity.
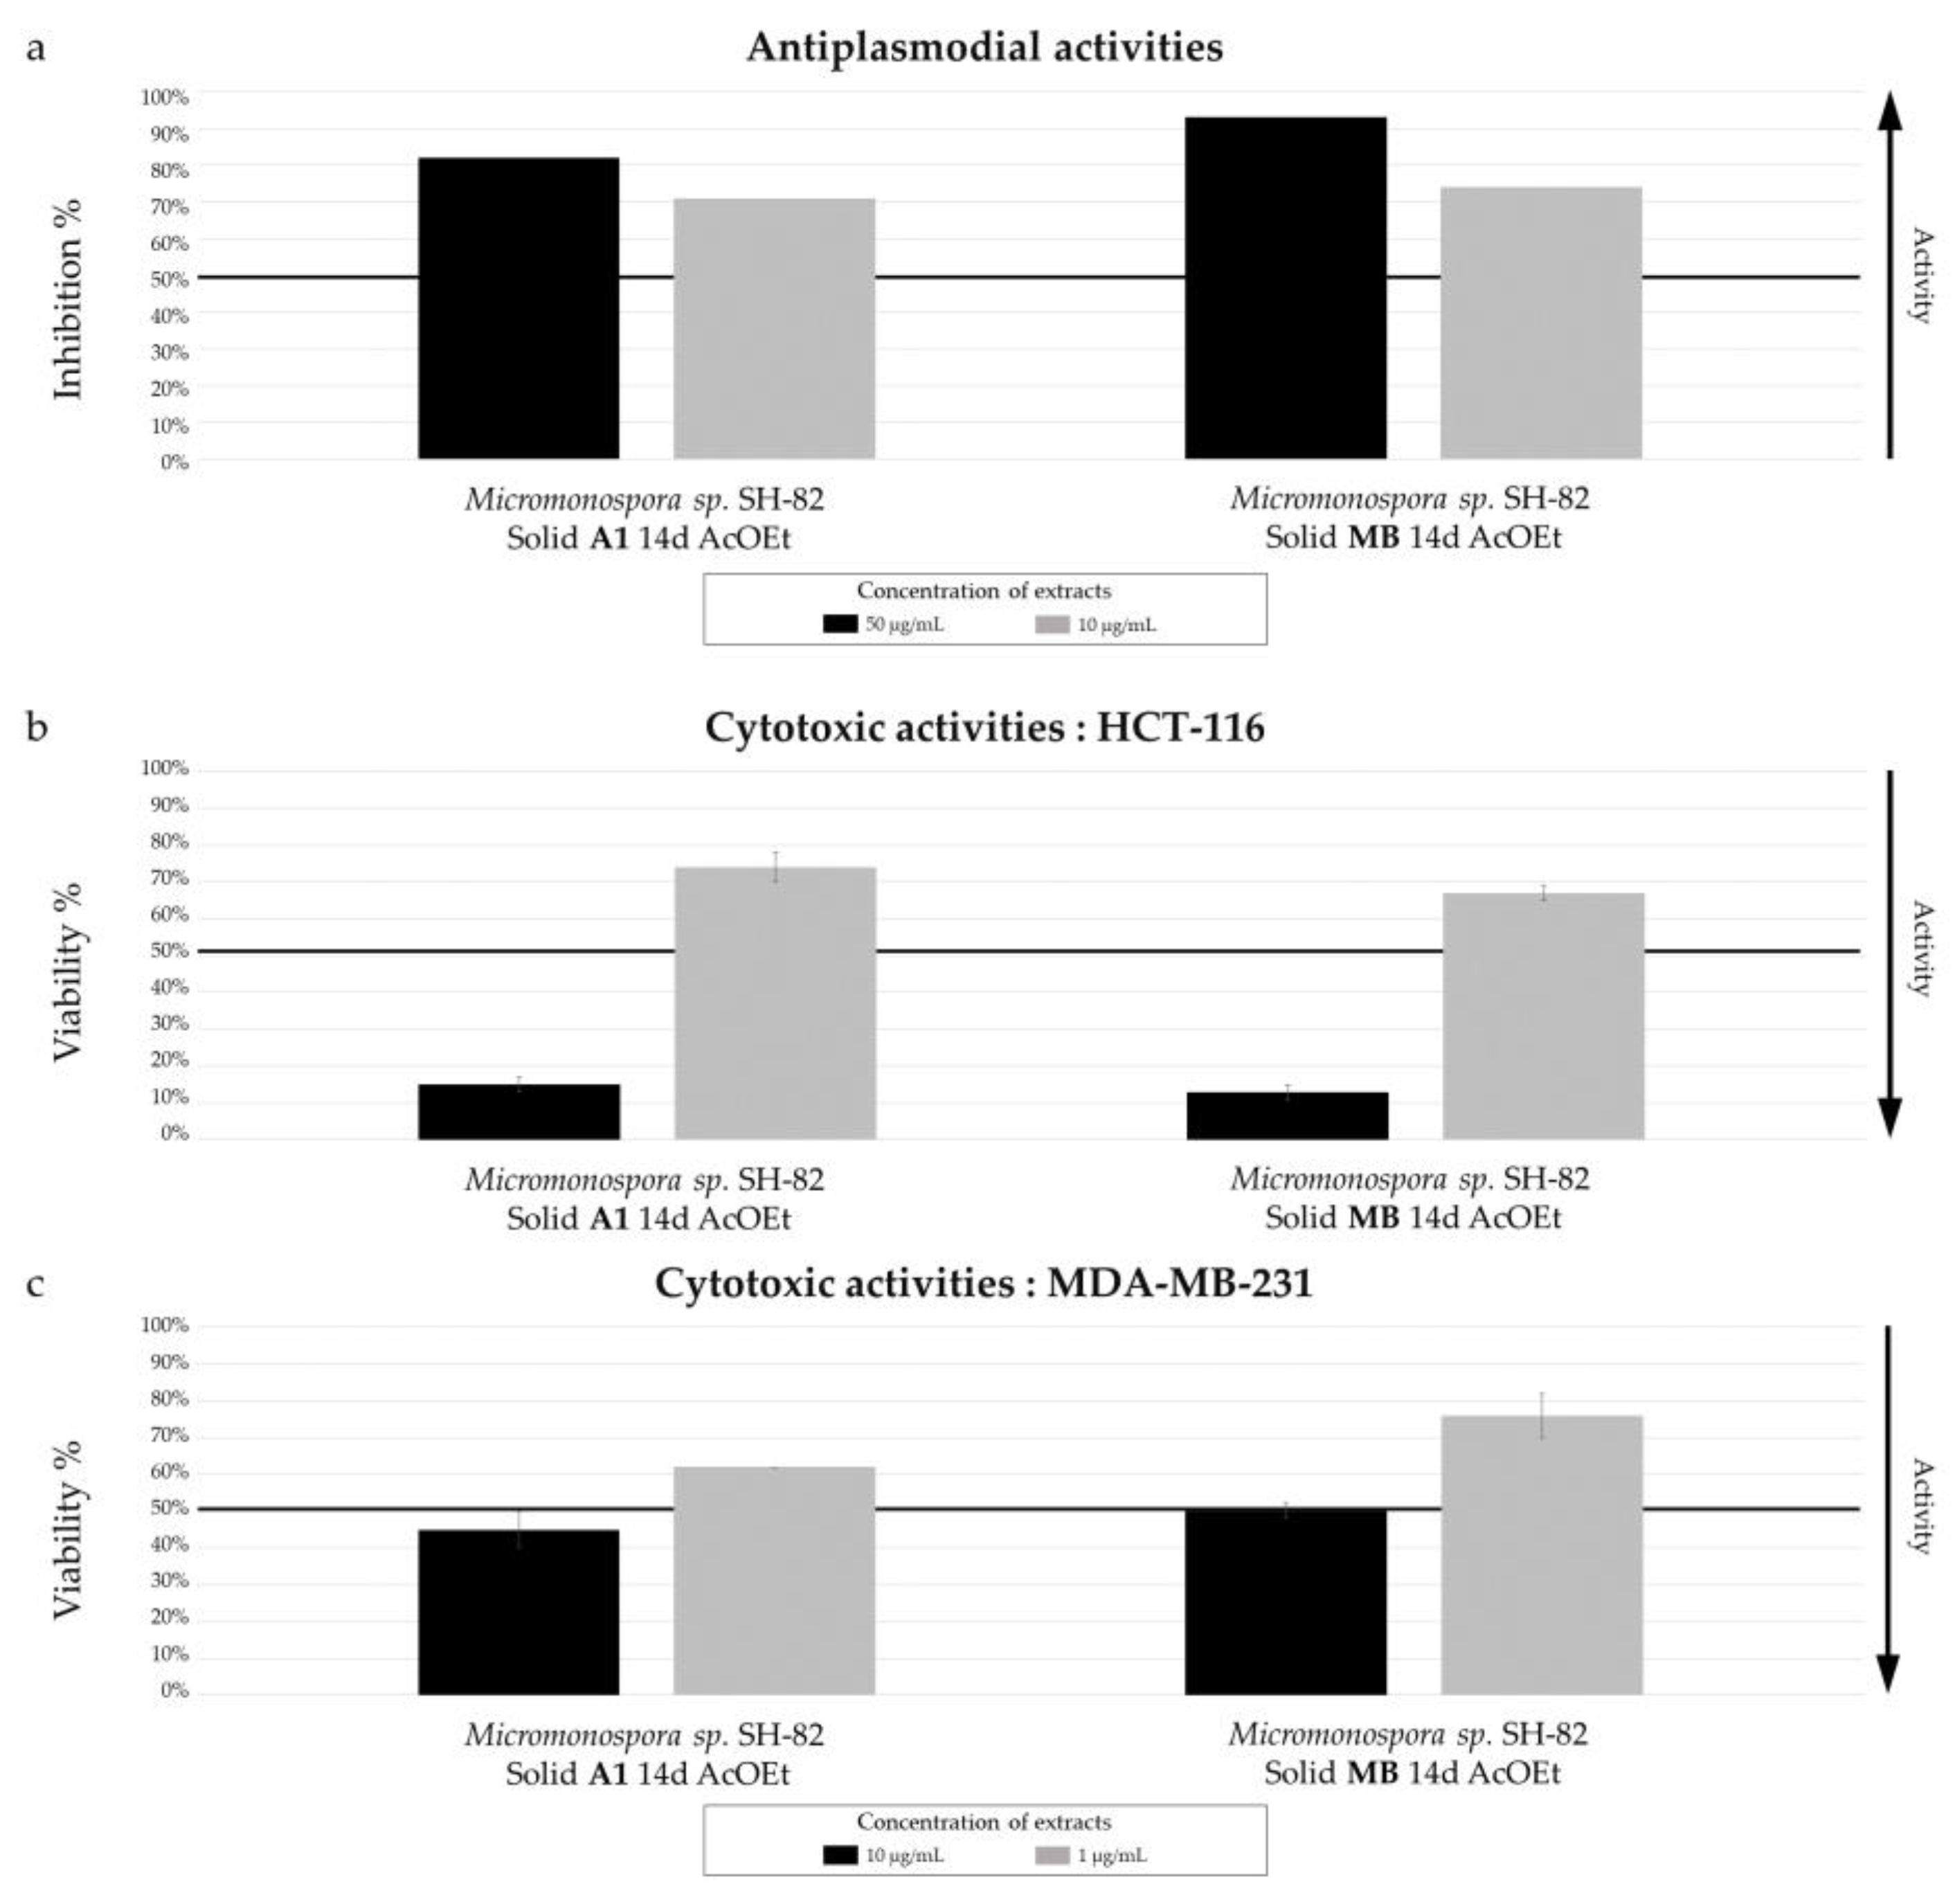
Figure 8.
(a) Ion Identity Molecular Network (IIMN) of microbial extracts from solid cultures at 7 (pink), 14 (red) and 21 days (maroon) and from liquid cultures of 7 (sky blue), 14 (standard blue) and 21 days (dark blue) of Micromonospora sp. SH-57. (b) Venn diagrams showing the percentage of nodes as a function of culture parameters, depending on the culture support at the top and time details at the bottom. (c) Zoom on clusters of interest with examples of annotations.
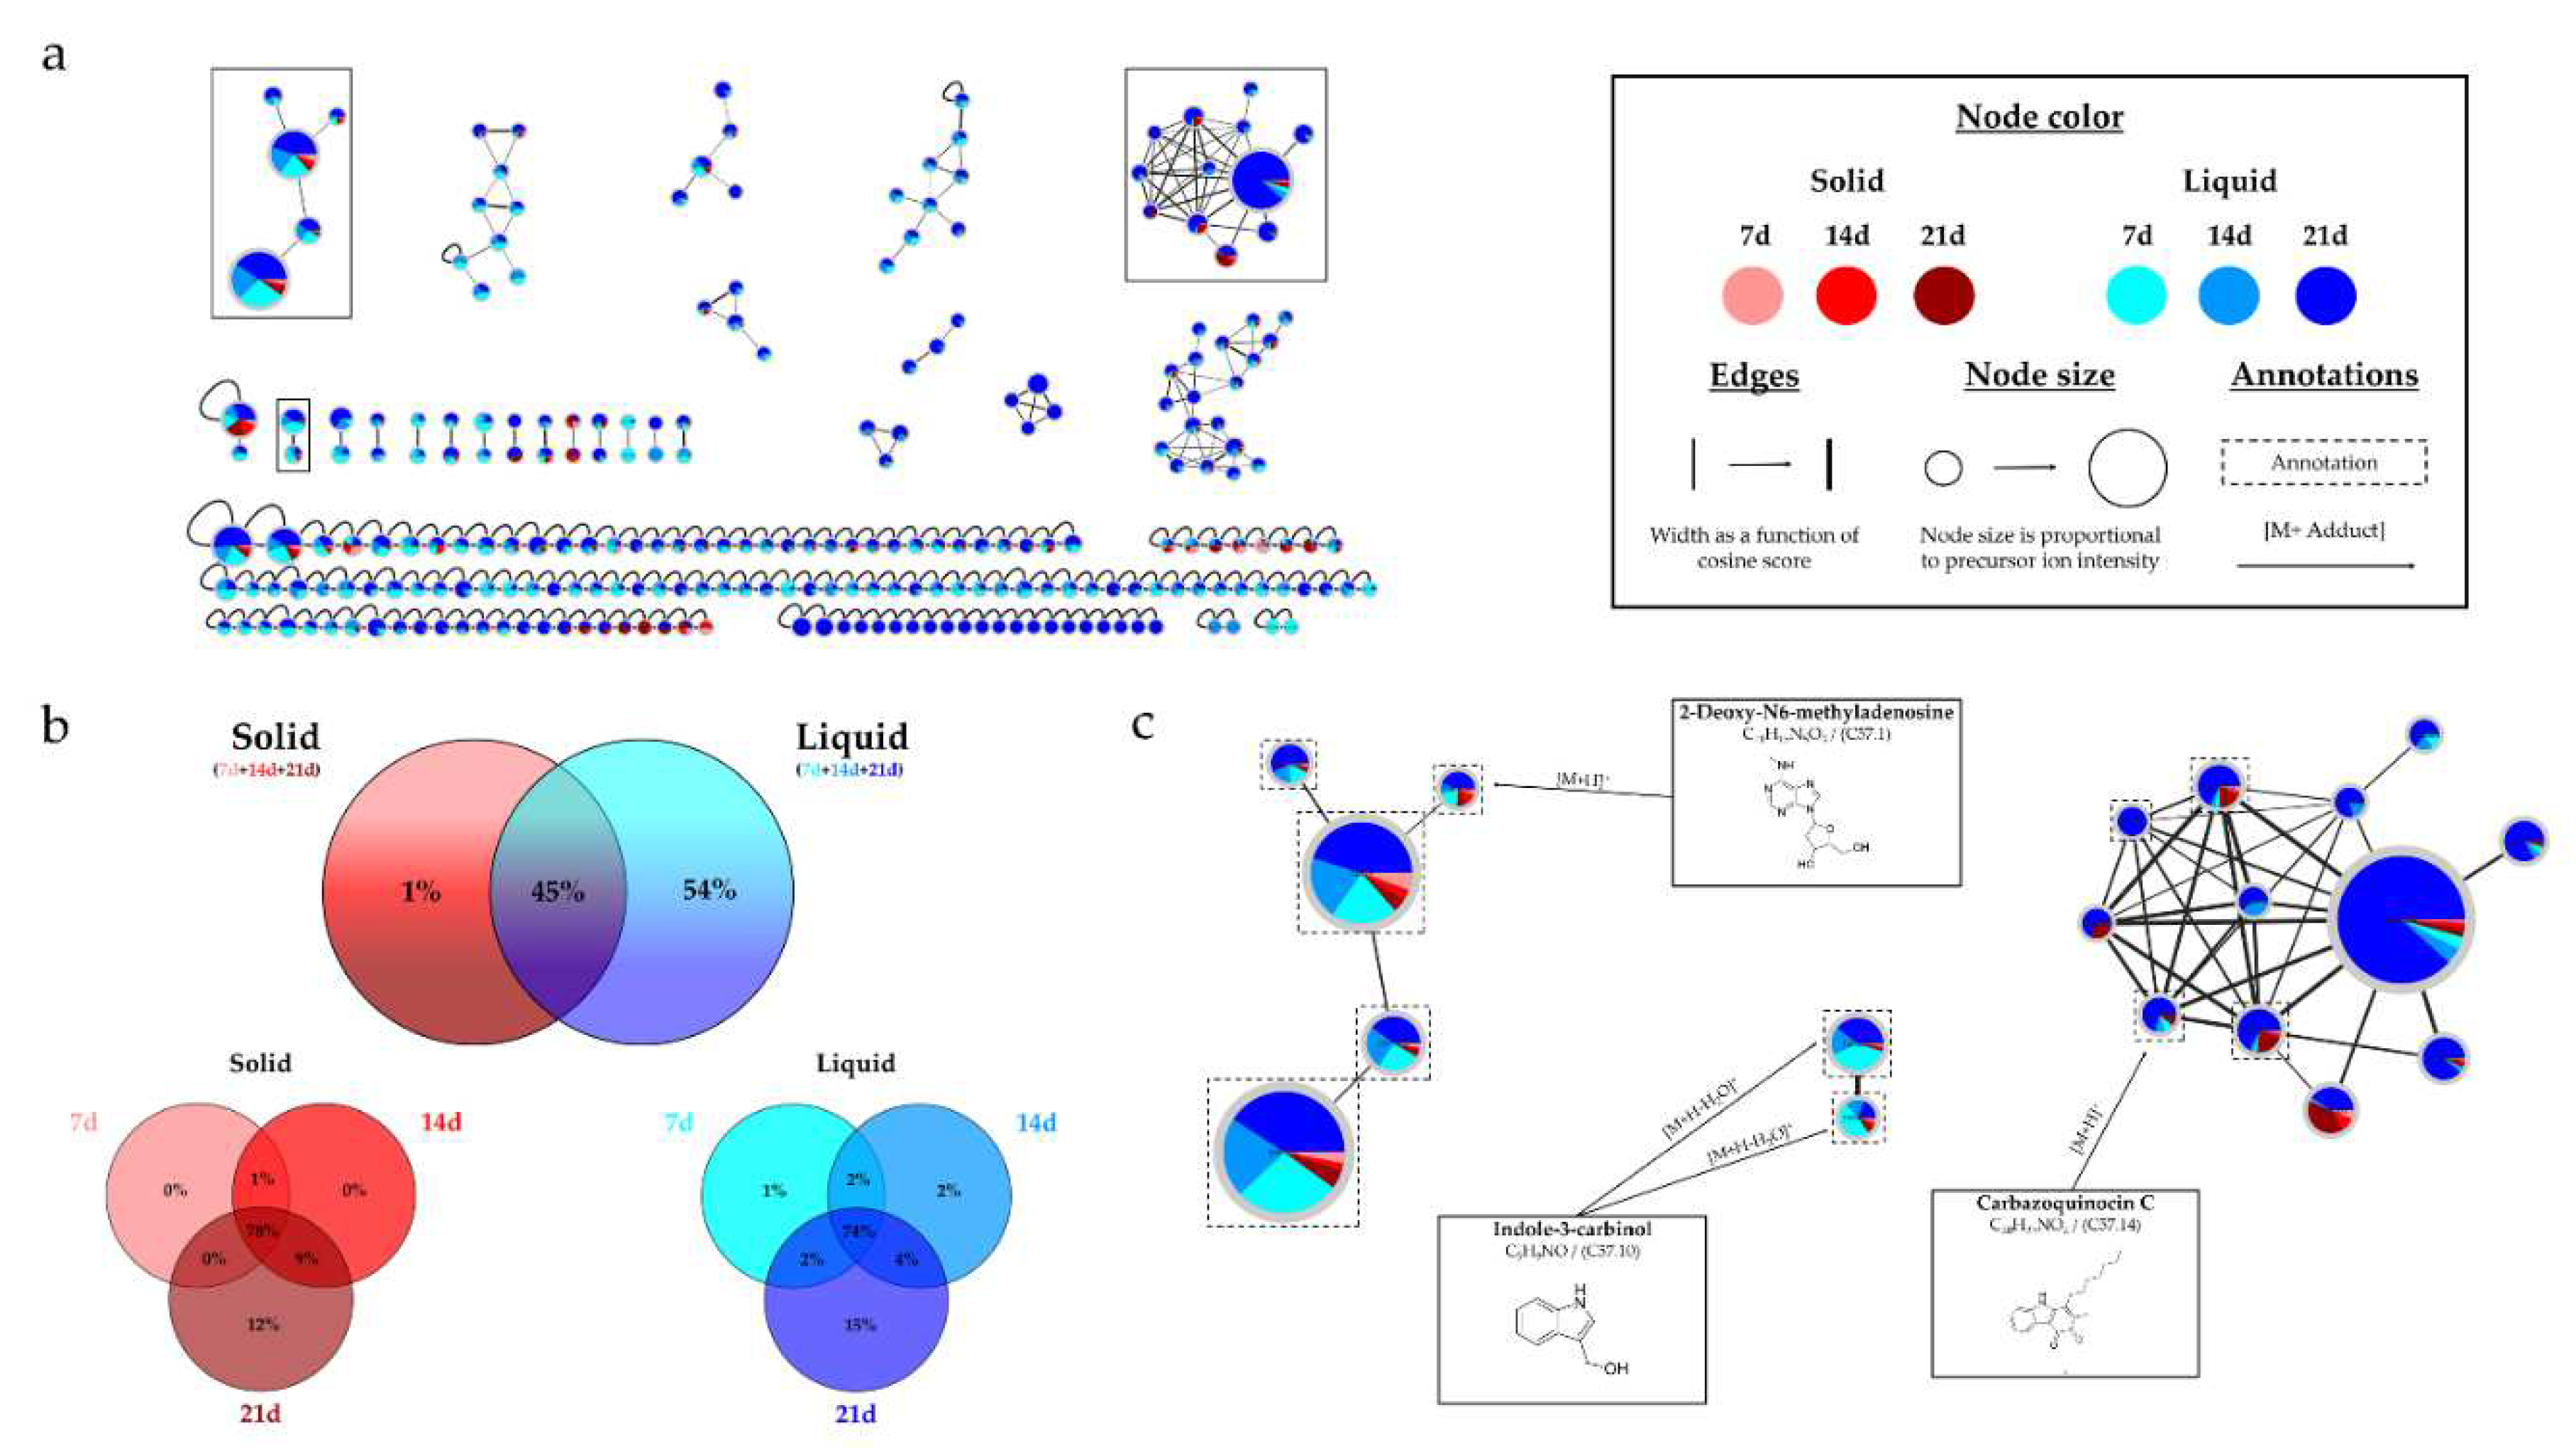
Figure 9.
Histograms representing the main annotations made in this network designed with extracts from the solid and liquid culture of Micromonospora sp. SH-57 at different times (7, 14, 21 days). Histograms presents the proportion attributed to each culture condition relative to the precursor ion area intensities. Red gradient represents extract from solid culture. Pink: 7 days; Red: 14 days; Brown: 21 days. Blue gradient represents extract from solid culture. Sky blue: 7 days; Standard blue: 14 days; Dark blue: 21 days.
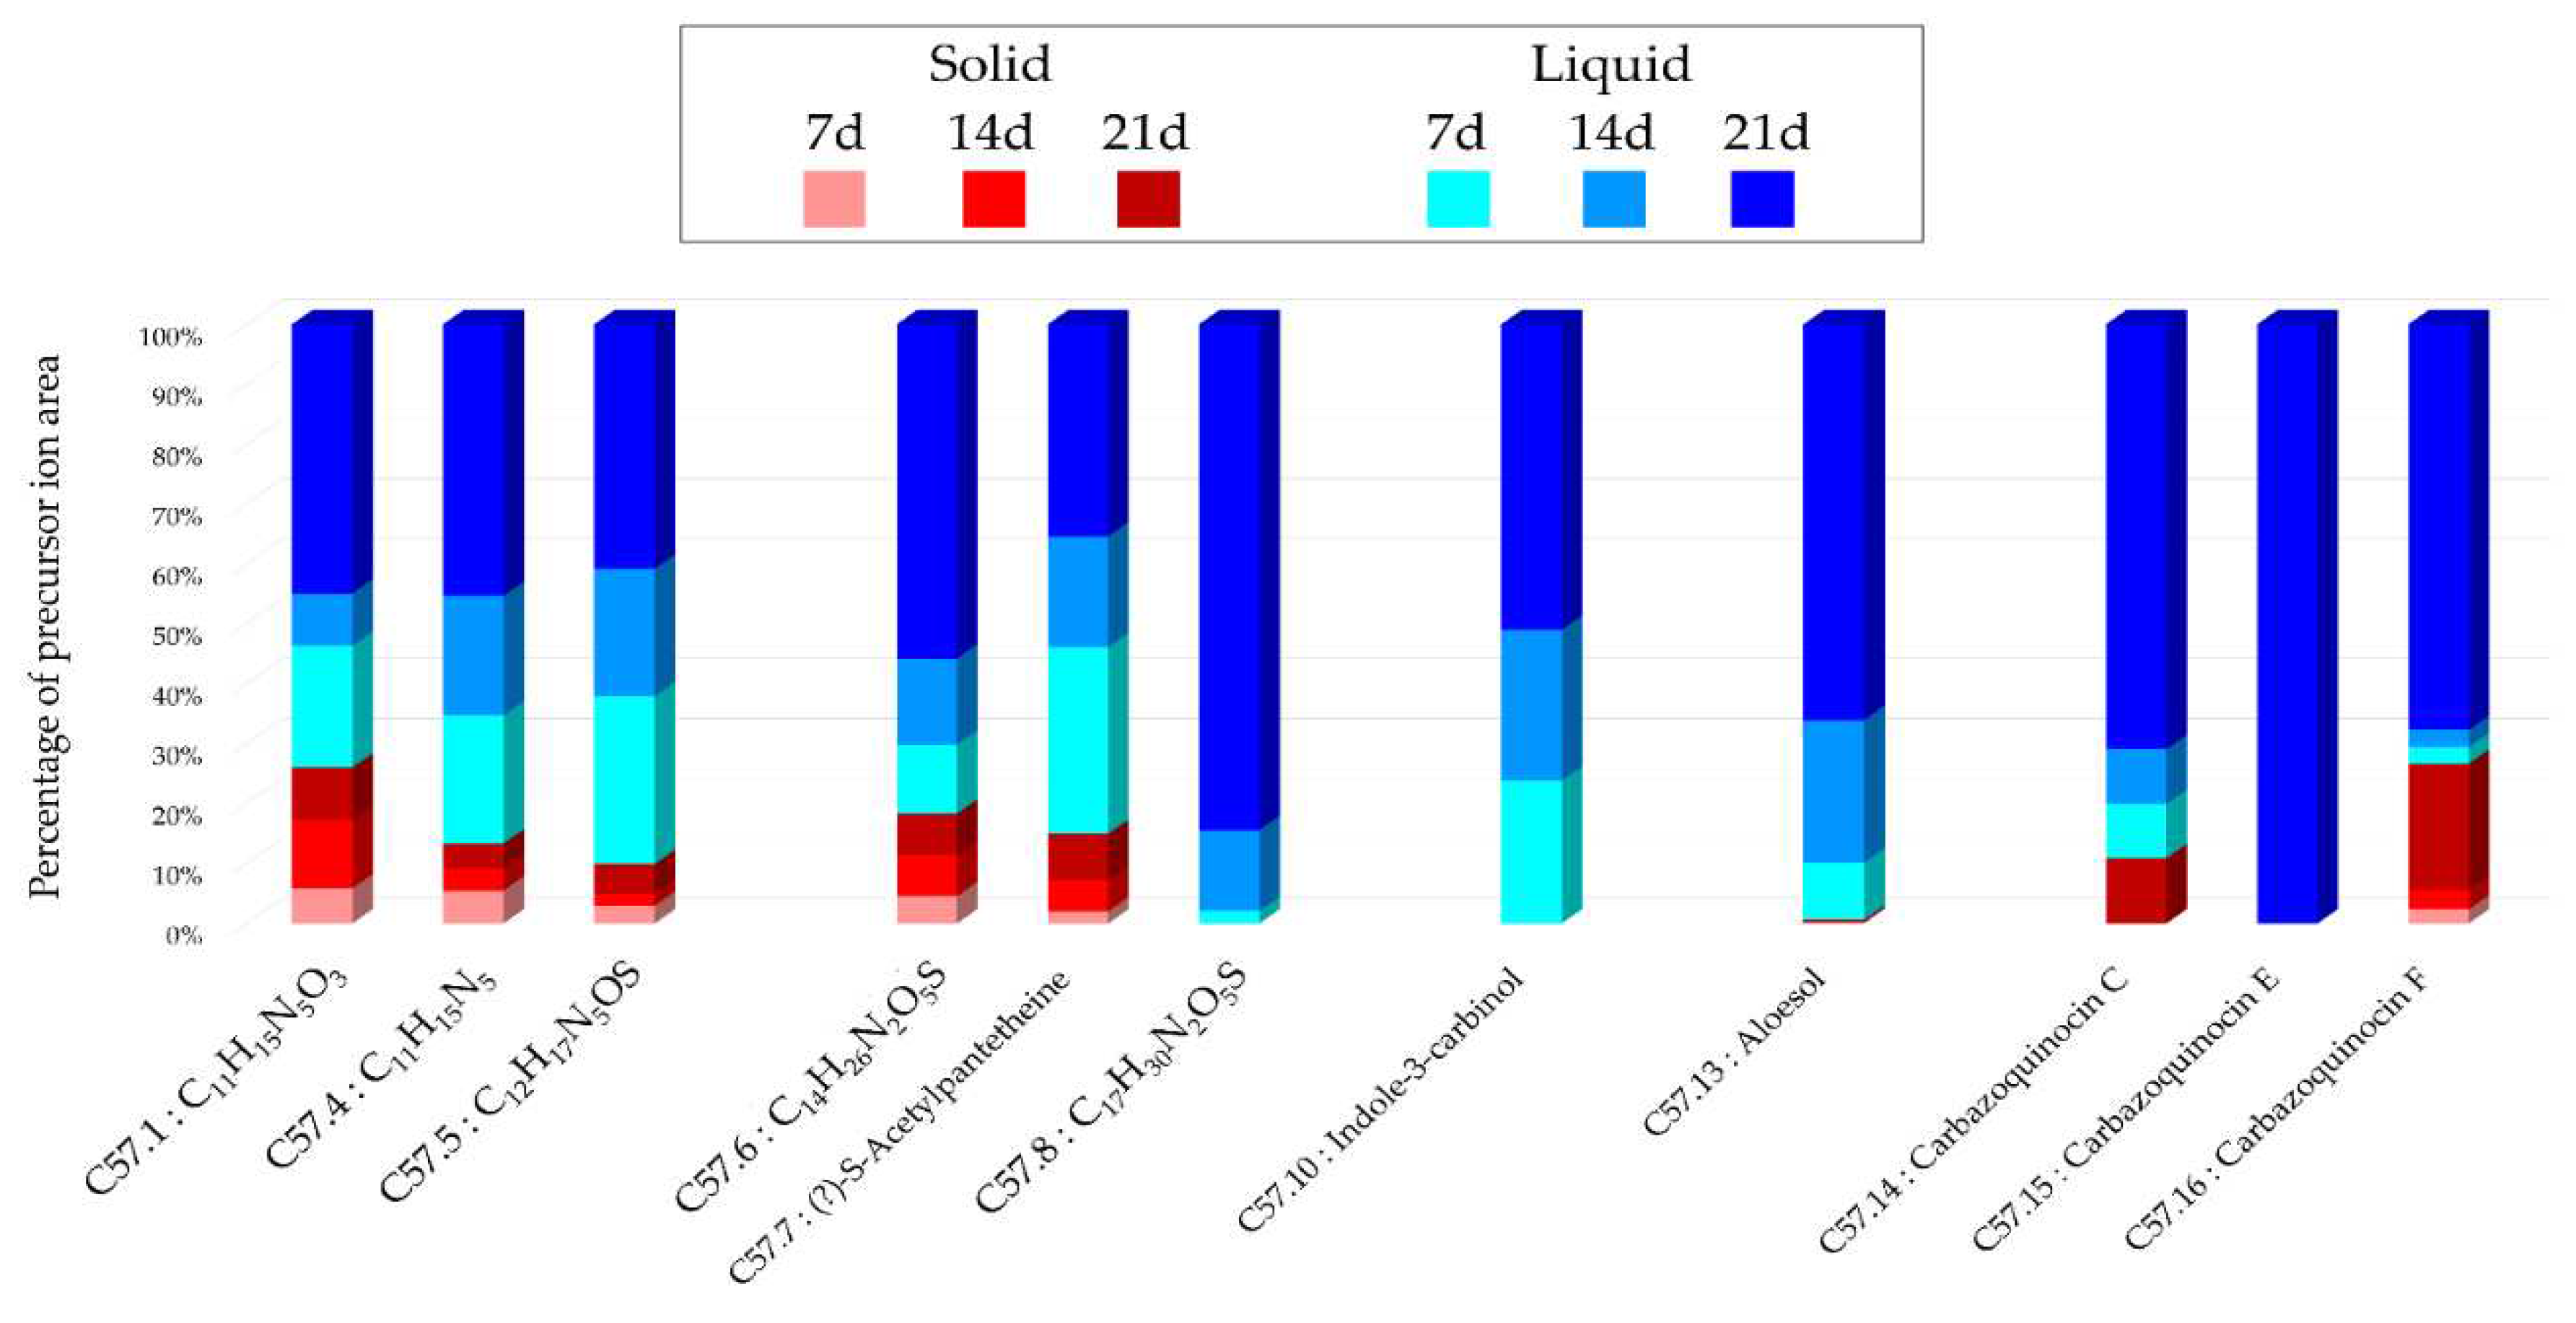
Figure 10.
Biological activity of Micromonospora sp. SH-57 extracts from culture on A1 solid and liquid medium for 14 days. (a) Antiplasmodial activities against P. falciparum strain 3D7, tested at 50 µg/mL (dark color) and 10 µg/mL (grey color). Cytotoxic activities against (b) HCT-116 cell line and (c) MDA-MB-231 cell line, tested at 10 µg/mL (dark color) and 1 µg/mL (grey color). The black lines indicate the threshold for considering the extract as promising, with different criteria: > 50% inhibition for antiplasmodial activity and < 50% viability for cytotoxic activity.
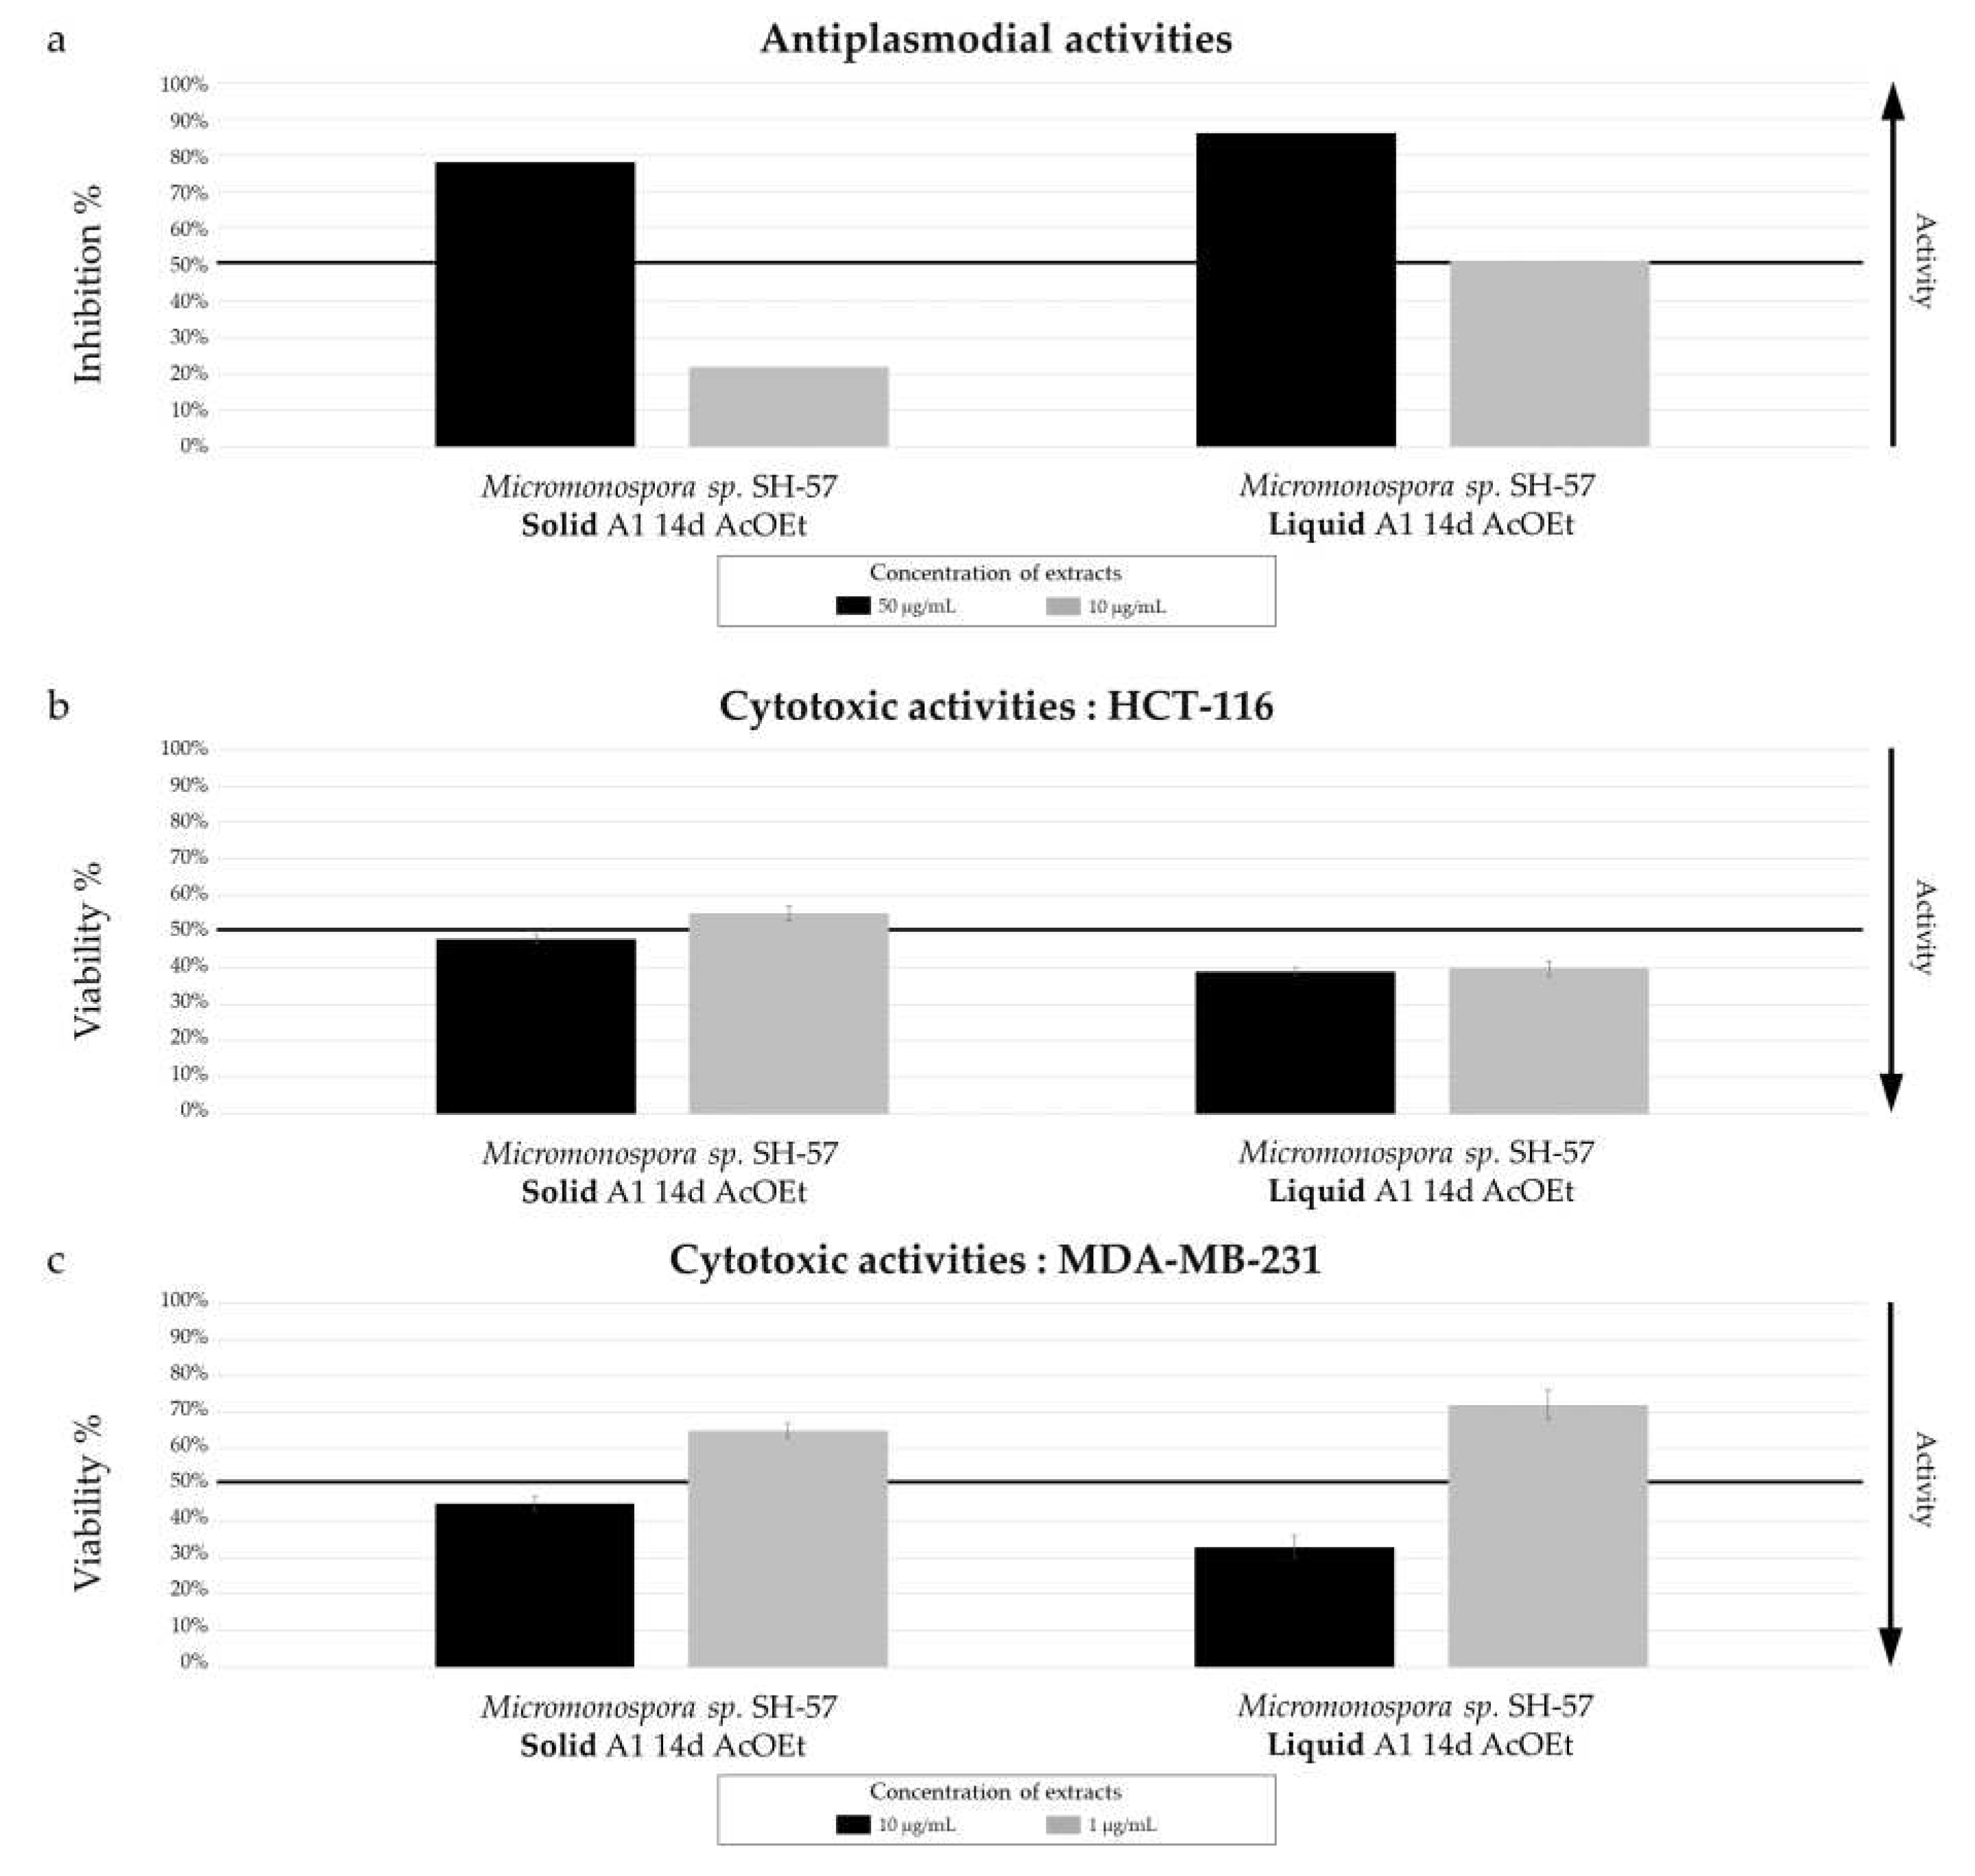
Figure 11.
(a) Ion Identity Molecular Network (IIMN) of microbial extracts from cultures of Micromonospora sp. SH-57 on A1 solid (red) and liquid (standard blue) medium and MB solid (orange) and liquid (purple) medium, at 14 days. (b) Venn diagrams showing the percentage of nodes as a function of culture parameters, depending on the culture medium composition at the top and support culture details at the bottom. (c) Zoom on clusters of interest with examples of annotations.
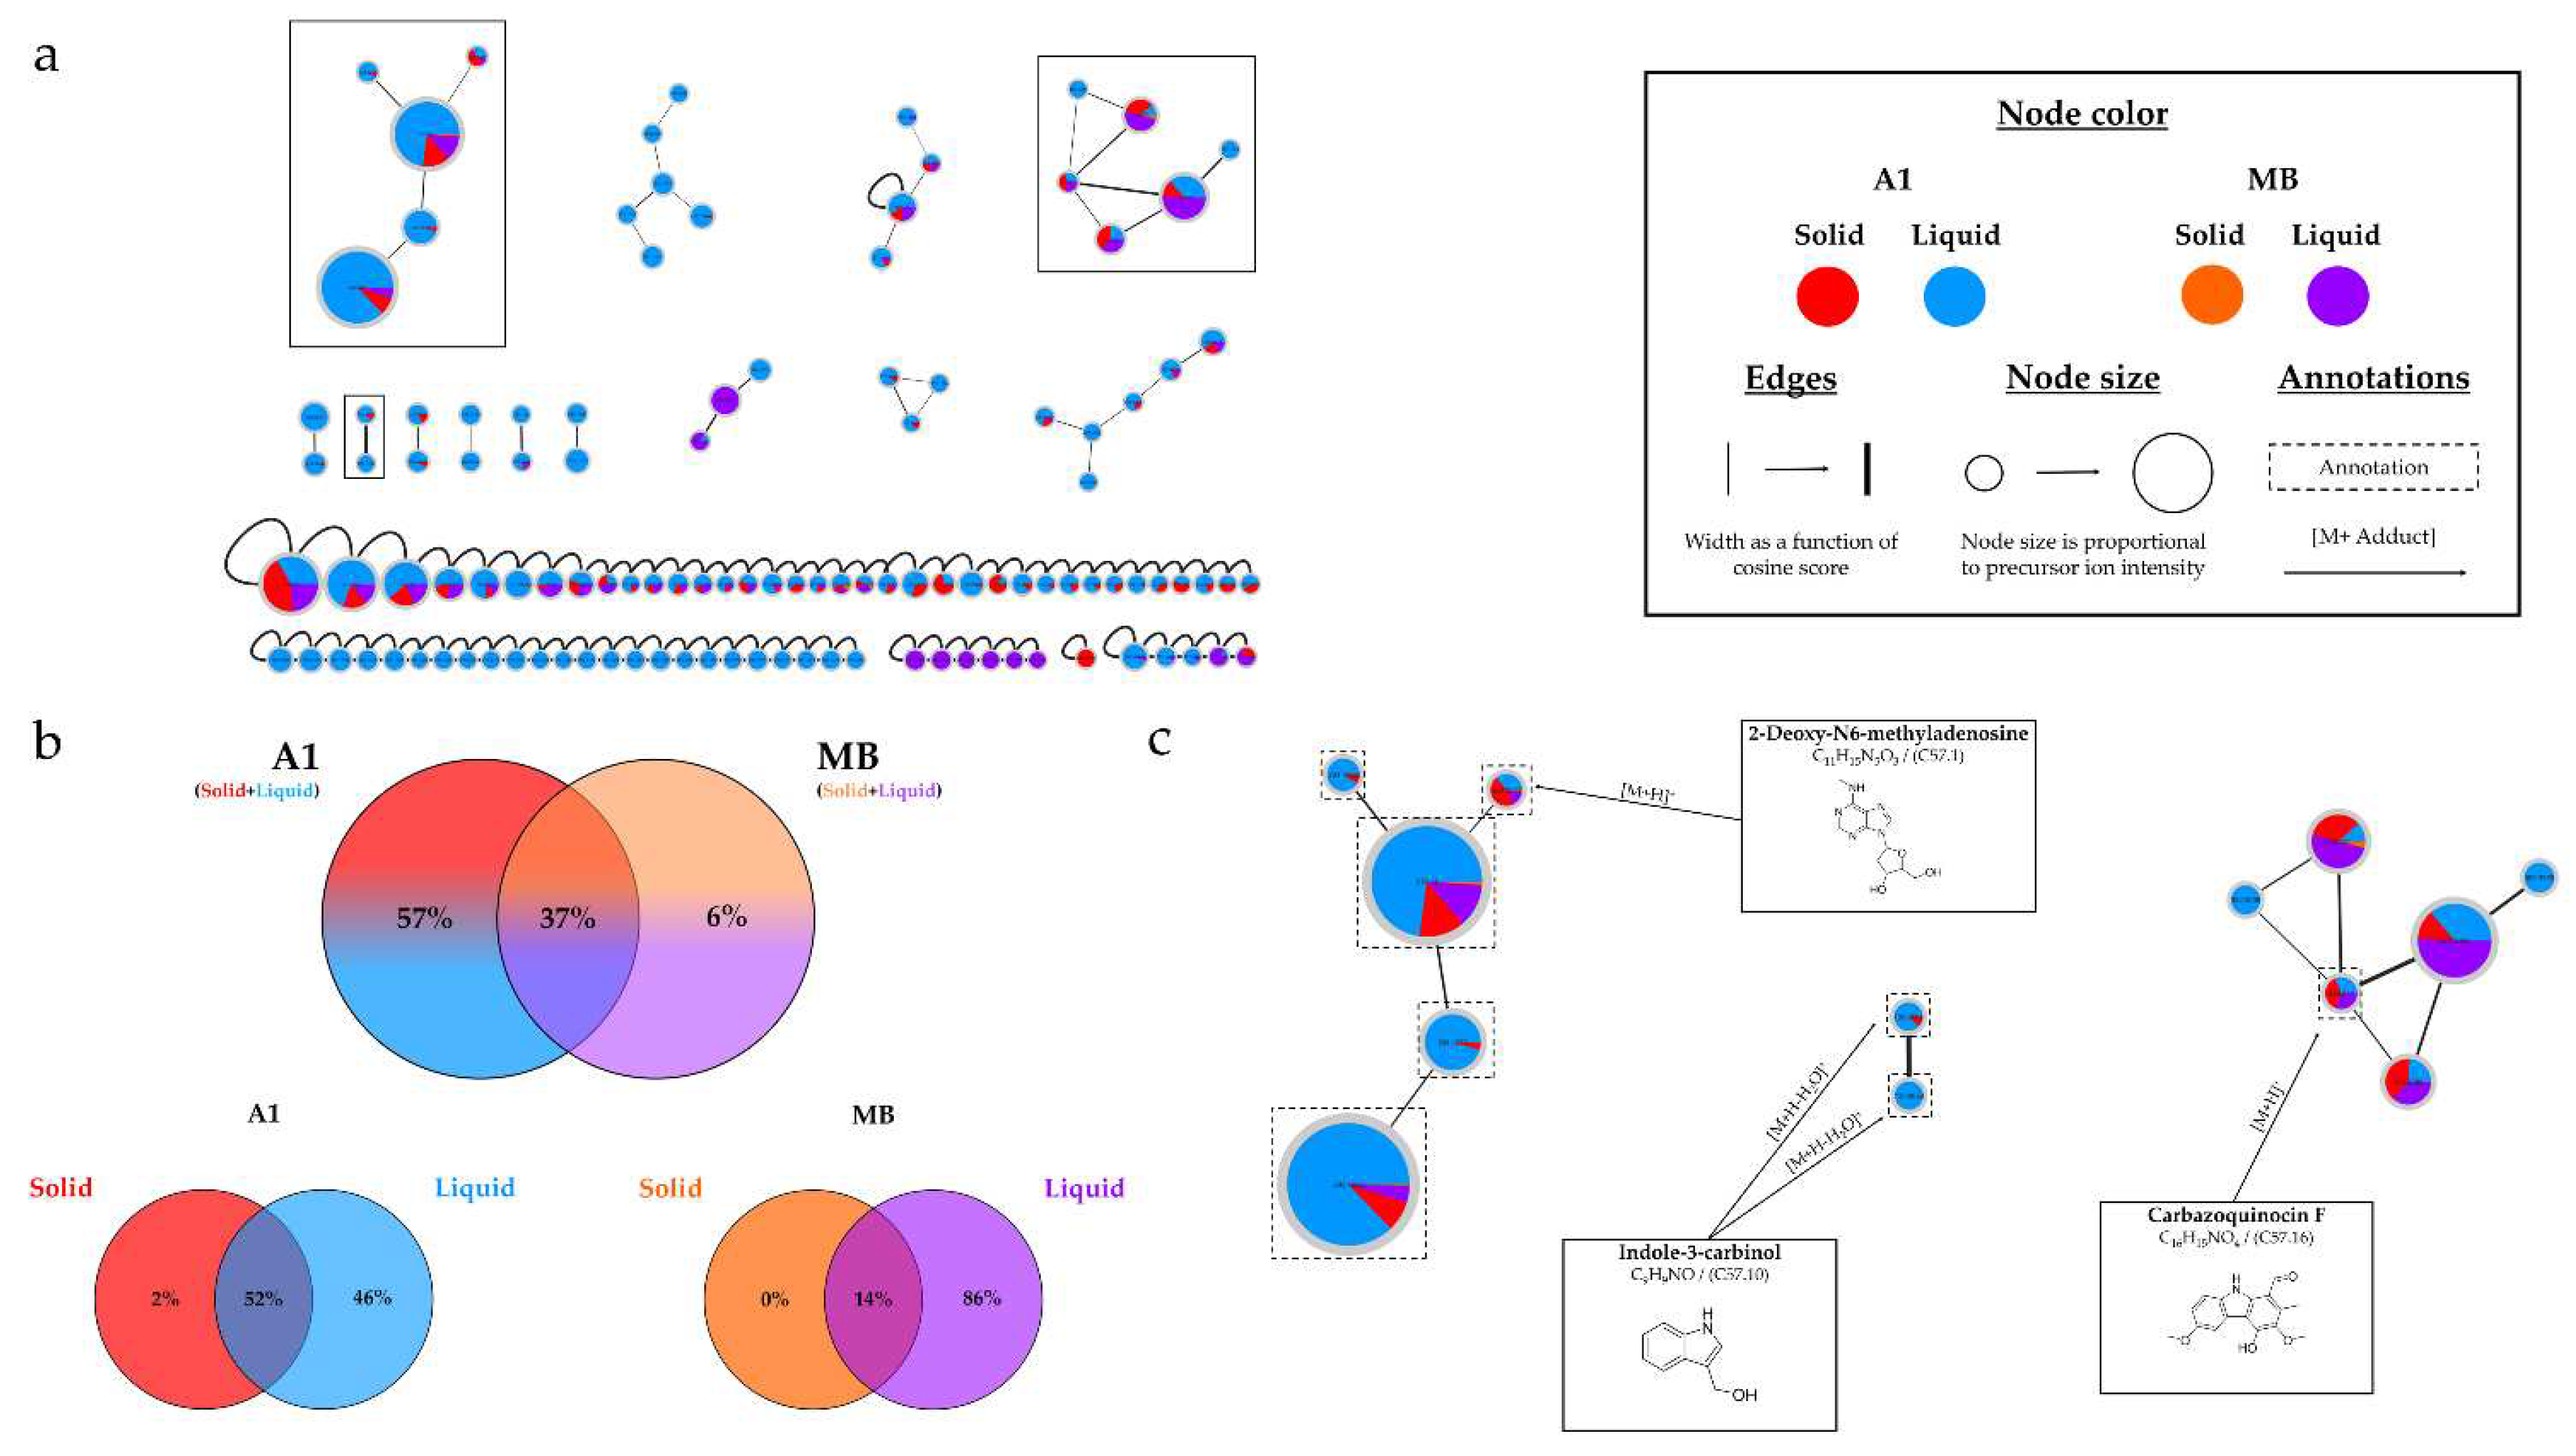
Figure 12.
Histograms representing the main annotations made in this network designed with extracts from the solid and liquid culture of Micromonospora sp. SH-57 at 14 days on A1 and MB medium. Histograms presents the proportion attributed to each culture condition relative to the precursor ion area intensities. Red: extracts from solid A1 culture; Blue: extracts from liquid A1 culture; Orange: extracts from solid MB culture; Purple: extracts from liquid A1 culture.
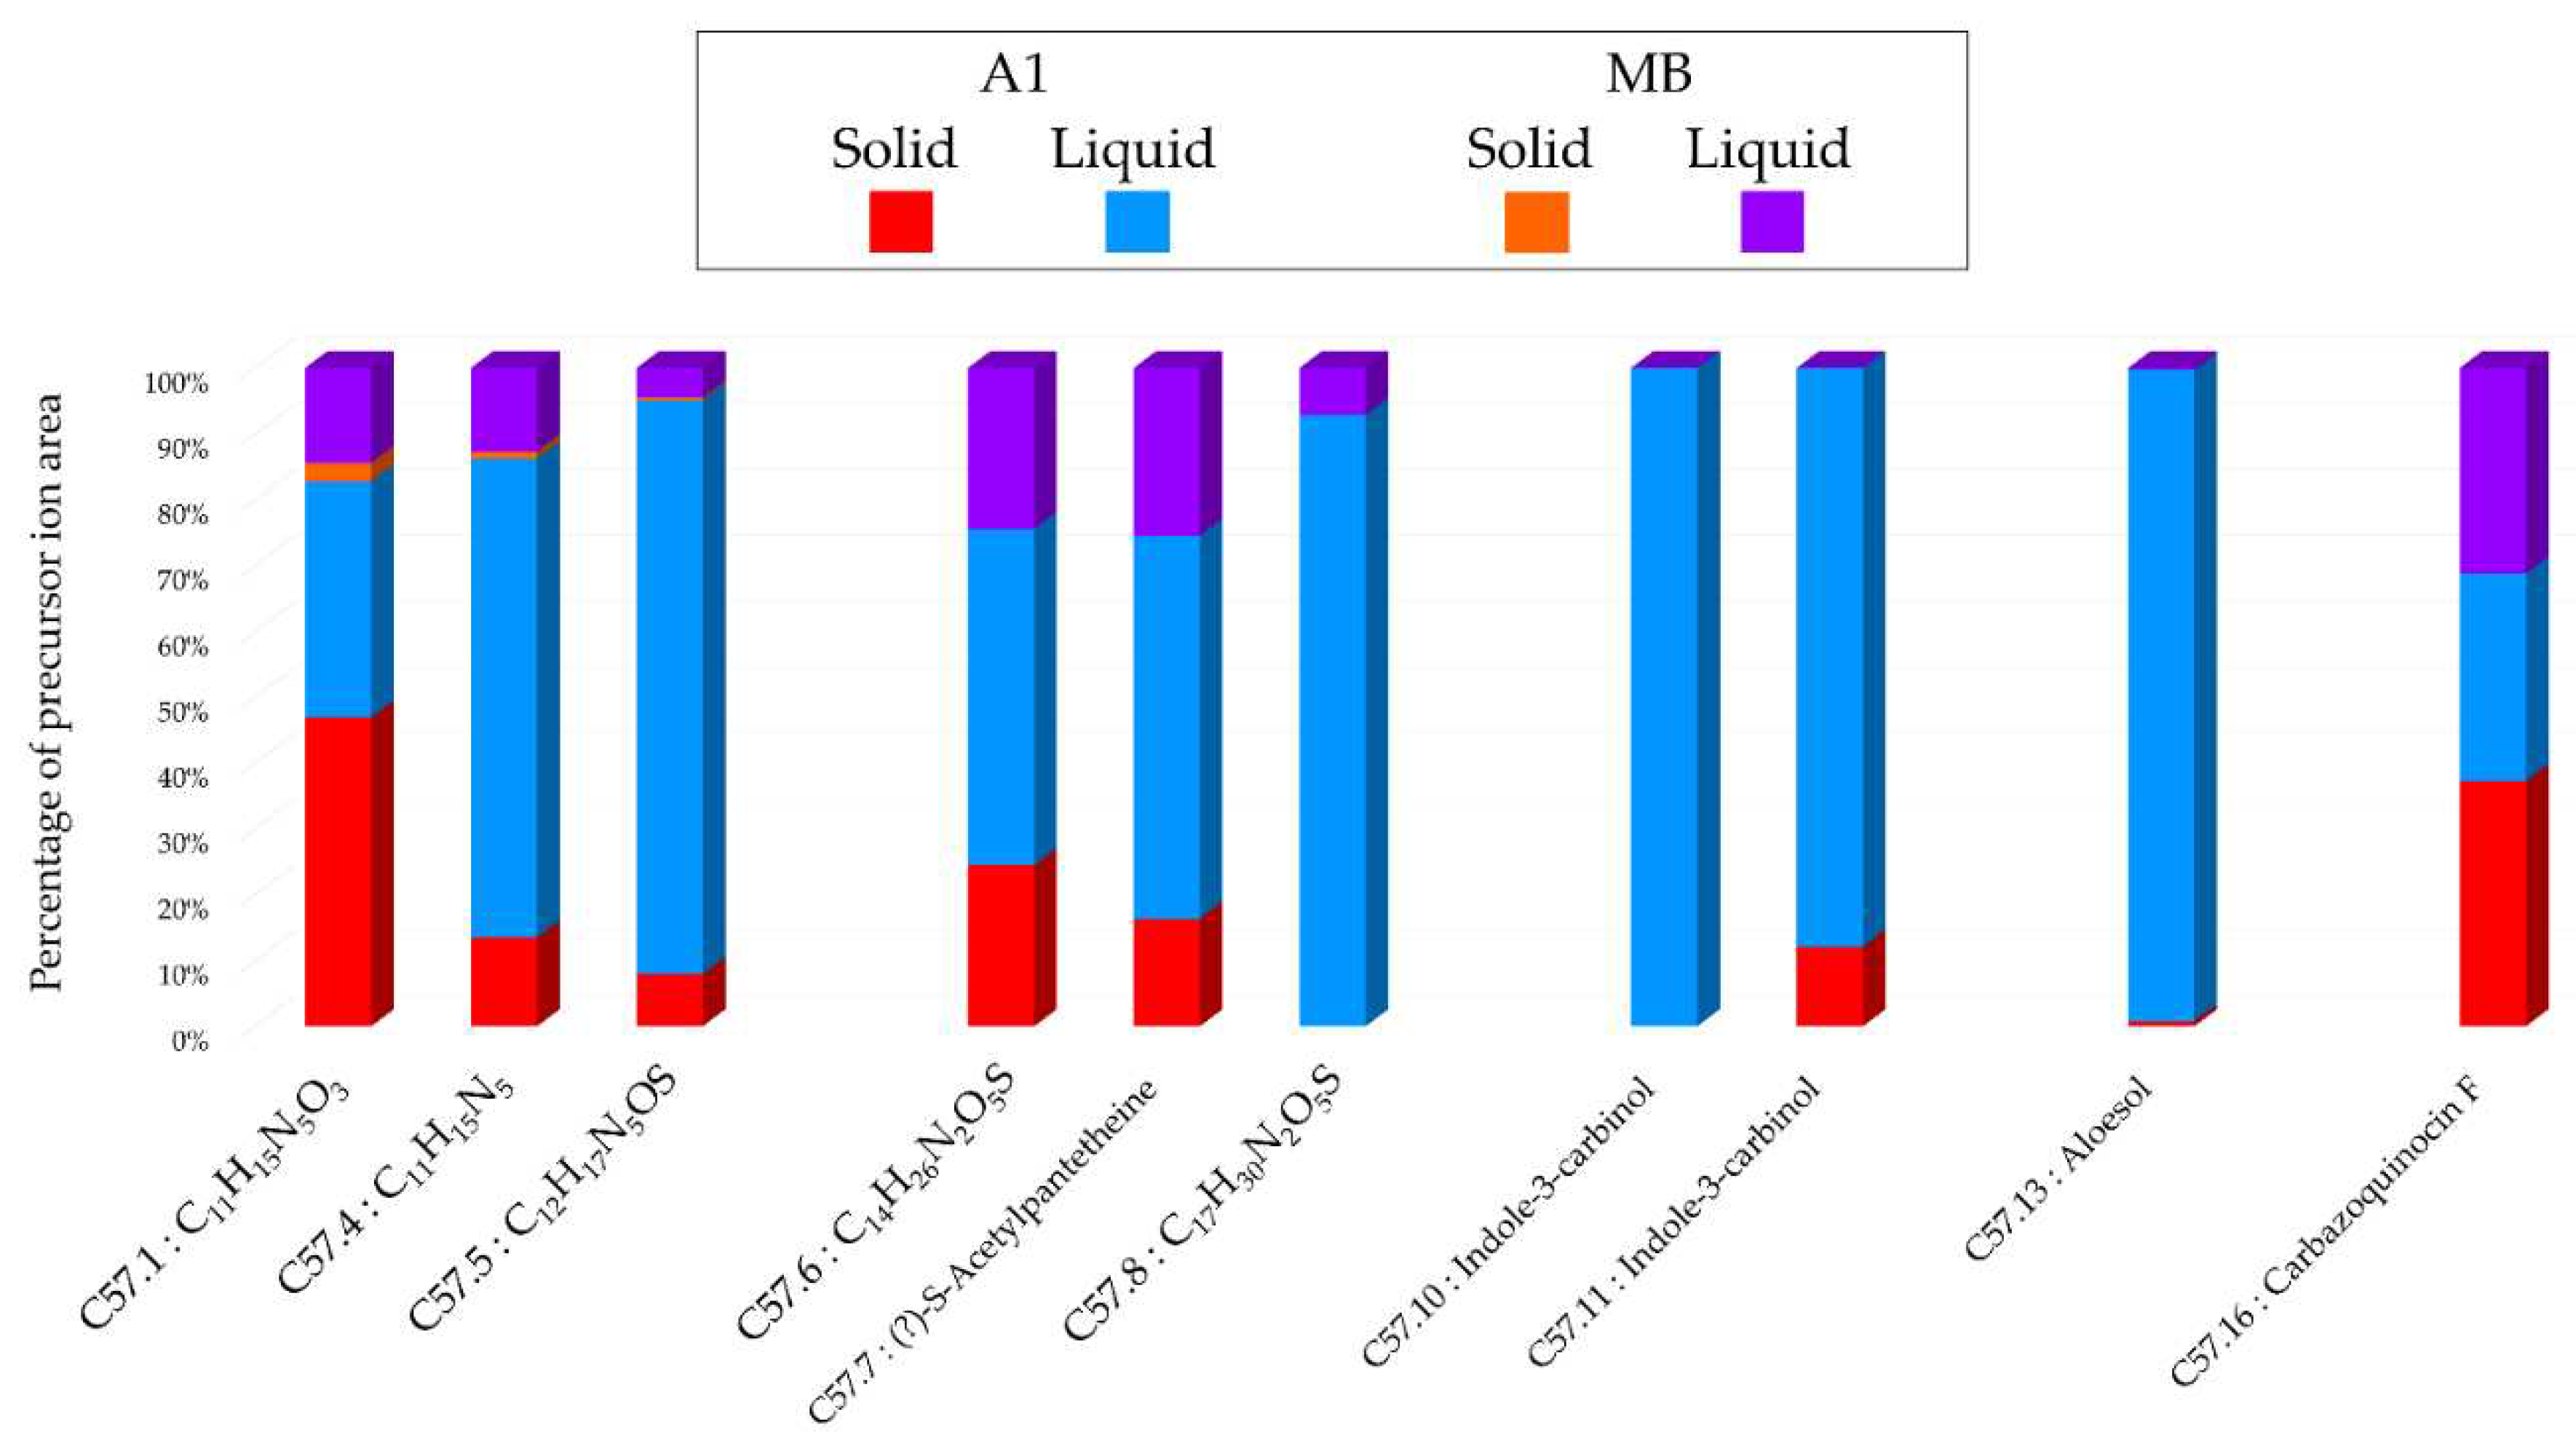
Figure 13.
(a) Ion Identity Molecular Network (IIMN) of microbial extracts from solid (red) and liquid (blue) culture of Salinispora arenicola SH-78 in A1 medium, at 14 days. (b) Venn diagram showing the percentage of nodes as a function of support culture. (c) Zoom on clusters of interest with examples of annotations.
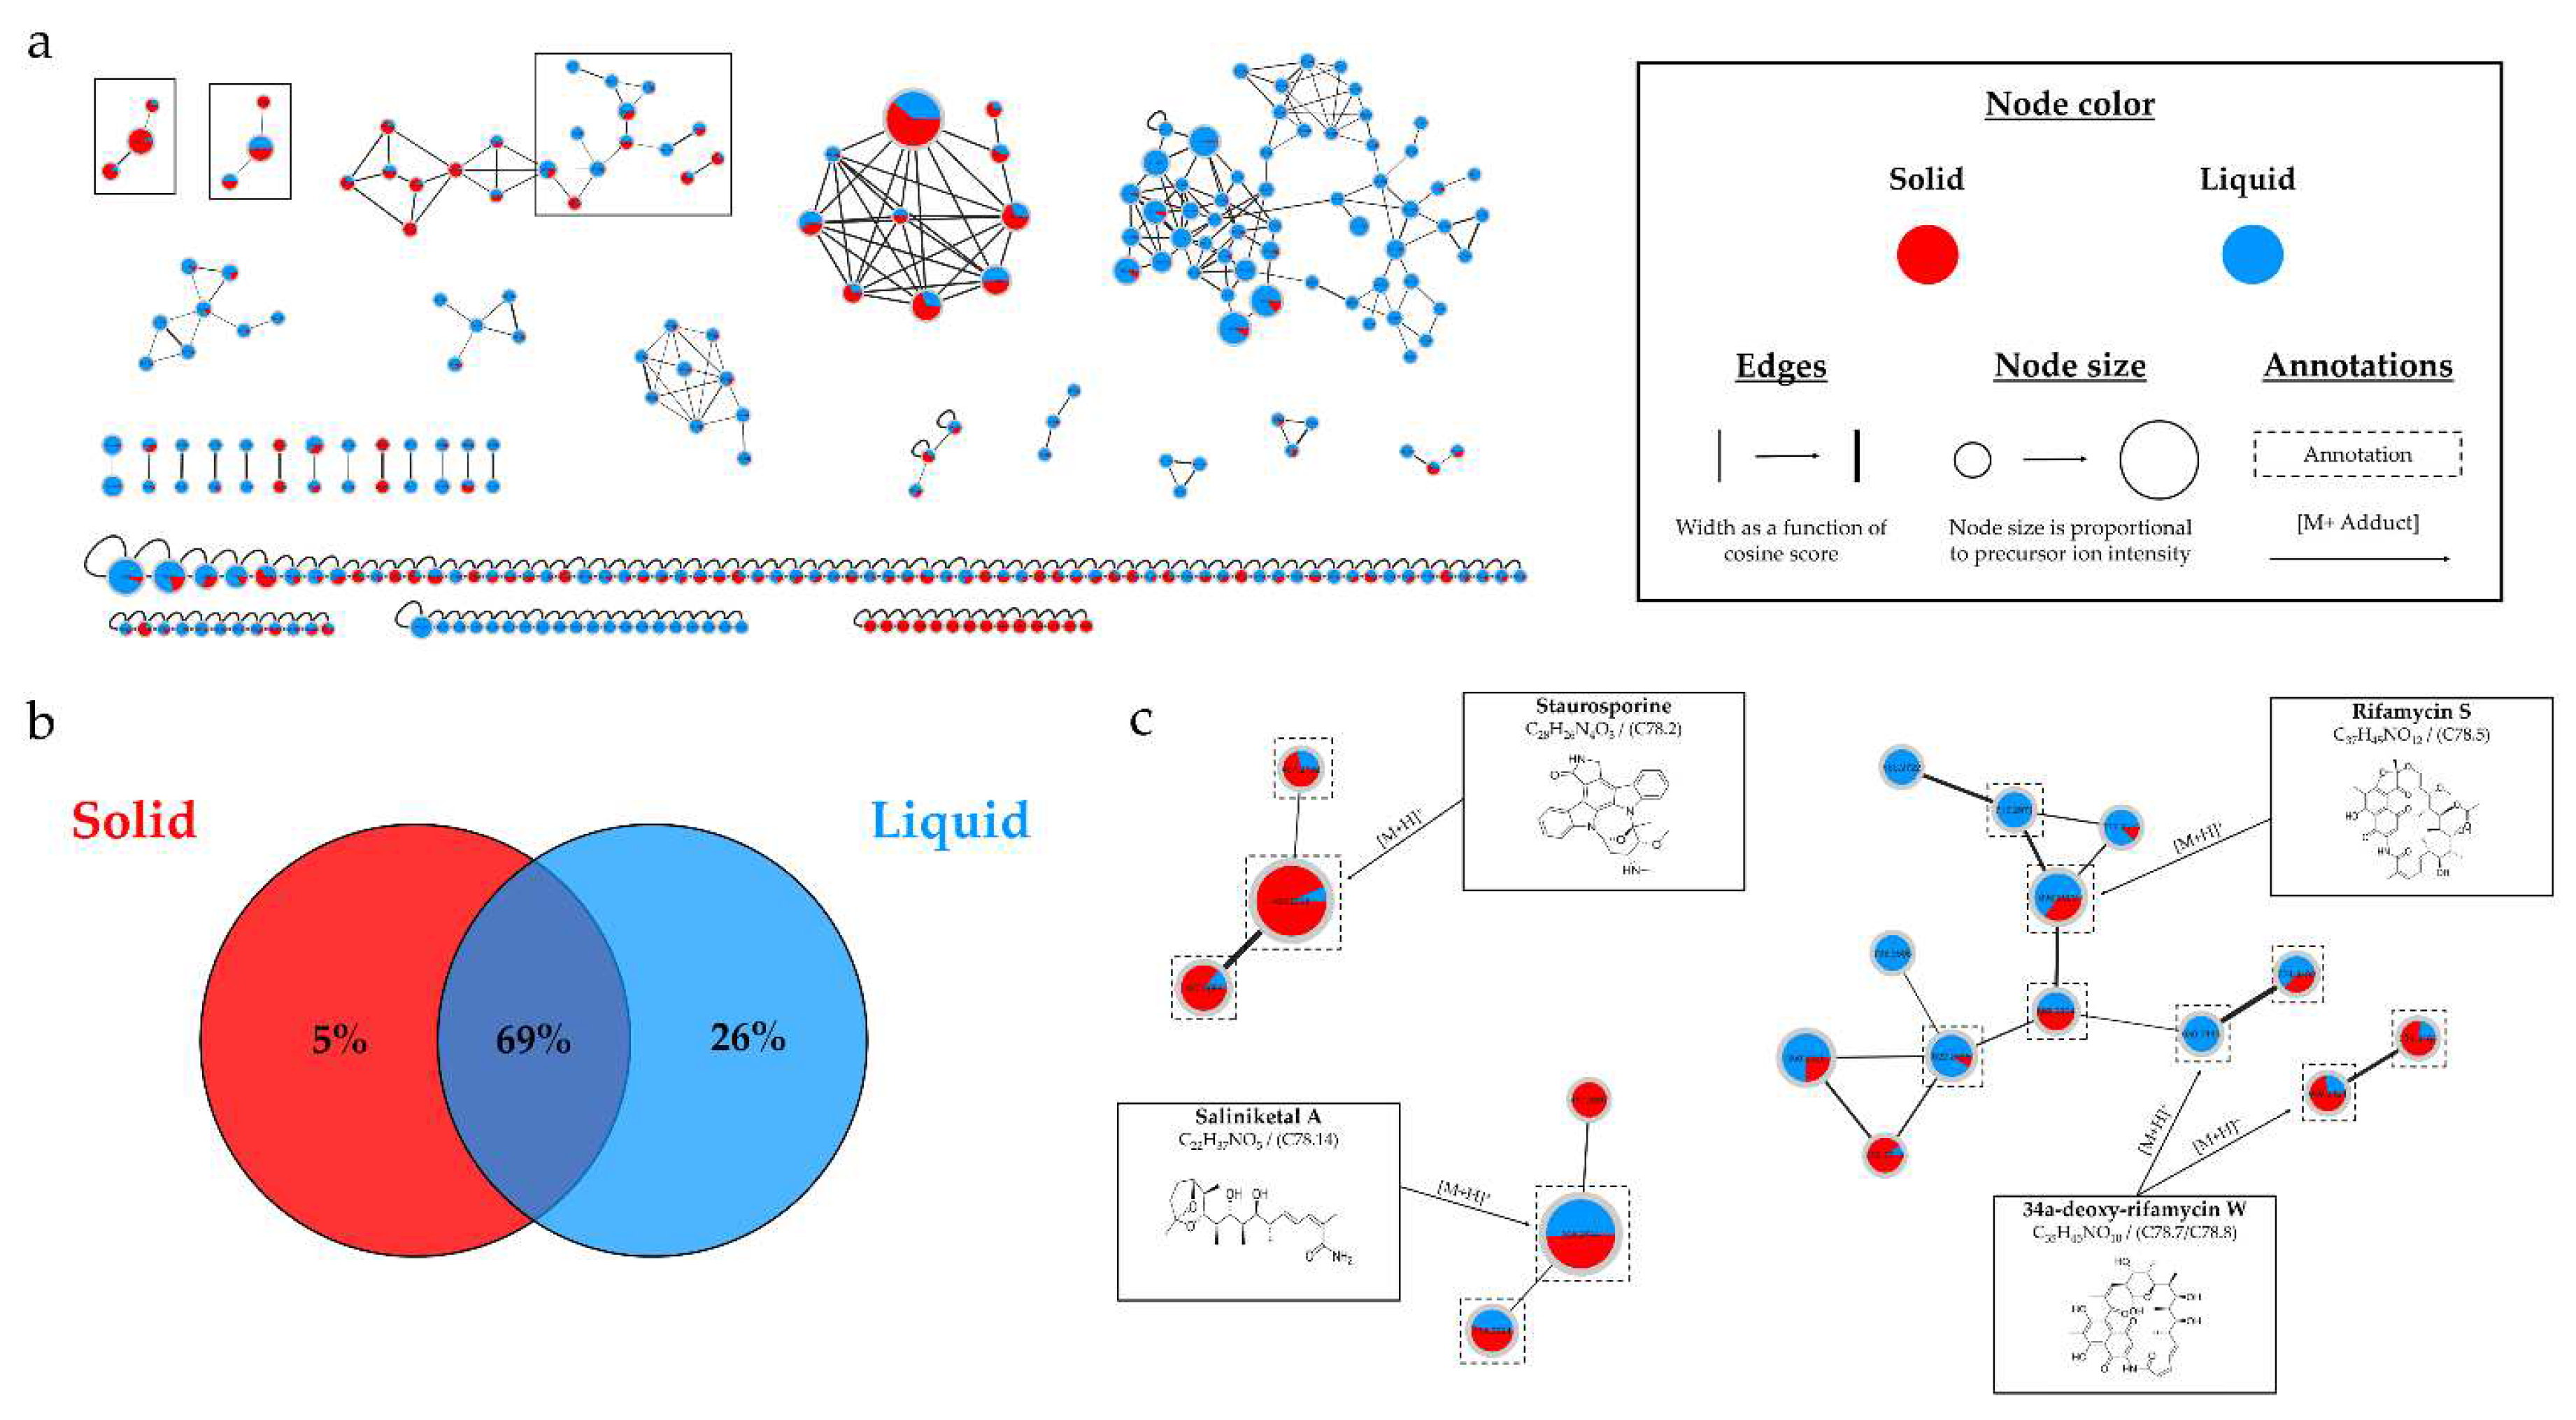
Figure 14.
Histograms representing the main annotations made in this network designed with extracts from extracts from 14-day A1 solid and liquid cultures of Salinispora arenicola SH-78. Histograms presents the proportion attributed to each culture condition relative to the precursor ion area intensities. Red: extract from solid culture ; Blue: extract from liquid culture.
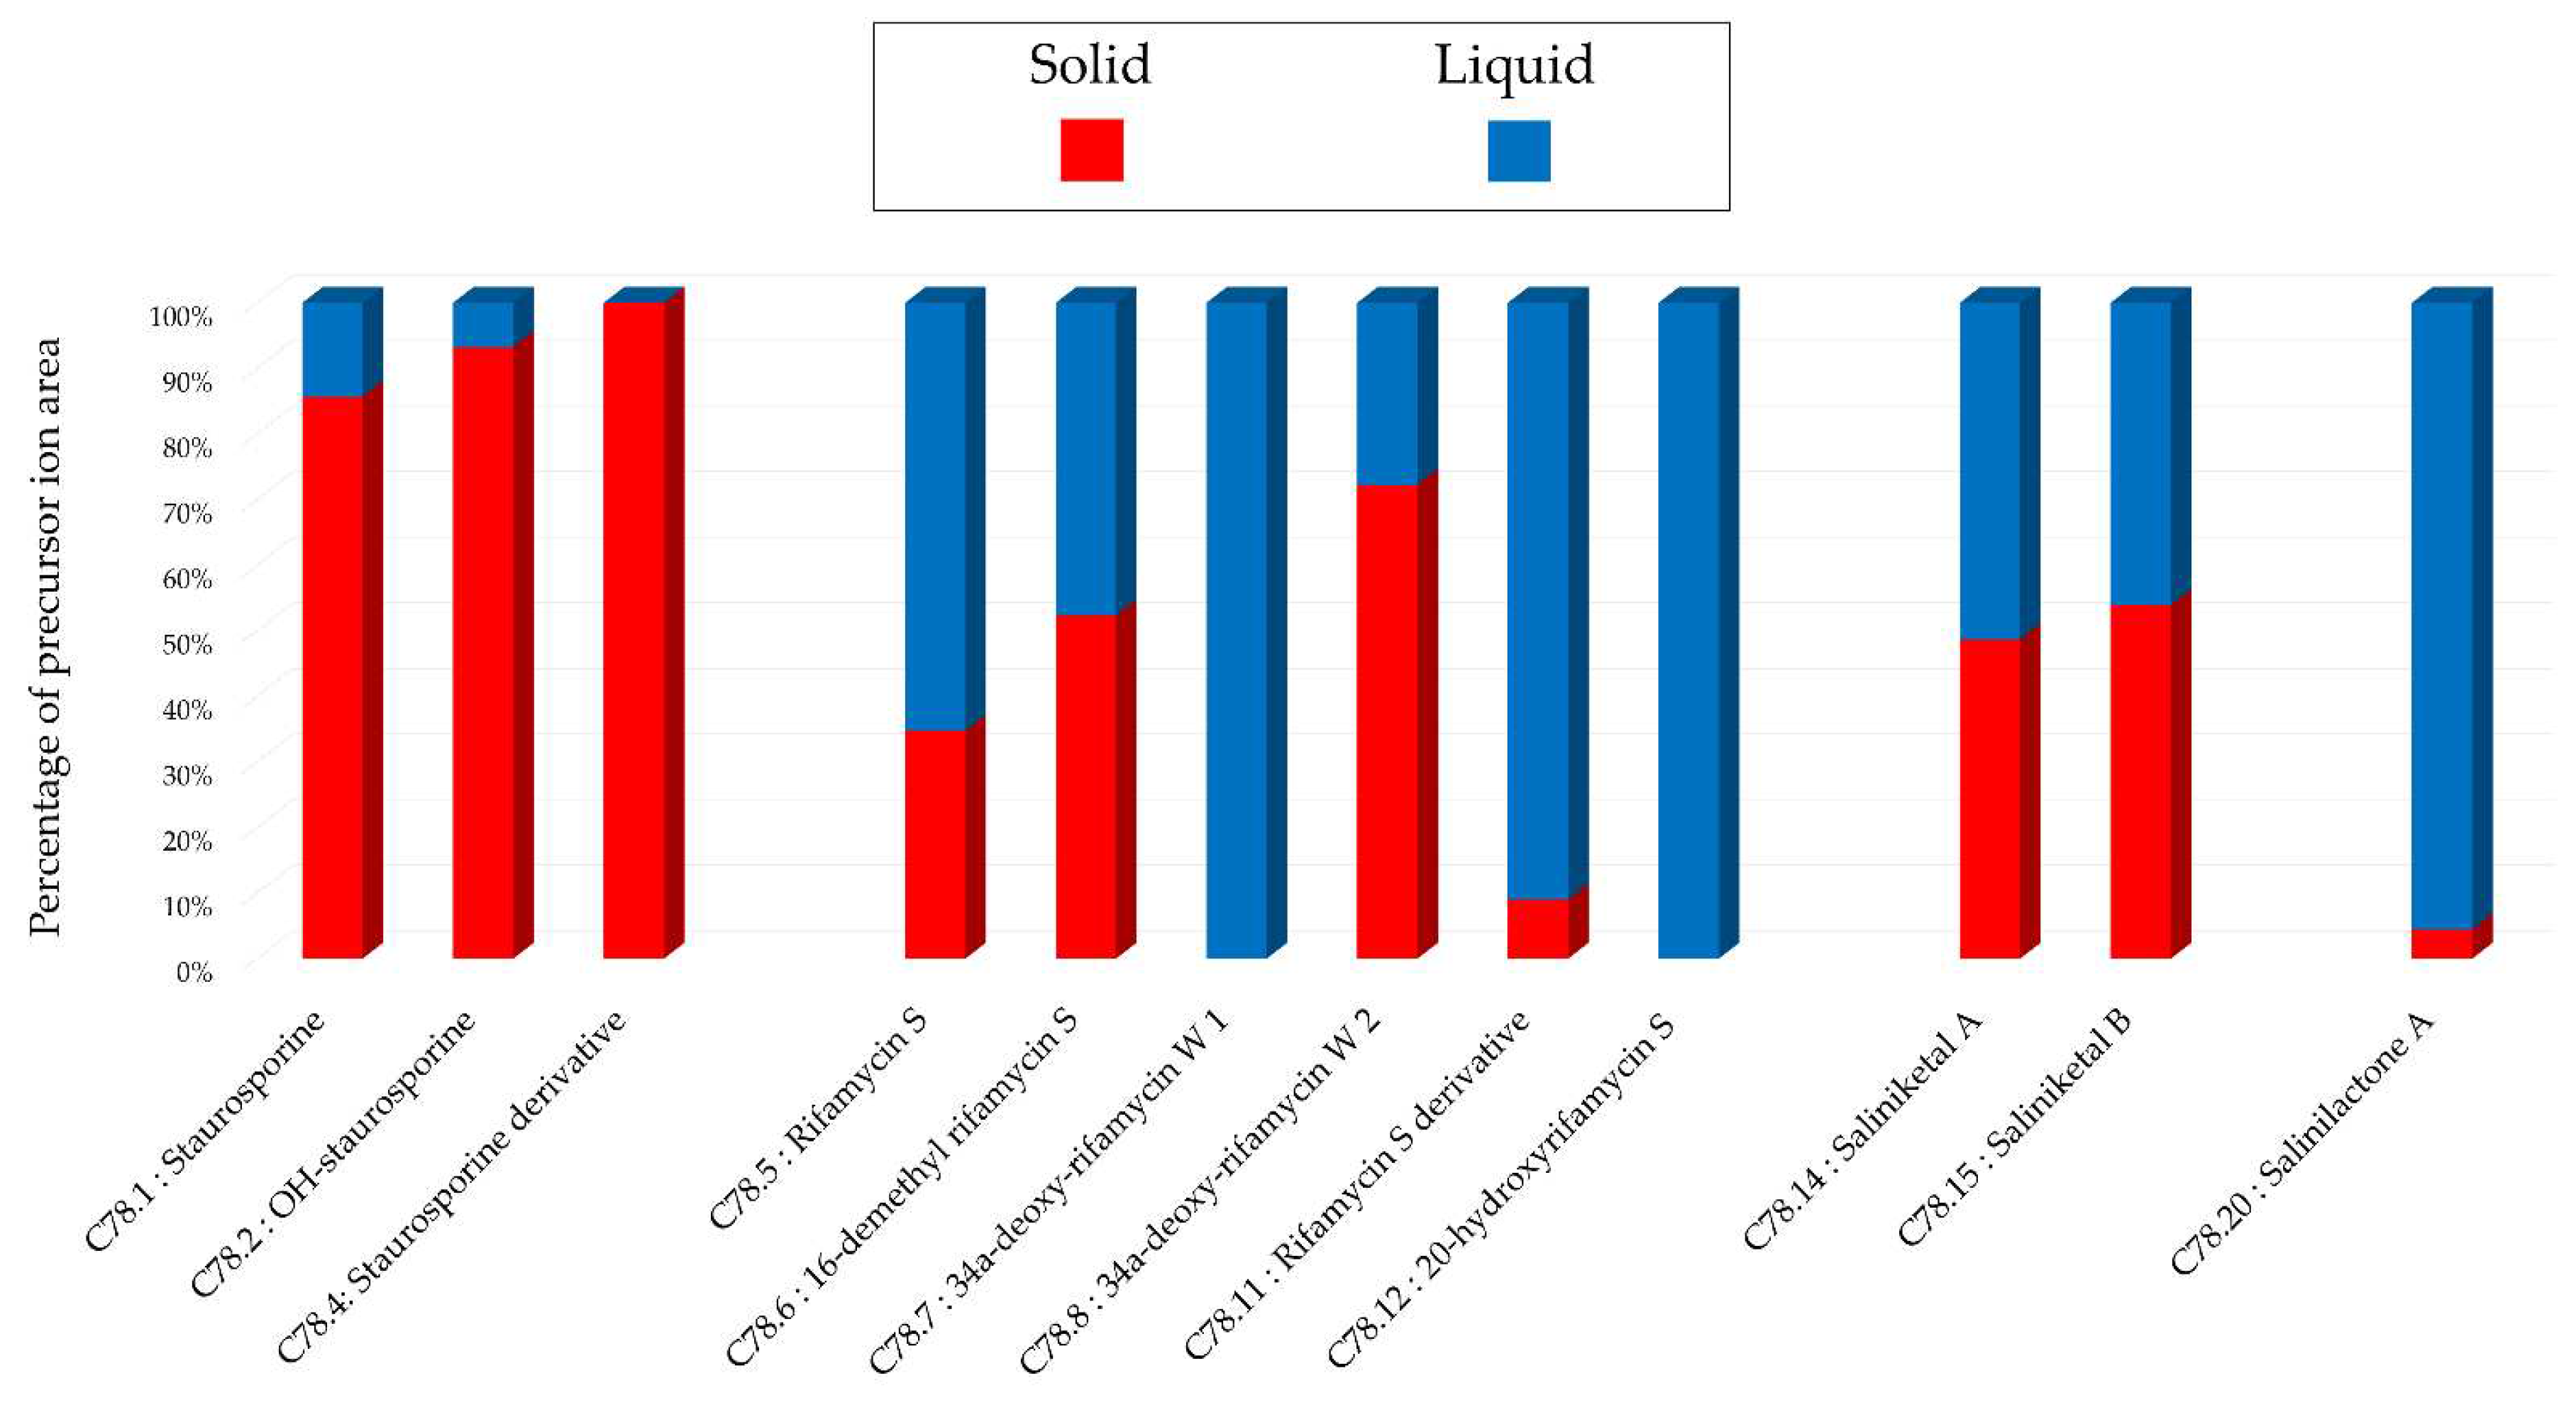
Figure 15.
(a) Ion Identity Molecular Network (IIMN) of microbial extracts from solid cultures of Salinispora arenicola SH-78 at 7 (pink), 14 (red) and 21 days (maroon). (b) Venn diagram showing the percentage of nodes as a function of cultivation time. (c) Zoom on clusters of interest with examples of annotations.
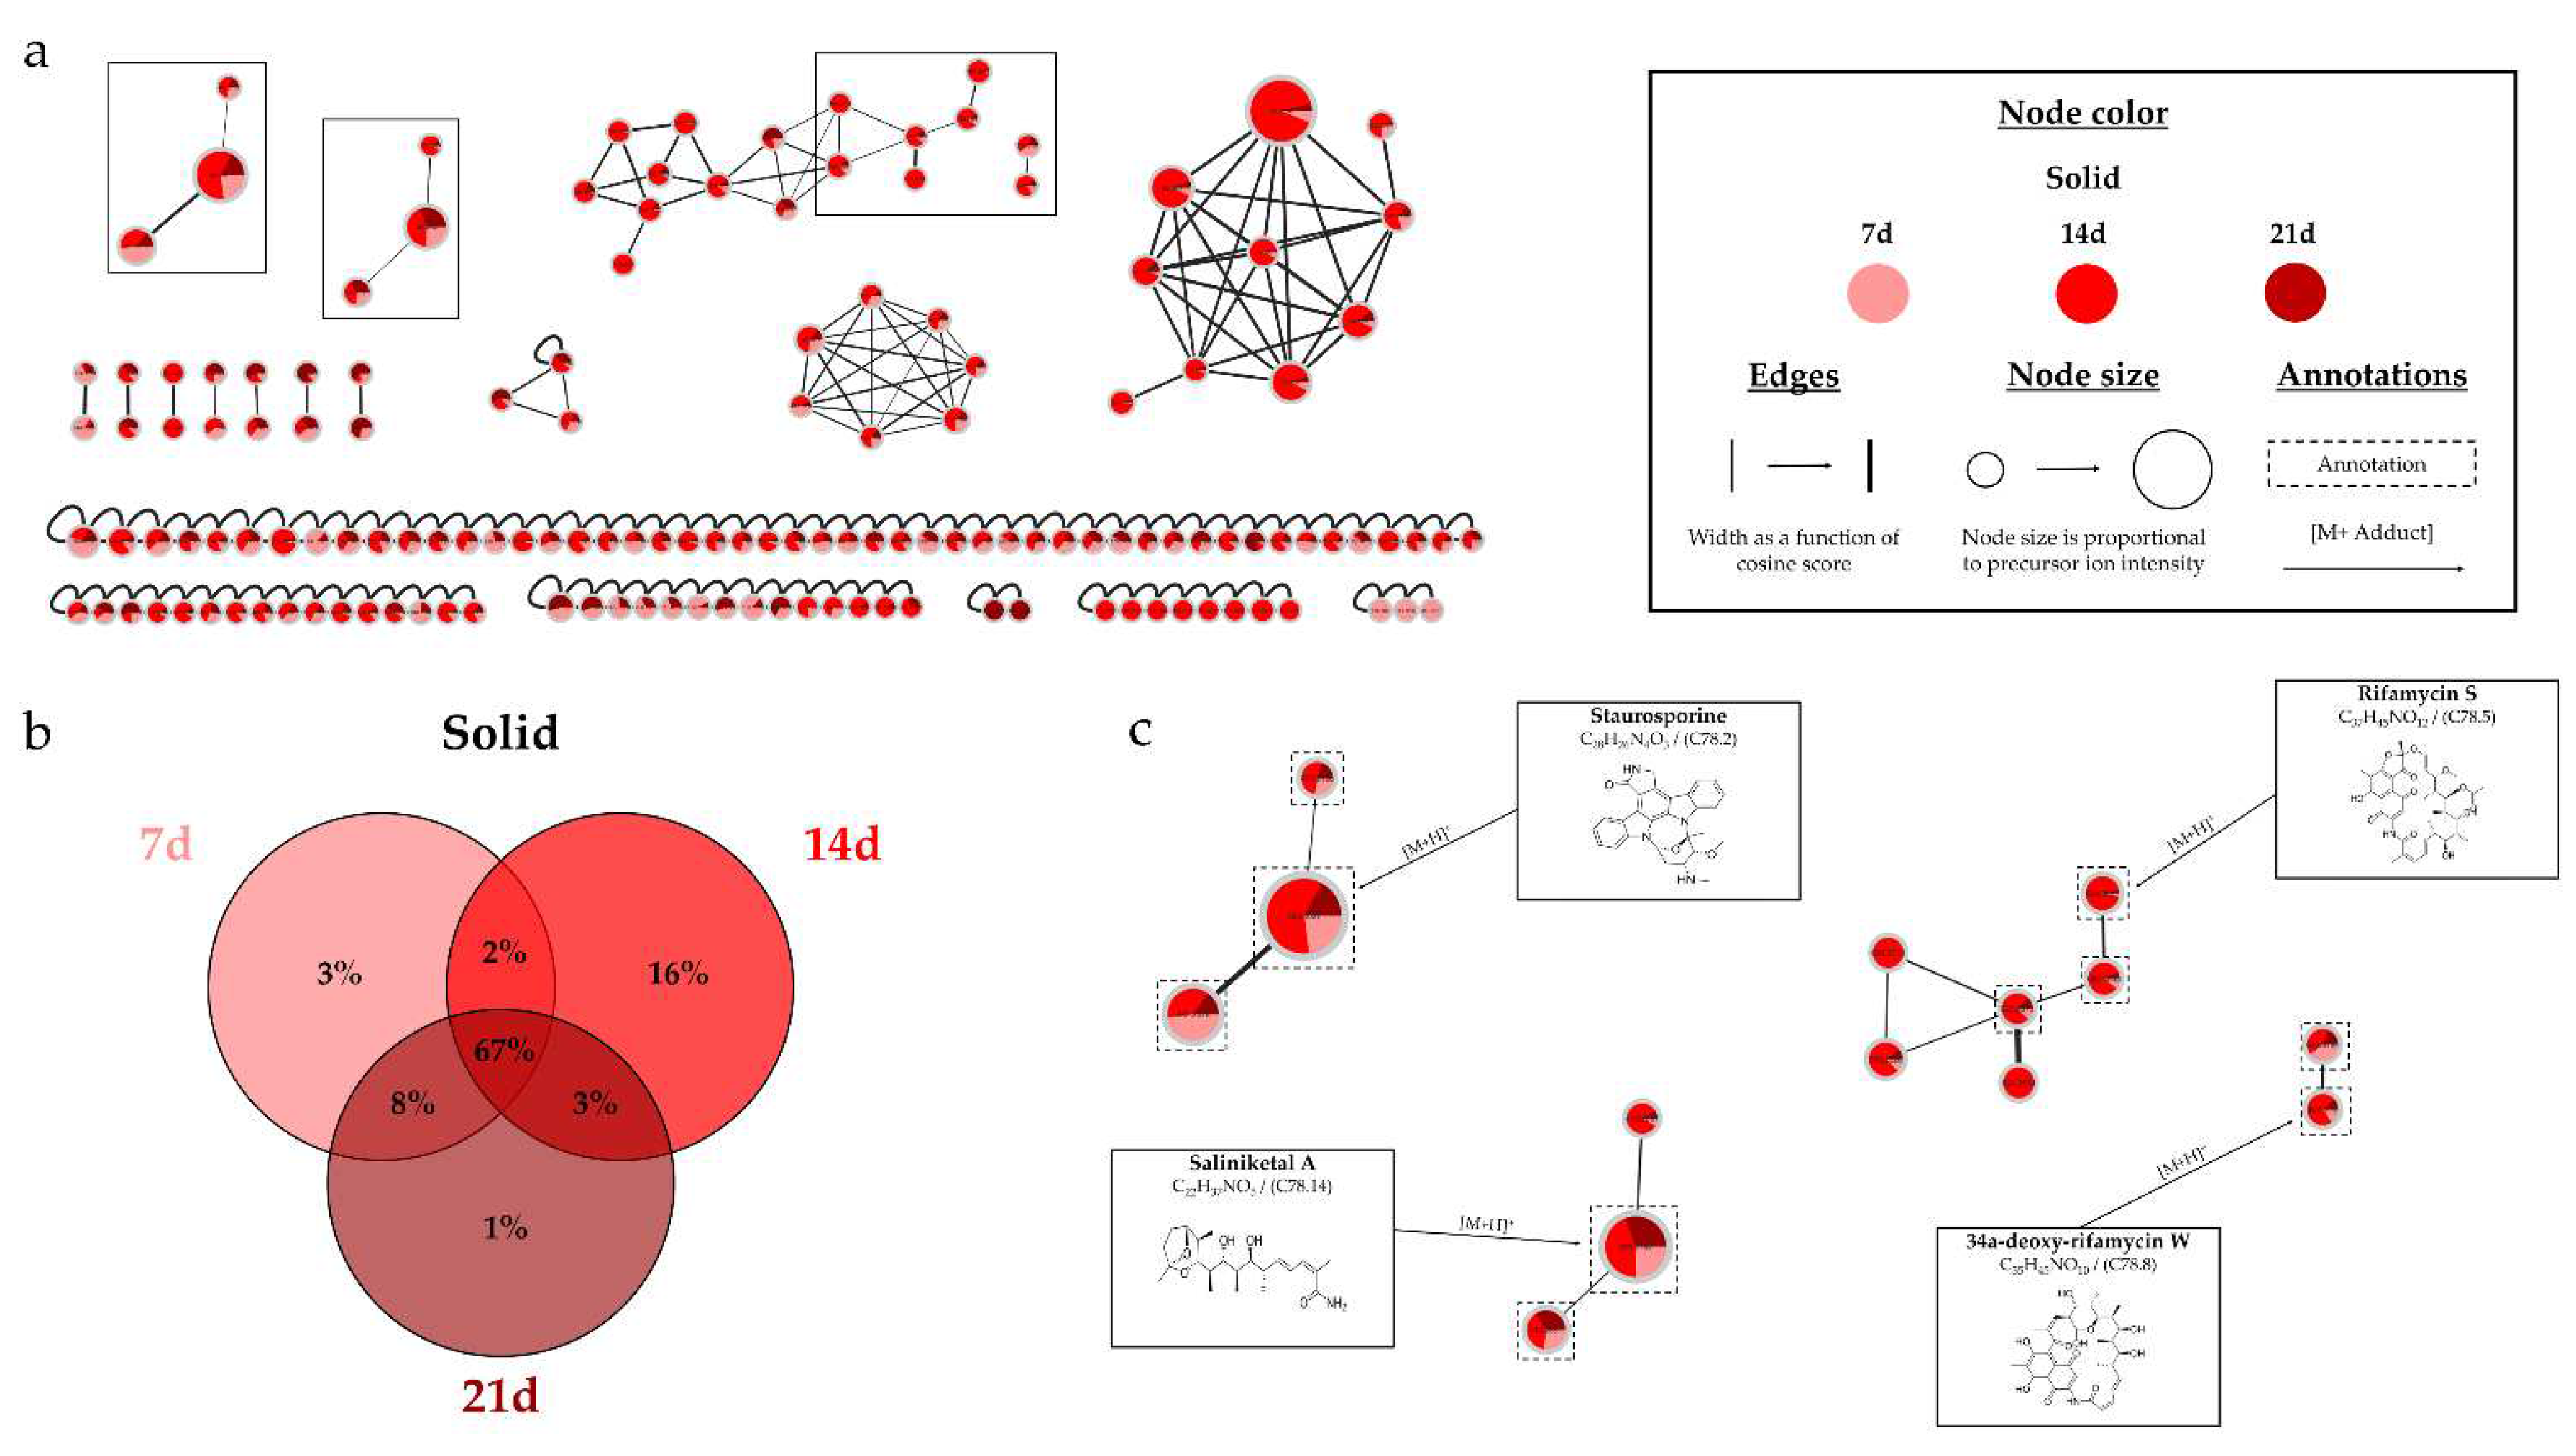
Figure 16.
Histograms representing the main annotations made in this network designed with extracts from the solid cultures of Salinispora arenicola SH-78 at the different times (7, 14, 21 days). Histograms presents the proportion attributed to each culture condition relative to the precursor ion area intensities. Pink: extract from solid culture at 7 days; Red: 14 days; Brown: 21 days.
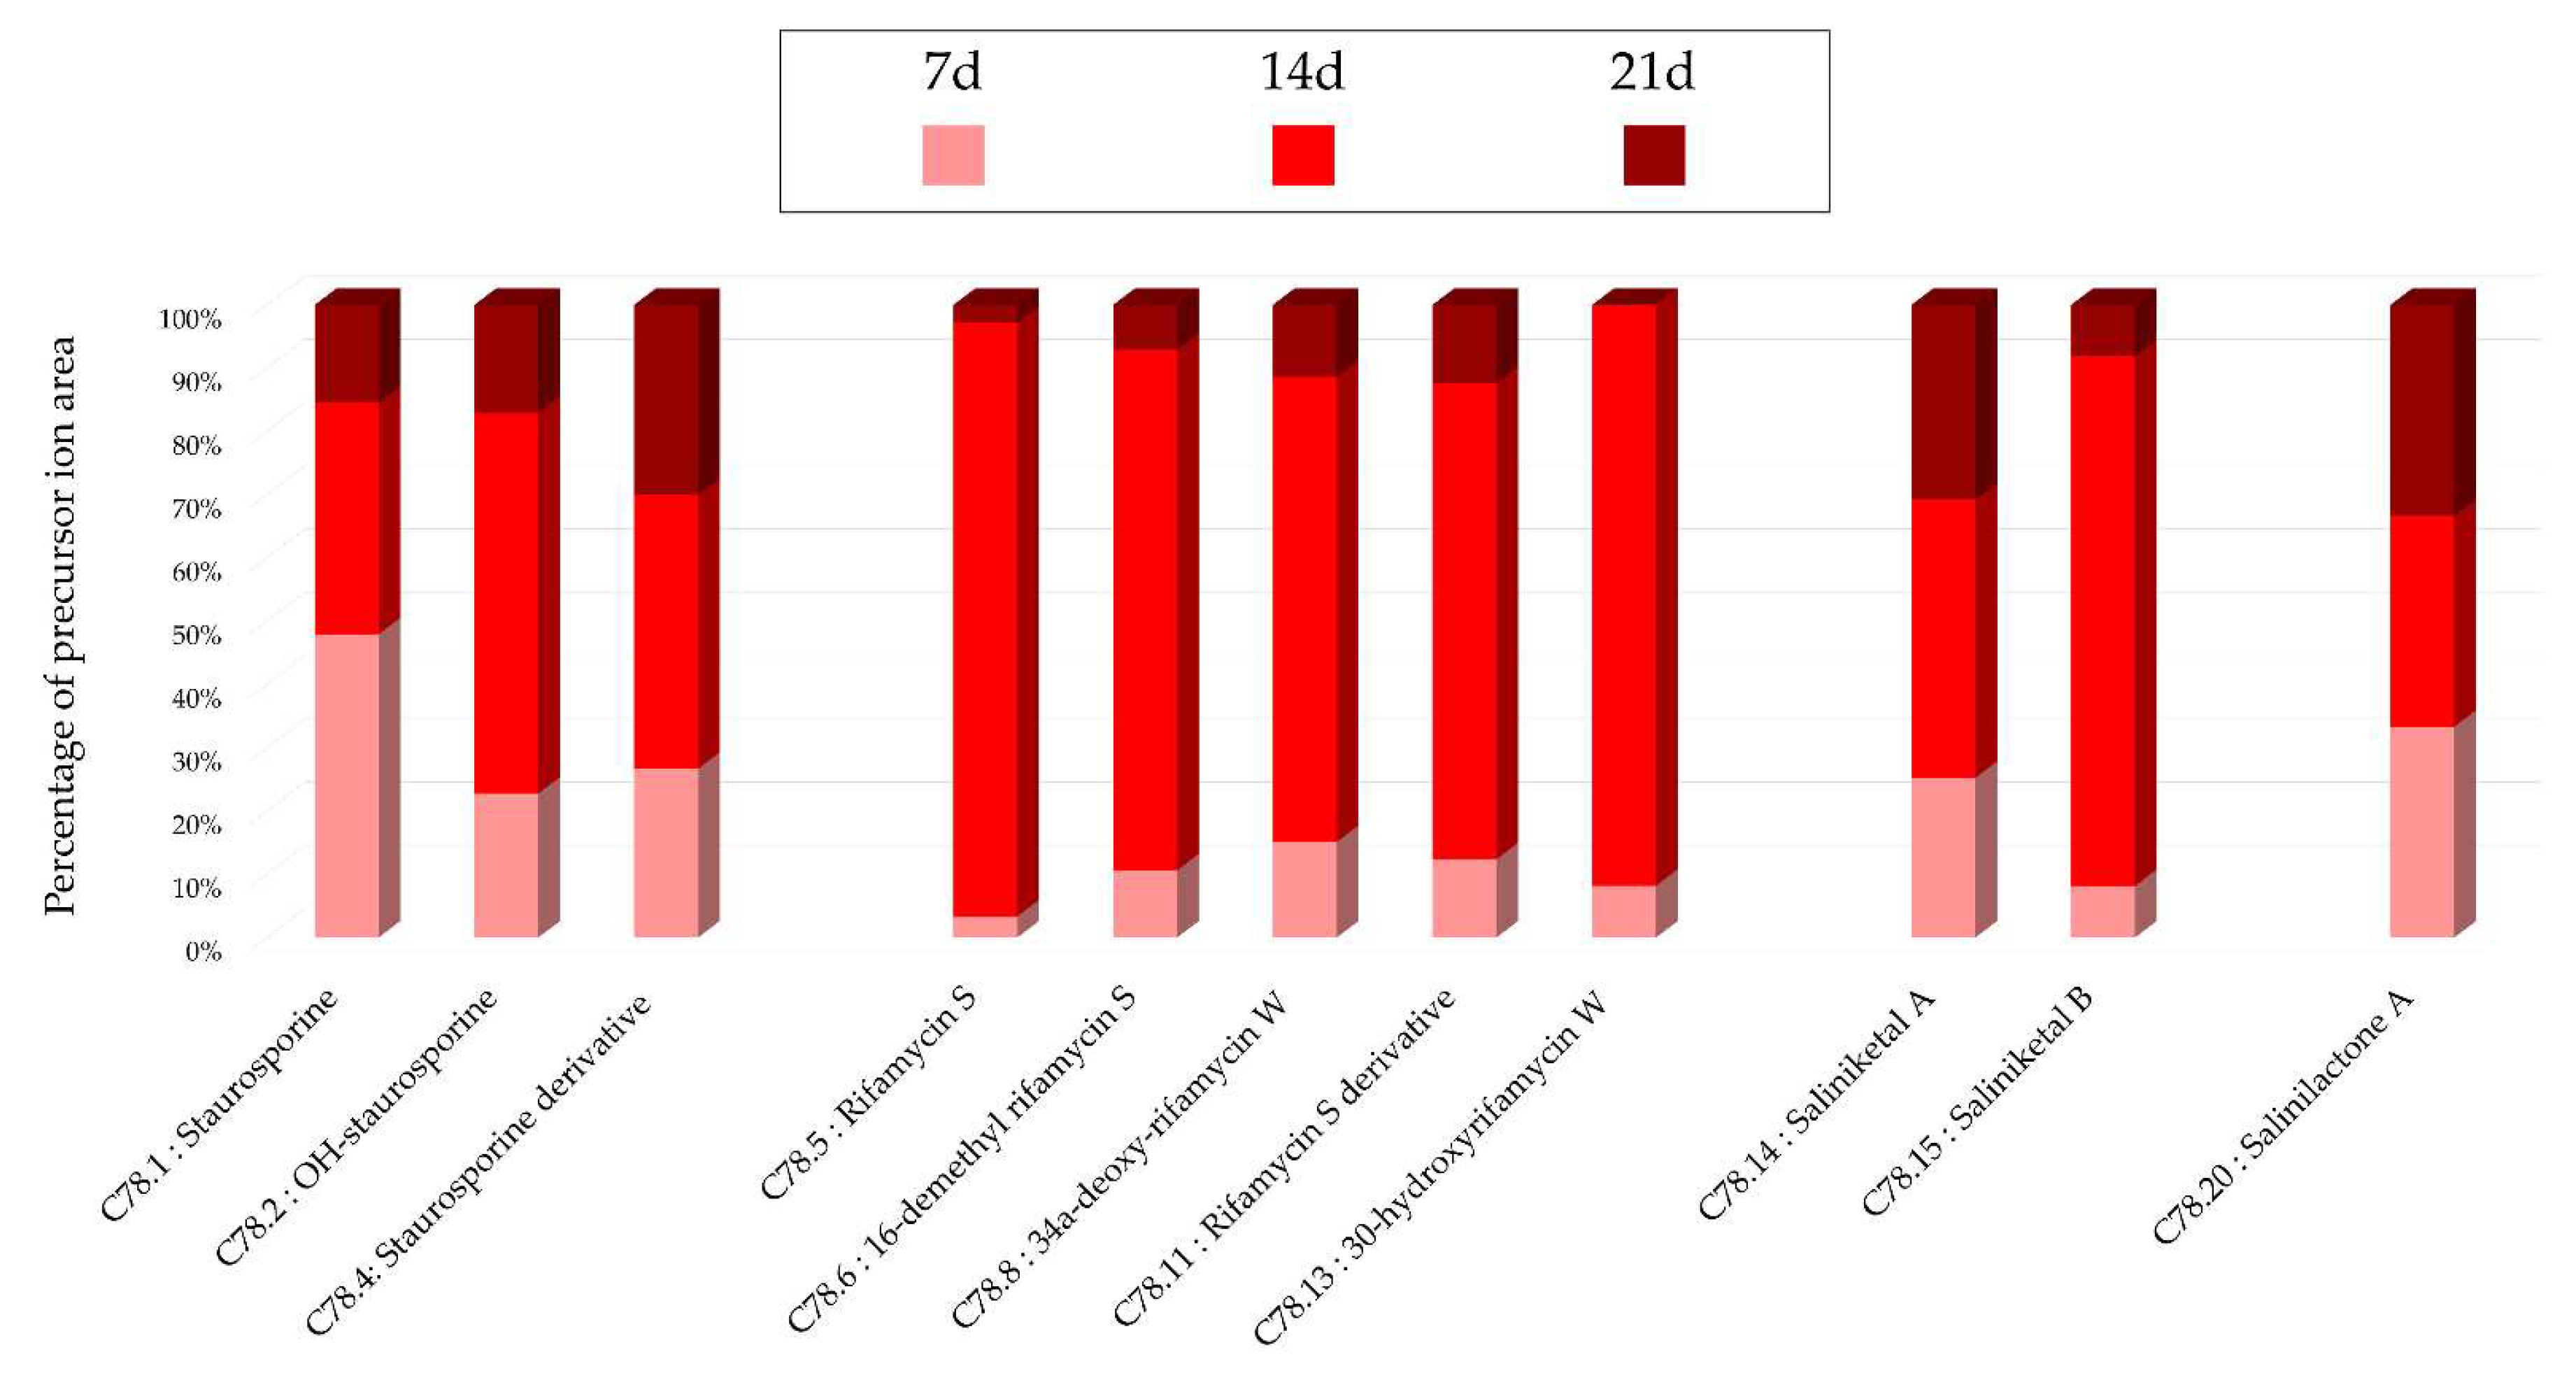
Figure 17.
(a) Ion Identity Molecular Network (IIMN) of AcOEt (red) and MeOH (green) extracts from 14-day solid A1 culture of Salinispora arenicola SH-78. (b) Venn diagram showing the percentage of nodes as a function of the solvent used. (c) Zoom on clusters of interest with examples of annotations.
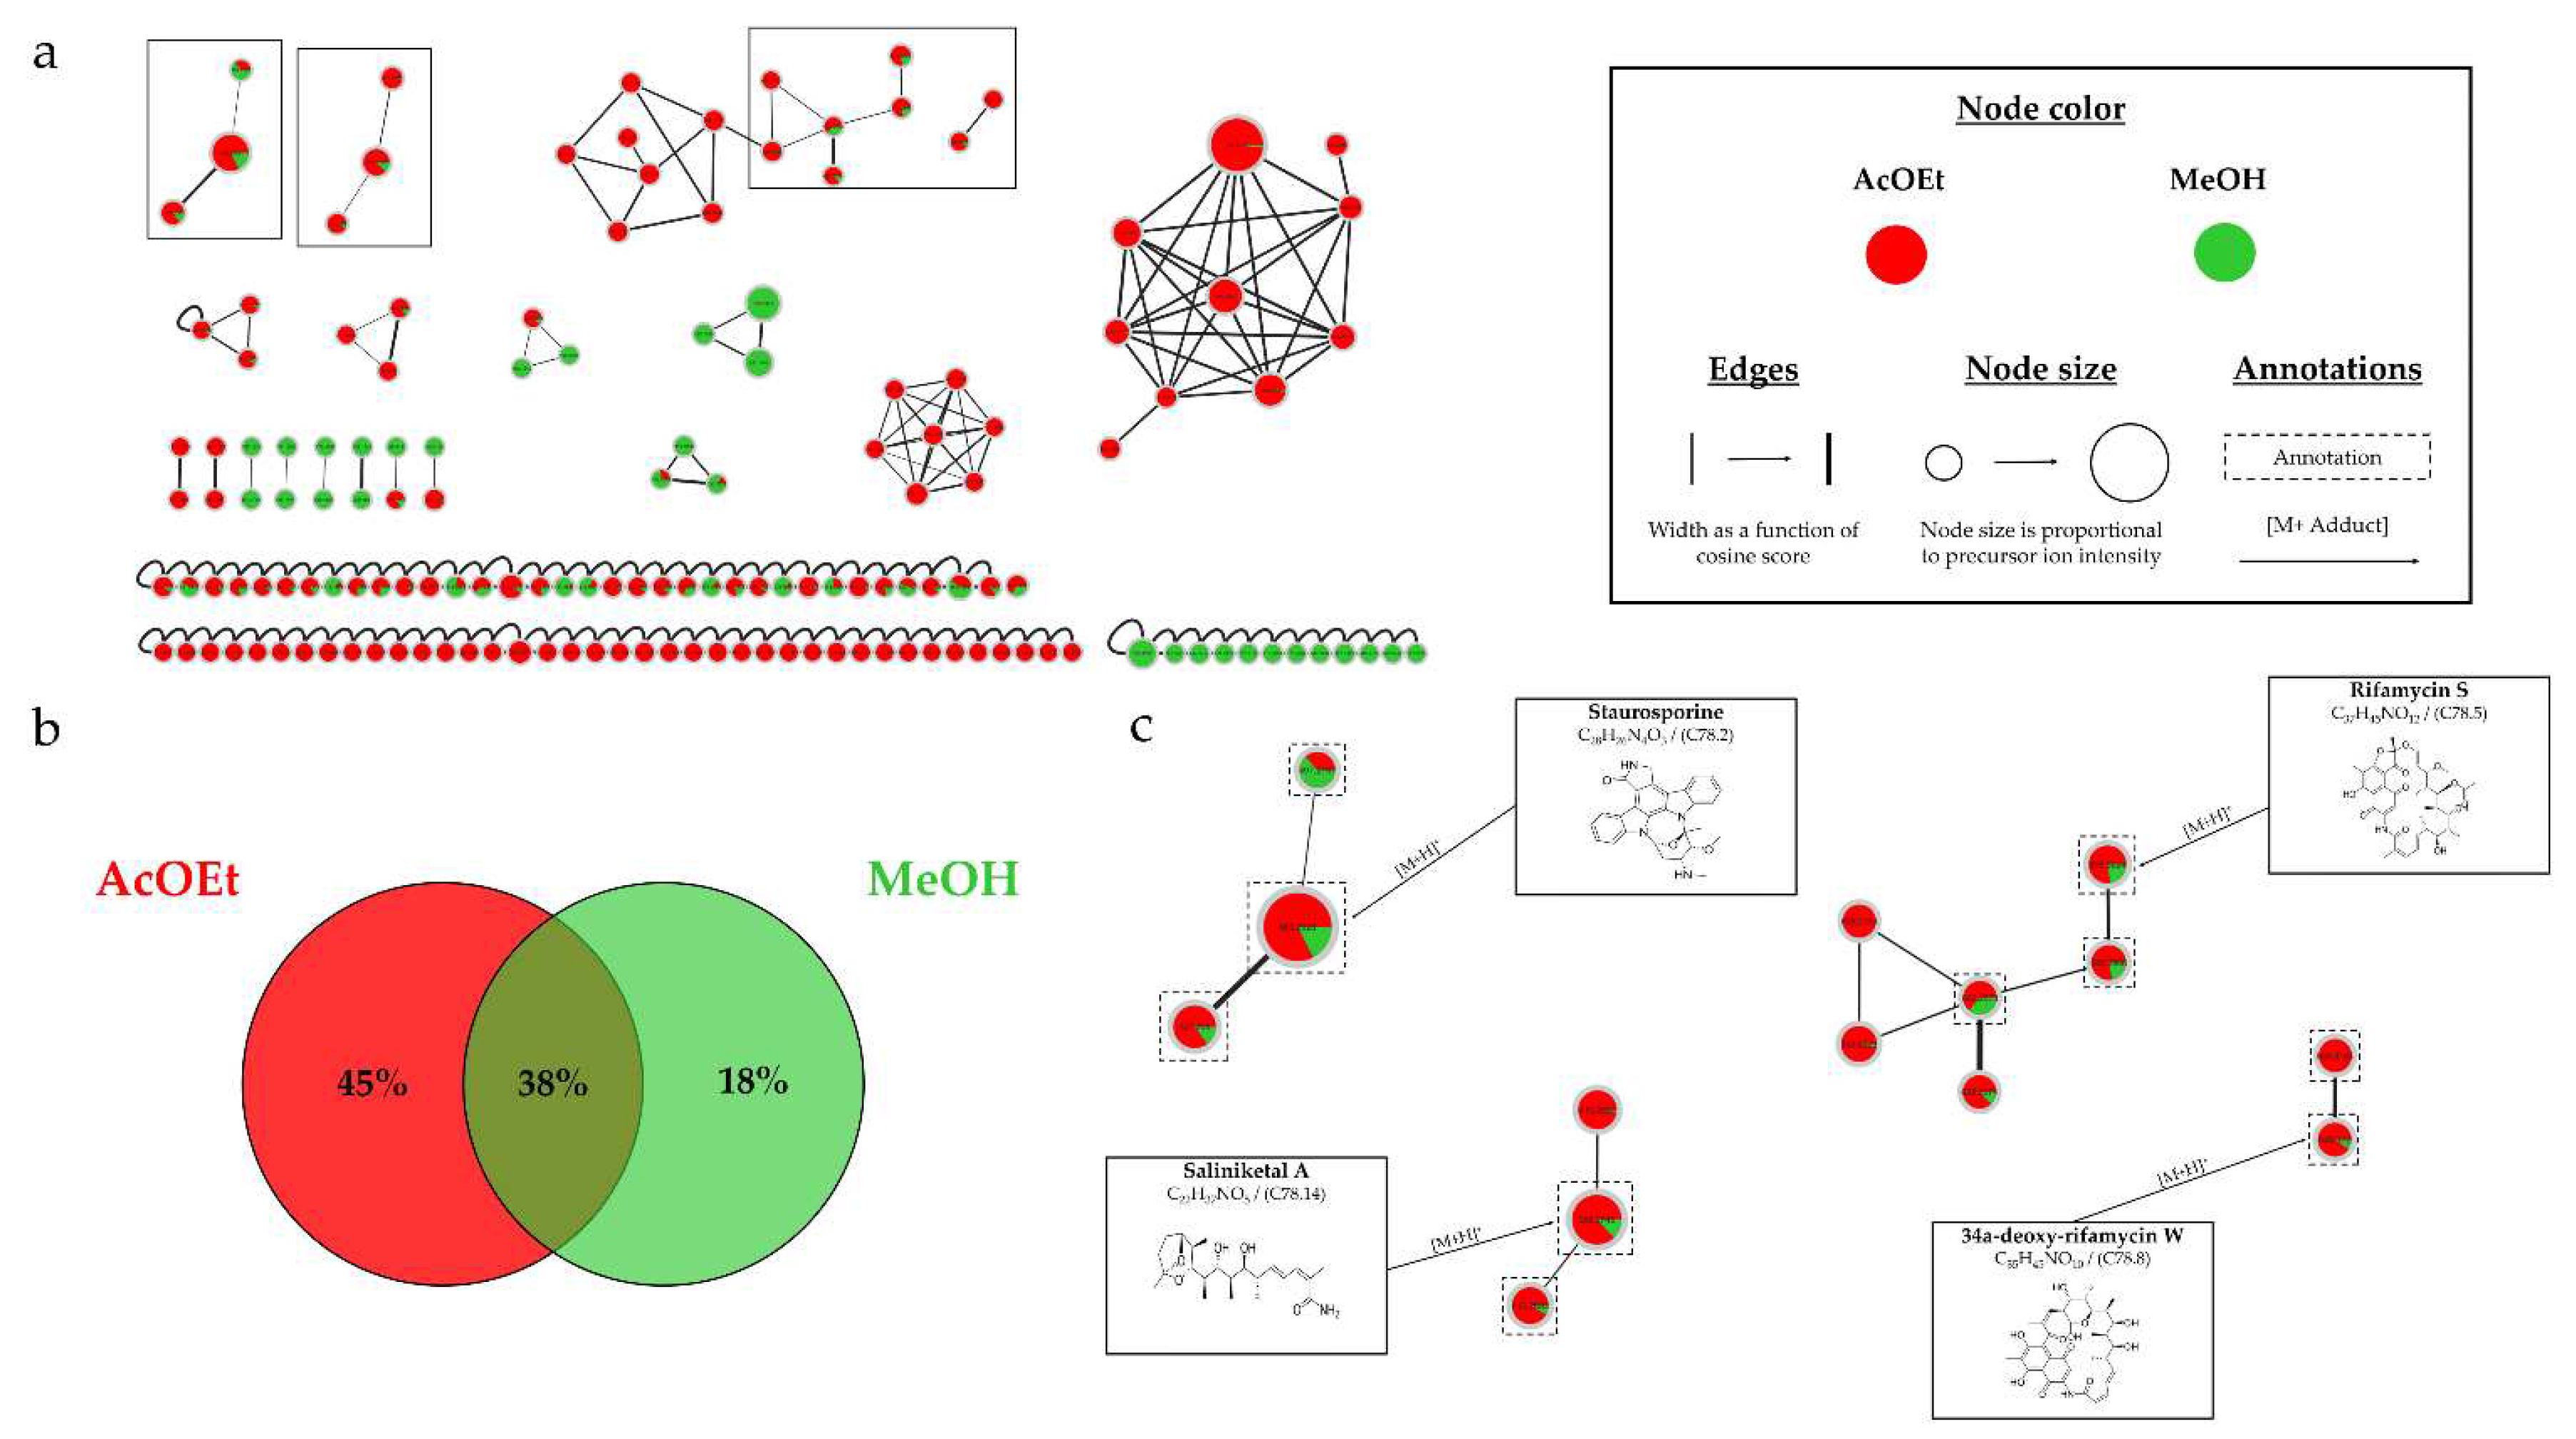
Figure 18.
Histograms representing the main annotations made in this network designed with ethyl acetate (AcOEt) and methanolic (MeOH) extracts from 14-day solid A1 culture of Salinispora arenicola SH-78. Histograms presents the proportion attributed to each culture condition relative to the precursor ion area intensities. Red: AcOEt extract ; Green: MeOH extract.
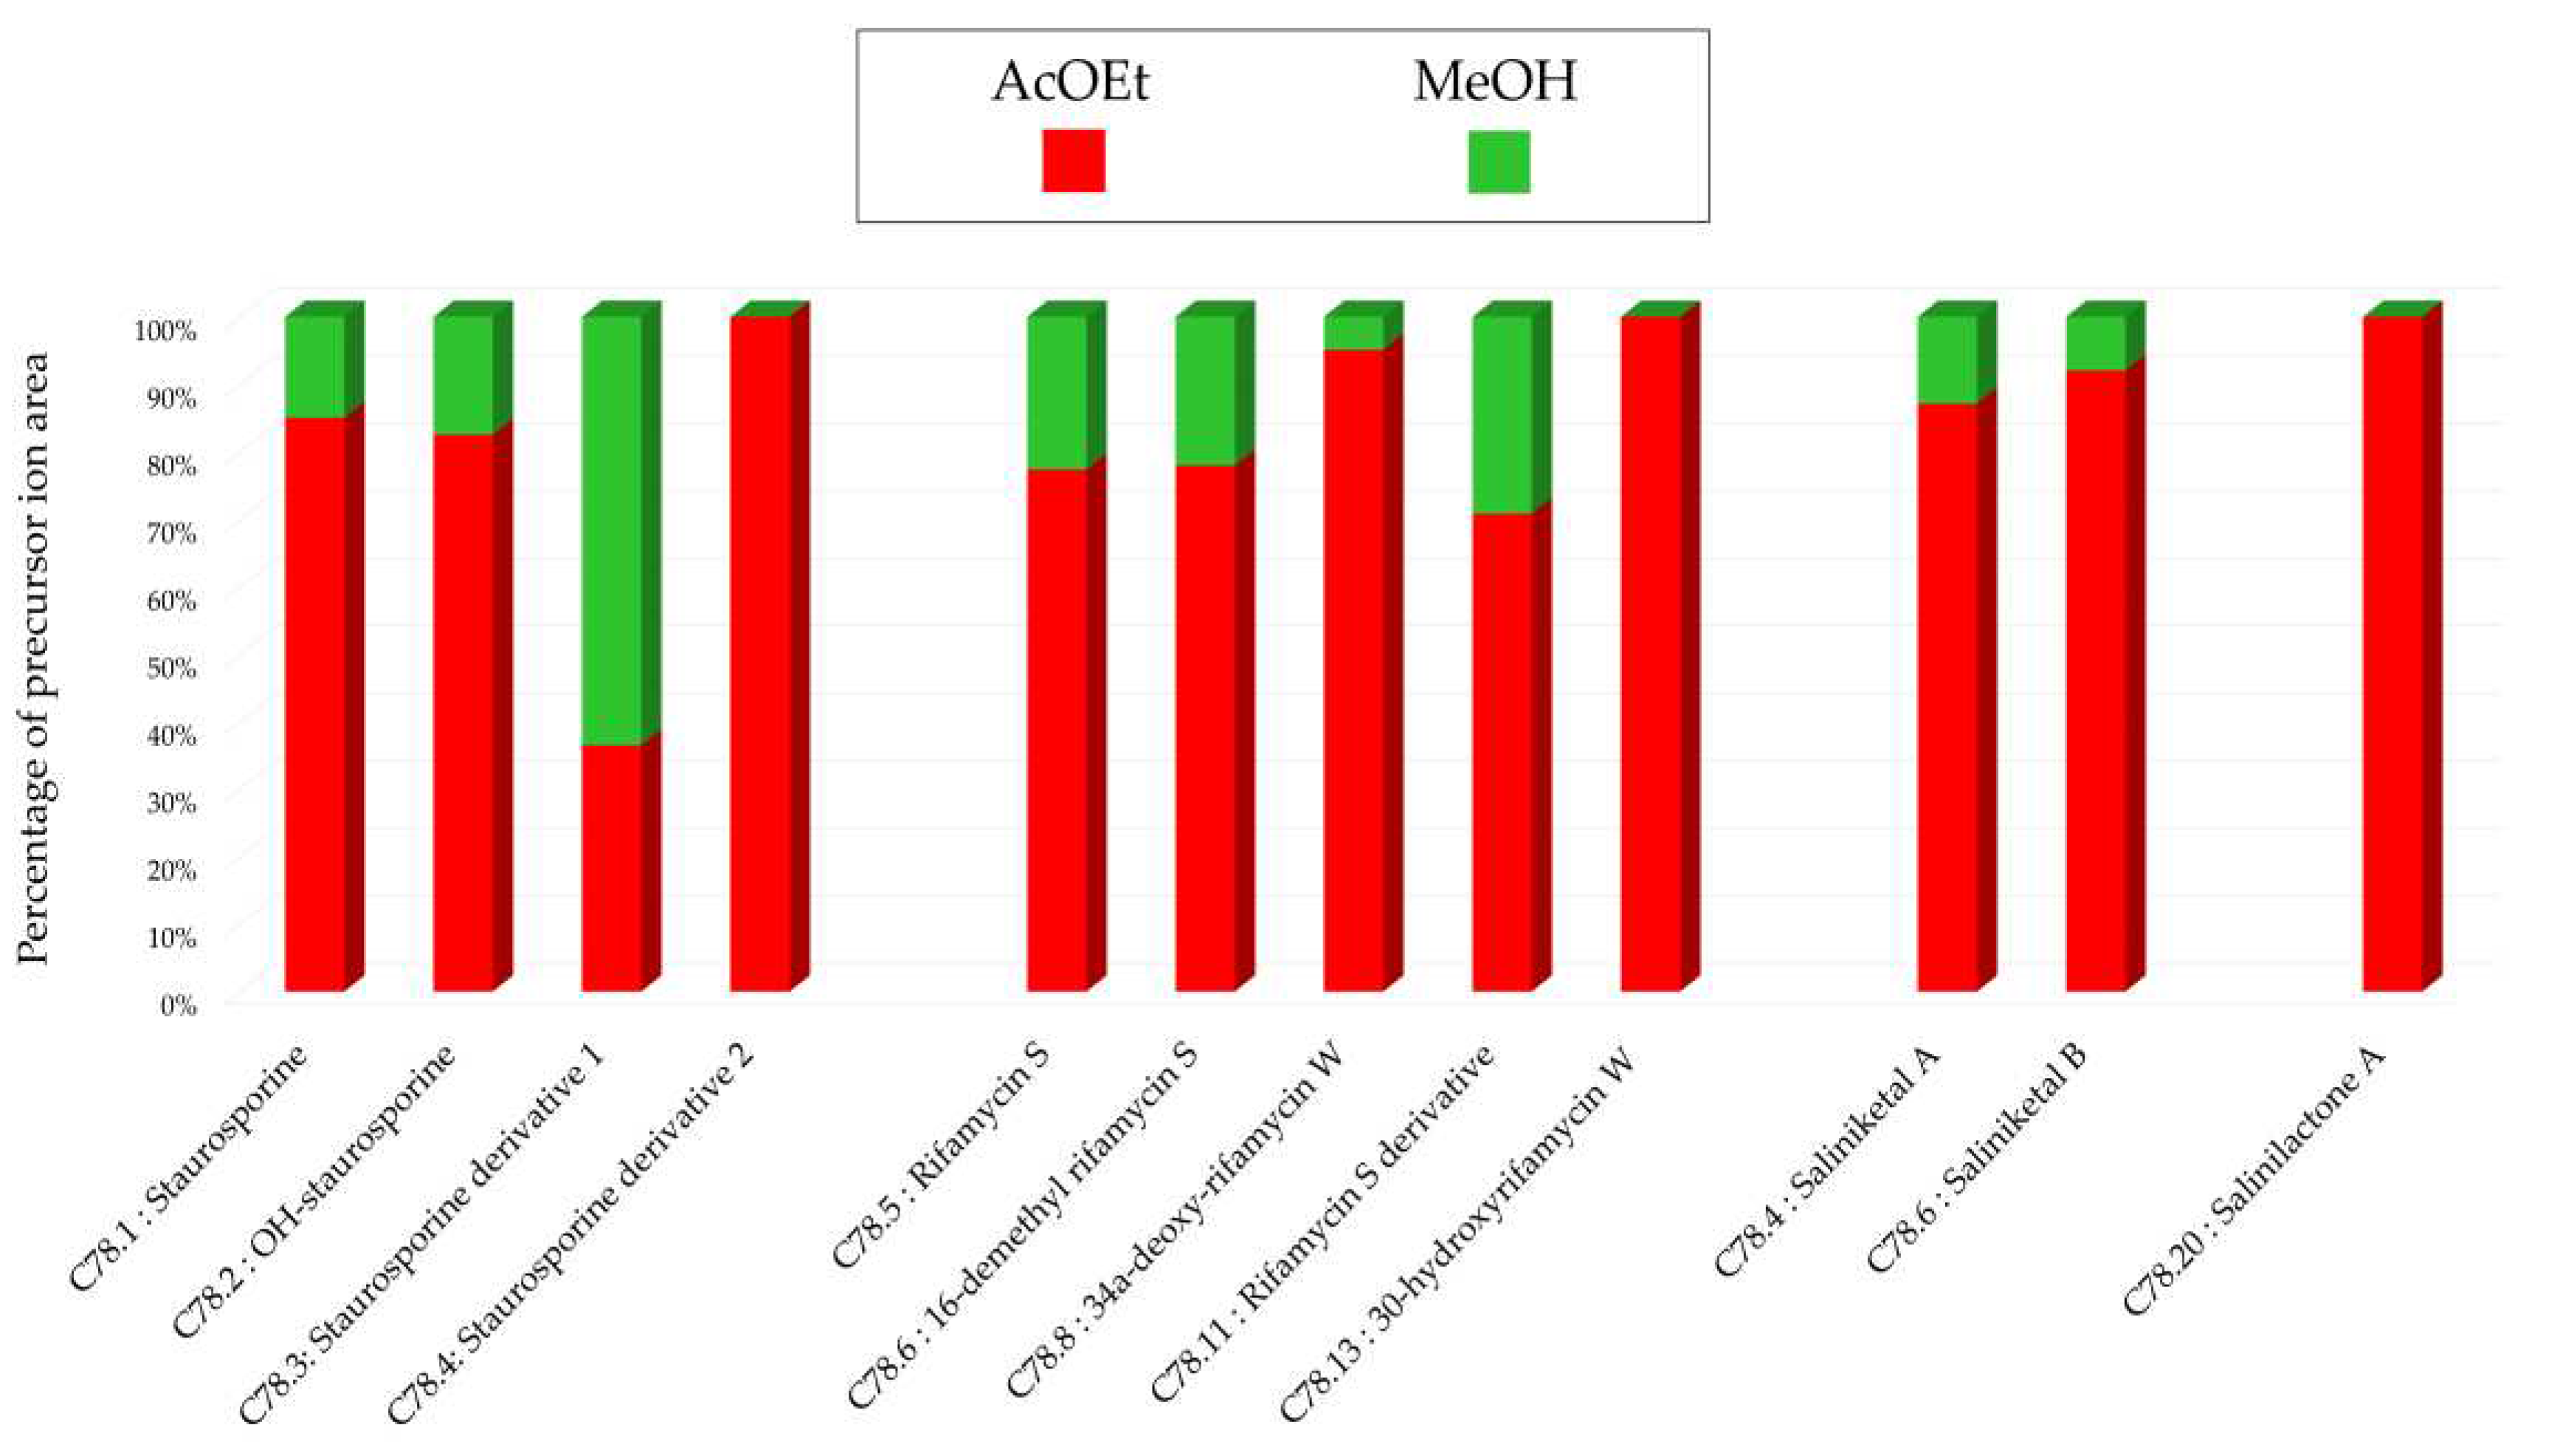
Figure 19.
Biological activity of Salinispora arenicola SH-78 extracts AcOET and MeOH from culture on A1 solid medium for 14 days. (a) Antiplasmodial activities against P. falciparum strain 3D7, tested at 50 µg/mL (dark color) and 10 µg/mL (grey color). Cytotoxic activities against (b) HCT-116 cell line and (c) MDA-MB-231 cell line, tested at 10 µg/mL (dark color) and 1 µg/mL (grey color). The black lines indicate the threshold for considering the extract as promising, with different criteria: > 50% inhibition for antiplasmodial activity and < 50% viability for cytotoxic activity.The results demonstrate a significant difference in biological activity between the two extracts. The AcOEt extract shows 70% antiplasmodial inhibition at 10 µg/mL, while the MeOH extract only 32%. The median inhibitory concentration (IC50) of the AcOEt extract was measured at 2.57 ± 0.90 µg/mL, which is promising for a crude extract. For anticancer activity, both extracts showed very promising results, with very low cell viability tested for the AcOEt extract at a concentration of only 1 µg/mL, with percentages of 2% for HCT-116 (Figure 19.b) and 5% for MDA-MB-231 (Figure 19.c). The MeOH extract also showed promising activity, with viability below 50% at 10 µg/mL for both cell lines.
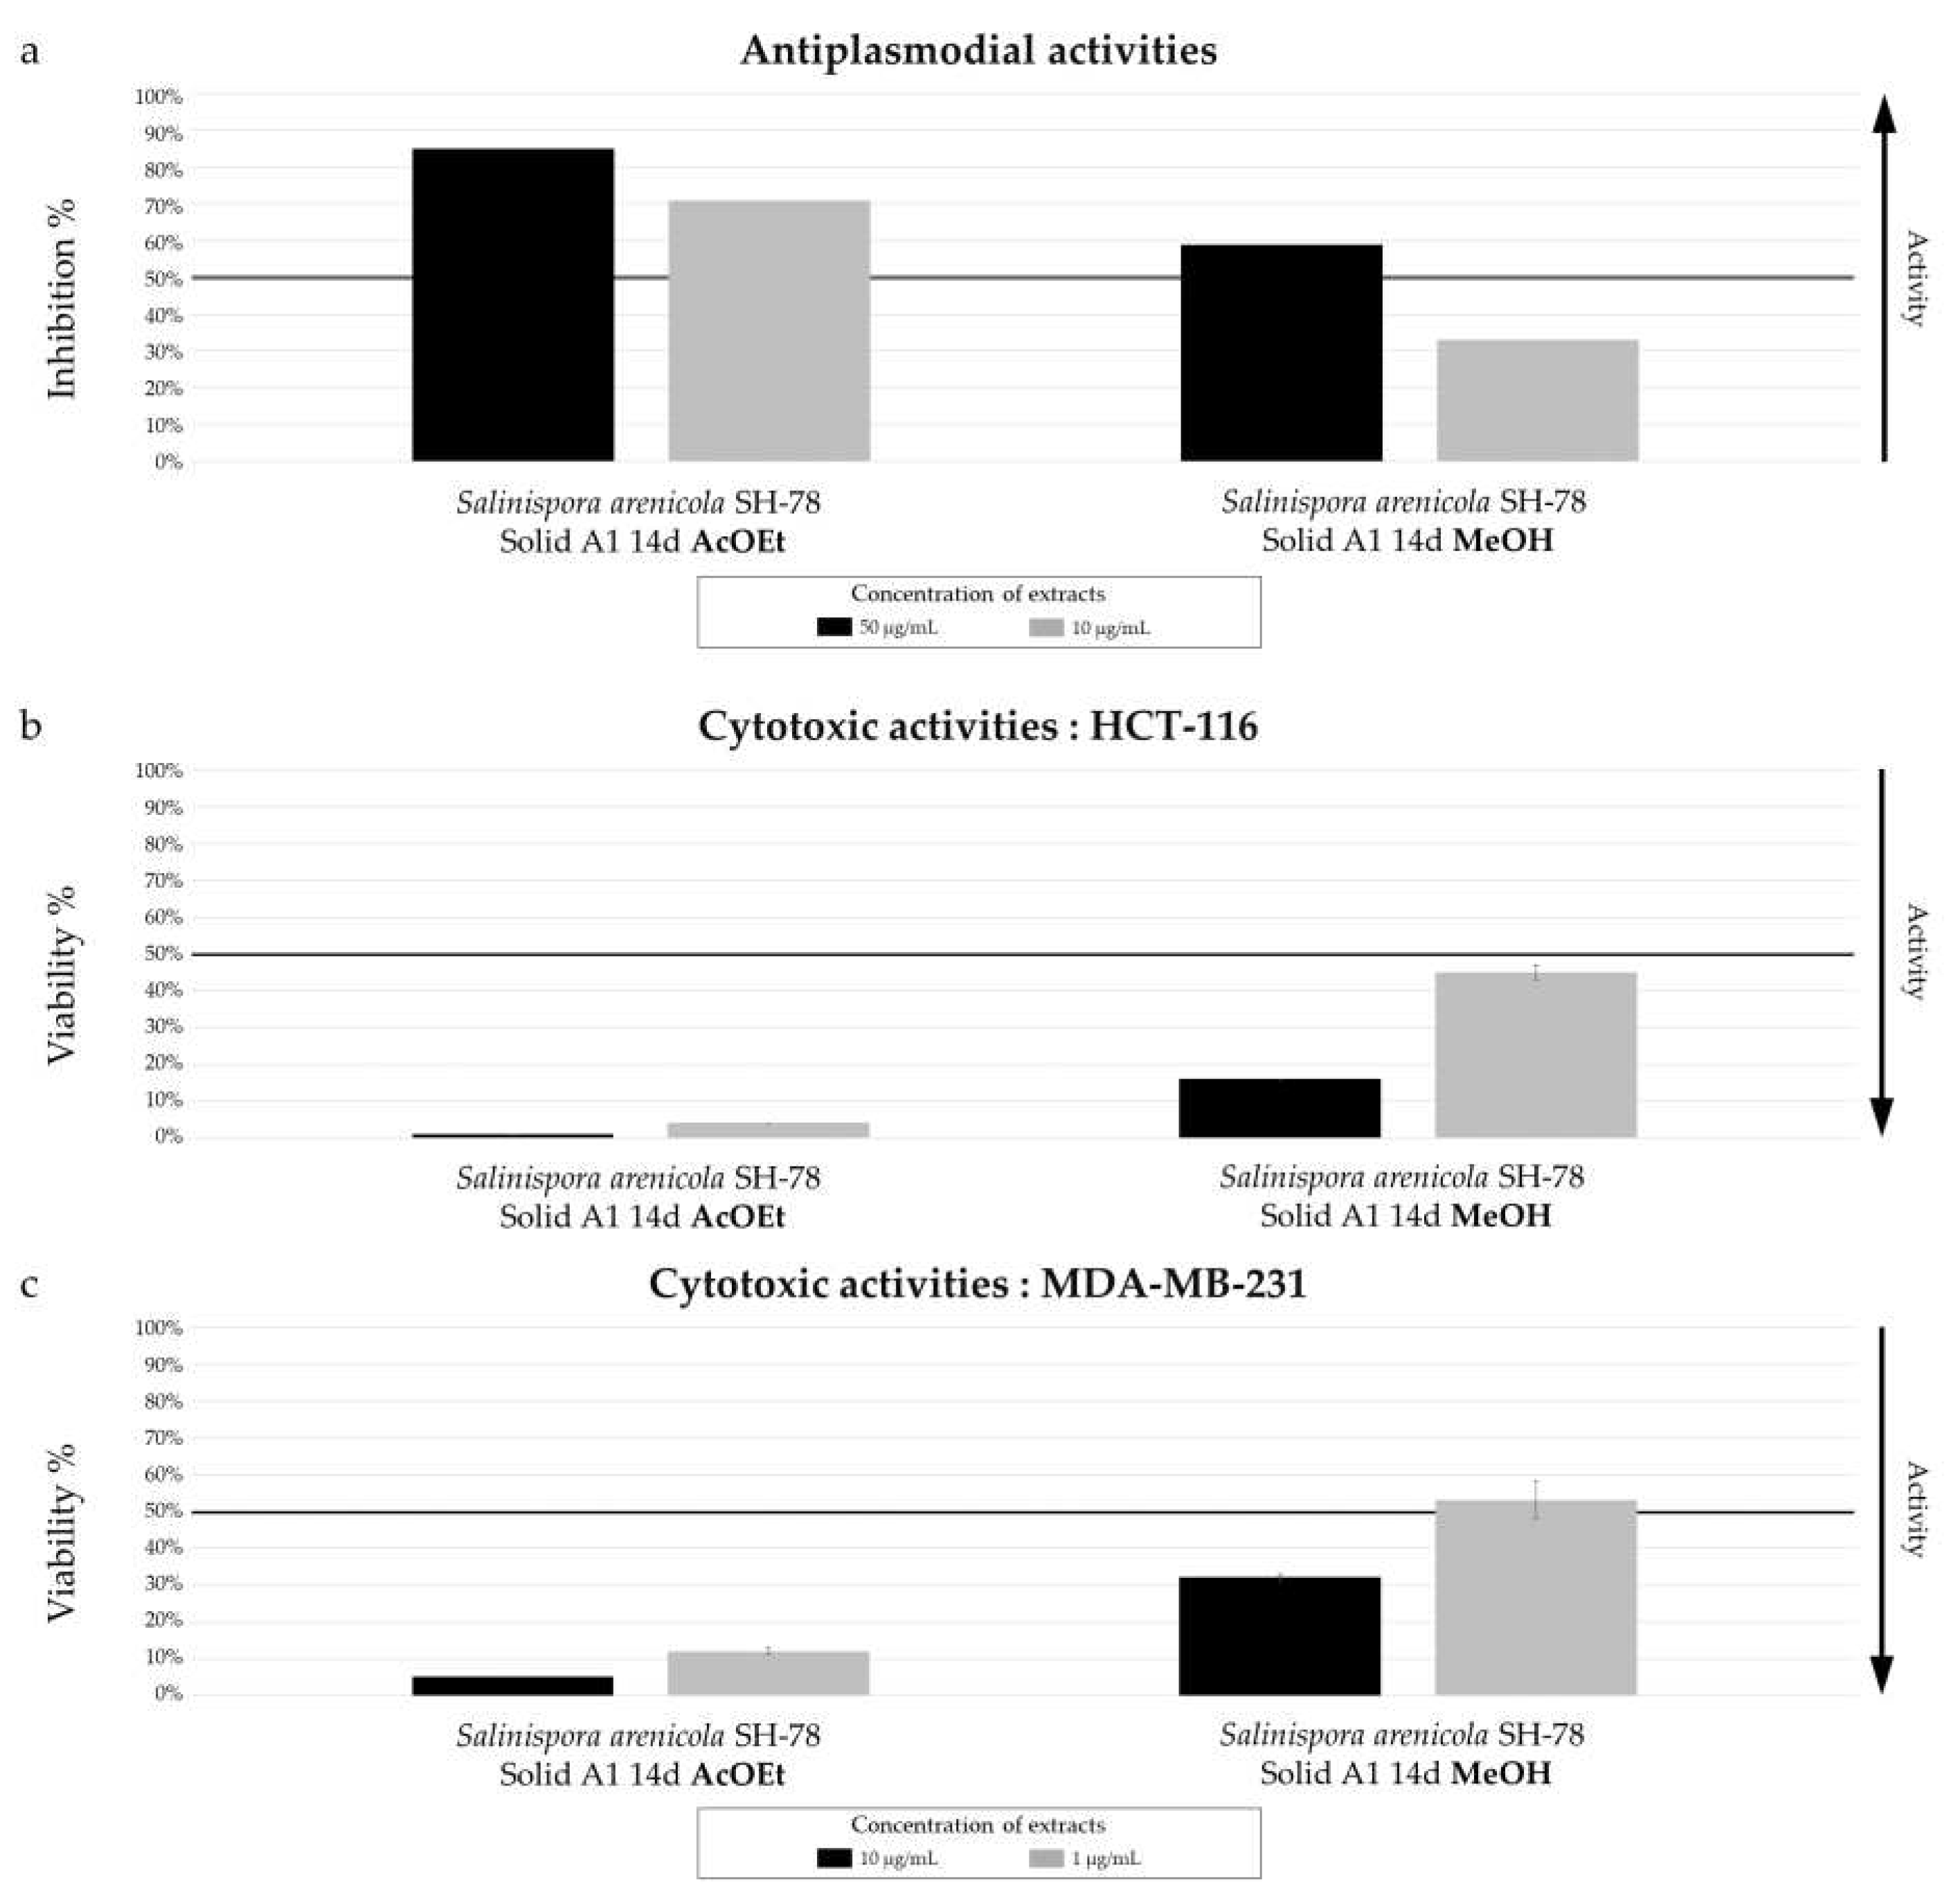

Table 1.
Summary table of annotations from the different extracts of Micromonospora sp. SH-82.
| Compound ID | Molecular formula | Compound name or InChIKey (1,2,3) | Precursor ion area observed in MzMine (with the maximum in bold) according to the culture conditions |
|||||||||||
|---|---|---|---|---|---|---|---|---|---|---|---|---|---|---|
| Medium | A1 | MB | ||||||||||||
| Support | Solid | Liquid | Solid | Liquid | ||||||||||
| Days | 7 | 14 | 21 | 7 | 14 | 21 | 14 | |||||||
| C82.1 | C44H80N2O15 | Megalomicin A (1,3) | 2,0E+02 | 3,0E+03 | 6,6E+03 | 1,0E+02 | 2,0E+02 | 2,0E+02 | 1,0E+02 | 5,0E+02 | ||||
| C82.2 | C45H78N2O17 | Megalomicin B (1,3) | 1,4E+02 | 5,2E+03 | 8,1E+03 | 2,0E+02 | 1,0E+03 | 1,0E+03 | - | 1,5E+03 | ||||
| C82.3 | C47H84N2O16 | 4’-Propionylmegalomicin A (1) | 1,0E+02 | 1,3E+03 | 2,2E+03 | 1,0E+02 | 3,0E+02 | 3,0E+02 | - | 6,0E+02 | ||||
| C82.4 | C48H84N2O17 | Megalomicin C1 (1,3) | 1,0E+02 | 3,5E+03 | 5,7E+03 | 3,3E+03 | 7,1E+03 | 6,7E+03 | - | 1,3E+03 | ||||
| C82.5 | C49H86N2O17 | Megalomicin C2 (1,3) | 1,0E+02 | 1,2E+03 | 1,7E+03 | 1,4E+03 | 3,4E+03 | 3,5E+03 | - | 1,1E+03 | ||||
| C82.6 | C39H69NO14 | 2’-O-Acetylerythromycin A (1) | 5,0E+02 | 8,0E+03 | 5,9E+03 | 6,0E+03 | 9,8E+03 | 1,2E+04 | 5,0E+01 | 4,2E+03 | ||||
| C82.7 | C36H65NO13 | Erythromycin C (1) | 6,7E+03 | 4,8E+04 | 4,9E+04 | 1,8E+04 | 3,0E+04 | 2,7E+04 | 1,0E+03 | 1,3E+04 | ||||
| C82.8 | C36H65NO13 | 13-Deethyl-13-methylerythromycin (1) | 4,8E+03 | 4,2E+03 | 2,0E+03 | 2,1E+04 | 4,5E+04 | 2,8E+04 | 5,0E+02 | 3,0E+03 | ||||
| C82.9 | C36H65NO12 | Erythromycin D (1) | 6,0E+03 | 1,3E+05 | 1,4E+05 | 6,8E+04 | 9,5E+04 | 7,0E+04 | 5,0E+02 | 1,7E+04 | ||||
| C82.10 | C37H67NO12 | Erythromycin B (1,3) | - | 1,5E+03 | 3,2E+03 | - | - | - | - | - | ||||
| C82.11 | C36H65NO12 | 6-Desmethyl erythromycin D (3) | 7,3E+02 | 4,3E+03 | 3,7E+03 | 1,0E+03 | 5,0E+02 | 5,0E+02 | 1,0E+02 | 1,0E+03 | ||||
| C82.12 | C29H53NO9 | 3-O-De(3-C,3-O-dimethyl-2,6-dideoxy-alpha-L-ribo-hexopyranosyl)-6-deoxyerythromycin (1) | - | 3,6E+03 | 5,5E+03 | - | - | - | 2,0E+02 | - | ||||
| C82.13 | C29H53NO9 | - | 8,0E+02 | 1,0E+03 | - | - | - | - | - | |||||
| C82.14 | C36H65NO12 | 6-Deoxy-3'-O-demethylerythromycin (1) | 1,0E+02 | 1,3E+03 | 1,6E+03 | 2,0E+03 | 1,0E+02 | 1,0E+02 | 1,0E+01 | 5,0E+01 | ||||
| C82.15 | C35H63NO13 | Norerythromycin (1) | 5,0E+02 | 1,0E+03 | 5,0E+02 | 5,0E+02 | 1,0E+03 | 1,4E+03 | 1,0E+02 | 1,9E+03 | ||||
| C82.16 | C21H38O7 | Erythronolide B (1) | 7,9E+04 | >2E+05* | >2E+05* | 8,0E+04 | 1,7E+05 | >2E+05* | 6,2E+04 | >2E+05* | ||||
| C82.17 | C20H36O7 | 2-Desmethyl-2-hydroxy-6-deoxyerythronolide B (1) | 1,0E+02 | 1,9E+03 | 1,1E+03 | 2,0E+02 | 7,0E+02 | 5,0E+02 | 5,0E+01 | 2,0E+02 | ||||
| C82.18 | C28H50O10 | 3-O-Alpha-mycarosylerythronolide B (1) | 1,5E+04 | 8,8E+04 | 1,3E+05 | 6,7E+04 | 1,5E+05 | 1,5E+05 | 8,8E+03 | 6,9E+04 | ||||
| C82.19 | C27H48O10 | 3-O-(alpha-L-olivosyl)erythronolide B (1) | 1,7E+03 | 1,2E+04 | 1,6E+04 | 4,2E+03 | 7,9E+03 | 7,3E+03 | 5,0E+02 | 4,3E+03 | ||||
| C82.20 | 5,0E+02 | 1,1E+03 | 2,0E+03 | 5,0E+02 | 1,7E+03 | 2,0E+03 | 5,0E+01 | 3,0E+02 | ||||||
| C82.21 | C21H38O6 | 6-Deoxyerythronolide B (1,3) | 2,5E+04 | 1,2E+05 | 1,4E+05 | 5,3E+04 | 6,9E+04 | 7,3E+04 | 1,5E+04 | 6,7E+04 | ||||
Data from 1 SIRIUS, 2 GNPS or 3 ISDB timaR bioinformatics tools. *saturated values.
Table 2.
Summary table of annotations from the different extracts of Micromonospora sp. SH-57.
| Compound ID | Molecular formula | Compound name or InChIKey (1,2,3) | Precursor ion area observed in MzMine(with the maximum in bold) according to the culture conditions | |||||||||||
|---|---|---|---|---|---|---|---|---|---|---|---|---|---|---|
| Medium | A1 | MB | ||||||||||||
| Support | Solid | Liquid | Solid | Liquid | ||||||||||
| Days | 7 | 14 | 21 | 7 | 14 | 21 | 14 | |||||||
| C57.1 | C11H15N5O3 | 2-Deoxy-N6-methyladenosine (1) | 5,0E+02 | 9,8E+02 | 7,5E+02 | 1,7E+03 | 7,5E+02 | 3,8E+03 | 6,0E+01 | 3,0E+02 | ||||
| C57.2 | C11H15N5O | SXIDRQQQIPLCTJ (1) | 2,0E+02 | 2,0E+02 | 2,0E+02 | 2,0E+03 | 2,0E+03 | 6,8E+03 | - | - | ||||
| C57.3 | C11H13N5O3 | UHYRJPGYRFMFLT (1) | 9,9E+02 | 4,1E+02 | 1,5E+03 | 8,9E+03 | 9,1E+03 | 1,4E+04 | - | - | ||||
| C57.4 | C11H15N5 | 9-cyclopentyl-N-methylpurin-6-amine (1) | 5,5E+03 | 3,7E+03 | 4,1E+03 | 2,1E+04 | 2,0E+04 | 4,5E+04 | 2,8E+02 | 3,4E+03 | ||||
| C57.5 | C12H17N5OS | INPAYTORGXXLMB (1) | 3,7E+03 | 2,4E+03 | 6,4E+03 | 3,5E+04 | 2,7E+04 | 5,2E+04 | 1,0E+02 | 1,4E+03 | ||||
| C57.6 | C14H26N2O5S | JDNYVZBVEBRRCT (1) | 2,0E+02 | 3,0E+02 | 3,0E+02 | 5,0E+02 | 6,3E+02 | 2,4E+03 | - | 3,0E+02 | ||||
| C57.7 | C13H24NO5S | (?)-S-Acetylpantetheine (1) | 4,0E+02 | 1,0E+03 | 1,5E+03 | 6,2E+03 | 3,7E+03 | 7,0E+03 | - | 1,6E+03 | ||||
| C57.8 | C17H30N2O5S | ZCNIMMSEOJFZKZ (1) | - | - | - | 2,0E+02 | 1,3E+03 | 8,2E+03 | - | 1,0E+02 | ||||
| C57.9 | C19H28N2O5S | IXKOTSUCYPEFPP (1) | - | 1,0E+02 | 2,0E+02 | 8,0E+02 | 2,0E+03 | 5,1E+03 | - | 2,0E+02 | ||||
| C57.10 | C9H9NO | Indole-3-carbinol (1,2) | - | - | - | 6,0E+02 | 6,3E+02 | 1,3E+03 | - | - | ||||
| C57.11 | 1,0E+02 | 1,0E+02 | 1,0E+02 | 5,0E+02 | 7,2E+02 | 1,4E+03 | - | - | ||||||
| C57.12 | C13H12O4 | Aloesone (1) | - | 5,0E+01 | 1,0E+02 | 6,9E+03 | 3,1E+03 | 1,7E+03 | - | - | ||||
| C57.13 | C13H14O4 | Aloesol (1) | 5,0E+01 | 5,0E+01 | 5,0E+01 | 2,5E+03 | 6,2E+03 | 1,7E+04 | - | 2,0E+01 | ||||
| C57.14 | C20H23NO2 | Carbazoquinocin C (1,3) | - | - | 9,6E+02 | 8,0E+02 | 8,0E+02 | 6,2E+03 | - | - | ||||
| C57.15 | C21H25NO2 | Carbazoquinocin E (1,3) | - | - | - | - | - | 1,5E+03 | - | - | ||||
| C57.16 | C22H27NO2 | Carbazoquinocin F (1,3) | 5,0E+02 | 7,2E+02 | 4,5E+03 | 5,9E+02 | 6,1E+02 | 1,5E+04 | - | 6,0E+02 | ||||
| C57.17 | C24H31NO2 | 12-Carbazol-9-yldodecanoic acid (1) | - | - | - | - | 5,0E+02 | 7,7E+02 | - | - | ||||
Data from 1 SIRIUS, 2 GNPS or 3 ISDB timaR bioinformatics tools.
Table 3.
Summary table of annotations from the different extracts of Salinispora arenicola SH-78.
| Compound ID | Molecular formula | Compound name or InChIKey (1,2,3) | Precursor ion area observed in MzMine (with the maximum in bold) according to the culture conditions |
||||||||
|---|---|---|---|---|---|---|---|---|---|---|---|
| Solvant | AcOEt | MeOH | |||||||||
| Support | Solid | Liquid | Solid | ||||||||
| Days | 7 d | 14 d | 21 d | 14 d | 14 d | ||||||
| C78.1 | C28H26N4O4 | OH staurosporine (1,2,3) | 2,4E+04 | 6,2E+04 | 1,8E+04 | 4,5E+03 | 1,3E+04 | ||||
| C78.2 | C28H26N4O3 | Staurosporine (1,2,3) | 2,4E+04 | 1,8E+04 | 7,6E+03 | 3,0E+03 | 3,2E+03 | ||||
| C78.3 | C29H28N4O4 | 4'-N-methyl-5'-hydroxy-staurosporine (1) | 1,3E+03 | 2,5E+03 | 9,6E+02 | 9,9E+02 | 4,3E+03 | ||||
| C78.4 | C28H24N4O5 | 4'-demethyl-Af-formyl-7V-hydroxy-staurosporine (1) | 4,0E+02 | 6,5E+02 | 4,5E+02 | - | - | ||||
| C78.5 | C37H45NO12 | Rifamycin S (1,2,3) | 3,0E+02 | 8,4E+03 | 2,5E+02 | 1,6E+04 | 2,5E+03 | ||||
| C78.6 | C36H43NO12 | 16-demethyl rifamycin S (3) | 4,5E+02 | 3,5E+03 | 3,0E+02 | 3,2E+03 | 9,9E+02 | ||||
| C78.7 | C35H45NO10 | 34a-deoxy-rifamycin W (1) | - | - | - | 2,0E+03 | - | ||||
| C78.8 | 4,0E+02 | 1,9E+03 | 3,0E+02 | 7,5E+02 | 1,0E+02 | ||||||
| C78.9 | C34H41NO10 | Proansamycin B (1,3) | 1,0E+03 | 1,0E+03 | 5,0E+02 | 3,0E+02 | - | ||||
| C78.10 | 3,0E+02 | 1,4E+03 | 1,0E+02 | 2,5E+03 | - | ||||||
| C78.11 | C34H41NO11 | Demethyl-desacetyl-rifamycin S (1) | 2,0E+02 | 1,2E+03 | 2,0E+02 | 1,2E+04 | 5,0E+02 | ||||
| C78.12 | C37H45NO13 | 20-hydroxyrifamycin S (1,3) | - | - | - | 1,9E+03 | - | ||||
| C78.13 | C35H42NO12 | 30-hydroxyrifamycin W (1) | 5,0E+01 | 5,6E+02 | - | 7,4E+02 | - | ||||
| C78.14 | C22H37NO5 | Saliniketal A (1,3) | 1,8E+04 | 3,1E+04 | 2,2E+04 | 3,3E+04 | 4,6E+03 | ||||
| C78.15 | C22H37NO6 | Saliniketal B (1,3) | 5,4E+03 | 7,7E+03 | 6,9E+03 | 6,6E+03 | 7,0E+02 | ||||
| C78.16 | C8H10O3 | Salinilactone D (3) | 8,0E+02 | 3,5E+02 | 6,0E+02 | 4,0E+04 | - | ||||
| C78.17 | C9H12O3 | Salinilactone E (3) | - | 6,0E+02 | - | 3,4E+04 | - | ||||
| C78.18 | 9,0E+03 | 7,6E+03 | 7,3E+03 | 1,1E+05 | 2,0E+02 | ||||||
| C78.19 | C10H14O3 | Salinilactone A (3) | 3,0E+02 | 3,0E+02 | 3,0E+02 | 7,0E+03 | - | ||||
| C78.20 | 4,0E+02 | 4,0E+02 | 4,0E+02 | 8,6E+03 | - | ||||||
| C78.21 | 4,0E+02 | 4,0E+02 | 4,0E+02 | 1,0E+04 | - | ||||||
| C78.22 | C11H16O3 | Salinilactone C (3) | 3,0E+03 | 3,7E+03 | 2,5E+03 | 1,4E+04 | - | ||||
| C78.23 | C12H18O3 | Salinilactone H (3) | 1,0E+03 | 2,0E+03 | 8,0E+02 | 1,5E+04 | - | ||||
Data from 1 SIRIUS, 2 GNPS or 3 ISDB timaR bioinformatics tools.
Table 4.
: Microbial strains isolated from Scopalina hapalia ML-263 selected for the study.
| Class | Species | Code strain | Selected Regions for Genetic Characterization |
|---|---|---|---|
| Actinobacteria | Micromonospora sp. | SH-82 | ADNr 16s (from V1 to V5) |
| Micromonospora sp. | SH-57 | ||
| Salinispora arenicola | SH-78 |
Table 5.
: Culture parameters studied for the microbial strains cultures (Micromonospora sp. SH-82, Micromonospora sp. SH-57 and Salinispora arenicola SH-78).
Table 5.
: Culture parameters studied for the microbial strains cultures (Micromonospora sp. SH-82, Micromonospora sp. SH-57 and Salinispora arenicola SH-78).
| Microbial strains | Days | Support | Culture Medium |
|---|---|---|---|
| Micromonospora sp. SH-82 Micromonospora sp. SH-57 | 7/14/21 | Solid/Liquid | A1BFe+C |
| 14 | MB | ||
| Salinispora arenicola SH-78 | 7/14/21 | Solid | A1BFe+C |
| 14 | Liquid |
Disclaimer/Publisher’s Note: The statements, opinions and data contained in all publications are solely those of the individual author(s) and contributor(s) and not of MDPI and/or the editor(s). MDPI and/or the editor(s) disclaim responsibility for any injury to people or property resulting from any ideas, methods, instructions or products referred to in the content. |
© 2023 by the authors. Licensee MDPI, Basel, Switzerland. This article is an open access article distributed under the terms and conditions of the Creative Commons Attribution (CC BY) license (http://creativecommons.org/licenses/by/4.0/).
Copyright: This open access article is published under a Creative Commons CC BY 4.0 license, which permit the free download, distribution, and reuse, provided that the author and preprint are cited in any reuse.


