
Submitted:
12 August 2025
Posted:
13 August 2025
You are already at the latest version
Abstract
Marine microorganisms process significant potential for varied application in the environment, medicine, agriculture and various industries. The nearshore coastal area usually exhibit unique characteristics due to the combined effects of terrestrial runoff, tidal exchange, and human activities, and is a high-incidence area of eutrophication of the seawater. In this study, 16S rRNA amplicon sequencing and functional analysis were used to characterize the bacterial populations in the eutrophic seawater samples from the nearshore S1 site, in which the red-tide frequently occurred in the East China Sea (ECS). Based on the obtained results, the Proteobacteria, Actinobacteria, and Bacteroidetes were identified as the predominant phyla of bacterial populations in station S1. The composition of the bacterial populations of this station showed significantly difference compared with the other five nearshore sites in addition to the taxonomic associations. Functional prediction of bacterial populations via both KEGG and MetaCyc analysis indicated the L-tryptophan biosynthesis pathway related to natural auxin, indole-3-acetic acid (IAA) biosynthesis appeared in the bacterial populations in eutrophic seawater from station S1. By using targeted isolation of the cultivable bacteria, a new red bacterium named S1-TA-50 was recovered, and it was identified as a potential novel species of the genera Sulfitobacter in the family Rhodobacteraceae which is the predominant taxa group for the phycobacterial populations. The new isolate exhibited attracting antibacterial activity against the four model testing pathogenic strains. Additionally, it proved to be a new microalgae growth-promoting bacterium with a substantial IAA production. This study is believed to contribute to the accumulation of scientific information of dynamic of marine bacterial ecosystems in the eutrophic nearshore areas. It is also beneficial for deeper understanding the bacteria roles in marine ecological balance and comprehensive utilization of microbial resources.
Keywords:
Eutrophic seawater
; Marine bacterial populations
; 16S rRNA amplicon sequencing
; IAA-producing bacterium
; Microbial diversity
1. Introduction
Marine microorganisms are essential to the health and balance of marine ecosystems, acting as key carbon fixer through photosynthesis, participate in the global carbon cycle, and also providing the initial energy source for the marine food web [1]. Additionally, they decompose organic matter, pollutants, and biological remains in the ocean, thereby purifying the oceanic environment and maintaining the balance of marine ecology [2]. Furthermore, various marine microorganisms produce unique biologically active substances with significant application potential in the medicine, agriculture, and various industries, such as the research and development of innovative drugs and enzymes [3]. From climate regulation to biotechnology innovation, these tiny organisms play an irreplaceable role in sustaining the health of the planet and human sustainability progress [4]. The spatial patterns of bacterial populations in the oceans are usually influenced by a variety of factors [5]. Variations in latitude, which correspond to changes in temperature, light availability, and other climatic conditions, significantly impact bacterial distribution. Similarly, the distance from the shore, which affects the availability of terrestrial inputs and the degree of human influence, also plays a critical role [6]. Additionally, different environmental gradients, such as salinity, temperature, and nutrient levels, which can vary markedly in coastal waters, contribute to the diverse spatial patterns observed in bacterial populations, as documented in research [7].
Marine microorganisms in nearshore sea areas exhibit unique characteristics due to the combined effects of terrestrial runoff, tidal exchange, and human activities [8]. They display high populations diversity with significant fluctuations, and the abundance of nutrients along with frequent changes in environmental conditions fosters the coexistence of various groups [9]. Dominant populations shift rapidly with the changing seasons and tides. Heterotrophic microbial populations are prevalent, and the influx of large quantities of terrestrial organic matter and biological debris makes them central to the decomposition of organic matter and the driving of material circulation. Their interactions with the environment and other organisms are complex, forming symbiotic relationships with animals and plants [10]. They may also act as potential pathogens affecting farmed organisms and possess a robust capacity for degrading the pollutants in the nature. However, they are significantly impacted by human activities, such as sewage discharge and aquaculture, which can easily disrupt their populations balance and potentially lead to algal blooms or the spread of drug-resistant bacteria, directly affecting the stability of nearshore ecosystems [11].
Given the significant role that bacterial populations play in assessing and maintaining the health of marine habitats, it is imperative to systematically accumulate comprehensive microbiota information [12]. This involves not only cataloging the diversity and abundance of marine bacteria, but also monitoring their dynamic changes over time. By doing so, researchers can uncover the fundamental processes that underpin the biogeographical and ecological patterns of bacterial diversity. This information is vital for developing effective strategies for marine conservation and management, ensuring the long-term sustainability of ocean ecosystems [13]. Also, it’s vital for the full utilization of marine microbial resources for serving the welfare of sustainable development of the human society [14]. In this study, we employed high-throughput 16S rRNA gene sequencing to investigate and compare the biodiversity of bacterial populations of the eutrophic seawater samples and other five sites of the nearshore ECS area. Consequently, after applying the selective isolation procedure for the targeted isolation of the cultivable bacteria, a new red-pigmented bacterium strain designed as S1-TA-50 was recovered from seawater of station S1, which occupied the sea area the red-tide frequently occurs. Strain S1-TA-50 was identified as a potential novel species in the genera Sulfitobacter within the family of Roseobacteraceae, and produced obvious active antibacterial activity. Besides, it demonstrated as a new microalgae growth-promoting bacterium and with a overwhelming productivity of natural auxin indole-3-acetic acid (IAA), which were vital and multifunctional metabolic signaling molecules during the wide-distributed plant-bacteria interactions.
2. Materials and Methods
2.1. Sampler Collection
The seawater samples in six investigated station sites (Figure S1) were collected from the nearshore areas (< 10 m depth) of the East China Sea (ECS) according to the procedure reported previously [10]. Among the sites (Table S1), the station S1 (LO1_E group) is the nearest site away from the island, and it occupies the sea area where the red-tide occurs most frequently [15,16,17]. For the sampling procedure, three samples were collected at three sea levels including the above level at each site. Each seawater sample with 3 L volume was passed through 0.22 μm filter membranes and then stored at -20°C for the further experiments. The environmental factors of the seawater samples were measured by the on-ship CTD equipment including the depth, temperature, conductivity, salinity, oxygen and the fluorescence contents (Table S1).
2.2. DNA Extraction, 16S rRNA Amplicon Sequencing and Data Analysis
The total genomic DNA of the samples were extracted using the Fast Bacterial Genomic DNA Extraction Kit (Sangon Biotech Co., Ltd, Shanghai, China) following the manufacturer’s instructions. The V3-V4 variable region of the bacterial 16S rRNA gene was amplified using a general bacterial primer pair of 338F/806R [18,19,20]. The 16S rRNA sequencing libraries for Illumina sequencing analysis were then constructed with the TruSeq® DNA PCR-Free Sample Preparation Kit (Illumina, San Diego, CA, USA) and subsequently sequenced on a NovaSeq 6000 PE250 platform at BioMajor (Shanghai, China).
To analyze the microbial populations, the QIIME2 script (https://qiime2.org) was employed [21]. Paired-end reads were joined and quality-filtered and the resulting OTUs were clustered using the UCLUST with a 0.97 threshold [22]. ASV or OTU phylotypes were assigned against the QIIME-modified SILVA database (v128) [23], using default parameters.
To compare the α-diversity among the investigated samples, all samples were rarefied to 95% of the minimum sample sequence size to account for differences in sequencing depth. The “qiime diversity alpha” plugin was used to calculate the α-diversity indices, and the R package “ggplot2” was utilized for data visualization [24]. For β-diversity analysis, the PCoA analysis based on Bray-Curtis distance was applied to display group differences, with “ggplot2” employed for visualization [25,26,27].
To identify species and functions with the most significant differences between groups, the Partial Least Squares Discriminant Analysis (PLS-DA) method was applied [28]. Visualization was performed using the ggplot2 package. Based on the relative abundance of the main microbial species, the co-occurrence network analysis was conducted by calculating the Spearman rank correlation coefficient. Correlations with p < 0.05 and |r| > 0.6 were retained, and gephi software was used for graphing [29]. Data visualization was further achieved using “qcorrplot” in the “linkET” package and a heatmap was generated with “pheatmap” in the R package [30].
2.3. Seclective Isolation of the Cultivable Bacterial Strains
The selective isolation of cultivable bacterial strains from the seawater was performed using our previously reported CECS procedure [18]. Briefly, marine broth (MB) or marine agar (MA) media containing 5.24 g/L HEPES as a buffering agent and 300 mL/L concentrated artificial seawater, were adjusted to a pH of 7.2±0.1. The nanoscale composite gels were pretreated with micro-nutrients and added to 12-well microplates at a final concentration of 0.251 g/L. Ten microliters of 1:10 serially diluted samples were added to triplicate 1-mL microwells. The microplates were incubated at 28±1.0°C for 5-10 days. Ten microliters of culture were spread on MA plates and cultured at 28 ± 1.0°C. The bacterial isolates were subjected to further purification and maintained on MA slant tubes for short-term use or preserved as a 25% (v/v) glycerol suspension at -80°C for long-term preservation.
2.4. Molecular Identification of Bacterial Strains
The related 16S rRNA gene sequences of PCR species within the genus Mameliella and type strains from the family Rhodobacteraceae were retrieved from the NCBI database. Identification of phylogenetic neighbors and calculation of the pairwise 16S rRNA gene sequence similarities were accomplished using the EzTaxon-e server (http://eztaxon-e. ezbiocloud.net, accessed on May 16, 2025). Sequence alignments were conducted using CLUSTAL_X [32]. Phylogenetic trees were reconstructed using the maximum-likelihood (ML) algorithm in the MEGA software package, version 7.0 [33].
2.5. Culture Optimization of Bacterial Strain
For bacterial culture optimization, 1 mL of 24 h fresh bacterial culture of the tested strain was taken and mixed with 24 mL of fresh 2216 medium. Then, a 150 μL of the mixture was added into the wells of the 96-well microplate containing different carbon sources and cultured with shaking at 60 rpm/min [34]. During different culture period, bacterial growth was measured by recording the OD600nm change every four hours. Ten carbon sources including the cellbiose, fructose, galactose, glucose, glycerol, lactose, maltose, mannose, sucrose, and trehalose, and the pH value range of 5.0–9.0 were used for the measurements [35].
2.6. Bioactivity Measurements of Bacterial Isolates
2.6.1. Antibacterial Bioactivity Measurements
The tested strains were routinely cultured on MA (Difco, BD), and cultivated for 4-10 days at 25 °C, and cultivated on the same medium in slant tubes and maintained as a glycerol suspension (30%, v/v) and stored at -80 °C for long term preservation. The antimicrobial activity were determined against two Gram-positive bacterial strains, Staphylococcus aureus ATCC 12600, Bacillus subtilis ATCC 6051, and Escherichia coli ATCC 25922, and one yeast Candida albicans ATCC 10231 using a standard microplate assays [36]. Minimum inhibitory concentration (MIC) studies were performed according to the standard reference method [37]. All the results are expressed as the means ± SD. The statistics significance was analyzed using t-test in SPSS Statistics (version 17.0) and plotted with Origin (verstion 8.0) [38]. A value of p < 0.05 was considered statistically significant.
2.6.2. Evaluation of Microalgae Growth-promoting Bioactivity
Microalgae growth-promoting (MGP) activity of bacterial strains toward a model microalgae, algal strain LZT09 in a co-culture system was evaluated as reported previously [39]. The evaluation of the effects on bacterial growth were analyzed by measuring the optical changes of bacterial density recorded at OD600nm and performed in a SpectraMax M2 model 96-well microplate reader (Molecular Devices, LLC, San Jose, Ca, USA). All the results are expressed as means ± SD.
2.6.3. IAA-producing Bacterial Strains Screening
The bacterial isolates were screened for indole-3-acetic acid (IAA) production using the colorimetric assay following the protocol reported previously [40]. Briefly, the bacterial strain was cultured in Erlenmeyer flasks with 50 mL MB supplemented with 1 g/L L-tryptophan at 28 ± 0.5 °C for 7 days at 150 rpm. Then, the cell cultures were centrifuged at 6,000 rpm for 10 min at 4 °C, and 1 mL of each supernatant was mixed with 2 mL of reaction reagent (1 mL of 0.5 mM FeCl3, and 49 mL of 35% HClO4). The mixture was then reacted for 30 min in the dark at 28 ± 0.5 °C, and then the resulting absorbance in the mixture was measured with the change of optical density and recorded at OD530nm. The concentration of IAA produced was calculated using the constructed IAA standard curve, and all determinations were performed in at least triplicate.
3. Results and Discussions
3.1. Characterization of Biodiversity of Bacterial populations of Six Sites
Based on 16S rRNA high-throughput sequencing analysis, a total of 2,756,337 sequences were obtained for all samples, and the filtered denoising data were shown in the Table S2. The Rarefaction Curves and Shannon index were plotted to evaluate the sequencing depth. The Shannon curve of each sample was also saturated. Compared with the other five stations investigated in this study, the total number of taxa at each taxonomic level of bacterial populations in the seawater of the station S1 (LO1_E group) demonstrated obviously different feature, which far surpassed other samples in the other five stations (Figure 1A).
The bacterial populations at the phylum level were found to be dominated by Firmicutes (63.7% to 96.5%). However, for the station S1 (LO1_E group), Proteobacteria was the predominant phylum (69.8%), followed by Actinobacteria (14.6%) and Bacteroidetes (9.7%) (Figure S2). Similarly, at the family level, bacterial populations of the seawater in station S1 also showed distinct characteristics. Only three family including Rhodobacteraceae (19.2%), Mycobacteriaceae (8.80%) and Flavobacteriaceae (6.15%) were found as the dominant groups (>5%) for the station S1 (Figure 1B). Additionally, total 32 family which were occupied over 1% but less than 5% were also found (Table S3). Meanwhile, bacterial populations in the other five sites all possessed three family, Lactobacillaceae, Streptococcaceae and Enterococcaceae as the dominant groups (Figure 2B).
The α-diversity was then analyzed with six indexes including the chao1, simpson, shannon, pielou, observed_species and faith_pd (Table S4). It’s found that, among the six stations investigated in this study, the indexes of the station S1 (LO1_E group) were obviously higher, or significantly different (all p <0.0001), compared with those of the other five nearshore sites (Figure 2). It indicated that the abundance and diversity of bacterial populations in the S1 station site in were apparently higher than those of the other five sites.
3.2. Functional Prediction of Bacterial populations of Six Station Sites
The biological functions of the bacterial populations of the six investigated nearshore stations were predicted using KEGG pathways [41] analysis and MetaCyc analysis [42]. KEGG annotation (Figure 3A, Pane a) indicated that the Metabolism pathway (averaging 78.6%) was the primary cluster among the k1-level pathway, followed by Genetic Information Processing (10.6%) (Table S5). Additionally, the k2-level pathways were predominantly associated with carbohydrate metabolism (10.2%), amino acid metabolism (9.8%), and metabolism of cofactors and vitamins (8.7%) (Figure S6).
For MetaCyc analysis (Table S6), the top five pathways with the highest abundance at the level 2 of the MetaCyc analysis (Figure S7) were identified as nucleoside and nucleotide biosynthesis, amino acid biosynthesis, fatty acid and lipid biosynthesis, cofactor, prosthetic group, electron carrier, and vitamin biosynthesis in the biosynthesis category, and fermentation in the general of precursors metabolite and energy category, respectively (Figure 3A, Pane b). Additionally, the predicted TRPSYN-PWY pathway for bacterial L-tryptophan biosynthesis based on the MetaCyc analysis (Figure 3B). Tryptophan is a precursor for the biosynthesis of indole-3-acetic acid (IAA), a crucial plant hormone, through a well-established tryptophan-dependent pathway. tryptophan is primarily converted to indole-3-pyruvate (IPA) and then to IAA, or it can be converted to indole-3-acetamide (IAM) and then to IAA [43,44,45].
To reveal the common and unique species among different groups, a Venn diagram was drawn based on the ASV/OTU abundance data. Based on the obtained result (Figure 3C), among the six stations surveyed, total 15,629 species were found. Among them, only 23 (about 0.14%) were shared species, while, the number of unique species in station S1 (LO1_E group) was as high as 10,910, accounting for 99.8% of the total number of species of this station. For the differences in the spatial populations and functions of the bacterial populations, the phyla and function of the bacterial populations of the seawater in the six stations were further explored using OPLS-DA analysis. Six taxa biomarkers at the genus level including Mycobacterium, Ascidiaceihabitans, Lactobacillus, Pediococcus, Streptococcus, and Enterococcus were obtained (Figure 3D, Pane a), and found significant differences (p < 0.01) of the abundance of these biomarkers. Among them, the S1 station (LO1_E group) obviously clustered into a separated group (Figure 3D, Pane b).
3.3. Taxonomic Associations of Bacterial Diversity in Different Samples
In order to analyze the relationships among the bacterial populations in the investigated sites, the co-occurrence network was constructed. It’s interesting to note that two independent unclassified-Rhodobacteraceae taxonomic units were found in the co-occurrence network for different stations sites (Figure 4B). In the group I only formed by the taxa units all from the S1 (LO1_E group) station site, the first unclassified-Rhodobacteraceae taxonomic unit demonstrated strong positive correlations with most of the other taxa units in this unique group. However, in the second group (group II), the six unique taxa units which were all from the S1 station site obviously formed a separated group (subgroup a) and showed strong positive intra-species association. The subgroup a was found to be centered with an unclassified-Rhodobacteraceae taxonomic unit, which demonstrated positive associations with all taxonomic units within the species from the S1 station, and negative associations with all taxonomic units outside of the S1 (LO1_E group) station (Figure 4B). This observation confirmed the unique characteristic of the bacterial diversity in the samples from the S1 station. Therefore, the seawater samples in S1 station was also designated as a target for the selective isolation and cultivation of the culturable bacteria.
3.4. Phylogenetic Analysis of Cultivable Bacteria Recovered from S1 Station
Based on our CEFC procedure for targeted isolation of marine Roseobaceter clade members [46,47], total 42 cultivable strains were isolated from the seawater samples in S1 (LO1_E group) station. After the bacterial isolation, the further discovery of new bacterial species which is regarded as an important part of the study of marine microbial biodiversity [48,49,50,51] was them performed. Phylogenetic analysis based on bacterial 16S rRNA gene revealed that one isolate, designed as strain S1-TA-50, exhibited gene similarity of 96.35% to type species of Sulfitobacter porphyrae SCM-1T [52]. The value was less than the threshold values (98.65%) for novel species identification [53]. Based on the phylogenetic tree constructed by 16S rRNA gene of strain S1-TA-50 and closely related type strains within the family Rhodobacteraceae and Roseobacteraceae which was separated from the Roseobacter clade and formed a new family in 2021, strain S1-TA-50 formed a distinct separate phylogenetic line and clustered with other three strains, S1-TA-3, S1-TA-44 and S1-TA-41 which were all isolated from S 1 station (Figure 5). Thus, it can infer that strain S1-TA-50 potentially represent a new species of genera Sulfitobacter with the family Rhodobacteraceae. Additionally, it’s interesting to note that, among the type strains of the genera Sulfitobacter, six bacteria including S. porphyrae, S. algicola, S. alexandrii, S. pseudonitzschiae, S. undariae and S. pacificus were all discovered from natural phycosphere niche. It may indicate some intrinsic relationship between these Sulfitobacter members and those harmful-algal blooming (HAB)-causing algae [54,55,56,57].
Strain S1-TA-50 was observed to form lightly red colonies when grown on MA at 28 °C for 2 days. Cells of strain S1-TA-50 were Gram-negative, rod-shaped with polyhydroxyalkanoate (PHA) granules inside (Figure 5A) [58,59,60]. It’s motile, aerobic and weak positive for anaerobic growth. Ultrastructural observation by transmission electron microscopy (TEM) showed that the cells of strain S1-TA-50 were approximately 0.3–0.5 μm wide and 1.2–1.8 μm long. Growth occurred at 15–37 °C and pH 5–10 in the presence of 1–4% (w/v) NaCl.
3.5. Bioactivity Assays of the Cultivable Bacterial Strains of S1 Station
After the preparation crude extracts of bacterial metabolites of four strains, S1-TA-3, S1-TA-41, S1-TA-44 and S1-TA-50, they were evaluated for antimicrobial activities. The obtained results were showed in Table 1. It can be seen that both three strains, S1-TA-41, S1-TA-44 and S1-TA-50, all exhibited various inhibitory activities against four model testing pathogens strains, including Bacillus subtilis (B. subtilis) ATCC 6051, Staphylococcus aureus (S. aureus) ATCC 12600, Candida albicans (C. albicans) ATCC 10231 and Escherichia coli (E. coli) ATCC 25922. However, the extracts from strain S1-TA-3 exhibited no obvious inhibitory effect on four test bacterial strains. Strain S1-TA-50 exhibited the highest antimicrobial activity among the four strains recovered from the S 1 station, the elucidation of the detail chemical structures of the bioactive metabolites of these new bacterial strains are in progress.
3.6. Culture Optimization of IAA Production by Strain S1-TA-50
Based on the screening assay, strain S1-TA-50 was found positive for IAA production. IAA is regarded as a vital component of the plant-bacteria joint extracellular matrix [61,62,63]. In both macro- and microalgae, IAA influences a range of physiological and developmental processes, including algal growth regulation, morphogenesis, reproduction and stress responses. As a result of the vital role of IAA in shaping plant and algae development, their associated bacterial populations have evolved intricate ways to manipulate IAA levels. In this sense, several algae-associated bacteria are known to synthesize and exude IAA, influencing several aspects of algae-bacteria interactions [64,65,66].
Preliminary experiment showed that both of the pH value and the type of carbon source in the media were identified as two candidate influencing factors affecting the indole-3-acetic acid (IAA) production in strain S1-TA-50. Therefore, ten alternative carbon sources and a pH range were used for the furthering bacteria culture optimization. The pH tests revealed that strain S1-TA-50 showed better bacterial growth when cultured at a pH range of 8.0-9.0 (Figure 6A). In addition, the fastest bacterial growth was achieved when the glucose was used as the sole carbon source in culture medium with a pH value of 9.0 (Figure 6B). However, the IAA accumulation profiling in strain S1-TA-50 indicated that the highest IAA yield was obtained when cultured at a pH of 9.0 when cultured after a total 60 h incubation (Figure 6C). Consequently, under the optimized conditions, strain S1-TA-50 reached the maximum peak for the bacterial growth after 60 hours (Figure 6C, pane a), and the highest IAA yield of 51.25 ± 6.47 μg/mL was achieved when glucose (10 g/L) was used as the carbon source, and cultured at 28 °C with a pH 9.0 in the initial medium for bacterial culture (Figure 6C, pane b). This suggests that increasing the medium pH enhances bacterial growth and IAA accumulation in the strain S1-TA-50. These findings is believed to laid good basis for the subsequent large-scale cultivation for the IAA production.
Figure 6. Culture
optimization of bacterial growth and IAA production of strain S1-TA-50. Effects
of different pH (Pane A) and carbon sources (Pane B) on bacterial growth were
recorded at OD600nm (Pane A and B). The accumulation curves of the
bacterial growth measured by cell number counting (pane a) and IAA production
(pane b) under the optimized culture condition (Pane C).
4. Conclusions
In this study, 16S rRNA amplicon sequencing analysis revealed the unique distribution manner of bacterial populations in eutrophic seawater of station S1 in the nearshore of East China Sea area. Functional prediction of the bacterial populations of station S1 via KEGG and MetaCyc analysis indicated the L-tryptophan biosynthesis pathway related to indole-3-acetic acid (IAA) biosynthesis. A new red-pigmented bacterium named S1-TA-50 was recovered after selective isolation of cultivable bacteria, and identified as a novel species in the genera of Sulfitobacter of Rhodobacteraceae. It demonstrated obvious antibacterial activity against four test four pathogens, and also proven a new microalgae growth-promoting bacterium with high IAA production after culture optimization. This study will to contribute to accumulation of scientific information of dynamic of marine bacterial ecosystems in the eutrophic nearshore areas, and beneficial for deeper understanding bacteria roles in marine ecological balance and comprehensive utilization of microbial resources.
Supplementary Materials
The following supporting information can be downloaded at the website of this paper posted on Preprints.org, Table S1: Grouping information and environmental parameters data of the six sampling station sites in this study; Table S2: Statistics of the sequencing data for each sample in six stations; Table S3: Statistical table of species taxonomic annotation results; Table S4: Summary of six indexes data for α-diversity analysis for each samples in six stations; Table S5: KEGG abundance data of the samples; Table S6. MetaCyc abundance data of the samples; Figure S1. Schematic diagram of the sampling station sites in this study. Figure S2: Relative abundance of the top 20 bacterial taxa at the phylum level for each sample of the six station sites; Figure S3: Relative abundance of the top 20 bacterial taxa at the family level for each sample of the six station sites; Figure S4: Relative abundance of the top 20 bacterial taxa at the genera level for each station site; Figure S5. GraPhlAn evolutionary tree at the phylum level.; Figure S6: Species taxonomic hierarchy tree with abundance information of bacterial diversity of six stations; Figure S7: Comparison of the relative abundance of KEGG pathways; Figure S8. Comparison of the relative abundance of MetaCyc pathways.
Author Contributions
Conceptualization, X.Z. and Q.Y.; methodology, J.L. and B.L.; validation, J.L., B.L. and B.O.; formal analysis, J.L.; investigation, J.L.; resources, X.Z. and Q.Y.; data curation, J.L., B.L. and B.O.; writing—original draft preparation, J.L.; writing—review and editing, X.Z. and Q.Y.; project administration, X.Z. and Q.Y.; funding acquisition, X.Z. and Q.Y. All authors have read and agreed to the published version of the manuscript.
Funding
This work was supported by and the Natural Science Foundation of Zhejiang (LY23D060005), the Project from Municipal Science and Technology Bureau of Zhoushan (2022C41018), the NSFC (41876114), and the National Training Program of Innovation and Entrepreneurship for the Undergraduates.
Institutional Review Board Statement
Not applicable.
Informed Consent Statement
Not applicable.
Data Availability Statement
The datasets presented in this study can be found in online repositories. The accession number of the repository of is PRJNA772089.
Acknowledgments
The authors sincerely thank the support of the Joint Internship Program in the Yangtze River Estuary and Adjacent Sea Areas for the Undergraduates implemented in August, 2023, for seawater sampling assistance.
References
- Arrigo, K. R. Marine microorganisms and global nutrient cycles. Nature 2005, 437, 349–355. [Google Scholar] [CrossRef]
- Landry, Z.C.; Vergin, K.; Mannenbach, C.; Block, S.; Yang, Q.; Blainey, P.; Carlson, C.; Giovannoni, S. Optofluidic Single-Cell Genome Amplification of Sub-micron Bacteria in the Ocean Subsurface. Front. Microbiol. 2018, 9, 1152. [Google Scholar] [CrossRef]
- Pietra, F. Secondary metabolites from marine microorganisms: bacteria, protozoa, algae and fungi. achievements and prospects[J]. Nat.Prod. Rep. 1997, 14, 453–464. [Google Scholar] [CrossRef] [PubMed]
- Sunagawa, S.; Coelho, L.P.; Chaffron, S.; Kultima, J.R.; Labadie, K.; Salazar, G.; Djahanschiri, B.; Zeller, G.; Mende, D.R.; Alberti, A. Structure and function of the global ocean microbiome. Science 2015, 348, 1261359. [Google Scholar] [CrossRef] [PubMed]
- König, G.M.; Kehraus, S.; Seibert, S.F.; Abdel-Lateff, A.; Müller, D. Natural products from marine organisms and their associated microbes. Chembiochem. 2006, 7, 229–38. [Google Scholar] [CrossRef]
- Wasserstrom, H.; Kublik, S.; Wasserstrom, R.; Schulz, S.; Schloter, M.; Steinberger, Y. Bacterial populations composition in costal dunes of the Mediterranean along a gradient from the sea shore to the inland. Sci Rep. 2017, 7, 40266. [Google Scholar] [CrossRef]
- Lian, K.; Liu, F.; Li, Y. , Wang, C.; Zhang, C.; McMinn, A.; Wang, M.; Wang, H. Environmental gradients shape microbiome assembly and stability in the East China sea. Environ. Res. 2023, 238, 117197. [Google Scholar] [CrossRef]
- Ouyang, L.; Chen, X.; Zhang, W.; Li, S.; Huang, Q.; Zhang, Y.; Yan, C.; Li, S. High Throughput Sequencing Reveals Distinct bacterial populations and Functional Diversity in Two Typical Coastal Bays. J. Mar. Sci. Eng. 2022, 10, 1878. [Google Scholar] [CrossRef]
- Zhang, M.; Jiang, R.; Zhang, J.; Li, K.; Zhang, J.; Shao, L.; He, W.; He, P. The impact of imta on the spatial and temporal distribution of the surface planktonic bacteria populations in the surrounding sea area of Xiasanhengshan Island of the East China Sea. J. Mar. Sci. Eng. 2023, 11, 476. [Google Scholar] [CrossRef]
- Wang, Z.; Xie, P.; Dai, J.; Zhang, L.; Yang, Q.; Zhang, X.; Yang, X. Variation in Structure and Functional Diversity of Surface Bacterioplankton populations in the Eastern East China Sea. J. Mar. Sci. Eng. 2024, 12, 69. [Google Scholar] [CrossRef]
- Cui, Z.; Du, D.; Zhang, X.L.; Yang, Q. Modeling and Prediction of Environmental Factors and Chlorophyll a Abundance by Machine Learning Based on Tara Oceans Data. J. Mar. Sci. Eng. 2022, 11, 1749. [Google Scholar] [CrossRef]
- Behzad, H.; Ohyanagi, H.; Alharbi, B.; Ibarra, M.; Alarawi, M.; Saito, Y.; Duarte, C.M.; Bajic, V.; Mineta, K.; Gojobori, T. A cautionary signal from the Red Sea on the impact of increased dust activity on marine microbiota. BMC Genomics 2022, 23, 277. [Google Scholar] [CrossRef]
- Sunagawa, S.; Acinas, S. G.; Bork, P.; Bowler, C.; Tara Oceans Coordinators, Eveillard, D. ; Gorsky, G.; Guidi, L.; Iudicone, D.; Karsenti, E.; et al. Tara Oceans: towards global ocean ecosystems biology. Nat. Rev. Microbiol. 2020, 18, 428–445. [Google Scholar] [CrossRef]
- Sunagawa, S.; Coelho, L.P.; Chaffron, S.; Kultima, J.R.; Labadie, K.; Salazar, G.; Djahanschiri, B.; Zeller, G.; Mende, D.R.; Alberti, A.; Cornejo-Castillo, et al. Ocean plankton. Structure and function of the global ocean microbiome. Science, 2015, 348, 1261359. [Google Scholar] [CrossRef] [PubMed]
- Zhang, X.L.; Tian, X.Q.; Ma, L.Y.; Feng, B.; Liu, Q.H.; Yuan, L.D. Biodiversity of the symbiotic bacteria associated with toxic marine dinoflagellate Alexandrium tamarense. J. Biosci. Med. 2015, 3, 23–28. [Google Scholar] [CrossRef]
- Zhang, X.L.; Ma, L.Y.; Tian, X.Q.; Huang, H.L.; Yang, Q. Biodiversity study of intracellular bacteria closely associated with paralytic shellfish poisoning dinoflagellates Alexandrium tamarense and A. minutum. Int. J. Environ. Resour. 2015, 4, 23–27. [Google Scholar] [CrossRef]
- Yang, Q.; Jiang, Z.; Zhou, X.; Zhang, R.; Xie, Z.; Zhang, S.; Wu, Y.; Ge, Y.; Zhang, X. Haliea alexandrii sp. nov.; isolated from phycosphere microbiota of the toxin-producing dinoflagellate Alexandrium catenella. Int. J. Syst. Evol. Microbiol. 2020, 70, 1133–1138. [Google Scholar] [CrossRef]
- Ren, C.Z.; Gao, H.M.; Dai, J.; Zhu, W. Z.; Xu, F.F.; Ye, Y.; Zhang, X.L.; Yang, Q. Taxonomic and Bioactivity Characterization of Mameliella alba Strain LZ-28 Isolated from Highly-toxic Marine Dinoflagellate Alexandrium catenella LZT09, Marine Drugs, 2022, 20, 321.
- Zhang, X.L.; Pan, Z. K.; Zhang, J.K.; Liu, B.Q.; Yang, Q. Phycobacteria Biodiversity, Selected Isolation, and Bioactivity Elucidation of New Bacterial Species of Highly Toxic Marine Dinoflagellate Alexandrium minutum amtk4. Microorganisms, 2025, 13, 1198. [Google Scholar] [CrossRef]
- Ge, Y.; Xue, Y.; Yang, Q.; Xing, W.; Zhu, S.; Jiang, W.; Liu, J. Benzalkonium chloride disinfection increases the difficulty of controlling foodborne pathogens identified in aquatic product processing. J. Hazard. Mater. 2025, 488, 137140. [Google Scholar] [CrossRef]
- Hall, M. and Beiko, R.G. 16S rRNA Gene Analysis with QIIME2. Methods Mol. Biol. 2018, 1849, 113–129. [Google Scholar]
- Zhang, X.; Xu, J.; Dai, J.; Zhang, L.; Feng, L.; Tian, X.; Yang, Q. Taxonomic, Phylogenomic and Bioactivity Profiling of Novel Phycosphere Bacterium from Model Cyanobacterium Synechococcus elongatus PCC7942. Marine Drugs, 2024, 22, 36. [Google Scholar] [CrossRef] [PubMed]
- Dubois, B.; Debode, F.; Hautier, L.; Hulin, J.; Martin, G.S.; Delvaux, A; Janssen, E. ; Mingeot, D.A detailed workflow to develop QIIME2-formatted reference databases for taxonomic analysis of DNA metabarcoding data. BMC Genomic Data 2022, 23, 53. [Google Scholar] [CrossRef] [PubMed]
- Gustavsson, E.K.; Zhang, D.; Reynolds, R.H.; Garcia-Ruiz, S.; Ryten, M. ggtranscript: an R package for the visualization and interpretation of transcript isoforms using ggplot2. Bioinformatics 2022, 38, 3844–3846. [Google Scholar] [CrossRef] [PubMed]
- Vázquez-Castellanos, J.F. Diversity Analysis in Viral Metagenomes. Methods Mol. Biol. 2018, 838, 203–230. [Google Scholar]
- Steichen, S.A.; Gao, S.; Waller, P.; Brown, J.K. Association between algal productivity and phycosphere composition in an outdoor Chlorella sorokiniana reactor based on multiple longitudinal analyses. Microb. Biotechnol. 2020, 13, 1546–1561. [Google Scholar] [CrossRef]
- Kearney, S.M.; Thomas, E.; Coe, A.; Chisholm, S.W. Microbial diversity of co-occurring heterotrophs in cultures of marine picocyanobacteria. Environ Microbiome 2021, 16, 1. [Google Scholar] [CrossRef]
- Worley, B. and Powers, R. PCA as a practical indicator of OPLS-DA model reliability. Curr Metabolomics 2016, 4, 97–103. [Google Scholar] [CrossRef]
- Wickham, H. ggplot2. Wiley Interdiscip. Rev. Comput. Stat. 2011, 3, 180–185. [Google Scholar] [CrossRef]
- Schliep, K.P. phangorn: phylogenetic analysis in R. Bioinformatics 2011, 27, 592–593. [Google Scholar] [CrossRef]
- Yang, Q.; Feng, Q.; Zhang, B.P.; Gao, J.J.; Sheng, Z.; Xue, Q.P.; Zhang, X.L. Marinobacter alexandrii sp. nov.; a novel yellow-pigmented and algae growth-promoting bacterium isolated from marine phycosphere microbiota. Antonie Van Leeuwenhoek 2021, 114, 709–718. [Google Scholar] [CrossRef]
- Liu, J.Z.; Yang, J.S.; Ge, Y.M.; Yang, Q.; Sun, J.Y.; Yu, X. Acute effects of CH3NH3PbI3 perovskite on Scenedesmus obliquus and Daphnia magana in aquatic environment. Ecotoxicol. Environ. Saf. 2021, 208, 111677. [Google Scholar] [CrossRef]
- Yang, Q.; Ge, Y.M.; Iqbal, N.M.; Yang, X.; Zhang, X.L. Sulfitobacter alexandrii sp. nov.; a new microalgae growth-promoting bacterium with exopolysaccharides bioflocculanting potential isolated from marine phycosphere. Antonie Van Leeuwenhoek 2021, 114, 1091–1106. [Google Scholar] [CrossRef]
- Zhang, H.; Zhao, W.; Yang, W.; Zhang, H.; Qian, X.; Sun, K.; Yang, Q.; Shen, X.; Zhang, L. Autoinducer-2 enhances defence of Vibrio furnissii against oxidative stress and DNA damage by modulation of c-di-GMP signaling via a two-component system. mBio, 2025, 16, e0292224. [Google Scholar] [CrossRef] [PubMed]
- Kim, M.; Shin, B.; Lee, J.; Park, H.Y.; Park, W. Culture-independent and culture-dependent analyses of the bacterial populations in the phycosphere of cyanobloom-forming Microcystis aeruginosa. Sci. Rep. 2019, 9, 20416. [Google Scholar] [CrossRef] [PubMed]
- Kaur, H. and Narasimhan, B. Antimicrobial Activity of Diazenyl Derivatives: An Update. Curr. Top. Med. Chem. 2018, 18, 3–21. [Google Scholar] [CrossRef] [PubMed]
- Andrews, J. M. Determination of minimum inhibitory concentrations. J. Antimicrob. Chemother. 2001, 48, 5–16. [Google Scholar] [CrossRef]
- Zhou, X.; Zhang, X. A.; Jiang, Z. W.; Yang, X.; Zhang, X. L.; Yang, Q. Combined characterization of a new member of Marivita cryptomonadis strain LZ-15-2 isolated from cultivable phycosphere microbiota of highly toxic HAB dinoflagellate Alexandrium catenella LZT09. Braz. J. Microbiol. 2021, 52, 739–748. [Google Scholar] [CrossRef]
- Pathom-Aree, W.; Sattayawat, P.; Inwongwan, S.; Cheirsilp, B.; Liewtrakula, N.; Maneechote, W.; Rangseekaew, P.; Ahmad, F.; Mehmood, M. A.; et al. Microalgae growth-promoting bacteria for cultivation strategies: Recent updates and progress. Microbiol. Res. 2024, 286, 127813. [Google Scholar] [CrossRef]
- Gang, S.; Sharma, S.; Saraf, M.; Buck, M.; Schumacher, J. Analysis of Indole-3-acetic Acid (IAA) Production in Klebsiellaby LC-MS/MS and the Salkowski Method. Bio-protoc. 2019, 9, e3230. [Google Scholar] [CrossRef]
- Kanehisa, M.; Furumichi, M.; Sato, Y.; Kawashima, M.; Ishiguro-Watanabe, M. KEGG for taxonomy-based analysis of pathways and genomes. Nucleic Acids Res. 2023, 51, D587–D592. [Google Scholar] [CrossRef]
- Karp, P.D.; Riley, M.; Paley, S.M.; Pellegrini-Toole, A. The MetaCyc Database. Nucleic Acids Res. 2002, 30, 59–61. [Google Scholar] [CrossRef]
- Duca, D.R. and Glick, B.R. Indole-3-acetic acid biosynthesis and its regulation in plant-associated bacteria. Appl. Microbiol. Biotechnol. 2020, 104, 8607–8619. [Google Scholar] [CrossRef] [PubMed]
- Pham, T.M.; Bui, X. D.; Trang, L. V. K.; Le, T. M.; Nguyen, M. L.; Trinh, D. M.; Phuong, N. T. D.; Khoo, K.S.; Chew, K.W.; Show, P.L. Isolation of indole-3-acetic acid-producing Azospirillum brasilense from Vietnamese wet rice: Co-immobilization of isolate and microalgae as a sustainable biorefinery. J. Biotechnol. 2022, 349, 12–20. [Google Scholar] [CrossRef] [PubMed]
- Duca, D. , Lorv, J., Patten, C.L., Rose, D., Glick, B.R. Indole-3-acetic acid in plant-microbe interactions. Antonie Van Leeuwenhoek. 2014, 106, 85–125. [Google Scholar] [CrossRef] [PubMed]
- Luo, H. and Moran, M.A. Evolutionary ecology of the marine Roseobacter clade. Microbiol. Mol. Biol. Rev. 2014, 78, 573–587. [Google Scholar] [CrossRef]
- Petrou, K. Phytoplankton-Bacteria Interactions 2.0. Microorganisms 2023, 11, 1536. [Google Scholar] [CrossRef]
- Jiang, Z.; Duan, Y.; Yang, X.; Yao, B.; Zeng, T.; Wang, X.; Feng, Q.; Qi, M.; Yang, Q.; Zhang, X. Nitratireductor alexandrii sp. nov.; from phycosphere microbiota of toxic marine dinoflagellate Alexandrium tamarense. Int. J. Syst. Evol. Microbiol. 2020, 70, 4390–4397. [Google Scholar] [CrossRef]
- Yang, Q.; Jiang, Z.; Zhou, X.; Zhang, R.; Xie, Z.; Zhang, S.; Wu, Y.; Ge, Y.; Zhang, X. Haliea alexandrii sp. nov.; isolated from phycosphere microbiota of the toxin-producing dinoflagellate Alexandrium catenella. Int. J. Syst. Evol. Microbiol. 2020, 70, 1133–1138. [Google Scholar] [CrossRef]
- Zhang, X.L.; Li, G. X.; Ge, Y.M.; Iqbal, N.M.; Yang, X.; Cui, Z.D.; Yang, Q. Sphingopyxis microcysteis sp. nov.; a novel bioactive ,exopolysaccharides-bearing Sphingomonadaceae isolated from the Microcystis phycosphere. Antonie van Leeuwenhoek 2021, 114, 845–857. [Google Scholar] [CrossRef]
- Zhu, W. Z.; Gao, H.M.; Ge, Y.M.; Dai, J.; Yang, X.; Zhang, X. L.; Yang, Q. Alexandriicola marinus gen. nov.; sp. nov.; a new member of the family Rhodobacteraceae isolated from marine phycosphere. Antonie van Leeuwenhoek 2022, 115, 473–486. [Google Scholar] [CrossRef]
- Fukui, Y.; Abe, M.; Kobayashi, M.; Shimada, Y.; Saito, H.; Oikawa, H.; Yano, Y.; Satomi, M. Sulfitobacter porphyrae sp. nov.; isolated from the red alga Porphyra yezoensis. Int. J. Syst. Evol. Microbiol. 2014, 64, 438–443. [Google Scholar] [CrossRef] [PubMed]
- Elbir, H. Updating the Relationship Between the Threshold Value of Average Nucleotide Identity and Digital DNA-DNA Hybridization for Reliable Taxonomy of Corynebacterium. Vet. Sci. 2024, 11, 661. [Google Scholar] [CrossRef] [PubMed]
- Wang, C.N.; Liu, Y.; Wang, J.; Du, Z. J.; Wang, M. Y. Sulfitobacter algicola sp. nov.; isolated from green algae. Arch. Microbiol. 2021, 203, 2351–2356. [Google Scholar] [CrossRef]
- Hong, Z.; Lai, Q.; Luo, Q.; Jiang, S.; Zhu, R.; Liang, J.; Gao, Y. Sulfitobacter pseudonitzschiae sp. nov.; isolated from the toxic marine diatom Pseudo-nitzschia multiseries. Int. J. Syst. Evol. Microbiol. 2015, 65, 95–100. [Google Scholar] [CrossRef]
- Fukui, Y.; Abe, M.; Kobayashi, M.; Satomi, M. Sulfitobacter pacificus sp. nov.; isolated from the red alga Pyropia yezoensis. Antonie van Leeuwenhoek, 2015, 107, 1155–1163. [Google Scholar] [CrossRef]
- Park, S.; Jung, Y.T.; Won, S.M.; Park, J.M.; Yoon, J.H. Sulfitobacter undariae sp. nov.; isolated from a brown algae reservoir. International journal of systematic and evolutionary microbiology, 2015, 65, 1672–1678. [Google Scholar] [CrossRef]
- Palmeiro-Sánchez, T.; O’Flaherty, V.; Lens, P.N.L. Polyhydroxyalkanoate bio-production and its rise as biomaterial of the future. J. Biotechnol. 2022, 348, 10–25. [Google Scholar] [CrossRef]
- Abate, T.; Amabile, C.; Muñoz, R.; Chianese, S.; Musmarra, D. Polyhydroxyalkanoate recovery overview: properties, characterizations, and extraction strategies. Chemosphere, 2024, 356, 141950. [Google Scholar] [CrossRef]
- Koller, M.; Maršálek, L.; de Sousa Dias, M.M.; Braunegg, G. Producing microbial polyhydroxyalkanoate (PHA) biopolyesters in a sustainable manner. New Biotechnol. 2017, 37, 24–38. [Google Scholar] [CrossRef]
- Yan, Z.; Chen, B.; Yang, Y.; Yi, X.; Wei, M.; Ecklu-Mensah, G.; Buschmann, M.M.; Liu, H.; Gao, J.; Liang, W.; et al. Multi-omics analyses of airway host-microbe interactions in chronic obstructive pulmonary disease identify potential therapeutic interventions. Nat. Microbiol. 2022, 7, 1361–1375. [Google Scholar] [CrossRef]
- Li, S.; Liu, Q.; Duan, C.; Li, J.; Sun, H.; Xu, L.; Yang, Q.; Wang, Y.; Shen, X.; Zhang, L. c-di-GMP inhibits the DNA binding activity of H-NS in Salmonella. Nat. Commun. 2023, 14, 7502. [Google Scholar] [CrossRef]
- Zarei, M.; Rahbar, M.R.; Negahdaripour, M. Interaction of indole-3-acetic acid with horseradish peroxidase as a potential anticancer agent: from docking to molecular dynamics simulation. J. Biomol. Struct. Dyn. 2022, 40, 4188–4196. [Google Scholar] [CrossRef]
- Cheng, X.; Li, X.; Tong, M.; Tong, M.; Wu, J.; Chan, L.L.; Cai, Z.; Zhou, J. Indole-3-acetic acid as a cross-talking molecule in algal-bacterial interactions and a potential driving force in algal bloom formation. Front. Microbiol. 2023, 4, 1236925. [Google Scholar] [CrossRef] [PubMed]
- Amin, S.A.; Hmelo, L.R.; van Tol, H.M.; Durham, B.P.; Carlson, L.T.; Heal, K.R.; Morales, R.L.; Berthiaume, C.T.; Parker, M.S.; et al. Interaction and signalling between a cosmopolitan phytoplankton and associated bacteria. Nature 2015, 522, 98–101. [Google Scholar] [CrossRef] [PubMed]
Figure 1.
Figure 1. Characterization and comparison of the bacterial structure in the eutrophic seawater sample of the S1 site (LO1_E) with the other five nearshore sites in the ECS area. Pane A: Comparison of the number of taxa of the S1 site (LO1_E) with other samples for the bacterial populations. Pane B: Comparison of the relative abundance of the top 20 family of the six investigated station sites.
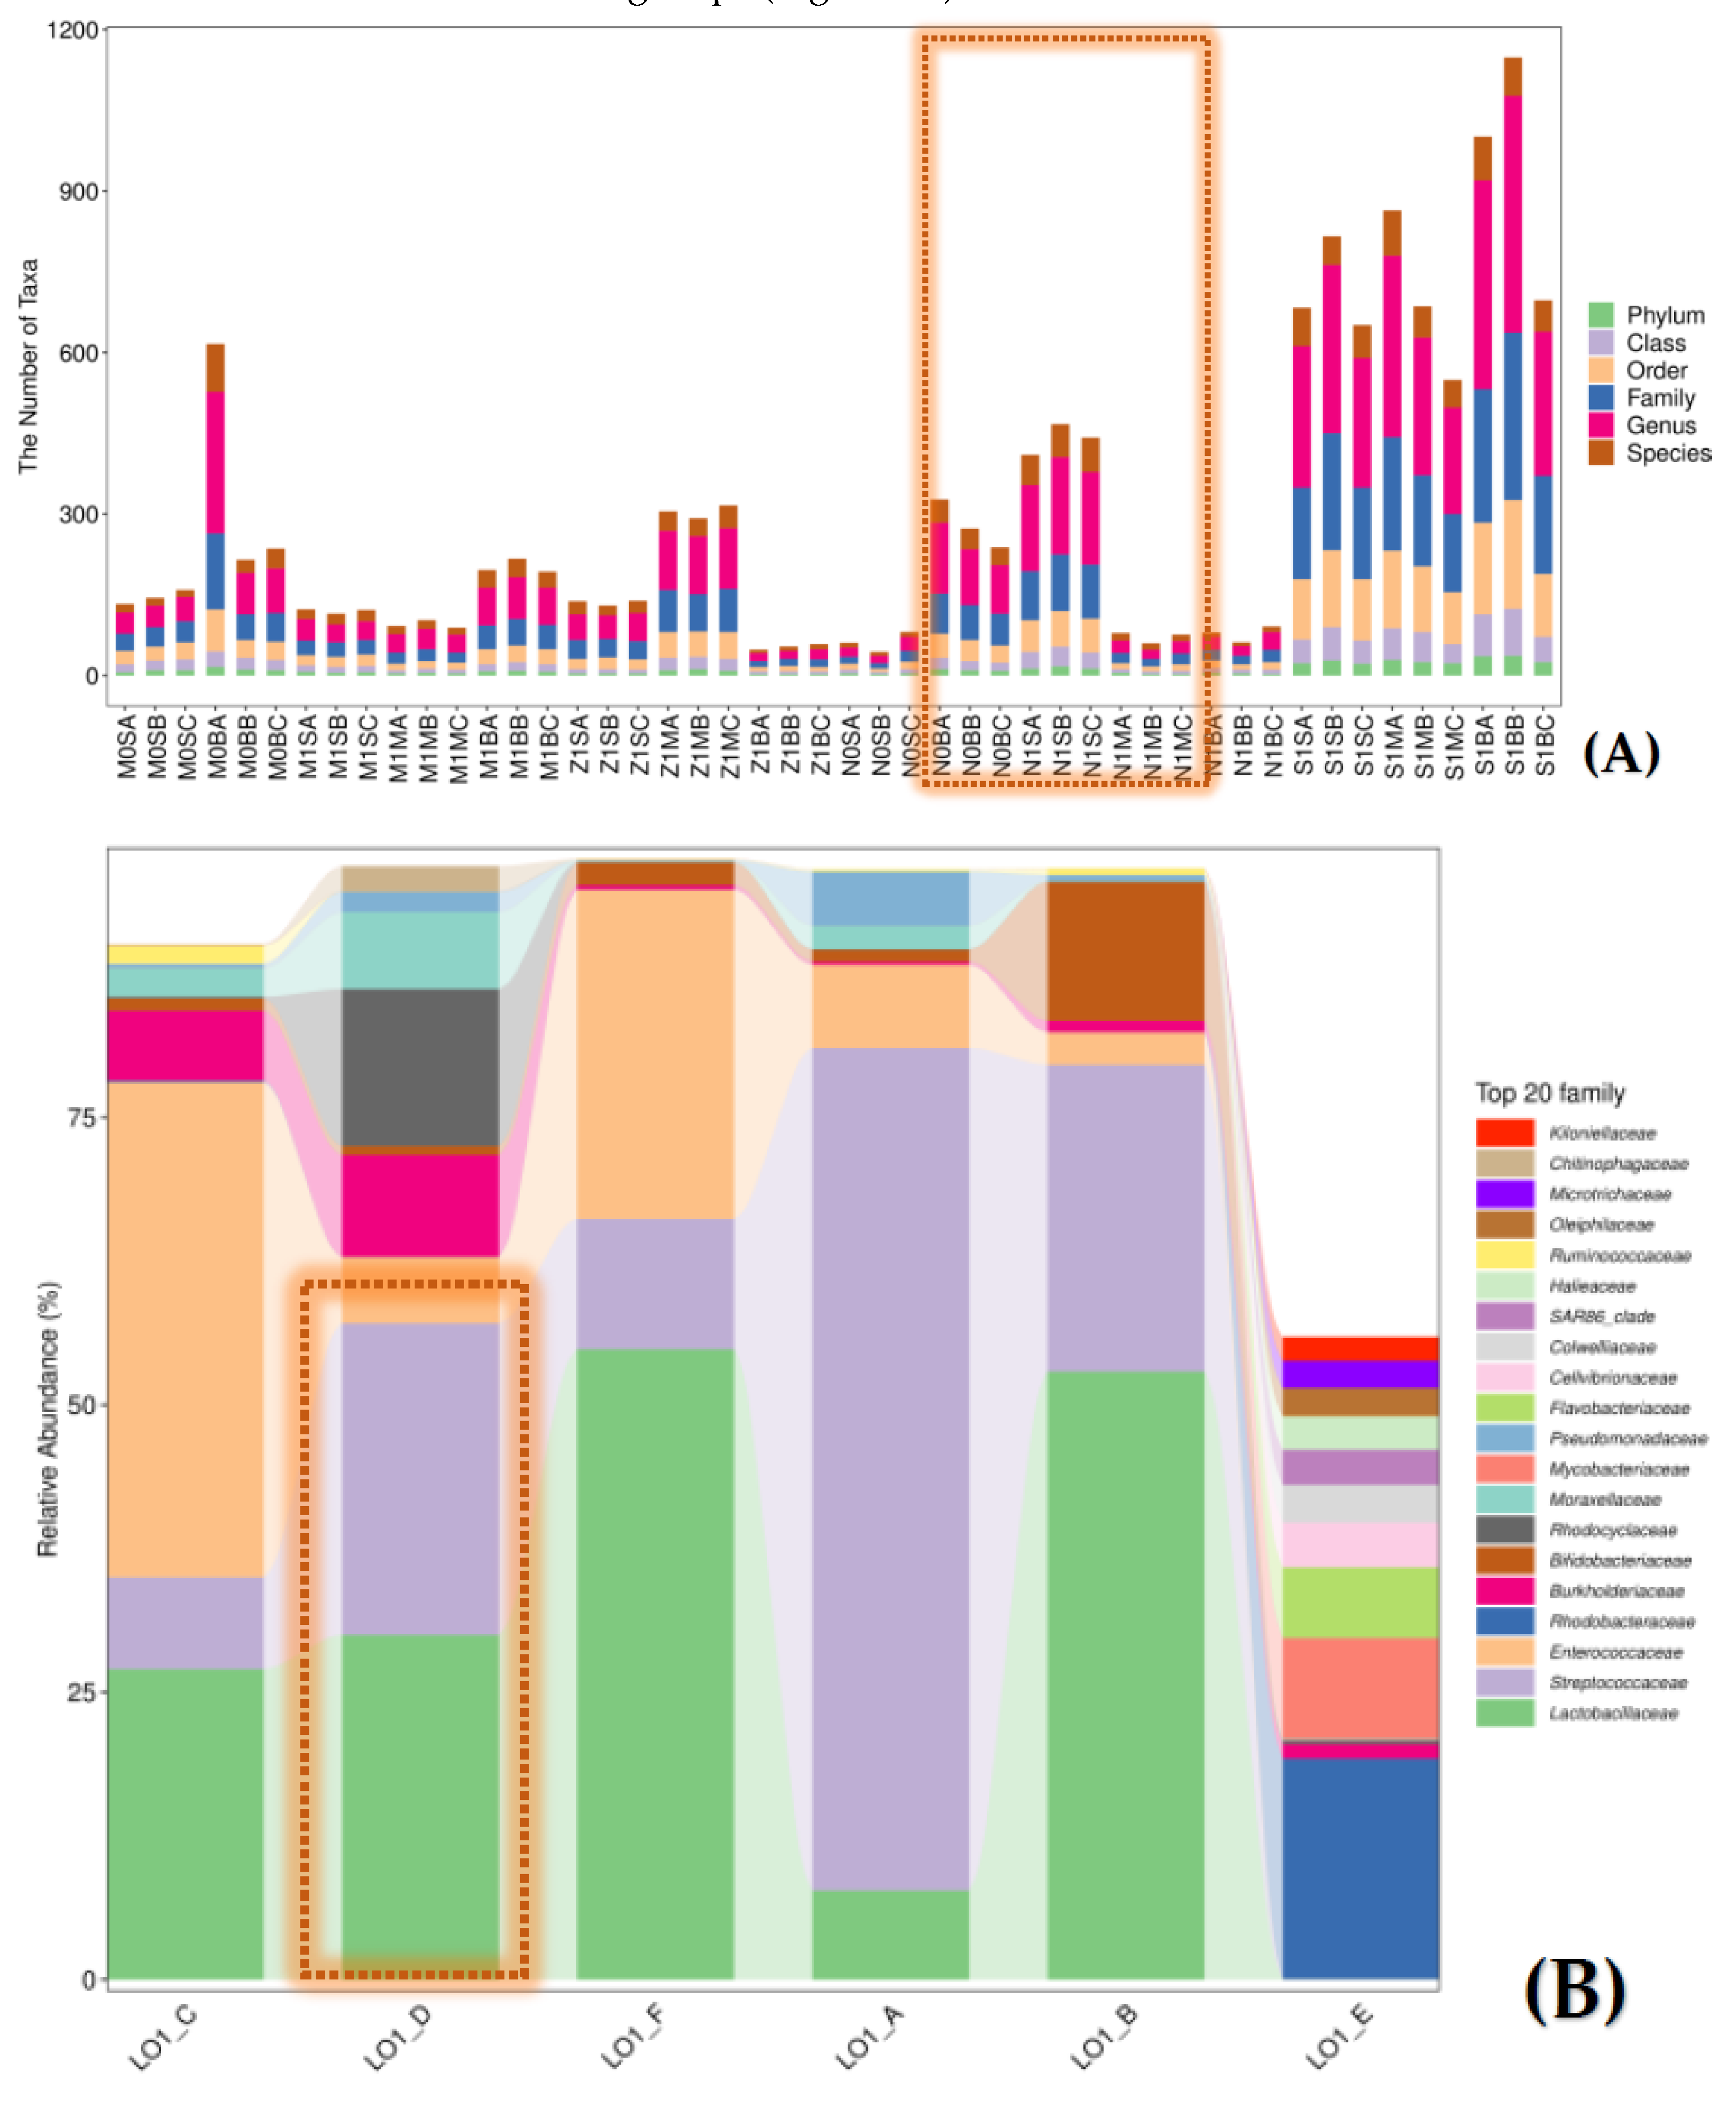
Figure 2.
Figure 2. The comparison of the α-diversity of the bacterial populations in the eutrophic seawater sample of the S1 site (LO1_E) with the other five nearshore sites in the ECS area. The alpha diversity index for each station was calculated as the average of all samples, error bars representing SEM.
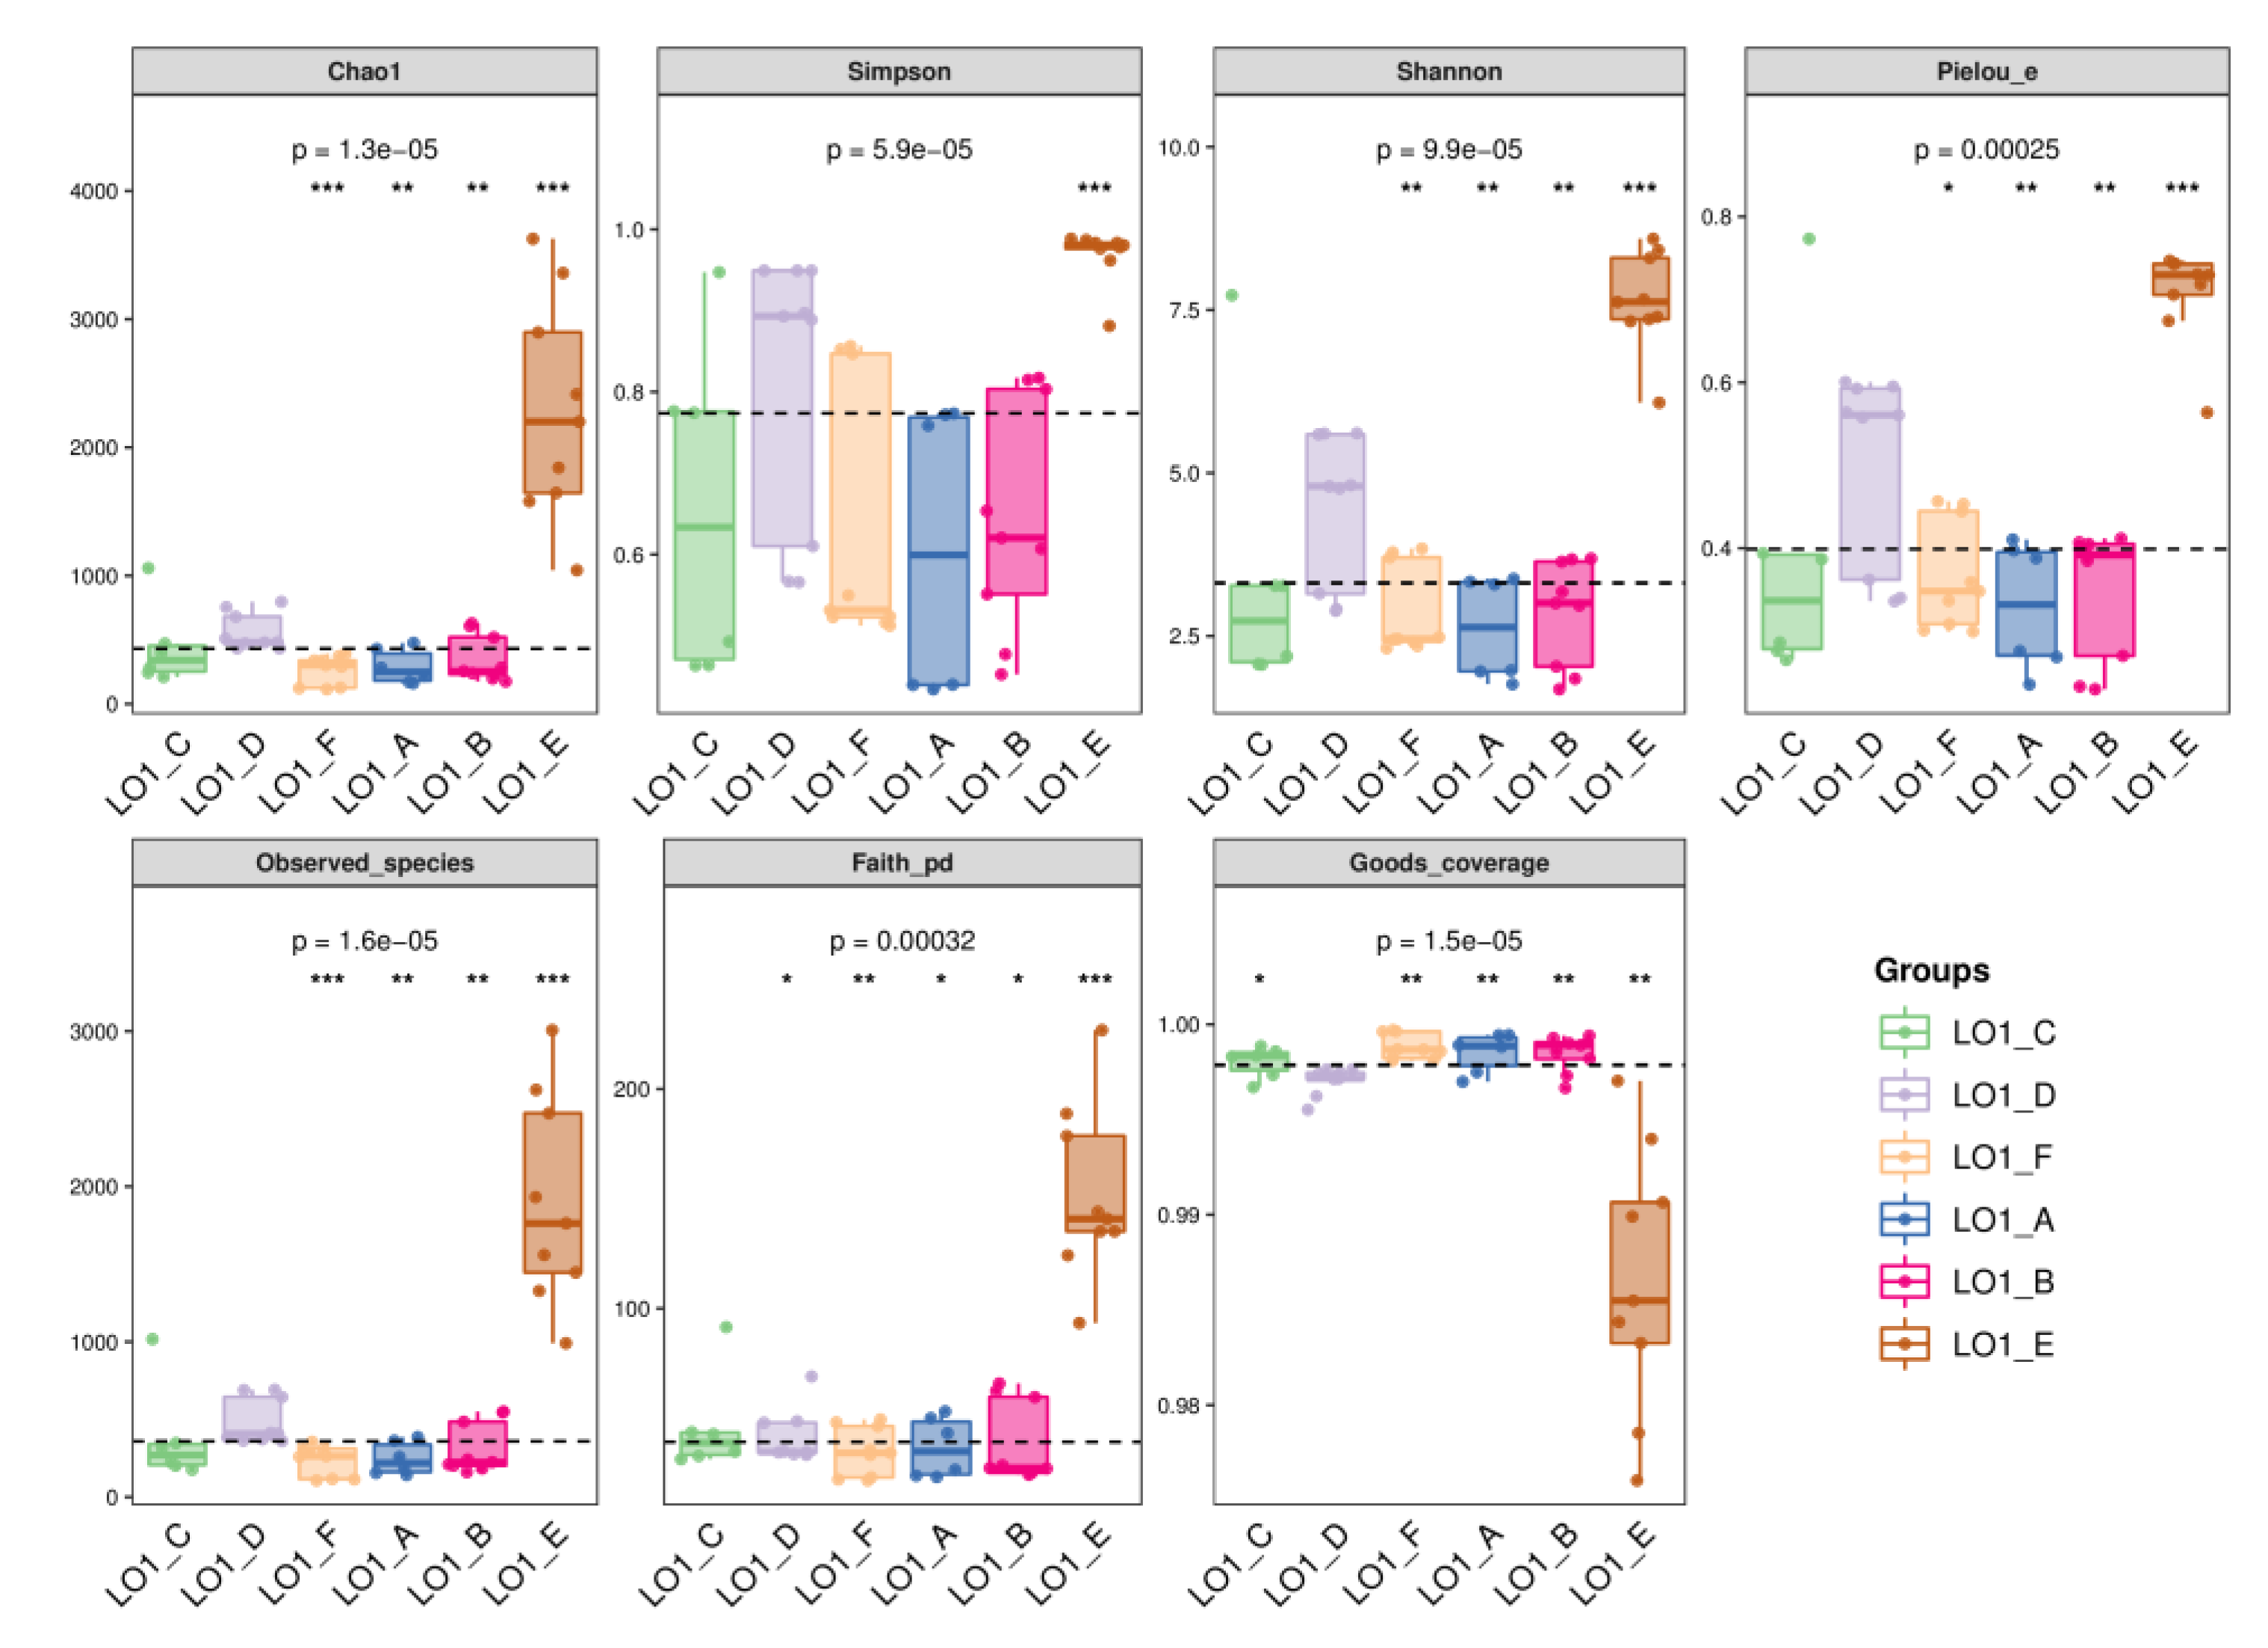
Figure 3.
Functional prediction of the bacterial populations in seawater samples of station S1. Pane A: KEGG functional prediction (Pane a) and MetaCyc functional prediction (Pane b). Pane B: The predicted TRPSYN-PWY pathway for bacterial L-tryptophan biosynthesis based on the MetaCyc analysis. Pane C: Venn diagram of the shard and unque species in each group. Pane D: PLS-DA discriminant analysis of bacterial populations, including the species loading diagram (Pane a) and sample ordination diagram (Pane b). In Pane a, each point represents a genus species, and the horizontal and vertical coordinates of the point are the VIP values of the species, and the colors indicate its value from small to large. In Pane b, each point represents a station sample (group), and points of different colors indicate different samples in each group.
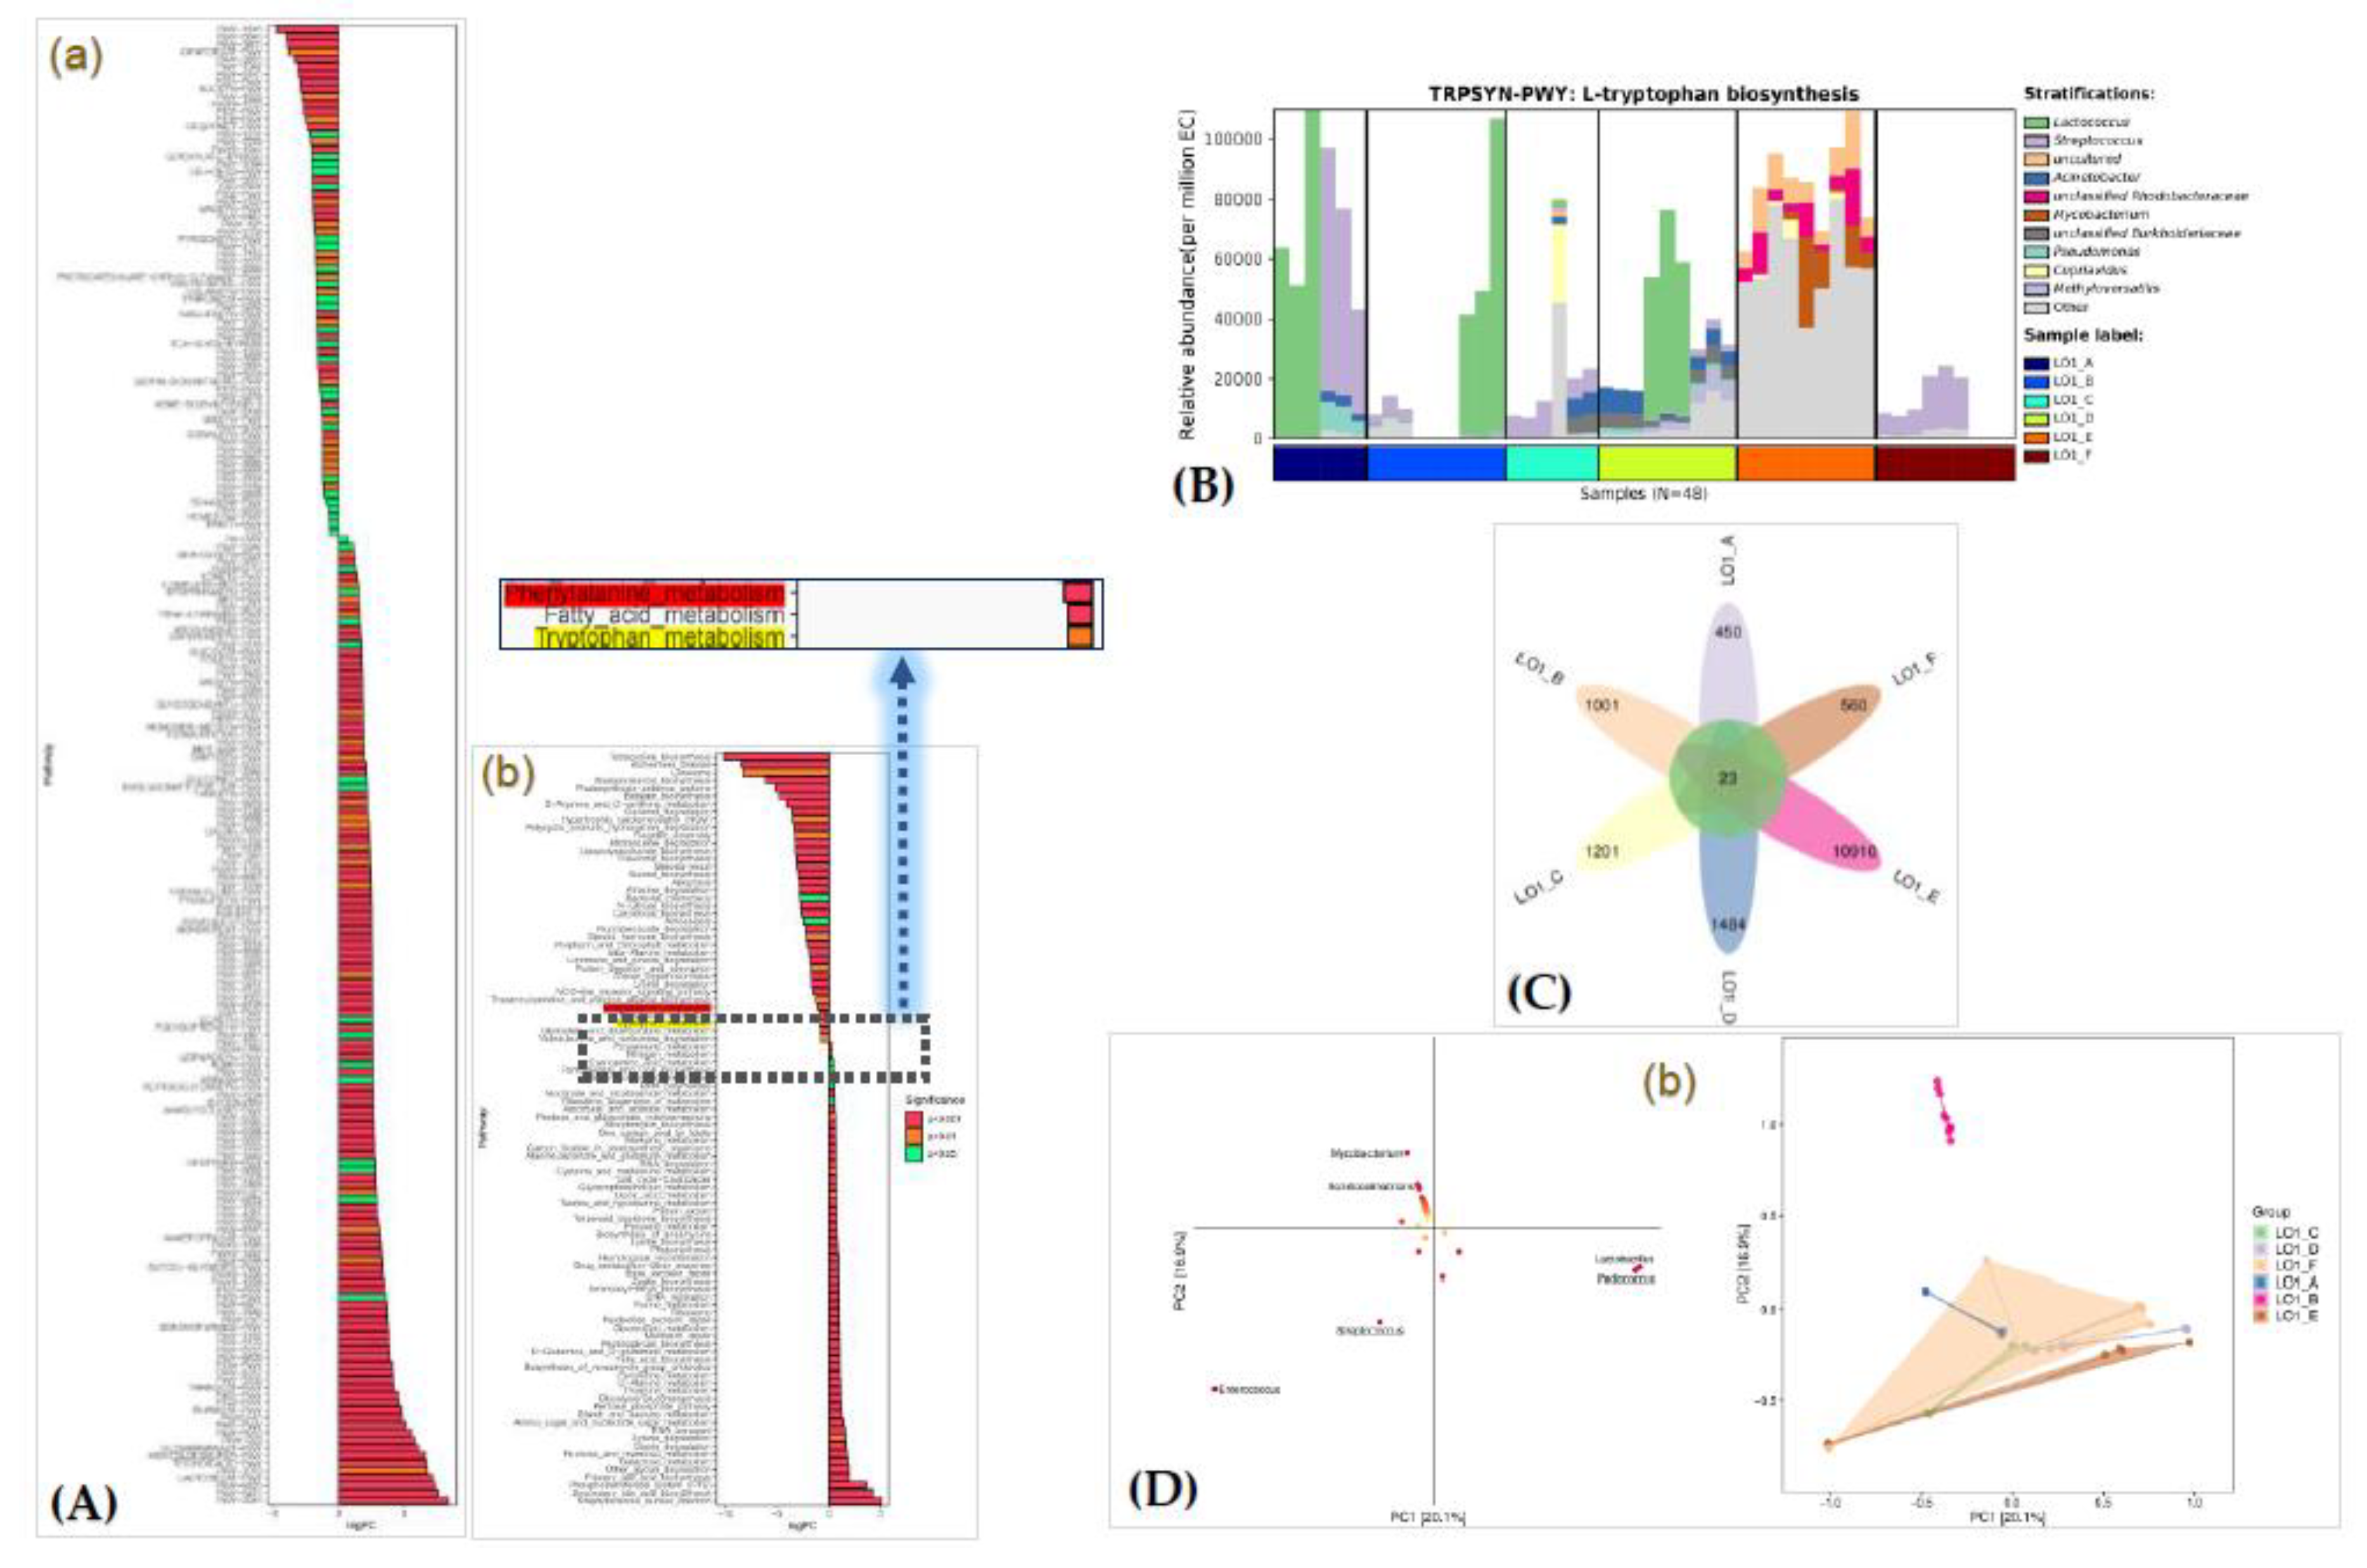
Figure 4.
Co-occurrence network analysis of the bacterial populations in the investigated six nearshore station sites. Pane A: Modular association network diagram of the predominant species at the phylum level in the samples. The node represented the ASV in the sample with the node size positively proportional to its abundance. The modules with the most nodes in the top 10 were marked with different colors. The edge between nodes indicates the correlation between two connected nodes. The red line indicated positive correlations, and the green with negative correlations. Pane B: The different colors represent different phyla, the size of the nodes represents the size of the abundance, and the lines represent the correlation, with red indicating positive correlation and green indicating negative correlation. The graph only showed correlation relationships whit p < 0.05 and |r| > 0.6. The unclassified Rhodobacteraceae members were marked with red arrows.
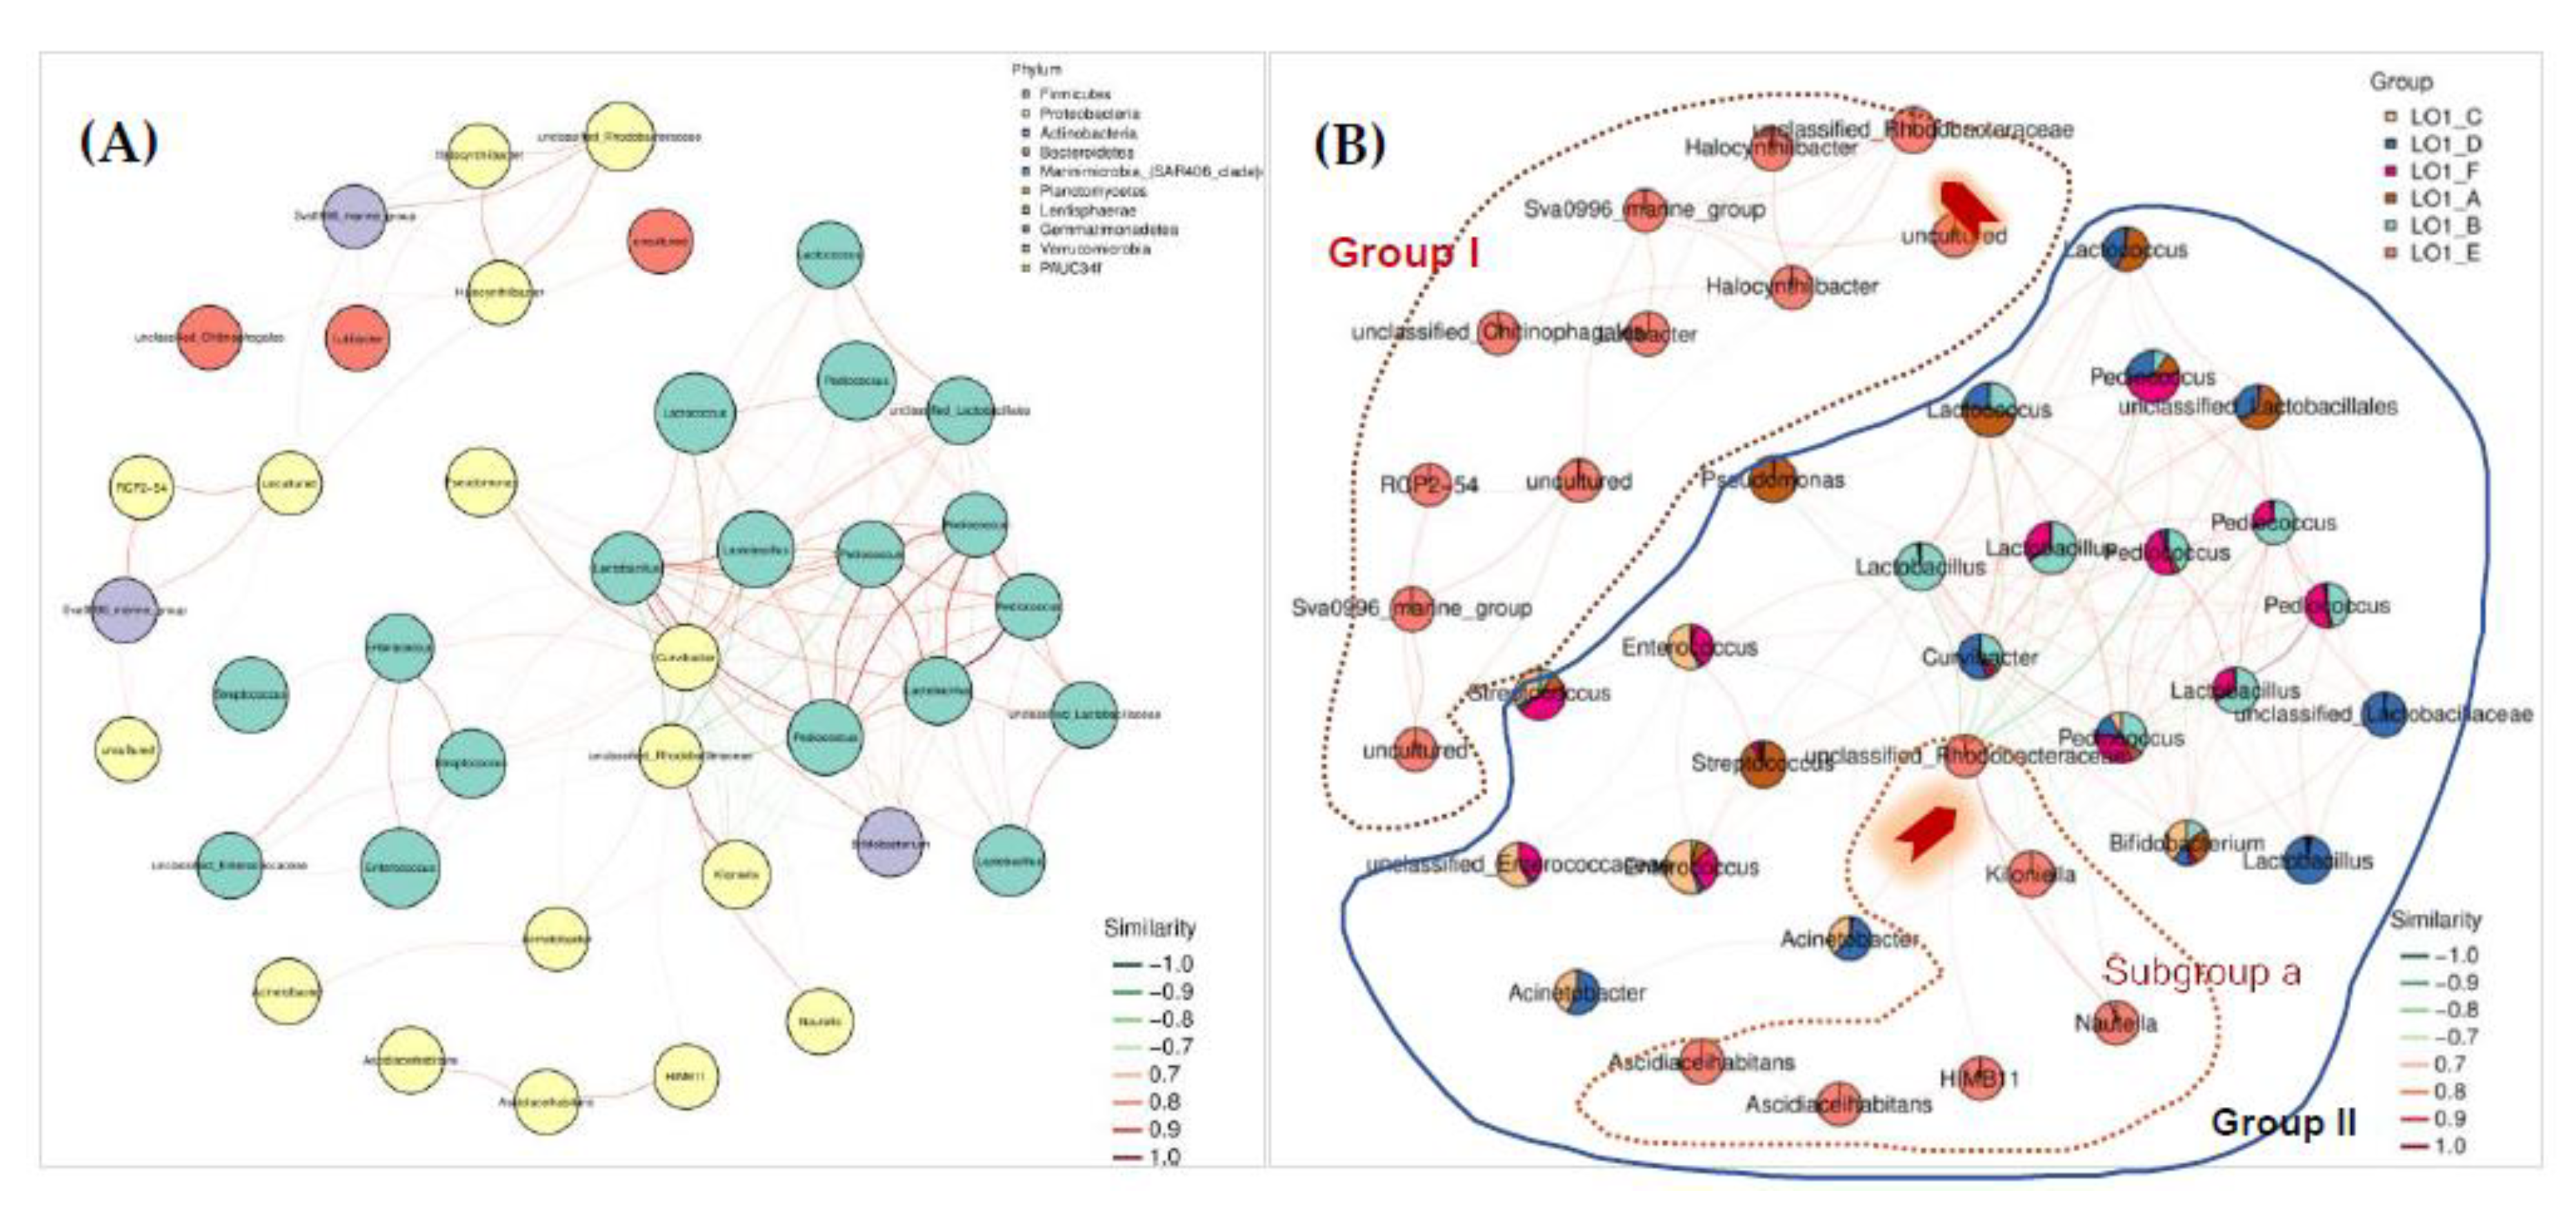
Figure 5.
Phylogenetic tree analysis of culturable bacteria based on 16S rRNA gene, for part of the strains along with some representative type species within the family Rhodobacteraceae and Roseobacteraceae (Pane A), and the potential novel species, strain S1-TA-50, and its three closely related strains, S1-TA-3, S1-TA-44 and S1-TA-41, and the types strains of the genera Sulfitobacter (Pane B). A transmission electron micrograph of the cell of strain S1-TA-50 grown on MA for 2 days at 28 °C, with white arrows indicating PHA granules inside of the cells was also attached. Bar 1 μm.
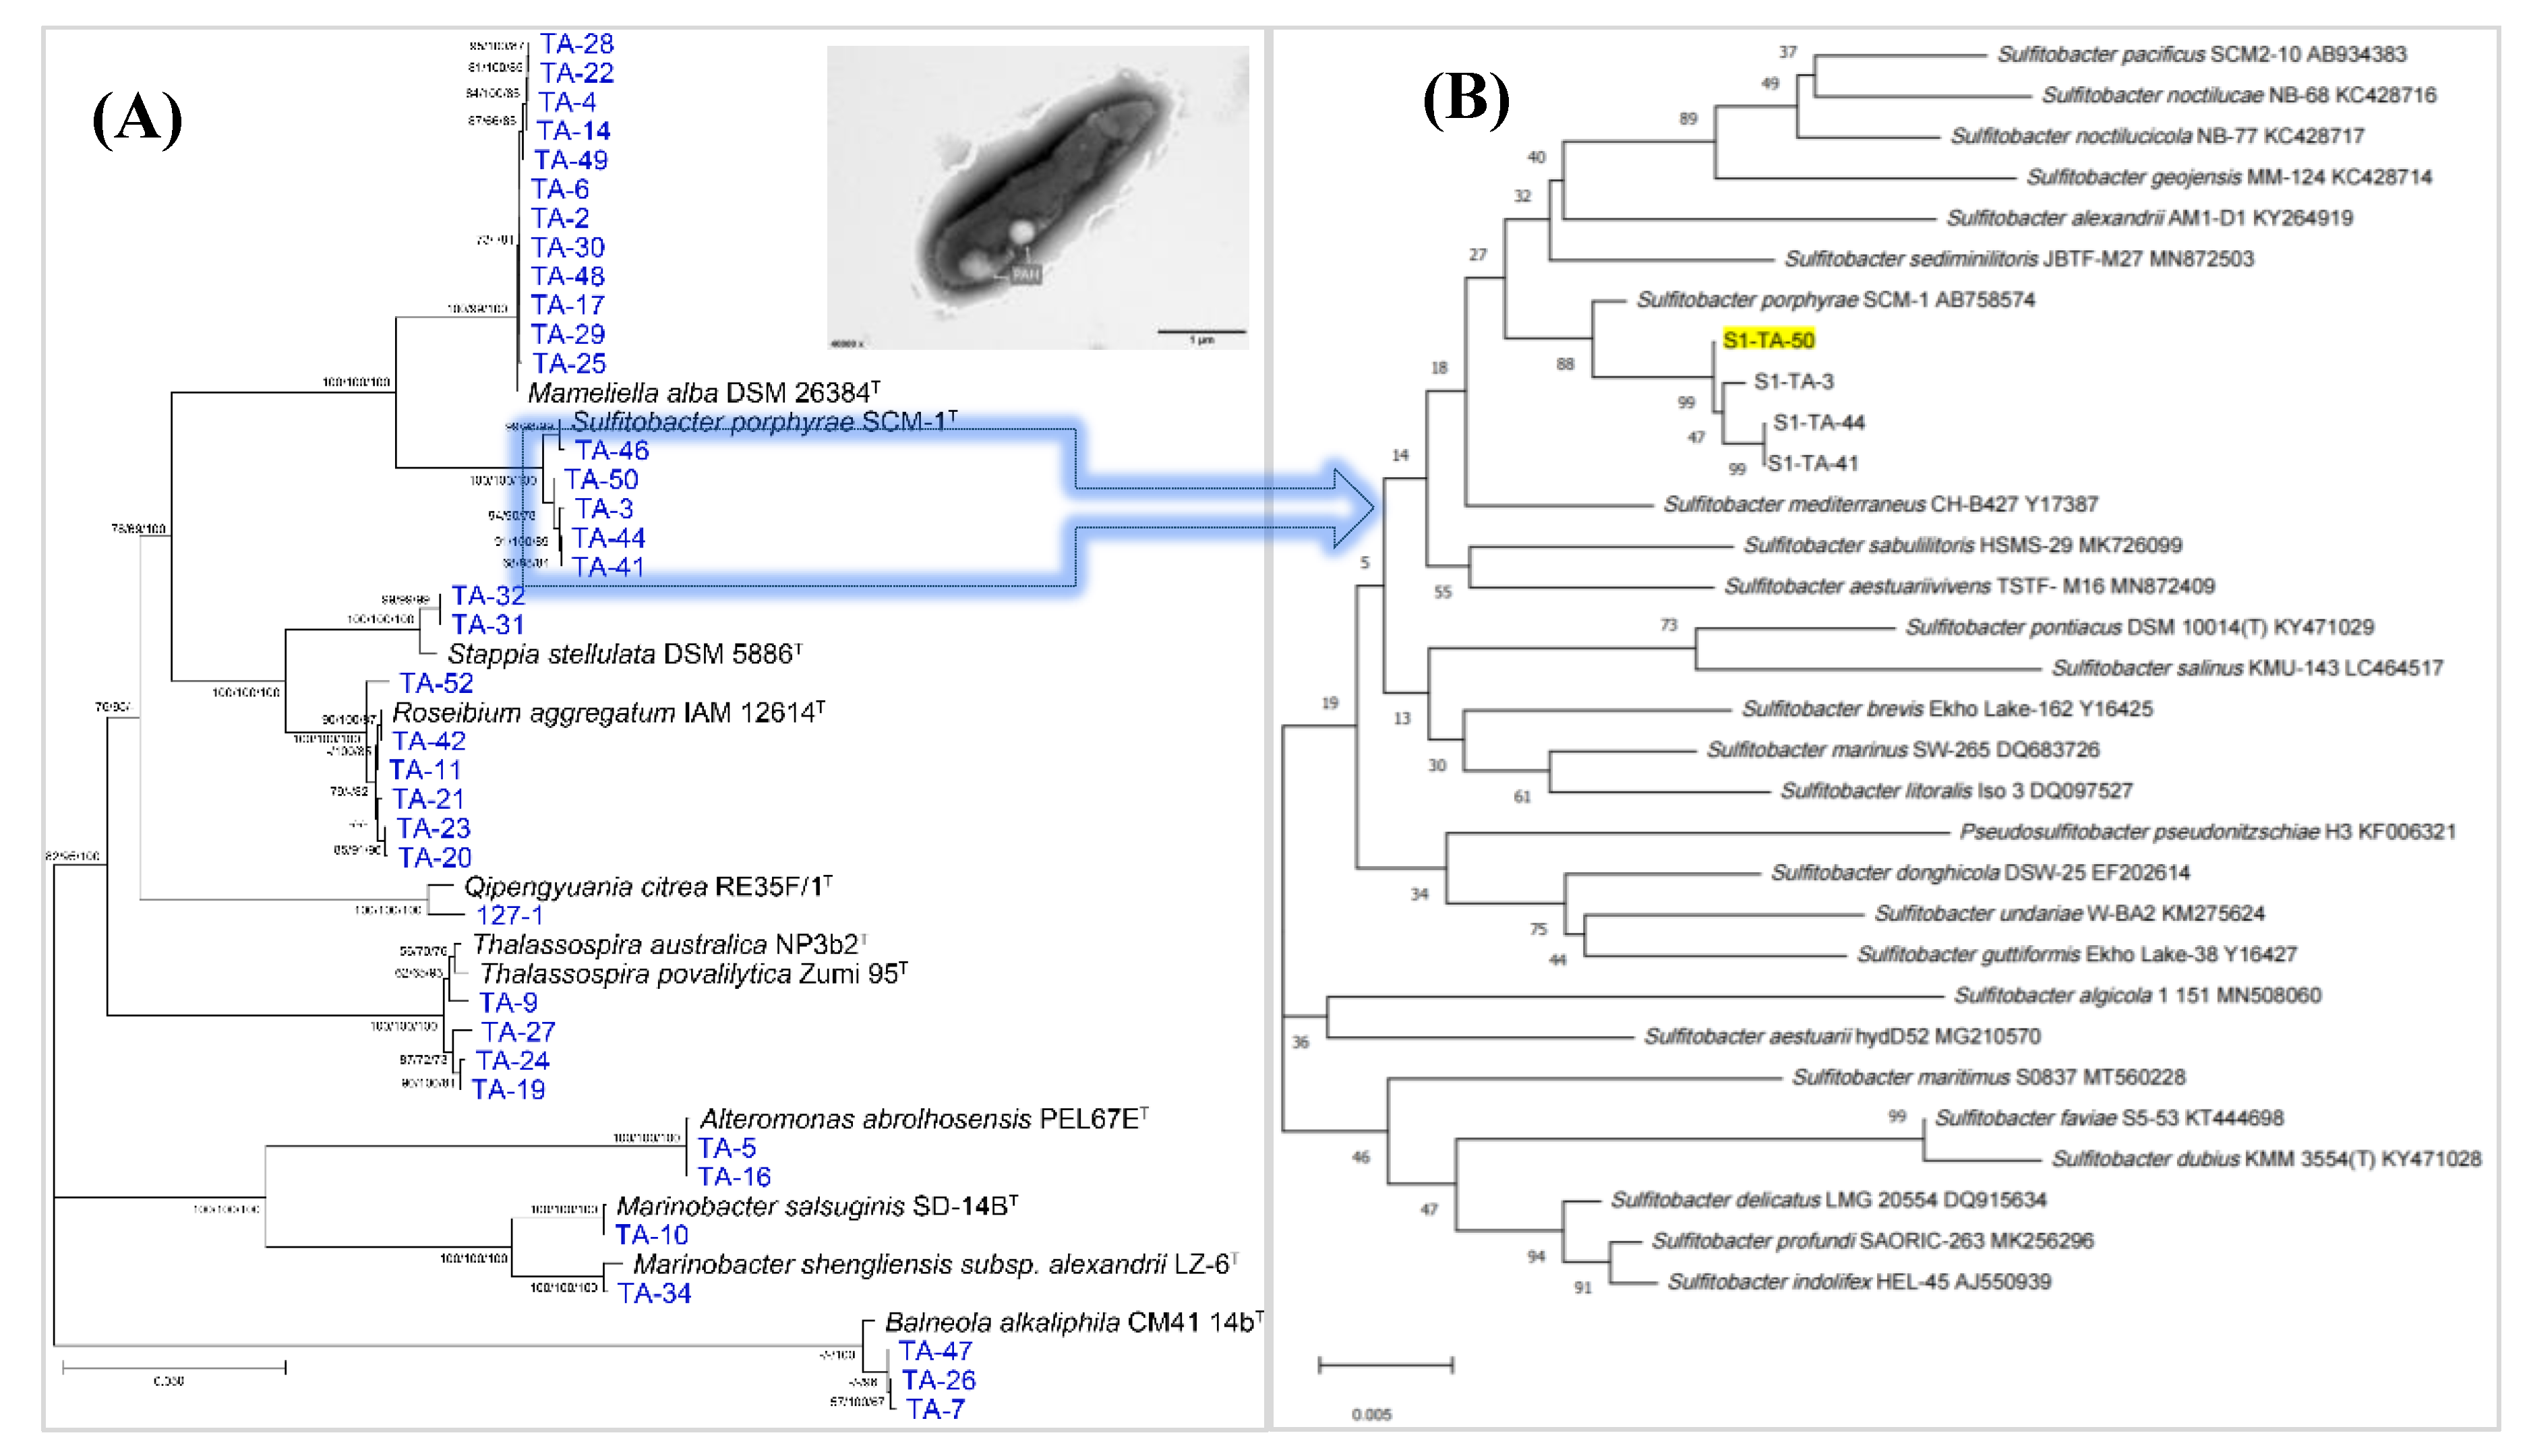
Figure 6.
Culture optimization of bacterial growth and IAA production of strain S1-TA-50. Effects of different pH (Pane A) and carbon sources (Pane B) on bacterial growth were recorded at OD600nm (Pane A and B). The accumulation curves of the bacterial growth measured by cell number counting (pane a) and IAA production (pane b) under the optimized culture condition (Pane C).
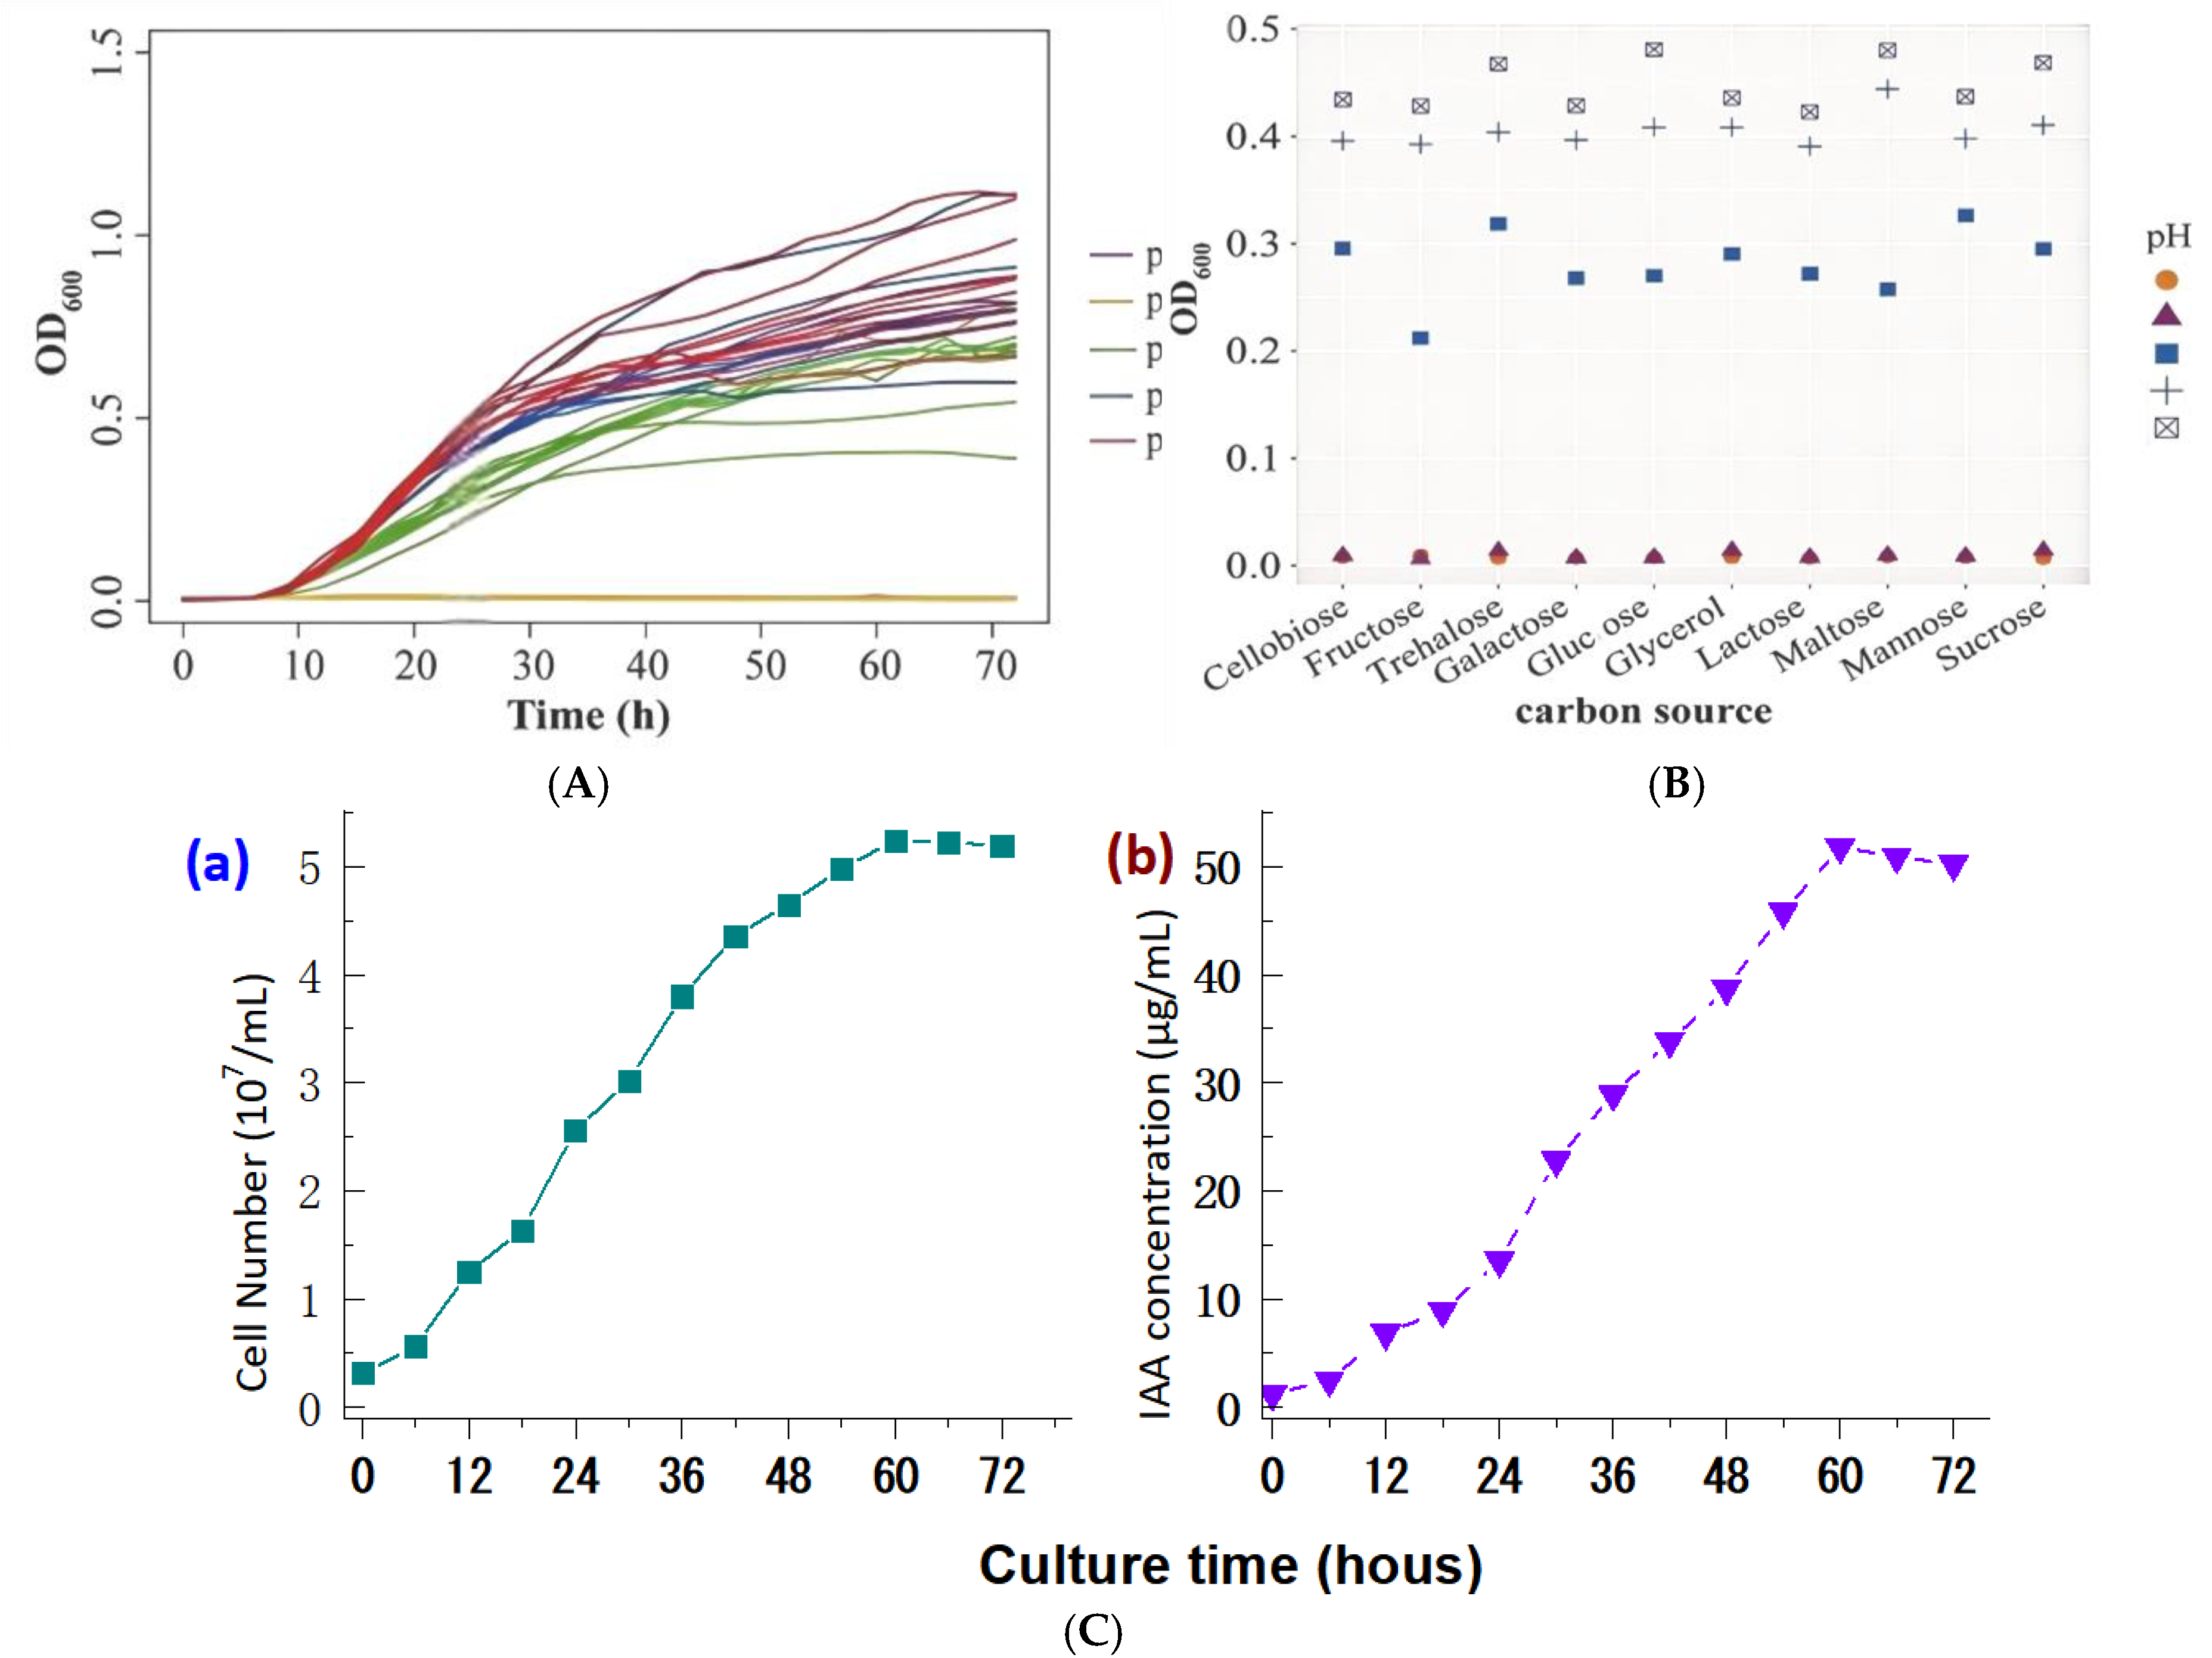

Table 1.
Bioactivity analysis of the four bacterial strains isolated from eutrophic seawater of the nearshore S1 site .
Table 1.
Bioactivity analysis of the four bacterial strains isolated from eutrophic seawater of the nearshore S1 site .
| Tested Strains | Antibacterial Activity (MIC, µg/mL) | |||
|---|---|---|---|---|
| B. subtilis | S. aureus | C. albicans | E. coli | |
| S1-TA-3 | >100 | >100 | >100 | >100 |
| S1-TA-41 | 25.4 | 15.6 | 12.8 | 10.7 |
| S1-TA-44 | 22.1 | 16.7 | 10.5 | 9.8 |
| S1-TA-50 | 12.3 | 3.3 | 5.4 | 3.6 |
Notes: MIC, Minimum inhibitory concentration; IC50, half-maximal inhibitory concentration; HL-60, human leukemic cell line; Bel-7402, human hepatocellular carcinoma cell line; A549, human lung cancer cell line; S. aureus, Staphylococcus aureus ATCC 12600; B. subtilis, Bacillus subtilis ATCC 6051; E. coli, Escherichia coli ATCC 25922; C. albicans, Candida albicans ATCC 10231.
Disclaimer/Publisher’s Note: The statements, opinions and data contained in all publications are solely those of the individual author(s) and contributor(s) and not of MDPI and/or the editor(s). MDPI and/or the editor(s) disclaim responsibility for any injury to people or property resulting from any ideas, methods, instructions or products referred to in the content. |
© 2025 by the authors. Licensee MDPI, Basel, Switzerland. This article is an open access article distributed under the terms and conditions of the Creative Commons Attribution (CC BY) license (http://creativecommons.org/licenses/by/4.0/).
Copyright: This open access article is published under a Creative Commons CC BY 4.0 license, which permit the free download, distribution, and reuse, provided that the author and preprint are cited in any reuse.


