Submitted:
12 September 2023
Posted:
13 September 2023
You are already at the latest version
Abstract
The assessment and prediction of drought risk under future climate change and land use land cover (LULC) scenarios is critically important for drought prevention and mitigation, as it enables a clearer understanding of potential shifts in drought patterns. The primary aim of this study is to evaluate sub-seasonal and seasonal meteorological and hydrological drought hazards across the Yellow River Basin (YRB) under projected future climate conditions and LULC patterns. The BCC-CSM1-1 climate model projections from the NASA Earth Exchange Global Daily Downscaled Projections (NEX-GDDP) dataset are utilized to represent future climate for 2025-2060 under RCP 4.5 and 8.5 scenarios. The CA-Markov model is employed to predict future LULC distributions. Meteorological and hydrological drought risks across different YRB zones are evaluated through a copula-based risk assessment approach, based on the joint probability distribution of drought duration and severity. The results indicate that sub-seasonal meteorological and hydrological droughts will likely be the primary concern moving forward. Specifically, the upper YRB (zones A, B, C) exhibits greater vulnerability to sub-seasonal meteorological drought, while the Loess Plateau (zones C, E) shows higher susceptibility to sub-seasonal hydrological drought. Moreover, zone F in the downstream region may experience increased seasonal hydrological drought risk due to projected urban expansion in the middle and lower portions of the YRB.
Keywords:
Meteorological drought
; Hydrological drought
; Drought risk prediction
; future climate and land use land cover change scenarios
1. Introduction
Over recent decades, meteorological and hydrological droughts at regional and global scales have had substantial impacts on agricultural, ecological, and public water systems. Despite rapid scientific and technological advancements, the consequences of such droughts remain unavoidable. For example, approximately 12 billion km2 of cropland were affected and over 10 million fatalities occurred due to droughts worldwide between 1900-2010 [1,2]. More recently, severe meteorological and hydrological drought events, including the 2011 East Africa drought, 2012 U.S. Central Great Plains drought, and 2012-2015 California drought, have elicited significant public attention due to their considerable agricultural and societal impacts [3,4,5,6,7]. China has also historically experienced frequent meteorological and hydrological droughts, especially in the ecologically fragile and geographically complex Yellow River Basin (YRB), profoundly influencing agricultural, economic and social development. Numerous studies have examined droughts in the YRB region [8,9,10,11]. For instance, Zhu et al [12] evaluated integrated droughts in the YRB using a comprehensive drought index, finding a drying trend over recent decades, with greater aridity in upstream and northern sections. Li et al. [13] assessed YRB hydrological drought evolution using a nonlinear joint index, identifying increasingly severe hydrological droughts in recent decades, particularly across the Loess Plateau. Wang et al. [14] examined the relationships between hydrological and meteorological droughts in the YRB, again showing worsening hydrological drought conditions. Collectively, these studies highlight the considerable impacts of meteorological and hydrological droughts on the ecologically and socially significant YRB region.
Against the backdrop of global change, meteorological drought patterns in the ecologically significant YRB may exhibit shifts. To understand potential variations under climate change projections, some studies have evaluated future meteorological drought characteristics for the YRB. For instance, Li et al. [15] examined the spatial, temporal, and persistence traits of meteorological droughts under climate warming scenarios across the Loess Plateau region of the YRB. Additionally, Ma et al. [16] assessed meteorological drought risk and change characteristics over a 40-year horizon utilizing eight climate models from the Coupled Model Inter-comparison Project Phase 5 under Representative Concentration Pathway (RCP) 2.6, 4.5 and 8.5 scenarios for the YRB. Research of this nature enhances preparedness for projected meteorological drought shifts in the YRB under global change. Zhang et al. [17] examined the evolution of meteorological drought over the period 2022-2100 under Shared Socioeconomic Pathway (SSP) 2-4.5 and SSP 5-8.5 emissions scenarios across the middle reaches of the YRB, employing copula functions to characterize the joint probability distribution of drought duration and severity. Collectively, these studies exemplify emerging work to anticipate and adapt to potential meteorological drought variations in the YRB resulting from climate change.
However, global change encompasses more than just climate variation; it also includes land use and land cover (LULC) alterations stemming from anthropogenic activities like agricultural expansion, afforestation, and urbanization. LULC characteristics can substantially influence hydrological processes by affecting rainfall infiltration, overland and channel flows, groundwater recharge and discharge, etc. [18]. Modifications to LULC traits may alter regional hydrological cycles and connections between meteorological and hydrological droughts, indirectly exacerbating or relieving hydrological droughts. Therefore, when projecting future hydrological drought risks, it is imperative to account for LULC pattern shifts in addition to climate change. Examining both factors will enable more comprehensive understanding of potential hydrological drought hazards under global change scenarios encompassing climate variations as well as human-induced LULC transformations. This dual perspective is critical for anticipating and managing hydrological drought risks moving forward.
Among the numerous studies on drought risk assessments, the copula function is a popular method that is widely applied in drought risk analysis because of its flexible and margin-free characteristics [19,20,21,22,23]. Zhang et al. [24] employed the copula function to evaluate the meteorological drought risk based on the precipitation data from 1960 to 2005 in the Pearl River basin. Xu et al. [25] used copula function to develop a regional drought risk assessment model, which was applied to analyze the drought frequency in Southwest China during the period of 1961–2012. Chang et al. [26] assessed the multivariate integrated drought risk in the Wei River Basin through the joint probability distribution of drought duration and severity based on Archimedean copulas. Yang et al. [27] assessed the drought risk of the Amu Darya River Basin from 1935 to 2015 by using MCMC-based maximum entropy copula method. However, these studies are mainly focus on historical drought frequency assessments, researches on meteorological and hydrological drought risk assessments under future climate and LULC change scenarios, especially in the YRB, are almost relatively blank.
Therefore, the current study focuses on the ecologically and socially significant YRB, with the primary objectives being: 1) to simulate and analyze projected land use/land cover (LULC) change patterns across the YRB, 2) to construct a drought risk assessment model based on joint probability distribution of drought duration and severity, and 3) to predict and examine meteorological and hydrological drought risks and interconnections under future climate and LULC change scenarios. The remainder of this paper is organized as follows: Section 2 presents the study area and data sources. Section 3 introduces the methodologies utilized in the analysis. Section 4 provides the results and discussion. Finally, Section 5 concludes with a summary of key findings, limitations, and directions for future research. Examining meteorological and hydrological drought projections for the YRB will provide greater understanding of potential changes to this integral system under global change pressures from climate and LULC shifts.
2. Study area and data sources
2.1. The Yellow River Basin
The Yellow River Basin (YRB) is the second largest river basin in China and sixth largest globally. As the cradle of Chinese civilization, it provides water resources for approximately 140 million people while irrigating 15% of China's agricultural land. The YRB spans nine provinces, traversing the Tibetan Plateau, Loess Plateau, and North China Plain before reaching the Bohai Sea. This expansive region exhibits dramatic spatial variability in elevation, precipitation, and temperature. Mean annual precipitation ranges from 123mm to 1021mm, increasing from northwest to southeast. Mean annual temperatures vary from -4°C to 14°C with latitude and elevation [8]. To enable systematic prediction of meteorological and hydrological drought risks across this heterogeneous basin, the YRB was delineated into six subzones based on distinct climatic and topographic characteristics (Figure 1). Detailed traits of each subzone are available in Li et al. [13]. This zonal delineation will facilitate spatial analysis of meteorological and hydrological drought hazards across the climatically and geographically diverse YRB.
2.2. Data sources
2.2.1. NEX-GDDP data
Projections of future climate under varying emissions scenarios are valuable for assessing meteorological and hydrological drought hazards. The National Aeronautics and Space Administration Earth Exchange Global Daily Downscaled Projections (NEX-GDDP) dataset provides statistically downscaled climate projections at high temporal (daily) and spatial (0.25° x 0.25°) resolutions [28,29]. Compared to traditional general circulation models (GCMs), the NEX-GDDP increases spatial resolution and enhances simulation of extreme climate values in the historical period, especially for topographically complex regions. This improves the accuracy of future climate change projections [30]. Several studies utilizing NEX-GDDP for meteorological drought analyses demonstrate its promise as a source of localized and regional-scale climate projections [31,32]. Therefore, this study employs the NEX-GDDP dataset to represent future climate conditions for assessing meteorological drought risk, as well as providing meteorological inputs for evaluating hydrological drought risk. The high-resolution NEX-GDDP data enables robust examination of potential future drought hazards in the topographically and climatically diverse YRB.
Given the BCC-CSM1-1 model within the NEX-GDDP dataset demonstrates skillful simulation and robust predictive capacity for China's climate conditions [33], downscaled projections from this model were selected for the period 2025-2060 under two Representative Concentration Pathway (RCP) scenarios (RCP4.5 and RCP8.5) to evaluate meteorological and hydrological drought risks across the YRB.
2.2.2. Observation data
Meteorological data from 1970-2015, including daily maximum and minimum temperature, precipitation, humidity, solar radiation, and wind speed records from 121 weather stations (Figure 1), were obtained from the National Climate Center of China. To calibrate and validate the SWAT model, naturalized monthly streamflow data from 1970-2015 at five hydrological stations (Figure 1) were acquired from the Yellow River Conservancy Commission. Naturalized streamflow refers to flow that excludes direct anthropogenic influences, such as reservoir storage, irrigation, and industrial, domestic and agricultural water withdrawals [13]. These high-resolution meteorological and hydrological records enable robust calibration and validation of the SWAT model prior to simulating future hydrological conditions across the climatically and topographically diverse YRB.
2.2.3. Spatial data
The spatial data utilized included a digital elevation model (DEM), a digital stream network, a soil map, and four land use/land cover (LULC) maps. The 30m resolution DEM data was extracted from the National Aeronautics and Space Administration's Shuttle Radar Topography Mission (SRTM) Digital Elevation Model. The 1:1,000,000 scale soil map and LULC maps for 1980, 1990, 2000, 2010 and 2020 were acquired from the Data Center for Resources and Environmental Sciences, Chinese Academy of Sciences. This high-resolution spatial data enables accurate characterization of the topographically and environmentally diverse YRB for hydrological modeling and analysis of LULC changes.
3. Methodologies
3.1. Meteorological and hydrological drought indexes
The selection or development of appropriate meteorological and hydrological drought indices is critical for predicting associated risks. Numerous metrics have been proposed for characterizing meteorological and hydrological droughts [13,34,35]. Meteorological drought indices predominantly include the Standardized Precipitation Index (SPI) [36], Precipitation Anomaly Percentage (PAP) [26], Standardized Precipitation Evapotranspiration Index (SPEI) [37], and Reconnaissance Drought Index (RDI) [38]. The SPEI and RDI are well-suited for capturing meteorological drought, as they incorporate precipitation and evapotranspiration, direct drought drivers [39]. Compared to the SPEI, the RDI demonstrates greater sensitivity to environmental changes and clearer evaluation criteria by fitting a distribution function to the precipitation-potential evapotranspiration ratio [40]. Therefore, this study utilizes the RDI as the meteorological drought index. RDI calculation details are available in Tsakiris and Vangelis [41], with classification shown in Table 1.
Several standardized indices have been developed in recent decades for characterizing hydrological drought, including the Surface Water Supply Index (SWSI) [42], Palmer Hydrological Drought Severity Index (PHDI) [43], Standardized Runoff Index (SRI) [44], and Standardized Streamflow Index (SSI) [45]. However, these metrics predominantly characterize surface runoff or streamflow, neglecting the groundwater component. Groundwater (recharge and discharge) also significantly influences hydrological drought as it plays a vital role in hydrological processes [46,47,48]. Therefore, this study employs the Nonlinear Joint Hydrological Drought Index (NJHDI) proposed in our previous study by Li et al. [13] to characterize hydrological drought. The NJHDI comprehensively considers surface water, groundwater, and their nonlinear interconnections. Details on the NJHDI procedures and classification are available in Li et al. [13]. The classification of NJHDI is same as the RDI in Table 1.
3.2. LULC prediction model
3.2.1. CA- Markov model
The Markov chain-cellular automata (CA-Markov) model is a robust approach for modeling and predicting land use/land cover (LULC) change across temporal scales, as it integrates the temporal Markov method with spatial cellular automata techniques [49,50]. The Markov chain is a stochastic modeling method based on the assumption that a system's state probability at a given time can be determined from its earlier state [51]. It has been widely applied to study LULC change dynamics, accurately predicting the magnitude of change at broad scales, but lacks spatial distribution capabilities as spatial categories are not considered [52]. In contrast, the cellular automata (CA) model incorporates spatial attributes by permitting computational experiments on spatial arrangements over time [53]. Coupling CA with Markov modeling has become a predominant technique for LULC change assessment and prediction [54,55,56,57,58].
Therefore, this study utilizes the CA-Markov model to predict future spatial-temporal LULC patterns based on historical trends. The CA-Markov module in IDRISI Andes v17.0 [55] is applied, following five key steps: (1) Calculate LULC transition probability matrix using spatial overlay of historical LULC maps; (2) Determine CA transition rules describing cell state changes; (3) Generate suitability maps defining transition potential; (4) Select 5x5 CA filters to define neighborhood cells; (5) Predict LULC maps for target years based on transition matrix and suitability maps. Further CA-Markov details are available in [54]. This approach couples Markovian temporal modeling with spatial CA techniques to robustly project LULC trends.
3.2.2. Accuracy assessment
In this study, the Kappa statistic is utilized to assess the accuracy and validity of the CA-Markov model. The Kappa statistic serves as a reliable metric for evaluating the agreements in the spatial patterns between two maps [56]. The calculation of Kappa is performed as follows:
where Po represents the proportion of units that agree, while Pc represents the proportion of units in agreement with the expected change. If the value of Kappa falls between 0 and 0.4, it indicates a low level of agreement between the two maps. Conversely, if Kappa ranges from 0.4 to 0.7, it signifies a moderate level of agreement. Finally, if Kappa surpasses 0.7, it suggests a high level of agreement between the two maps.
3.3. SWAT model
The Soil and Water Assessment Tool (SWAT) is a physically based distributed hydrological model that operates in continuous time. It is capable of effectively representing the intricate hydrological processes occurring in watersheds with varying meteorological, land use/land cover (LULC), soil, and geographical conditions, at different temporal scales (daily, monthly, and yearly) [59,60]. Therefore, in this study, the SWAT model is employed to simulate the hydrological processes influenced by climate and LULC changes.
The performance of the SWAT model is assessed using three metrics: the Nash-Sutcliffe coefficient (Ens) [61], coefficient of determination (R2), and percentage bias (PBIAS) [62]. According to Moriasi et al. [63], satisfactory performance of the SWAT model at the monthly scale is indicated by Ens > 0.5, R2 > 0.6, and |PBIAS| < 25%.
3.4. Drought event and characteristics definition
The occurrence of a drought event is primarily characterized by drought onset, drought duration, drought severity, and drought termination. Among these, drought duration and drought severity are considered the key indicators for defining a drought event [26]. In this study, the runs theory [64] is utilized to identify a drought event, as well as to determine the duration (D) and severity (S) of the drought. The duration (D) of a drought event is represented by the length of the consecutive dry period, while the severity (S) quantifies the total magnitude of the dry periods, as illustrated in Figure 2.
In Figure 2, two thresholds at -0.5 and 0 are presented on the Y-axis. When the monthly drought index (RDI or NJHDI) falls below -0.5, the corresponding month is classified as a drought month. If the drought index in the subsequent month exceeds 0, or if the drought indexes in the following two months are both within the range of -0.5 and 0, the duration of the drought (D) is denoted as D1, and D1 is equal to the value "a". Alternatively, if the drought index in the second month falls within the range of -0.5 and 0, but then in the third month drops below -0.5, the duration of the drought (D) is referred to as D2, and D2 is calculated as the sum of "b", "d2", and "c". Drought severity (S) is defined as the absolute sum of the drought index values observed during a drought period.
3.5. Copula-based drought risk assessment model
Given that drought duration (D) and drought severity (S) are crucial characteristics of drought events, the assessment of drought risk in this study involves the examination of the joint probability distribution of D and S within a specified range of thresholds. In order to analyze drought risk across various temporal scales, drought events are further categorized into sub-seasonal drought and seasonal drought.
3.5.1. Definition of sub-seasonal drought and seasonal drought
In accordance with the definition of drought event and its characteristics provided in section 3.4, the drought duration (D) represents the count of consecutive dry months within a drought period. On the other hand, the drought severity (S) is quantified as the absolute sum of the drought index values observed throughout the entire duration of the drought, as depicted in equation (2).
where I is drought index such as RDI and NJHDI. n is the number of dry months during a drought period.
In the context of a drought event, the duration of the drought is directly proportional to the magnitude of n. To differentiate between short-duration and long-duration drought events, this study introduces two classifications based on the duration of the drought. If the drought duration (D) falls within a single season, i.e., when n is less than or equal to three, the drought event is categorized as a sub-seasonal drought. Conversely, if the drought duration (D) exceeds three months, the drought event is classified as a seasonal drought.
According to the classification of the drought index presented in Table 1, it is established that a month is designated as dry if the corresponding drought index value (I) is less than or equal to -0.5. Furthermore, based on equation (2), it is determined that the severity of the drought (S) during such dry months is greater than or equal to 0.5. In the case of a drought persisting for two or three months, the severity (S) increases to a minimum threshold of 1.0 or 1.5, respectively. Consequently, for a sub-seasonal drought (Figure 3a), the threshold for the severity (S) should be set at least as high as the minimum value among all drought severity (S) in Figure 3a, which is larger than or equal to 0.5. Similarly, for a seasonal drought (Figure 3b), where the drought duration (D) exceeds three months and the corresponding drought severity (S) is greater than or equal to 1.5, the threshold for S should also be set at least as high as the minimum value among all drought severity (S) in Figure 3b, which is larger than or equal to 1.5.
In general, when a drought event is recognized as a sub-seasonal drought or a seasonal drought, the corresponding drought duration (D) and drought severity (S) should be both satisfy the following conditions:
Sub-seasonal drought:
Seasonal drought:
3.5.2. Sub-seasonal and seasonal drought risk assessment models
Copula function can be used to calculate the joint probability distribution of drought duration (D) and drought severity (S) that are both less than or equal to a given threshold as below:
Based on equation (3), the sub-seasonal and seasonal drought risk probability models are established by mathematical deduction as follows:
Sub-seasonal drought risk assessment model:
Seasonal drought risk assessment model:
whereandare the marginal distribution functions of drought duration (D) and drought severity (S), respectively. is the copula joint probability distribution.
In this study, we employ the exponential distribution, lognormal distribution, and gamma distribution to fit the marginal distribution of drought duration (D) and drought severity (S). Furthermore, we utilize the Clayton, Frank, and Gumbel-Hougaard copulas to model the joint probability distribution. The selection of the most appropriate marginal distribution and copula functions is determined using the minimum Akaike information criterion (AIC) and bias. These criteria are crucial in ensuring the accuracy and reliability of the selected distributions and copulas.
4. Results and discussion
4.1. LULC prediction in the YRB
The CA-Markov model, which employs equal intervals for simulating and predicting Land Use and Land Cover (LULC) patterns, utilizes the LULC patterns in 1990 and 2000 to predict the LULC in 2010, and the patterns in 2000 and 2010 to predict the LULC in 2020. To assess the accuracy of the CA-Markov model, Kappa coefficients are calculated for 2010 and 2020 by comparing the simulated LULC with observed data using the crosstab module in IDRISI. The resulting Kappa coefficients for 2010 and 2020 are 0.8792 and 0.8850, respectively, both exceeding 0.7, indicating the suitability and reliability of the CA-Markov model for predicting future LULC changes in the YRB.
Based on the CA-Markov model, the historical LULC pattern in 2020 serves as the initial point, combined with historical patterns in 2010, 2000, 1990 and 1980, to predict the LULC patterns in 2030, 2040, 2050 and 2060 using 10, 20, 30 and 40 CA iterations, respectively. The results are illustrated in Figure 4, and quantification of LULC area change characteristics during the period of 2020-2060 is presented in Table 2. Analysis of Figure 4 and Table 2 reveals a significant decline in grassland and cropland areas by approximately 14% in 2060 compared to 2020. Conversely, the areas of the remaining four LULC types are projected to increase. Notably, the build-up area exhibits the most substantial expansion, estimated to be nearly 260% larger in 2060 than in 2020. This expansion can be attributed to rapid urban economic development, increased employment opportunities, and the migration of rural populations to urban areas, thereby accelerating the process of urbanization in the future.
4.2. SWAT model calibration and validation
The YRB is initially divided into 381 sub-basins, ranging in size from 6 km2 to 12,176 km2, based on the Digital Elevation Model (DEM) and channel network. Subsequently, these sub-basins are further partitioned into 1850 hydrological response units (HRUs) using thresholds of 8% for dominant LULC types in 2020, 10% for soil patterns, and 8% for slopes within each sub-basin. This division allows for improved simulation accuracy and a better understanding of the hydrological processes in the YRB. To calibrate and validate the SWAT model for the period of 1970-2015, streamflow observations from the main hydrological stations (see Figure 1) are utilized. These stations, located within each subzone, are selected as they represent the variability and availability of the hydrological processes in the YRB.
This study employs a monthly time step for model runs. The spin-up period utilizes the naturalized stream records from 1970 to generate initial conditions for the model experiment. Model calibration is then performed using the naturalized stream records from 1971 to 1990, while model validation uses data from 1991 to 2015. The calibration and validation results, evaluated using three metrics (i.e., R2 and PBIAS), are presented in Table 3. Analysis of Table 3 reveals that the values of R2 and in both calibration and validation periods exceed 0.6 and 0.7, respectively. Additionally, the absolute values of PBIAS remain within 25%. These results indicate that the SWAT model performs satisfactorily and is capable of reasonably simulating the hydrological processes impacted by climate and LULC changes in the YRB.
4.3. Meteorological drought risk prediction
4.3.1. Selection of the appropriate marginal distribution
In order to determine an appropriate marginal distribution for meteorological drought, the exponential distribution, lognormal distribution, and gamma distribution were employed to model drought duration and severity under RCP 4.5 and RCP 8.5 scenarios. The selection of the best-fitting marginal distributions was based on the minimum values of AIC and Bias, using the AIC and Bias methods. The results are presented in Table 4. It is evident from Table 4 that the error values of the exponential distribution, for both drought duration (D) and drought severity (S), exhibit the lowest values within each subzone under both RCP 4.5 and RCP 8.5 scenarios. This indicates that the goodness-of-fit of the exponential distribution is superior. Therefore, in this study, the exponential distribution is chosen as the appropriate marginal distribution to model meteorological drought duration and severity in the six subzones of the YRB under the two scenarios.
4.3.2. Selection of the appropriate copula function
Once the marginal distribution function is determined, the joint probability of two marginal distributions is modeled using the Clayton, Frank, and Gumbel copulas. The selection of the best-fitting copula is based on the minimum values of AIC and Bias, using the AIC and Bias methods. The fitting errors are presented in Table 5. From the analysis of Table 5, it is evident that the error values of the Frank copula, within each subzone and under both the RCP 4.5 and RCP 8.5 scenarios, are the lowest. This indicates that the Frank copula exhibits the optimal goodness-of-fit effect. Consequently, in this study, the Frank copula is chosen as the appropriate copula function to construct the meteorological drought risk assessment model.
4.3.3. Prediction of meteorological drought risk in the YRB
Utilizing the meteorological drought risk assessment model, predictions are made for the risks of sub-seasonal and seasonal meteorological droughts in the future years of 2025-2060 across the six subzones of the YRB under the RCP 4.5 and RCP 8.5 scenarios. In order to provide a clearer representation of the spatial variation in meteorological drought risk, the spatial risk distributions of sub-seasonal and seasonal meteorological droughts under the two scenarios are illustrated in Figure 5.
Figure 5 reveals that the risks associated with seasonal meteorological droughts remain below 10% throughout the entire YRB under both scenarios. This suggests that the occurrence of seasonal meteorological droughts in the YRB is not expected to be significant in the next 35 years. However, sub-seasonal meteorological drought risks range from 40% to 50% within each subzone, indicating a potential increase in the frequency of sub-seasonal meteorological droughts in the YRB in the future. Additionally, the risk of sub-seasonal meteorological droughts is marginally higher in the upstream subzones (A, B, C) compared to the middle and lower reaches (D, E, F), with risks ranging from 46% to 50% in the upstream and 41% to 45% in the middle and lower reaches. When comparing the RCP 4.5 and RCP 8.5 scenarios, the risk of sub-seasonal meteorological droughts remains relatively stable, except for a 5% increase in the middle stream of zone E under the RCP 8.5 scenario.
4.4. Hydrological drought risk prediction
4.4.1. Selection of the appropriate marginal distribution
In a similar manner to the analysis performed for meteorological drought, the selection of appropriate marginal distributions for hydrological drought is based on the minimum values of AIC and Bias. The results, presented in Table 6, demonstrate the fitting error values for the exponential distribution in relation to both drought duration (D) and drought severity (S) within each subzone under the RCP 4.5 and RCP 8.5 scenarios.
Table 6 clearly indicates that the error values for the exponential distribution, when fitting either drought duration or drought severity, are the lowest within each subzone under both the RCP 4.5 and RCP 8.5 scenarios. This suggests that the exponential distribution provides the best goodness-of-fit. As a result, the exponential distribution is selected as the appropriate marginal distribution in this study to model the hydrological drought duration and severity across the six zones of the YRB under the two scenarios.
4.4.2. Selection of the appropriate copula function
Additionally, in order to select the appropriate copula, the minimum AIC and Bias values are utilized. The fitting errors are presented in Table 7. Analysis of Table 7 reveals that in the PCP 4.5 scenario, the Gumbel copula exhibits the minimum error values in zone A and zone C, while the Frank copula displays the minimum error values in the remaining four zones in the YRB. Consequently, the Gumbel copula is chosen as the suitable copula function for constructing the hydrological drought risk assessment model in zone A and zone C, whereas the Frank copula is selected for constructing the hydrological drought risk assessment model in the other four zones in the YRB. Under the PCP 8.5 scenario, the Frank copula demonstrates the minimum error values in the YRB, with the exception of zone A where the Gumbel copula presents the minimum error value. Therefore, the Gumbel copula is chosen as the appropriate copula function for constructing the hydrological drought risk assessment model in zone A, while the Frank copula is selected for constructing the hydrological drought risk assessment model in the other five zones in the YRB.
4.4.3. Prediction of hydrological drought risk in the YRB
Figure 6 illustrates the spatial distributions of sub-seasonal and seasonal hydrological drought risks under the RCP 4.5 and RCP 8.5 scenarios in the future years of 2025-2060 across the six subzones of the YRB. From Figure 6, it is evident that both sub-seasonal and seasonal hydrological drought risks exhibit significant spatial variability over the next 35 years. Under the RCP 4.5 scenario, sub-zone C and sub-zone E are projected to experience higher risks of sub-seasonal hydrological droughts, ranging from 45% to 50%. However, these two subzones will have lower risks of suffering from seasonal hydrological droughts, as their risks will be less than 10%. Sub-zones A and B will face risks ranging from 20% to 40% for sub-seasonal hydrological droughts, but their risks for seasonal hydrological droughts will decrease by 10% to 20%. Sub-zones D and F will have risks of 10% to 30% for sub-seasonal hydrological droughts, while their risks for seasonal hydrological droughts will increase to 30% to 40%. Under the RCP 8.5 scenario, sub-zone C will be the most susceptible to experiencing sub-seasonal hydrological droughts, with a probability of 45% to 50%. However, it will be the least prone to occur seasonal hydrological droughts, with a probability of less than 10%. Sub-zones A, B, and E will have higher risks of sub-seasonal hydrological droughts, ranging from 20% to 40%. Nevertheless, these subzones will have lower risks of suffering from seasonal hydrological droughts, as their risks will be within the range of 10% to 20%. Conversely, sub-zones D and F will be more susceptible to seasonal hydrological droughts, with probabilities ranging from 30% to 40%. However, their risks for sub-seasonal hydrological droughts will decrease to 20% to 30%.
In general, the YRB is expected to be vulnerable to sub-seasonal hydrological drought, with risks ranging from 30% to 50%. Spatially, zones C and E, which both belong to the Loess Plateau, exhibit the highest risks of experiencing sub-seasonal hydrological droughts, with probabilities ranging from 45% to 50%. It is important to note that the Loess Plateau is characterized by an extremely fragile ecological environment, making recovery from such drought events challenging.
4.5. Analysis of the future concerns regarding sub-seasonal and seasonal droughts
It is challenging to assess whether the sub-seasonal and seasonal droughts, as defined in this study, will be of concern in the future for the YRB without understanding the extent to which future statistics deviate from historical data. Therefore, an analysis of the frequencies of sub-seasonal and seasonal droughts during the historical period from 1970 to 2015 is conducted to gain insights into their potential concerns in the future. The findings of this analysis are presented in Figure 7.
Based on Figure 7, it is evident that the YRB experienced a higher likelihood of sub-seasonal droughts in both meteorology and hydrology compared to seasonal droughts during the historical period. In terms of meteorological drought, the frequency of sub-seasonal drought ranged from 21% to 30% across the YRB, with little variation across different spatial zones. However, the frequency of seasonal drought in the upper reaches of the basin was slightly higher than in the lower reaches. Specifically, zones A and B exhibited drought frequencies of 11% to 20%, while the frequencies in the other four zones were less than 10%. Regarding hydrological drought, there was substantial spatial variation in both sub-seasonal and seasonal drought frequencies during the historical period. Zones B and F had similar frequencies (11% to 20%) for both sub-seasonal and seasonal drought occurrences. Zones C and E had higher probabilities of experiencing sub-seasonal droughts, with frequencies ranging from 21% to 30%. However, these two zones rarely experienced seasonal droughts, with frequencies below 10%. Conversely, zones A and D were more prone to seasonal droughts than sub-seasonal droughts. The frequency of seasonal droughts in these zones was 21% to 30%, while the frequency of sub-seasonal droughts decreased to 0% to 10% in zone A and 11% to 20% in zone D.
Compared to the historical period, the risks of sub-seasonal meteorological and hydrological droughts in the entire YRB will significantly increase in the next 35 years under the RCP 4.5 and RCP 8.5 scenarios. The upstream areas (A, B, C) will experience a 30%-35% higher risk of sub-seasonal meteorological drought under both scenarios, with a range of 46%-50%. In the middle and lower reaches (D, E, F), the risk under the RCP 4.5 scenario will be 25%-30% higher than historical levels, with a range of 41%-45%. However, under the RCP 8.5 scenario, the risks of sub-seasonal meteorological droughts will vary across zone D, zone E, and zone F, with increases of 25%-30%, 30%-35%, and 20% respectively compared to historical levels. Regarding sub-seasonal hydrological droughts, zone C will face the highest risk under both RCP 4.5 and RCP 8.5 scenarios in the future, with a 30%-35% increase compared to historical levels. Similarly, zone E under the RCP 4.5 scenario will experience a 30%-35% higher risk in the next 35 years. However, for the other four zones, the risks of sub-seasonal hydrological droughts will not be a significant concern in the future, as the increases in risk will be below 10% compared to the historical period.
However, in comparison to the historical conditions, the likelihood of experiencing seasonal meteorological and hydrological droughts in the majority of the YRB will remain relatively unchanged in the next 35 years under the RCP 4.5 and RCP 8.5 scenarios. The risks associated with seasonal meteorological drought in the entire YRB under both scenarios are very low, with probabilities below 10%. However, it is important to monitor the downstream area of the YRB (zone F) in the future, as the risk of seasonal hydrological drought in this region will be 20% higher than in the historical period.
In summary, the future sub-seasonal meteorological and hydrological droughts in the YRB should be a cause for concern. Specifically, greater attention should be given to the upstream areas of the YRB (A, B, C) in relation to sub-seasonal meteorological droughts, as the risks in these regions will be 30%-35% higher than in the historical period. Similarly, the Loess Plateau (C, E) should be closely monitored in relation to sub-seasonal hydrological droughts, as the risks in these areas will also be 30%-35% higher than historical conditions. Regarding seasonal droughts, meteorological droughts in the entire YRB will not be a concern in the future, but it is crucial to focus on the downstream area of the YRB (zone F) in the next 35 years, as the risk of seasonal hydrological droughts in this region will increase by 20% compared to historical conditions.
4.6. The relationship between meteorological and hydrological drought risk patterns
Upon analyzing Figure 5 and Figure 6, it becomes evident that significant disparities exist between meteorological and hydrological drought risk patterns. In comparison to hydrological drought, the YRB is projected to be more susceptible to sub-seasonal meteorological drought rather than seasonal meteorological drought in the future, according to two scenarios. This implies that the frequency of meteorological drought will surpass that of hydrological drought. However, the duration of hydrological drought is expected to be longer than that of meteorological drought. The elevated frequency of meteorological drought can be attributed to two primary factors. Firstly, if the intensity of meteorological drought remains relatively mild within a certain time frame, it may not trigger a hydrological drought. Secondly, due to successive meteorological droughts, the short intervals between hydrological droughts make it easier to identify them as drought events. This, in turn, contributes to the higher frequency of meteorological drought. The shorter duration of meteorological drought is primarily a result of the ease with which the balance between precipitation and evaporation can be restored through an increase in precipitation or a decrease in evaporation. However, when it comes to changes in surface water and groundwater, they are more likely to lag behind for extended periods of time. In other words, surface water and groundwater may not recover immediately once the meteorological drought is alleviated. Consequently, the duration of hydrological drought exceeds that of meteorological drought.
From a hydrological cycle perspective, it is widely acknowledged that there exists a definitive linkage between meteorological drought and hydrological drought. The equilibrium between precipitation and evaporation is known to be easily disrupted as meteorological conditions fluctuate, often resulting in the onset of meteorological drought. When meteorological drought persists over an extended period, it engenders two key factors that trigger hydrological drought. Firstly, the prolonged meteorological drought intensifies surface water evaporation and groundwater evaporation, thereby depleting the available surface water and groundwater resources. Secondly, this extended meteorological drought can lead to the thickening and drying of the vadose zone, impeding the runoff yield of surface water and the recharge of groundwater. These two aspects play a pivotal role in inducing hydrological drought, as a prolonged meteorological drought ultimately culminates in the occurrence of hydrological drought. The specific duration of this phenomenon is not only influenced by climate factors but is also closely intertwined with the characteristics of the region's underlying surfaces. Different land use and land cover (LULC) patterns can give rise to distinct mechanisms of runoff generation, consequently exacerbating or mitigating hydrological drought within the same climatic conditions. For instance, woodland and grassland exhibit higher water-holding capacities in the soil, facilitating increased water recharge into groundwater. As a result, when meteorological drought occurs, these LULC patterns can to some extent alleviate the severity of hydrological drought in comparison to urbanized areas.
Based on the land use and land cover (LULC) projections presented in section 4.1, it is evident that urban development, particularly in the middle and downstream regions of the YRB, will experience significant expansion in the future. This expansion of urban areas will have a profound impact on the occurrence of hydrological drought when meteorological drought events transpire. The increased urbanization can hinder the recharge of groundwater due to the presence of impermeable underlying surfaces during periods of precipitation deficit.
This finding further elucidates the reasons behind the projected concerns of sub-seasonal hydrological drought in zone C and zone E, as well as seasonal hydrological drought in zone F, as highlighted in section 4.5. The substantial expansion of urban land in these zones exacerbates the challenges associated with hydrological drought, as the limited recharge of groundwater during meteorological droughts becomes even more difficult due to the impermeable nature of the underlying surfaces.
ident that the error values of the Frank copula, within each subzone and under both the RCP 4.5 and RC
5. Summaries and conclusions
The prediction of both meteorological and hydrological drought risks is essential for establishing early warning systems for drought disasters and formulating effective measures to minimize future drought impacts. In this study, future climate projections for the period 2025-2060 under RCP 4.5 and RCP 8.5 scenarios are obtained using the BCC-CSM1-1 data from the NASA Earth Exchange Global Daily Downscaled Projections (NEX-GDDP) dataset. This downscaled climate dataset provides daily precipitation, as well as daily maximum and minimum temperatures for the YRB. Additionally, the CA-Markov model is employed to simulate and predict future land use and land cover (LULC) change scenarios within the YRB. By combining the future climate scenarios with the projected LULC patterns, a copula-based drought risk assessment model is utilized to estimate the risks of sub-seasonal and seasonal meteorological and hydrological droughts in different regions of the YRB for the next 35 years (2025-2060).
To determine the significance of these future drought events, a comparative analysis is conducted by comparing them to historical drought events. This assessment helps identify whether these projected meteorological and hydrological droughts should be of concern in the future. Lastly, the study analyzes the differences and linkages between the patterns of meteorological and hydrological drought risk, shedding light on their interconnection.
The findings indicate that both sub-seasonal meteorological and hydrological droughts in the YRB will be significant issues in the future. Specifically, greater attention should be given to the sub-seasonal meteorological drought in the upstream areas of the YRB (A, B, C), as the risks in these regions are 30%-35% higher compared to the historical period. Similarly, increased focus is needed on the sub-seasonal hydrological drought in the Loess Plateau (C, E), where the risks are also 30%-35% higher than in the historical period. On the other hand, the future impact of seasonal meteorological drought in the YRB is projected to be negligible, with a low risk level below 10%. However, the downstream area of the YRB (zone F) should be alarmed about the future occurrence of hydrological drought, as the risk will increase by 20% compared to historical conditions. The concerns regarding hydrological droughts in zones C, E, and F primarily stem from the rapid urban land expansion anticipated in the middle and downstream areas of the YRB, which will exacerbate the occurrence of hydrological droughts when meteorological droughts happen.
Great efforts have been made in this study to investigate and predict the spatial risk distributions of sub-seasonal and seasonal meteorological and hydrological droughts scientifically. The results can help decision-makers to find the high-risk occurring zones of meteorological and hydrological droughts more clearly and easily, and hence can prevent and mitigate corresponding local droughts more effectively. In addition, the methods used in this study can apply to other region or basins' for drought risk prediction. Although it has stepped forward an important progress in drought risk prediction with considering not only the variations of future climate conditions, but also the changes in future underlying land surfaces, the present study neglects the influence of future water resource development and utilization (e.g., reservoir storage, irrigation, industrial, domestic and agricultural water consumption) on hydrological drought risk prediction, which will be pursued in our future study.
This study represents a significant effort to scientifically investigate and forecast the spatial distribution of sub-seasonal and seasonal meteorological and hydrological drought risks. The findings have important implications for decision-makers, as they provide clear and accessible information about high-risk areas for meteorological and hydrological droughts. This knowledge can facilitate more effective prevention and mitigation strategies for local drought events. Furthermore, the methodologies employed in this study can be applied to other regions or basins for drought risk prediction.
While this study represents an important advancement in drought risk prediction by considering future climate conditions and changes in underlying land surfaces, it should be noted that the influence of future water resource development and utilization (such as reservoir storage, irrigation, industrial, domestic, and agricultural water consumption) on hydrological drought risk prediction has not been taken into account. This aspect will be addressed in future research endeavors.
Author Contributions
Y.L.: investigation, formal analysis, and writing—original draft. Y.H.: conceptualization and methodology. J.F.: investigation and formal analysis. H.Z. and Y.C.: validation. X.W. and Q.D.: methodology and supervision. All authors have read and agreed to the published version of the manuscript.
Funding
This research was funded by the National Natural Science Foundation of China (Grant number 52009053), Natural Science Foundation of Mianyang Normal University (Grant number QD2020A06), and National Natural Science Foundation of China (Grant number 52209013, 52209008, 32101363).
Institutional Review Board Statement
Not applicable.
Informed Consent Statement
Not applicable.
Conflicts of Interest
The authors declare no conflict of interest.
References
- EM-DAT: Disasters in numbers, www.emdat.be/ (last access: 14 March 2013), 2012. 3.
- EEA: Urban adaptation to climate change in Europe, Challenges and opportunities for cities together with supportive national and European policies, European Environment Agency, Report No 2/2012, Copenhagen, Denmark, 2012, 3, 44, 61. 3.
- Peterson, T.C., Alexander L.V., Allen M.R., Anel J.A., Zhou T. J. Explaining extreme events of 2012 from a climate perspective. Bull. Am. Meteorol. Soc. 2013, 94, S1–S74. [CrossRef]
- Dutra, E., Pozzi W., Wetterhall F., Giuseppe F. D., Magnusson L., Naumann G., Barbosa P., Vogt J., Pappenberger F., 2014. Global meteorological drought - part 2: seasonal forecasts. Hydrol. Earth Syst. Sci. 2014, 11, 919–944.
- Seager, R., Hoerling M., Schubert S., Wang H., Lyon B., Kumar A., Nakamura J., Henderson N. Causes of the 2011–14 California Drought, J. Climate 2015, 28, 6997–7024.
- Hao, Z.; Singh, V.P.; Xia, Y. Seasonal drought prediction: advances, challenges, and future prospects. Reviews of Geophysics 2018, 56, 108–141. [Google Scholar] [CrossRef]
- Liu, Y.; Shan, F.Z.; Yue, H.; Wang, X.; Fan, Y.H. Global analysis of the correlation and propagation among meteorological, agricultural, surface water, and groundwater droughts [J]. Journal of environment management 2023, 333. [Google Scholar] [CrossRef]
- Huang, S.Z.; Chang, J.X.; Leng, G.Y.; Huang, Q. Integrated index for drought assessment based on variable fuzzy set theory: a case study in the Yellow River basin, China. Journal of Hydrology 2015, 527, 608–618. [Google Scholar] [CrossRef]
- Ma, M.; Ren, L.; Singh, V.P.; Fei, Y.; Lu, C.; Yang, X. Hydrologic model-based palmer indices for drought characterization in the yellow river basin, China. Stochastic Environmental Research & Risk Assessment 2016, 30, 1401–1420. [Google Scholar]
- Wang, F.; Wang, Z.M.; Yang, H.B.; Di, D.Y.; Zhao, Y.; Liang, Q.H.; Hussain, Z. Copula-Based Drought Analysis Using Standardized Precipitation Evapotranspiration Index: A Case Study in the Yellow River Basin, China. Water 2019, 11. [Google Scholar] [CrossRef]
- Song, M.W. , Jiang, X.H., Lei, Y.X., Zhao, Y.R., Cai, W.J., 2023. Spatial and temporal variation characteristics of extreme hydrometeorological events in the Yellow River Basin and their effects on vegetation [J]. Natural Hazards. [CrossRef]
- Zhu, Y.L.; Chang, J.X.; Huang, S.Z.; Huang, Q. Characteristics of integrated droughts based on a nonparametric standardized drought index in the Yellow River Basin, China. Hydrology Research 2016, 47, 454–467. [Google Scholar] [CrossRef]
- Li, Y.Y.; Luo, L.F.; Chang, J.X.; Wang, Y.M.; Guo, A.J.; Fan, J.J.; Liu, Q. Hydrological drought evolution with a nonlinear joint index in regions with significant changes in underlying surface. J. Hydrol. 2020, 585. [Google Scholar] [CrossRef]
- Wang, F.; Wang, Z.M.; Yang, H.B.; Di, D.Y.; Zhao, Y.; Liang, Q.H.; Hussain, Z. Comprehensive evaluation of hydrological drought and its relationships with meteorological drought in the Yellow River basin, China. Journal of hydrology 2020, 584, 124751. [Google Scholar] [CrossRef]
- Li; Y; Xie, Z.X.; Qin, Y.C.; Xia, H.M.; Zheng, Z.C.; Zhang, L.J.; Pan, Z.W.; Liu, Z.Z. Drought Under Global Warming and Climate Change: An Empirical Study of the Loess Plateau. Sustainability 2019, 11, 1281. [CrossRef]
- Ma, M.W.; Yuan, F.; Cui, H.J.; Ren, L.L.; Liu, Y. A comprehensive analysis of meteorological drought stress over the Yellow River basin (China) for the next 40 years. International journal of climatology 2021, 41, E2927–E2948. [Google Scholar] [CrossRef]
- Zhang, G.D.; Zhang, Z.X.; Li, X.Y.; Zheng, B.Q.; Zhang, X.L. Evolution Characteristics of Meteorological Drought under Future Climate Change in the Middle Reaches of the Yellow River Basin Based on the Copula Function [J]. Water 2023, 15. [Google Scholar] [CrossRef]
- Li, Y.Y.; Chang, J.X.; Luo, L.F.; Wang, Y.M.; Guo, A.J.; Fan, J.J. Spatiotemporal impacts of land use land cover changes on hydrology from the mechanism perspective using swat model with time-varying parameters. Hydrology Research 2019, 50, 244–261. [Google Scholar] [CrossRef]
- Wong, G.; Van Lanen, H.A.J.; Torfs, P.J.J.F. Probabilistic analysis of hydrological drought characteristics using meteorological drought. Hydrol. Sci. J.-Journal des Sciences Hydrologiques 2013, 58, 253–270. [Google Scholar] [CrossRef]
- Zhang, D.D.; Yan, D.H.; Lu, F.; Wang, Y.C.; Feng, J. Copula-based risk assessment of drought in Yunnan province, China. Natural Hazards 2015, 75, 2199–2220. [Google Scholar] [CrossRef]
- Yang, J.; Chang, J.X.; Wang, Y.M.; Li, Y.Y.; Hu, H.; Chen, Y.T.; Yao, J. Comprehensive drought characteristics analysis based on a nonlinear multivariate drought index. Journal of Hydrology 2018, 557, 651–667. [Google Scholar] [CrossRef]
- She, D.; Xia, J. Copulas-based drought characteristics analysis and risk assessment across the loess plateau of China. Water Resources Management 2018, 32, 1–18. [Google Scholar] [CrossRef]
- Ullah, H.; Akbar, M. Bivariate Drought Risk Assessment for Water Planning Using Copula Function in Balochistan. J. Environmental and modeling & assessment 2023, 28, 447–464. [Google Scholar] [CrossRef]
- Zhang, Q.; Xiao, M.Z.; Vijay, P. Singh, Chen X.H. Copula-based risk evaluation of droughts across the pearl river basin, China. Theoretical and Applied Climatology 2013, 111, 119–131. [Google Scholar] [CrossRef]
- Xu, K.; Yang, D.W.; Xu, X.Y.; Lei, H.M. Copula based drought frequency analysis considering the spatio-temporal variability in Southwest China. J. Hydrol 2015, 527, 630–640. [Google Scholar] [CrossRef]
- Chang, J.X.; Li, Y.Y.; Wang, Y.M.; Yuan, M. Copula-based drought risk assessment combined with an integrated index in the Wei River Basin, China. Journal of Hydrology 2016, 540, 824–834. [Google Scholar] [CrossRef]
- Yang, X.; Li, Y.P.; Liu, Y.R.; Gao, P.P. A MCMC-based maximum entropy copula method for bivariate drought risk analysis of the Amu Darya River Basin. Journal of Hydrology 2020, 590, 125502. [Google Scholar] [CrossRef]
- Ali, J.; Syed, K.H.; Gabriel, H.F.; Saeed, F.; Ahmad, B.; Bukhari, S.A.A. Centennial heat wave projections over Pakistan using ensemble nex gddp data set. Earth Systems & Environment 2018, 1–18. [Google Scholar]
- Das, S.; Das, J.; Umamahesh, N.V. Identification of future meteorological drought hotspots over Indian region: A study based on NEX-GDDP data [J]. Int. J. Climatol. 2021, 41, 5644–5662. [Google Scholar] [CrossRef]
- Wu, Y.; Miao, C.; Duan, Q.; Shen, C.; Fan, X. Evaluation and projection of daily maximum and minimum temperatures over China using the high-resolution NEX-GDDP dataset. Climate Dynamics 2020, 55, 1–15. [Google Scholar] [CrossRef]
- Singh, S.; Jain, S.K.; Singh, P.K. Inter-comparisons and applicability of CMIP5 GCMs, RCMs and statistically downscaled NEX-GDDP based precipitation in India. Science of total environment 2019, 697. [Google Scholar] [CrossRef]
- Li, Y.; Chen, Y.; Wang, F.; He, Y.; Li, Z. Evaluation and projection of snowfall changes in High Mountain Asia based on NASA’s NEX-GDDP high-resolution daily downscaled dataset. Environ. Res. Lett. 2020, 15. [Google Scholar] [CrossRef]
- Xiong, Y.; Xin, X.; Kou, X. Simulation and Projection of Near-Surface Wind Speeds in China by BCC-CSM Models. Journal of Meteorological Research 2019, 33, 149–158. [Google Scholar] [CrossRef]
- Vicente-Serrano, S.; Schrier, G.; Beguería, S.; Azorin-Molina, C.; Lopez-Moreno, J. Contribution of precipitation and reference evapotranspiration to drought indices under different climates. Journal of Hydrology 2015, 526, 42–54. [Google Scholar] [CrossRef]
- Cammalleri, C.; Micale, F.; Vogt, J. A novel soil moisture-based drought severity index (DSI) combining water deficit magnitude and frequency. Hydrological Processes 2016, 30, 289–301. [Google Scholar] [CrossRef]
- Mckee, T. , Doesken N., Kleist J., (1993). The Relationship of drought frequency and duration to time scales. Proceedings of the Eighth Conference on Applied Climatology. American Meteorological Society: Boston.
- Wang, H.; He, B.; Zhang, Y.; Huang, L.; Chen, Z.; Liu, J. Response of ecosystem productivity to dry/wet conditions indicated by different drought indices. Science of the Total Environment 2018, 612, 347–357. [Google Scholar] [CrossRef]
- Khan, M.I.; Dong, L.; Qiang, F.; Faiz, M.A. Detecting the persistence of drying trends under changing climate conditions using four meteorological drought indices. Meteorological Applications 2018, 13, 184–194. [Google Scholar] [CrossRef]
- Chen, H.; Sun, J. Changes in drought characteristics over China using the standardized precipitation evapotranspiration index. Journal of Climate 2015, 28, 5430–5447. [Google Scholar] [CrossRef]
- Zarch, M.A.A.; Sivakumar, B.; Sharma, A. Droughts in a warming climate: a global assessment of standardized precipitation index (SPI) and reconnaissance drought index (RDI). Journal of Hydrology 2015, 526, 183–195. [Google Scholar] [CrossRef]
- Tsakiris, G.; Vangelis, H. Establishing a drought index incorporating evapotranspiration. Europe Water 2005, 3–11. [Google Scholar]
- Hoekema, D.J.; Sridhar, V. Relating climatic attributes and water resources allocation: a study using surface water supply and soil moisture indices in the snake river basin, Idaho. Water Resources Research 2011, 47, 209–216. [Google Scholar] [CrossRef]
- Palmer, W.C. , 1965. Meteorological drought, Res. Pap. 45, p. 58, U.S. Weather Bur., Washington, D.C.
- Wang, D.; Hejazi, M.; Cai, X.; Valocchi, A. Climate change impact on meteorological, agricultural, and hydrological drought in central Illinois. Water Resour. Res. 2011, 47, W09527. [Google Scholar] [CrossRef]
- Svensson, C.; Hannaford, J.; Prosdocimi, I. Statistical distributions for monthly aggregations of precipitation and streamflow in drought indicator applications. Water Resources Research 2017, 53, 999–1018. [Google Scholar] [CrossRef]
- Shahid, S.; Hazarika, M. ; K Groundwater Drought in the Northwestern Districts of Bangladesh. Water Resour Manage 2010, 24, 1989–2006. [Google Scholar] [CrossRef]
- Li, B.; Rodell, M. Evaluation of a model-based groundwater drought indicator in the conterminous U. S. Journal of Hydrology 2015, 526, 78–88. [Google Scholar] [CrossRef]
- Ottosen, C.B.; Ronde, V.; Trapp, S.; Bjerg, P.L.; Broholm, M.M. Phytoscreening for Vinyl Chloride in Groundwater Discharging to a Stream. Ground water monitoring and remediation 2018, 38, 66–74. [Google Scholar] [CrossRef]
- Berberoğlu, S.; Akın, A.; Clarke, K.C. Cellular automata modeling approaches to forecast urban growth for adana, Turkey: A comparative approach. Landscape & Urban Planning 2016, 153, 11–27. [Google Scholar]
- Wangyel, W.; Lamchin, M.; Woo-Kyun, L. Land use and land cover change detection and prediction in Bhutan's high altitude city of Thimphu, using cellular automata and Markov chain. Environmental Challenges 2021, 2. [Google Scholar] [CrossRef]
- Weng, Q. Land use change analysis in the Zhujiang Delta of China using satellite remote sensing, GIS and stochastic modelling. Journal of Environmental Management 2002, 64, 273–284. [Google Scholar] [CrossRef] [PubMed]
- Guan, D.; Li, H.; Inohae, T.; Su, W.; Nagaie, T.; Hokao, K. Modeling urban land use change by the integration of cellular automaton and Markov model. Ecological Modelling 2011, 222, 3761–3772. [Google Scholar] [CrossRef]
- Fuglsang, M. , Münier Bernd, Hansen H.S. Modelling land-use effects of future urbanization using cellular automata: an eastern Danish case. Environmental Modelling & Software 2013, 50, 1–11. [Google Scholar]
- Halmy, M.W.A.; Gessler, P.E.; Hicke, J.A.; Salem, B.B. Land use/land cover change detection and prediction in the north-western coastal desert of Egypt using Markov-Ca. Applied Geography 2015, 63, 101–112. [Google Scholar] [CrossRef]
- Gong, W.F.; Yuan, L.; Fan, W.Y.; Stott, P. Analysis and simulation of land use spatial pattern in Harbin prefecture based on trajectories and cellular automata-Markov modelling. International Journal of Applied Earth Observation and Geoinformation 2015, 34, 207–216. [Google Scholar] [CrossRef]
- Ghosh, P.; Mukhopadhyay, A.; Chanda, A.; Mondal, P.; Akhand, A.; Mukherjee, S. Application of Cellular automata and Markov-chain model in geospatial environmental modeling- A review. Remote Sensing Applications Society & Environment 2017, 5, 64–77. [Google Scholar]
- Zhang, X.R.; Zhou, J.; Song, W. Simulating Urban Sprawl in China Based on the Artificial Neural Network-Cellular Automata-Markov Model. Sustainability 2020, 12. [Google Scholar] [CrossRef]
- Okba, W., Samir B., Moncef S.M. Modelling and Assessing the Spatiotemporal Changes to Future Land Use Change Scenarios Using Remote Sensing and CA-Markov Model in the Mellegue Catchment [J]. Journal of the Indian Society of Remote Sensing 2023, 51, 9–29. [CrossRef]
- Arnold, J.G.; Srinivasan, R.; Muttiah, R.S.; Williams, J.R. Large Area Hydrologic Modeling and Assessment Part I: Model Development. JAWRA J. Am. Water Resour. Association. 1998, 34, 73–89. [Google Scholar] [CrossRef]
- Woldesenbet, T.A.; Elagib, N.A.; Ribbe, L.; Heinrich, J. Hydrological responses to land use/cover changes in the source region of the Upper Blue Nile Basin, Ethiopia. Science of The Total Environment 2017, 575, 724–741. [Google Scholar] [CrossRef] [PubMed]
- Nash, J.E.; Sutcliffe, J.V. River flow forecasting through conceptual models part I: A discussion of principles. J. Hydrol. 1970, 10, 282–290. [Google Scholar] [CrossRef]
- Gupta H V, Sorooshian S, Yapo P O. Status of Automatic Calibration for Hydrologic Models: Comparison With Multilevel Expert Calibration[J].Journal of Hydrologic Engineering, 1999, 4, 135–143. [CrossRef]
- Moriasi, D.N.; Arnold, J.G.; Liew, M.W.V.; Bingner, R.L.; Harmel, R.D.; Veith, T.L. Model evaluation guidelines for systematic quantification of accuracy in watershed simulations. Trans. ASABE 2007, 50, 885–900. [Google Scholar] [CrossRef]
- Yevjevich, V.M. , 1967. An objective approach to definitions and investigations of continental hydrologic droughts. Hydrologic Paper. 23. Colorado State Univ., Fort Collins, CO.
Figure 1.
Map depicting the location and topography of the YRB and its six delineated zones. Zone A encompasses a semi-arid to semi-humid region with plateau climatic characteristics. Zone B represents a transitional zone between plateau and mid-temperate climates. Zone C comprises an arid to semi-arid region with mid-temperature climatic features. Zone D constitutes a semi-arid region with warm temperature climate traits. Zone E encompasses a semi-arid to semi-humid zone with temperate continental climate. Zone F constitutes a humid region with temperate monsoonal climate characteristics.
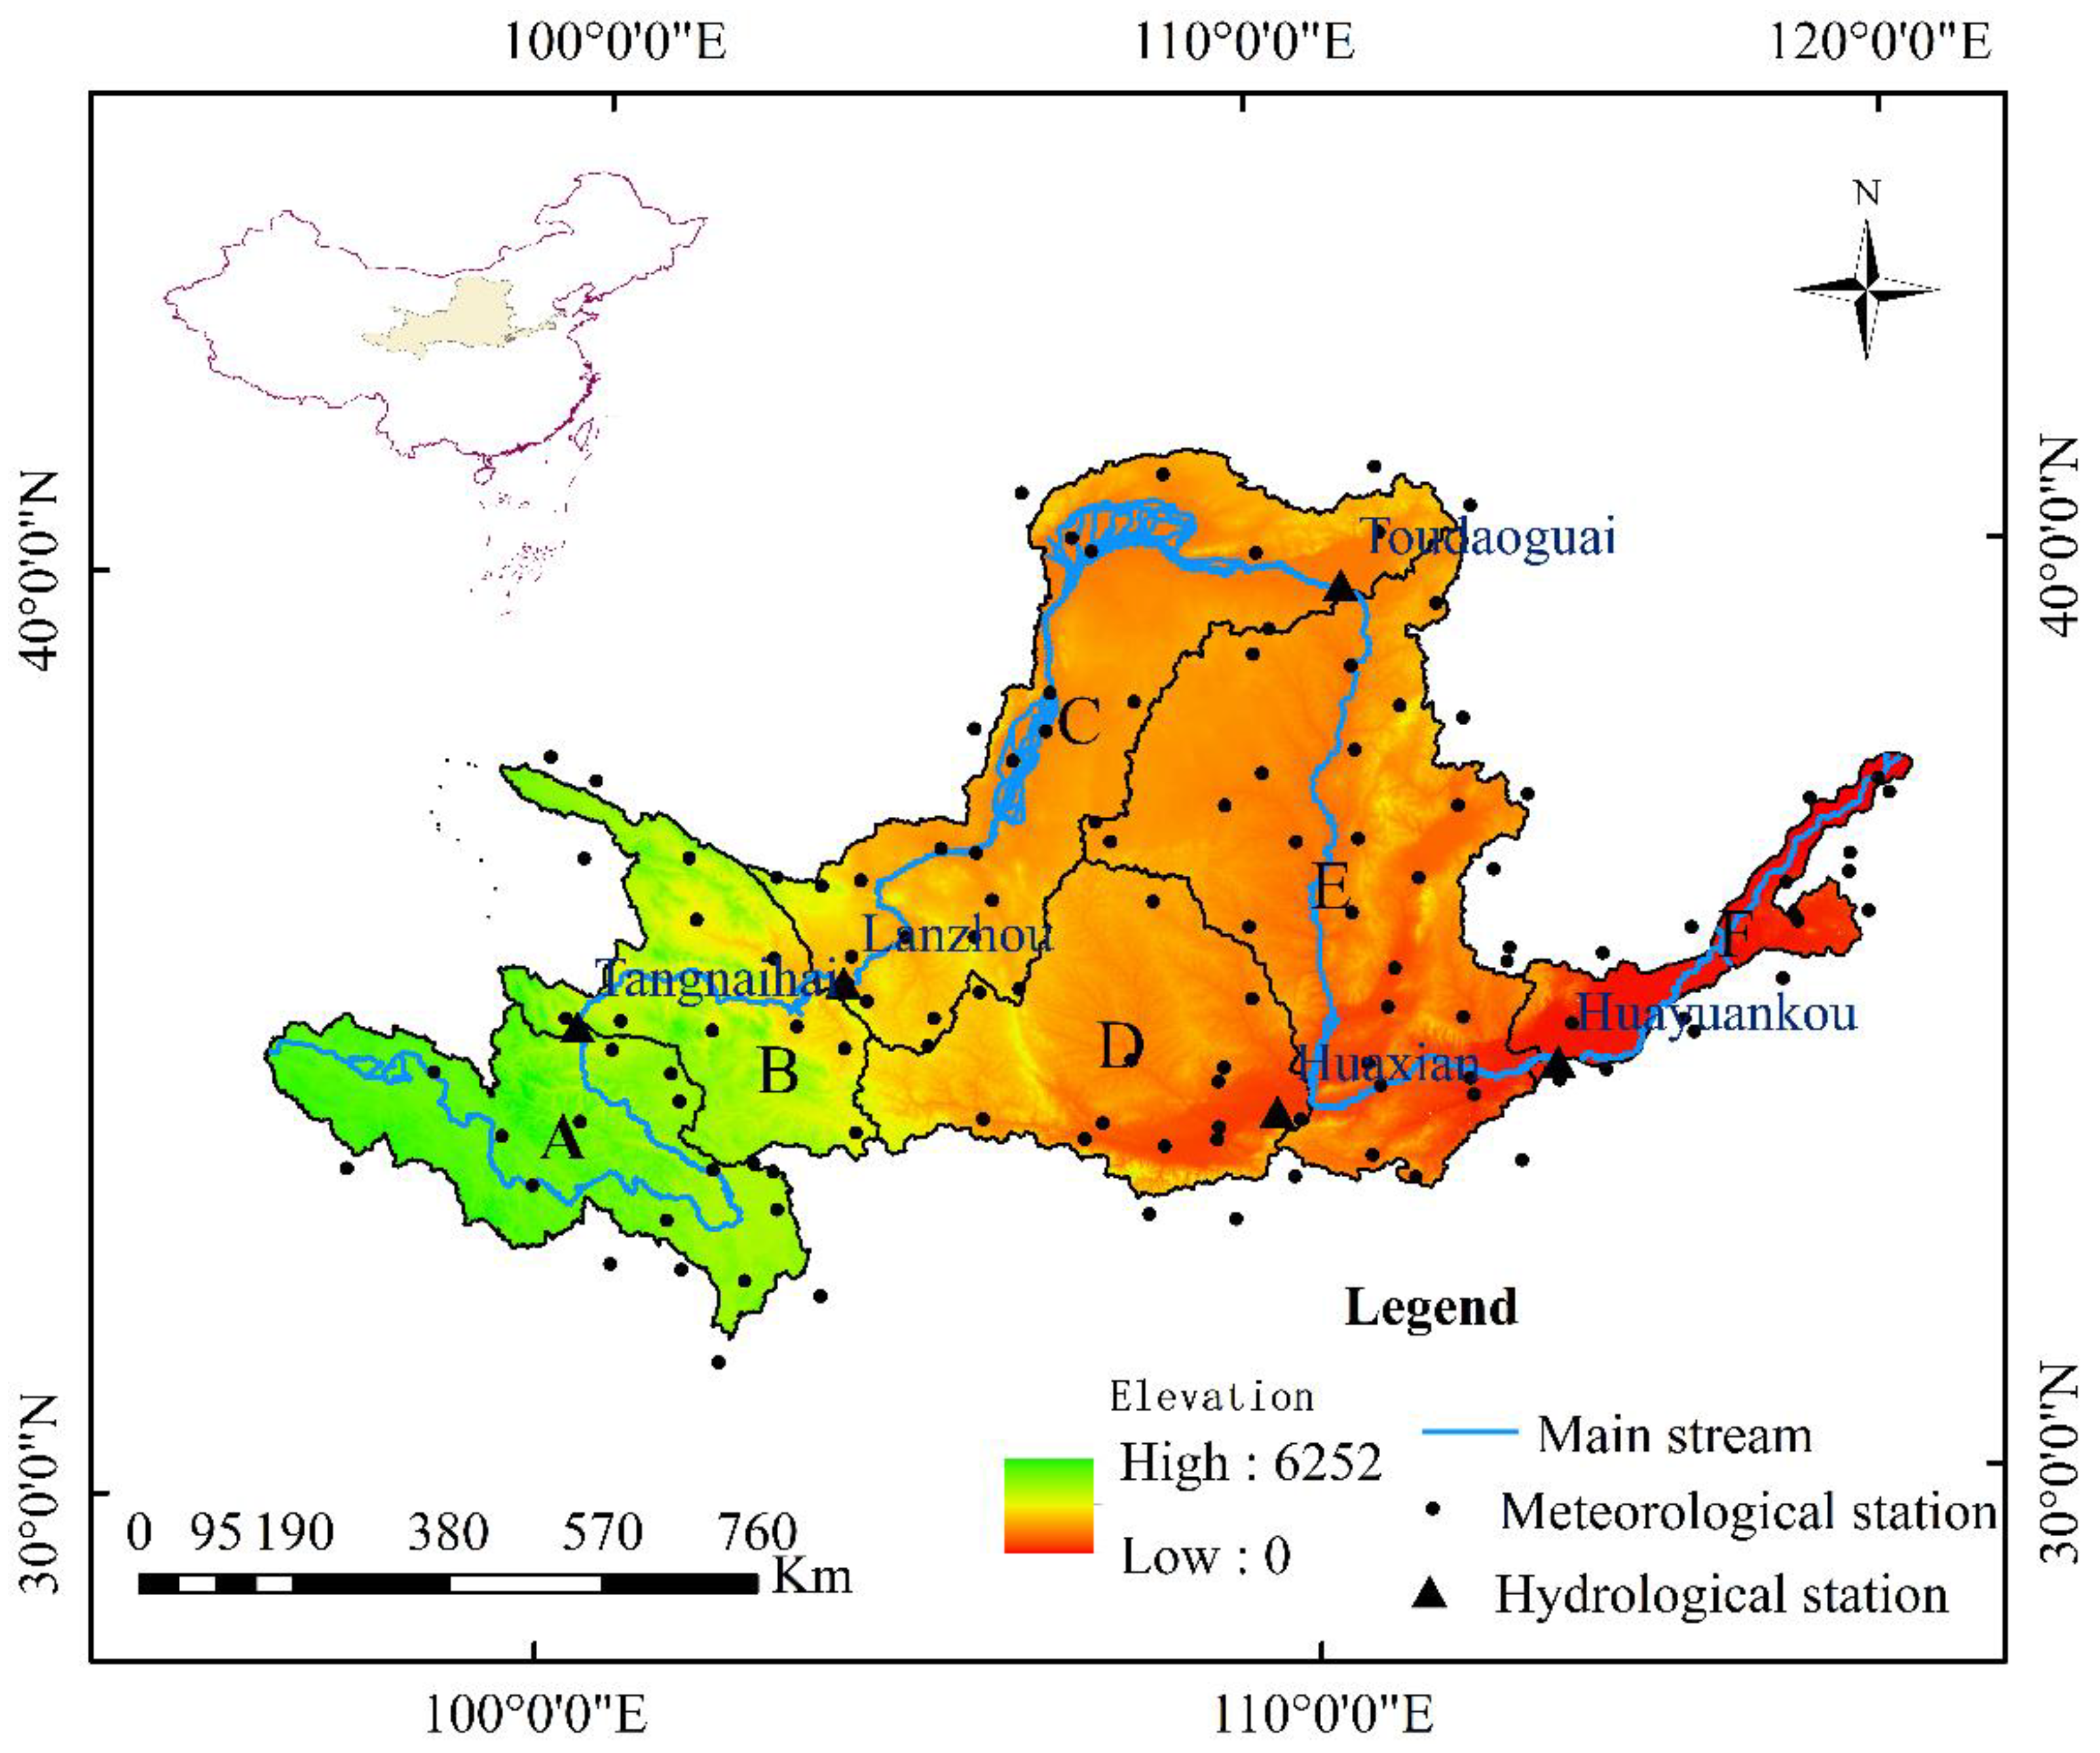
Figure 2.
Schematic diagram illustrating the identification of drought events and their characteristics.
Figure 2.
Schematic diagram illustrating the identification of drought events and their characteristics.
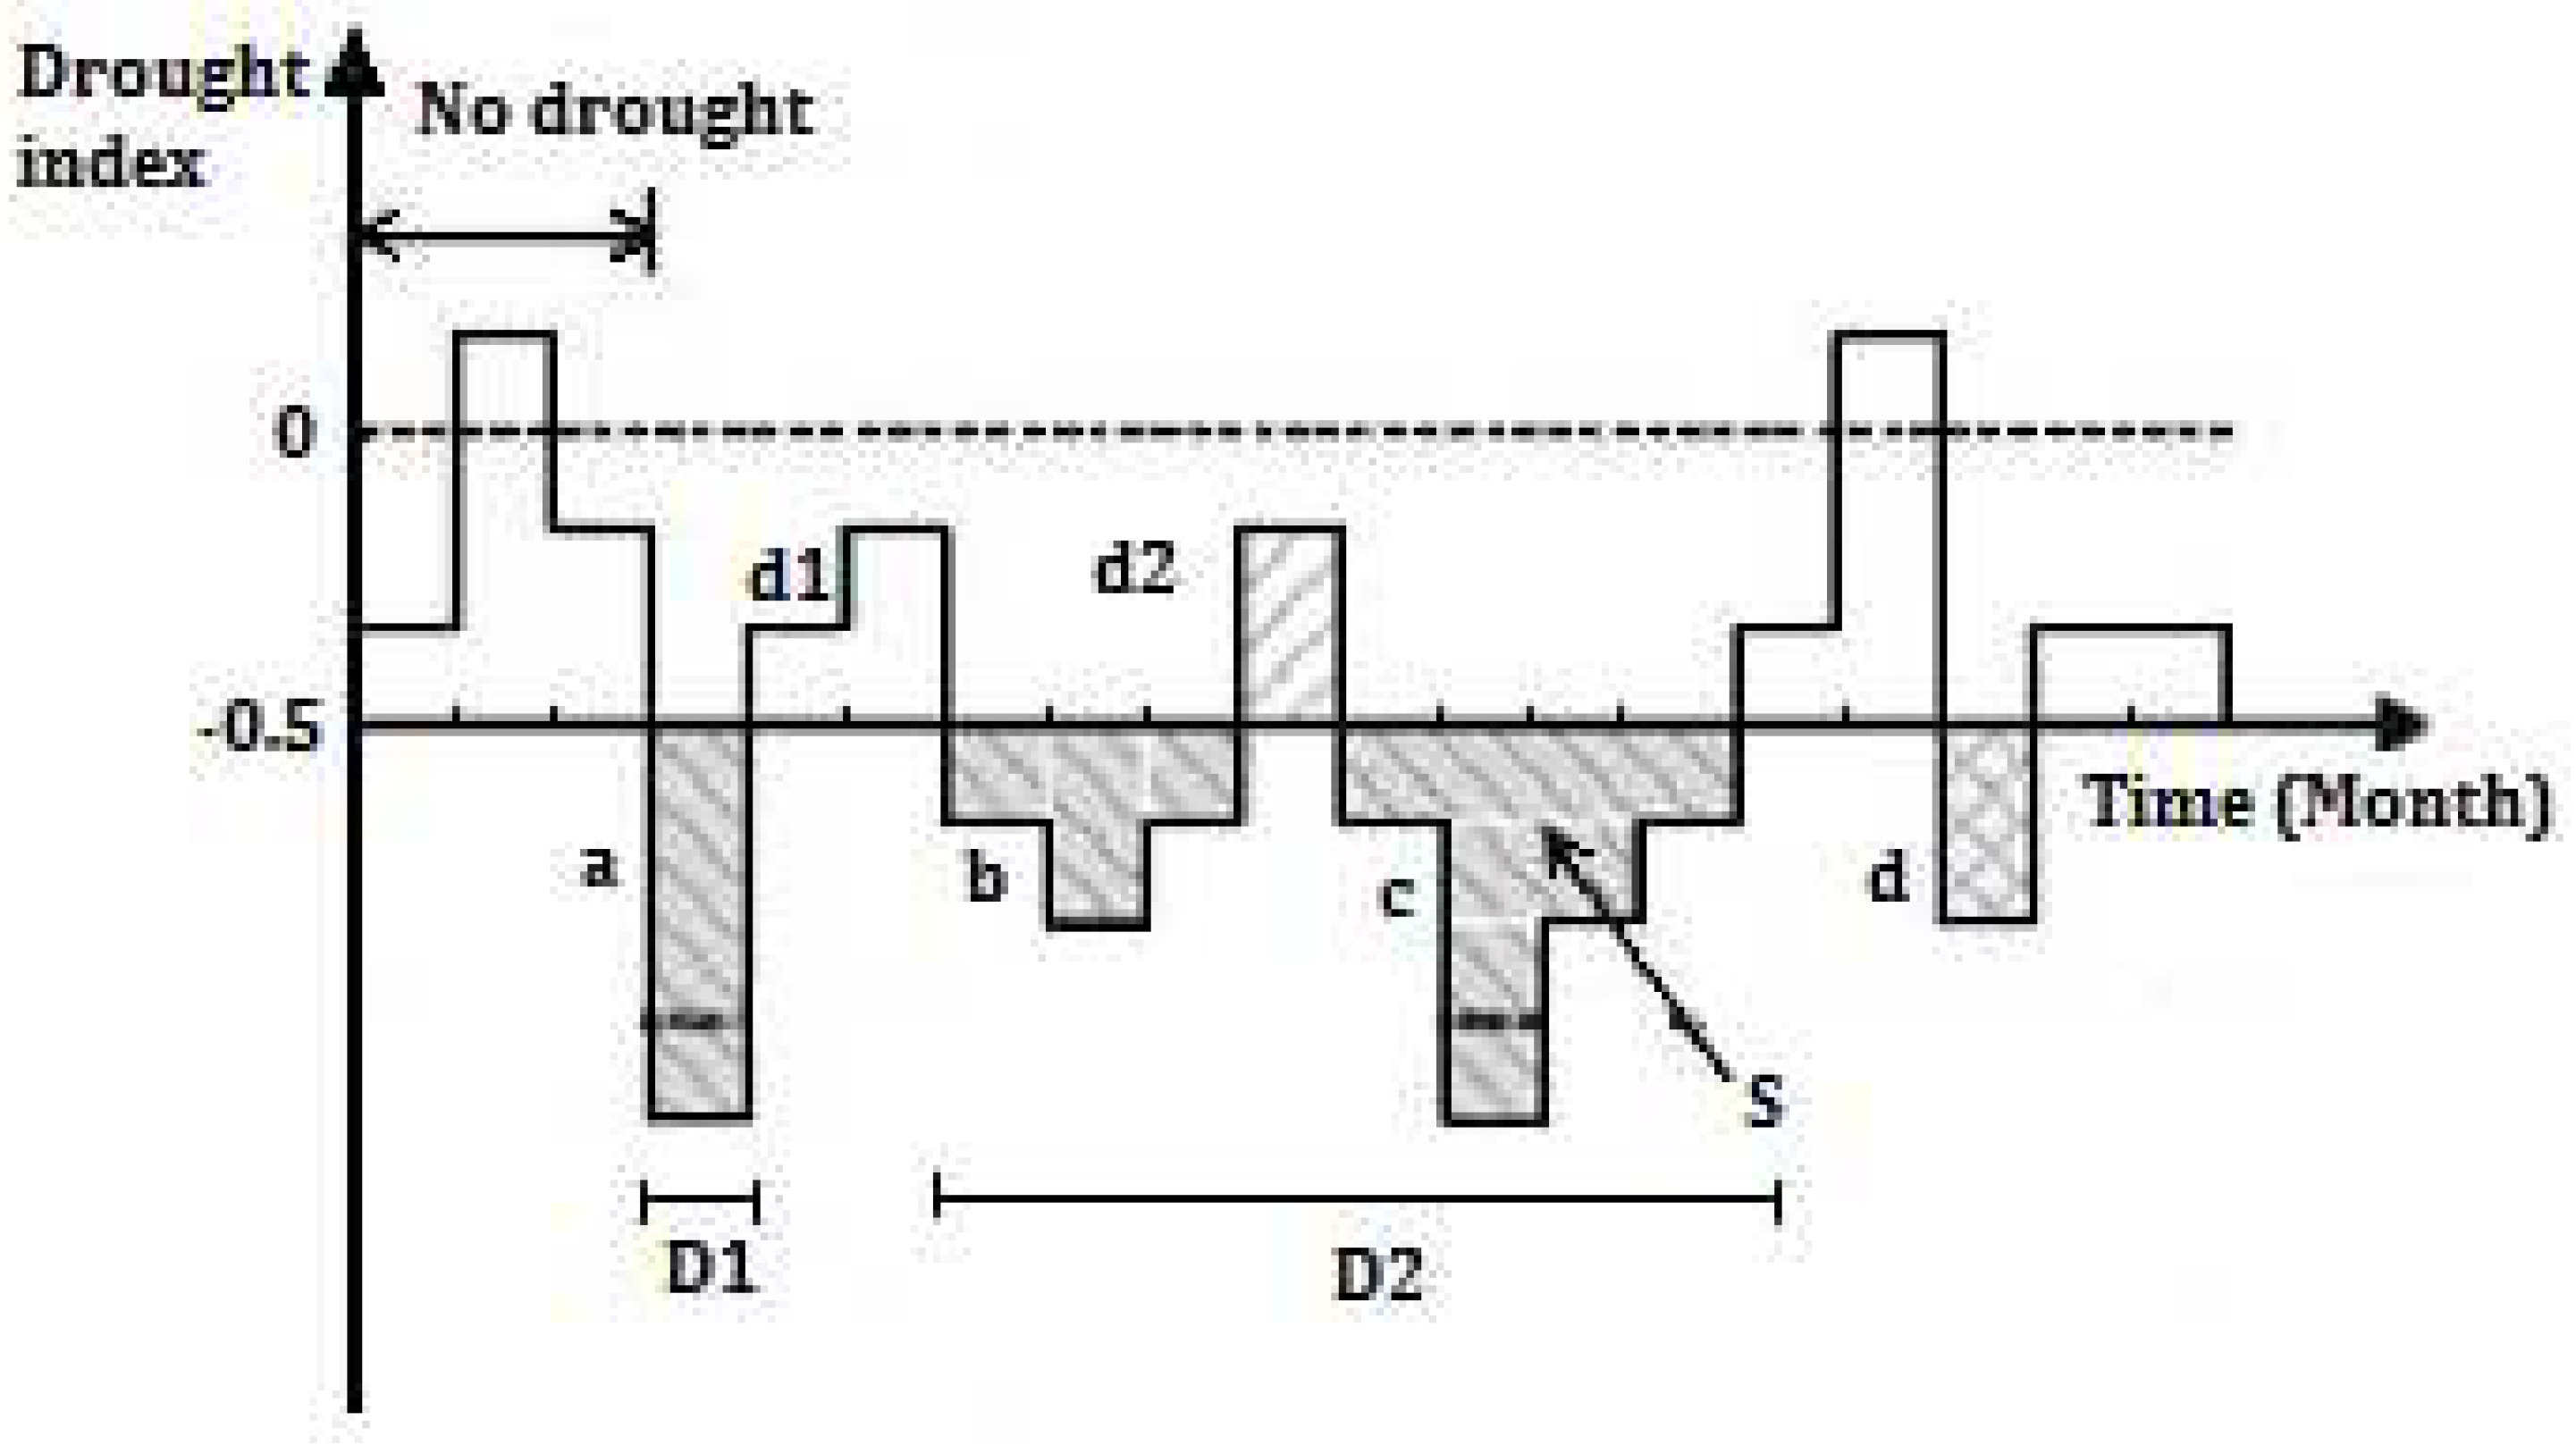
Figure 3.
The definition of D and S of sub-seasonal drought (a) and seasonal drought (b).
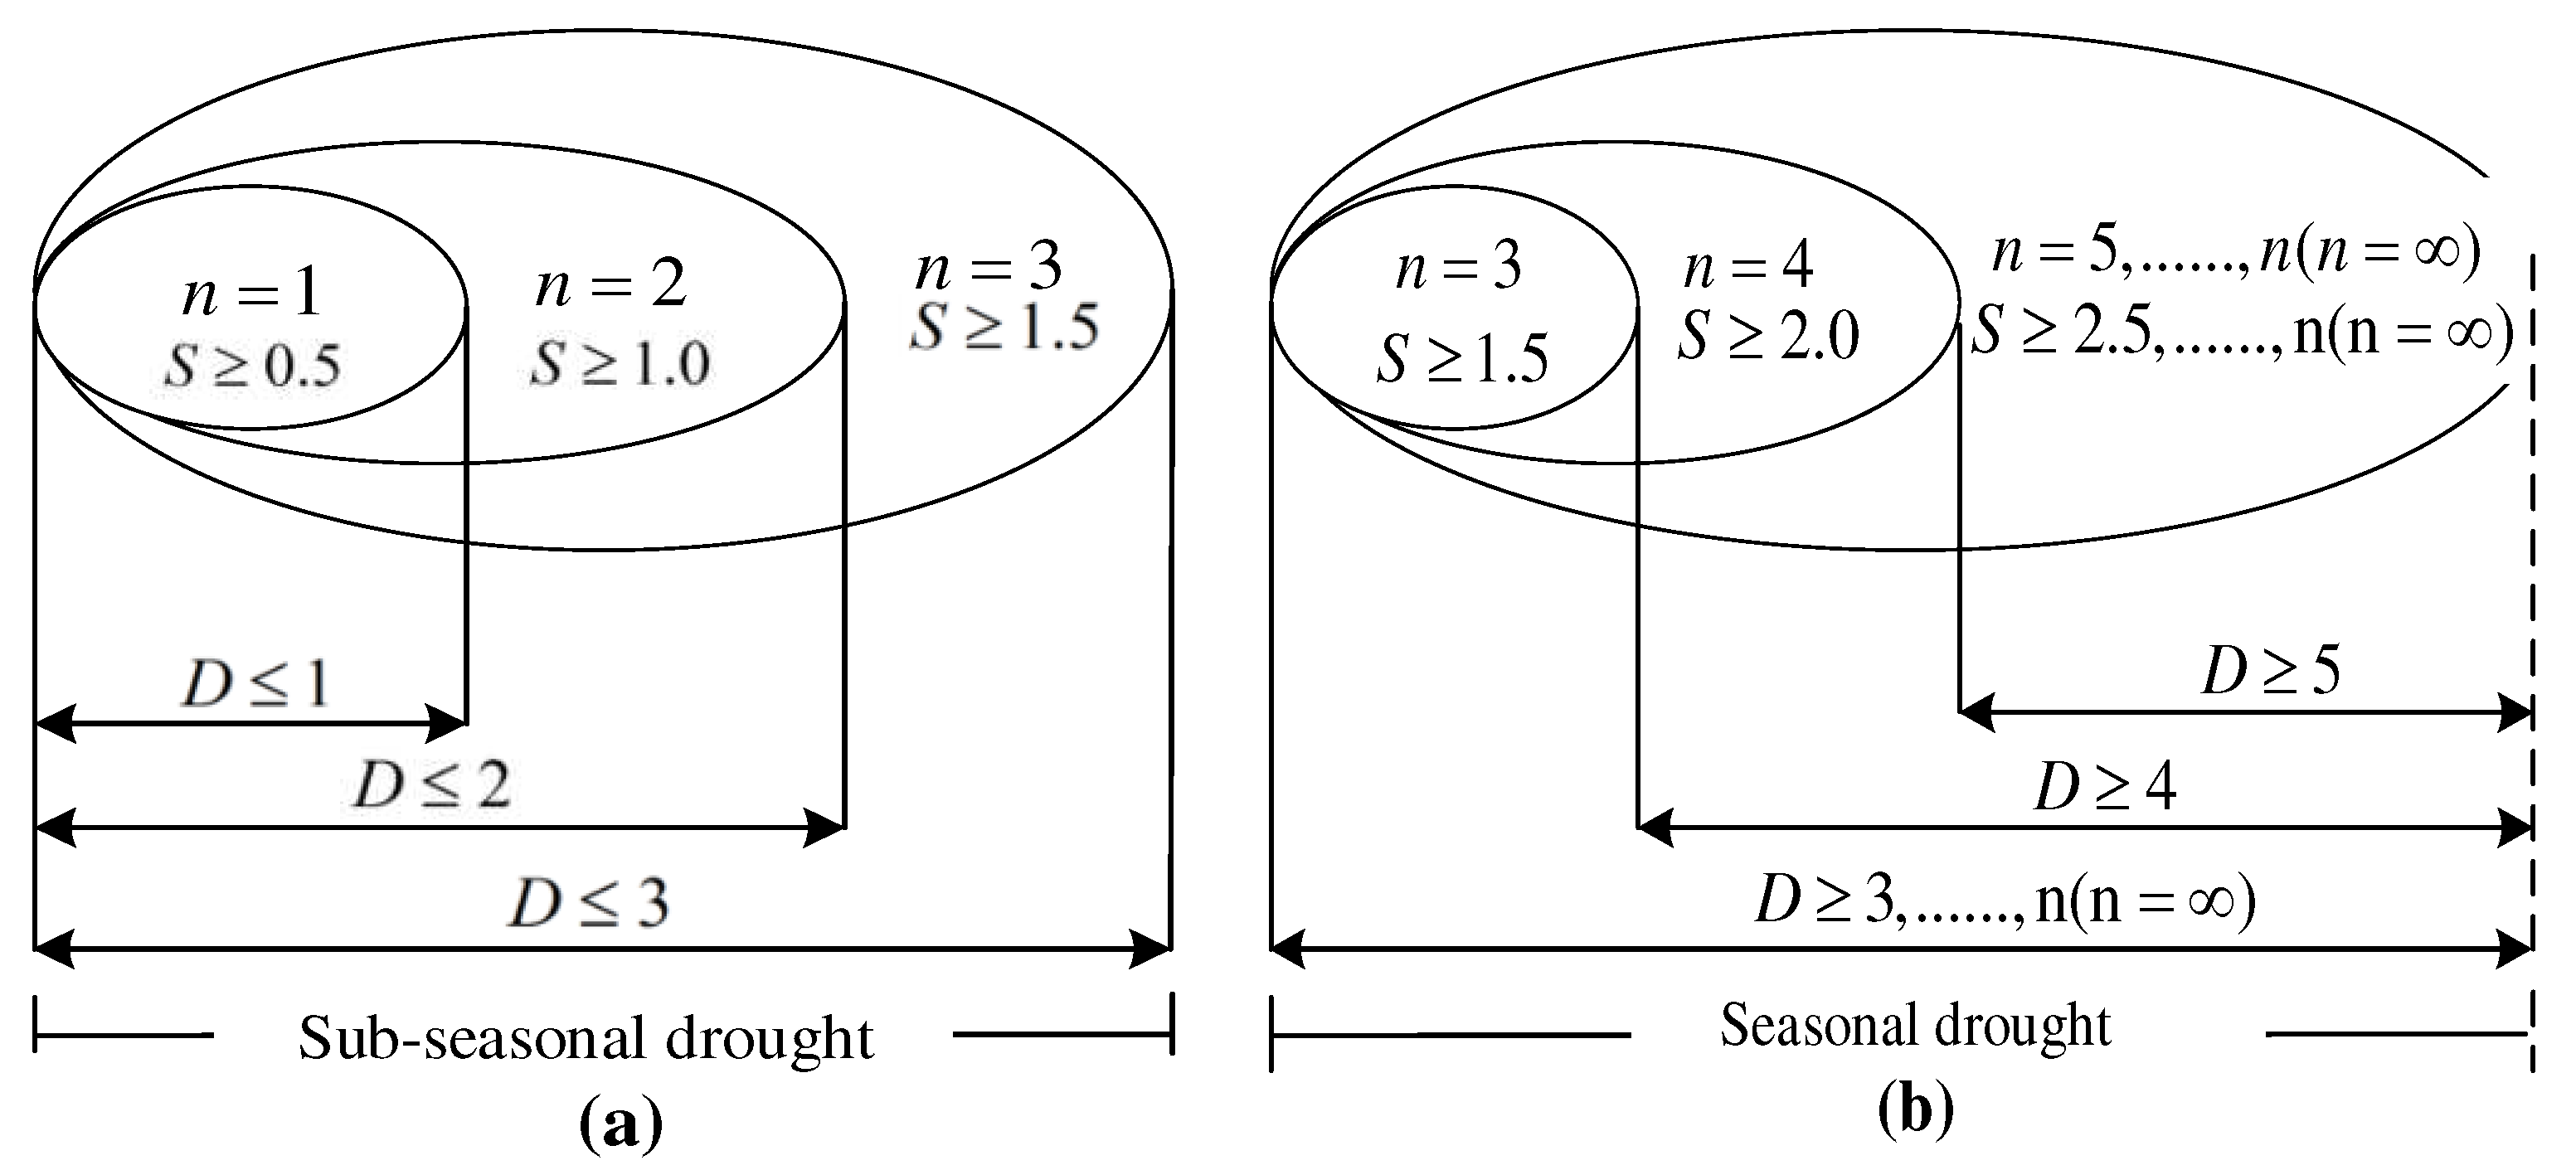
Figure 4.
Prediction of LULC patterns in 2030, 2040, 2050 and 2060 in the YRB.
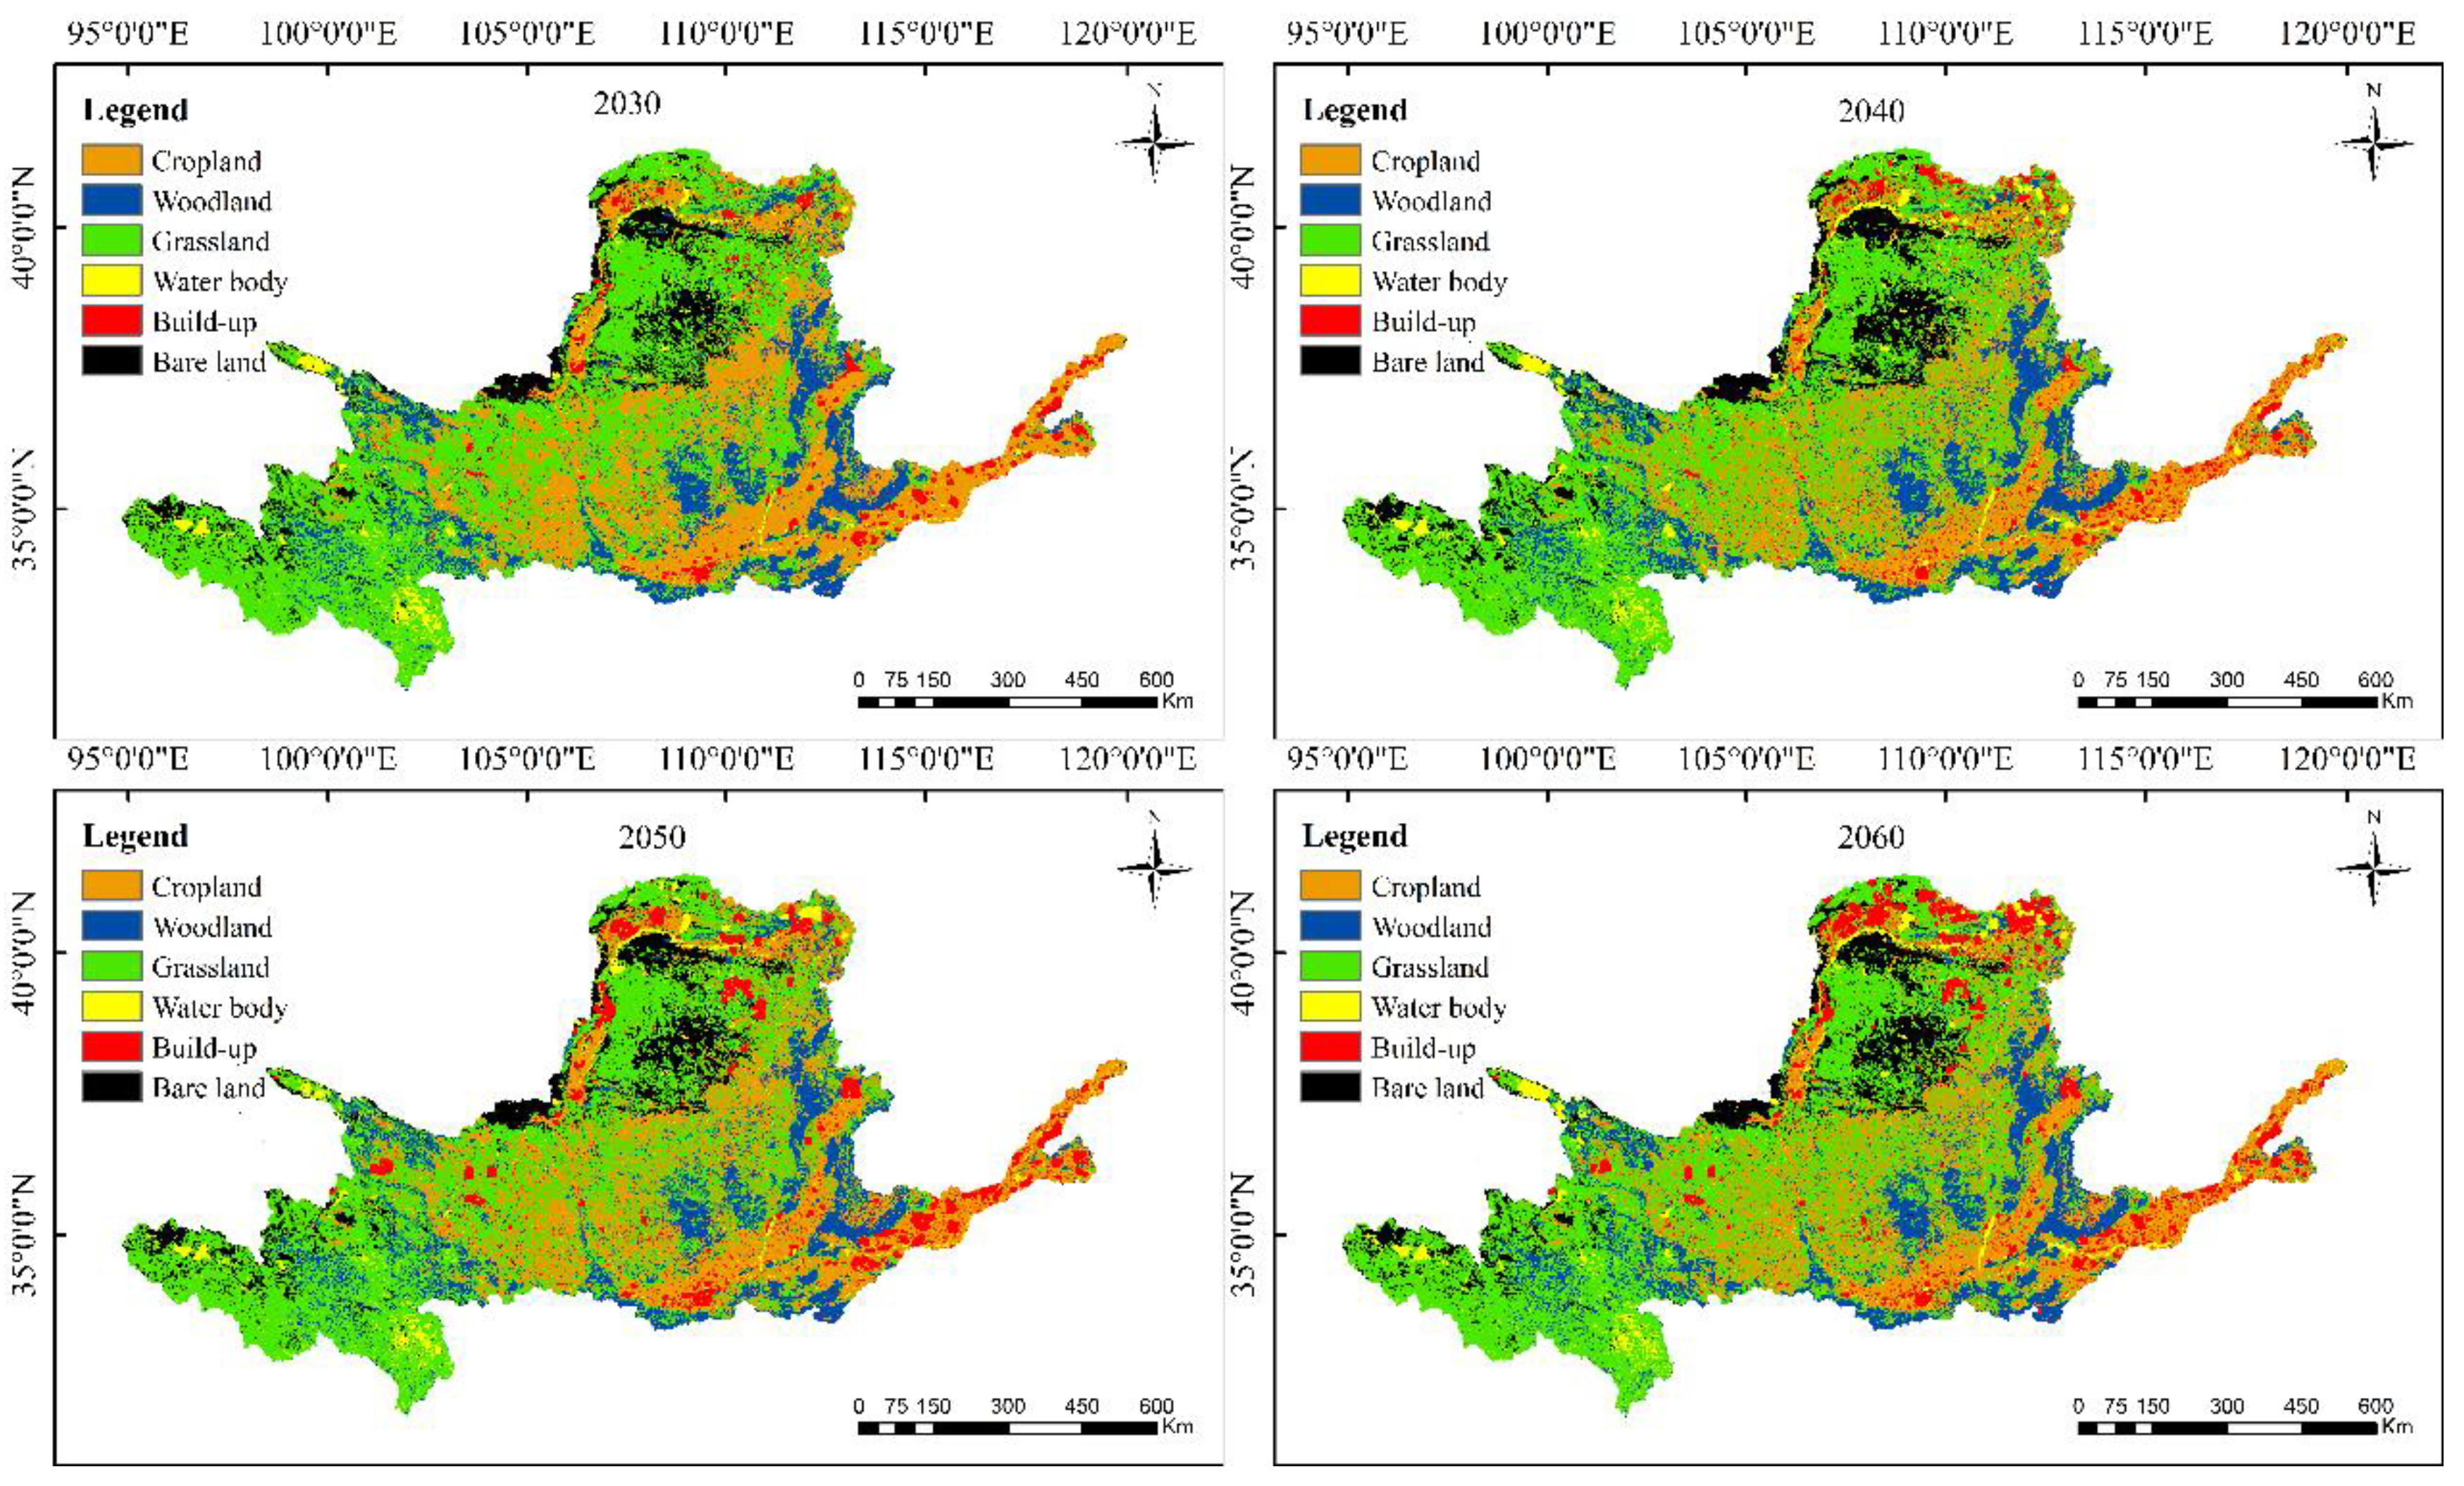
Figure 5.
Spatial distributions of sub-seasonal and seasonal meteorological drought risks under two scenarios in the future years of 2025-2060 in the YRB.
Figure 5.
Spatial distributions of sub-seasonal and seasonal meteorological drought risks under two scenarios in the future years of 2025-2060 in the YRB.
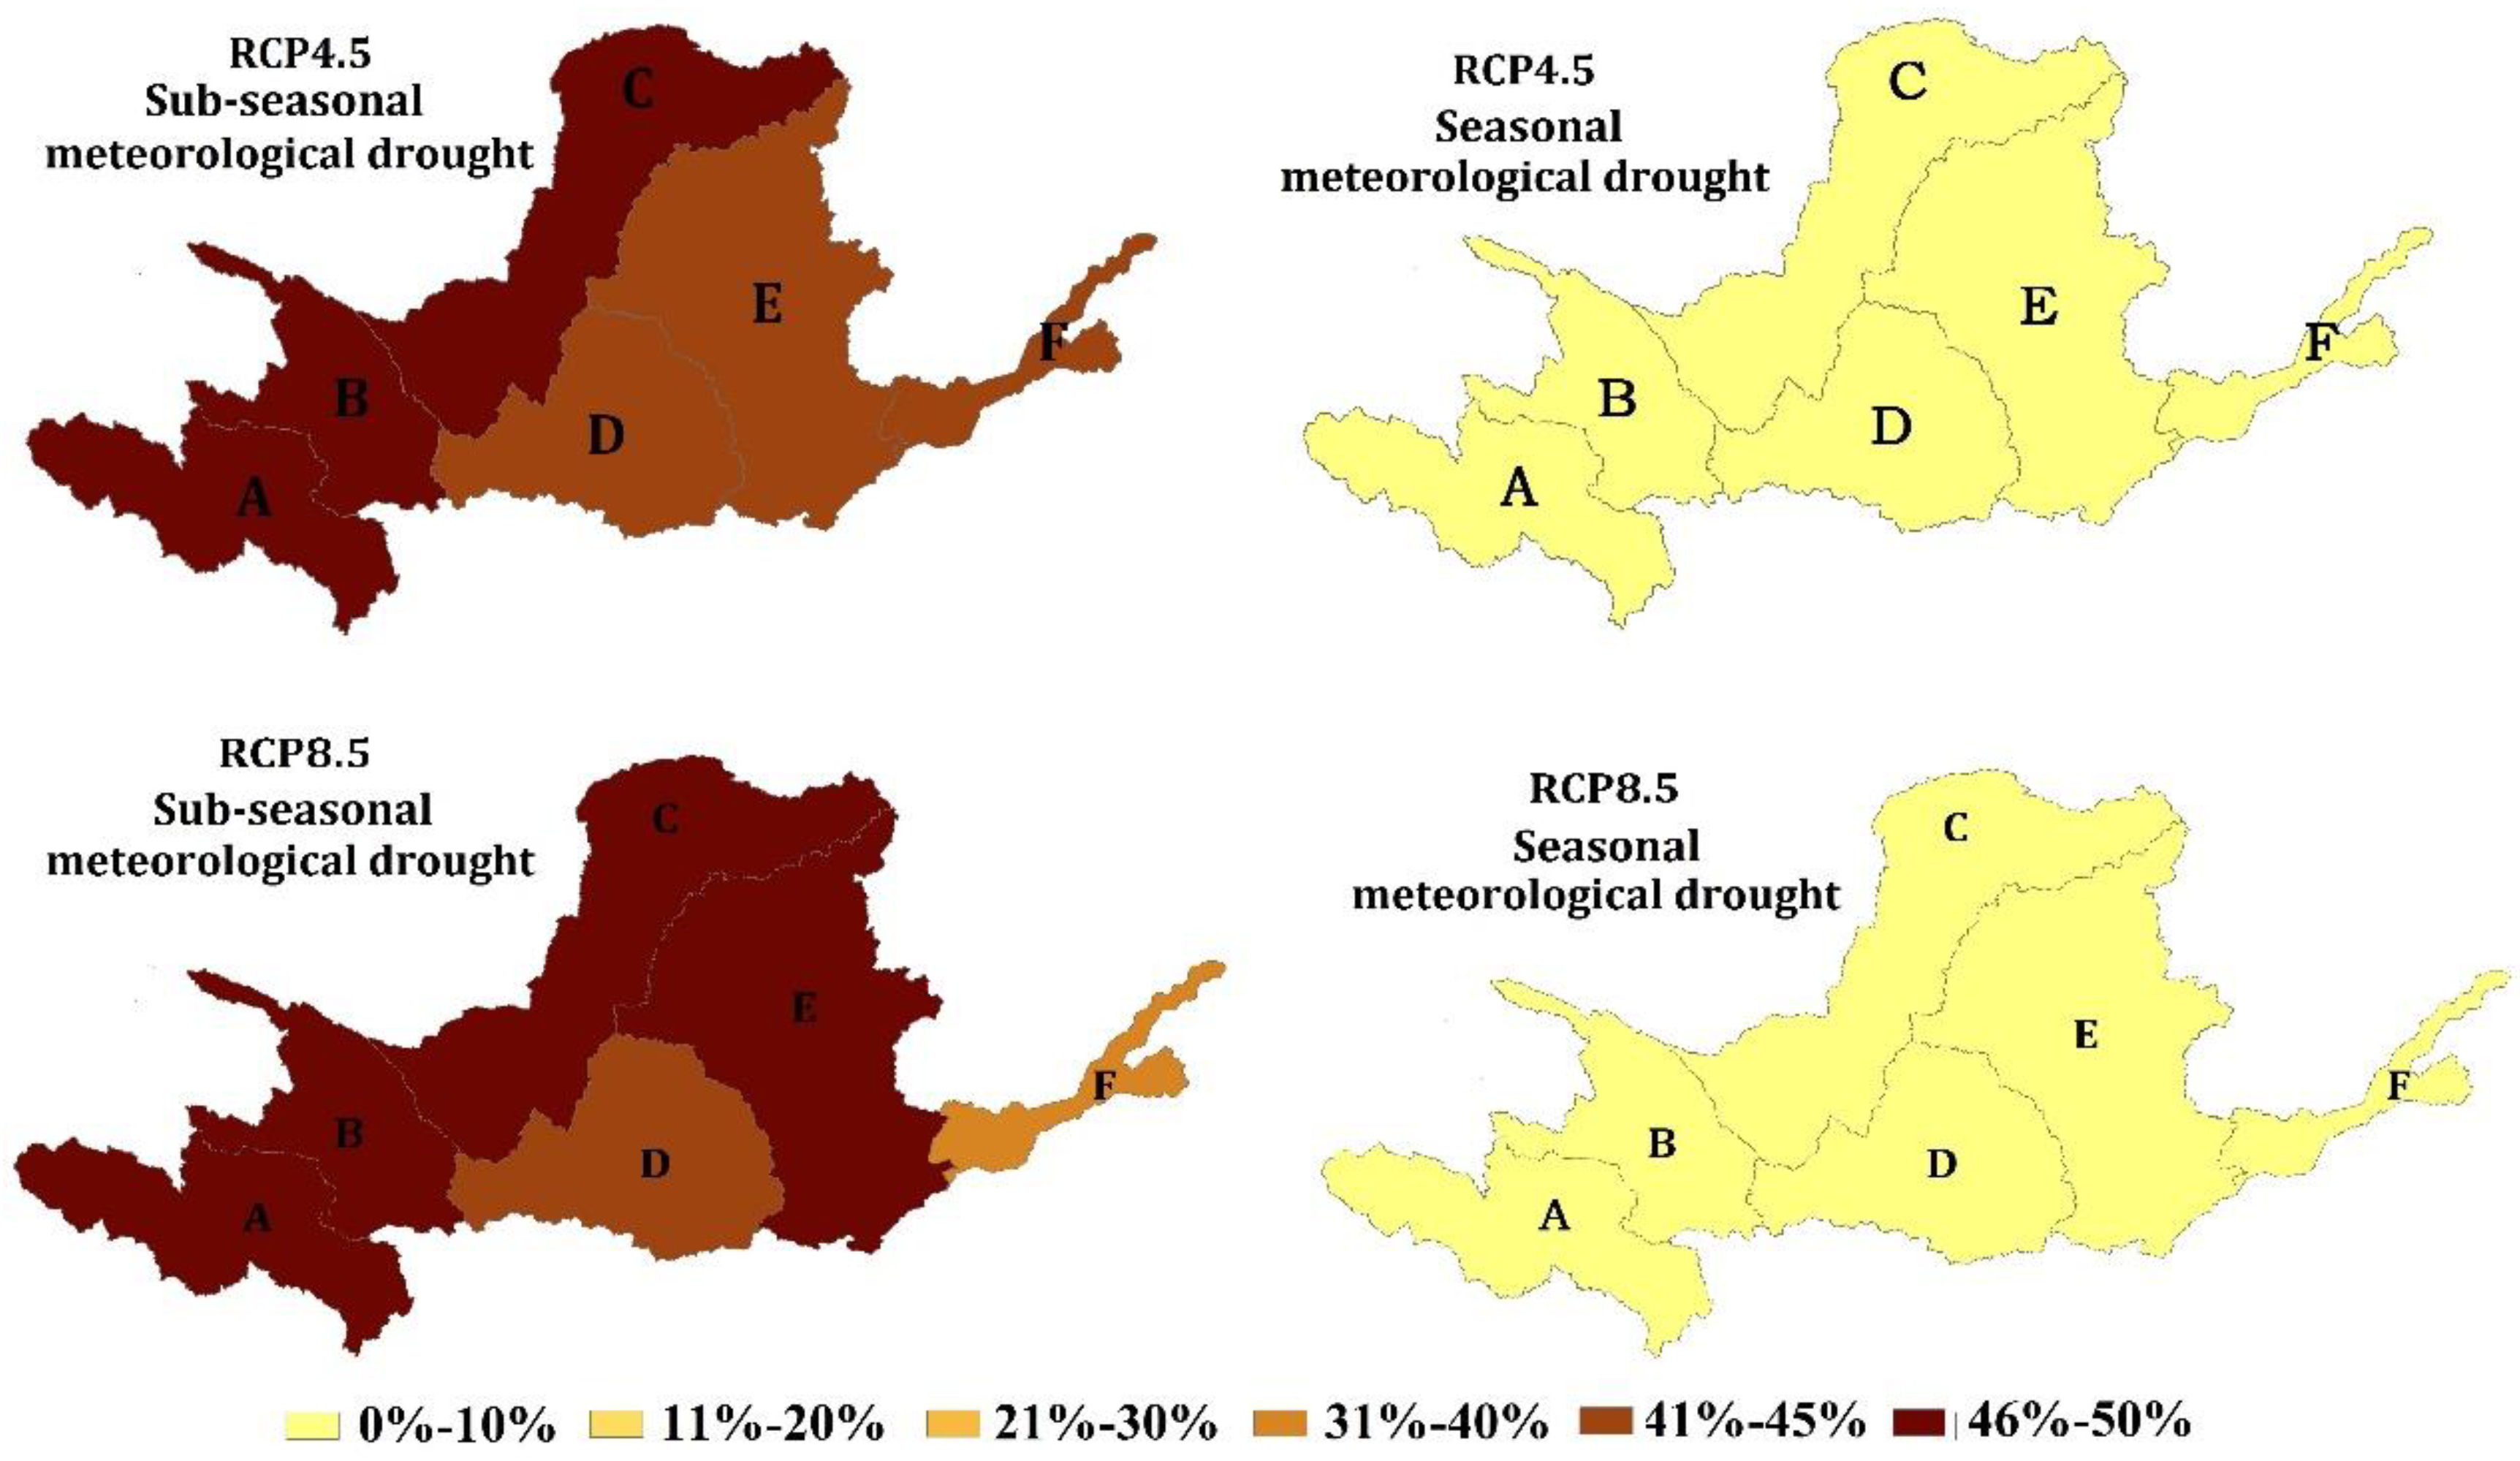
Figure 6.
Spatial distributions of sub-seasonal and seasonal hydrological drought risks under two scenarios in the future years of 2025-2060 over the YRB.
Figure 6.
Spatial distributions of sub-seasonal and seasonal hydrological drought risks under two scenarios in the future years of 2025-2060 over the YRB.
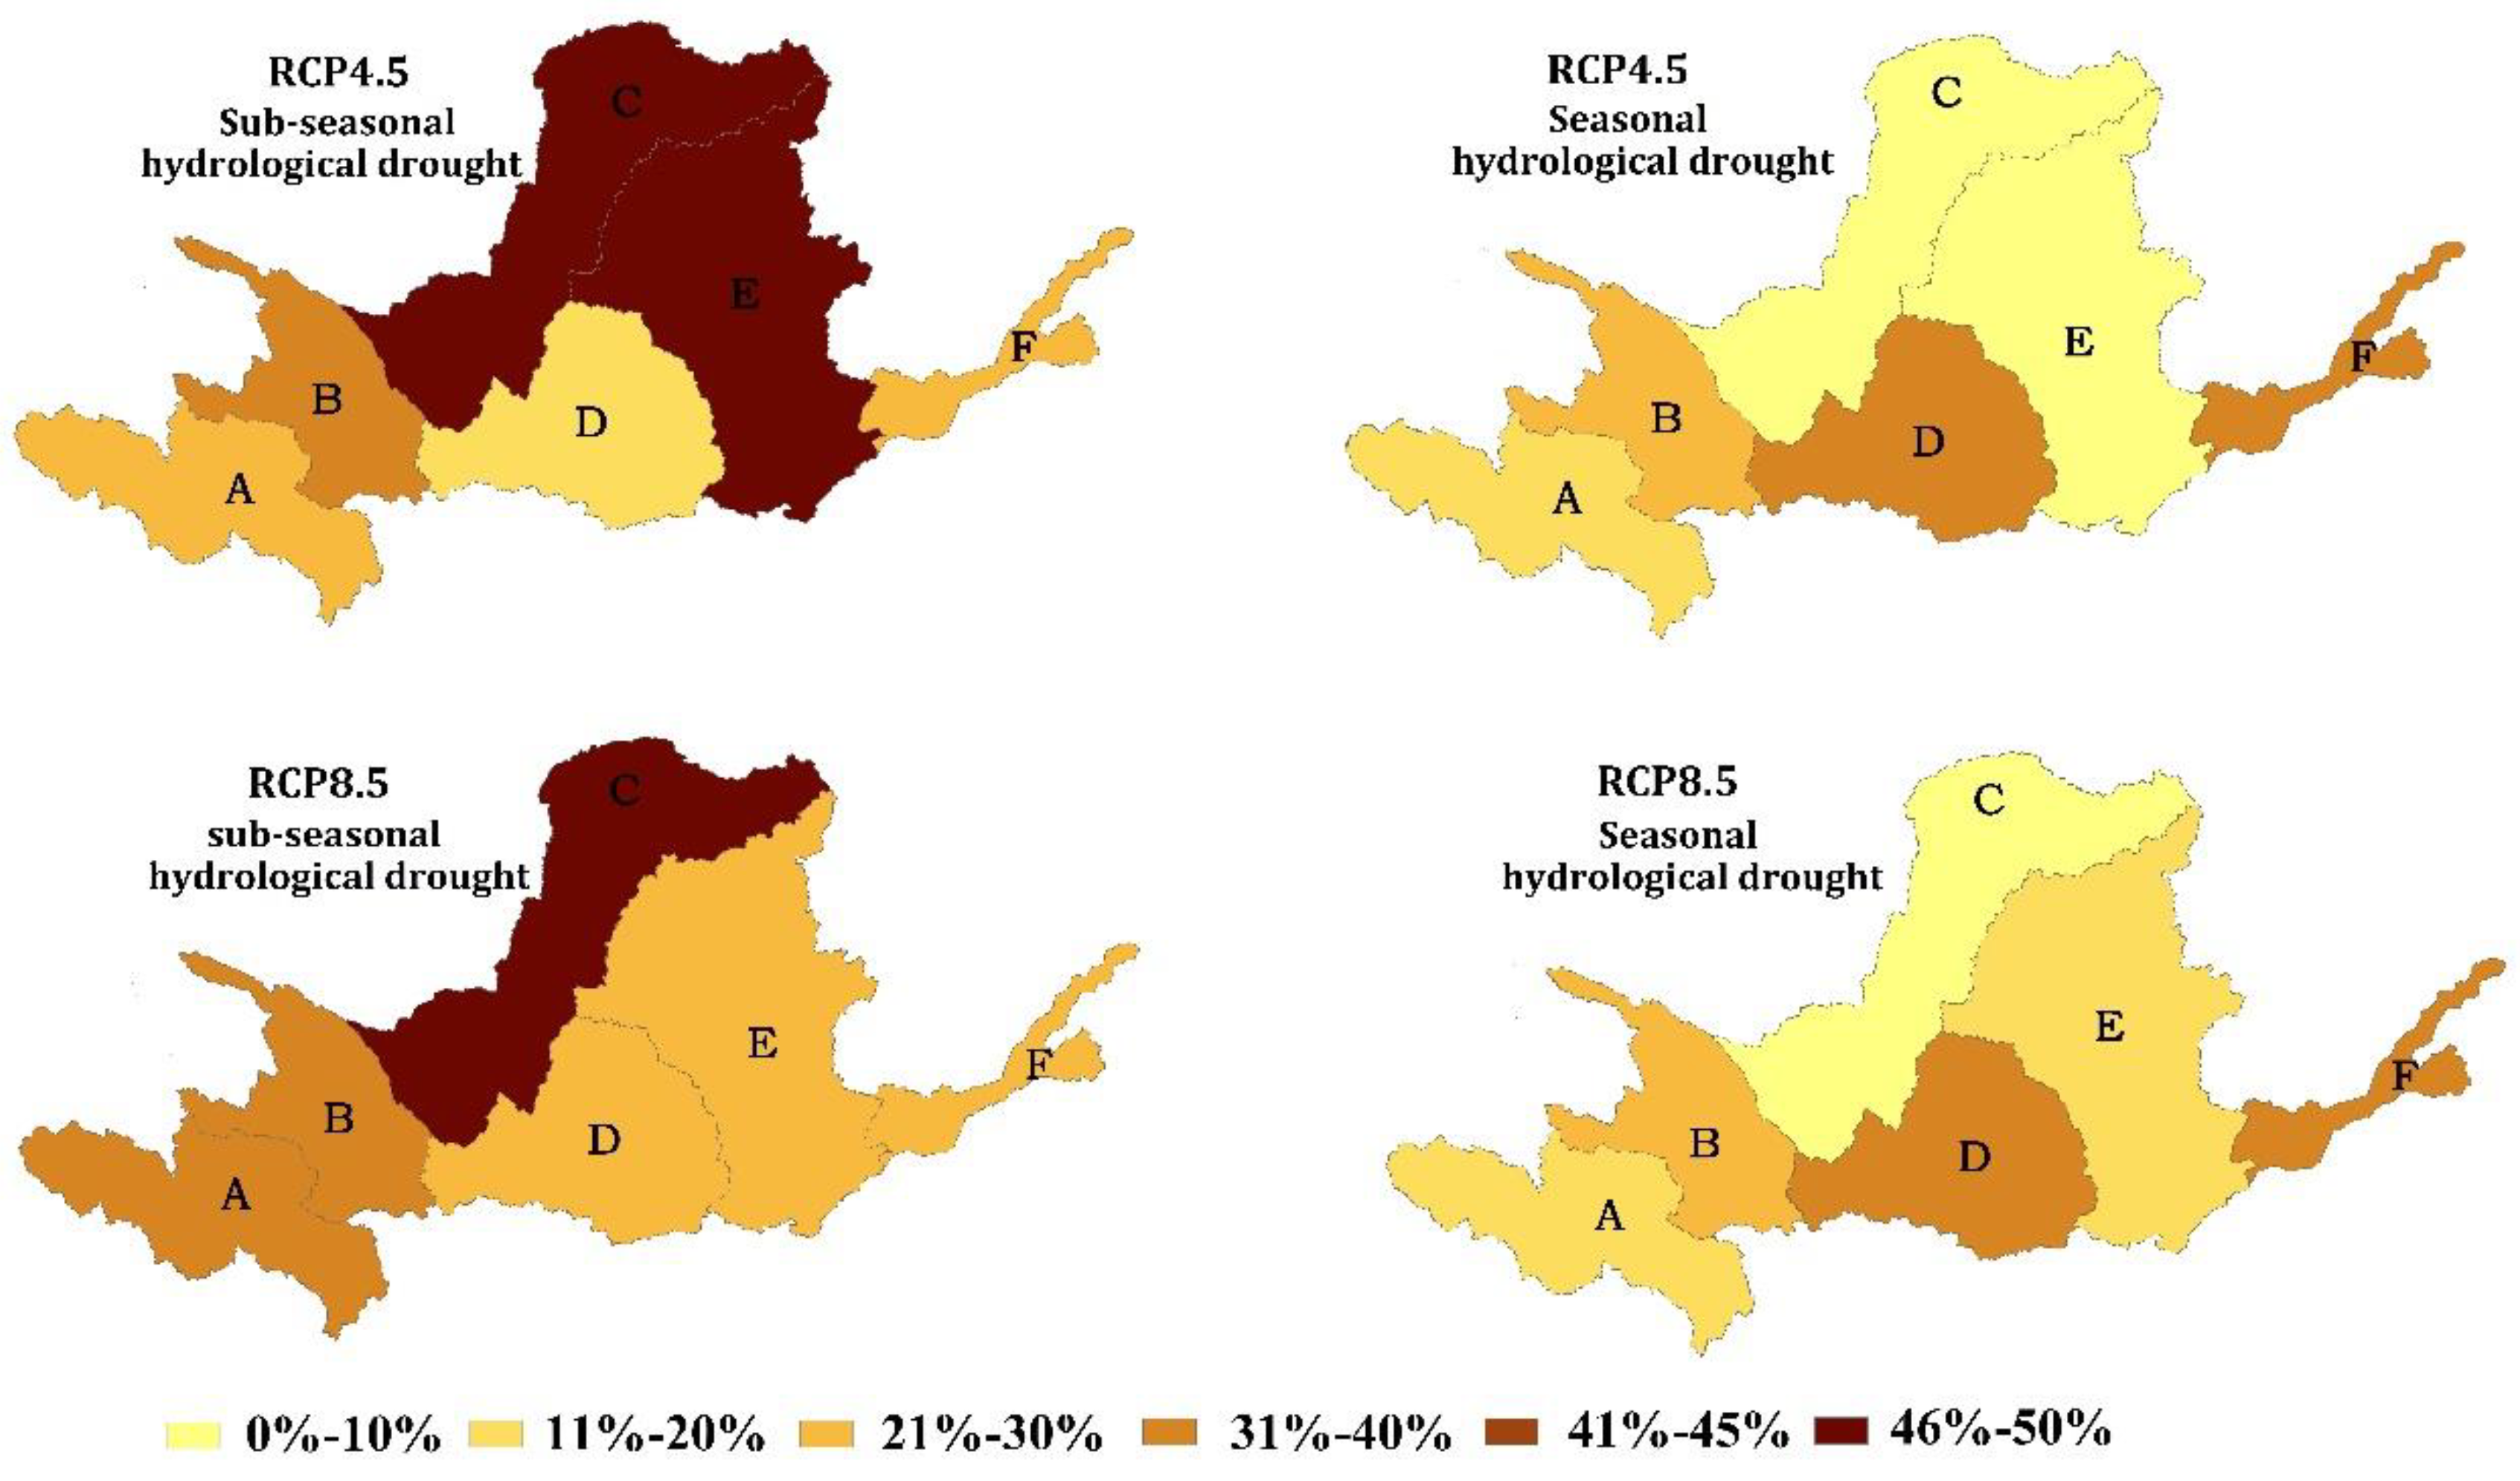
Figure 7.
Spatial distributions of probabilities for sub-seasonal and seasonal meteorological and hydrological droughts during the historical period in the YRB.
Figure 7.
Spatial distributions of probabilities for sub-seasonal and seasonal meteorological and hydrological droughts during the historical period in the YRB.
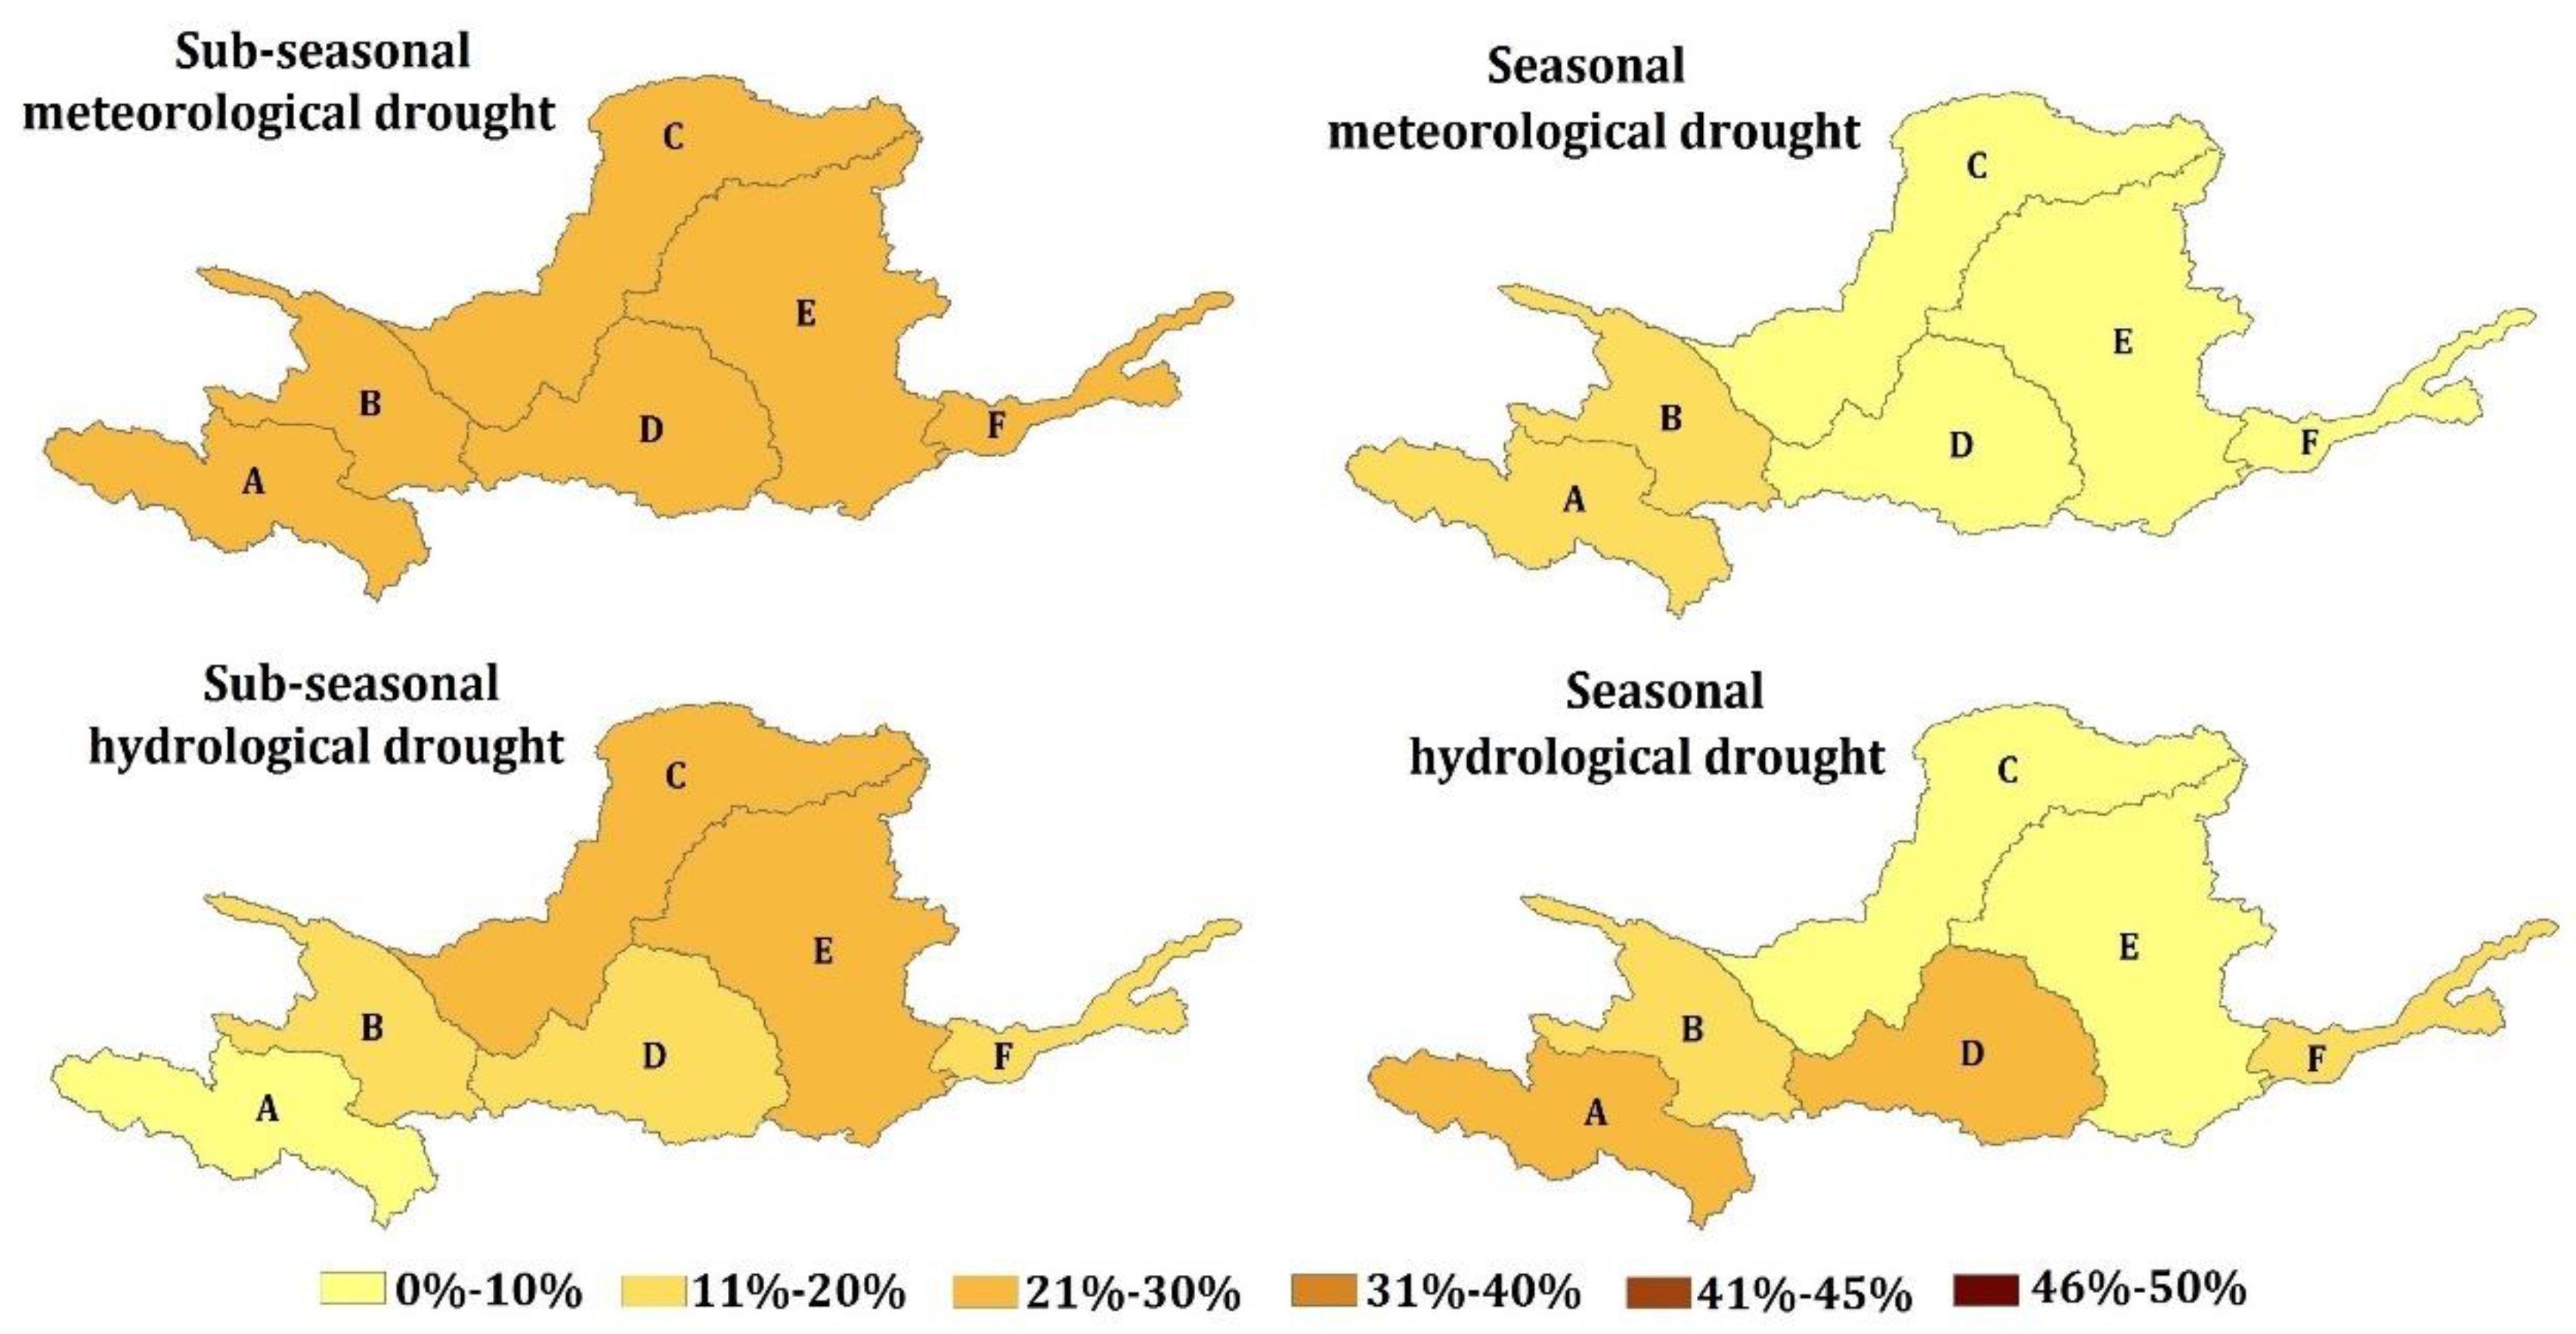

Table 1.
The classification of RDI.
| RDI | Drought grade |
|---|---|
| No drought | |
| Abnormally dry | |
| Moderate drought | |
| Severe drought | |
| Extreme drought |
Table 2.
Area change characteristics of LULC patterns during the period of 2020-2060 in the YRB.
| LULC type | 2020-2030 | 2030-2040 | 2040-2050 | 2050-2060 | 2020-2060 | |||||
|---|---|---|---|---|---|---|---|---|---|---|
| Area (km2) | Ratio (%) |
Area (km2) | Ratio (%) |
Area (km2) | Ratio (%) |
Area (km2) | Ratio (%) |
Area (km2) | Ratio (%) |
|
| Cropland | -18746 | -8.34 | 6376 | 3.09 | -20754 | -9.35 | -11240 | -5.29 | -216504 | -14.74 |
| Woodland | 5569 | 4.93 | -7969 | -6.72 | 5306 | 4.87 | 3675 | 3.32 | 3314 | 3.28 |
| Grassland | -9261 | -2.55 | -6364 | -1.80 | -36459 | -9.52 | -1445 | -0.42 | -206952 | -13.79 |
| Water | 5293 | 21.42 | -2783 | -9.28 | 8127 | 36.37 | 3070 | 11.28 | 5117 | 23.17 |
| Build-up | 3113 | 9.94 | 19117 | 55.50 | 3587 | 63.16 | 4210 | 7.86 | 55876 | 257.16 |
| Bare land | 14033 | 20.60 | -8378 | -10.20 | 7962 | 11.79 | 1730 | 2.35 | 7962 | 11.79 |
Table 3.
Calibration and validation results of the SWAT model measured by the three metrics
| Calibration | Validation | |||||
|---|---|---|---|---|---|---|
| Station | R2 | PBIAS (%) | R2 | PBIAS (%) | ||
| Tangnaiai | 0.83 | 0.85 | -5.19 | 0.86 | 0.88 | -10.38 |
| Lanzhou | 0.77 | 0.88 | -8.77 | 0.80 | 0.90 | -10.99 |
| Toudaoguai | 0.68 | 0.77 | -16.12 | 0.71 | 0.79 | -13.32 |
| Huaxian | 0.79 | 0.83 | 11.65 | 0.80 | 0.87 | 2.85 |
| Huanyuankou | 0.65 | 0.71 | -20.64 | 0.64 | 0.75 | -15.13 |
Table 4.
Error value of marginal distribution of meteorological drought duration and severity in each subzone of the YRB under two scenarios.
Table 4.
Error value of marginal distribution of meteorological drought duration and severity in each subzone of the YRB under two scenarios.
| Subzone | Exponent | Logarithm | Gamma | |||||
|---|---|---|---|---|---|---|---|---|
| AIC | Bias | AIC | Bias | AIC | Bias | |||
| RCP4.5 | ||||||||
| A | D | 221.32 | 226.23 | 302.67 | 307.57 | 243.23 | 247.14 | |
| S | 89.53 | 94.44 | 105.75 | 110.66 | 91.86 | 96.76 | ||
| B | D | 183.61 | 188.69 | 241.65 | 246.74 | 198.91 | 204.00 | |
| S | 225.97 | 231.05 | 248.76 | 253.84 | 226.85 | 231.93 | ||
| C | D | 192.35 | 197.37 | 260.49 | 265.51 | 210.11 | 215.14 | |
| S | 244.17 | 249.19 | 306.46 | 311.48 | 254.09 | 259.11 | ||
| D | D | 171.78 | 176.78 | 228.01 | 233.20 | 187.59 | 192.78 | |
| S | 235.58 | 240.77 | 261.17 | 266.36 | 237.51 | 242.70 | ||
| E | D | 187.70 | 192.77 | 251.65 | 256.71 | 204.50 | 209.56 | |
| S | 229.06 | 234.13 | 272.27 | 277.33 | 235.54 | 240.61 | ||
| F | D | 205.24 | 210.34 | 290.58 | 295.69 | 228.13 | 233.24 | |
| S | 240.32 | 245.42 | 299.62 | 304.73 | 251.56 | 256.67 | ||
| RCP8.5 | ||||||||
| A | D | 216.90 | 221.85 | 310.19 | 315.14 | 241.78 | 246.74 | |
| S | 238.92 | 243.88 | 293.69 | 298.64 | 248.54 | 253.50 | ||
| B | D | 181.27 | 186.34 | 239.90 | 244.97 | 196.83 | 201.89 | |
| S | 219.92 | 224.98 | 241.95 | 247.01 | 220.59 | 225.65 | ||
| C | D | 192.35 | 197.37 | 260.49 | 265.51 | 210.11 | 215.14 | |
| S | 245.25 | 250.27 | 308.26 | 313.28 | 255.43 | 260.45 | ||
| D | D | 184.36 | 189.55 | 256.69 | 261.88 | 204.28 | 209.47 | |
| S | 243.52 | 248.71 | 272.47 | 277.66 | 246.15 | 251.34 | ||
| E | D | 184.78 | 189.91 | 254.46 | 259.59 | 203.41 | 208.54 | |
| S | 232.86 | 237.99 | 277.86 | 282.99 | 239.34 | 244.47 | ||
| F | D | 200.08 | 205.21 | 286.71 | 291.83 | 223.33 | 228.46 | |
| S | 243.53 | 248.66 | 305.42 | 310.54 | 255.30 | 260.43 | ||
Table 5.
Fitting error of copula function of meteorological drought in each subzone of the YRB under two scenarios.
Table 5.
Fitting error of copula function of meteorological drought in each subzone of the YRB under two scenarios.
| Subzone | Clayton | Frank | Gumbel | |||
|---|---|---|---|---|---|---|
| AIC | Bias | AIC | Bias | AIC | Bias | |
| RCP4.5 | ||||||
| A | -15.21 | -15.65 | -31.85 | -31.89 | -23.46 | -23.96 |
| B | -19.51 | -19.48 | -41.66 | -41.63 | -29.14 | -29.11 |
| C | -20.13 | -20.11 | -47.94 | -47.91 | -35.70 | -35.6 |
| D | -35.22 | -35.20 | -54.88 | -54.85 | -19.46 | -19.43 |
| E | -14.88 | -14.85 | -43.20 | -43.17 | -42.52 | -42.49 |
| F | -20.98 | -20.96 | -50.19 | -50.17 | -23.97 | -23.94 |
| RCP8.5 | ||||||
| A | -14.86 | -14.84 | -48.44 | -48.41 | -28.81 | -28.78 |
| B | -19.21 | -19.18 | -36.42 | -36.39 | -22.45 | -22.42 |
| C | -20.63 | -20.61 | -49.71 | -49.68 | -36.87 | -36.84 |
| D | -21.77 | -21.75 | -55.66 | -55.64 | -34.46 | -34.43 |
| E | -38.69 | -38.66 | -46.15 | -46.12 | -24.03 | -24.01 |
| F | -21.68 | -21.65 | -53.01 | -52.98 | -28.68 | -28.66 |
Table 6.
Fitting error of marginal distribution of hydrological drought duration and severity in each subzone of the YRB under two scenarios.
Table 6.
Fitting error of marginal distribution of hydrological drought duration and severity in each subzone of the YRB under two scenarios.
| Subzone | Exponent | Logarithm | Gamma | |||||
|---|---|---|---|---|---|---|---|---|
| AIC | Bias | AIC | Bias | AIC | Bias | |||
| RCP4.5 | ||||||||
| A | D | 190.45 | 193.77 | 264.93 | 268.26 | 205.55 | 208.88 | |
| S | 195.09 | 198.42 | 282.16 | 285.49 | 211.54 | 214.87 | ||
| B | D | 211.76 | 215.74 | 270.33 | 274.31 | 224.20 | 228.18 | |
| S | 226.38 | 230.35 | 299.83 | 303.81 | 239.45 | 243.43 | ||
| C | D | 201.95 | 206.97 | 298.01 | 303.03 | 226.58 | 231.60 | |
| S | 236.69 | 241.71 | 285.62 | 290.64 | 243.79 | 248.81 | ||
| D | D | 198.64 | 202.11 | 240.97 | 244.44 | 206.23 | 209.71 | |
| S | 212.23 | 215.71 | 266.53 | 270.00 | 219.70 | 223.17 | ||
| E | D | 226.53 | 231.22 | 305.43 | 310.11 | 245.96 | 250.65 | |
| S | 248.18 | 252.86 | 337.02 | 341.71 | 264.65 | 269.34 | ||
| F | D | 214.15 | 218.59 | 274.04 | 277.48 | 227.76 | 232.20 | |
| S | 243.32 | 247.76 | 295.80 | 300.24 | 251.58 | 256.02 | ||
| RCP8.5 | ||||||||
| A | D | 188.38 | 191.65 | 258.67 | 261.95 | 202.05 | 205.33 | |
| S | 194.40 | 197.67 | 272.86 | 276.13 | 208.51 | 211.79 | ||
| B | D | 215.65 | 219.66 | 273.04 | 277.05 | 227.60 | 231.62 | |
| S | 228.12 | 232.14 | 305.49 | 309.50 | 242.06 | 246.08 | ||
| C | D | 190.71 | 195.79 | 296.50 | 301.58 | 218.20 | 223.29 | |
| S | 232.76 | 237.85 | 282.46 | 287.55 | 240.31 | 245.39 | ||
| D | D | 194.91 | 198.24 | 234.31 | 237.64 | 201.48 | 204.81 | |
| S | 206.05 | 209.38 | 253.03 | 256.36 | 212.05 | 215.38 | ||
| E | D | 226.76 | 231.47 | 308.77 | 313.48 | 247.21 | 251.93 | |
| S | 248.42 | 253.13 | 336.89 | 341.60 | 264.62 | 269.34 | ||
| F | D | 213.48 | 217.89 | 256.04 | 260.45 | 222.46 | 226.87 | |
| S | 237.11 | 241.51 | 292.22 | 296.63 | 246.47 | 250.88 | ||
Table 7.
Fitting error of copula function of hydrological drought in each subzone of the YRB under two scenarios.
Table 7.
Fitting error of copula function of hydrological drought in each subzone of the YRB under two scenarios.
| Subzone | Clayton | Frank | Gumbel | |||
|---|---|---|---|---|---|---|
| AIC | Bias | AIC | Bias | AIC | Bias | |
| RCP4.5 | ||||||
| A | -15.57 | -15.53 | -39.92 | -39.88 | -41.95 | -41.91 |
| B | -19.65 | -19.61 | -40.89 | -40.85 | -33.16 | -33.12 |
| C | -13.76 | -13.73 | -42.10 | -42.07 | -42.15 | -42.12 |
| D | -16.77 | -16.73 | -37.10 | -37.06 | -29.01 | -28.97 |
| E | -20.85 | -20.82 | -51.77 | -51.74 | -19.57 | -19.55 |
| F | -17.48 | -17.45 | -53.48 | -53.45 | -34.59 | -34.56 |
| RCP8.5 | ||||||
| A | -19.67 | -19.63 | -40.53 | -40.49 | -43.93 | -43.89 |
| B | -20.95 | -20.92 | -48.78 | -48.74 | -42.92 | -42.89 |
| C | -13.43 | -13.40 | -38.46 | -38.44 | -38.16 | -38.13 |
| D | -20.84 | -20.80 | -51.66 | -51.62 | -44.51 | -44.47 |
| E | -14.12 | -14.09 | -40.70 | -40.68 | -34.61 | -34.59 |
| F | -17.38 | -17.35 | -50.86 | -50.82 | -28.65 | -28.62 |
Disclaimer/Publisher’s Note: The statements, opinions and data contained in all publications are solely those of the individual author(s) and contributor(s) and not of MDPI and/or the editor(s). MDPI and/or the editor(s) disclaim responsibility for any injury to people or property resulting from any ideas, methods, instructions or products referred to in the content. |
© 2023 by the authors. Licensee MDPI, Basel, Switzerland. This article is an open access article distributed under the terms and conditions of the Creative Commons Attribution (CC BY) license (https://creativecommons.org/licenses/by/4.0/).
Copyright: This open access article is published under a Creative Commons CC BY 4.0 license, which permit the free download, distribution, and reuse, provided that the author and preprint are cited in any reuse.


