
Submitted:
09 September 2023
Posted:
12 September 2023
You are already at the latest version
Abstract
Ankle joint flexion and extension exercises play an important role in the rehabilitation training of patients who have been injured or bedridden for a long time before and after surgery. Accurately guiding patients to perform ankle flexion and extension exercises can significantly reduce deep vein thromboembolism. Currently, most ankle rehabilitation devices focus on assisting patients with ankle flexion and extension movements, and there is a lack of devices for effectively monitoring these movements. In this study, we designed an ankle joint flexion and extension movement monitoring device based on a pressure sensor. It is composed of an STM32 microcontroller, a pressure sensor, an HX711A/D conversion chip, and an ESP8266 WiFi communication module. The value of force and effective number of ankle joint flexion and extension movements were obtained. An experimental device was designed to verify the accuracy of the system. The results showed that the device can effectively monitor and control ankle flexion and extension movements remotely, ultimately ensuring that the patient can effectively monitor and grasp the active ankle pump movement.
Keywords:
ankle pump movement
; ankle joint flexion and extension movement monitoring
; pressure sensor
; STM32
1. Introduction
Many injuries and prolonged bed rest before and after surgery can easily lead to lower limb deep vein thromboembolism, which greatly affects the patient’s life and can even result in death. Ankle joint flexion and extension movements can effectively avoid this situation from occurring. Ankle joint flexion and extension movements are effective measures for preventing venous thromboembolism [1]. Ankle flexion and extension movements refer to the plantar flexion and back extension movements of the ankle joint [2]. A schematic of ankle joint flexion and extension movements is shown in Figure 1. First, the patient lies flat on the bed, exert maximum force on the toes (plantar flexion movement) and hold it for 10 s; then, use force to hook the feet up (back extension movement) and hold it for another 10 s. These steps are then repeated continuously for 10 min.
Traditional ankle flexion and extension exercises generally require medical staff to assist patients in completing them; however, this method has a few drawbacks, such as one medical staff can perform ankle flexion and extension exercises for only one patient at a time, which results in lower efficiency. When patients perform ankle flexion and extension exercises, there is a distinction between comfort and maximal strength. Different populations and rehabilitation stages have different maximum strengths. Therefore, it is necessary to monitor the effectiveness of ankle flexion and extension exercises to help patients complete ankle flexion and extension exercises better. Currently, research on ankle flexion and extension mainly focuses on ankle pump rehabilitation devices; there is relatively little research on ankle pump movement monitoring. G. Westrich et al. used the Acuson 128XP/10 dual function ultrasound device with a 5 MHz linear array probe to measure the rate of pressure rise and maximum pressure reached during ankle flexion and extension movements to evaluate peak venous velocity and venous volume [3]. But this device can only measure the maximum pressure and cannot display the real-time pressure value of ankle joint flexion and extension movement, and there are also issues such as high equipment cost. Yoon J Y et al. used a goniometer to measure the angles of dorsiflexion and plantar flexion during ankle flexion and extension movements [4]. Kim et al. compare the ankle joint angle measured using wearable devices with the ankle joint angle obtained using movement capture systems during running, and verify the ability of inertial measurement units (IMUs) to accurately measure ankle joint angles, thereby detecting the effectiveness of ankle joint flexion and extension movements[5]. Knyazev, A. A. et al. have developed an ankle joint mechanical treatment device based on a parallel robotic arm. The measuring instrument built into the device platform monitors the interaction force between the foot and the platform at three points. The movement control unit of the mobile platform generates a control voltage based on the reference model and corrected stress, and compares the changes in ankle physiological parameters during rehabilitation to effectively monitor ankle flexion and extension movements[6].Al-Quraishi et al. use electromyography signals for pattern recognition, which is mainly divided into four stages; Signal detection and preprocessing feature extraction, dimensionality reduction and classification. They used three classifiers (LDA, k-NN, and MLP) to classify four types of ankle joint movements[7]. Hideki Toda et al. used a device that can achieve affected ankle joint stretching by using the angle of the healthy ankle joint as a trigger to move the foot plate connected to the linear actuator. They used two acceleration sensors to measure the ankle joint rotation angle on the affected and healthy sides. Compared to the previously used button control, the healthy side control can achieve a smooth and stable process of pressing the affected side’s sole. The proposed system does not require the operation of a physical therapist during the treatment process, making it possible for the ankle joint to self recover[8].
The monitoring device for ankle pump movement mainly detects the posture of ankle pump movement and can only measure the corresponding movement angle. It cannot measure the force of the ankle pump movement. The force value is an important standard for evaluating the effectiveness of the ankle-pump movement. In addition, there is currently a mismatch between the demand for monitoring devices for ankle pump movements and medical resources for a large number of long-term bedridden patients. There is an urgent need to design a low-cost and easy-to-monitor ankle pump movement monitoring device to assist long-term bedridden patients in rehabilitation training. Therefore, based on the above issues, this paper proposes an active ankle pump movement monitoring device based on pressure sensors. The remainder of this paper is organized as follows. Section 2 introduces the implementation method for the force value monitoring of ankle flexion and extension movements based on a pressure sensor. Section 3 presents the experiment and accuracy analysis. Finally, Section 4 concludes the paper.
2. Implementation method
The system composition is shown in Figure 2 and includes an STM32 microcontroller, pressure sensor, pressure acquisition module, HX711 A/D signal conversion module [9], ESP8266 module [10], and upper computer module. To ensure that the force values of ankle flexion and extension movements (especially during back extension movements) could be applied to the pressure sensor, the monitoring device was fixed on a wall. A foot was tied to a strap (without elasticity). The strap was connected to the spring, and the other end of the spring was fixed to the pressure sensor device. When a patient performs ankle flexion and extension movements, the ankle compresses or stretches the spring, compressing or pulling the pressure sensor.
The workflow diagram of the system is shown in Figure 3. First, the hardware, which includes a microcontroller (model STM32F103ZET6), HX711A/D conversion module, ESP8266 WiFi communication module, and pressure sensor, is Initialized. When the STM32 microcontroller receives the start command through the WIFI module, the HX711 module collects the electrical information generated by the pressure sensor, and the A/D signal conversion module collects the force value of the ankle joint flexion and extension movements. The microcontroller processes the pressure value of the patient’s plantar flexion movement, pulling force of the back extension movement, and effective number of movements. Finally, the microcontroller uploads the collected data to the server through the WIFI communication module, and the mobile app reads the data from the server cloud platform, thereby achieving real-time monitoring of ankle joint flexion and extension movements. Users and medical staff can observe and evaluate real-time and past data through a server or mobile app, and make timely adjustments to achieve better recovery.
As shown in Figure 4 , the directions of plantar flexion and back extension movements are exactly opposite; thus, there are positive and negative values for the movement force. A positive force value represents the direction of plantar flexion movement and a negative force value represents ankle joint extension movement. We set the effective number of plantar flexion movements as Dcount and the effective number of back extension movements as Tcount. The maximum force value for each user is not the same, and the user can first record the absolute value of their maximum force value (because the force value is positive or negative) as a threshold. In subsequent movements, when the absolute value of the force value is greater than the threshold and the duration exceeds 10 s, the plantar flexion or back extension movement is considered effective, and the corresponding number of effective times Dcount is increased by 1. In contrast, if the absolute value of the movement force is less than the set threshold or the duration of the movement does not meet the conditions, the value of Dcount remains unchanged.
3. Experiment and accuracy analysis
3.1. Analysis of extension movement accuracy
The back extension movement involves hooking the foot upward with force, and the pressure sensor is in a pulled state. To verify the accuracy of monitoring the back extension movement, the force value of the back extension movement was simulated using a pulley device. As shown in Figure 5, it includes a bracket, fixed pulley, weight, string, and ankle joint flexion and extension movement monitoring device. The pulley is fixed to a bracket. One end of the thin rope (without elasticity) is connected to a weight and the other end is connected to the monitoring device. Simultaneously, the device is fixed to a desktop. To simulate the different force values of back extension movements, five weights with different masses were used to complete the experiment. The weights were 100 g (1 N), 200 g (2 N), 300 g (3 N), 400 g (4 N), and 500 g (5 N), respectively. Because of the influence of its own weight, the weight will pull the string to move, thereby pulling the spring and generating a pull force. Based on relevant physical knowledge, it can be seen that the pull force applied to the monitoring device is equal to the mass of the weight. Ten experiments were performed for each weight, and the relevant data were recorded. The weight mass and force values of the monitoring device were used to calculate the average and mean square errors, respectively. The results are summarized in Table 1.
From the Table 1, it can be seen that the monitoring accuracy of the extension movement is high, with an average error of 0.023N at the maximum and 0.0001N at the minimum. The maximum and the minimum mean square error are 7.5 × and 1 × respectively. It can effectively monitor the force of ankle joint extension movement.
3.2. Analysis of flexion movement accuracy
The flexion movement occurs when the toes are pressed down with force, and the pressure sensor is in a pressed state. The accuracy analysis of the experimental device, including the bracket, force gauge, weight, and monitoring device, is shown in Figure 6. The monitoring device was fixed to a desktop. When the weight was directly pressed onto the spring, it slipped off. Therefore, the weight was hung on a force gauge that was fixed to a bracket. A pressure force was applied to the spring and monitoring device by adjusting the weight and force gauges, as shown in formula (1).
In formula (1), m is the mass of the weight itself, g is the acceleration due to gravity, and has a value 10 . represents the force exerted by the force gauge. In this experiment, five weights with different masses were used: 200 g, 300 g, 400 g, 500 g, and 1 kg. Ten experiments were performed for each weight, and the relevant data were recorded. The ith pressure value (i=1,2,3...,10) measured by the monitoring device and the actual pressure F were used to calculate the average and mean square errors. The results are summarised in Table 2. The range of the force gauge is 10 N, resolution is 0.01 N, and accuracy is ± 0.05 N.
As shown in Table 2, the monitoring accuracy of the flexion movement is high, with average maximum and minimum errors of 0.068 N and 0.0001 N, respectively. The maximum and minimum mean square error were 2.61 × and 2 × , respectively. It can effectively monitor the force of ankle joint flexion movement.
In summary, the device developed in this study can accurately monitor the force values of ankle joint flexion and extension movements.
4. Conclusions
Ankle flexion and extension movements are very important for the rehabilitation of bedridden patients. In this study, an ankle joint flexion and extension movement monitoring device was designed based on a pressure sensor. It could accurately monitor the force values of plantar flexion and back extension movements. The maximum and minimum average error values of plantar flexion movement were 0.068 N and 0.0001 N, respectively, and the maximum and minimum mean square error values were 2.61 × and 2 × , respectively, with an average error of 0.023 N and 0.0001 N within different force ranges for monitoring back extension movement. The maximum and minimum mean square deviation values were 7.5 × and 1 × , respectively. These results indicate that the conditions for monitoring the effective values of the ankle flexion and extension movements have been satisfied. This device can also count the effective number of ankle flexion and extension movements and transmit data to mobile applications, making it an effective ankle flexion and extension monitoring device.
Author Contributions
Chunying Xu and Yu Zhou conceived the experiments.; Yu Zhou, Taoyu Wen, Chengyu Yang and Hongjian Lv helped supervise the theory and verified the experiment.; Jianji and Chuliang Wei structured and drafted the manuscript.; All authors have read and agreed to the published version of the manuscript.
Funding
This research was funded by Zhoushan Science and Technology Plan Project of grant number 2022C61002.
Institutional Review Board Statement
Not applicable.
Informed Consent Statement
Not applicable.
Data Availability Statement
The data presented in this study are available on request from the corresponding author.
Conflicts of Interest
The authors declare no conflict of interest.
References
- Shimizu, Y.; Kamada, H.; Sakane, M.; Aikawa, S.; Mutsuzaki, H.; Tanaka, K.; Mishima, H.; Kanamori, A.; Nishino, T.; Ochiai, N.; Yamazaki, M. A novel exercise device for venous thromboembolism prophylaxis improves venous flow in bed versus ankle movement exercises in healthy volunteers. Journal of Orthopaedic Surgery 2017, 25, 2309499017739477. [Google Scholar] [CrossRef] [PubMed]
- Brindle, T.J.; Lebiedowska, M.K.; Miller, J.L.; Stanhope, S.J. The influence of ankle joint movement on knee joint kinesthesia at various movement velocities. Scandinavian Journal of Medicine & Science in Sports 2010, 20, 262–267. [Google Scholar] [CrossRef]
- Westrich, G.H.; Specht, L.M.; Sharrock, N.E.; Windsor, R.E.; Sculco, T.P.; Haas, S.B.; Trombley, J.F.; Peterson, M. Venous haemodynamics after total knee arthroplasty. The Journal of Bone & Joint Surgery British Volume 1998, 80-B, 1057–1066. [Google Scholar] [CrossRef]
- yeon Yoon, J.; seop Oh, J.; hyun An, D. Three-Dimensional Analysis of Foot Motion After Uphill Walking With Mobilization With Movement Using Tape Applied to the Talocrural Joint in Women With Limited Ankle Dorsiflexion. Foot & Ankle International 2014, 35, 1217–1225. [Google Scholar] [CrossRef]
- Kim, B.H.; Hong, S.H.; Oh, I.W.; Lee, Y.W.; Kee, I.H.; Lee, S.Y. Measurement of Ankle Joint Movements Using IMUs during Running. Sensors 2021, 21. [Google Scholar] [CrossRef] [PubMed]
- Knyazev, A. A., Y. S.F.F.A.V. Control of a Device for Mechanotherapy of the Ankle Joint. Biomedical Engineering 2023, 56, 392–396. [Google Scholar] [CrossRef]
- Al-Quraishi, M.S.; Ishak, A.J.; Ahmad, S.A.; Hasan, M.K. Impact of feature extraction techniques on classification accuracy for EMG based ankle joint movements. 2015 10th Asian Control Conference (ASCC), 2015, pp. 1–5. [CrossRef]
- Toda, H.; Kawamoto, H. Device Design of Ankle Joint Stretching System Controlled by the Healthy Side Ankle Joint Movement for Self-Rehabilitation. Journal of Robotics and Mechatronics 2023, 35, 556–564. [Google Scholar] [CrossRef]
- Liu, H.; Yang, L. Design of a High-Precision Force Sensor Signal Acquisition System Based on HX711. Proceedings of the 4th International Conference on Information Technologies and Electrical Engineering; Association for Computing Machinery: New York, NY, USA, 2022; ICITEE ’21. [Google Scholar] [CrossRef]
- Kodali, R.K.; Soratkal, S. MQTT based home automation system using ESP8266. 2016 IEEE Region 10 Humanitarian Technology Conference (R10-HTC), 2016, pp. 1–5. [CrossRef]
Figure 1.
Schematic diagram of ankle joint flexion and extension movement.
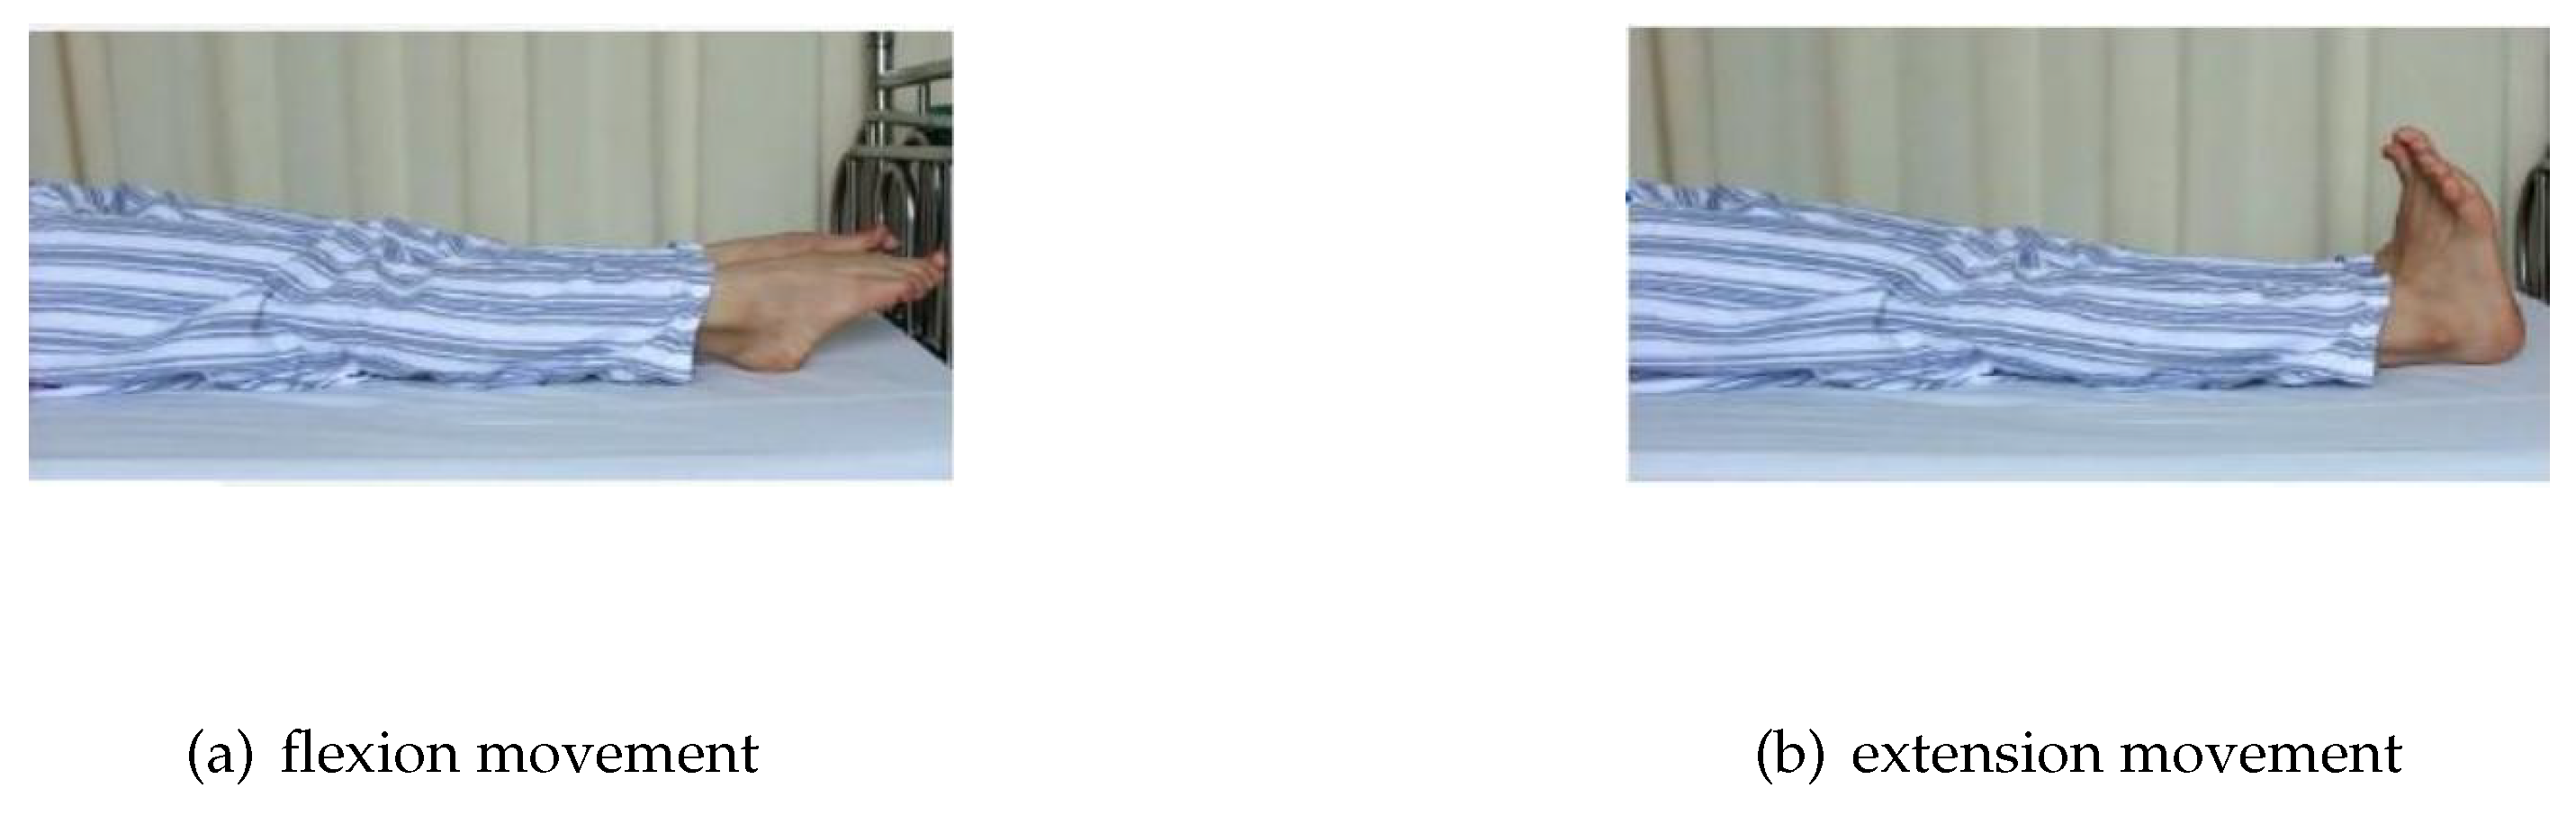
Figure 2.
Structure of an active ankle flexion and extension movement system based on pressure sensors
Figure 2.
Structure of an active ankle flexion and extension movement system based on pressure sensors
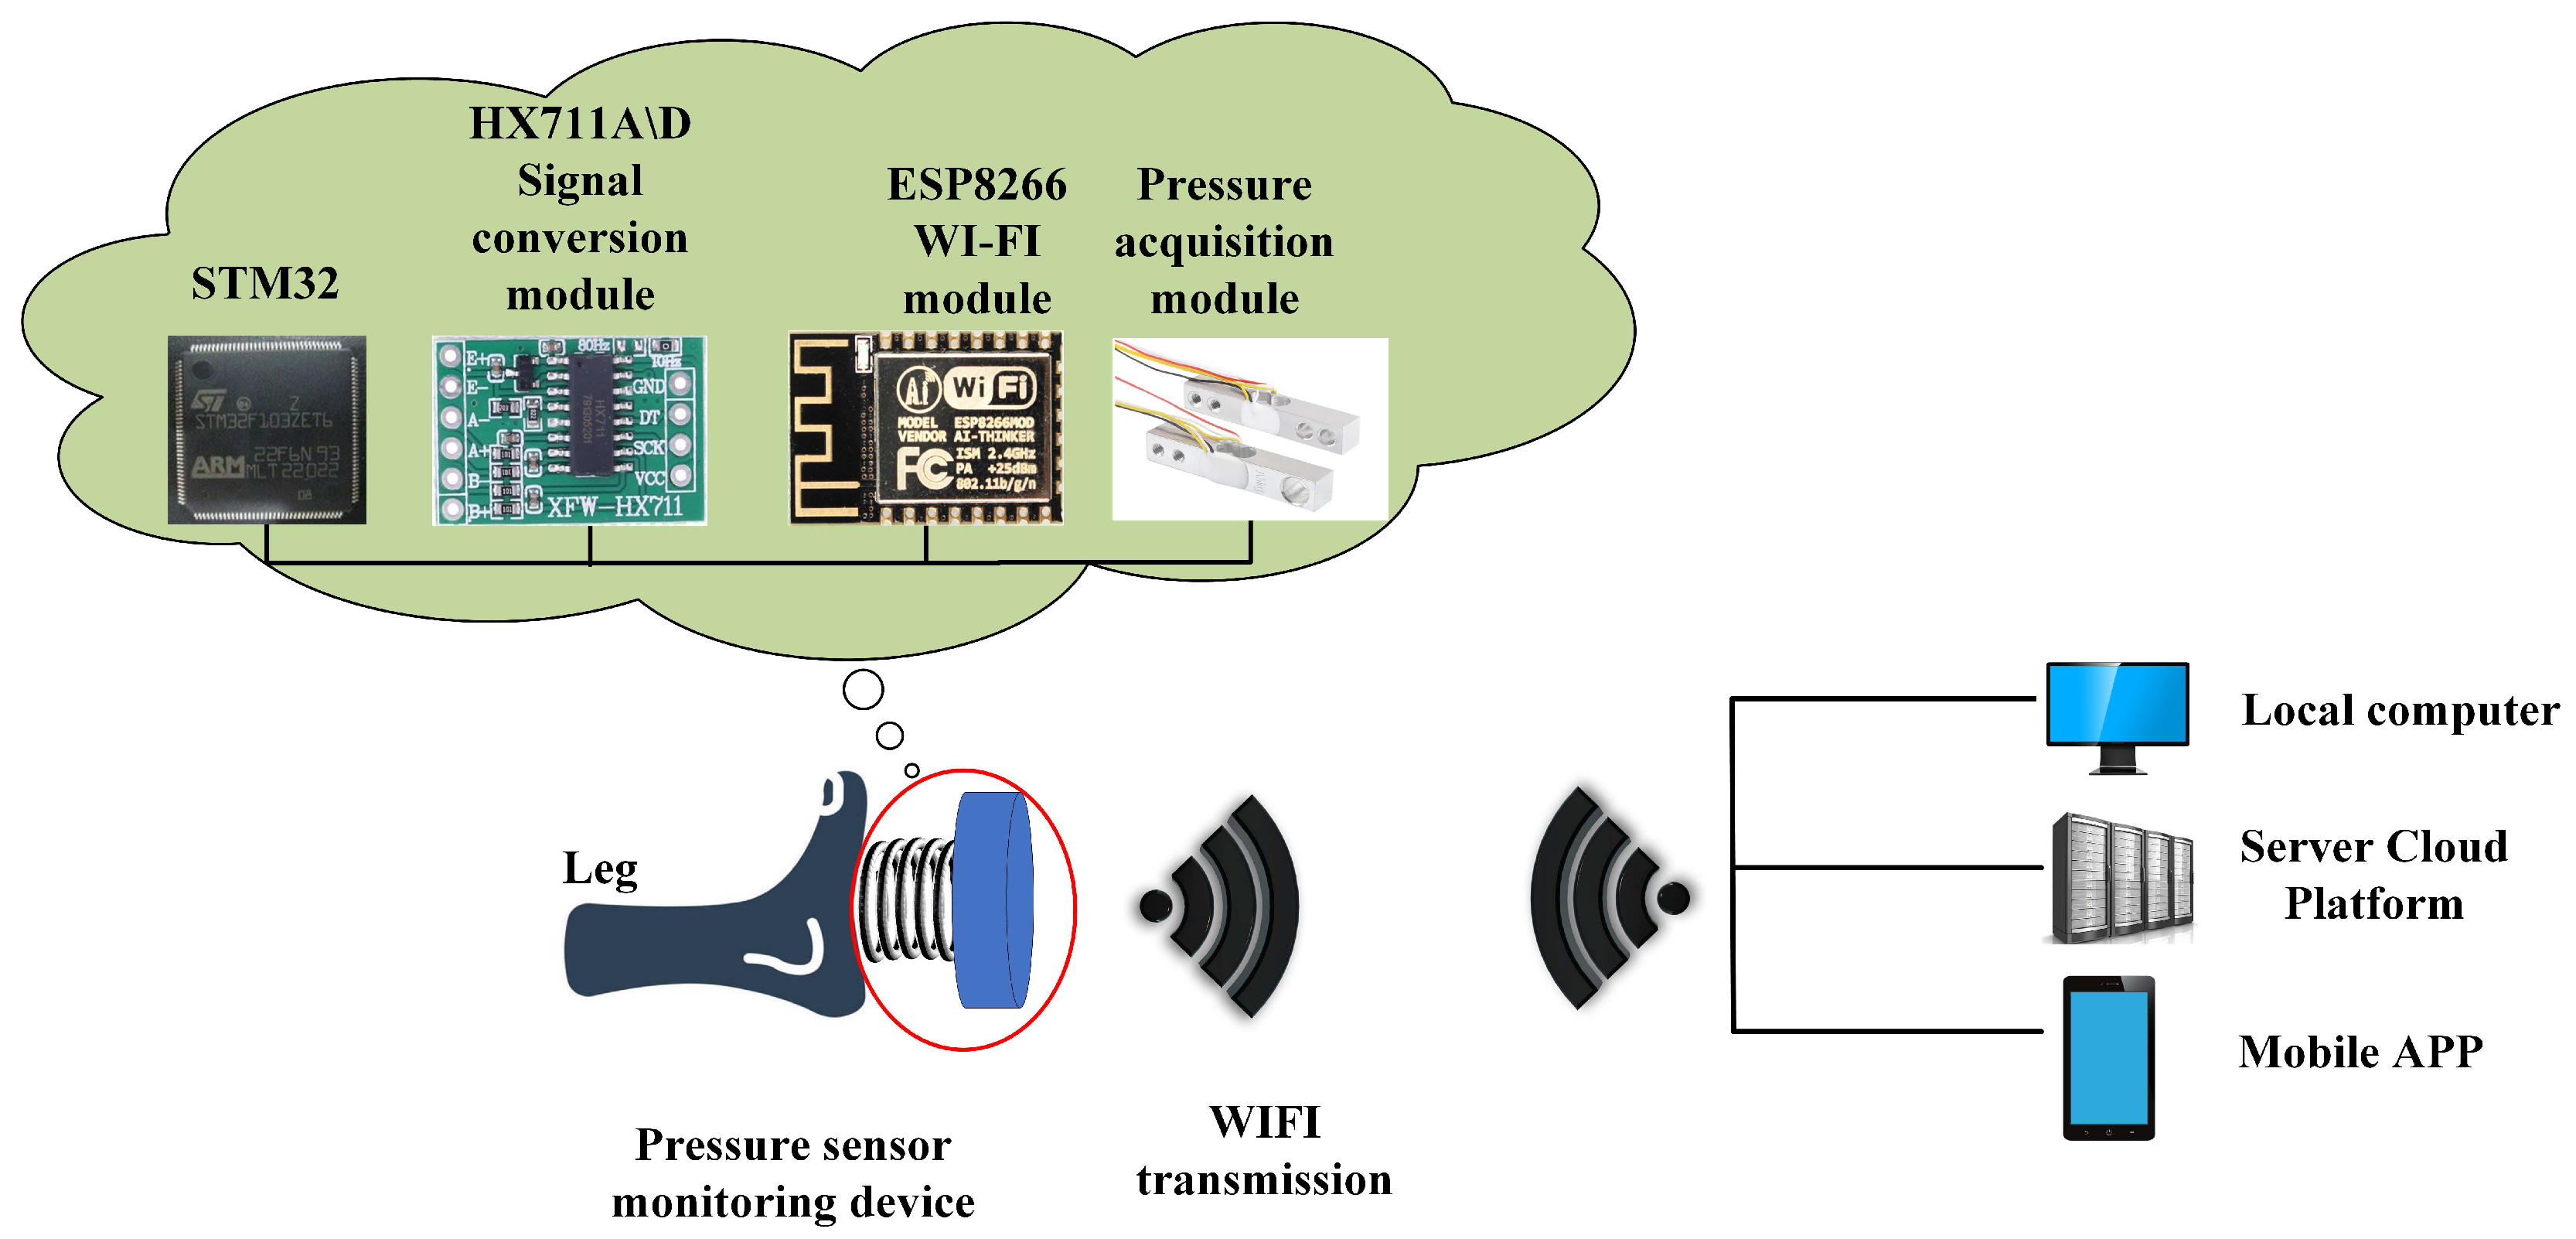
Figure 3.
Structure of an active ankle flexion and extension movement system based on pressure sensors
Figure 3.
Structure of an active ankle flexion and extension movement system based on pressure sensors
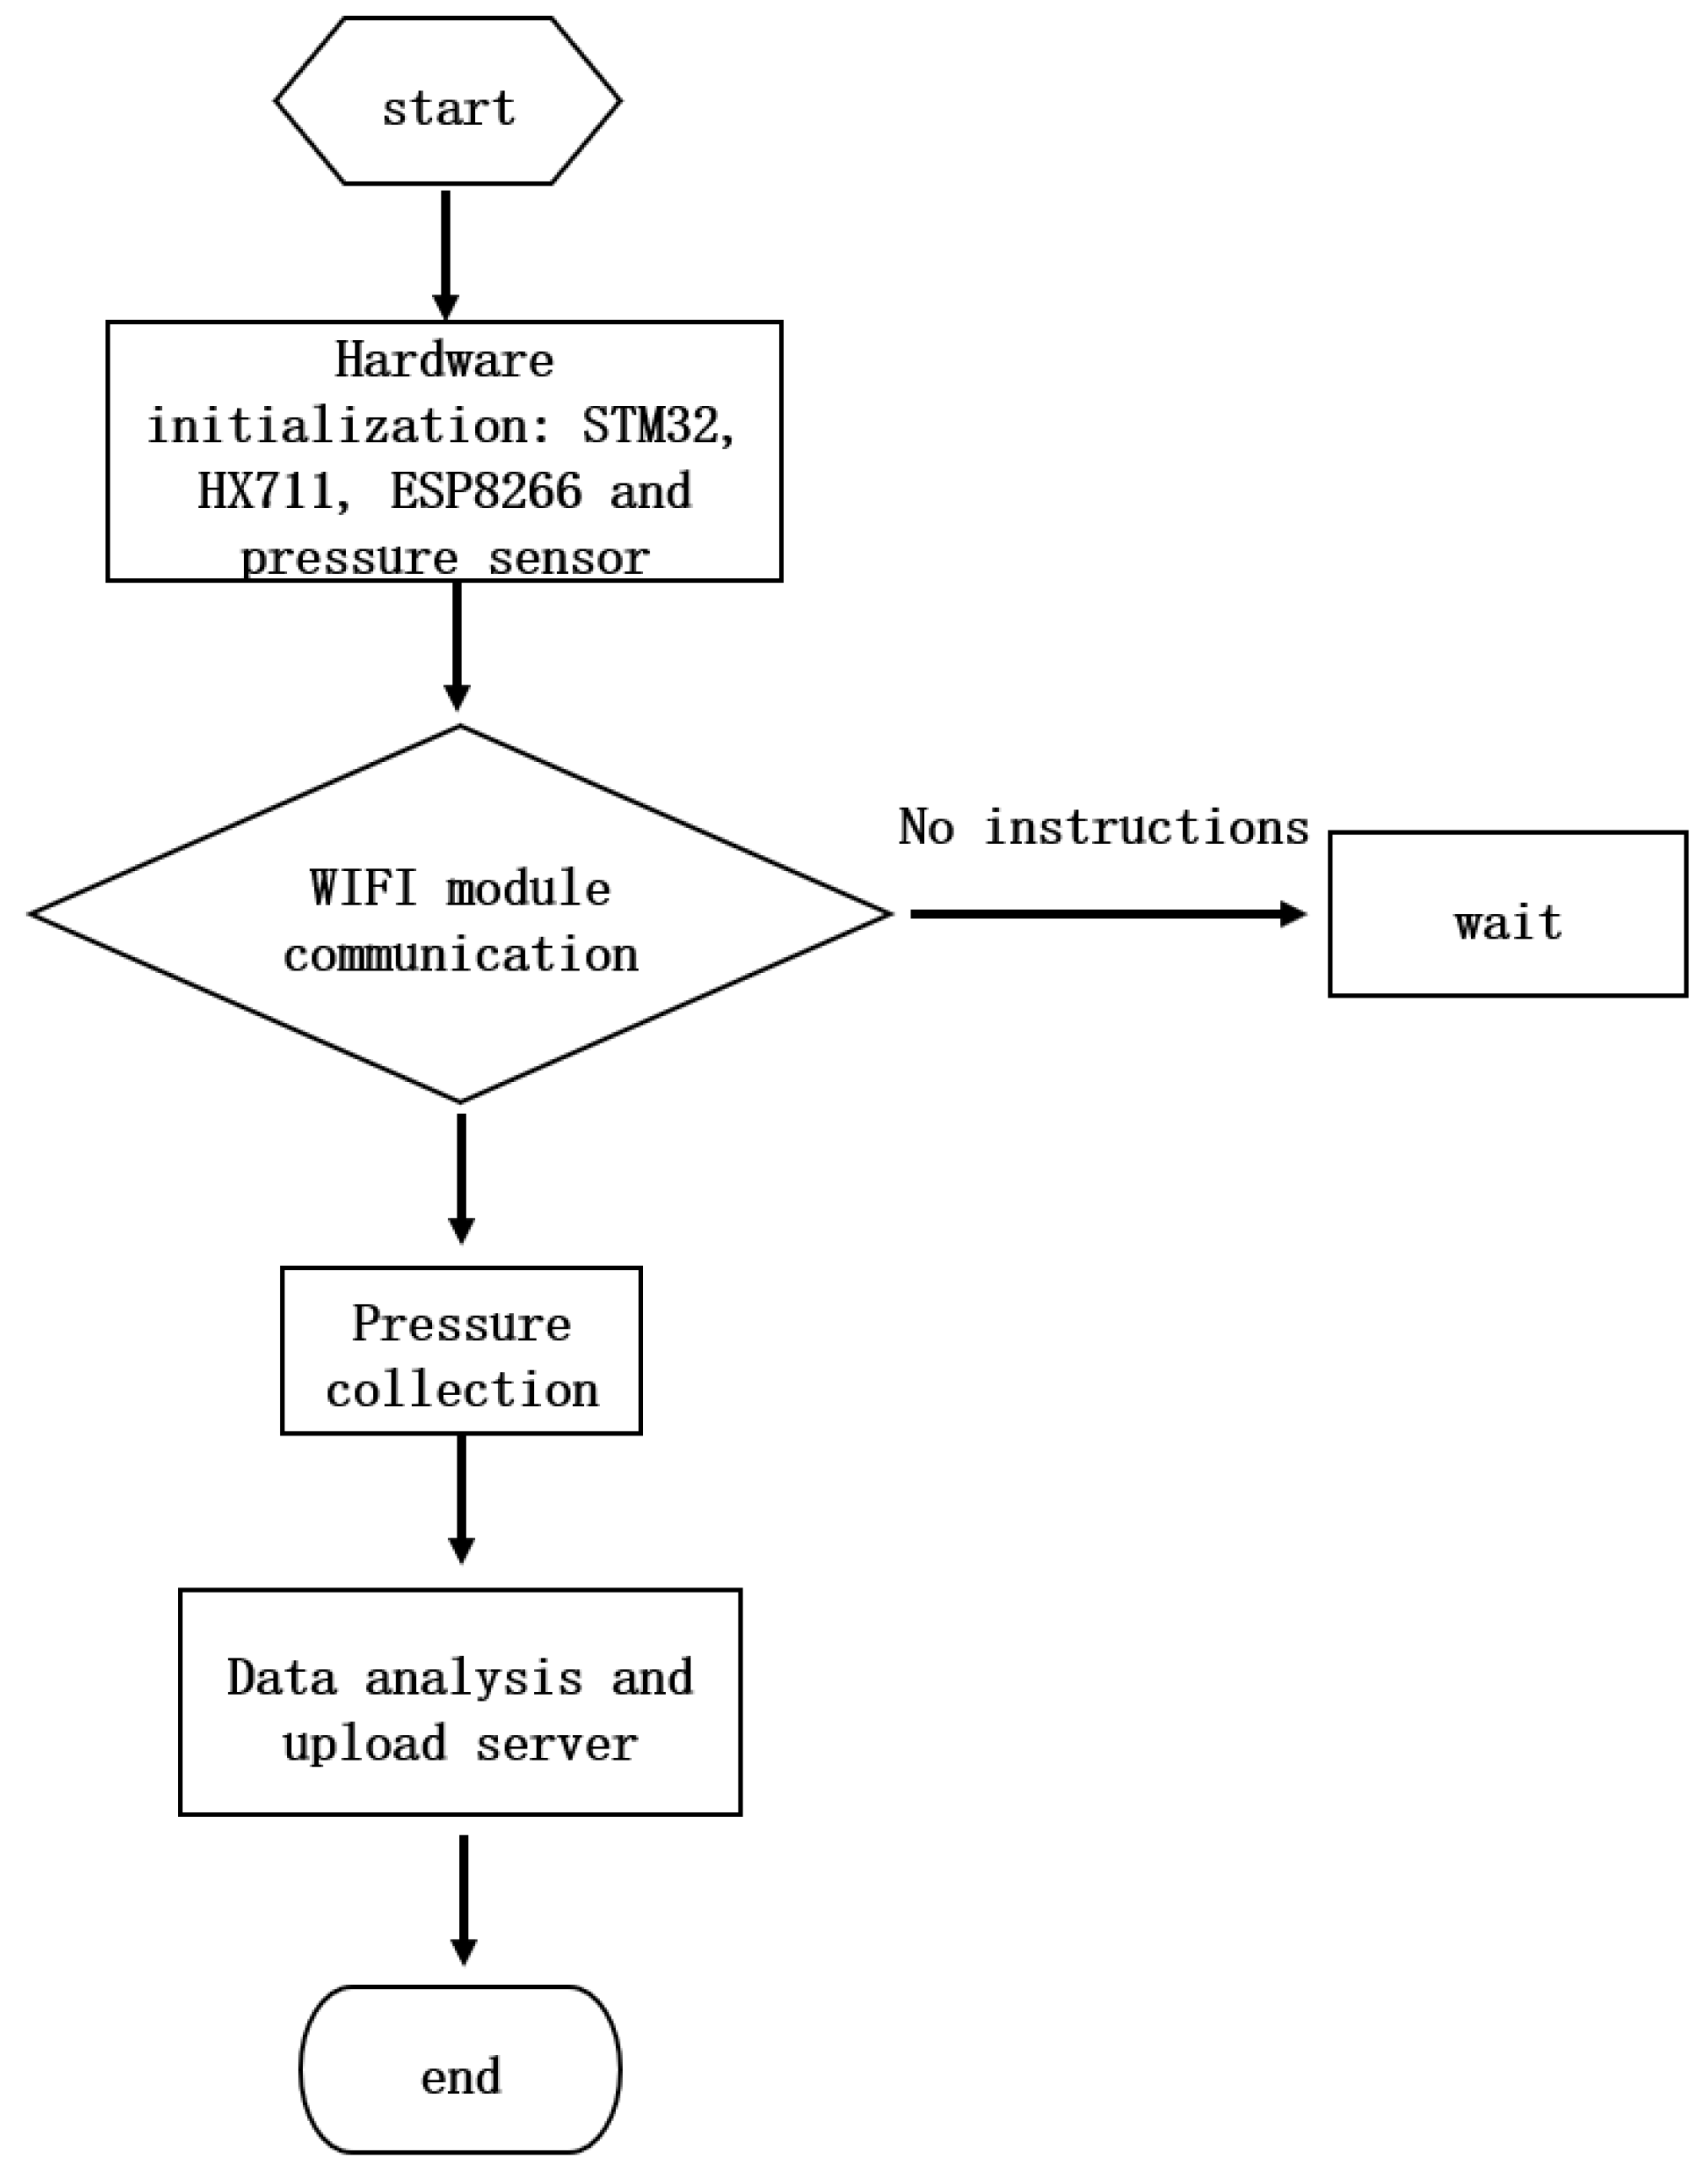
Figure 4.
Schematic diagram of ankle joint flexion and extension movement.
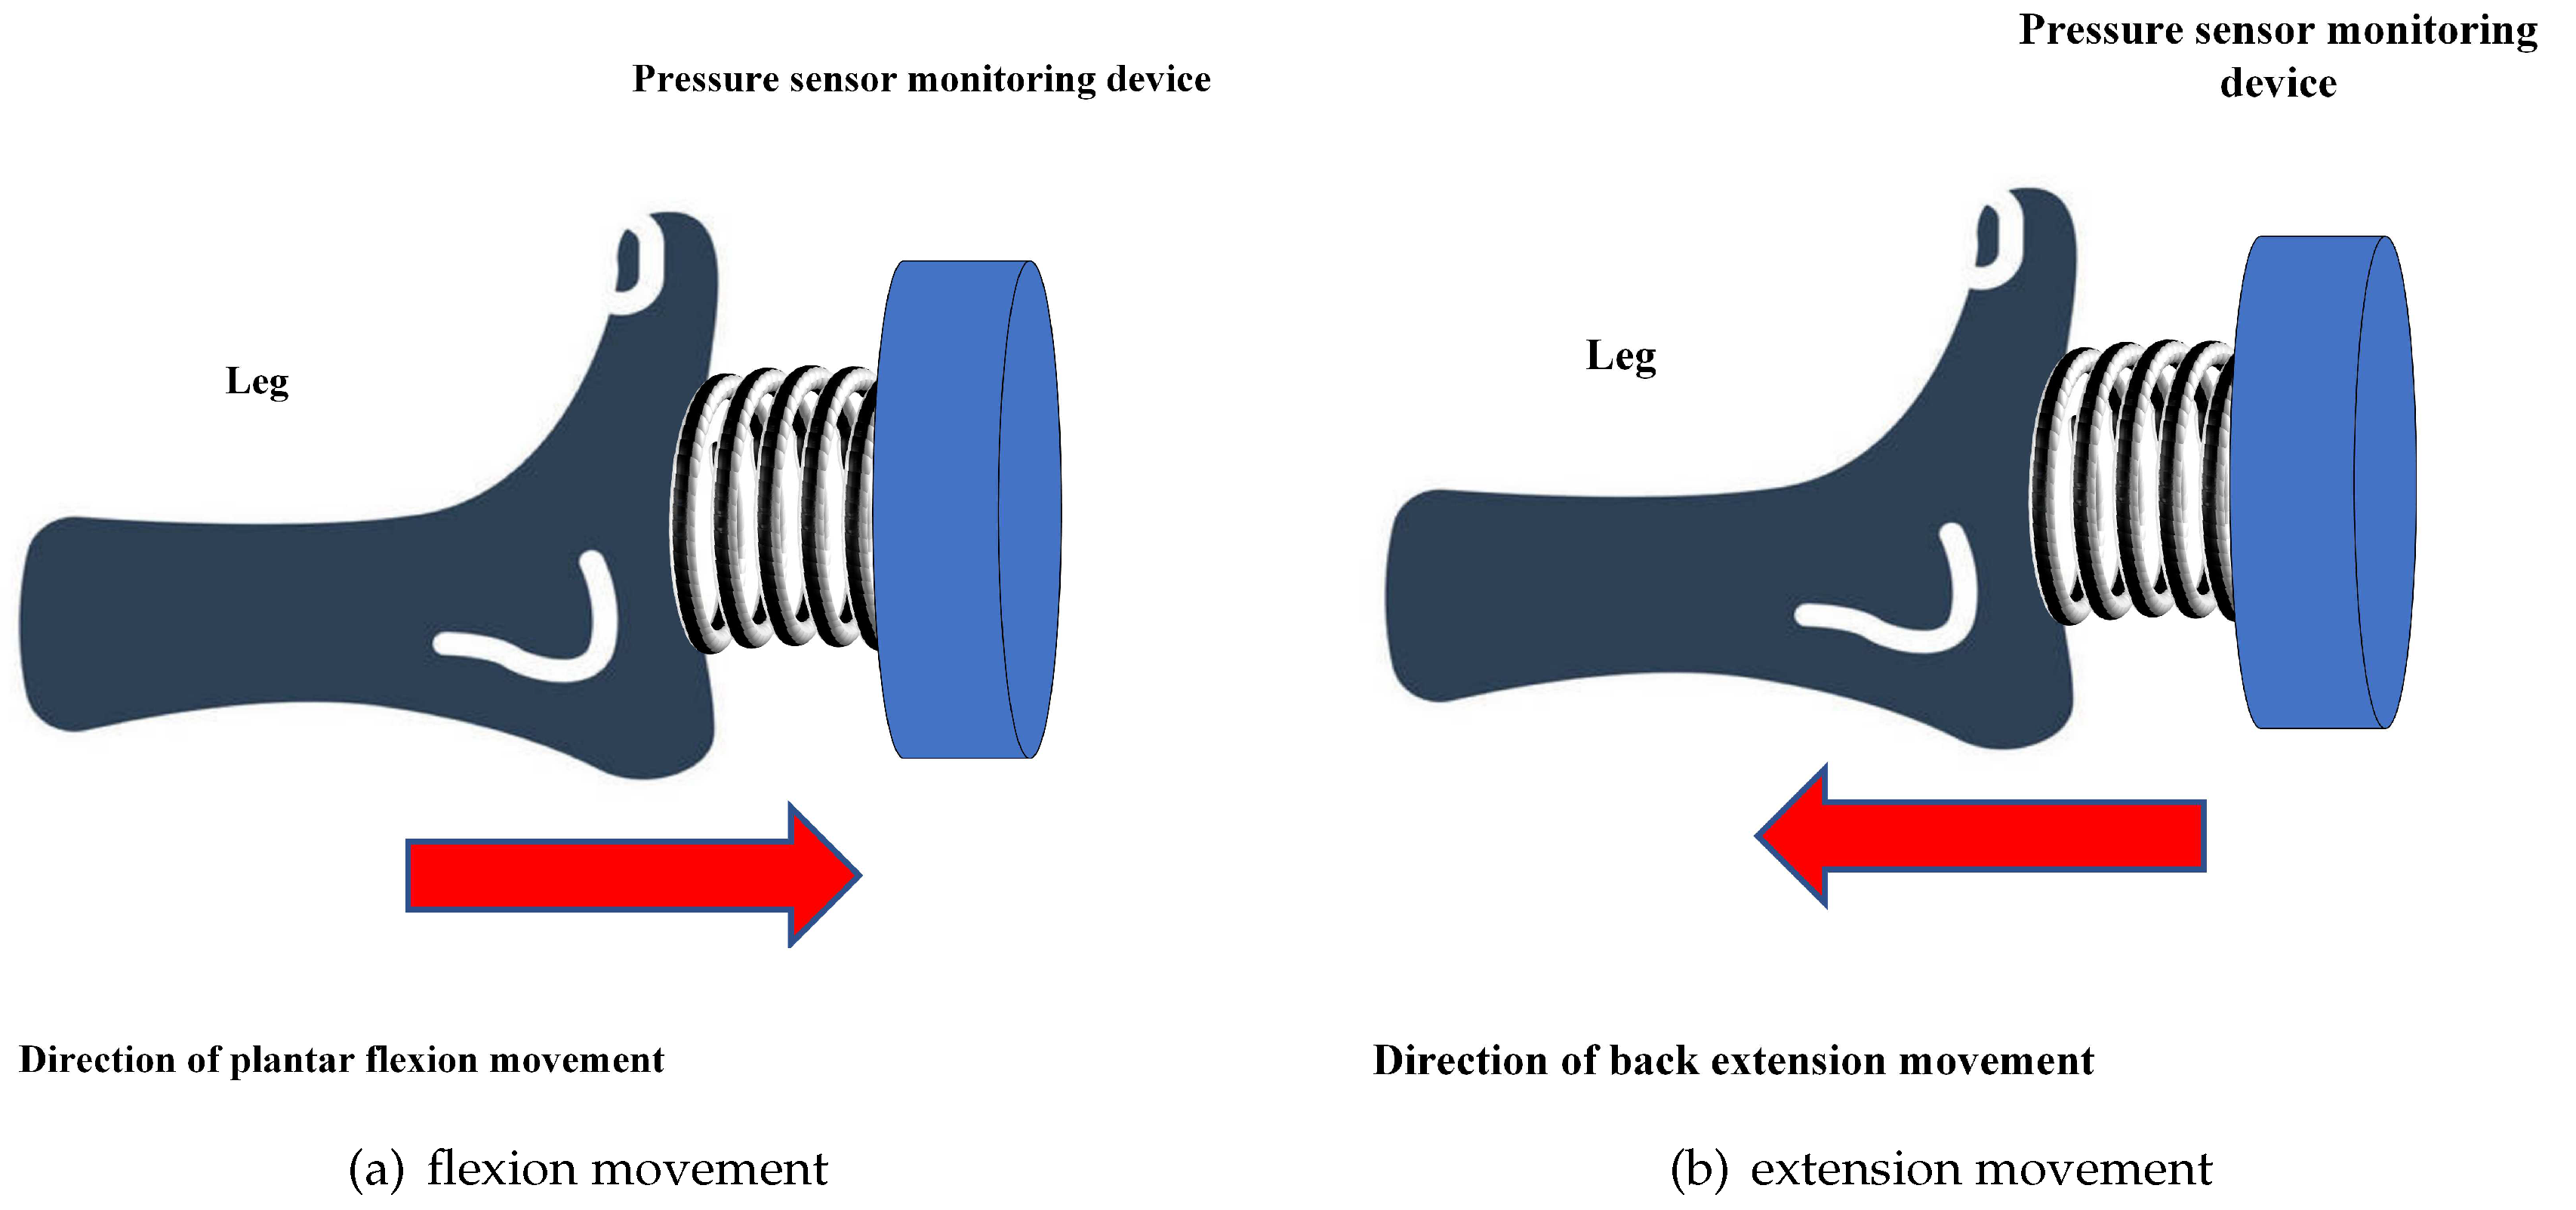
Figure 5.
Experimental device diagram for analysing the monitoring accuracy of extension force value
Figure 5.
Experimental device diagram for analysing the monitoring accuracy of extension force value
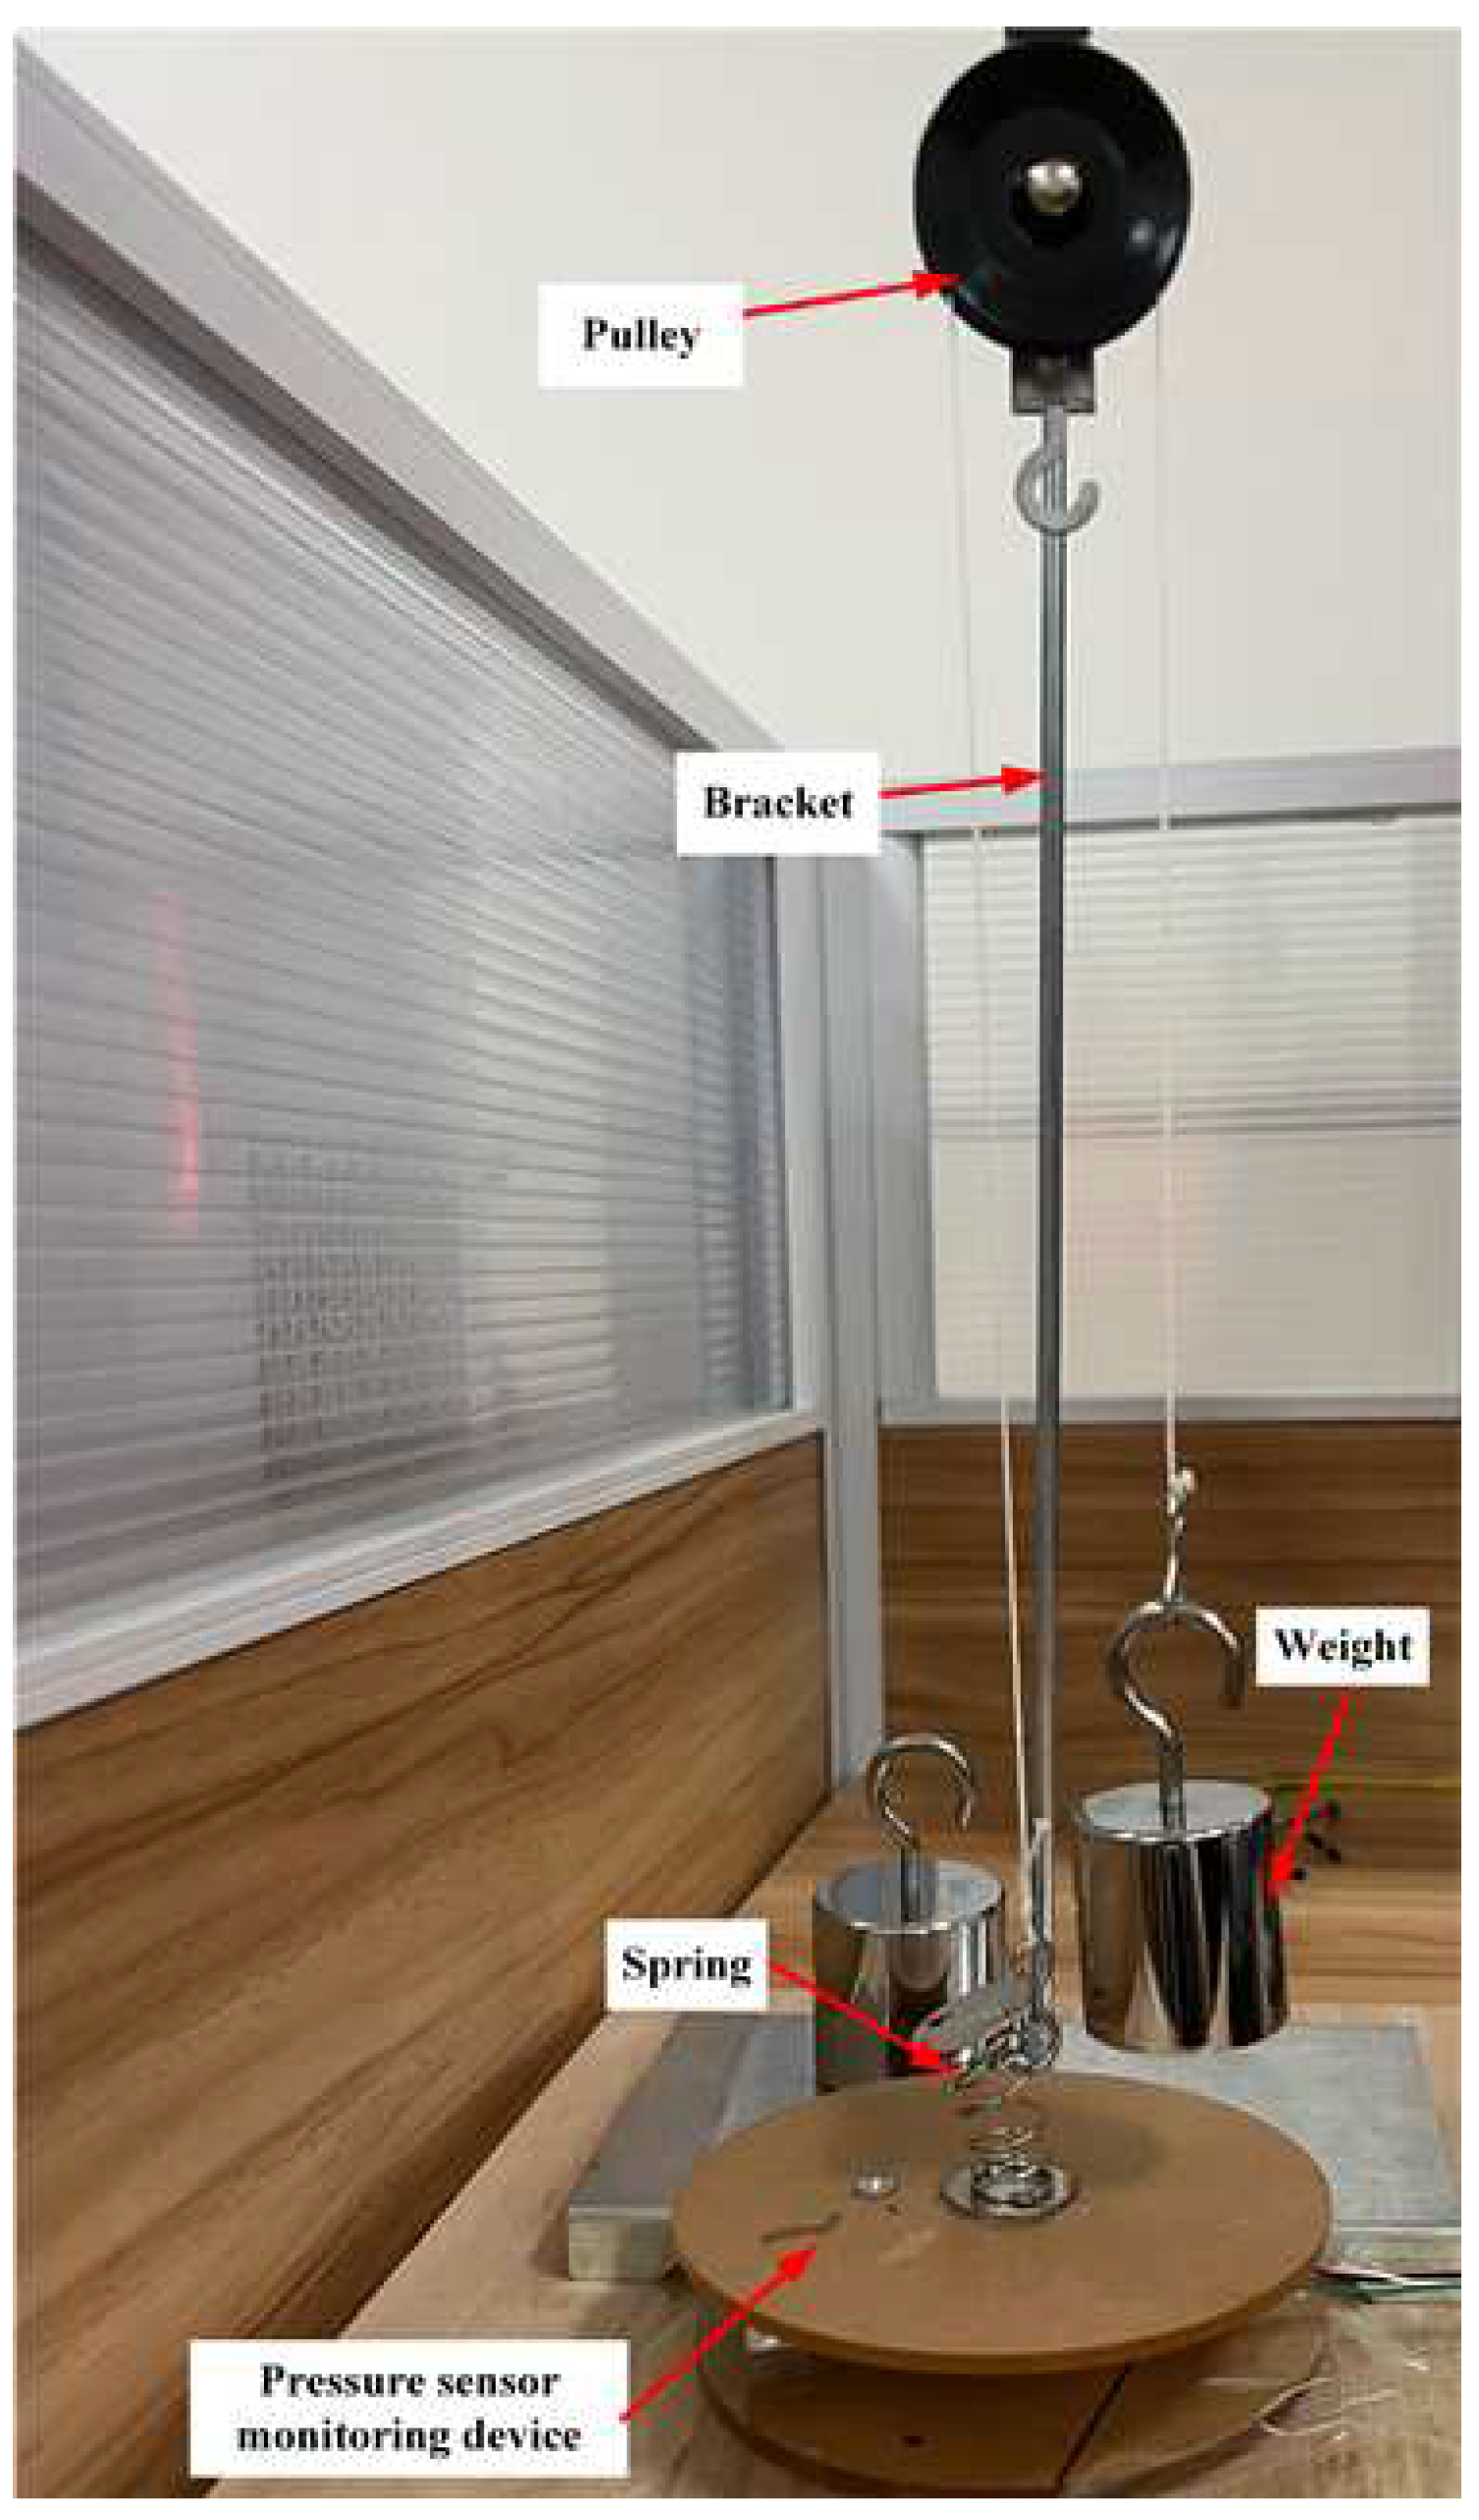
Figure 6.
Experimental device diagram for analysing the monitoring accuracy of flexion force value
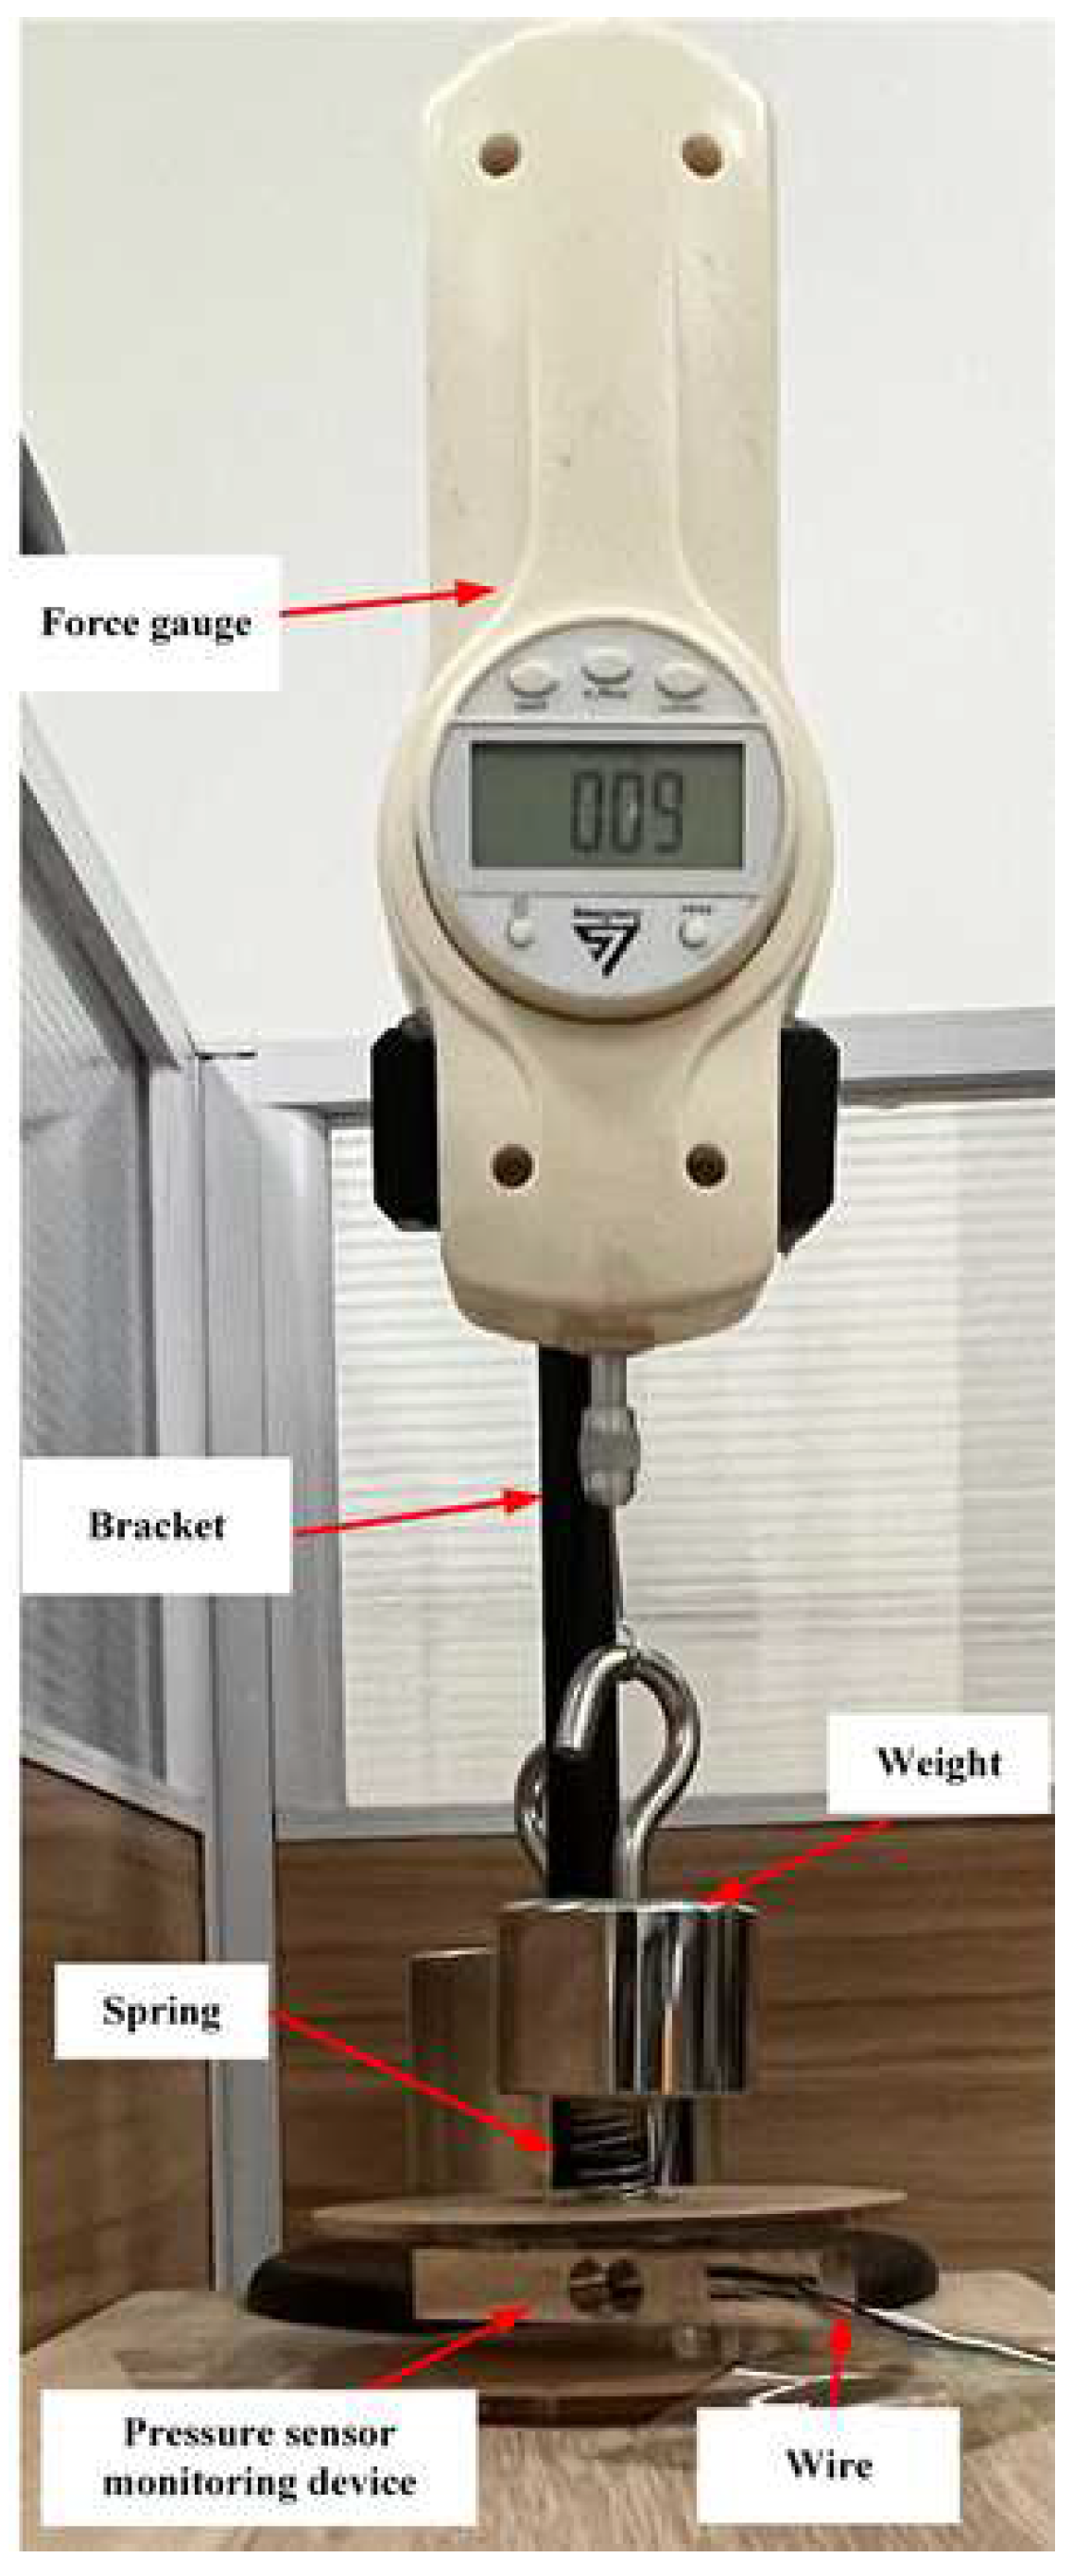

Table 1.
Experiment data and accuracy analysis of the extension force value
| Weight mass |
First force value (N) |
Second force value (N) |
Third force value (N) |
Fourth force value (N) |
Fifth force value (N) |
Sixth force value (N) |
Seventh force value (N) |
Eighth force value (N) |
Ninth force value (N) |
Tenth force value (N) |
Average error |
Mean square error |
|---|---|---|---|---|---|---|---|---|---|---|---|---|
| 100g (1N) | 1.01 | 1.00 | 1.00 | 1.00 | 1.00 | 1.00 | 1.00 | 1.00 | 1.00 | 1.00 | 0.0001 | 1× |
| 200g (2N) | 1.97 | 1.98 | 1.98 | 1.98 | 1.98 | 1.98 | 1.98 | 1.98 | 1.99 | 2.00 | 0.018 | 3.8× |
| 300g (3N) | 3.03 | 3.04 | 3.01 | 3.00 | 3.01 | 3.00 | 3.00 | 3.00 | 3.00 | 2.99 | 0.01 | 2.8× |
| 400g (4N) | 3.95 | 4.00 | 4.02 | 4.03 | 4.00 | 3.98 | 3.99 | 3.98 | 3.96 | 3.97 | 0.022 | 7.2× |
| 500g (5N) | 4.97 | 4.96 | 5.01 | 4.99 | 5.02 | 4.97 | 5.00 | 4.97 | 5.00 | 5.05 | 0.023 | 7.5× |
Table 2.
The experiment data and accuracy analysis of the flexion force value
| Weight mass |
Force value (N) |
Actual pressure F(N) |
Pressure value (N) |
Pressure value (N) |
Pressure value (N) |
Pressure value (N) |
Pressure value (N) |
Pressure value (N) |
Pressure value (N) |
Pressure value (N) |
Pressure value (N) |
Pressure value (N) |
Average error |
Mean square error |
|---|---|---|---|---|---|---|---|---|---|---|---|---|---|---|
| 200g (2N) | 1.00 | 1.00 | 1.00 | 1.00 | 1.00 | 1.00 | 1.00 | 1.01 | 1.01 | 1.00 | 1.00 | 1.00 | 0.0002 | 2× |
| 300g (3N) | 1.00 | 2.00 | 1.99 | 1.99 | 1.99 | 1.99 | 2.00 | 2.00 | 2.00 | 2.00 | 2.00 | 2.00 | 0.004 | 4× |
| 400g (4N) | 1.00 | 3.00 | 3.01 | 3.08 | 3.11 | 3.06 | 3.04 | 3.03 | 3.03 | 3.02 | 3.01 | 3.00 | 0.039 | 2.61× |
| 500g (5N) | 1.00 | 4.00 | 4.07 | 4.07 | 4.07 | 4.07 | 4.07 | 4.06 | 4.07 | 4.07 | 4.07 | 4.07 | 0.068 | 4.64× |
| 1kg (10N) | 5.00 | 5.00 | 5.04 | 5.05 | 5.02 | 5.06 | 5.08 | 5.05 | 5.05 | 5.05 | 5.04 | 5.05 | 0.049 | 2.61× |
Disclaimer/Publisher’s Note: The statements, opinions and data contained in all publications are solely those of the individual author(s) and contributor(s) and not of MDPI and/or the editor(s). MDPI and/or the editor(s) disclaim responsibility for any injury to people or property resulting from any ideas, methods, instructions or products referred to in the content. |
© 2023 by the authors. Licensee MDPI, Basel, Switzerland. This article is an open access article distributed under the terms and conditions of the Creative Commons Attribution (CC BY) license (https://creativecommons.org/licenses/by/4.0/).
Copyright: This open access article is published under a Creative Commons CC BY 4.0 license, which permit the free download, distribution, and reuse, provided that the author and preprint are cited in any reuse.


