
Submitted:
04 September 2023
Posted:
07 September 2023
You are already at the latest version
Abstract
Recent studies suggest that PEBP1/RKIP and YY1, despite having distinct molecular functions, may interact and mutually influence one another's activity. They exhibit reciprocal control over each other's expression through regulatory loops, prompting the hypothesis that their interplay could be pivotal in cancer advancement and resistance to drugs. To delve into this interplay's functional characteristics, we conducted a comprehensive analysis using bioinformatics tools across a range of cancers. Our results confirm the association between elevated YY1 mRNA levels and varying survival outcomes in diverse tumors. Furthermore, we observed differing degrees of inhibitory or stimulatory effects of these two genes in various cancer pathways, along with correlations between their mRNA expression and immune infiltration. Additionally, YY1/PEBP1 expression (or methylation) displayed connections with genomic alterations across cancer types. Notably, we uncovered links between YY1/PEBP1 and different indicators of immunosuppression, such as immune checkpoint blockade response, and T-cell dysfunction/exclusion levels, across different patient groups. Overall, our findings underscore the significant role of the interplay between YY1 and PEBP1 in cancer progression, influencing genomic changes, tumor immunity or the tumor microenvironment. Additionally, these two gene products appear to impact the sensitivity of anticancer drugs, opening new avenues for cancer therapy.
Keywords:
pan-cancer analysis
; RKIP
; YY1
; gene expression
; mutations
; immune infiltration
; drug resistance
1. Introduction
The Raf kinase inhibitor protein (RKIP), also known as phosphatidylethanolamine-binding protein 1 (PEBP1), is a member of the phospholipid-binding protein family that regulates several central signaling pathways, including the Raf/MEK/ERK, G protein-coupled receptors (GPCRs), and NF-κB pathways. RKIP is a negative regulator of these pathways and has been shown to inhibit cell proliferation, invasion, and metastasis in multiple cancer types. In addition, RKIP plays a crucial role in drug resistance and apoptosis [1,2,3]. On the other hand, Yin Yang 1 (YY1) is a transcription factor that regulates a variety of biological processes, including cell proliferation, differentiation, and apoptosis. YY1 can activate or repress the expression of a wide range of genes by binding to specific DNA sequences [4,5]. YY1 targeting therapy could have clinical implications and potentially be used to improve patient outcomes [6]. Recently, YY1 was shown to repress RKIP in lung cancer [7], suggesting a potential link between these two genes.
Although PEBP1/RKIP and YY1 have different molecular functions, recent studies suggest that they might interact and modulate each other's activity. Both gene products can modulate each other’s expression in an inverse relationship, through several regulatory loops [8]. For example, a recent study demonstrated that YY1 negatively regulates PEBP1/RKIP expression in lung cancer [9]. In addition, YY1 has been shown to interact either with transcriptional co-activators/co-repressors or with chromatin modulating enzymes, to indirectly regulate the transcription of their targets [10]. Together, these findings suggest that a cross-talk between PEBP1/RKIP and YY1 might play a crucial role in cancer progression and drug resistance.
To better understand the potential implications of the cross-talk between the two genes in cancer, we conducted a comprehensive bioinformatics analysis across multiple cancer types. Our study focused on analyzing the expression, mutation, immune infiltration, and drug resistance profiles of PEBP1/RKIP and YY1, using large-scale datasets from public repositories such as the Cancer Genome Atlas (TCGA) and the Cancer Proteome Atlas (TCPA). By integrating multiple data sources and applying advanced computational methods, we aimed to identify novel insights into the role of PEBP1/RKIP and YY1 in cancer, as well as potential therapeutic targets and biomarkers.
Overall, our study provides new evidence that the cross-talk between RKIP and YY1 might be an important regulator of cancer progression and drug resistance, with potential clinical implications. Our findings shed light on the intricate interaction between these two genes, and have the potential to lay the foundation for the creation of improved diagnostic and therapeutic approaches for cancer.
2. Materials and Methods
2.1. Data Extraction
The TCGA mRNA expression, copy number variations (CNV) and methylation data were retrieved from UCSC Xena (http://xena.ucsc.edu/). The mRNA data (RSEM normalized) were normalized to remove batch effects. The TCGA single nucleotide variants (SNV) data were obtained from the Synapse project (syn7824274; https://www.synapse.org/#!Synapse:syn7824274). Calculation of methylation was based on the beta value.
2.1.1. Differential Expression
Based on the normalized and batch corrected RSEM mRNA expression, we examined the differential expression of YY1 and PEBP1 across 14 TCGA cancer types (thyroid cancer, THCA; kidney renal papillary cell carcinoma, KIRP; muscle-invasive bladder cancer, BLCA; liver hepatocellular carcinoma, LIHC; head-neck squamous cell carcinoma, HNSC; breast invasive carcinoma, BRCA; lung adenocarcinoma, LUAD; prostate adenocarcinoma, PRAD; esophageal carcinoma, ESCA; kidney chromophobe, KICH; lung squamous cell carcinoma, LUSC; kidney renal clear cell carcinoma, KIRC; stomach adenocarcinoma, STAD; and colon adenocarcinoma, COAD). The p-values were estimated using t-test and adjusted by FDR. The differential gene expression analysis results were provided as bubble plots and boxplots.
2.1.2. Expression and Survival
For expression and survival analysis, we explored 33 cancer types from GSCA [11]. Samples having a competing risk for death from cancer were filtered out (for DSS and DFI data). Tumor samples were divided into high and low YY1 (or PEBP1) expression groups, using the median value. We used the following prognostic indicators: overall survival (OS), progression-free survival (PFS), disease-specific survival (DSS) and disease-free survival (DFI). The survival status was fitted within the two groups using the R package survival.
We also explored patient survival using GEPIA2 [12]. Cox proportional-hazards model and log rank tests were performed for each gene in every cancer. Data were presented as bubble plots and Kaplan-Meier curves for high and low expression of YY1 and/or PEBP1 in specific cancers to measure significant differences between curves. The genes with p-values <0.05 from the Kaplan-Meier log rank test were statistically significant.
In addition, we used PrognoScan [13] as an additional tool for survival analysis, using various Gene Expression Omnibus (GEO) datasets.
2.1.3. Expression and Subtype
We explored changes of gene expression in different subtypes of HNSC, LUSC, COAD, STAD, LUAD, glioblastoma multiforme (GBM), BRCA, KIRC and BLCA. The gene set variation analysis (GSVA) score was compared among groups using Wilcoxon and ANOVA tests.
2.1.4. Expression and Stage
For expression and stage analysis, we analysed 4 stage types (pathologic, clinical, masaoka (for thymoma, THYM), and the International Germ Cell Cancer Collaborative Group (IGCCCG) stage [for tenosynovial giant cell tumors, TGCT, only]) data of 9,478 tumor samples from 27 cancer types (adrenocortical carcinoma, ACC; BLCA; BRCA; cervical squamous cell carcinoma and endocervical adenocarcinoma, CESC; cholangiocarcinoma, CHOL; COAD; diffuse large B-cell lymphoma, DLBC; ESCA; HNSC; KICH; KIRC; KIRP; LIHC; LUAD; LUSC; mesothelioma (MESO); ovarian cancer, OV; pancreatic ductal adenocarcinoma, PAAD; rectum adenocarcinoma, READ; skin cutaneous melanoma, SKCM; STAD; TGCT; THCA; THYM; uterine corpus endometrial carcinoma, UCEC; uterine carcinosarcoma, UCS; and uveal melanoma, UVM).
The pathologic, clinical and masaoka stages classify samples into stage I, II, III, and IV, while the IGCCCG classifies samples into good (n=32), intermediate (n=9), and poor (n=2). Trend analysis was performed using the Mann-Kendall Trend test.
2.1.5. Expression and Pathway Activity
We estimated the difference in YY1 and PEBP1 gene expression between pathway activity groups (activation and inhibition), as defined by their median pathway scores. Reverse phase protein array (RPPA) data from TCPA (https://www.tcpaportal.org/tcpa/) were used to assess the pathway activity score of 10 cancer-related pathways for 7,876 samples across 32 cancer types.
RPPA data were median-centered and normalized by the standard deviation across all samples for each component to obtain the relative protein level. The pathway score was calculated as previously described [14].
The difference in pathway activity score (PAS) between high and low gene expression groups was defined using the student’s T test. The p-values were adjusted by FDR, and the threshold of significance [15] was set at 0.05, as previously described in Ye et al. [16].
If the samples exhibiting elevated gene expression demonstrated significantly increased pathway activity (FDR≤0.05), this suggested a potential activating impact on the pathway's activity for the gene; conversely, if not, it indicated a potential suppressive influence on the pathway activity.
2.2.1. Immune Infiltration and mRNA Expression
For immune infiltration analyses, we extracted a total of 10,995 samples from 33 cancer types in the TCGA, including 24 immune cells (18 T-cell subtypes, B cells, NK cells, monocytes, macrophages, neutrophils and dendritic cells [DC])). The estimation of the abundance of the immune cells was based on specific gene set signatures (Table S1), using the Immune Cell Abundance Identifier (ImmuCellAI) tool (http://bioinfo.life.hust.edu.cn/ImmuCellAI/#!/) [17]. We then estimated the association between YY1/PEBP1 mRNA expression and the immune cells’ infiltrates, using Spearman correlation analysis.
In addition, we analyzed associations between YY1 and PEBP1 mRNA expression and immune signatures/tumor immune cell infiltration in the TCGA database, using the R package “UCSCXenaShiny” [18]. In addition, we examined the Spearman’s correlations between molecular profiling and the tumor mutational burden (TMB), stemness and microsatellite instability (MSI).
2.2.2. Immune Infiltration and Mutations
We then estimated the difference in immune cells’ infiltrates between mutated genes (SNV) and wild-type (WT) groups through the Wilcoxon test. We also explored the association between YY1 or PEBP1 CNVs and immune cells’ infiltrates through Spearman correlation analysis. The infiltrates of 24 immune cells were evaluated through ImmuCellAI [15,17].
2.2.3. Immune Infiltration and Methylation
We further examined the association between YY1/PEBP1 methylation and immune cells’ infiltrates through Spearman correlation analysis. The P values were FDR-adjusted.
2.3.1. YY1 and PEBP1 Mutation Analysis
We also explored YY1 and PEBP1 SNVs in 10,234 samples across 33 cancer types, focusing on the presence of deleterious mutations, including missense, nonsense, frame-shift or in-frame insertions/deletions, and splice site mutations. We assessed differences in survival between mutant and WT groups, using the R package survival, the Cox proportional-hazards model and log rank tests. Co-mutation was associated with the cancer clinical outcome, as previously described [19].
In addition, we downloaded CNV data of 11,495 TCGA samples and analyzed the genomic regions with significant amplifications or deletions, using GISTIC2.0 [20], The GISTIC scores (-2, -1, 1, 2) reflecting the CNVs in YY1 and PEBP1 in the selected cancer types were summarized and the results were depicted as oncoplots, pie plots and bubble plots representing either heterozygous or homozygous amplifications and deletions of each gene per cancer.
2.3.2. CNV and mRNA Expression Analysis
We correlated YY1 and PEBP1 CNVs with their corresponding mRNA expression levels, using Spearman correlation as previously described [21].
2.3.3. CNV and Survival Analysis
The samples were divided into wild-type (WT), amplification (Amp.) and deletion (Del.) groups and differences in their survival were assessed using the R package survival and the log rank test.
2.4.1. Differential Methylation Analysis
We then set to explore the differential methylation between tumor and normal sample groups, using Illumina HumanMethylation 450k (level 3) data. Generally, there are multiple methylation sites in the region of one gene. Therefore, there are multiple tags that store the methylation level of each site. Before differential methylation analysis, we performed correlation analysis to filter the sites most negatively correlated with YY1 and PEBP1 expression into this analysis.
2.4.2. Differential Methylation and Survival Analysis
Before survival analysis, we performed correlation analysis to filter the site most negatively correlated with gene expression into this analysis. We downloaded clinical data from 33 TCGA cancer types and the study by Liu et al. [22]. Uncensored data was left out. Samples with a competing risk for death from cancer were filtered out (for DSS and DFI data). The median methylation level was used to divide tumor samples into high and low methylation groups and survival differences between them were assessed using survival.
2.4.3. Differential Methylation and YY1/PEBP1 mRNA Expression
We used the Spearman’s test to get the correlation between gene mRNA expression and methylation levels.
2.5. Drug Sensitivity and YY1/PEBP1 Expression
We collected the half maximal inhibitory concentration (IC50) of 265 small molecules in 860 cell lines and the corresponding mRNA gene expression from two databases: Genomics of Drug Sensitivity in Cancer (GDSC; Release 8.4 [July 2022]) [16,23,24] and Genomics of Therapeutics Response Portal (CTRP v2) [25,26,27]. GDSC contains 265 small molecules IC50, 860 cell lines and 17,419 genes; whereas, CTRP contains 481 small molecules IC50, 1,001 cell lines and 18,900 genes. We explored the correlation between YY1/PEBP1 mRNA expression and drug IC50 using Pearson’s correlation test. Meanwhile, we used CellMiner Cross Database (CDB) (https://discover.nci.nih.gov/cellminercdb/) to explore associations between YY1 (or PEBP1) expression levels and drug sensitivity, across all major cancer cell line pharmacogenomic data sources from NCI-DTP NCI-60, Sanger GDSC, and Broad CCLE/CTRP.
We then used ROC plotter tool (http://www.rocplot.org/) [28] to explore the relationship between YY1/PEBP1 mRNA expression and sensitivity in endocrine therapy, anti-HER2 therapy or chemotherapy in breast cancer, using the following parameters: response: pathological complete response (n=1775), and treatment: [(any) chemotherapy; (any) endocrine therapy; (any) anti-HER2 therapy]). A total of 1,632 samples (1,100 non-responders and 532 responders) met the above conditions for chemotherapy; 217 for anti-HER2 therapy (122 non-responders and 95 responders); and 64 (19 non-responders and 45 responders) for endocrine therapy. The Mann‒Whitney test was used to compare expression differences between non-responders and responders to each type of therapy.
We also used the Tumor Immune Dysfunction and Exclusion (TIDE) algorithm [29,30] (http://tide.dfci.harvard.edu/) to find associations between PEBP1/YY1 mRNA expression and immunotherapy (ICB) outcomes.
3. Results
3.1. Differential Expression of YY1 and PEBP1 in Pan-Cancer
We initially investigated pan-cancer the expression of YY1 and PEBP1, and found higher YY1 mRNA levels in HNSC, lung cancer (LUAD and LUSC), as well as in ESCA, BRCA and BLCA, compared to their corresponding normal tissues. In contrast, PEBP1 mRNA levels were significantly lower across all kidney cancer subtypes (KICH, KIRC and KIRP), as well as in LIHC, HNSC, THCA, LUAD and LUSC tumors (Figure 1A-B). The reverse expression pattern that the two genes exhibited in HNSC and lung cancers, was previously described [31]. We further found that YY1 mRNA expression was correlated with clinicopathological stages in KIRC, KIRP, LIHC, OV, and SKCM; whereas PEBP1 mRNA expression exhibited the reverse pattern in these tumors, as well as in CESC, PAAD and THCA (Figure S1). Trend analysis also revealed differences of YY1 mRNA expression between pathologic and clinical stage in KIRP (pathologic stage: p=1.27e-4, FDR=3.23e-3, and clinical stage: p=2.25e-5, FDR=3.19e-3), as well as differences of PEBP1 mRNA expression across pathologic stages of LIHC (p=3.81e-3, FDR=0.11) and THCA (p=3.08e-3, FDR=0.01), among others (Figure 1C and Table S1).
In addition, we found that YY1 mRNA expression correlates with the molecular subtypes in BLCA (Non-Papillary vs Papillary; p=0.049), BRCA (Basal, Her2, Luminal A, Luminal B and Normal-like; p=9.7011E-09), GBM (Classical, G-CIMP, Mesenchymal, Neural and Proneural; p=0.046), KIRC (p<0.0001), LUAD (p=0.0016), LUSC (p=0.009) and STAD (p=0.0012); whereas that of PEBP1 with GBM (p=0.013), KIRC (p=2.76E-30), LUAD (subtypes 1-6; p=0.00005), and LUSC (basal, classical, primitive and secretory; p=0.0007) (Figure 1D and Table S2).
3.2. Pan-Cancer Analysis of Correlations between YY1/PEBP1 mRNA Expression and Patient Survival
To discover the prognostic value of YY1 and PEBP1 in pan-cancer, we analyzed differences in patient survival between high and low expression groups of the two genes, and we found that the expression of both genes significantly (p<0.05) correlates with survival in different tumor types (Table S3).
High YY1 mRNA levels correlated with worse survival in HNSCC (OS and DSS), KIRC (OS, DSS) and KIRP (OS, PFS, DSS, DFI) among other tumors (Figure 1E and Table S3) (e.g., LUAD (DSS), PAAD (OS, PFS, DSS, DFI), PCPG (OS, PFS), PCPG (DFI), SARC (DFI), STAD (DSS) and THCA (PFS, DFI). In READ and THYM on the other hand, high YY1 mRNA levels correlated with better DFI and DSS, respectively.
Similarly, high PEBP1 mRNA levels correlated with better survival in KICH (PFS and DFI) (Figure 1E and Table S3), among other tumors (e.g., KIRP (OS, DSS), LIHC (OS, PFS and DSS), LUAD (OS, PFA, DSS and DFI), MESO (OS and PFS), PAAD (OS, PFS and DSS), and UVM (OS, PFS and DSS)).
We also used GEPIA2 survival analysis to explore the (overall and disease-free) survival maps of the two genes in pan-cancer. Our findings indicate that in ACC, PCPG, PAAD and PRAD the overall survival of the high-YY1 expression group was significantly (p<0.05) higher than that of the low expression group. In addition, in ACC, MESO and UVM the disease-free survival of the high-YY1 expression group was significantly higher than that of the low expression group. On the other hand, in KIRC, CESC, UCEC, and UVM the overall survival of the high-PEBP1 expression group was significantly lower than that of the high expression group. Also, in DLBCL, high PEBP1 expression correlated with better DFS (Figure S2A-B).
Using univariate Cox proportional hazard regression (HR) model to predict the prognostic risk of the two genes in pan-cancer, we found that YY1 was an adverse prognostic factor (p<0.05, HR>0) for OS in PAAD, LUAD and KIRP and a protective prognostic factor in OV and KIRC (p<0.05, HR<0). YY1 was also an adverse prognostic factor for PFI in UVM, LUAD, BLCA and ACC and a protective prognostic factor in OV and KIRC. For DSS, YY1 was an adverse prognostic factor in PRAD, PAAD, LUAD and KIRP and a protective prognostic factor in OV and KIRC; while for DFI, it was an adverse prognostic factor in PAAD, CESC and ACC, and a protective prognostic factor in OV (Figure S2C).
Likewise, PEBP1 was an adverse prognostic factor (p<0.05, HR>0) for OS in SKCM and a protective prognostic factor (p<0.05, HR<0) in PAAD, OV, LUAD, KIRP and KIRC. PEBP1 was also an adverse prognostic factor for PFI in DLBCL and a protective prognostic factor in PAAD, OV, KIRP and KIRC. For DSS, PEBP1 was a protective prognostic factor in PAAD, OV, KIRP and KIRC; while for DFI, it was an adverse prognostic factor in PCPG, and a protective prognostic factor in THCA (Figure S2C).
Overall, the analysis of multiple prognostic datasets pan-cancer revealed the cancers in which YY1 and PEBP1 significantly correlate with a good or bad prognosis, respectively.
We further used PrognoScan for survival analysis using various GEO datasets. We constructed a univariate Cox proportional hazard regression model to predict the prognostic risk of YY1 and PEBP1 in pan-cancer, and we found that the two genes associate with the prognoses of various tumors (Table S4). For example, our analysis showed that YY1 is an adverse prognostic factor in AML, B-cell lymphoma, DLBCL, colorectal cancer, uveal melanoma, lung cancer, ovarian cancer, skin cancer and liposarcoma (p<0.05, HR>0) and a protective prognostic factor in astrocytoma, breast cancer, gliomas, ovarian cancer, B-cell lymphoma, breast cancer and renal cell carcinoma (p<0.05, HR<0).
On the other hand, PEBP1 was shown to act as an adverse prognostic factor in brain cancer (meningioma), colorectal cancer, breast cancer, ovarian cancer and AML and a protective prognostic factor in bladder cancer, lung cancer, adenocarcinoma and liposarcoma (Table S4).
Taken together, we used multiple prognostic datasets for pan-cancer and preliminarily revealed that the high mRNA levels of YY1 and PEBP1 significantly correlate with a poor prognosis for different cancer patients.
3.3. Pathway Activity in Pan-Cancer
We then set to explore the differences of the activity of 10 pathways, between high and low YY1/PEBP1 mRNA expression. Our results reveal a strong inducing (activatory) effect of YY1 mRNA expression in Cell Cycle (31%), apoptosis (16%) and DNA damage (16%) pathways, pan-cancer. YY1 mRNA expression also had an inhibitory effect in the EMT (12%), hormone ER (12%), RASMAPK (19%) and RTK (12%) pathways, pan-cancer.
PEBP1 on the other hand, had an activatory effect in the hormone AR (19%), hormone ER (9%), PI3KAKT (9%), RTK (9%) and RASMAPK (6%) pathways; as well as a strong inhibitory effect in the apoptosis (22%) and EMT (25%), and less on the Cell cycle (9%), PI3KAKT (9%) and RTK (9%) pathways (Figure 2A and Table S5).
For example, in bladder cancer, low PEBP1-expressing tumors had significantly higher activity score in the apoptosis (FDR=3e-06) and EMT (FDR=3e-1.2e-07) pathways, compared to high-expressing BLCA tumors. In contrast, high-expressing PEBP1 BLCAs had higher pathway activity score in the DNA damage (FDR=3.4e-07) and hormone AR (FDR=4e-20) pathways (Figure 2B). BLCA tumors with high YY1 expression on the other hand, exhibited a reverse profile in the pathway activity scores of the Cell Cycle pathway and DNA damage pathway (higher PAS), as well as lower PAS in the EMT and hormone ER pathways, compared to BLCA tumors with lower YY1 expression (Figure 2B).
3.4. Correlation between YY1 and PEBP1 mRNA Expression and Immune Infiltration in Pan-Cancer
We next explored the correlation between YY1/PEBP1 mRNA levels and immune infiltration in pan-cancer. To this purpose, we evaluated the infiltrates of 24 immune cells through ImmuCellAI. Our findgins highlight significant negative correlations (p<0.001 and FDR<0.01) between PEBP1 mRNA expression and the infiltration score, as well as infiltration in B cells, central memory T cells, nTreg cells, cytotoxic T cells, dendritic cells (DC), macrophages and iTregs in KICH. In contrast PEBP1 mRNA expression was positively correlated with γδ T-cells, NKT, neutrophils, Th17 and Th2 in KICH (Figure 3A-B and Table S6). Likewise, YY1 mRNA levels correlated negatively with NK cells, and positively with central memory T cells and nTreg cells in KICH (Figure 3A and Table S6).
Collectively, our findings reveal that mainly PEBP1 expression associates with the infiltration of specific immune cells in KICH, among other tumors.
3.5. Correlation between YY1 (and PEBP1) Mutation Status and Immune Infiltration in Pan-Cancer
First, we explored the YY1 and PEBP1 gene mutation rate in pan-cancer. As expected, no significant differences were found due to the small mutation rate of both genes, in pan-cancer. Nevertheless, we found that 15% of uterine corpus endometrial carcinomas (UCEC) and 8% of skin melanomas (SKCM) harboured YY1 mutations. The mutation rate for PEBP1 was 6% in both tumor types (Figure S3A). Overall, neither gene is mutated at high levels. Just 15 out of 531 (2.82%) of UCEC tumors were found to harbour YY1 mutations and 6/531 (1.13%) of them, mutations in PEBP1 (Figure S3B). These mutations affect both the activation, repression and zinc fingers domains of the YY1 gene locus. In a similar manner, the few PEBP1 mutations are scatter along the gene locus (Figure S3C).
We then explored differences of immune cell infiltration between mut and wt PEBP1 or YY1 tumors. We found a significant enrichment of Th2 cells in PEBP1 mutant skin melanomas (logFC=0.304, p=0.035), as well as an enrichment of B cells in YY1 wt skin melanomas (logFC=-0.56, p=0.018) (Figure 3C and Table S7). Th2 cells produce IL-4 and IL-10 and contribute to favor tumor growth by inhibiting the host immune system [32]. B cells on the other, confer several anti-tumor roles through production of effective tumor-clearing antibodies, predominantly IgG1: mediating antibody dependent cell-mediated cytotoxicity (ADCC), antibody dependent cell-mediated phagocytosis (ADCP) and facilitating complement activation [33].
In addition, we noted significant enrichment of iTreg (logFC=0.41, p=0.016) and Th1 cells (logFC=0.66, p=0.013) in YY1 mutant UCECs, as well as an enrichment of mucosal-associated invariant T (MAIT) cells in wt YY1 UCECs (logFC=0.-408, p=0.003) (Figure 3C and Table S7).
iTreg cells are involved in an immunosuppressive tumor microenvironment (TME) and their targeting is a promising antitumor immunotherapy [34].
The function of Th1 cells is to activate macrophages and neutrophils; and they are critical for host defence against intracellular pathogens such as M. tuberculosis [35].
MAIT cells are a newly described subset of T cells found in the blood and are enriched in many tissues, particularly in the liver. Human MAIT cells mainly express the CD8α coreceptor (CD8+), with a smaller subset lacking both CD4 and CD8 (double-negative, DN) [36].
Together, our results suggest that PEBP1 and YY1 mutations associate with the infiltration of specific immune cells in skin melanoma and uterine corpus endometrial carcinomas, respectively.
3.6. Correlation between YY1 (or PEBP1) CNV and Immune Infiltration in Pan-Cancer
We first assessed the percentage of YY1 and PEBP1 (heterozygous and homozygous) CNVs in pan-cancer. Our results reveal a large distribution of (mainly) heterozygous CNVs affecting both genes, across almost all tumor types. Of note, the highest percentage of CNVs was detected in UCS, OV, ACC, GCT, CHOL and LUSC. CNVs affecting YY1 were almost double in number compared to those affecting PEBP1 (1.4% vs 0.8%), whereas a significant number of tumors (mainly TGCT, ACC, KICH, HNSC, LUSC, BLCA, LUAD, SARC, ESCA and UCS) was characterized by a high percentage of YY1 and PEBP1 amplifications and deep deletions. (Figure S4).
To further explore the mechanisms underlying the abnormal mRNA expression of YY1 and PEBP1, we explored the relationship between each gene’s CNVs and their mRNA expression levels in pan-caner. Overall, we found various correlations between CNVs affecting both genes and immune infiltrates in BRCA, LUAD, KIRC, HNSC and THCA, among others (Table S8). For example, in BRCA, we spotted significant correlations between PEBP1 CNVs and CD8-naive immune infiltrates (corr=0.19, p=1.86e-10, FDR=1.25e-9), as well as macrophages (corr=0.08, p=7.89e-3, FDR=0.03) and neutrophils (p=0.08, FDR=0.03). PEBP1 CNVs were negatively correlated with the infiltration score (corr=-0.09, p=3.67e-3, FDR=0.01), NKT (corr=-0.13, p=1.82e-5, FDR=1.27e-4), B cell (corr.=-0.10, p=1.14e-3, FDR=2.51e-3), CD4 T cells (corr=-0.11, p=4.69e-4, FDR=1.33e-3), cytotoxic (corr=-0.09, p=2.57e-3, FDR=7.34e-3), exhausted T cells (corr=-0.08, p=7.01e-3, FDR=0.02), NK (corr=-0.11, p=4.16e-4, FDR=1.36e-3) and Tfh infiltrates (corr=-0.12, p=1.23e-4, FDR=5.14e-4) in BRCA (Figure 3D and Table S8).
Naive CD8 T cells are found predominately in the circulation, spleen and lymph nodes where they survey the entire body for DCs presenting cognate antigens that will result in their activation. Their presence has been well described in breast cancer [37,38].
Macrophage infiltration associates with high vascular grade, reduced relapse-free survival, decreased overall survival, and serves as an independent prognostic indicator of breast cancer [39,40]. In addition, high neutrophil infiltration has been associated with disease aggressiveness and therapy resistance [41].
The immune infiltration score is a method to quantify the immune cell infiltration within cancers to predict prognosis and chemotherapy effects in breast cancer [42]. Similarly, an infiltration for NKT cells, has been reported in breast cancer [38,42,43], but this is the first to our knowledge, mentioning their association with CNVs in genomic regions affecting YY1 and PEBP1.
Overall, these findings suggest that YY1/PEBP1 CNVs might play a specific role in immune infiltration in breast cancer.
3.7. Correlation between YY1 (or PEBP1) Methylation and Immune Infiltration in Pan-Cancer
Following, we explored the methylation levels (beta values) of YY1 and PEBP1 across different TCGA tumors and found that PEBP1 is highly methylated in LGG, LAML, LUAD, LUSC and HNSC, among other tumors, while YY1 is not significantly methylated in any tumor (Figure 4-B).
Our next point of attention was to decipher associations between YY1/PEBP1 methylation (beta values) and immune cell infiltrates, across different tumor types. Our results show that methylation in both genes correlates with different immune cell infiltrates in COAD, DLBCL, LGG, LIHC, LUSC, PRAD, STAD, TGCT, THYM and UVM (Table S9). In addition, we found that PEBP1 methylation levels anticorrelate significantly with its mRNA expression in LUSC, SKCM, LGG, HNSCC and LIHC (Figure 4C-D).
In THYM in specific, we found that PEBP1 methylation significantly correlates with infiltration of CD4 T cells, CD4 naive T cells, CD8 T cells, CD8 naive T cells, central memory, DC, effector memory, MAIT, macrophages, monocytes, neutrophils, Tfh, Th1, Th2 and nTreg cells in the tumor (Table S9).
Additionally, YY1 methylation was found to correlate significantly with the infiltration score, as well as with infiltration of CD8 T cells, cytotoxic, effector memory, exhausted, gamma-delta (γδ), MAIT, NKT, neutrophils, Th1, Th17, Th2 and iTreg cells in UVM (Table S9).
Taken together, our findings show that PEBP1 methylation might play a significant role in specific tumors, such as LUSC and HNSCC. They also suggest that mainly PEBP1 methylation (and YY1) might play a specific role in immune infiltration across different tumors, but especially in THYM and UVM.
3.8. Correlations between YY1/PEBP1 Expression and Immune Modulators, the TMB, Stemness and MSI in Pan-Cancer
Stemness, the TMB and MSI in the TME are known to be related to antitumor immunity. We thus, explored the associations between YY1 (or PEBP1) expression and immune signatures, tumor immune cell infiltration, TMB, stemness and microsatellite instability (MSI) in the TCGA database, using the R package "UCSCXenaShiny".
Figure 5A-B shows the correlations between YY1 (or PEBP1) expression and the infiltration levels of different immune cell subtypes. In specific, YY1 expression was positively correlated with CD4 naive T cells in ACC; CD4 memory resting T cells across most of the tumors; M1 macrophages in BRCA, KIRC, KIRP, LIHC, LUAD, PRAD and READ; M2 macrophages in BRCA, COAD, KIRC, LUAD, LUSC, and THCA; activated DCs in BLCA, CESC and UCEC; but negatively correlated with Tregs across most of the different tumors; follicular T helper cells in BRCA, HNSCC, KIRC, PCPG, PRAD and TGCT; CD8 T cells in BRCA, CESC, GBM, HNSCC, SKCM,STAD, THCA and UCEC; as well as with memory B cells in BRCA, HNSC, KIRC, KIRP, LGG, LUAD, STAD and TGCT (Figure 5A).
Likewise, PEBP1 expression correlated positively with CD4 naive T cells in BLCA, LIHC and THCA; NK resting cells in LIHC and THCA; monocytes in ACC, KIRC, LGG, LIHC and THCA; resting mast cells in BRCA, HNSCC, KICH, KIRC, LGG, LIHC, LUAD, PRAD, SARC and THCA; but negatively with Tregs in ACC, KIRC, KIRP, LIHC, TGCT and THCA; as well as with activated CD4 memory T cells in BLCA, BRCA, KIRC, LUAD, LUSC and THCA (Figure 5B).
We also investigated the correlations between YY1 (or PEBP1) expression and the abundance of infiltrating immune cells. Overall, YY1 expression correlated significantly with most of TIMER’s immune signatures across most of the different tumor types, including T cell C8+, neutrophil, DC, macrophage and B cell (Figure 6A). In contrast, PEBP1 expression was generally anti-correlated with the abundance of infiltrating immune cells (Figure 6B).
Apart from the TME, stemness, the TMB and MSI are also related to antitumor immunity. We thus, analyzed the relationships between YY1 (or PEBP1) expression and the stemness, MSI and TMB across different tumors.
ΥΥ1 was positively correlated with stemness in ACC (r = 0.242, p=0.035), BLCA (r = 0.28, p<0.05), BRCA (r = 0.176, p<0.05), ESCA (r = 0.298, p<0.05), LAML (r = 0.256, p=0.001), LUAD (r = 0.401, p<0.05), LUSC (r = 0.456, p<0.05), PCPG (r = 0.249, p=0.001), PRAD (r = 0.166, p<0.05), STAD (r = 0.357, p<0.05) and TGCT (r = 0.325, p<0.05); and negatively correlated with stemness in KICH (r = -0.385, p<0.05) and KIRP (r = -0.112, p=0.046) (Figure 7A).
Likewise, PEBP1 expression was positively correlated with stemness in ACC (r = 0.368, p=0.001), BLCA (r = 0.115, p=0.018), COAD (r = 0.167, p=0.003), ESCA (r = 0.343, p<0.05), LAML (r = 0.354, p<0.001), OV (r = 0.162, p=0.005), PCPG (r = 0.234, p=0.001), PRAD (r = 0.177, p<0.001), SKCM (r = 0.127, p=0.006), STAD (r = 0.131, p=0.006), TGCT (r = 0.243, p=0.002), THCA (r = 0.124, p=0.003). PEBP1 was also negatively correlated with stemness in KICH (r = -0.539, p<0.05), LUAD (r = -0.138, p=0.001), PAAD (r = -0.477, p<0.05), SARC (r = -0.171, p=0.006), THYM (r = -0.636, p<0.05) and UVM (r = -0.267, p=0.017) (Figure 7B).
In addition, YY1 expression was positively correlated with MSI in BLCA (r = 0.092, p=0.01), BRCA (r = 0.092, p=0.004), CESC (r = 0.112, p=0.049), GBM (r = 0.164, p=0.038), LGG (r = 0.09, p=0.04), LUAD (r = 0.17, p<0.01), LUSC (r = 0.166, p=0.001), PCPG (r = 0.157, p=0.036), PRAD (r = 0.115, p=0.007), READ (r = 0.28, p=0.011) and SKCM (r = 0.282, p=0.003) (Figure 7C).
The expression of PEBP1 on the other, was positively correlated with MSI in CESC (r = 0.196, p=0.001), HNSC (r = 0.101, p=0.019), LUSC (r = 0.129, p=0.007) and PAAD (r = 0.206, p=0.007) (Figure 7D).
Regarding TMB, YY1 expression was positively correlated with it in BRCA (r = 0.061, p=0.047), COAD (r = 0.176, p=0.004), DLBC (r = 0.31, p=0.034), LUAD (r = 0.245, p<0.05) and SKCM (r = 0.111, p=0.016) (Figure 7E).
PEBP1 expression was further positively correlated with TMB in SKCM (r = 0.119, p=0.01) and STAD (r = 0.132, p=0.007); and negatively correlated with it in LUAD (r = -0.141, p=0.001), OV (r = -0.122, p=0.04) and THCA (r = -0.13, p=0.004 (Figure 7F).
Altogether, the above findings indicate that YY1 and PEBP1 expression associates with the TME and anti-tumor immunity.
3.9. Correlation between YY1 (or PEBP1) Expression and Drug Sensitivity in Pan-Cancer
Finally, we collected the IC50 of various drugs across different cancer cell lines from the GDSC and CTRP databases, and associated them with the corresponding YY1 and PEBP1 mRNA levels.
Collectively, we found several correlations. Interestingly, YY1 mRNA expression correlated positively with sensitivity in Dabrafenib, and negatively with sensitivity in QL-XII-61 and YM201636 (to a lower level) in CTRP. In addition, PEBP1 mRNA expression was shown to correlate positively with sensitivity in Afatinib, CCT018159 and Gefitinib, and negatively with many other drugs, including Dabrafenib, Nutlin-3a (-), EH 1864, MP470, SB52334, QL-XII-61 and YM201636 (Figure 8A).
Likewise, YY1 mRNA expression was found to correlate negatively with BI-2536, COL-3, CR-1-31B, GSK461364, LRRK2-IN-1 and NSC19630, among other drugs in CTRP. PEBP1 mRNA expression on the other, correlated positively with sensitivity in dasatinib and negatively with sensitivity in nutlin-3, PL-DI, PRIMA-1, PX-12, belinostat, ciclopirox, and necrosulfonamide, among many other drugs (Figure 8B).
Subsequently, we used the ROC plotter tool to analyze the relationship between YY1 (and PEBP1) expression and sensitivity in endocrine therapy, anti-HER2 therapy or chemosensitivity in breast cancer. The results indicated that the expression levels of both genes were significantly correlated with the response to chemotherapy in breast cancer (Mann-Whitney test, p<0.05) (Figure 8C). In specific, YY1 was downregulated in the chemotherapy-sensitive group, while PEBP1 was upregulated in the responders to chemotherapy. In contrast, neither YY1 or PEBP1 expression correlated with sensitivity to the other two kinds of treatment (endocrine and anti-HER2 therapy).
Furthermore, we used the CellMinerCDB database to explore the association between YY1 (or PEBP1) expression and sensitivity in the afore-mentioned drugs from GDC and CTRP. We found that YY1 expression was significantly (p≤0.05) negatively correlated with drug sensitivity of dabrafenib (r=-0.27, p=0.05); whereas, PEBP1 expression was positively correlated with sensitivity of the same drug (r=0.43, p=0.0014), as well as of nutlin-3a (r=0.26, p=0.05). PEBP1 was also negatively correlated with drug sensitivity of dasatinib (r=-0.32, p=0.015) (Figure 8D). The above results suggest that YY1 and PEBP1 expression may serve as potential indicators for evaluating the sensitivity of certain chemotherapeutic drugs.
Finally, we explored the association between YY1/PEBP1 expression and patient response to immune checkpoint blockade (ICB), using TIDE. YY1 and PEBP1 were found to associate with several indicators of immunosuppression, including the ICB response outcome, T-cell dysfunction/exclusion levels, and phenotypes in CRISPR screens, across different patient cohorts, using regulator prioritization analysis (Figure 8E). High YY1 expression associated with a worse outcome of therapy with anti-CTLA-4 in skin melanoma (Van Allen, 2015 dataset) [44], but was related to better anti-PD-L1 therapy outcomes in metastatic urinary bladder cancer (Mariathasan, 2018 dataset) [45]. In addition, high PEBP1 expression associated with a worse outcome of anti-PD-1 therapy in skin melanoma (Riaz, 2017 dataset) [46], but was related to better anti-D-L1 therapy outcomes in glioblastoma (Zhao, 2019 dataset) [47] (Figure 8F).
4. Discussion
Dysregulation of YY1 and PEBP1 expression patterns has been reported across different types of cancer. Nevertheless, most studies have focused on each gene per tumor. Here, we have systematically explored the patterns of gene expression, mutations, TME, immune infiltration, and drug sensitivity of the two genes, and we have evaluated their crosstalk in pan-cancer, for the first time.
YY1 is reported to be widely expressed in various tissues, acting either as an oncogene or as a tumor suppressor [48], and thus, playing a dual role in cancer development and progression in a cancer type-specific manner [49,50]. Accordingly, studies on dissecting the roles and clinical potential of YY1 in the TME, revealed that although it is mostly overexpressed in the majority of cancers [51,52], different conclusions regarding the survival, prognosis and other clinical implications of its expression analysis can be drawn across different tumors, as the functions of YY1 seem to be diversified in a pan-cancer context [52,53]. Similar conclusions have also emerged, with respect to the diversity and frequency of the main YY1 phosphorylation patterns (S118 and S247) among different tumor types, as well as their associations with clinicopathological features [52]. On the other hand, downregulation or loss of RKIP expression has regularly been observed in many cancers, a fact that is mainly attributed to altered epigenetic landscape (e.g., promoter methylation and epigenetic transcription silencing) rather than RKIP allele deletion or mutational events [54,55]. Although a pan-cancer computational analysis of RKIP expression and relevant associations with clinicopathological features including disease progression, metastasis and therapeutic response is still missing from the literature, a general picture from individualized cancer types reveals that RKIP expression can be used as an independent prognostic marker for overall survival and disease-free survival [2,56]. Notably, the prognostic value of phosphorylated at Ser 153 RKIP protein levels (pSer153 RKIP), known to weaken its tumor suppressing activity, is still limited, as it has been studied only in a few cancer types [57,58,59,60,61].
Accordingly, the results of our analysis show that YY1 is considerably upregulated in HNSC, breast, bladder and lung cancers (LUSC and LUAD), while PEBP1 is significantly downregulated in all kidney and lung cancer subtypes, as well as in LIHC, HNSC and STAD. YY1 over-expression has also been previously reported ex vivo in different cancer types, including those of the breast [62], bladder [63], prostate [64], gastrointestinal [65], ovaries [66], esophagus [67], nervous system [68], pancreas [69] and skin [70]. YY1 mRNA levels were also recently explored in a systematic pan-cancer computational single analysis from Fu et al. [52]. In our study, we found similar findings, but we further address the interplay between the two genes (YY1 and PEBP1/RKIP). In addition, our findings on the distribution of RKIP mRNA levels across different cancer types, corroborate its reported significant reduction in most malignancies, a fact known to support tumor growth and metastasis [71]. Accordingly, a computational analysis by Touboul et al. [60] revealed that PEBP1 is significantly under-expressed in most tumor types, including THCA, KIRP, KICH GBM, LUAD, CESC, and LUSC. In this study, we also report significant differences between high and low YY1 expression in different subtypes of BRCA, KIRC, LUAD, LUSC and STAD; as well as between high and low PEBP1 expression in different subtypes of KIRC and lung cancers.
Our results further validate the association of high YY1 mRNA levels with different survival outcomes in different tumors. For example, we show that there is a significant association between increased YY1 expression and poor prognosis in HNSCC. Accordingly, Schnoell et al. [72] recently reported that high YY1 mRNA expression is indicative of worse overall survival in HNSCC patients and might be a suitable prognostic marker for their risk stratification, as well as a putative therapeutic target [73]. In addition, we show that there is a correlation between high PEBP1 expression and better prognosis in KICH. Although KICH is known to have the best prognosis among all kidney cancer types [74,75], reported findings from univariate and multivariate analyses of various cases of RCC, revealed that reduced RKIP expression is an independent negative predictor for overall patient survival [76]. In this context, the urinary RKIP/pRKIP expression ratio has been further suggested to serve as a potential diagnostic and prognostic marker of the more aggressive clear cell renal cell carcinoma (ccRCC) [77]. Importantly, the reverse expression pattern of YY1 and RKIP that we observed in LUAD and LUSC, might suggest an explicit YY1/RKIP crosstalk in lung cancers, with possible clinical significance. In support of this notion, Vivarelli et al. recently reported that YY1 and RKIP expression are inversely correlated in lung cancer, as the computational analysis of the deposited YY1-ChIP-Seq experiments revealed a negative regulation of RKIP by YY1, suggesting that both genes can be used for predictive diagnostic and prognostic purposes in this malignancy [9]. In this study, computational analysis revealed that YY1 negatively regulates PEBP1/RKIP expression in lung cancer, as corroborated by the deposited YY1-ChIP-Seq experiments and validated by their robust negative correlation.
In accordance, our preliminary findings from our studies investigating the direct role of YY1 in the transcriptional repression of RKIP in several solid malignancies (including LUSC) reveal a significant increase in RKIP promoter activity after YY1 silencing, thus supporting the inverse correlation of their expression levels, at least in lung malignancies (unpublished data).
We also explored the pathway activity scores of the two genes in pan-cancer. We found a strong inducing effect of YY1 expression in the cell cycle (31%), apoptosis (16%) and DNA damage (16%) pathways across different cancers, as well as a potent inhibitory effect in the RASMAPK (19%), EMT (12%), hormone ER (12%), and RTK (12%) pathways. PEBP1 on the other hand, could strongly induce the hormone androgen receptor (AR) (19%) pathway and inhibit the apoptosis (22%) and EMT (25%) pathways. These findings are in strong support of previous reports implicating YY1 in the regulation of a large number of genes being critical for cellular development, growth, differentiation, cell cycle, apoptosis and DNA damage [64,78,79,80,81]. However, the role of YY1 in promoting or suppressing tumor growth and spread remains controversial and apparently conflicting, as different and still unclear molecular mechanisms of YY1 action may exist in a cancer-type specific context [82]. As such and in support of its oncogenic function, YY1 has been shown to have proliferative and tumor promoting effects in several tumors, including gastric, breast, prostate, cervical, colon, neuroblastoma and hepatocellular carcinomas [83,84], whereas in others, such as in pancreatic ductal adenocarcinoma, it can suppress the proliferation and migration of cancer cells [85]. Contrarily, we and others have identified a clear role of RKIP in the regulation of EMT and apoptosis in the tumor microenvironment, resulting in potent anti-metastatic and tumor suppressing effects in several tumor models [31,71,86]. Interestingly, among the underlying molecular signaling cascades currently suggested to mediate the RKIP activities in cancer cells, we have identified and proposed the dyregulation of the NF-κΒ/Snail/YY1/RKIP/PTEN circuitry, not only as an example of the RKIP/YY1 crosstalk in cancer cells, but also as a moderator and connector of several critical processes that take place in tumors, like autophagy, EMT and resistance to apoptosis [87,88,89,90]. In addition, PEBP1 was recently identified as a newly-found target gene of androgens and AR [91,92]; however the possible vice-versa regulation of AR pathway by RKIP, proposed in our analysis, is a novel finding that needs further investigation in terms of clarifying whether it concerns the pSer153 RKIP form, as is in the case of pSer153 RKIP-mediated stimulation of the β-adrenergic receptor signaling [93]. Given that YY1 promotes the transcriptional activation of AR in prostate cells, which further cooperates with YY1 to activate expression of prostate specific antigen (PSA) and prostate stem cell antigen (PSCA), both known to contribute to prostate oncogenesis [94], a possible YY1/RKIP crosstalk in prostate cancer is also worth to be explored [95].
Our study further detected several correlations between YY1 and PEBP1 mRNA expression and immune infiltration across different cancers. As expected, most of the associations for both genes followed a cancer type-specific pattern. Notably, across the majority of different tumors positive correlations were established between YY1 and various immuno-suppressing (iTreg and nTreg) and naïve/resting immune populations, including M2 macrophages and CD4+ naïve and memory resting T cells. In particular, in breast cancer models, it was reported that the intra-tumoral naïve CD4+ T cells and Tregs share overlapping TCR repertoires, suggesting that the existing Tregs in the tumor microenvironment may have originated by reprograming of tumor infiltrating naïve CD4+ T cells to Tregs and therefore, blocking of the recruitment of naïve CD4+ T cells might reverse immunosuppression in this cancer type [96]. In contrast, in a considerable number of tumors, YY1 expression was negatively associated with intra-tumoral abundance of CD8 T cells, follicular T helper cells (Tfh), as well as with memory B cells, which are all known to promote the formation of an immunoreactive tumor microenvironment. Specifically, both Tfh and memory B cells advance the anti-tumor cellular and humoral immunities by promoting a chemokine-mediated CD8+ T cell and B-cell infiltration [97] and contributing, as APCs, to additional CD4+ T cell expansion, intratumorally [98]. Memory B cells have also been reported to possess cytototoxic functions against cancer cells by secreting IFN-γ, granzyme B and TRAIL [99]. Corroborating our findings on the critical immunomodulatory role of YY1 in cancer progression, data derived by a recent pan-cancer analysis also demonstrate negative correlation between YY1 expression and infiltration of most immunoreactive cells, including CD8+ T cells, B cells, macrophages, dendritic cells and neutrophils, in >10 different cancer tissues; while YY1 expression has been positively associated with the estimated infiltration value of cancer-associated fibroblasts [52]. Although the expression of YY1 in immune cells has been extensively studied, particularly under the prism of B and T cell development and exhaustion in cancer cells through the regulation of PD1 and LAG3 [100,101], it remains to be elucidated how YY1 expression interferes with the diverse immune cell infiltrates in the microenvironment of different tumors.
With respect to PEBP1, our analysis revealed that its expression is significantly negatively correlated with the infiltration of Tregs and memory CD4+ T cells in 6 cancer types, including lung tumors, while positively associated with the infiltration level of resting mast cells and NK cells in 10 and 2 different malignancies, respectively, also including different lung cancer subtypes. Li et al. found that aberrant activation of mast cells and CD4+ memory T cells was critical for cigarette smoking-induced immune dysfunction in the lung, which further associated with tumor development and progression [102]. Accordingly, Zhang et al., suggested a prognostic model in HCC based on the negative correlation of the risk score with the content of the tumor-infiltrated resting mast cells [103]. The critical implication of RKIP in the modulation of the immune-composition of the tumor microenvironment by regulating the infiltration and activities of various immune cell populations has been reviewed by Gabriela-Freitas et al. [104]. Briefly, RKIP induction in triple negative breast tumor models was able to inhibit TAMs infiltration and their pro-metastatic activity in vivo and in vitro, through RKIP-mediated HMGA2 blockade, which eventually led to reduction of numerous macrophage chemotactic factors, including CCL5 [105,106]. RKIP levels were further shown to be inversely correlated with the myeloid/lymphoid ratio, as well as with gene signatures associated with myeloid cell infiltration in melanoma tissues [107], while positively associated with signatures of effective T-cell responses in melanoma [107] and gastric cardiac adenocarcinomas [108]. Moreover, RKIP inhibition in CLL leads to elimination of CXCR4 expression by cancer cells [109], whereas RKIP was shown to play an important role in controlling mast cell-mediated allergic responses, specifically by negatively regulating mast cell activation [110]. The latter agrees with our observed positive association of RKIP with the infiltration of resting mast cells.
Overall, in the context of YY1/RKIP crosstalk in the regulation of tumor infiltration by immune cells, our results show that YY1 and PEBP1 expression scores were anti-correlated with infiltration levels of nTreg cells, B cells, neutrophils and CD8 naïve T cells, as well as with the infiltration score and CD4+ T cells, Tfh, NK, MAIT, NKT and Th2 cells. The immunomodulation within the tumor microenvironment undoubtfully plays crucial roles in tumor progression and metastasis, and the prognostic value of the suggested gene signatures seem to shed light on new and better disease management and therapeutic targeting. Nevertheless, further validation of the above anti-correlations remains to be elucidated.
Gene expression and cancer progression are regulated by genetic alterations in key genes. Here, we found various correlations between YY1/PEBP1 expression (or methylation) and genomic alterations, such as SNVs and CNVs that exhibited a cancer type-specific pattern. The genetic alteration status of YY1 has been previously reported in a pan-cancer context, and has demonstrated effects of YY1 mutation on gene expression in multiple myeloma and uterine cancer, as well as on YY1 expression in cervix cancer, head and neck cancer, lung squamous cell carcinoma and melanoma [52]. In addition, the same study showed that only cholangiocarcinoma, DLBC, and KIRP cases with genetic alteration had copy number deletion of YY1, while the “amplification” type of CNVs was only seen in adrenocortical carcinoma and pheochromocytoma/paraganglioma tumors [52].
Furthermore, our analysis reveals a differential methylation pattern of both genes in pan-cancer. Importantly, we show that PEBP1 methylation is negatively correlated with its mRNA expression, in pan-cancer, with LUSC, SKCM, LGG, HNSC and LIHC being the leading tumor entities in this anti-correlation. Similar studies are missing for RKIP in a pan-cancer context; therefore, our RKIP-associated findings are the first of this kind. Another interesting finding in our study is that the expression of the two genes is associated with the TMB, stemness, MSI, and tumor immunity in different cancers. This is in accordance with individual findings on the associations of each gene with the aforementioned parameters [9,52,111,112,113]. Notably, RKIP expression associations with MSI have been studied only in colorectal cancer where they were identified as independent parameters [2].
Lastly, we found that both YY1 and PEBP1 gene expressions were also correlated with chemosensitivity and immunotherapy responses, in different types of tumors. Drug resistance is an important reason for the low five-year survival rate of cancer patients, while improving drug sensitivity is a significant topic in the field of cancer. Our findings corroborate previous reports by us and others, demonstrating the critical but opposite functions of YY1 and RKIP in the regulation of tumor sensitivities to drug and endogenous immune-mediated cytotoxic effects and/or to immunotherapy [90,95,8,114].
We finally would like to report a limitation in our study, which is the lack of in vitro and/or in vivo validation experiments of our findings, which could further decipher the molecular function of the two genes in the setting of different tumor types.
5. Conclusions
In conclusion, our study unveils the pivotal role of the cross-talk between YY1 and PEBP1 in tumor progression, encompassing genetic alterations, tumor immunity, and the tumor microenvironment, while also highlighting their potential influence on anticancer drug sensitivity, offering fresh insights and therapeutic targets for cancer treatment.
Supplementary Materials
The following supporting information can be downloaded at: www.mdpi.com/xxx/s1, Figure S1: GEPIA2 stage plot analysis of YY1 and PEBP1 in pan-cancer. The log2(TPM + 1) value were used for gene expression.; Figure S2: (A) GEPIA2 survival analysis including OS and DFS demonstrated the survival maps of YY1 and PEBP1 in pan-cancer. (B) Examples of Kaplan-Meier curves depicting OS and DFS differences between high and low- YY1 and PEBP1 groups of PRAD, UVM and KIRC patients. (C) COX regression analysis showed the correlation between YY1 (and PEBP1) expression and OS in pan-cancer. p<0.05 was considered statistically significant. A cancer type is defined as risky if log(Hazard Ratio)>0, protective if log(Hazard Ratio)<0 or NS, if p>0.05.; Figure S3: The SNV frequency of YY1 and PEBP1 in pan-cancer (A-B). The lollipop plots depict the YY1 and PEPB1 loci affected by each SNV (C).; Figure S4: (A) The mutation frequency of YY1 and PEBP1 in pan-cancer was explored using cBioPortal. (B) The pie-charts depict the different frequencies of YY1 and PEBP1 CNVs detected in pan-cancer. The different colors in each pie-chart represent different types of variation. (C) Heterozygous (and homozygous) amplifications and deletions in each cancer type. (D) CNV distribution of YY1 and PEBP1 in UCS tumor samples. Table S1: The Table depicts the gene set signature of each immune cell used in ImmuCellAI analysis.; Table S2: The Table depicts the correlation between YY1 and PEBP1 mRNA expression with the different pathologic and clinical stages in pan-cancer.; Table S3: The Table depicts the correlation between YY1 and PEBP1 mRNA expression with the different molecular subtypes in pan-cancer.; Table S4: The Table depicts the correlation between YY1 and PEBP1 mRNA expression with patient survival in pan-cancer; Table S5: The Table depicts the results of the univariate Cox proportional hazard regression model used to predict the prognostic risk of YY1 and PEBP1 in pan-cancer in pan-cancer, using different GEO datasets.; Table S6: The Table depicts the correlation between YY1 and PEBP1 expression with pathways activity scores in pan-cancer in pan-cancer. Table S7: The Table depicts the correlation between YY1 and PEBP1 mRNA expression and immune infiltration in pan-cancer.; Table S8: The Table depicts the correlation between YY1 (and PEBP1) mutation status and immune infiltration in pan-cancer.; Table S9: The Table depicts the correlation between YY1 (or PEBP1) CNV and immune infiltration in pan-cancer.; Table S10: The Table depicts the correlation between YY1 (or PEBP1) methylation and immune infiltration in pan-cancer.
Author Contributions
Conceptualization, A.Z..; methodology, S.B. and A.Z.; software, A.Z.; validation, S.B. and A.Z.; formal analysis, A.Z.; investigation, A.Z.; resources, S.B. and A.Z.; data curation, A.Z.; writing—original draft preparation, A.Z.; writing—review and editing, S.B. and A.Z.; visualization, A.Z.; supervision, A.Z.; project administration. Both authors have read and agreed to the published version of the manuscript.
Funding
Not applicable.
Institutional Review Board Statement
Not applicable.
Informed Consent Statement
Not applicable
Data Availability Statement
All data supporting the reported results in this study were retrieved from the TCGA and GEO datasets.
Acknowledgments
We would like to thank all patients, the genetic material of which was sequenced and further analyzed in order to produce the data used in the present study.
Conflicts of Interest
The authors declare no conflict of interest.
References
- Yeung, K.; Seitz, T.; Li, S.; Janosch, P.; McFerran, B.; Kaiser, C.; Fee, F.; Katsanakis, K.D.; Rose, D.W.; Mischak, H.; et al. Suppression of Raf-1 Kinase Activity and MAP Kinase Signalling by RKIP. Nature 1999, 401, 173–177. [Google Scholar] [CrossRef]
- Al-Mulla, F.; Hagan, S.; Behbehani, A.I.; Bitar, M.S.; George, S.S.; Going, J.J.; García, J.J.C.; Scott, L.; Fyfe, N.; Murray, G.I.; et al. Raf Kinase Inhibitor Protein Expression in a Survival Analysis of Colorectal Cancer Patients. J Clin Oncol 2006, 24, 5672–5679. [Google Scholar] [CrossRef]
- Bonavida, B. RKIP: A Pivotal Gene Product in the Pathogenesis of Cancer. Cancers (Basel) 2022, 14, 6092. [Google Scholar] [CrossRef]
- Shi, Y.; Lee, J.S.; Galvin, K.M. Everything You Have Ever Wanted to Know about Yin Yang 1. Biochim Biophys Acta 1997, 1332, F49–66. [Google Scholar] [CrossRef]
- Meliala, I.T.S.; Hosea, R.; Kasim, V.; Wu, S. The Biological Implications of Yin Yang 1 in the Hallmarks of Cancer. Theranostics 2020, 10, 4183–4200. [Google Scholar] [CrossRef]
- Hosea, R.; Hillary, S.; Wu, S.; Kasim, V. Targeting Transcription Factor YY1 for Cancer Treatment: Current Strategies and Future Directions. Cancers (Basel) 2023, 15, 3506. [Google Scholar] [CrossRef]
- Kurisaki, K.; Kurisaki, A.; Valcourt, U.; Terentiev, A.A.; Pardali, K.; Ten Dijke, P.; Heldin, C.-H.; Ericsson, J.; Moustakas, A. Nuclear Factor YY1 Inhibits Transforming Growth Factor Beta- and Bone Morphogenetic Protein-Induced Cell Differentiation. Mol Cell Biol 2003, 23, 4494–4510. [Google Scholar] [CrossRef]
- Bonavida, B. RKIP-Mediated Chemo-Immunosensitization of Resistant Cancer Cells via Disruption of the NF-ΚB/Snail/YY1/RKIP Resistance-Driver Loop. Crit Rev Oncog 2014, 19, 431–445. [Google Scholar] [CrossRef]
- Vivarelli, S.; Falzone, L.; Grillo, C.M.; Bonavida, B.; Crimi, C.; La Mantia, I.; Libra, M. Computational Analyses of YY1 and Its Target RKIP Reveal Their Diagnostic and Prognostic Roles in Lung Cancer. Cancers (Basel) 2022, 14, 922. [Google Scholar] [CrossRef]
- Sarvagalla, S.; Kolapalli, S.P.; Vallabhapurapu, S. The Two Sides of YY1 in Cancer: A Friend and a Foe. Front Oncol 2019, 9, 1230. [Google Scholar] [CrossRef]
- Liu, C.-J.; Hu, F.-F.; Xia, M.-X.; Han, L.; Zhang, Q.; Guo, A.-Y. GSCALite: A Web Server for Gene Set Cancer Analysis. Bioinformatics 2018, 34, 3771–3772. [Google Scholar] [CrossRef]
- Tang, Z.; Kang, B.; Li, C.; Chen, T.; Zhang, Z. GEPIA2: An Enhanced Web Server for Large-Scale Expression Profiling and Interactive Analysis. Nucleic Acids Res 2019, 47, W556–W560. [Google Scholar] [CrossRef]
- Mizuno, H.; Kitada, K.; Nakai, K.; Sarai, A. PrognoScan: A New Database for Meta-Analysis of the Prognostic Value of Genes. BMC Med Genomics 2009, 2, 18. [Google Scholar] [CrossRef]
- Akbani, R.; Ng, P.K.S.; Werner, H.M.J.; Shahmoradgoli, M.; Zhang, F.; Ju, Z.; Liu, W.; Yang, J.-Y.; Yoshihara, K.; Li, J.; et al. A Pan-Cancer Proteomic Perspective on The Cancer Genome Atlas. Nat Commun 2014, 5, 3887. [Google Scholar] [CrossRef]
- Miao, Y.-R.; Zhang, Q.; Lei, Q.; Luo, M.; Xie, G.-Y.; Wang, H.; Guo, A.-Y. ImmuCellAI: A Unique Method for Comprehensive T-Cell Subsets Abundance Prediction and Its Application in Cancer Immunotherapy. Adv Sci (Weinh) 2020, 7, 1902880. [Google Scholar] [CrossRef]
- Ye, Y.; Xiang, Y.; Ozguc, F.M.; Kim, Y.; Liu, C.-J.; Park, P.K.; Hu, Q.; Diao, L.; Lou, Y.; Lin, C.; et al. The Genomic Landscape and Pharmacogenomic Interactions of Clock Genes in Cancer Chronotherapy. Cell Syst 2018, 6, 314–328. [Google Scholar] [CrossRef]
- Miao, Y.-R.; Xia, M.; Luo, M.; Luo, T.; Yang, M.; Guo, A.-Y. ImmuCellAI-Mouse: A Tool for Comprehensive Prediction of Mouse Immune Cell Abundance and Immune Microenvironment Depiction. Bioinformatics 2022, 38, 785–791. [Google Scholar] [CrossRef]
- Wang, S.; Xiong, Y.; Zhao, L.; Gu, K.; Li, Y.; Zhao, F.; Li, J.; Wang, M.; Wang, H.; Tao, Z.; et al. UCSCXenaShiny: An R/CRAN Package for Interactive Analysis of UCSC Xena Data. Bioinformatics 2022, 38, 527–529. [Google Scholar] [CrossRef]
- Griffith, O.L.; Spies, N.C.; Anurag, M.; Griffith, M.; Luo, J.; Tu, D.; Yeo, B.; Kunisaki, J.; Miller, C.A.; Krysiak, K.; et al. The Prognostic Effects of Somatic Mutations in ER-Positive Breast Cancer. Nat Commun 2018, 9, 3476. [Google Scholar] [CrossRef]
- Mermel, C.H.; Schumacher, S.E.; Hill, B.; Meyerson, M.L.; Beroukhim, R.; Getz, G. GISTIC2.0 Facilitates Sensitive and Confident Localization of the Targets of Focal Somatic Copy-Number Alteration in Human Cancers. Genome Biol 2011, 12, R41. [Google Scholar] [CrossRef]
- Schlattl, A.; Anders, S.; Waszak, S.M.; Huber, W.; Korbel, J.O. Relating CNVs to Transcriptome Data at Fine Resolution: Assessment of the Effect of Variant Size, Type, and Overlap with Functional Regions. Genome Res 2011, 21, 2004–2013. [Google Scholar] [CrossRef] [PubMed]
- Liu, J.; Lichtenberg, T.; Hoadley, K.A.; Poisson, L.M.; Lazar, A.J.; Cherniack, A.D.; Kovatich, A.J.; Benz, C.C.; Levine, D.A.; Lee, A.V.; et al. An Integrated TCGA Pan-Cancer Clinical Data Resource to Drive High-Quality Survival Outcome Analytics. Cell 2018, 173, 400–416. [Google Scholar] [CrossRef] [PubMed]
- Yang, W.; Soares, J.; Greninger, P.; Edelman, E.J.; Lightfoot, H.; Forbes, S.; Bindal, N.; Beare, D.; Smith, J.A.; Thompson, I.R.; et al. Genomics of Drug Sensitivity in Cancer (GDSC): A Resource for Therapeutic Biomarker Discovery in Cancer Cells. Nucleic Acids Res 2013, 41, D955–961. [Google Scholar] [CrossRef]
- Iorio, F.; Knijnenburg, T.A.; Vis, D.J.; Bignell, G.R.; Menden, M.P.; Schubert, M.; Aben, N.; Gonçalves, E.; Barthorpe, S.; Lightfoot, H.; et al. A Landscape of Pharmacogenomic Interactions in Cancer. Cell 2016, 166, 740–754. [Google Scholar] [CrossRef] [PubMed]
- Rees, M.G.; Seashore-Ludlow, B.; Cheah, J.H.; Adams, D.J.; Price, E.V.; Gill, S.; Javaid, S.; Coletti, M.E.; Jones, V.L.; Bodycombe, N.E.; et al. Correlating Chemical Sensitivity and Basal Gene Expression Reveals Mechanism of Action. Nat Chem Biol 2016, 12, 109–116. [Google Scholar] [CrossRef]
- Seashore-Ludlow, B.; Rees, M.G.; Cheah, J.H.; Cokol, M.; Price, E.V.; Coletti, M.E.; Jones, V.; Bodycombe, N.E.; Soule, C.K.; Gould, J.; et al. Harnessing Connectivity in a Large-Scale Small-Molecule Sensitivity Dataset. Cancer Discov 2015, 5, 1210–1223. [Google Scholar] [CrossRef]
- Basu, A.; Bodycombe, N.E.; Cheah, J.H.; Price, E.V.; Liu, K.; Schaefer, G.I.; Ebright, R.Y.; Stewart, M.L.; Ito, D.; Wang, S.; et al. An Interactive Resource to Identify Cancer Genetic and Lineage Dependencies Targeted by Small Molecules. Cell 2013, 154, 1151–1161. [Google Scholar] [CrossRef]
- Fekete, J.T.; Győrffy, B. ROCplot.Org: Validating Predictive Biomarkers of Chemotherapy/Hormonal Therapy/Anti-HER2 Therapy Using Transcriptomic Data of 3,104 Breast Cancer Patients. Int J Cancer 2019, 145, 3140–3151. [Google Scholar] [CrossRef]
- Fu, J.; Li, K.; Zhang, W.; Wan, C.; Zhang, J.; Jiang, P.; Liu, X.S. Large-Scale Public Data Reuse to Model Immunotherapy Response and Resistance. Genome Med 2020, 12, 21. [Google Scholar] [CrossRef]
- Jiang, P.; Gu, S.; Pan, D.; Fu, J.; Sahu, A.; Hu, X.; Li, Z.; Traugh, N.; Bu, X.; Li, B.; et al. Signatures of T Cell Dysfunction and Exclusion Predict Cancer Immunotherapy Response. Nat Med 2018, 24, 1550–1558. [Google Scholar] [CrossRef]
- Zaravinos, A.; Bonavida, B.; Chatzaki, E.; Baritaki, S. RKIP: A Key Regulator in Tumor Metastasis Initiation and Resistance to Apoptosis: Therapeutic Targeting and Impact. Cancers (Basel) 2018, 10, 287. [Google Scholar] [CrossRef] [PubMed]
- Nicholas, C.; Lesinski, G.B. Immunomodulatory Cytokines as Therapeutic Agents for Melanoma. Immunotherapy 2011, 3, 673–690. [Google Scholar] [CrossRef] [PubMed]
- Willsmore, Z.N.; Harris, R.J.; Crescioli, S.; Hussein, K.; Kakkassery, H.; Thapa, D.; Cheung, A.; Chauhan, J.; Bax, H.J.; Chenoweth, A.; et al. B Cells in Patients With Melanoma: Implications for Treatment With Checkpoint Inhibitor Antibodies. Front Immunol 2020, 11, 622442. [Google Scholar] [CrossRef] [PubMed]
- Chen, B.-J.; Zhao, J.-W.; Zhang, D.-H.; Zheng, A.-H.; Wu, G.-Q. Immunotherapy of Cancer by Targeting Regulatory T Cells. Int Immunopharmacol 2022, 104, 108469. [Google Scholar] [CrossRef] [PubMed]
- Kortekaas Krohn, I.; Aerts, J.L.; Breckpot, K.; Goyvaerts, C.; Knol, E.; Van Wijk, F.; Gutermuth, J. T-Cell Subsets in the Skin and Their Role in Inflammatory Skin Disorders. Allergy 2022, 77, 827–842. [Google Scholar] [CrossRef] [PubMed]
- Dias, J.; Boulouis, C.; Gorin, J.-B.; van den Biggelaar, R.H.G.A.; Lal, K.G.; Gibbs, A.; Loh, L.; Gulam, M.Y.; Sia, W.R.; Bari, S.; et al. The CD4-CD8- MAIT Cell Subpopulation Is a Functionally Distinct Subset Developmentally Related to the Main CD8+ MAIT Cell Pool. Proc Natl Acad Sci U S A 2018, 115, E11513–E11522. [Google Scholar] [CrossRef]
- Egelston, C.A.; Avalos, C.; Tu, T.Y.; Simons, D.L.; Jimenez, G.; Jung, J.Y.; Melstrom, L.; Margolin, K.; Yim, J.H.; Kruper, L.; et al. Human Breast Tumor-Infiltrating CD8+ T Cells Retain Polyfunctionality despite PD-1 Expression. Nat Commun 2018, 9, 4297. [Google Scholar] [CrossRef]
- Dieci, M.V.; Miglietta, F.; Guarneri, V. Immune Infiltrates in Breast Cancer: Recent Updates and Clinical Implications. Cells 2021, 10, 223. [Google Scholar] [CrossRef]
- Leek, R.D.; Lewis, C.E.; Whitehouse, R.; Greenall, M.; Clarke, J.; Harris, A.L. Association of Macrophage Infiltration with Angiogenesis and Prognosis in Invasive Breast Carcinoma. Cancer Res 1996, 56, 4625–4629. [Google Scholar]
- Campbell, M.J.; Tonlaar, N.Y.; Garwood, E.R.; Huo, D.; Moore, D.H.; Khramtsov, A.I.; Au, A.; Baehner, F.; Chen, Y.; Malaka, D.O.; et al. Proliferating Macrophages Associated with High Grade, Hormone Receptor Negative Breast Cancer and Poor Clinical Outcome. Breast Cancer Res Treat 2011, 128, 703–711. [Google Scholar] [CrossRef]
- Wu, L.; Saxena, S.; Goel, P.; Prajapati, D.R.; Wang, C.; Singh, R.K. Breast Cancer Cell-Neutrophil Interactions Enhance Neutrophil Survival and Pro-Tumorigenic Activities. Cancers (Basel) 2020, 12, 2884. [Google Scholar] [CrossRef] [PubMed]
- Allam, M.; Hu, T.; Lee, J.; Aldrich, J.; Badve, S.S.; Gökmen-Polar, Y.; Bhave, M.; Ramalingam, S.S.; Schneider, F.; Coskun, A.F. Spatially Variant Immune Infiltration Scoring in Human Cancer Tissues. NPJ Precis Oncol 2022, 6, 60. [Google Scholar] [CrossRef]
- Rezaeifard, S.; Talei, A.; Shariat, M.; Erfani, N. Tumor Infiltrating NK Cell (TINK) Subsets and Functional Molecules in Patients with Breast Cancer. Mol Immunol 2021, 136, 161–167. [Google Scholar] [CrossRef]
- Van Allen, E.M.; Miao, D.; Schilling, B.; Shukla, S.A.; Blank, C.; Zimmer, L.; Sucker, A.; Hillen, U.; Foppen, M.H.G.; Goldinger, S.M.; et al. Genomic Correlates of Response to CTLA-4 Blockade in Metastatic Melanoma. Science 2015, 350, 207–211. [Google Scholar] [CrossRef] [PubMed]
- Mariathasan, S.; Turley, S.J.; Nickles, D.; Castiglioni, A.; Yuen, K.; Wang, Y.; Kadel, E.E.; Koeppen, H.; Astarita, J.L.; Cubas, R.; et al. TGFβ Attenuates Tumour Response to PD-L1 Blockade by Contributing to Exclusion of T Cells. Nature 2018, 554, 544–548. [Google Scholar] [CrossRef] [PubMed]
- Riaz, N.; Havel, J.J.; Makarov, V.; Desrichard, A.; Urba, W.J.; Sims, J.S.; Hodi, F.S.; Martín-Algarra, S.; Mandal, R.; Sharfman, W.H.; et al. Tumor and Microenvironment Evolution during Immunotherapy with Nivolumab. Cell 2017, 171, 934–949. [Google Scholar] [CrossRef]
- Zhao, J.; Wang, L.; Hu, G.; Wei, B. A 6-Gene Risk Signature Predicts Survival of Glioblastoma Multiforme. Biomed Res Int 2019, 2019, 1649423. [Google Scholar] [CrossRef] [PubMed]
- Bonavida, B. Therapeutic YY1 Inhibitors in Cancer: ALL in ONE. Crit Rev Oncog 2017, 22, 37–47. [Google Scholar] [CrossRef]
- Zaravinos, A.; Spandidos, D.A. Yin Yang 1 Expression in Human Tumors. Cell Cycle 2010, 9, 512–522. [Google Scholar] [CrossRef]
- Castellano, G.; Torrisi, E.; Ligresti, G.; Malaponte, G.; Militello, L.; Russo, A.E.; McCubrey, J.A.; Canevari, S.; Libra, M. The Involvement of the Transcription Factor Yin Yang 1 in Cancer Development and Progression. Cell Cycle 2009, 8, 1367–1372. [Google Scholar] [CrossRef]
- Zaravinos, A.; Spandidos, D.A. Yin Yang 1 Expression in Human Tumors. Cell Cycle 2010, 9, 512–522. [Google Scholar] [CrossRef] [PubMed]
- Fu, X.; Ji, F.; He, Q.; Qiu, X. A Systematic Pan-Cancer Analysis of YY1 Aberrations and Their Relationship with Clinical Outcome, Tumor Microenvironment, and Therapeutic Targets. J Immunol Res 2022, 2022, 5826741. [Google Scholar] [CrossRef] [PubMed]
- Li, M.; Wei, J.; Xue, C.; Zhou, X.; Chen, S.; Zheng, L.; Duan, Y.; Deng, H.; Xiong, W.; Tang, F.; et al. Dissecting the Roles and Clinical Potential of YY1 in the Tumor Microenvironment. Front Oncol 2023, 13, 1122110. [Google Scholar] [CrossRef]
- Datar, I.; Tegegne, H.; Qin, K.; Al-Mulla, F.; Bitar, M.S.; Trumbly, R.J.; Yeung, K.C. Genetic and Epigenetic Control of RKIP Transcription. Crit Rev Oncog 2014, 19, 417–430. [Google Scholar] [CrossRef]
- Al-Mulla, F.; Hagan, S.; Al-Ali, W.; Jacob, S.P.; Behbehani, A.I.; Bitar, M.S.; Dallol, A.; Kolch, W. Raf Kinase Inhibitor Protein: Mechanism of Loss of Expression and Association with Genomic Instability. J Clin Pathol 2008, 61, 524–529. [Google Scholar] [CrossRef] [PubMed]
- Papale, M.; Netti, G.S.; Stallone, G.; Ranieri, E. Understanding Mechanisms of RKIP Regulation to Improve the Development of New Diagnostic Tools. Cancers (Basel) 2022, 14, 5070. [Google Scholar] [CrossRef]
- Li, S.; Liu, T.; Mo, W.; Hou, Q.; Zhou, Y.; Liu, M.; He, Z.; Liu, Z.; Chen, Q.; Wang, H.; et al. Prognostic Value of Phosphorylated Raf Kinase Inhibitory Protein at Serine 153 and Its Predictive Effect on the Clinical Response to Radiotherapy in Nasopharyngeal Carcinoma. Radiat Oncol 2016, 11, 121. [Google Scholar] [CrossRef]
- Baritaki, S.; Huerta-Yepez, S.; Cabrava-Haimandez, M. da L.; Sensi, M.; Canevari, S.; Libra, M.; Penichet, M.; Chen, H.; Berenson, J.R.; Bonavida, B. Unique Pattern of Overexpression of Raf-1 Kinase Inhibitory Protein in Its Inactivated Phosphorylated Form in Human Multiple Myeloma. For Immunopathol Dis Therap 2011, 2. [Google Scholar] [CrossRef]
- Cross-Knorr, S.; Lu, S.; Perez, K.; Guevara, S.; Brilliant, K.; Pisano, C.; Quesenberry, P.J.; Resnick, M.B.; Chatterjee, D. RKIP Phosphorylation and STAT3 Activation Is Inhibited by Oxaliplatin and Camptothecin and Are Associated with Poor Prognosis in Stage II Colon Cancer Patients. BMC Cancer 2013, 13, 463. [Google Scholar] [CrossRef]
- Touboul, R.; Baritaki, S.; Zaravinos, A.; Bonavida, B. RKIP Pleiotropic Activities in Cancer and Inflammatory Diseases: Role in Immunity. Cancers (Basel) 2021, 13, 6247. [Google Scholar] [CrossRef]
- Schuller, D.E. A Unified Otolaryngology-Head and Neck Surgery. Arch Otolaryngol Head Neck Surg 1989, 115, 1422–1423. [Google Scholar] [CrossRef]
- Allouche, A.; Nolens, G.; Tancredi, A.; Delacroix, L.; Mardaga, J.; Fridman, V.; Winkler, R.; Boniver, J.; Delvenne, P.; Begon, D.Y. The Combined Immunodetection of AP-2alpha and YY1 Transcription Factors Is Associated with ERBB2 Gene Overexpression in Primary Breast Tumors. Breast Cancer Res 2008, 10, R9. [Google Scholar] [CrossRef] [PubMed]
- Zaravinos, A.; Lambrou, G.I.; Boulalas, I.; Delakas, D.; Spandidos, D.A. Identification of Common Differentially Expressed Genes in Urinary Bladder Cancer. PLoS One 2011, 6, e18135. [Google Scholar] [CrossRef] [PubMed]
- Seligson, D.; Horvath, S.; Huerta-Yepez, S.; Hanna, S.; Garban, H.; Roberts, A.; Shi, T.; Liu, X.; Chia, D.; Goodglick, L.; et al. Expression of Transcription Factor Yin Yang 1 in Prostate Cancer. Int J Oncol 2005, 27, 131–141. [Google Scholar] [CrossRef] [PubMed]
- Chinnappan, D.; Xiao, D.; Ratnasari, A.; Andry, C.; King, T.C.; Weber, H.C. Transcription Factor YY1 Expression in Human Gastrointestinal Cancer Cells. Int J Oncol 2009, 34, 1417–1423. [Google Scholar]
- Berchuck, A.; Iversen, E.S.; Lancaster, J.M.; Pittman, J.; Luo, J.; Lee, P.; Murphy, S.; Dressman, H.K.; Febbo, P.G.; West, M.; et al. Patterns of Gene Expression That Characterize Long-Term Survival in Advanced Stage Serous Ovarian Cancers. Clin Cancer Res 2005, 11, 3686–3696. [Google Scholar] [CrossRef]
- Luo, J.; Zhou, X.; Ge, X.; Liu, P.; Cao, J.; Lu, X.; Ling, Y.; Zhang, S. Upregulation of Ying Yang 1 (YY1) Suppresses Esophageal Squamous Cell Carcinoma Development through Heme Oxygenase-1. Cancer Sci 2013, 104, 1544–1551. [Google Scholar] [CrossRef]
- Baritaki, S.; Chatzinikola, A.M.; Vakis, A.F.; Soulitzis, N.; Karabetsos, D.A.; Neonakis, I.; Bonavida, B.; Spandidos, D.A. YY1 Over-Expression in Human Brain Gliomas and Meningiomas Correlates with TGF-Beta1, IGF-1 and FGF-2 MRNA Levels. Cancer Invest 2009, 27, 184–192. [Google Scholar] [CrossRef]
- Zhang, J.-J.; Zhu, Y.; Xie, K.-L.; Peng, Y.-P.; Tao, J.-Q.; Tang, J.; Li, Z.; Xu, Z.-K.; Dai, C.-C.; Qian, Z.-Y.; et al. Yin Yang-1 Suppresses Invasion and Metastasis of Pancreatic Ductal Adenocarcinoma by Downregulating MMP10 in a MUC4/ErbB2/P38/MEF2C-Dependent Mechanism. Mol Cancer 2014, 13, 130. [Google Scholar] [CrossRef]
- Zhao, G.; Li, Q.; Wang, A.; Jiao, J. YY1 Regulates Melanoma Tumorigenesis through a MiR-9 ~ RYBP Axis. J Exp Clin Cancer Res 2015, 34, 66. [Google Scholar] [CrossRef]
- Cessna, H.; Baritaki, S.; Zaravinos, A.; Bonavida, B. The Role of RKIP in the Regulation of EMT in the Tumor Microenvironment. Cancers (Basel) 2022, 14, 4596. [Google Scholar] [CrossRef]
- Schnoell, J.; Jank, B.J.; Kadletz-Wanke, L.; Stoiber, S.; Spielvogel, C.P.; Gurnhofer, E.; Kenner, L.; Heiduschka, G. Transcription Factors CP2 and YY1 as Prognostic Markers in Head and Neck Squamous Cell Carcinoma: Analysis of The Cancer Genome Atlas and a Second Independent Cohort. J Cancer Res Clin Oncol 2021, 147, 755–765. [Google Scholar] [CrossRef] [PubMed]
- Pazhani, J.; Veeraraghavan, V.P.; Jayaraman, S. Transcription Factors: A Potential Therapeutic Target in Head and Neck Squamous Cell Carcinoma. Epigenomics 2023, 15, 57–60. [Google Scholar] [CrossRef] [PubMed]
- Tabibu, S.; Vinod, P.K.; Jawahar, C.V. Pan-Renal Cell Carcinoma Classification and Survival Prediction from Histopathology Images Using Deep Learning. Sci Rep 2019, 9, 10509. [Google Scholar] [CrossRef] [PubMed]
- Caliskan, A.; Andac, A.C.; Arga, K.Y. Novel Molecular Signatures and Potential Therapeutics in Renal Cell Carcinomas: Insights from a Comparative Analysis of Subtypes. Genomics 2020, 112, 3166–3178. [Google Scholar] [CrossRef]
- Moon, A.; Park, J.-Y.; Sung, J.-Y.; Park, Y.-K.; Kim, Y.W. Reduced Expression of Raf-1 Kinase Inhibitory Protein in Renal Cell Carcinoma: A Significant Prognostic Marker. Pathology 2012, 44, 534–539. [Google Scholar] [CrossRef]
- Papale, M.; Vocino, G.; Lucarelli, G.; Rutigliano, M.; Gigante, M.; Rocchetti, M.T.; Pesce, F.; Sanguedolce, F.; Bufo, P.; Battaglia, M.; et al. Urinary RKIP/p-RKIP Is a Potential Diagnostic and Prognostic Marker of Clear Cell Renal Cell Carcinoma. Oncotarget 2017, 8, 40412–40424. [Google Scholar] [CrossRef]
- Erkeland, S.J.; Valkhof, M.; Heijmans-Antonissen, C.; Delwel, R.; Valk, P.J.M.; Hermans, M.H.A.; Touw, I.P. The Gene Encoding the Transcriptional Regulator Yin Yang 1 (YY1) Is a Myeloid Transforming Gene Interfering with Neutrophilic Differentiation. Blood 2003, 101, 1111–1117. [Google Scholar] [CrossRef]
- de Nigris, F.; Botti, C.; de Chiara, A.; Rossiello, R.; Apice, G.; Fazioli, F.; Fiorito, C.; Sica, V.; Napoli, C. Expression of Transcription Factor Yin Yang 1 in Human Osteosarcomas. Eur J Cancer 2006, 42, 2420–2424. [Google Scholar] [CrossRef]
- Martins Peçanha, F.L.; Jaafar, R.; Werneck-de-Castro, J.P.; Apostolopolou, C.-C.; Bhushan, A.; Bernal-Mizrachi, E. The Transcription Factor YY1 Is Essential for Normal DNA Repair and Cell Cycle in Human and Mouse β-Cells. Diabetes 2022, 71, 1694–1705. [Google Scholar] [CrossRef]
- Tesfazghi, M.T. The Recruitment of the Transcription Factor YY1 to DNA Damage Sites in Human Cells. Theses and Dissertations, Florida State University, 2016.
- Khachigian, L.M. The Yin and Yang of YY1 in Tumor Growth and Suppression. Int J Cancer 2018, 143, 460–465. [Google Scholar] [CrossRef]
- Qiao, K.; Ning, S.; Wan, L.; Wu, H.; Wang, Q.; Zhang, X.; Xu, S.; Pang, D. LINC00673 Is Activated by YY1 and Promotes the Proliferation of Breast Cancer Cells via the MiR-515-5p/MARK4/Hippo Signaling Pathway. J Exp Clin Cancer Res 2019, 38, 418. [Google Scholar] [CrossRef]
- Yang, F.; Fang, E.; Mei, H.; Chen, Y.; Li, H.; Li, D.; Song, H.; Wang, J.; Hong, M.; Xiao, W.; et al. Cis-Acting Circ-CTNNB1 Promotes β-Catenin Signaling and Cancer Progression via DDX3-Mediated Transactivation of YY1. Cancer Res 2019, 79, 557–571. [Google Scholar] [CrossRef] [PubMed]
- Liu, D.; Zhang, J.; Wu, Y.; Shi, G.; Yuan, H.; Lu, Z.; Zhu, Q.; Wu, P.; Lu, C.; Guo, F.; et al. YY1 Suppresses Proliferation and Migration of Pancreatic Ductal Adenocarcinoma by Regulating the CDKN3/MdM2/P53/P21 Signaling Pathway. Int J Cancer 2018, 142, 1392–1404. [Google Scholar] [CrossRef] [PubMed]
- Ahmed, M.; Lai, T.H.; Zada, S.; Hwang, J.S.; Pham, T.M.; Yun, M.; Kim, D.R. Functional Linkage of RKIP to the Epithelial to Mesenchymal Transition and Autophagy during the Development of Prostate Cancer. Cancers (Basel) 2018, 10, 273. [Google Scholar] [CrossRef] [PubMed]
- Bonavida, B.; Baritaki, S. Dual Role of NO Donors in the Reversal of Tumor Cell Resistance and EMT: Downregulation of the NF-ΚB/Snail/YY1/RKIP Circuitry. Nitric Oxide 2011, 24, 1–7. [Google Scholar] [CrossRef]
- Bonavida, B. Linking Autophagy and the Dysregulated NFκB/ SNAIL/YY1/RKIP/PTEN Loop in Cancer: Therapeutic Implications. Crit Rev Oncog 2018, 23, 307–320. [Google Scholar] [CrossRef]
- Bonavida, B.; Baritaki, S. The Novel Role of Yin Yang 1 in the Regulation of Epithelial to Mesenchymal Transition in Cancer via the Dysregulated NF-ΚB/Snail/YY1/RKIP/PTEN Circuitry. Crit Rev Oncog 2011, 16, 211–226. [Google Scholar] [CrossRef]
- Bonavida, B.; Jazirehi, A.; Vega, M.I.; Huerta-Yepez, S.; Baritaki, S. Roles Each of Snail, Yin Yang 1 and RKIP in the Regulation of Tumor Cells Chemo-Immuno-Resistance to Apoptosis. For Immunopathol Dis Therap 2013, 4. [Google Scholar] [CrossRef]
- Deng, Q.; Wang, Z.; Du, Y.; Zhang, Y.; Liang, H. Transcriptional Regulation of PEBP1 Expression by Androgen Receptor in Mouse Testes. Syst Biol Reprod Med 2022, 68, 70–79. [Google Scholar] [CrossRef]
- Zhang, H.; Wu, J.; Keller, J.M.; Yeung, K.; Keller, E.T.; Fu, Z. Transcriptional Regulation of RKIP Expression by Androgen in Prostate Cells. Cell Physiol Biochem 2012, 30, 1340–1350. [Google Scholar] [CrossRef]
- Lee, J.; Olivieri, C.; Ong, C.; Masterson, L.R.; Gomes, S.; Lee, B.-S.; Schaefer, F.; Lorenz, K.; Veglia, G.; Rosner, M.R. Raf Kinase Inhibitory Protein Regulates the CAMP-Dependent Protein Kinase Signaling Pathway through a Positive Feedback Loop. Proc Natl Acad Sci U S A 2022, 119, e2121867119. [Google Scholar] [CrossRef] [PubMed]
- Deng, Z.; Wan, M.; Cao, P.; Rao, A.; Cramer, S.D.; Sui, G. Yin Yang 1 Regulates the Transcriptional Activity of Androgen Receptor. Oncogene 2009, 28, 3746–3757. [Google Scholar] [CrossRef] [PubMed]
- Wottrich, S.; Kaufhold, S.; Chrysos, E.; Zoras, O.; Baritaki, S.; Bonavida, B. Inverse Correlation between the Metastasis Suppressor RKIP and the Metastasis Inducer YY1: Contrasting Roles in the Regulation of Chemo/Immuno-Resistance in Cancer. Drug Resist Updat 2017, 30, 28–38. [Google Scholar] [CrossRef]
- Su, S.; Liao, J.; Liu, J.; Huang, D.; He, C.; Chen, F.; Yang, L.; Wu, W.; Chen, J.; Lin, L.; et al. Blocking the Recruitment of Naive CD4+ T Cells Reverses Immunosuppression in Breast Cancer. Cell Res 2017, 27, 461–482. [Google Scholar] [CrossRef] [PubMed]
- Lin, X.; Ye, L.; Wang, X.; Liao, Z.; Dong, J.; Yang, Y.; Zhang, R.; Li, H.; Li, P.; Ding, L.; et al. Follicular Helper T Cells Remodel the Immune Microenvironment of Pancreatic Cancer via Secreting CXCL13 and IL-21. Cancers (Basel) 2021, 13, 3678. [Google Scholar] [CrossRef]
- Kinker, G.S.; Vitiello, G.A.F.; Ferreira, W.A.S.; Chaves, A.S.; Cordeiro de Lima, V.C.; Medina, T. da S. B Cell Orchestration of Anti-Tumor Immune Responses: A Matter of Cell Localization and Communication. Front Cell Dev Biol 2021, 9, 678127. [Google Scholar] [CrossRef]
- Shi, J.-Y.; Gao, Q.; Wang, Z.-C.; Zhou, J.; Wang, X.-Y.; Min, Z.-H.; Shi, Y.-H.; Shi, G.-M.; Ding, Z.-B.; Ke, A.-W.; et al. Margin-Infiltrating CD20(+) B Cells Display an Atypical Memory Phenotype and Correlate with Favorable Prognosis in Hepatocellular Carcinoma. Clin Cancer Res 2013, 19, 5994–6005. [Google Scholar] [CrossRef]
- Kwiatkowska, D.; Mazur, E.; Reich, A. YY1 Is a Key Player in Melanoma Immunotherapy/Targeted Treatment Resistance. Front Oncol 2022, 12, 856963. [Google Scholar] [CrossRef]
- Balkhi, M.Y.; Wittmann, G.; Xiong, F.; Junghans, R.P. YY1 Upregulates Checkpoint Receptors and Downregulates Type I Cytokines in Exhausted, Chronically Stimulated Human T Cells. iScience 2018, 2, 105–122. [Google Scholar] [CrossRef]
- Li, X.; Li, J.; Wu, P.; Zhou, L.; Lu, B.; Ying, K.; Chen, E.; Lu, Y.; Liu, P. Smoker and Non-Smoker Lung Adenocarcinoma Is Characterized by Distinct Tumor Immune Microenvironments. Oncoimmunology 2018, 7, e1494677. [Google Scholar] [CrossRef]
- Zhang, H.; Sun, L.; Hu, X. Mast Cells Resting-Related Prognostic Signature in Hepatocellular Carcinoma. J Oncol 2021, 2021, 4614257. [Google Scholar] [CrossRef] [PubMed]
- Gabriela-Freitas, M.; Pinheiro, J.; Raquel-Cunha, A.; Cardoso-Carneiro, D.; Martinho, O. RKIP as an Inflammatory and Immune System Modulator: Implications in Cancer. Biomolecules 2019, 9, 769. [Google Scholar] [CrossRef] [PubMed]
- Frankenberger, C.; Rabe, D.; Bainer, R.; Sankarasharma, D.; Chada, K.; Krausz, T.; Gilad, Y.; Becker, L.; Rosner, M.R. Metastasis Suppressors Regulate the Tumor Microenvironment by Blocking Recruitment of Prometastatic Tumor-Associated Macrophages. Cancer Research 2015, 75, 4063–4073. [Google Scholar] [CrossRef] [PubMed]
- Datar, I.; Qiu, X.; Ma, H.Z.; Yeung, M.; Aras, S.; de la Serna, I.; Al-Mulla, F.; Thiery, J.P.; Trumbly, R.; Fan, X.; et al. RKIP Regulates CCL5 Expression to Inhibit Breast Cancer Invasion and Metastasis by Controlling Macrophage Infiltration. Oncotarget 2015, 6, 39050–39061. [Google Scholar] [CrossRef]
- Buschow, S.I.; Ramazzotti, M.; Reinieren-Beeren, I.M.J.; Heinzerling, L.M.; Westdorp, H.; Stefanini, I.; Beltrame, L.; Hato, S.V.; Ellebaek, E.; Gross, S.; et al. Survival of Metastatic Melanoma Patients after Dendritic Cell Vaccination Correlates with Expression of Leukocyte Phosphatidylethanolamine-Binding Protein 1/Raf Kinase Inhibitory Protein. Oncotarget 2017, 8, 67439–67456. [Google Scholar] [CrossRef]
- Wei, H.; Gao, H.Q.; Li, H.B.; Qi, S.J.; Liu, W.L.; Xu, L.; Li, H.; Liu, J.X.; Dong, Z.M. Correlation among RKIP Expression, NF-ΚB P65 Levels, and T-Lymphocyte Subsets in Gastric Cardia Adenocarcinoma. Genet Mol Res 2015, 14, 16491–16496. [Google Scholar] [CrossRef]
- Crassini, K.; Pyke, T.; Shen, Y.; Stevenson, W.S.; Christopherson, R.I.; Mulligan, S.P.; Best, O.G. Inhibition of the Raf-1 Kinase Inhibitory Protein (RKIP) by Locostatin Induces Cell Death and Reduces the CXCR4-Mediated Migration of Chronic Lymphocytic Leukemia Cells. Leuk Lymphoma 2018, 59, 2917–2928. [Google Scholar] [CrossRef]
- Lin, W.; Su, F.; Gautam, R.; Wang, N.; Zhang, Y.; Wang, X. Raf Kinase Inhibitor Protein Negatively Regulates FcεRI-Mediated Mast Cell Activation and Allergic Response. Proc Natl Acad Sci U S A 2018, 115, E9859–E9868. [Google Scholar] [CrossRef]
- Martinez-Ruiz, G.U.; Morales-Sanchez, A.; Pacheco-Hernandez, A.F. Roles Played by YY1 in Embryonic, Adult and Cancer Stem Cells. Stem Cell Rev Rep 2021, 17, 1590–1606. [Google Scholar] [CrossRef]
- Wottrich, S.; Bonavida, B. Regulation of the Cancer Stem Cell Phenotype by Raf Kinase Inhibitor Protein via Its Association with Kruppel-Like Factor 4. Forum Immun Dis Ther 2016, 7, 107–118. [Google Scholar] [CrossRef]
- Son, H.J.; Choi, E.J.; Yoo, N.J.; Lee, S.H. Somatic Mutations and Intratumoral Heterogeneity of Cancer-Related Genes NLK, YY1 and PA2G4 in Gastric and Colorectal Cancers. Pathol Oncol Res 2020, 26, 2813–2815. [Google Scholar] [CrossRef] [PubMed]
- Özenver, N.; Efferth, T. Therapeutic Targeting of SNAIL, RKIP, and YY1 in Tumor Metastasis and Drug Resistance. In Prognostic and Therapeutic Applications of RKIP in Cancer; Elsevier, 2020; pp. 357–387 ISBN 978-0-12-819612-0.
Figure 1.
A. The bubble plot presents the fold change of YY1 and PEBP1 across 14 cancer types, and the corresponding FDR through bubble color and size. The bubble color from purple to red represents the fold change between tumor vs. normal. The size of dots is positively correlated with the FDR significance. B. PEBP1 and YY1 mRNA expression in lung cancers (LUAD and LUAD) compared to the normal tissue. C. The trend plot summarizes the trend of YY1 and PEBP1 mRNA expression from early stage to late stage in pan-cancer. The boxplots to the right are examples of differential YY1 and PEBP1 expression in KIRP, LIHC and THCA. D. The associations between different cancer subtypes and YY1/PEBP1 mRNA expression. The boxplots to the right are examples of differential YY1 and PEBP1 expression in molecular subtypes of BRCA and KIRC, respectively. E. Kaplan-Meier plots depict examples of survival differences between high and low YY1 (and PEBP1) mRNA expression groups in HNSCC and KICH, respectively.
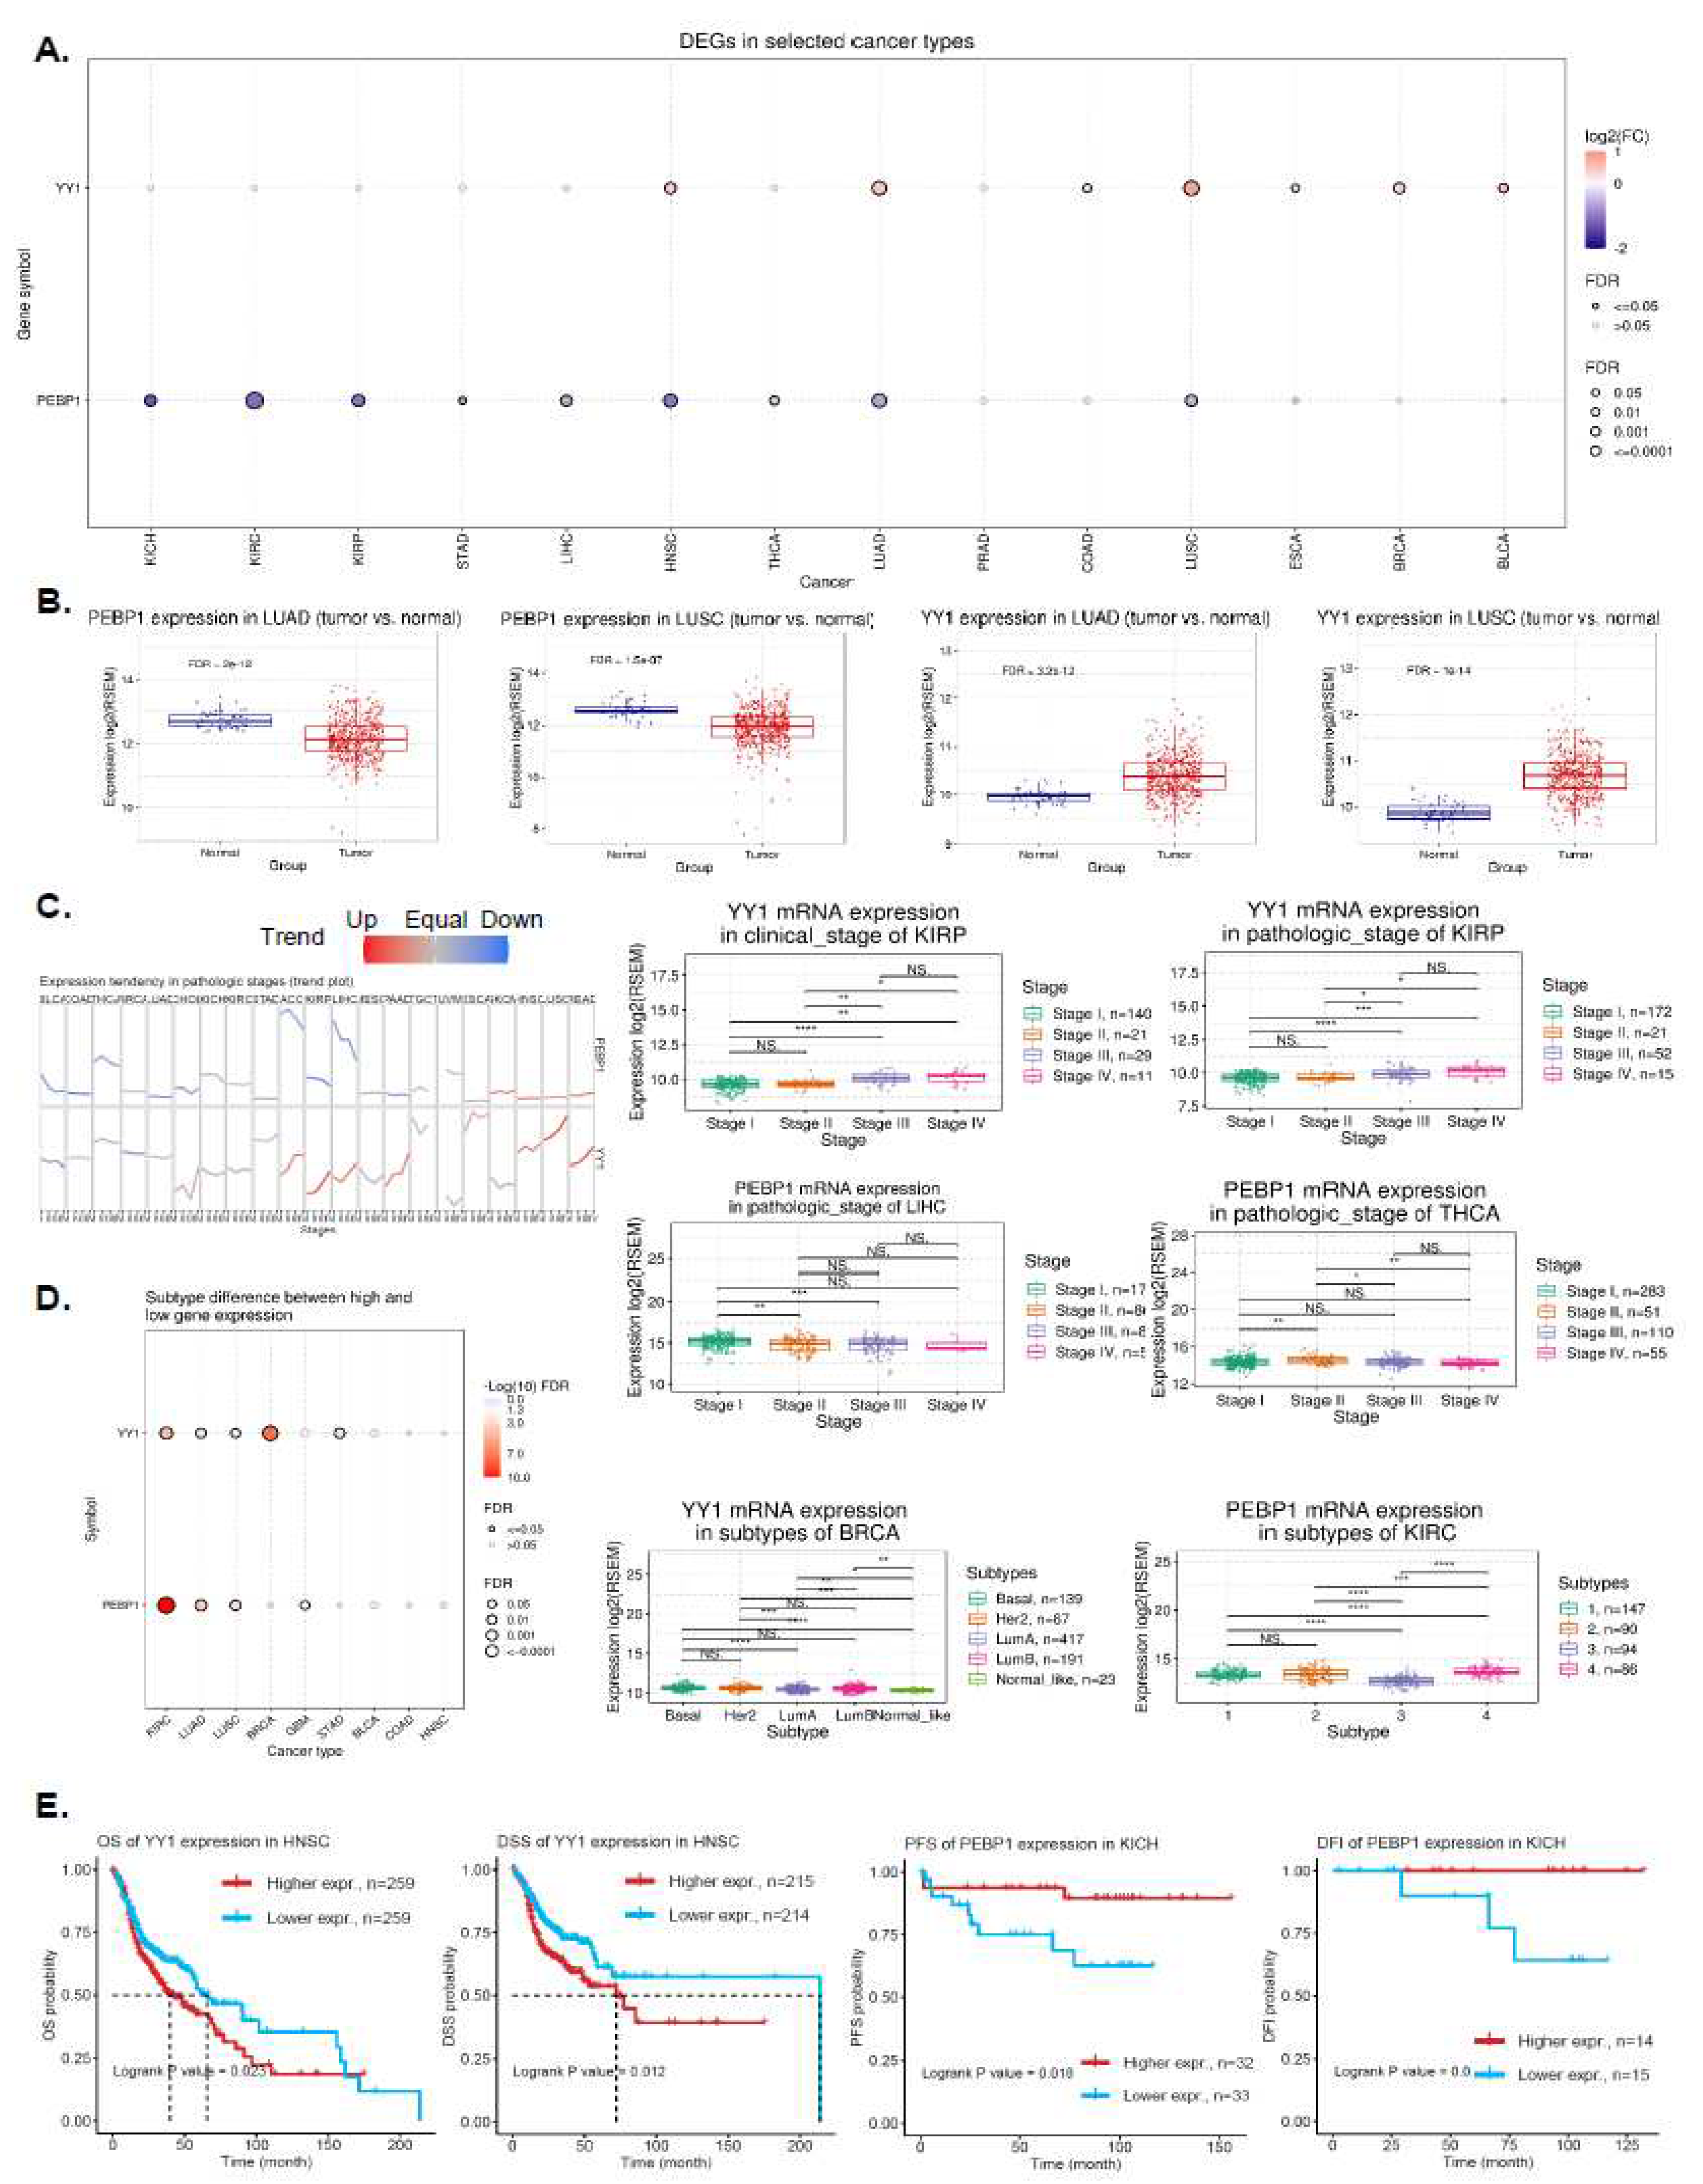
Figure 2.
A. The number in each cell indicates the percentage of cancer types, in which each gene (YY1 and PEBP1) showed significant association (inducing or inhibitory) with a specific pathway, in pan-cancer. B. Pathway activity scores (PAS) of high- and low- (YY1 and PEBP1) expression groups in BLCA tumors.
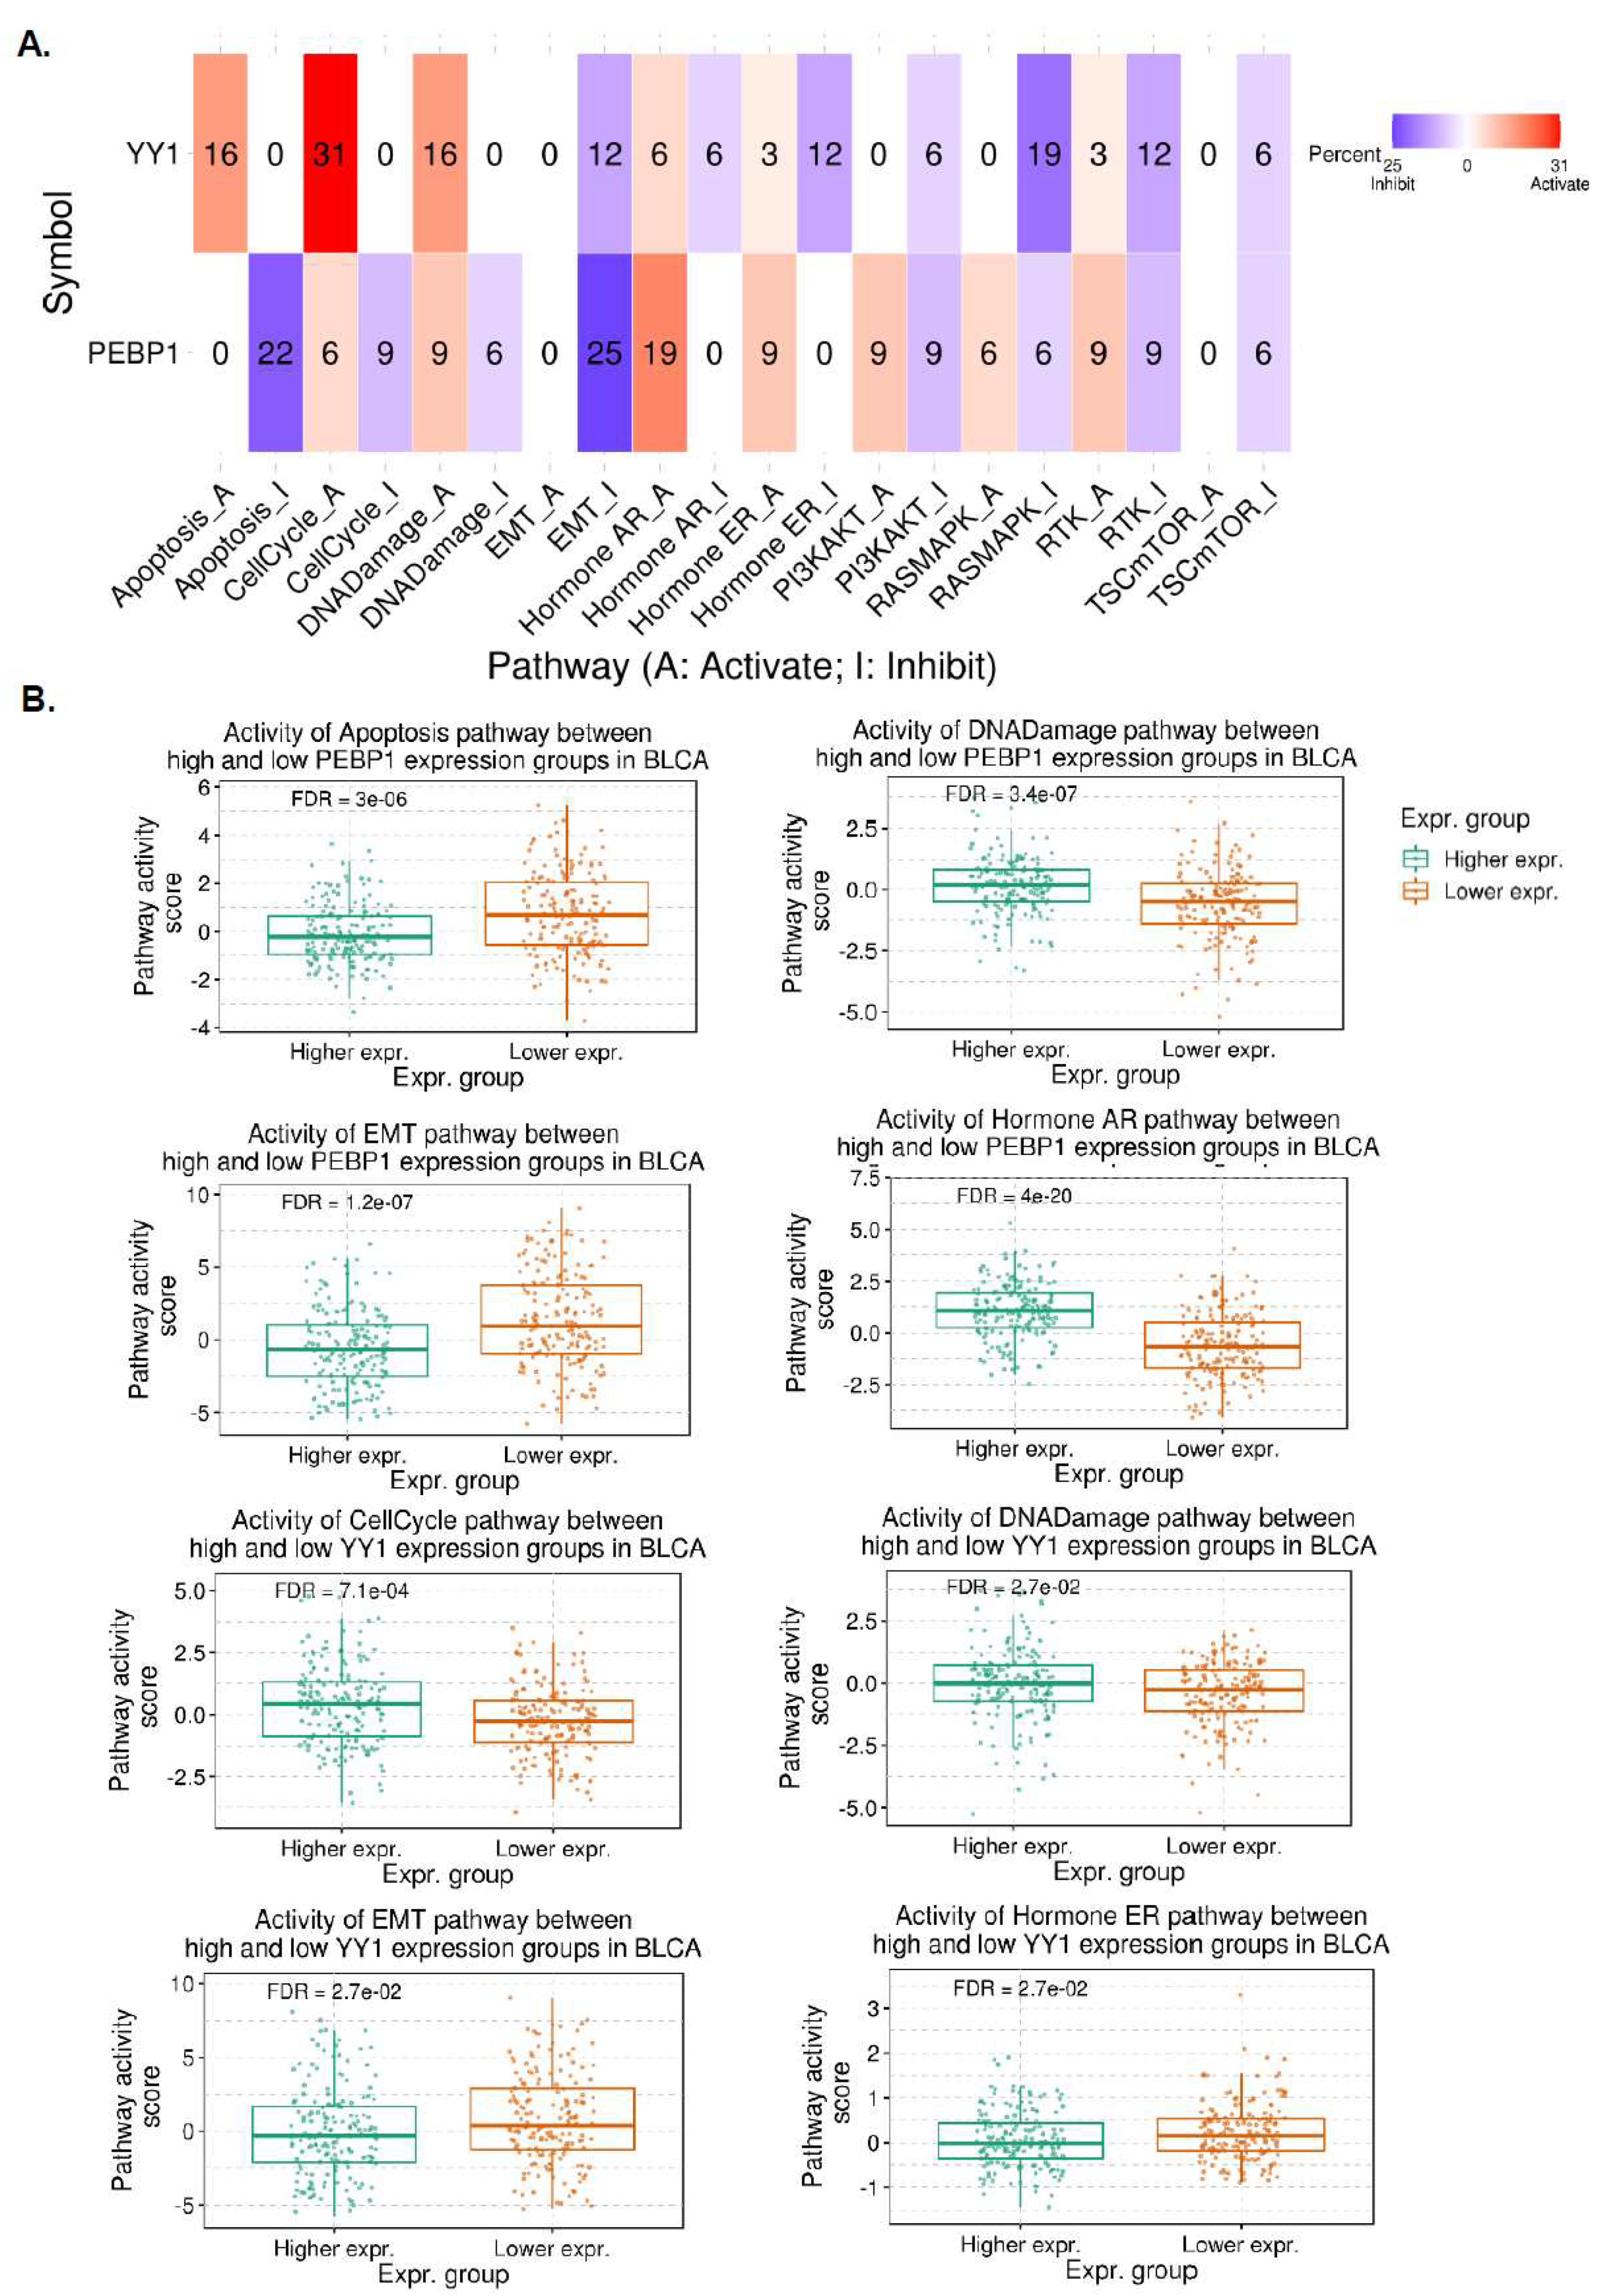
Figure 3.
A. The bubble plot depicts the correlation between YY1 (and PEBP1) mRNA expression and immune infiltrates in KICH. B. Spearman correlation between PEBP1, central infiltrate and Th17 infiltrate in KICH. C. Upper panel: Th2 infiltrates between PEBP1 mutants and wt, and B cell infiltrates between YY1 mutants and wt in SKCM. Lower panel: iTreg, Th1 and MAIT infiltrates between YY1 mutants and wt in UCEC. D. Association between PEBP1 CNV and immune cells’ infiltrates in breast cancer, through Spearman correlation analysis.
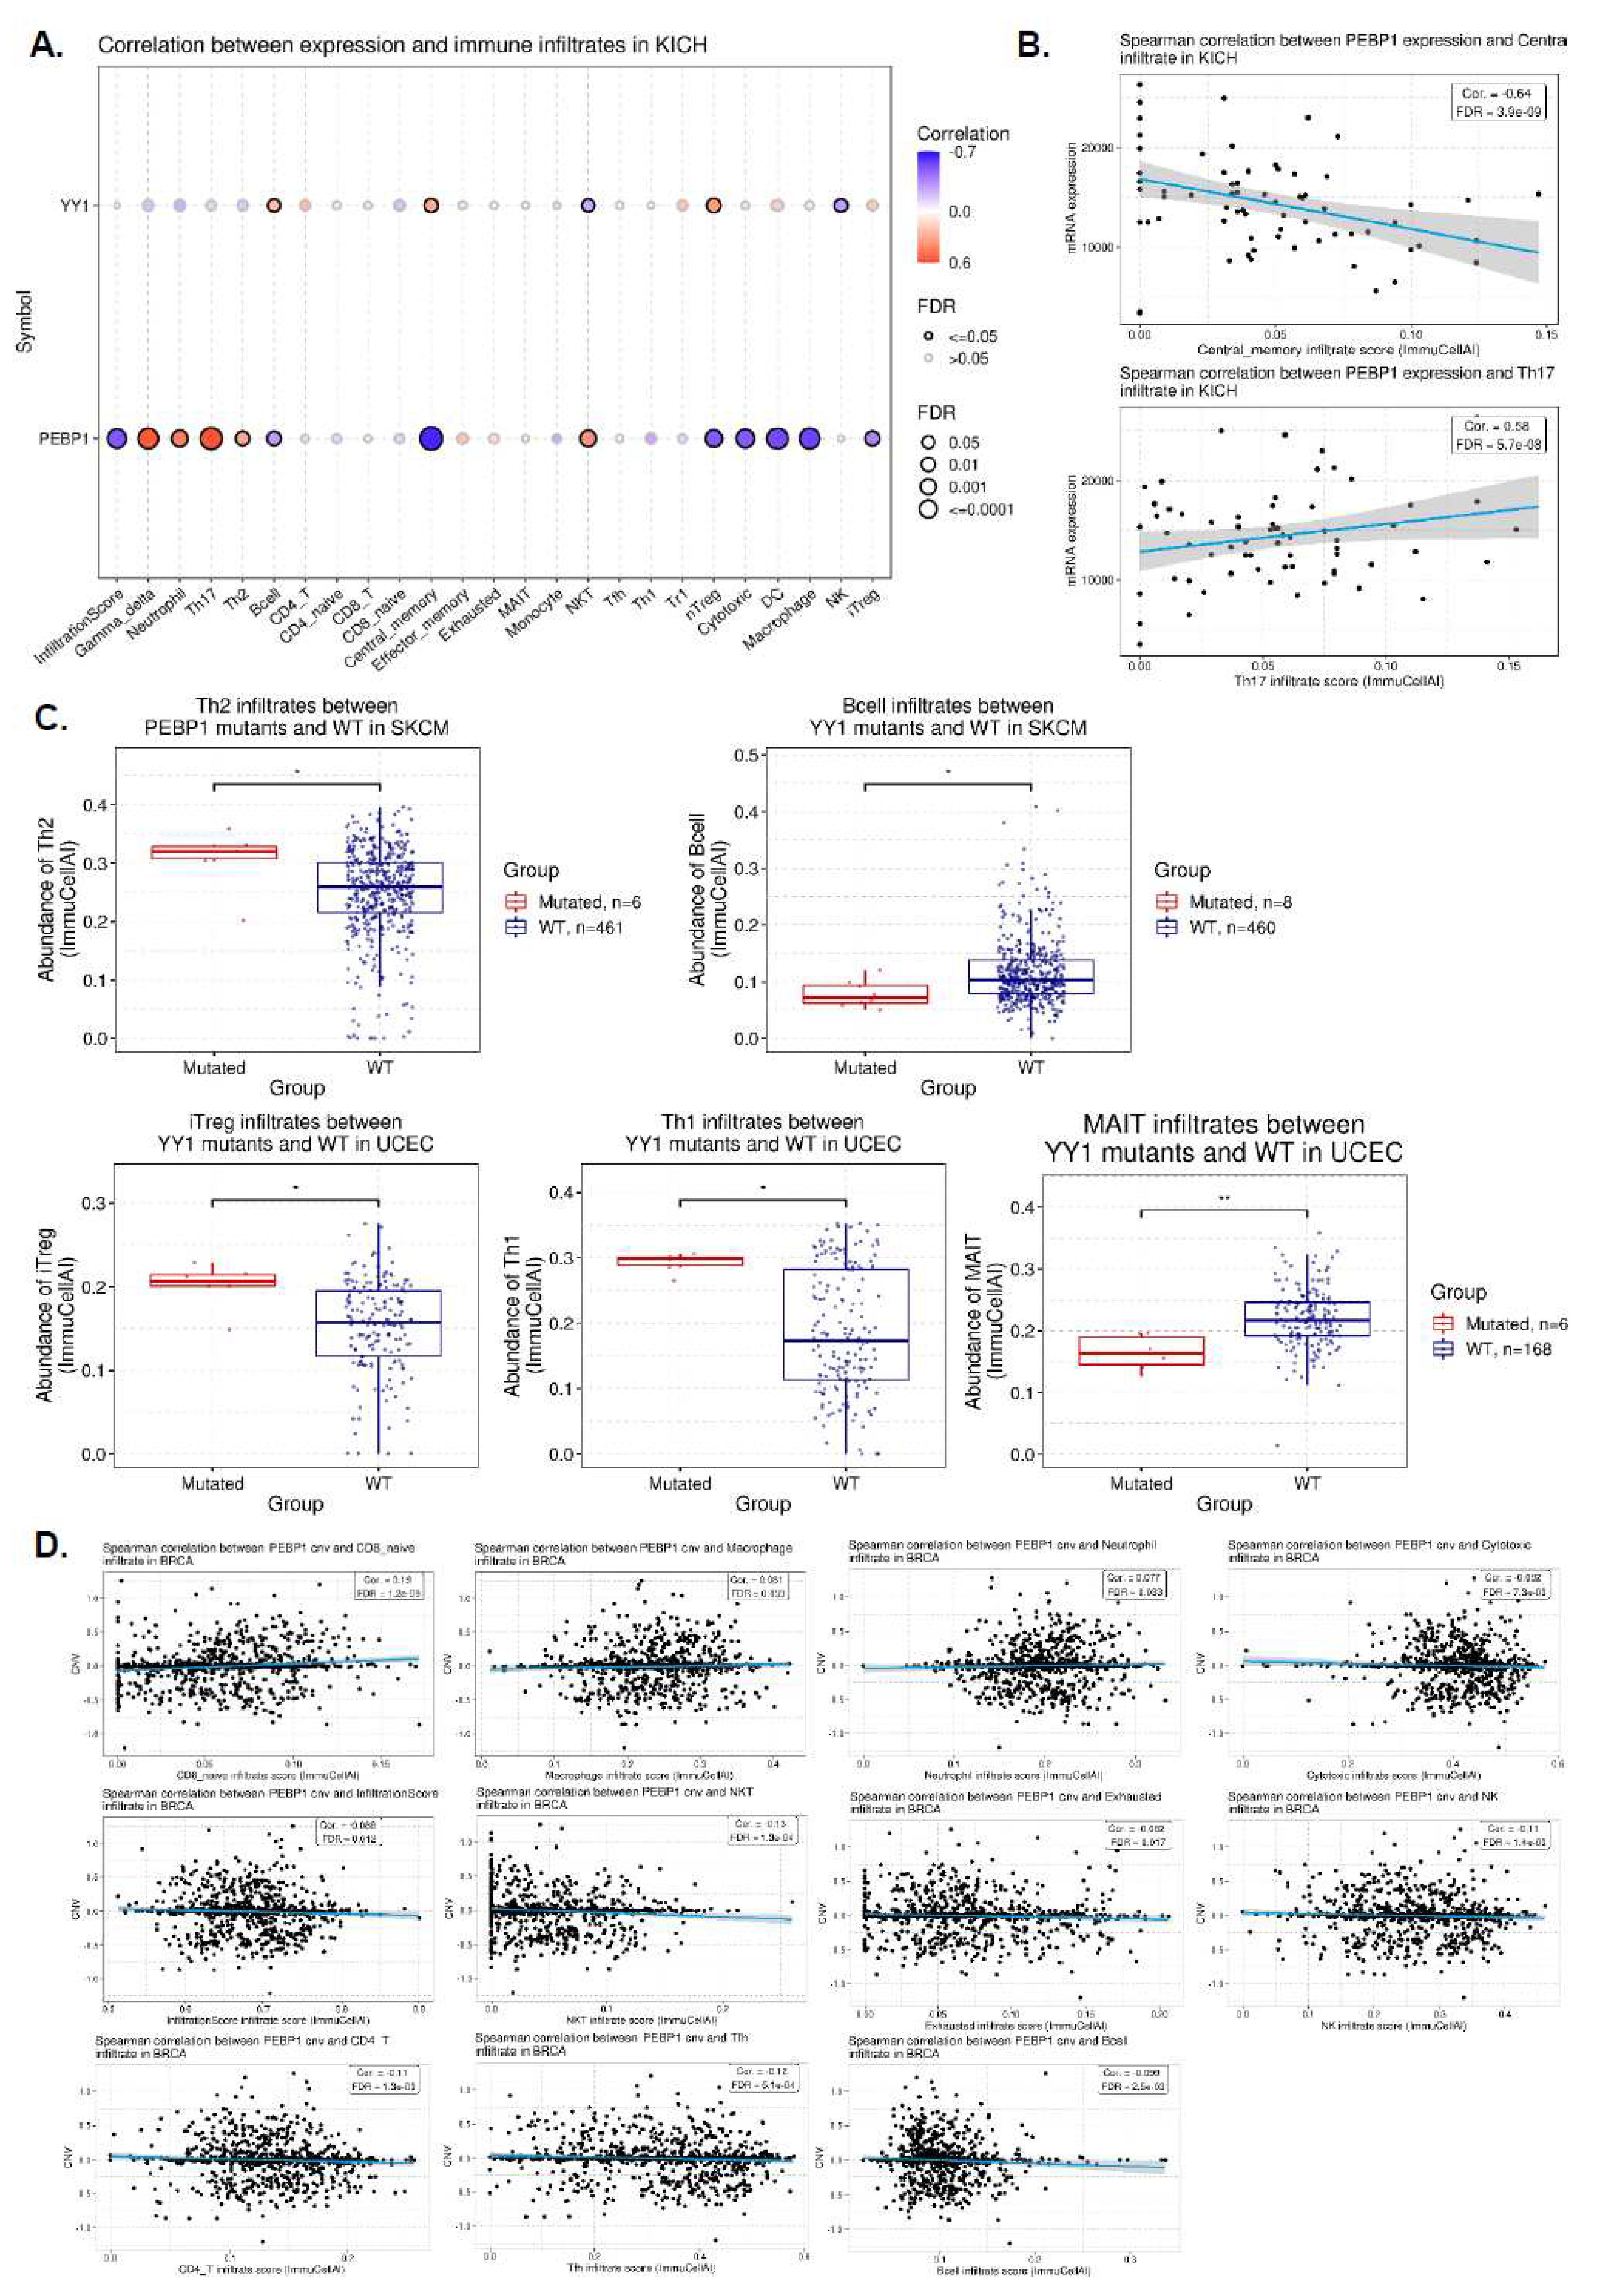
Figure 4.
A. Differential PEBP1 and YY1 methylation levels (beta values) between tumor and normal samples in pan-cancer. B. Differential methylation levels of PEBP1 in LUSC and HNSCC. C. Correlation between YY1/PEBP1 methylation and their mRNA expression in pan-cancer. D. Spearman's correlations between PEBP1 (and YY1) methylation and their mRNA levels in LGG and LUSC, respectively.
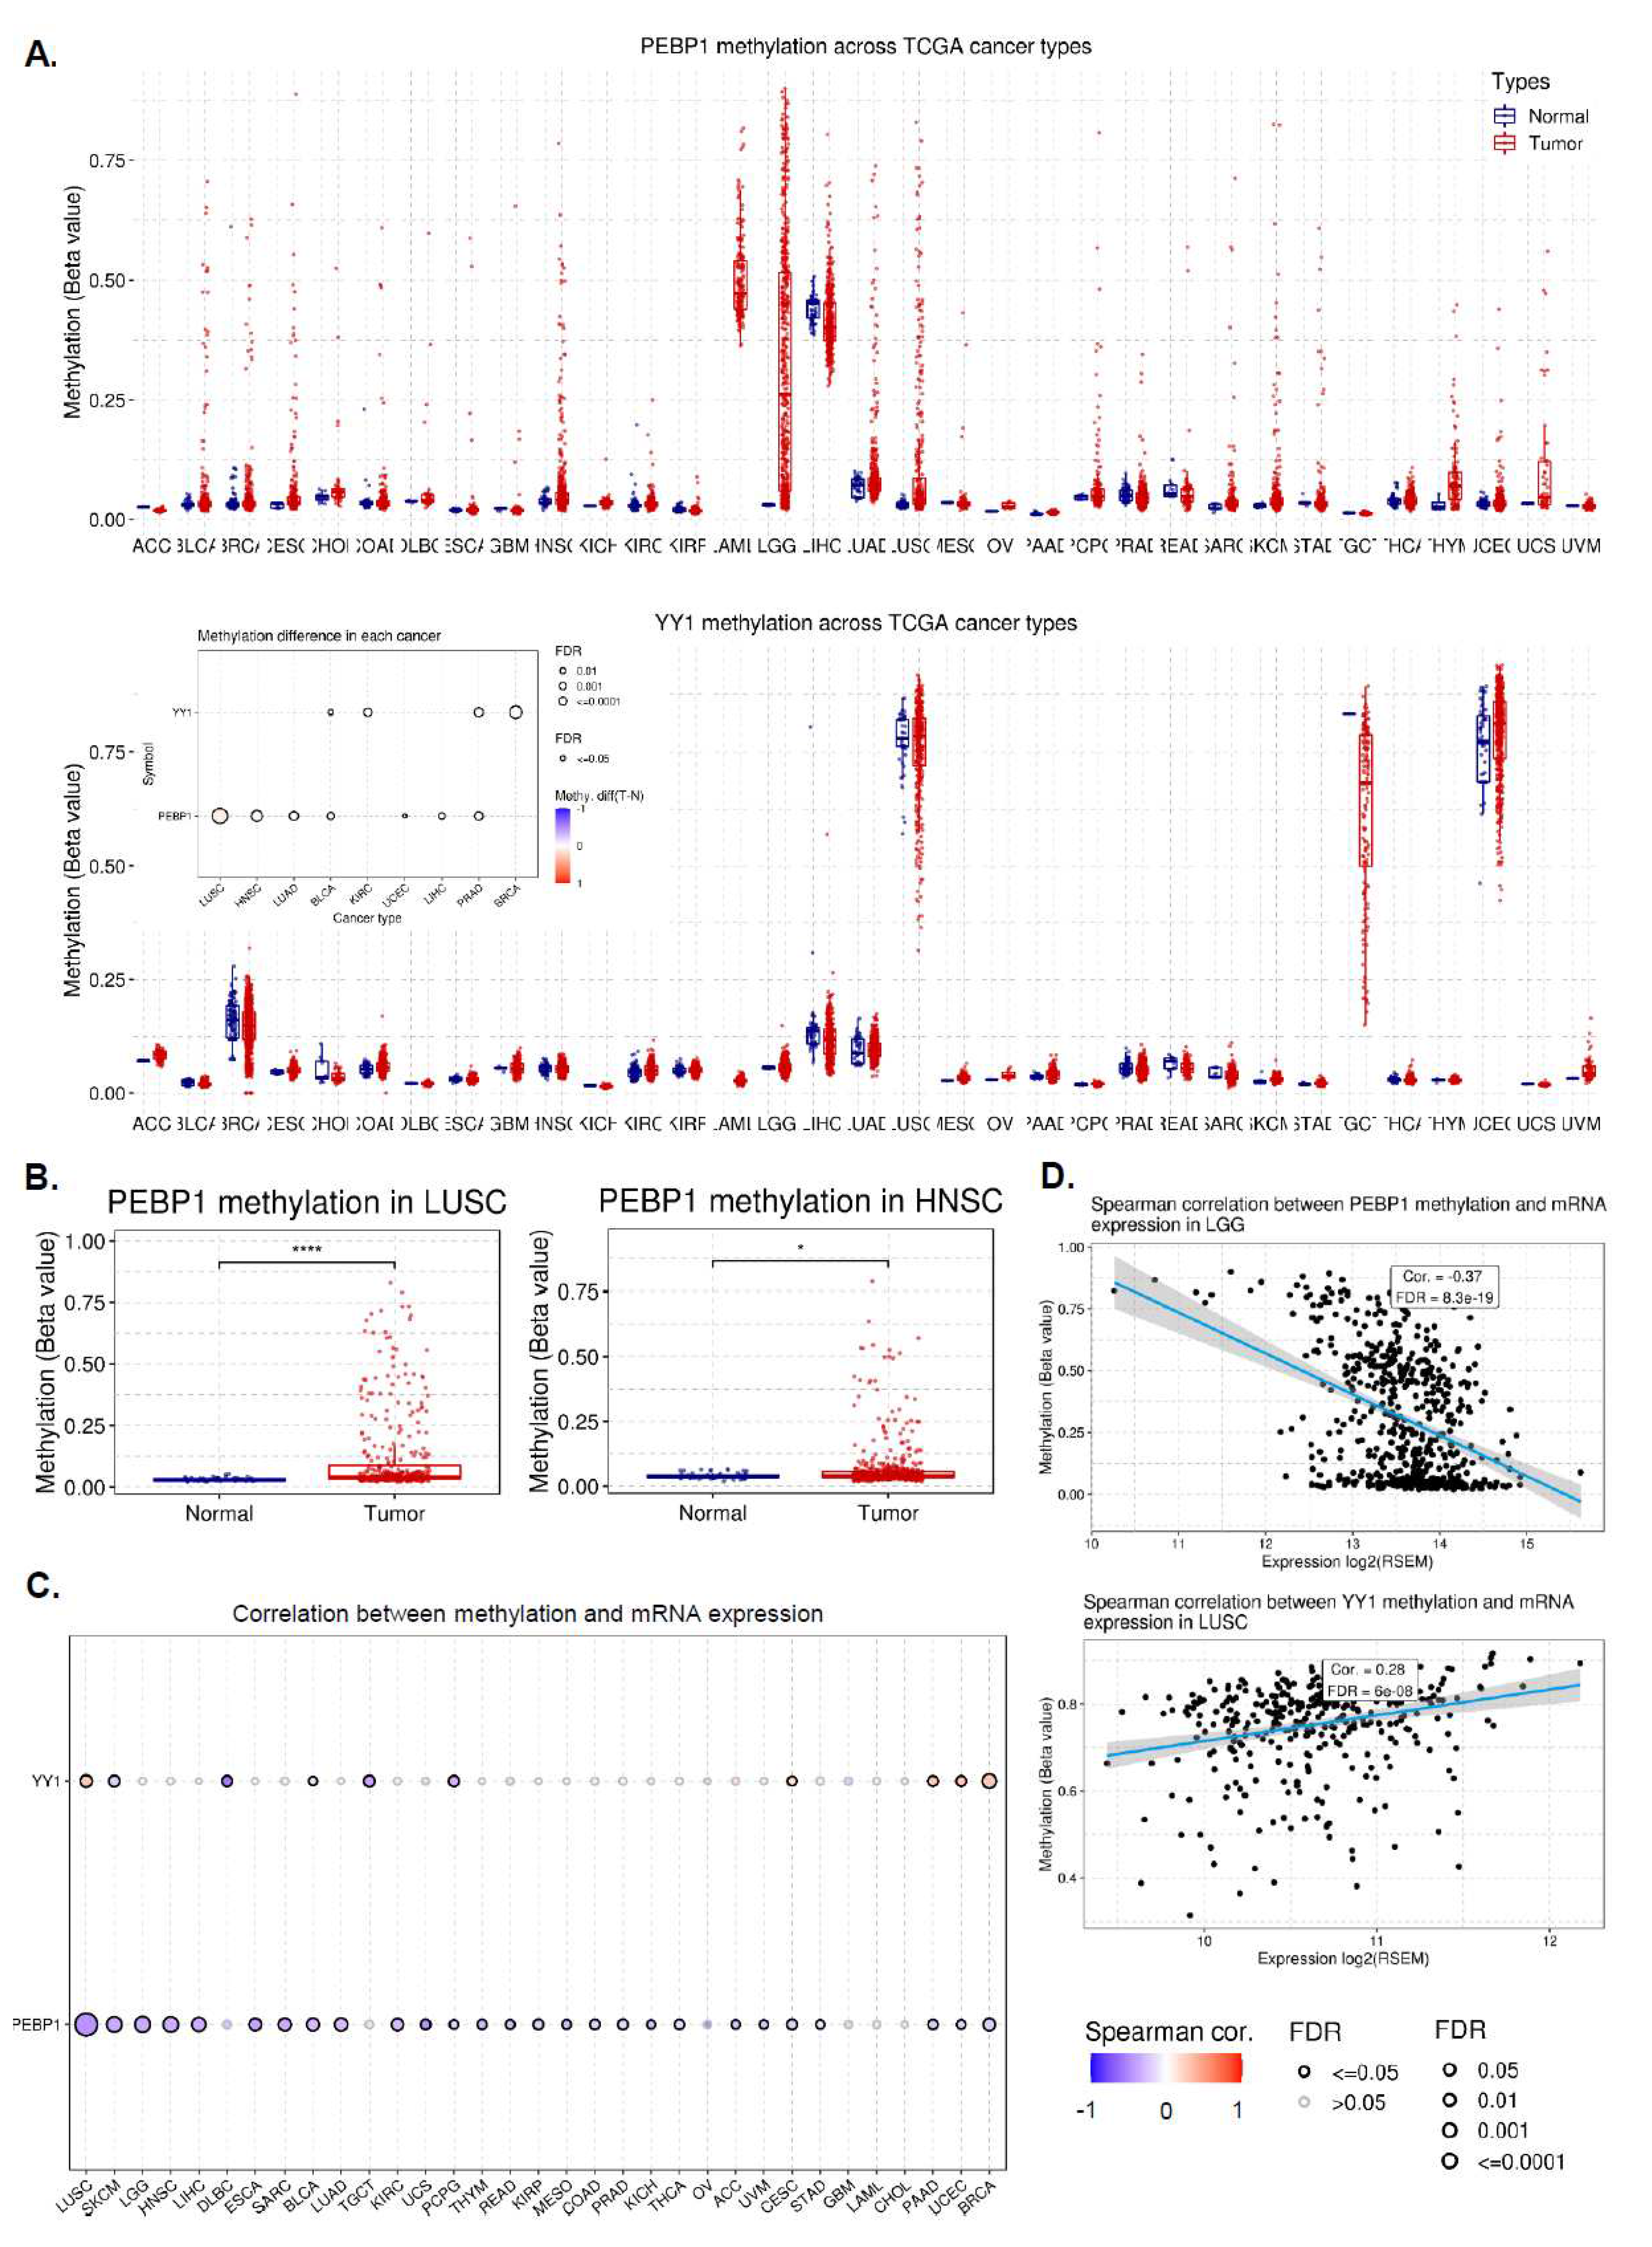
Figure 5.
Correlations between the expression of YY1 (A) or PEBP1 (B) and the infiltration levels of different immune cell subtypes. *p<0.05; **p<0.01; ***p<0.001.
Figure 5.
Correlations between the expression of YY1 (A) or PEBP1 (B) and the infiltration levels of different immune cell subtypes. *p<0.05; **p<0.01; ***p<0.001.
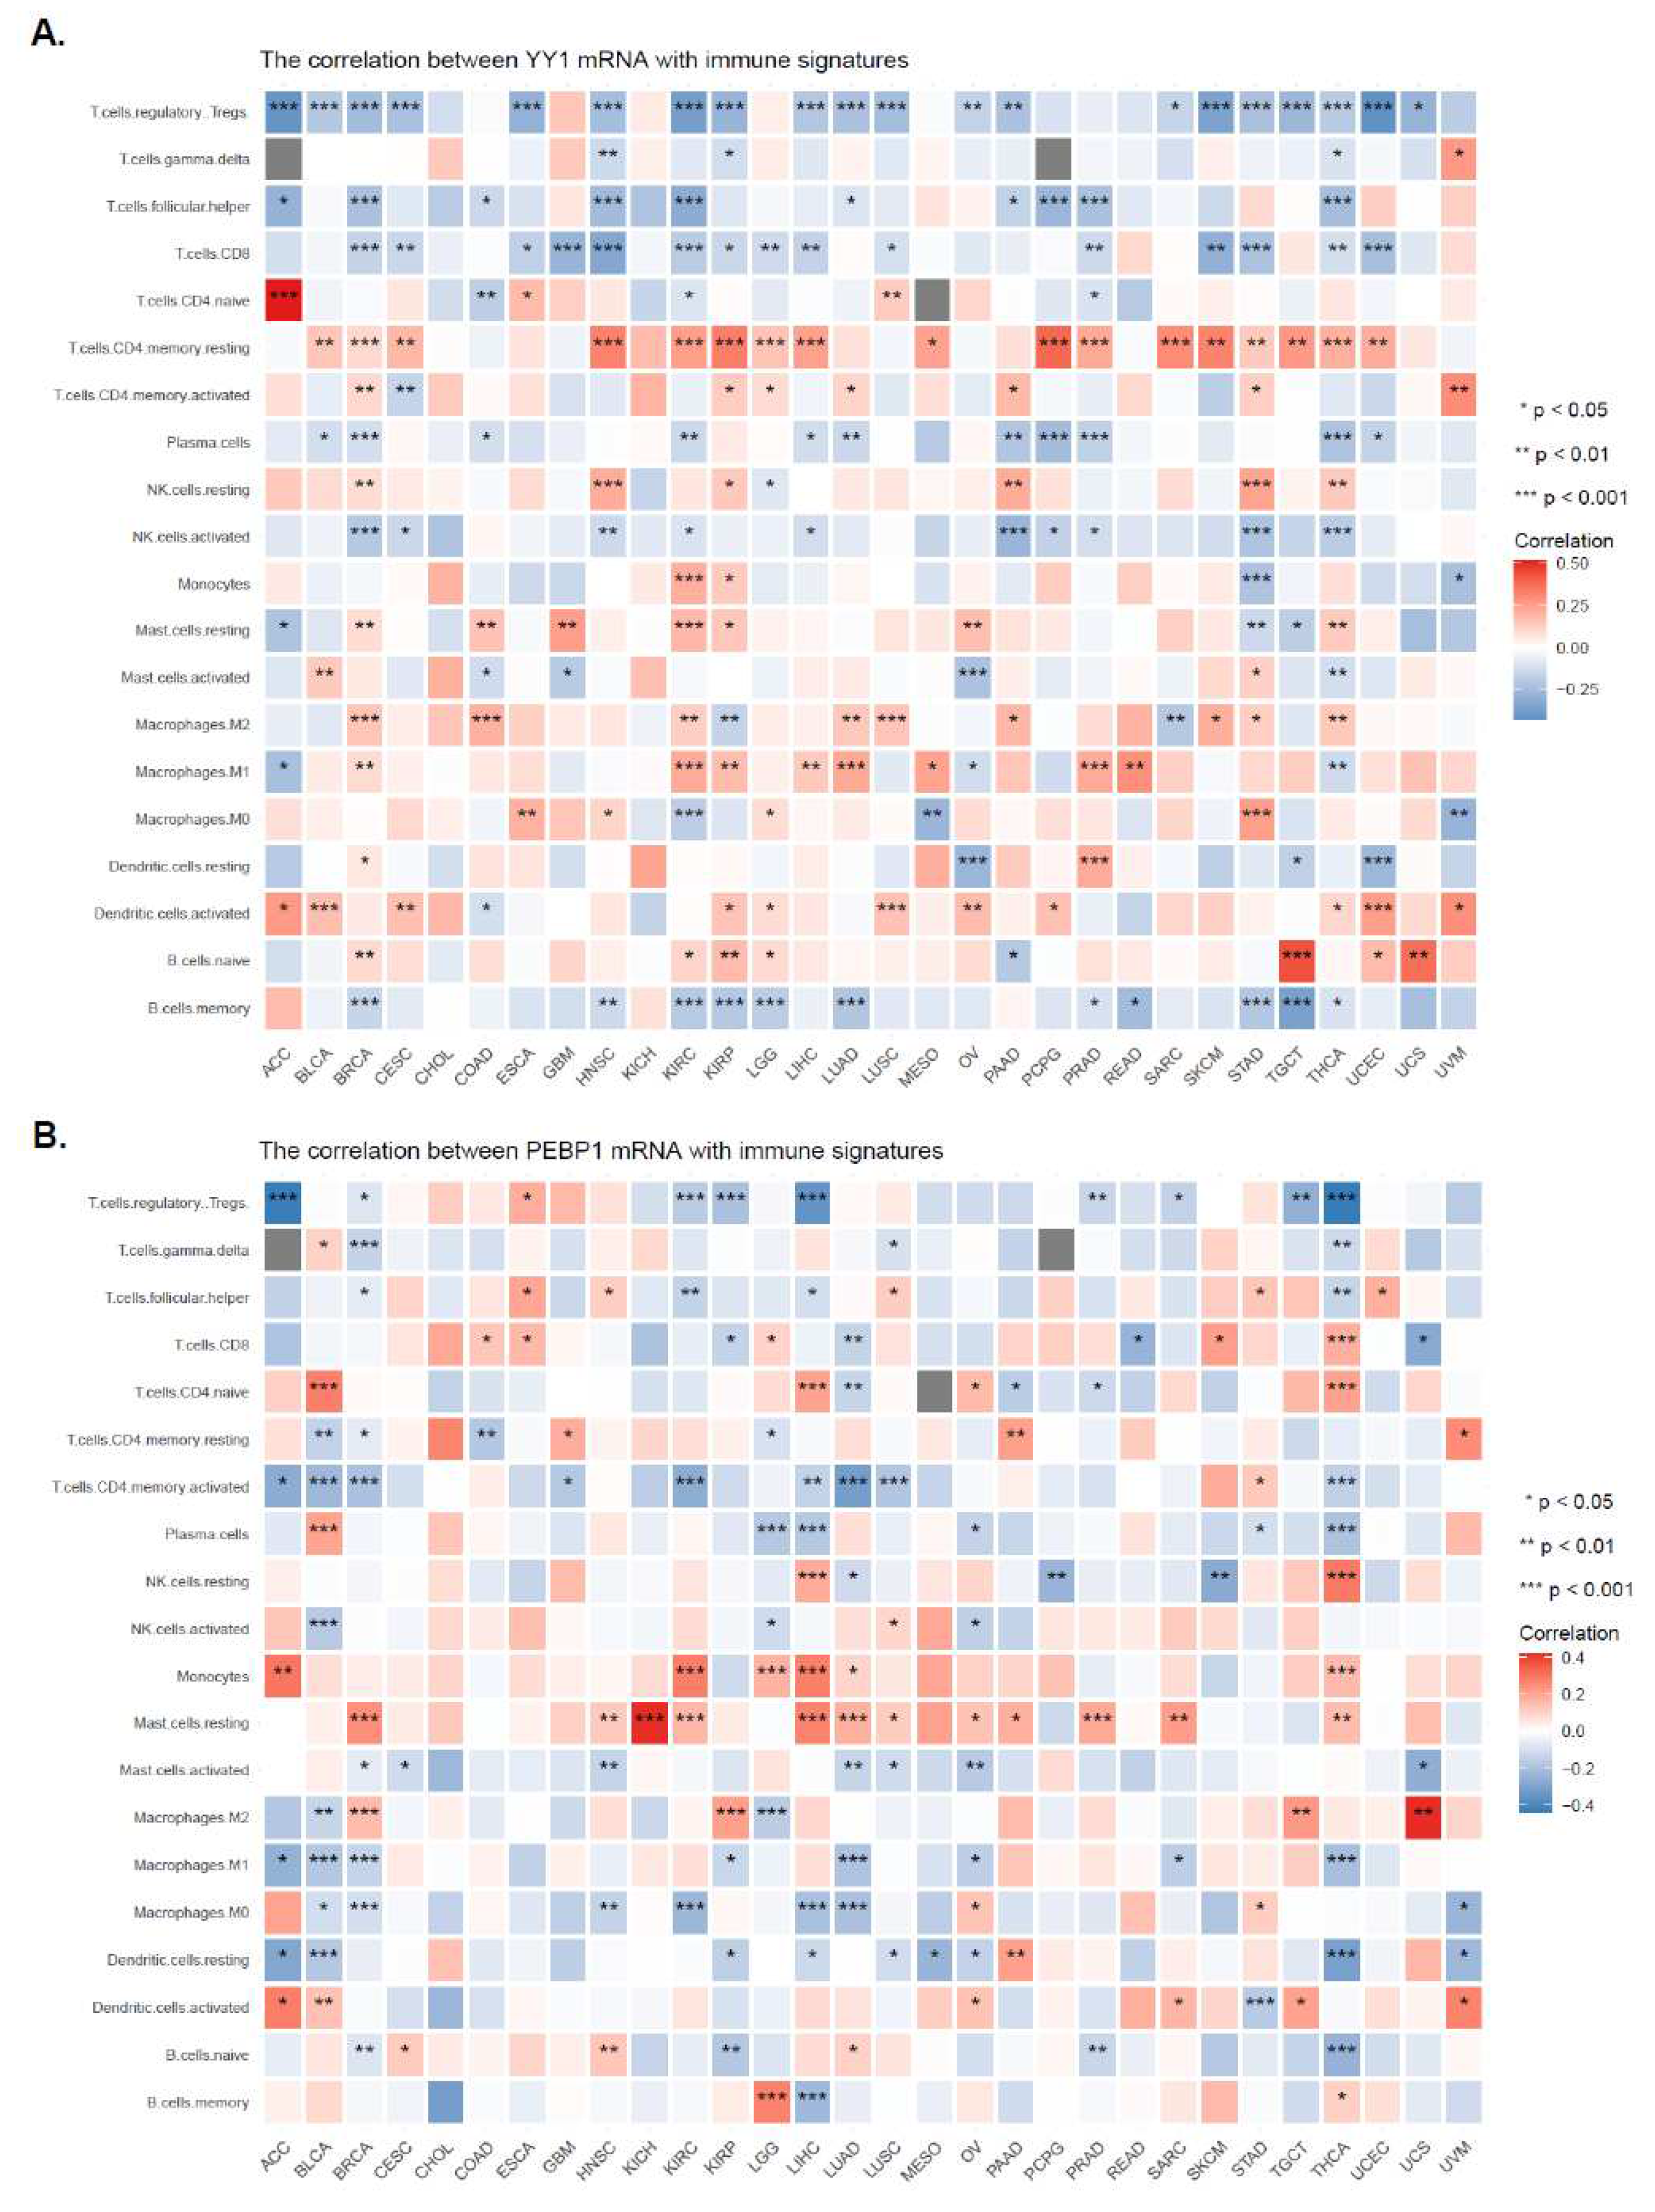
Figure 6.
The expression of YY1 (A) correlated significantly with the following immune signatures from TIMER: T cell C8+, neutrophil, dendritic cell, macrophage and B cell, pan-cancer. In contrast, PEBP1 expression was generally anti-correlated with the abundance of infiltrating immune cells. *p<0.05; **p<0.01; ***p<0.001.
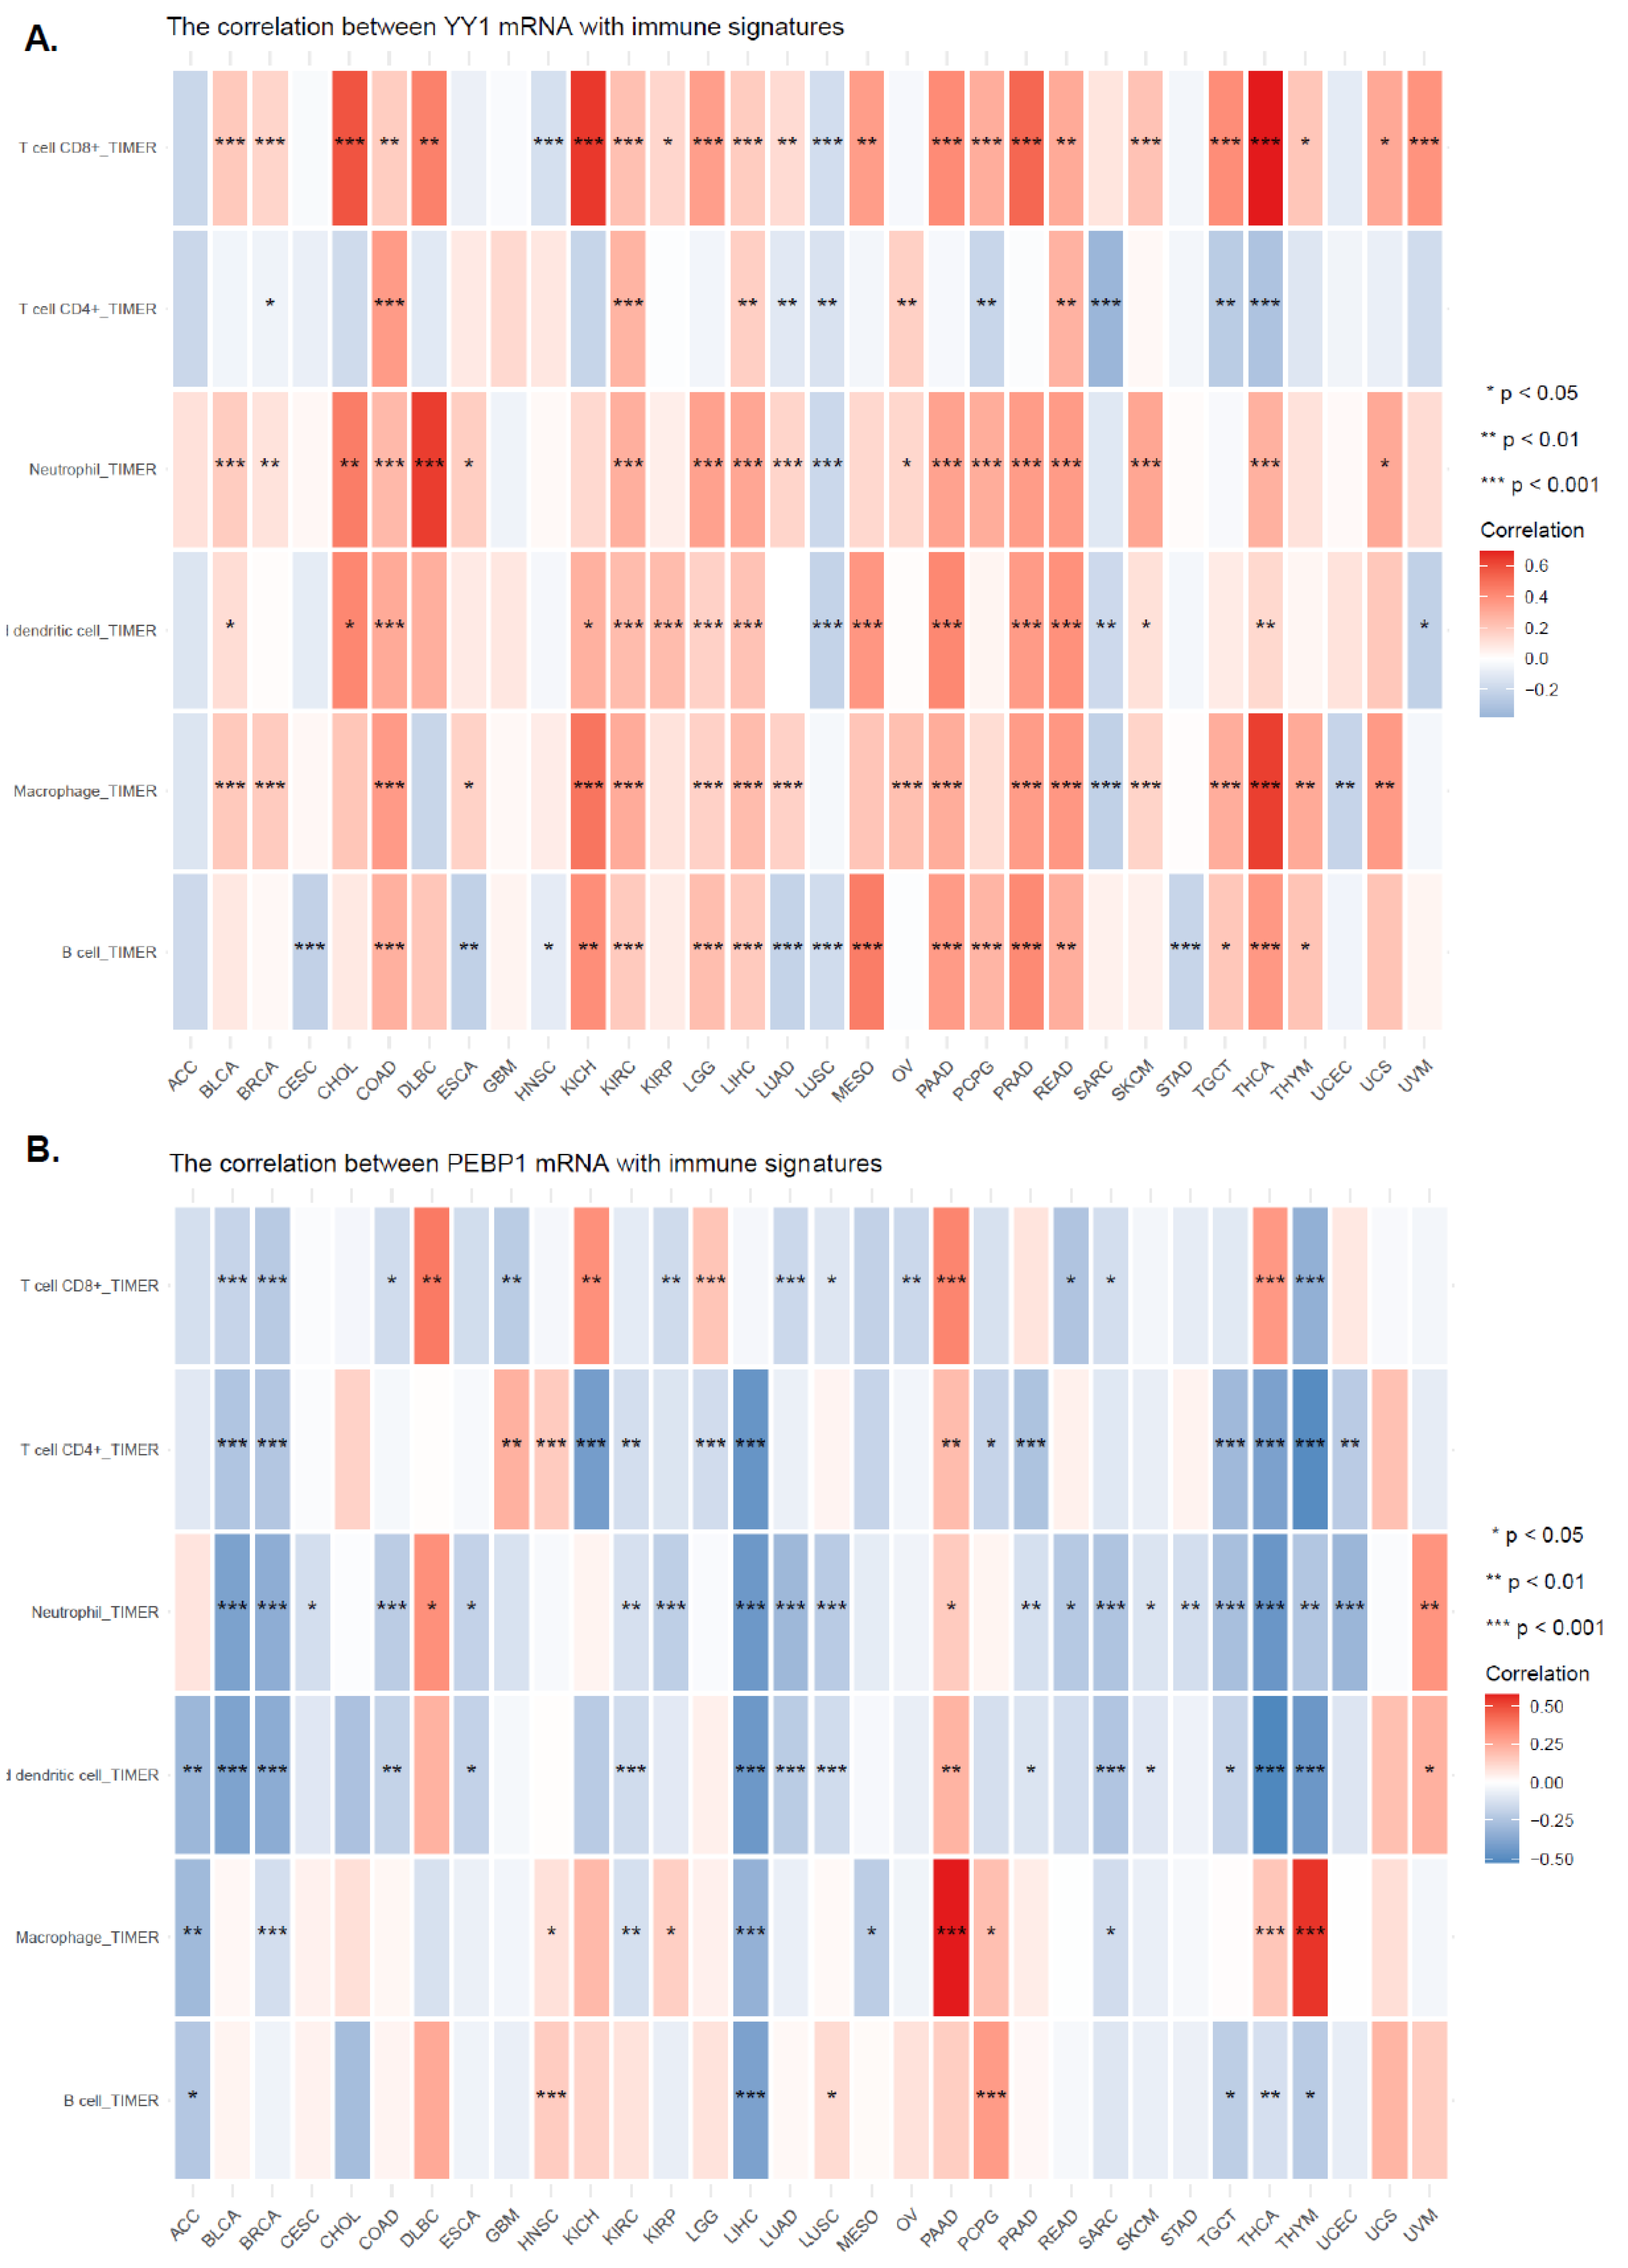
Figure 7.
The relationship between the mRNA expression of YY1 (or PEBP1) and stemness (A, D) / MSI (B, E) / TMB (C, F) of the TCGA tumors was analyzed. *p<0.05; **p<0.01; ***p<0.001.
Figure 7.
The relationship between the mRNA expression of YY1 (or PEBP1) and stemness (A, D) / MSI (B, E) / TMB (C, F) of the TCGA tumors was analyzed. *p<0.05; **p<0.01; ***p<0.001.
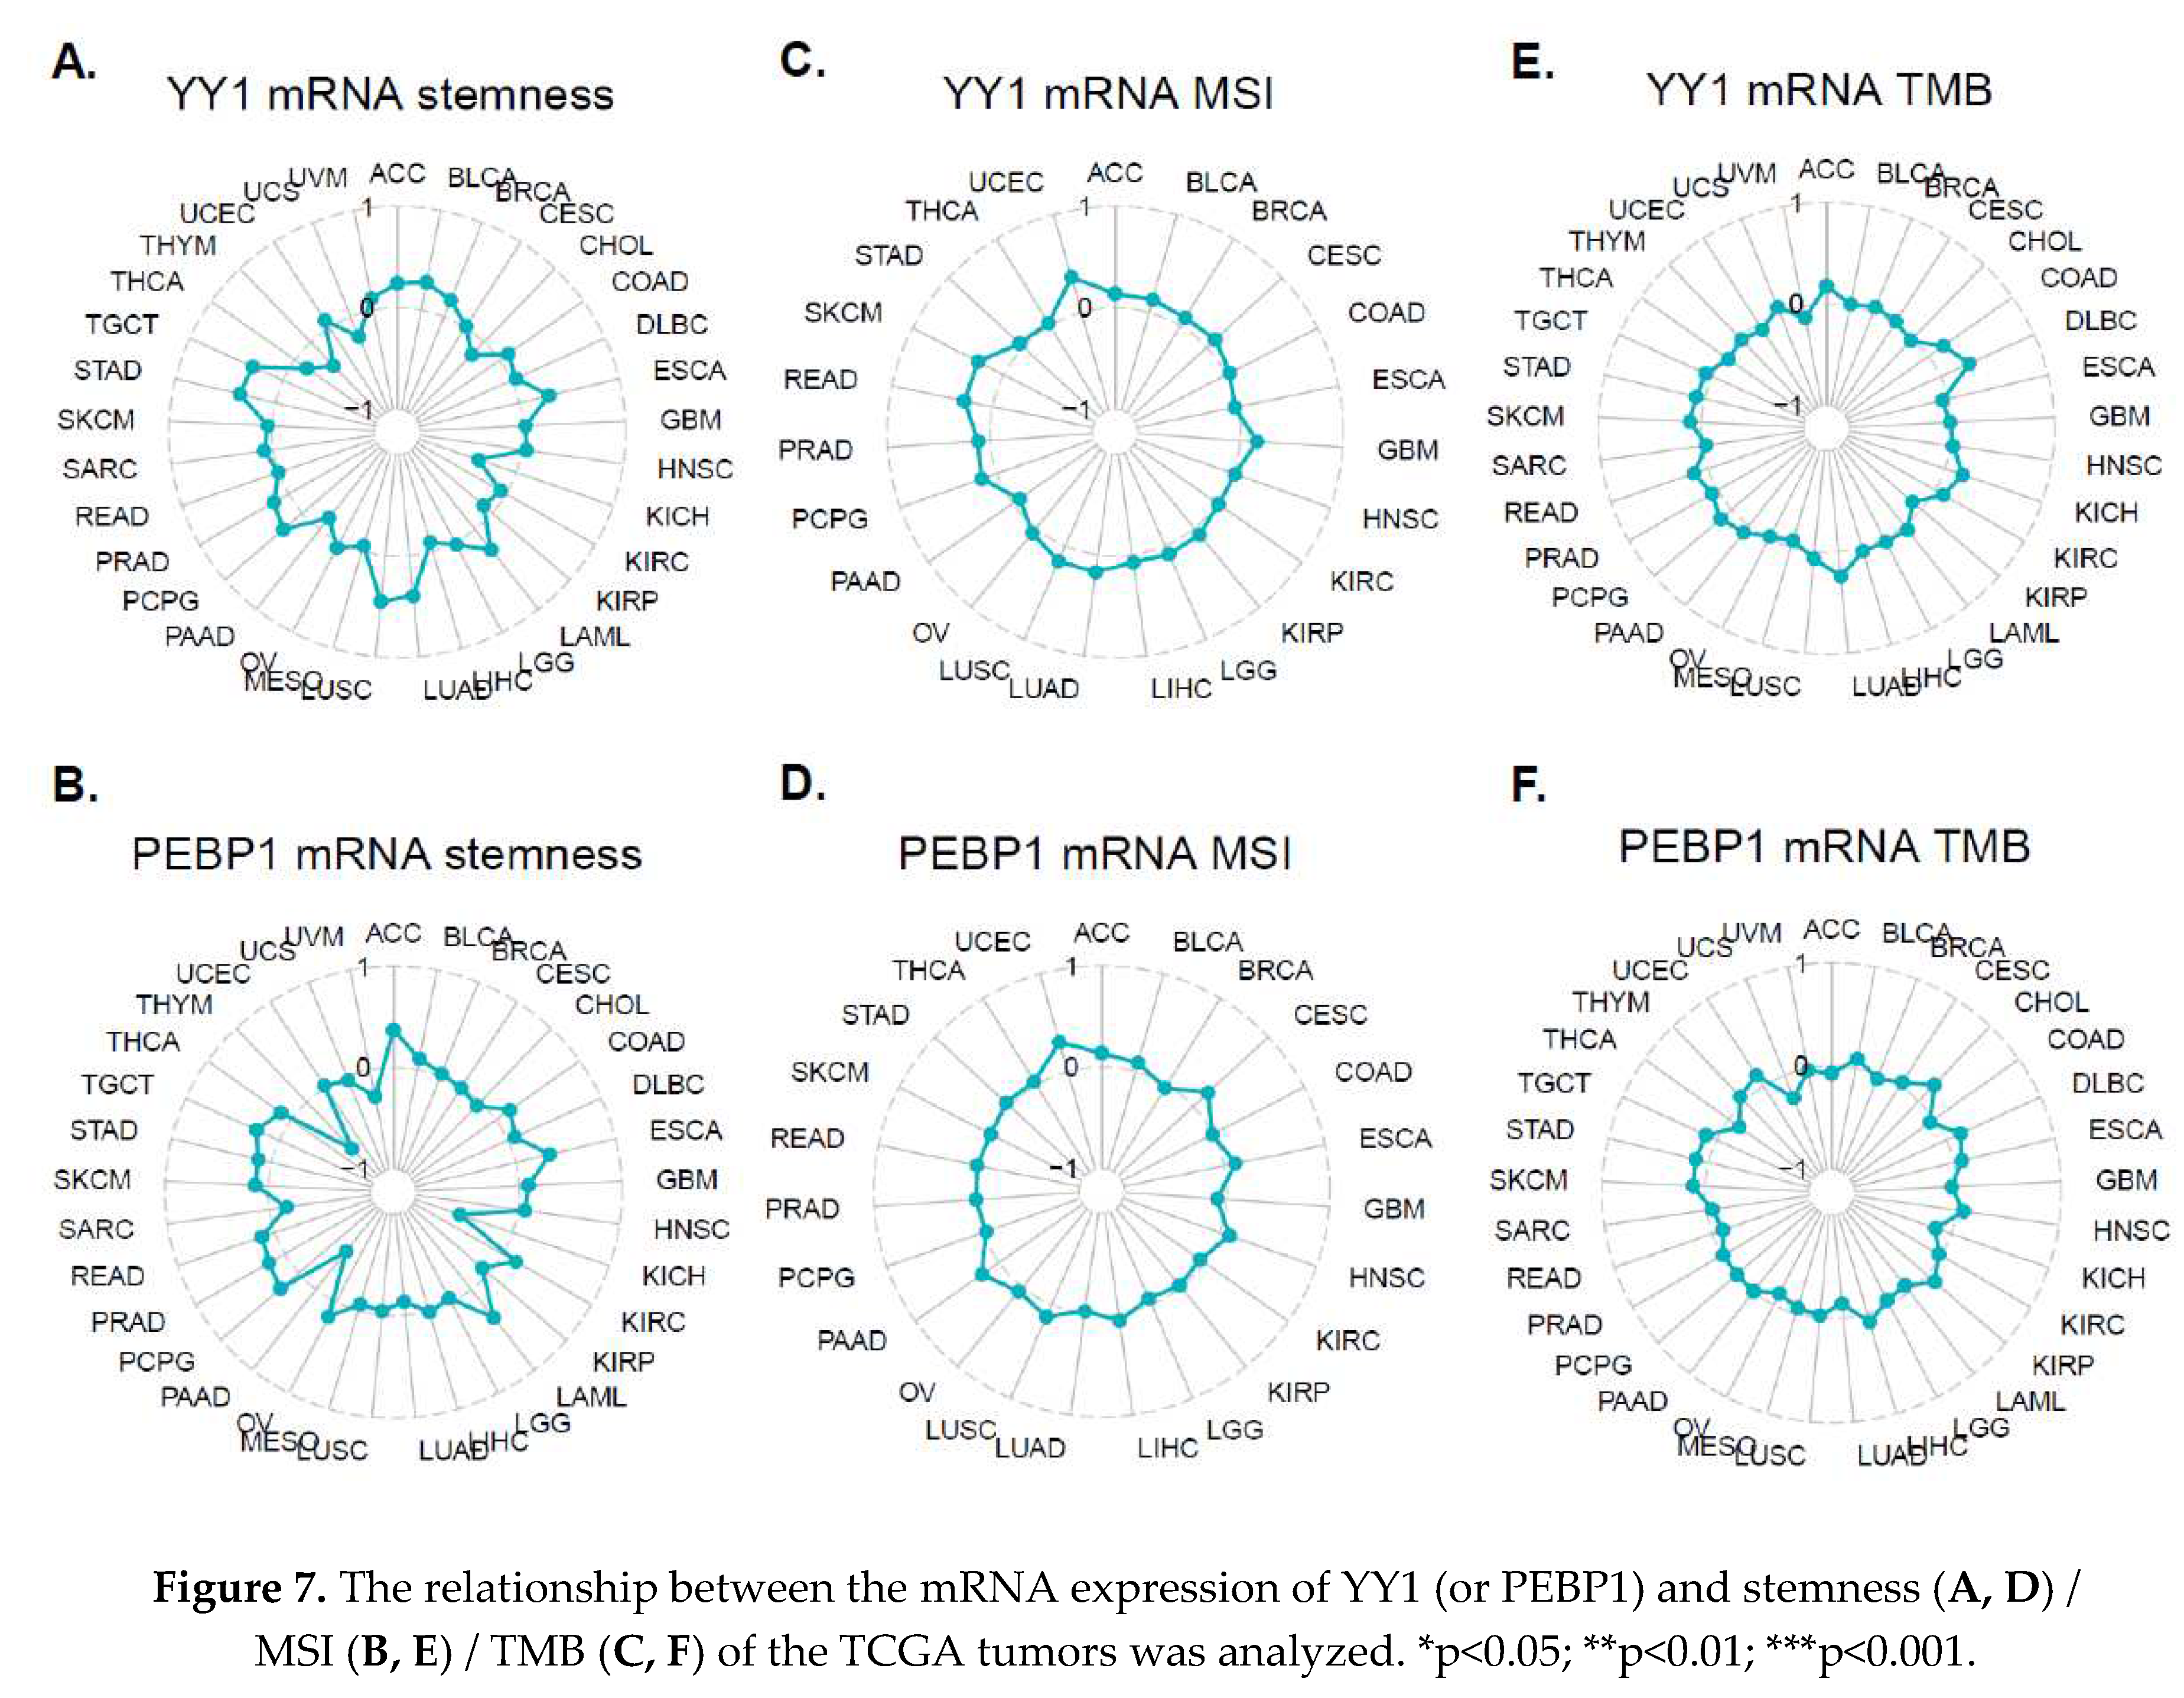
Figure 8.
YY1 and PEBP1 expression correlates with chemosensitivity in pan-cancer. We analyzed the correlation of YY1 and PEBP1 mRNA levels with GDSC (A) and CTRP (B) drug sensitivity (IC50) in pan-cancer. The color from blue to red represents the correlation between each gene's mRNA expression and IC50. The bubble size positively correlates with the FDR significance. Black outline border indicates an FDR<0.05. (C) The ROC plotter tool was used to analyze the relationship between YY1 and PEBP1 expression and sensitivity in endocrine therapy; anti-HER2 therapy and chemotherapy in breast cancer. p<0.05 was considered statistically significant. (D) Drug sensitivity analysis of YY1 and PEBP. YY1 expression was negatively associated with the drug sensitivity of Dabrafenib across blood, bowel, brain, breast, kidney, lung, ovary, prostate and skin tumors; whereas PEBP1 expression was positively associated with the drug sensitivity of dabrafenib and nutlin-3a, and negatively associated with the drug sensitivity of dasatinib, in the afore-mentioned tumor types. p<0.05 was considered statistically significant. (E) The regulator prioritization clustering heatmap revealed the association of YY1 and PEBP1 with several indicators of immunosuppression. (F) Differences in OS (and PFS) of immunotherapy patients with high and low YY1 (or PEBP1) expression.
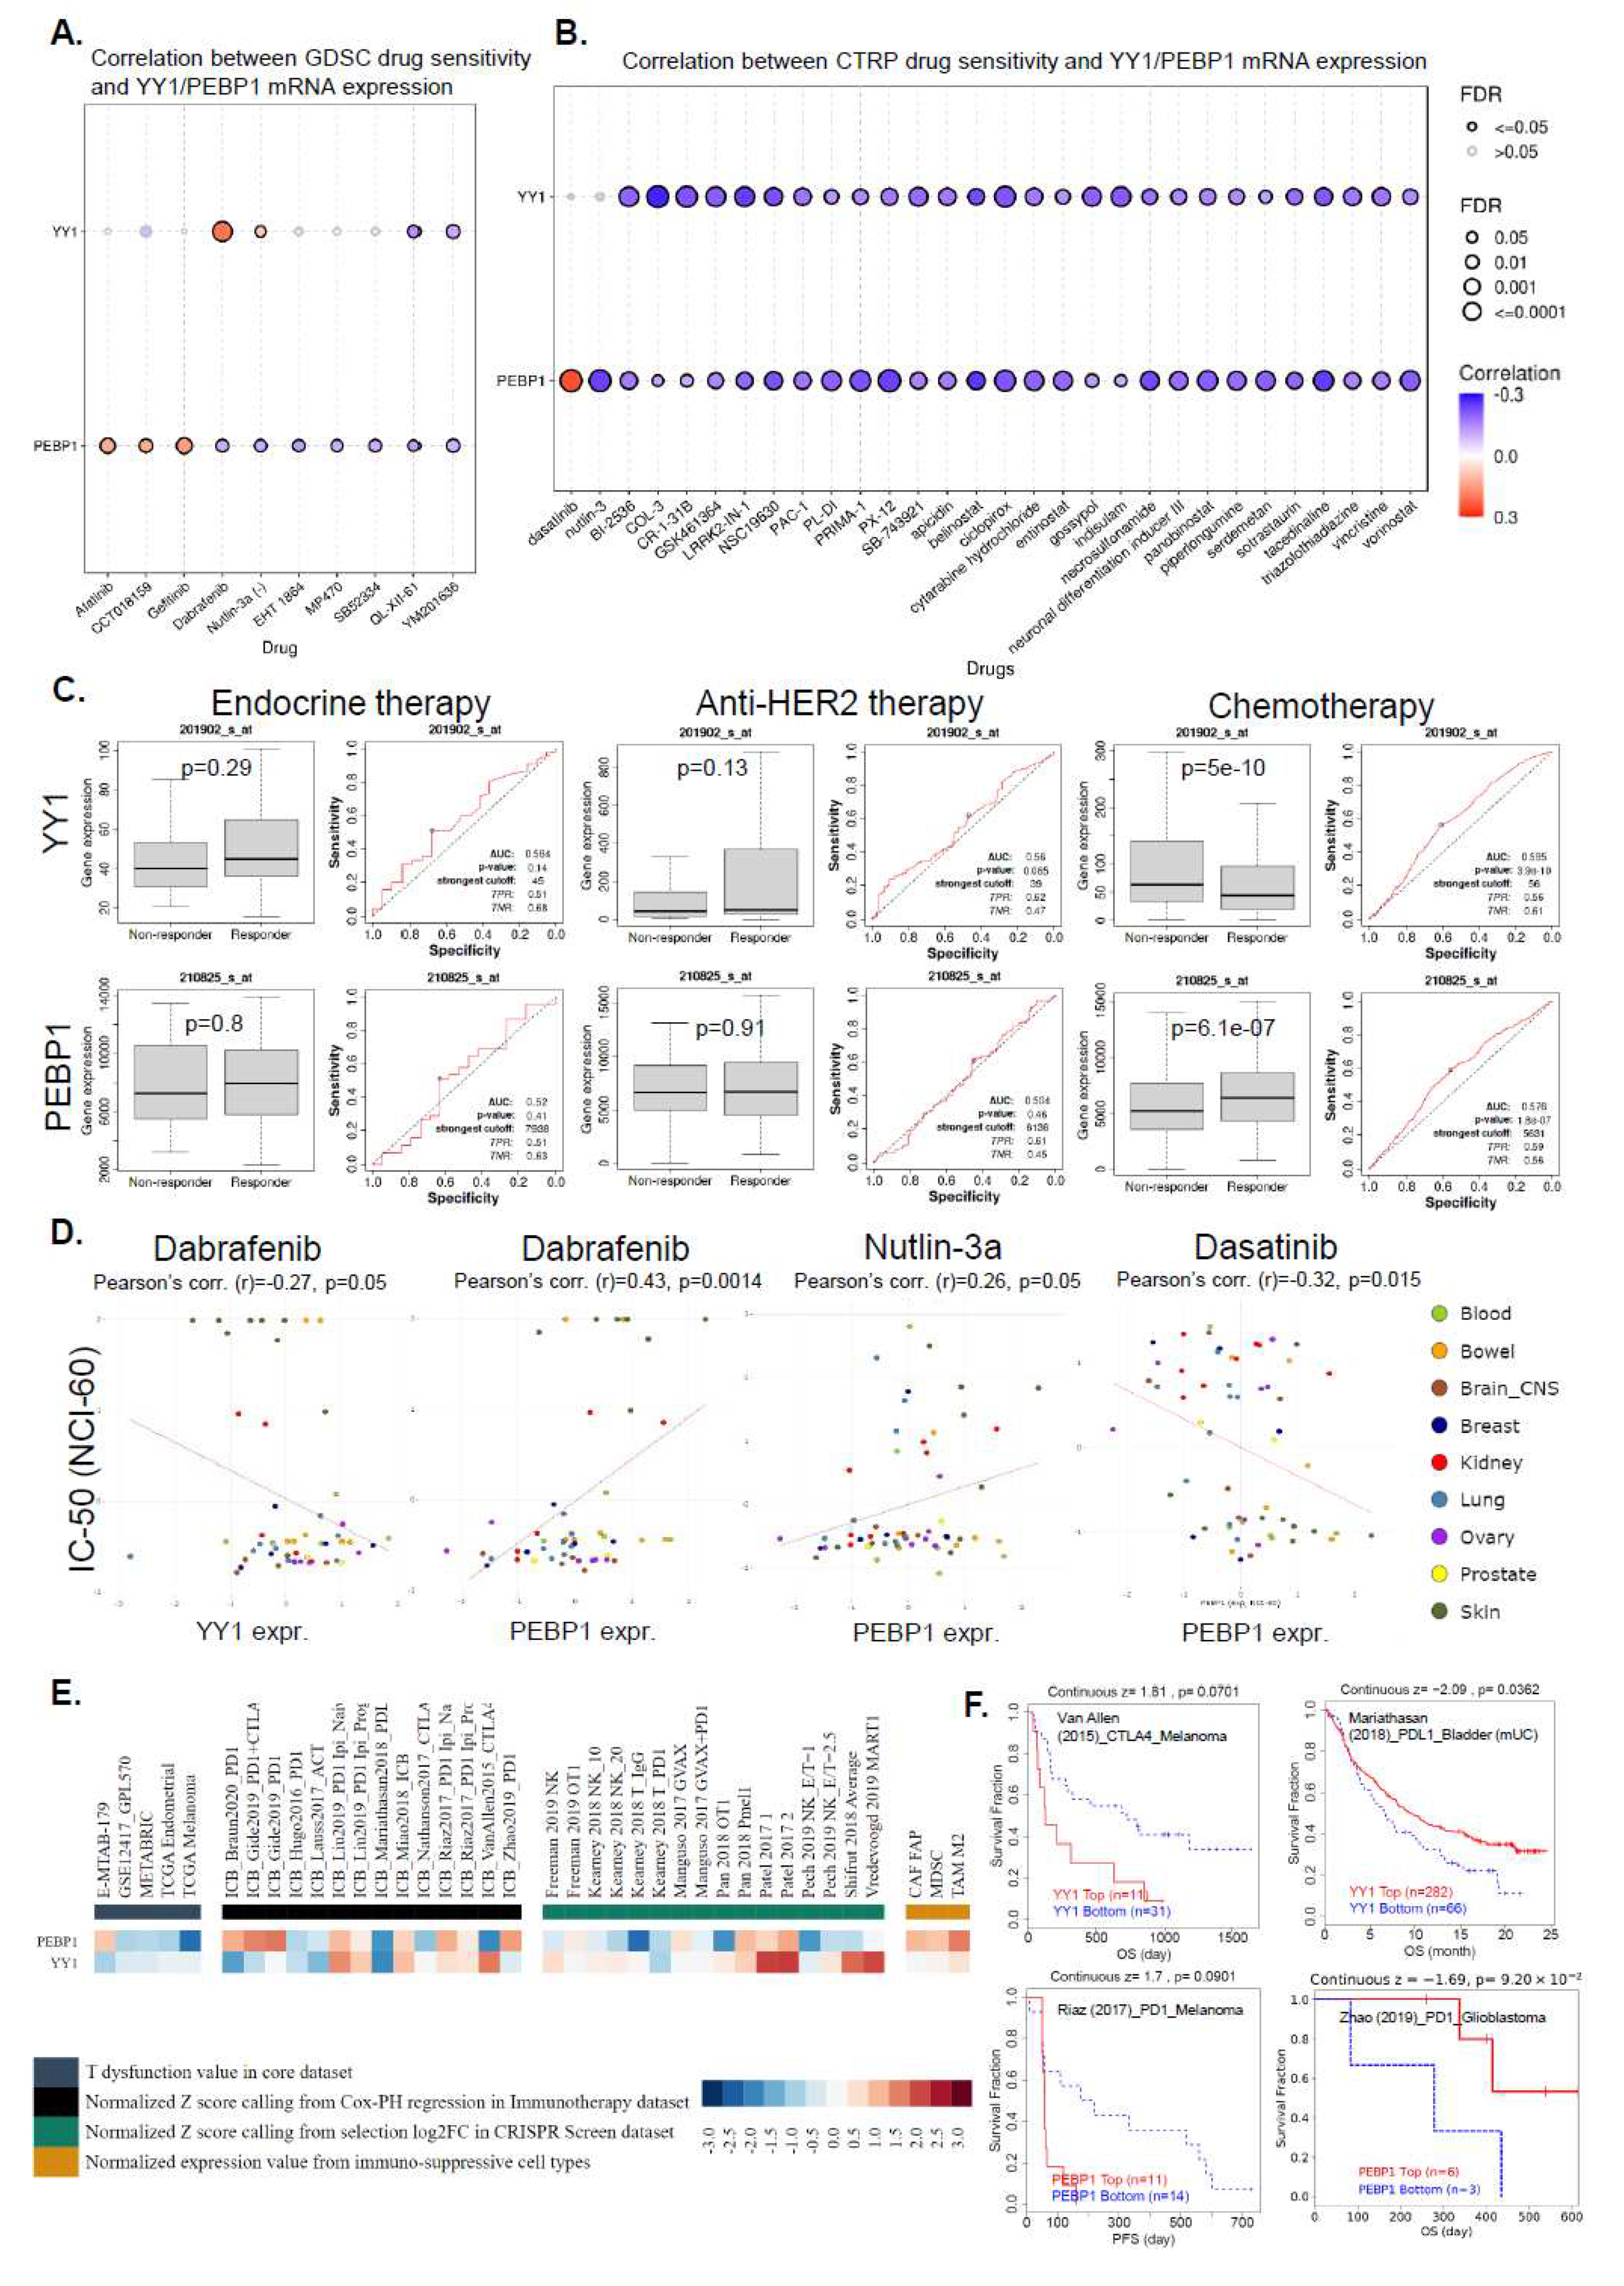
Disclaimer/Publisher’s Note: The statements, opinions and data contained in all publications are solely those of the individual author(s) and contributor(s) and not of MDPI and/or the editor(s). MDPI and/or the editor(s) disclaim responsibility for any injury to people or property resulting from any ideas, methods, instructions or products referred to in the content. |
© 2023 by the authors. Licensee MDPI, Basel, Switzerland. This article is an open access article distributed under the terms and conditions of the Creative Commons Attribution (CC BY) license (http://creativecommons.org/licenses/by/4.0/).
Copyright: This open access article is published under a Creative Commons CC BY 4.0 license, which permit the free download, distribution, and reuse, provided that the author and preprint are cited in any reuse.


