
Submitted:
04 September 2023
Posted:
06 September 2023
You are already at the latest version
Abstract
The performance and lifespan of cutting tools are significantly influenced by their surface quality. The present report highlights recent advances in enhancing the surface characteristics of tungsten carbide and high-speed steel cutting tools using a novel micro-machining technique for polishing and edge-honing. Notably, the main aim is to reduce the surface roughness while maintaining the hardness of the materials at an optimal level. By conducting a thorough analysis, of surfaces obtained with different techniques. It was that micro-machining method effectively decreased the surface roughness of the cutting tools, most effectively of the techniques investigated. Significantly, the surface roughness is reduced from an initial measurement of 400 nm to an impressive value of 60 nm. No significant change in hardness was observed, which guarantees the maintenance of the mechanical properties of the cutting tools. This analysis enhances the comprehension of surface enhancement methodologies for cutting tools through the presentation of these findings. The observed decrease in surface roughness, along with the consistent hardness, exhibits potential for improving tool performance. These enhancements possess the capacity to optimise manufacturing processes, increase tool reliability, and minimise waste generation.
Keywords:
micro machining
; cutting tools
; tungsten carbide
; high speed steels
; surface roughness
; surface finish
; edge preparation
1. Introduction
Cutting tools have played a crucial role in numerous manufacturing sectors, facilitating the manipulation, processing, and refinement of a wide range of materials. The composition and technological methods utilised in the manufacturing and finishing processes of these tools have a significant impact on their quality, efficiency, and durability. The materials of high-speed steels (HSS) and tungsten carbides (WC) have garnered significant attention in this field due to their notable contributions to the cutting tool industry. The alloy known as HSS consists of tungsten, chromium, molybdenum, vanadium, and occasionally cobalt. It exhibits exceptional wear resistance and retains its hardness even when exposed to high temperatures, rendering it suitable for a wide array of applications.1 Tungsten carbides, when incorporated into composite materials alongside cobalt or nickel as a binding agent, exhibit remarkable hardness and resistance to abrasion.2 As a result, they have become indispensable in the realm of machining, particularly for tasks that require high levels of performance and durability.3–5
To meet the expectations of the most demanding customers, cutting tools must possess optimal mechanical properties, such as high toughness, hot hardness, and wear resistance. One of the ways to enhance these mechanical properties of the tools and improve the surface quality of the machined components is to carefully control the surface topography and nose radius of the cutting edge of the tool, and then application of a suitable hard coatings, which improves the tool's workability. For instance, HSS and WC cutting tools can be coated with different nitrides, such as titanium nitride and its derivatives, to increase wear resistance and anti-corrosion ability enhancing the tribological compatibility within the cutting tool/workpiece system.6,7 To maximize the benefits of coatings, the tool surface must undergo pre-treatment through surface finishing techniques, which can eliminate defects, reduce roughness, and enhance the tool's quality and performance.8
Micro-machining has become a crucial technique in the field of surface finishing, as it provides a means to achieve precise manipulation of surface topography and facilitates the elimination of material at a micro or nano-scale. Methods such as micro-grinding, micro-milling, and micro-polishing are employed to modify surface structure of the tools to achieve a well-defined cutting edge, and reduce any defects that can significantly affect performance.9,10 Within the cutting tool industry, a variety of surface treatment methods with suitable machining parameters have been developed and implemented over an extended period of time.11 The aforementioned processes can be categorised into three distinct approaches: mechanical, chemical, and electrochemical. Mechanical techniques, including grinding, honing, and lapping, have been widely employed due to their ability to effectively eliminate substantial amounts of material, diminish surface roughness, and establish distinct surface characteristics. Chemical methodologies such as etching, pickling, and passivation have demonstrated enhanced efficacy in the elimination of surface impurities and the enhancement of surface quality. Electrochemical techniques, such as electro-polishing and electrochemical grinding, are commonly used due to their inherent attributes of precision and accuracy in generating a refined and uniform surface texture. Aside from that, an ultrashort laser-induced source could be implemented to tailor the surface properties, resulting in the significant impact on the microtextures on these ultrahard materials.12
The evaluation of the efficacy of a specific surface finishing procedure can be conducted in terms of surface roughness. Surface roughness is a term used to describe the deviations from a smooth surface that occur as a result of the machining process.13,14 These abnormalities can have a notable impact on the performance of the tool being used. The average roughness (Ra) is the predominant measure employed for assessing surface roughness. It is determined by calculating the arithmetic mean of peak height (Rp) and valley depth (Rv). The term "Rq" denotes the root-mean-square roughness of the Rp and Rv values. Rt is defined as the overall height of the roughness profile, encompassing the disparity between the height of the highest peak Rp and the depth of the deepest valley within the specified evaluation length. On the other hand, Rz represents the maximum height of the roughness profile, calculated by summing the absolute values of the heights of the highest-profile peaks and the depths of the deepest valleys within the evaluation length. Hence, it is imperative to ascertain the suitable surface finishing methodology that would provide the intended surface roughness and augment the efficacy of the tool. The significance of this matter is particularly pronounced in the contemporary competitive landscape of the sector, wherein producers make considerable efforts to provide the highest quality products that meet customers’ preferences and requirements.
Through the implementation of appropriate surface finishing processes, manufacturers have the ability to enhance the quality and visual appeal of their cutting tools. This, in turn, increases productivity, decreases energy consumption, and produces high-quality products. Also, the substrate's final topography and residual stresses are affected by the edge preparation performed prior to the coating process. Numerous studies demonstrate the benefits of edge preparation of cutting tools regardless of their cutting operations.15 Based on these findings, it is clear that proper preparation of the cutting edge will improve cutting performance by increasing the mechanical strength and stability of the cutting edge. Pre-treatment improves the tool's wear resistance by enhancing its mechanical strength and decreasing the likelihood of chipping and first crack formation along the edge. In addition, cutting edge preparation affects adhesion strength, therefore a smooth cutting-edge surface facilitates coating application. The ideal cutting edge form for a given machining process depends on the machining conditions as well as the characteristics of the tool and the material being machined or precisely micro-machined.16
In this study, we investigate the surface morphological, elemental, and mechanical properties of raw and micro-machined HSS and WC tools. By examining the micro-machined tool surface integrity, we aim to gain a better understanding of the polishing mechanism and how it might assist the improvement of tool performance.
2. Materials & Methods
The cutting tools employed in this investigation comprised two distinct materials: HSS and WC, both of which are provided by Sutton Tools (Australia). These tools' surfaces were refined employing a proprietary micro machining process, the details of which are kept confidential due to industry partner restrictions. Prior to further micro-structure analysis, the tool samples were cross-sectioned into shorter slides with a length of 5 mm and cold-mounted with epoxy resin. Depending on the analysis technique, the mounted samples were then ground using SiC #220 to #1200 grinding sandpapers and DiaPro diamond suspensions supplied by Struer.
Optical images were captured on the DSX1000 digital microscopes with 20x Olympus lens. The Zeiss Supra 40 VP FE-SEM was utilised for the Scanning Electron Microscopy (SEM) analysis, specifically for the characterisation of rod samples in this study. The rods were being subjected to both longitudinal and transverse cutting techniques, and the resultant transparencies were being cleansed using deionized water and acetone. The transparencies that have been washed and sliced were subsequently attached to a copper substrate using carbon adhesive. The field emission scanning electron microscopy (SEM) analysis of high-speed steel was performed using a beam of 5 kV, whereas the characterisation of tungsten carbide was carried out at 10 kV. The energy dispersive X-ray spectroscopy (EDX) technique was utilised to analyse both sample materials, employing a voltage of 20 kV and taking approximately 3 minutes per scan and 5 relocating scans per spot.
A 3D profilometer is a surface measurement instrument that utilises non-contact methods to provide a highly accurate and precise representation of surface topography in three dimensions. To obtain accurate and precise measurements, the surface of the sample was initially subjected to a cleaning process in an ultrasonication bath, using a combination of deionized (DI) water and acetone. The cleansing procedure facilitates the elimination of contaminants and the establishment of a consistent surface for subsequent examination. The surface of the sample was subsequently analysed using a Bruker ContourGT-X 3D Optical Profiler in VSI mode, with a magnification of 50x. The roughness data was subsequently analysed using the Vision84 software, which adheres to the ISO 4288 standard. The purpose of this standard is to establish a set of guidelines for the measurement and assessment of surface roughness metrics. These guidelines aim to promote uniformity and precision in measurements conducted by different devices and operators. A set of ten random measurements were performed for each sample to obtain statistically significant results, with the roughness and standard deviation subsequently computed. The calculation of average roughness for certain samples can be conducted by performing a scan over an area of 0.5x0.5mm in stitching mode. The utilisation of the stitching mode facilitates the achievement of a comprehensive and precise representation of surface intricacy.
The Duramin-40 Hardness Tester is a Vickers microhardness testing instrument. It is equipped with a diamond indenter that allows precise loads of 300 gf for both HSS and WC to be applied, dwell time of 10s as well as a high-resolution camera that can capture images of the indents for subsequent analysis. The machine is also furnished with Duramin software that calculates hardness values automatically based on the size of the indentations.
3. Results & Discussion
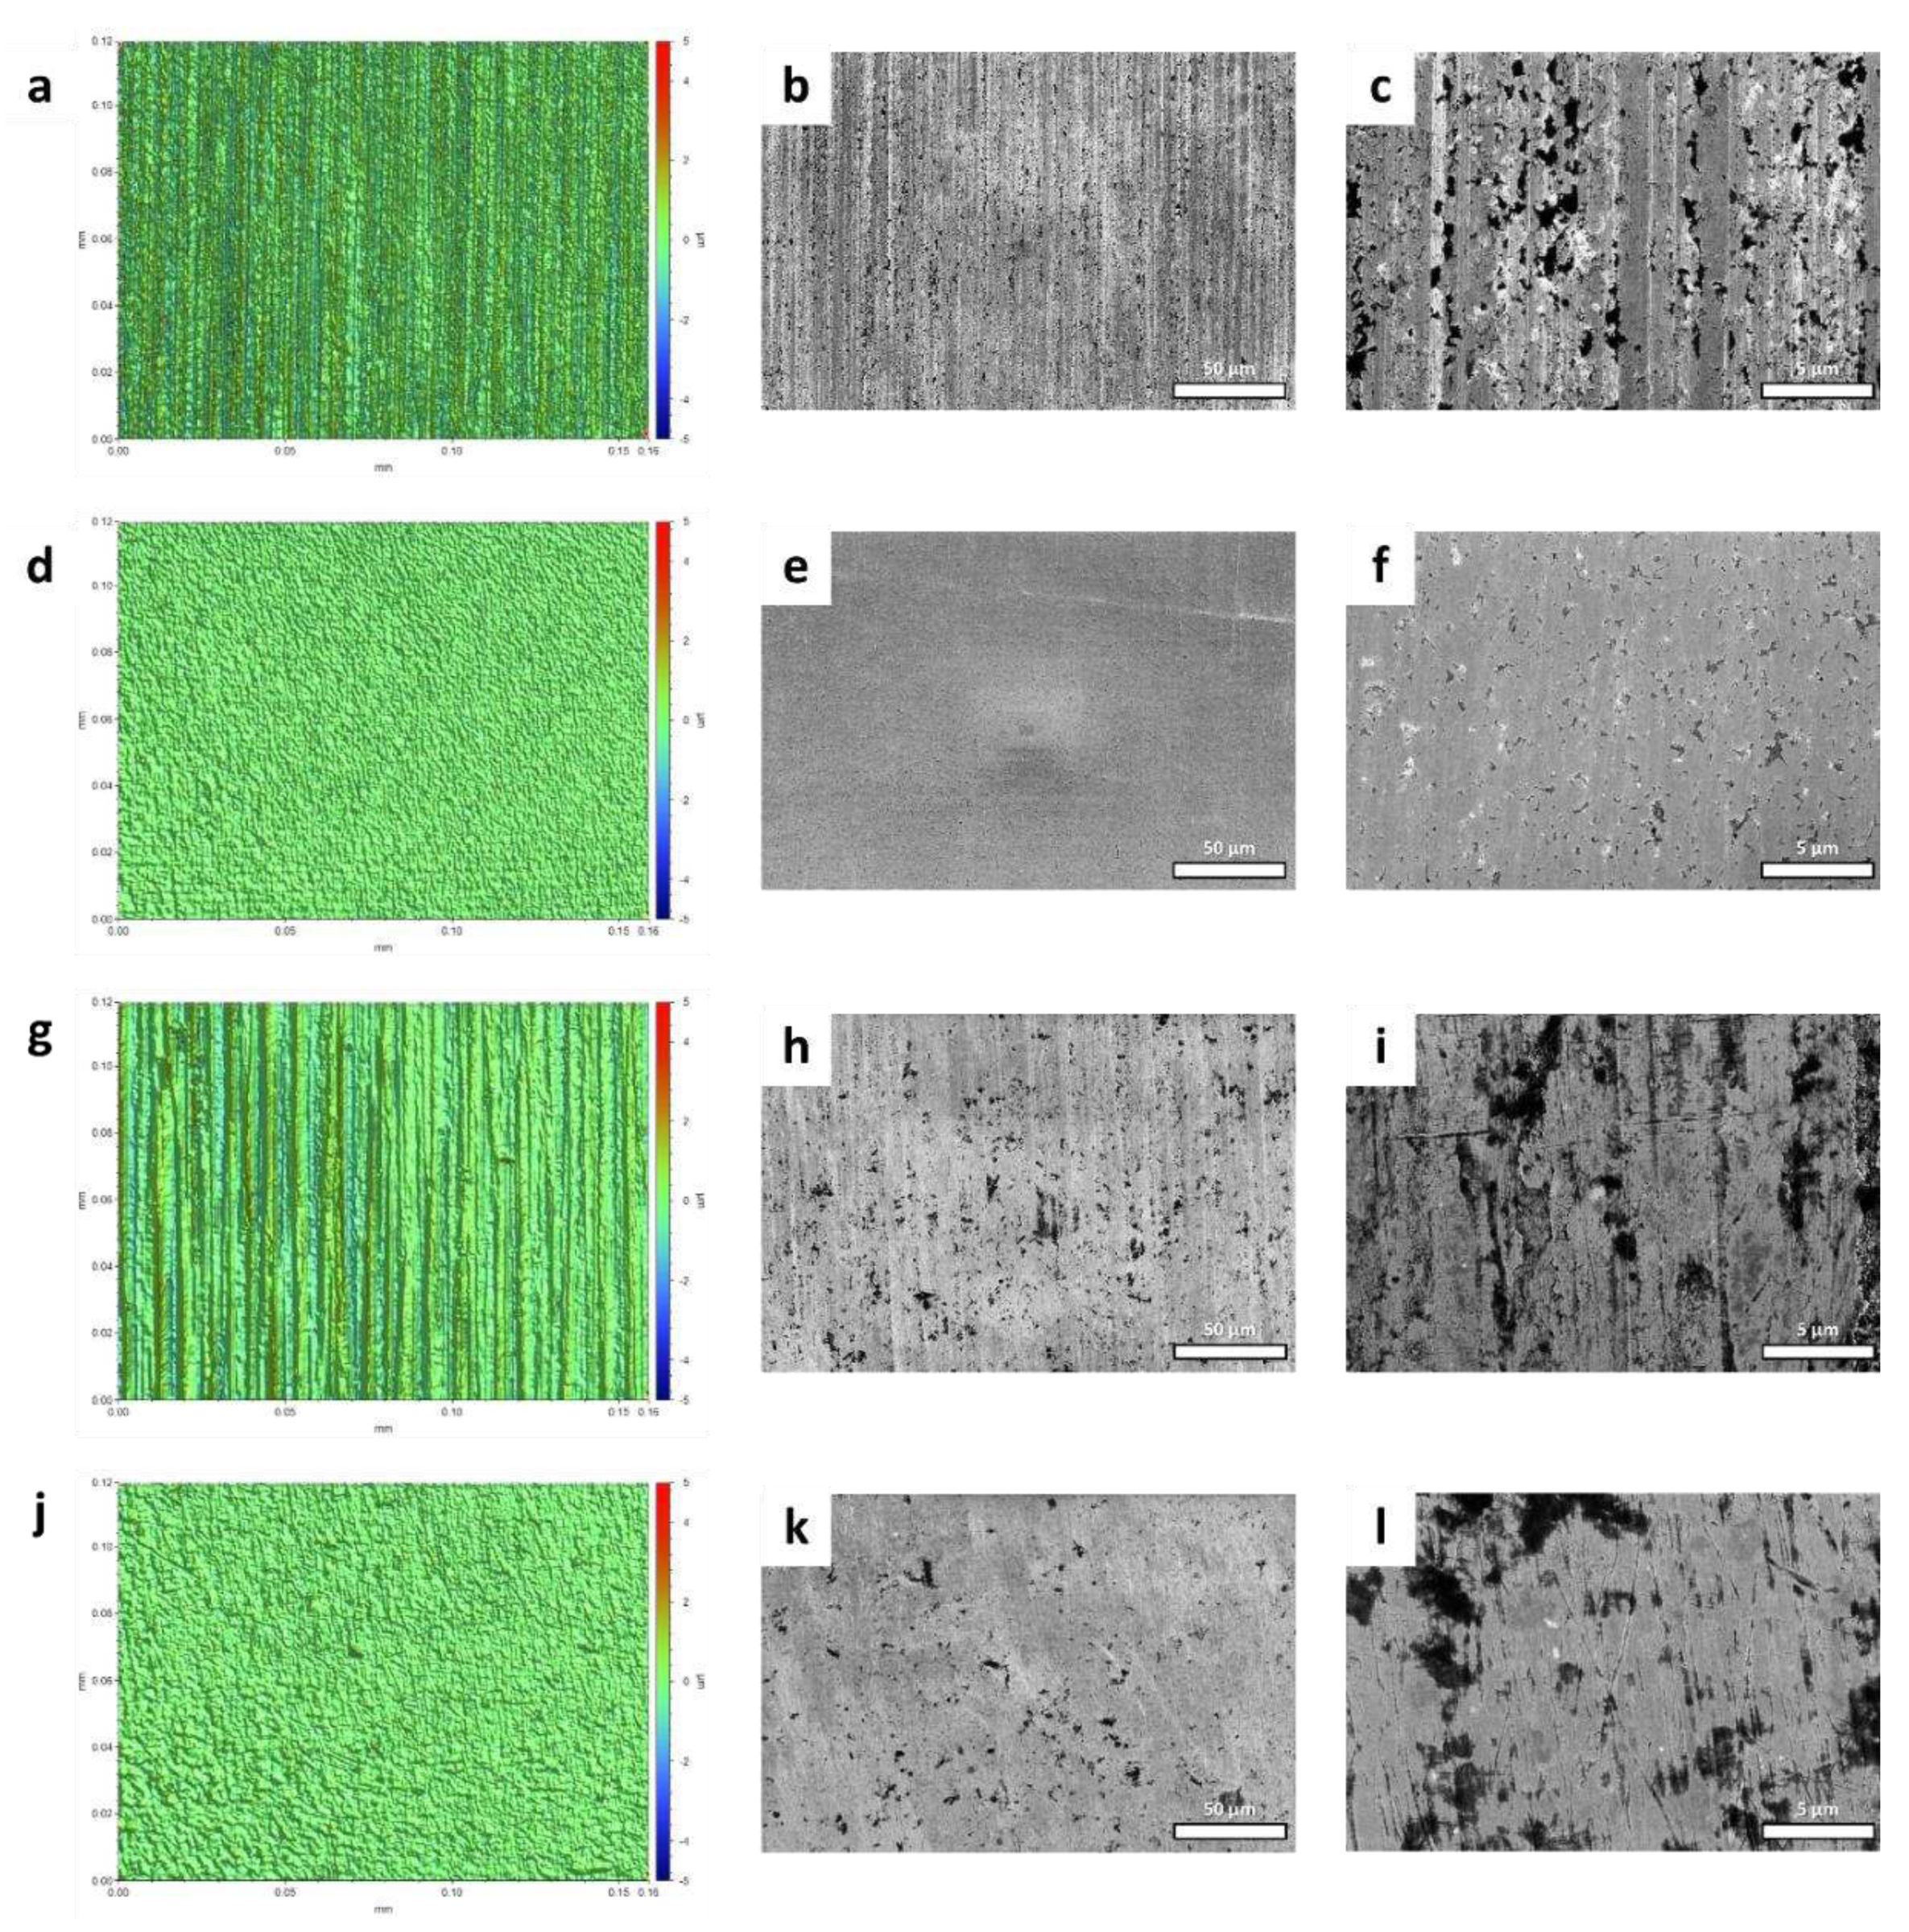
Preliminary examinations were performed on the micro-machined HSS sample at the unpolished-polished transition zone (UPTZ) utilising different microscopy analyses. The unpolished section exhibited discernible grinding lines, which are commonly associated with CNC production methods. Additionally, the presence of holes and burrs was detected in the SEM and optical microscopy (Figure 1a-c). In sharp contrast, the defects were conspicuously lacking in the polished area. The visual evaluation readily discerns the heightened reflection and gloss of the polished segment in contrast to its unpolished counterpart. The results of quantitative assessments on surface roughness demonstrate a notable decrease following the micro-machining process. The utilisation of 3D profilometer investigations provided confirmation of the improved surface quality, thereby demonstrating an extraordinarily low roughness value that extends to the nanoscale (Figure 1d). Nevertheless, there were still detectable tiny surface defects on the polished surface. Following the process of micro-machining, the distribution of roughness values exhibited a greater degree of homogeneity, characterised by a mean value below 60 nm and a standard deviation of 5 nm. In comparison, the pre-machining roughness exhibited a mean value of around 300 nm, accompanied by a standard deviation of 30 nm. Significantly, the Rz value exhibited a noticeable decrease from around 10 µm to a mere 2 µm, while consistently maintaining a stable standard deviation (Figure 3a, d). The grinding texture has diminished noticeably, and concurrently, the hole size has reduced across the entire polished region, as evident in the resulted photos (Figure 3b, c, e, f). These visual observations corroborate the roughness data presented in the graph. The data presented indicates that the micro-machining procedure successfully decreased the maximum heights while simultaneously increasing the depths on the surface of the tool (Figure 1e). It is noteworthy that the micro-hardness exhibited a very consistent trend, showing just a slight rise of around 11% following the micro-machining process (Figure 1f). The potential cause of this phenomenon might be ascribed to the removal of the grinding-burn layer, which is a common side-effect of the CNC procedure.17 The micro-machining technique appears to have removed the outer layer, which had a deceptively softer texture, revealing the essentially tougher structure of the underlying high-speed steel core.
Similar to the observations made on the high-speed steel, the tungsten carbide sample displays noticeable visual changes resulting from the micro-machining process (Figure 2b). These changes are evident in the form of a more pronounced and darker coloration in the polished area, highlighting the different reactions of various materials to comparable mechanical interventions. Significantly, although the grinding lines exhibit a noticeable reduction, they are not completely eradicated, so emphasising the distinction between the prominent, more profound grinding textures and the more delicate, superficial textures: the former endure, while the latter are meticulously refined. The intricate behaviour seen can be ascribed to the intricate microstructural composition of tungsten carbide. Carbides, renowned for their intrinsic ceramic nature, have a structure commonly composed of cemented binders, such as cobalt (Co), intricately dispersed amid tungsten (W) particles. The incorporation of a composite structure confers distinct mechanical and chemical properties to the material. In contrast to the generally uniform HSS matrix, the WC framework, either ultra-fine or extra-coarse type, poses difficulties when exposed to procedures that may result in cobalt leaching. During the process of leaching, the resulting voids remain unfilled and might expand due to the inherent nature of the ceramic matrix.18 The process of micro-machining has been observed to worsen cobalt depletion, resulting in the displacement or migration of nearby tungsten particles as well as the creation of voids in the binder material, while simultaneously improving the surface texture. The observed morphological progression, when examined through a mechanical lens, leads to a measurable decrease of approximately 20% in the hardness of the polished region (Figure 2f). This reduction indicates the presence of inherent microscopic alterations caused by the process of micro-machining. From a topological perspective, it can be observed that post-machining valleys have increased depth, while peaks are reduced in magnitude. This is evidenced by a significant decrease in the Rz value from 8.5 µm to 1.5 µm, as well as a decrease in Ra from 396 nm to about 63.7 nm (Figure 3g, j). The aforementioned changes are accompanied by a decrease in the standard deviation from 13.8 nm to 9.9 nm in average roughness, as clearly depicted in the roughness distribution chart of the UPTZ (Figure 2d, e). Nevertheless, it is crucial to acknowledge that although the micro-machining procedure has effectively improved the surface of the WC sample, it has not completely eliminated the prominent burrs that are initially found in raw samples (Figure 3h, i, k, l). The presence of these burrs, despite being less noticeable after undergoing treatment, continues to exist, indicating possible difficulties for applications requiring a flawless surface (Figure 2a).
Figure 1.
Polished – unpolished transition zone of HSS tool sample after micro-machining process: (a) SEM photo, (b) Photograph of the drill bit investigated, (c) Optical photo, (d) 3D profilometer photo, (e) Roughness change chart and (f) Microhardness measurement on the same zone.
Figure 1.
Polished – unpolished transition zone of HSS tool sample after micro-machining process: (a) SEM photo, (b) Photograph of the drill bit investigated, (c) Optical photo, (d) 3D profilometer photo, (e) Roughness change chart and (f) Microhardness measurement on the same zone.
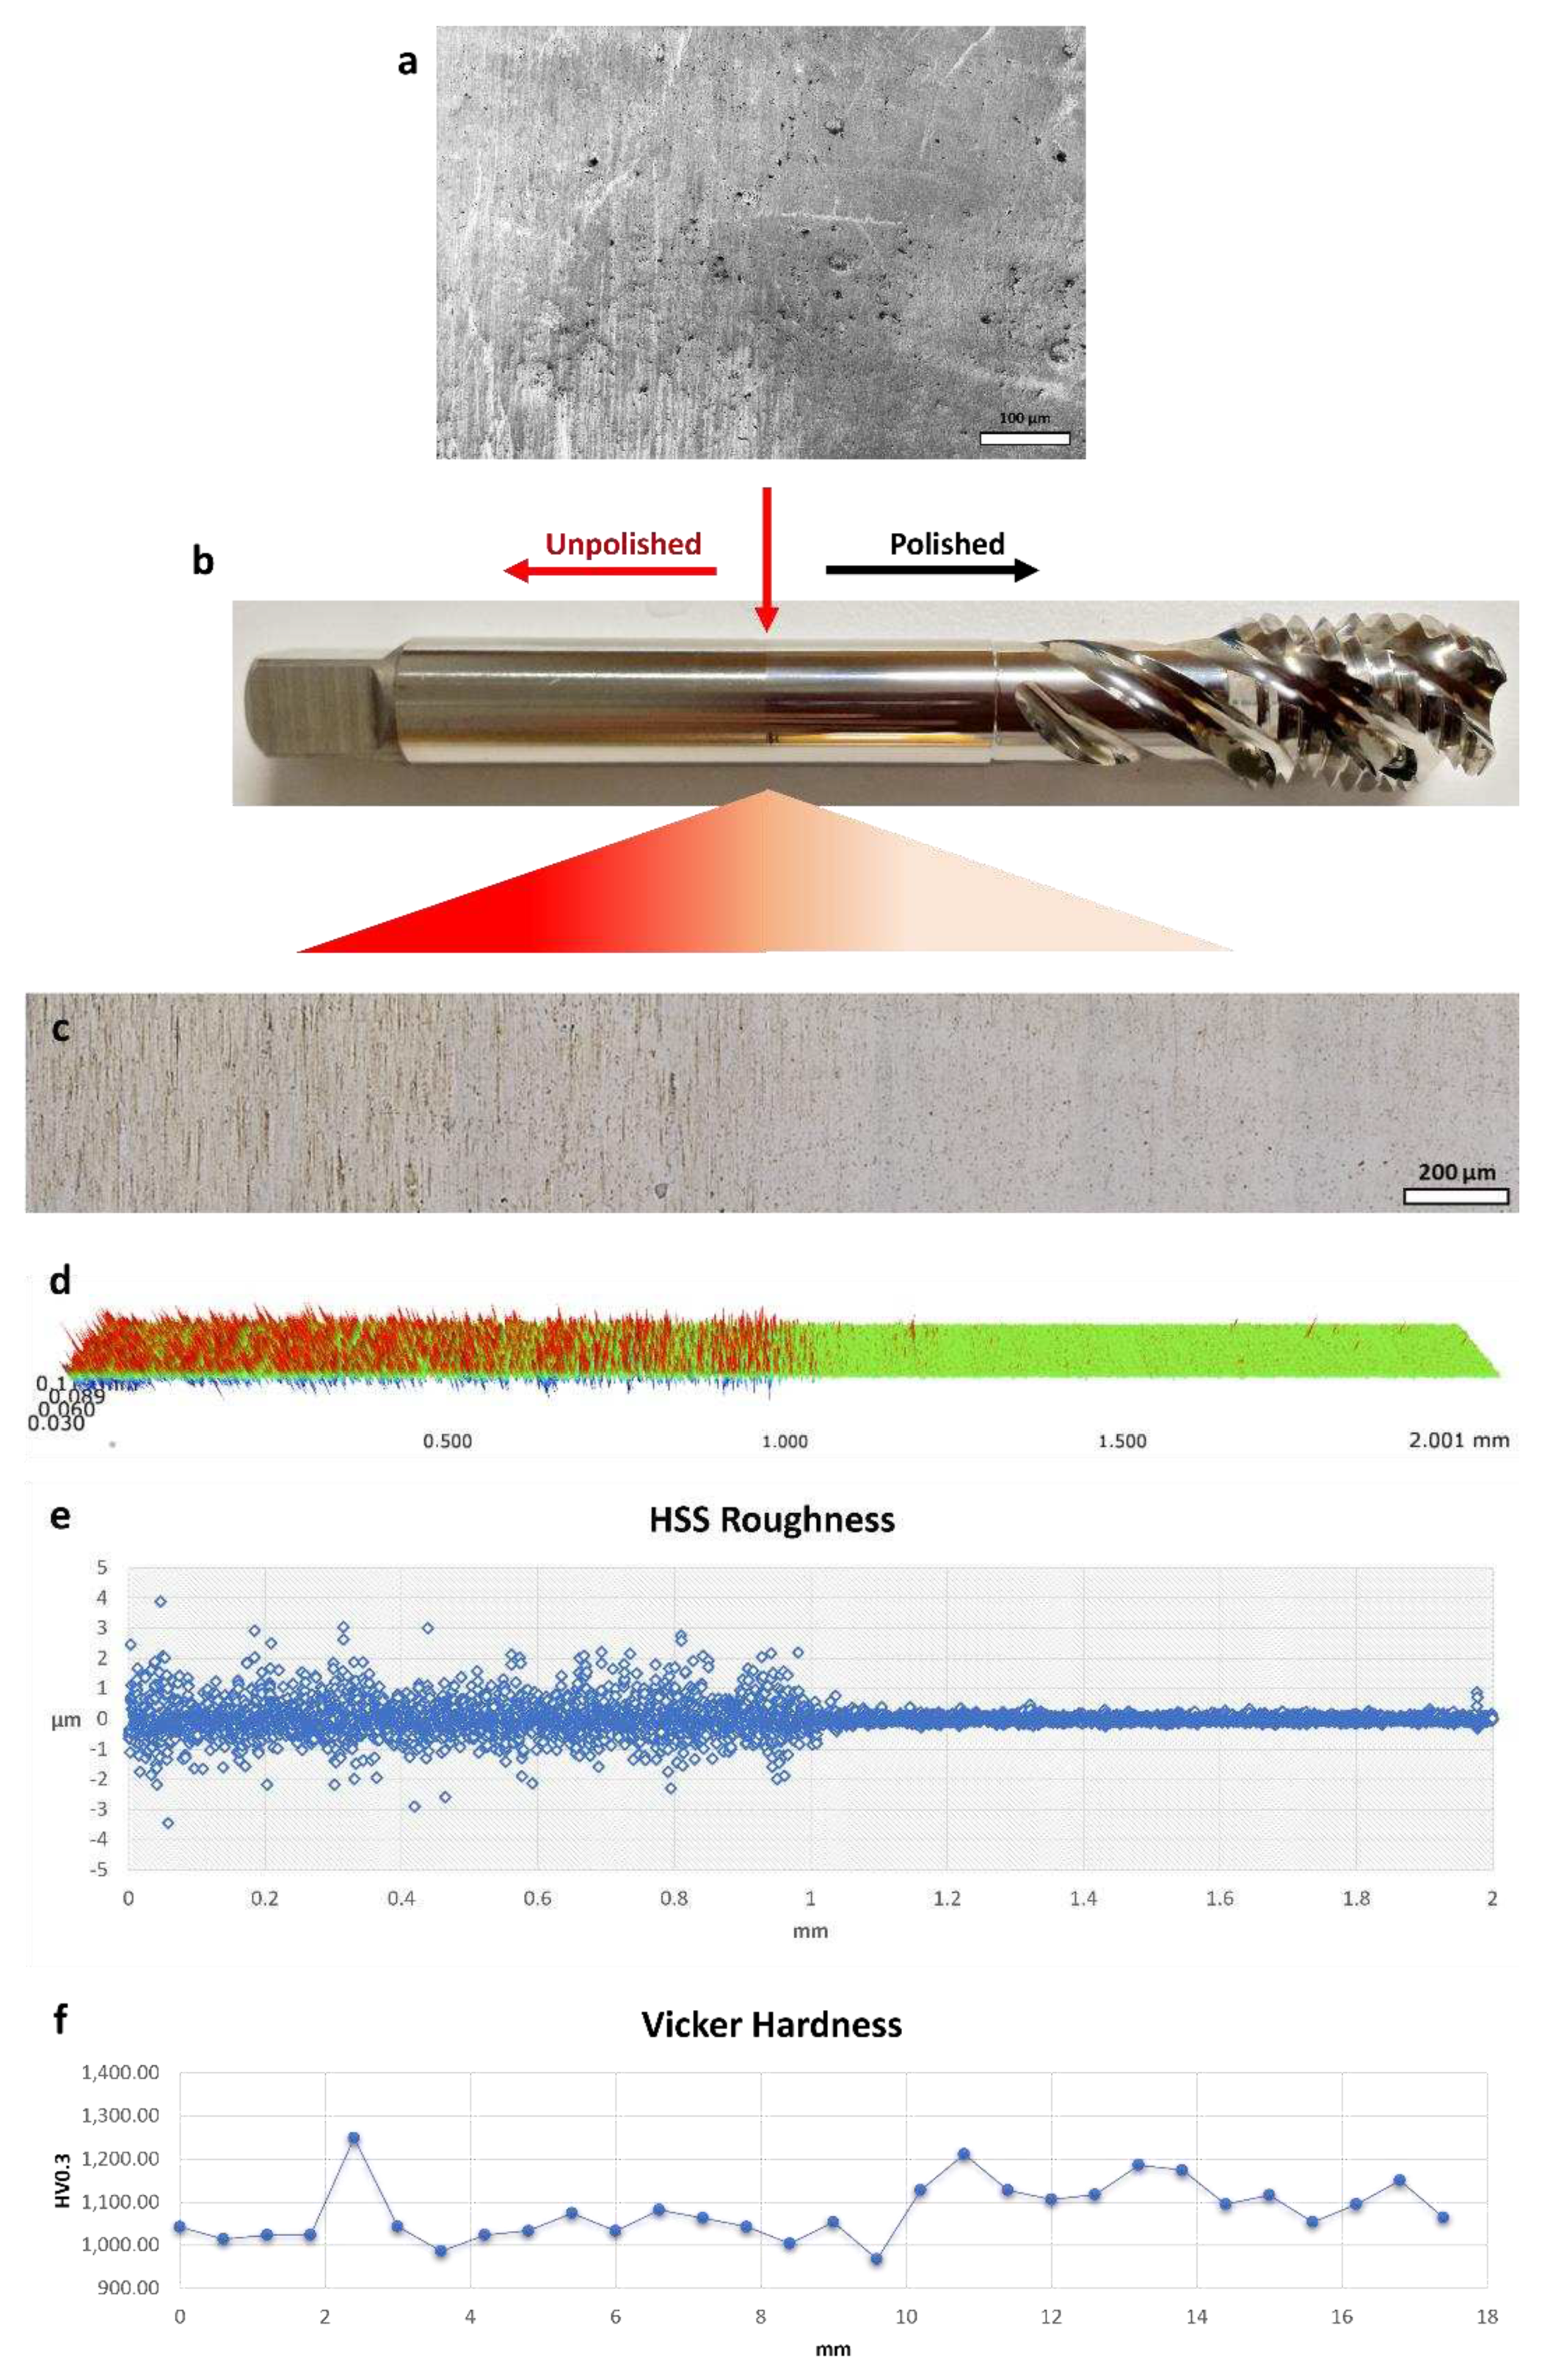
Figure 2.
Polished – unpolished transition zone of WC tool sample after micro-machining process: (a) SEM photo, (b) Photograph of the drill bit investigated, (c) Optical photo, (d) 3D profilometer photo, (e) Roughness change chart and (f) Microhardness measurement on the same zone.
Figure 2.
Polished – unpolished transition zone of WC tool sample after micro-machining process: (a) SEM photo, (b) Photograph of the drill bit investigated, (c) Optical photo, (d) 3D profilometer photo, (e) Roughness change chart and (f) Microhardness measurement on the same zone.
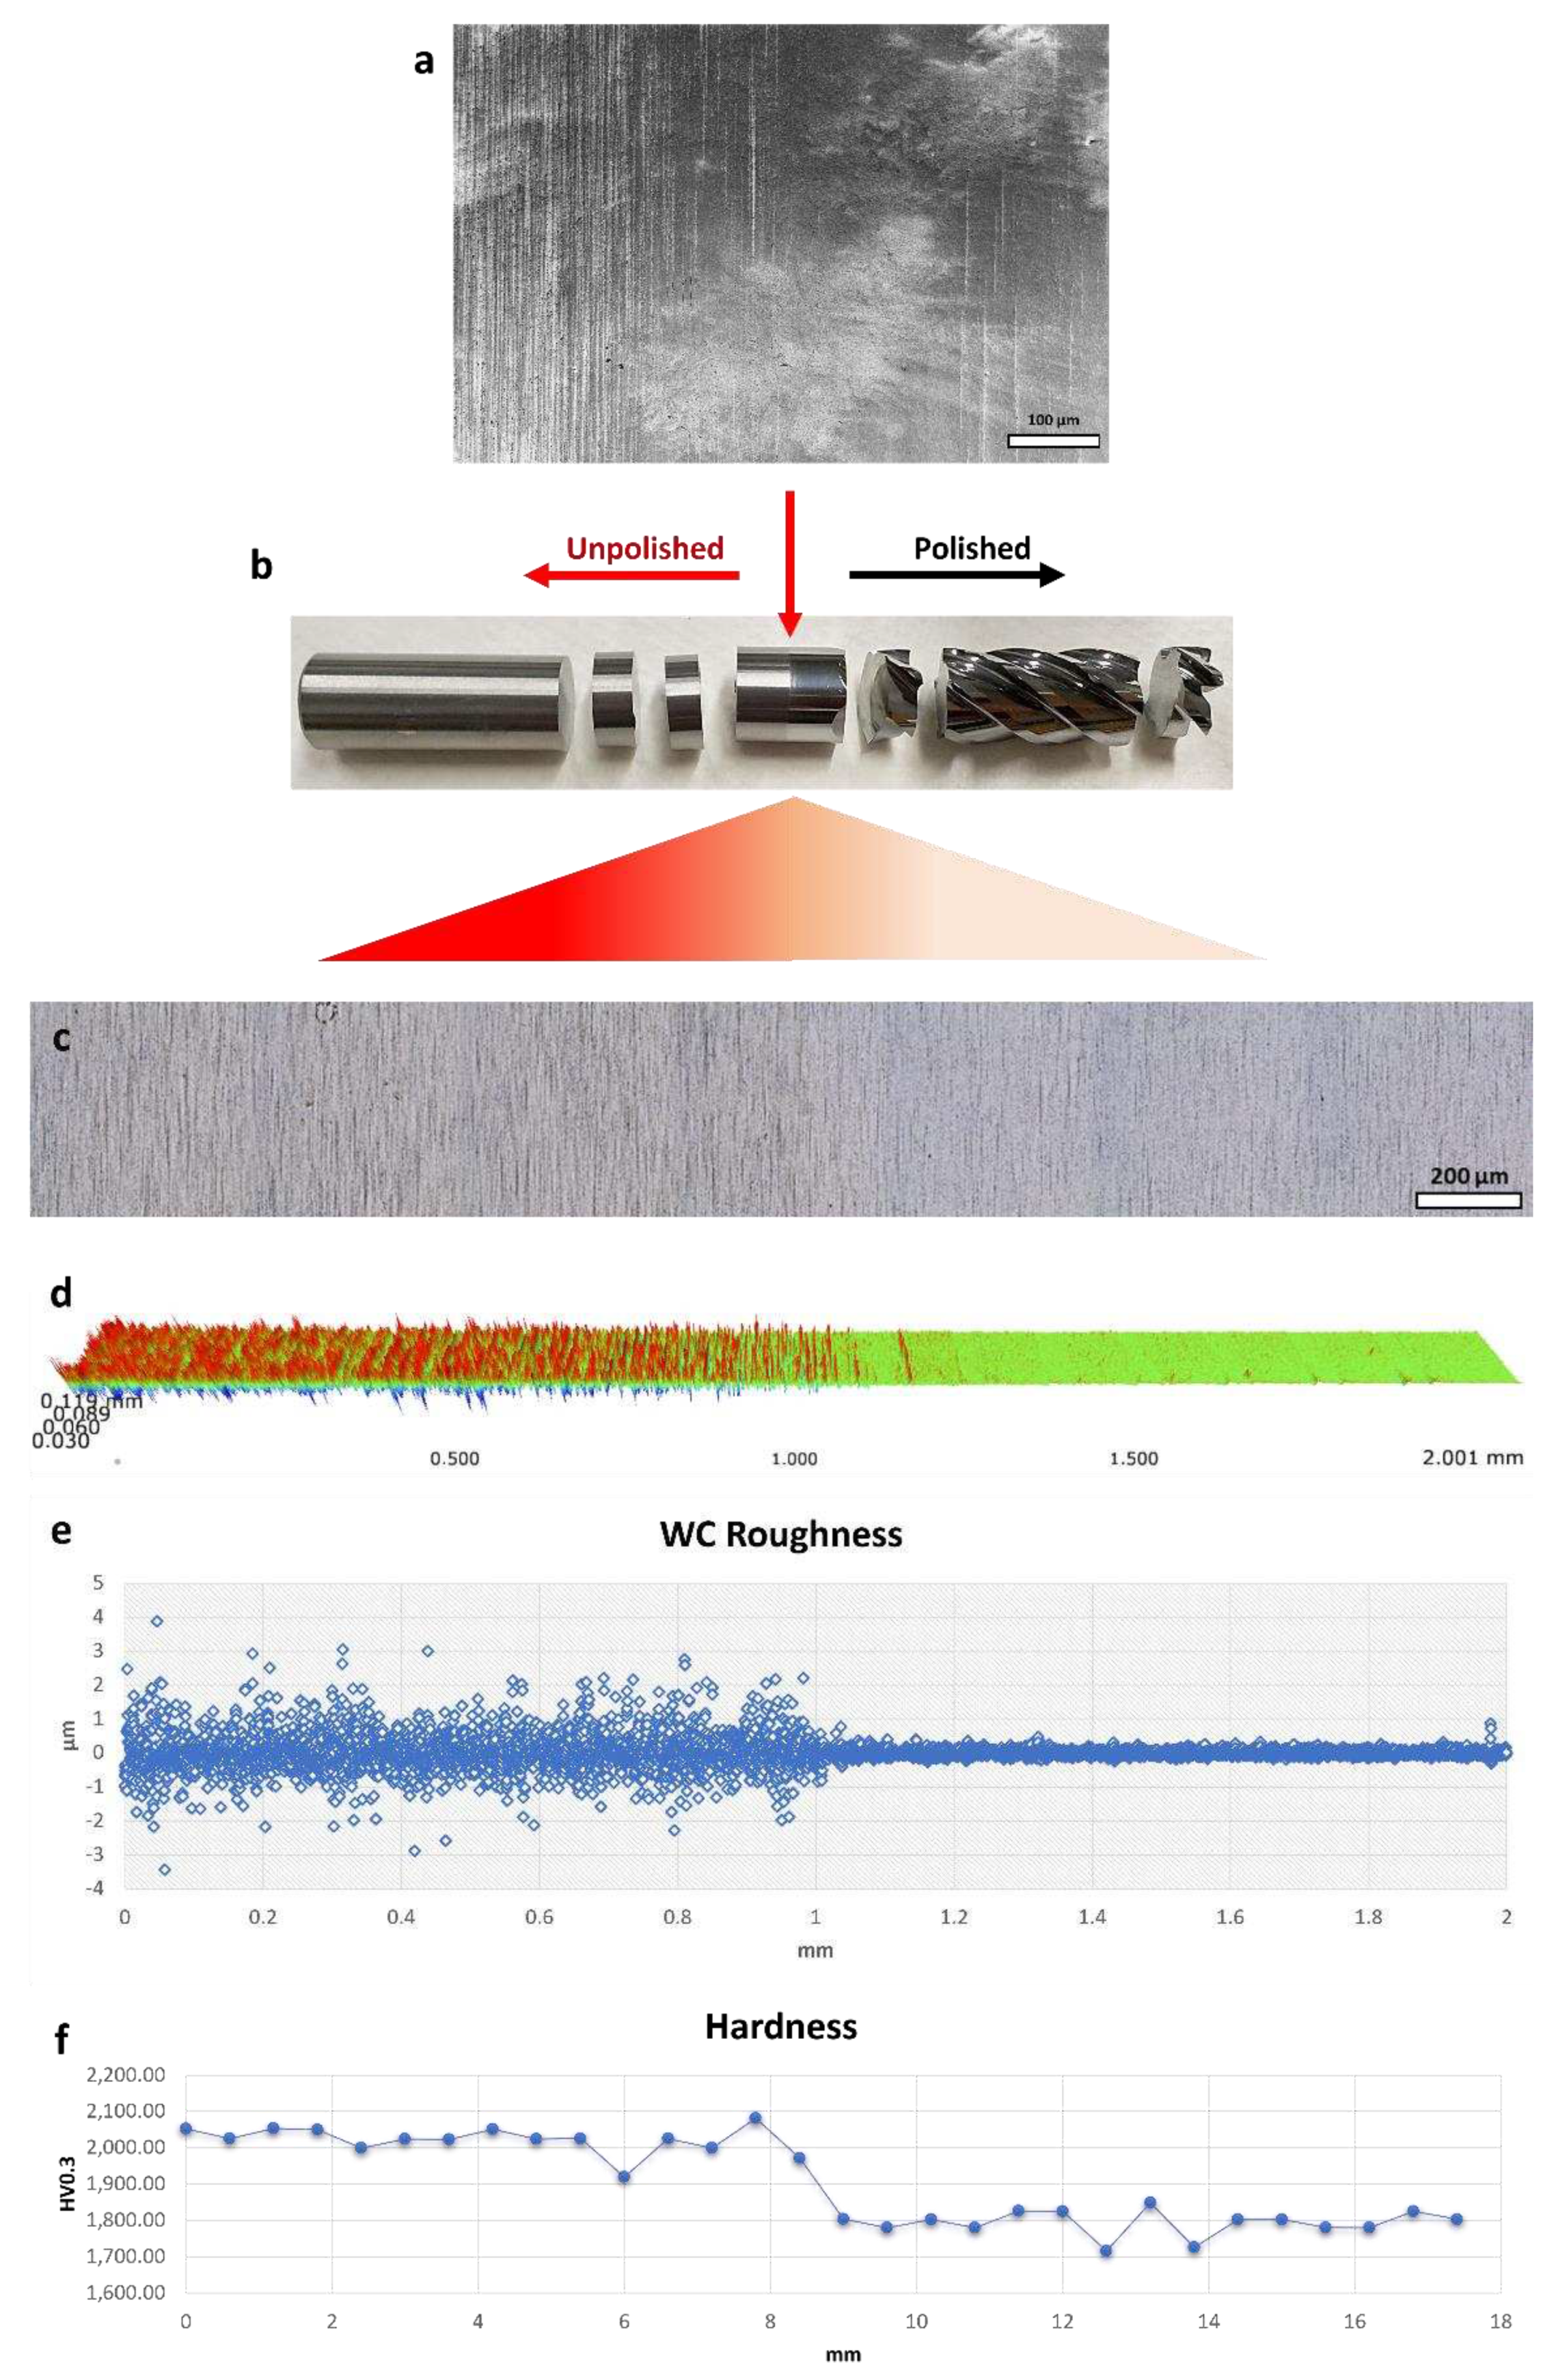
Figure 3.
(a, d, g, j) 3D profilometer and (b, c, e, f, h, I, k, l) SEM images of (a-c) unpolished and (d-f) polished WC sample; (g-i) Unpolished and (j-l) Polished HSS sample.
Figure 3.
(a, d, g, j) 3D profilometer and (b, c, e, f, h, I, k, l) SEM images of (a-c) unpolished and (d-f) polished WC sample; (g-i) Unpolished and (j-l) Polished HSS sample.
Energy Dispersive X-ray Spectroscopy was utilised to conduct elemental analysis on the cross-sectional specimens of high-speed steel and tungsten carbide. A noticeable pattern in the distribution of elements was identified, with a clear organisation apparent from the centre to periphery regions in both HSS and WC samples. Quantitative analysis indicated that the cobalt content in the polished area of the HHS sample exhibited a slight decrease, whereas the WC sample exhibited an elevation in cobalt concentration. The persistence of constituent distribution in an apparently random pattern inside the homogeneous matrix of both HSS and WC alloys is a subject of intrigue. It is worth mentioning that a substantial decrease of roughly 13 wt.% was seen in the iron content of the HSS sample after micro-machining (Figure 4). This reduction was accompanied by an increase in the concentrations of vanadium, molybdenum, and tungsten. In contrast, the composition of tungsten in the WC sample exhibited minimal changes after the machining process (Figure 5). The observed variations in elemental composition could impact the mechanical characteristics along the radial gradient of the tool materials. As an example, the HSS sample in its unpolished state displayed an average hardness of 1082.2 ± 54.1 HV. After polishing, the hardness slightly decreased to 1063.4 ± 51.6 HV. This indicates that the fundamental mechanical properties of the HSS samples were mostly unaffected, as supported by the uniform distribution of microhardness from the centre to the periphery regions. In contrast, the unpolished WC sample had an average hardness of 1989.0 ± 79.4 HV. Interestingly, this hardness increased to 2060.4 ± 113.19 HV after the polishing process. The observed increase in hardness can be ascribed to a cryogenic pre-heat treatment procedure (what is the mechanism?), which appears to have improved the hardness in the vicinity of the tool's tip - the area from which the polished slide was obtained.19 However, similar to the behaviour observed in HSS, the radial distribution of microhardness in both polished and unpolished WC samples demonstrated a high level of consistency. Therefore, drawing from thorough elemental and mechanical analyses, we hypothesised that the micro-machining process primarily impacts the external surface characteristics, as previously discussed, while causing minor disruptions to the interior structural integrity of the tool.
Figure 4.
Elemental analysis by EDX from centre to periphery part of cross-sectional HSS sample on Unpolished and Polished area.
Figure 4.
Elemental analysis by EDX from centre to periphery part of cross-sectional HSS sample on Unpolished and Polished area.
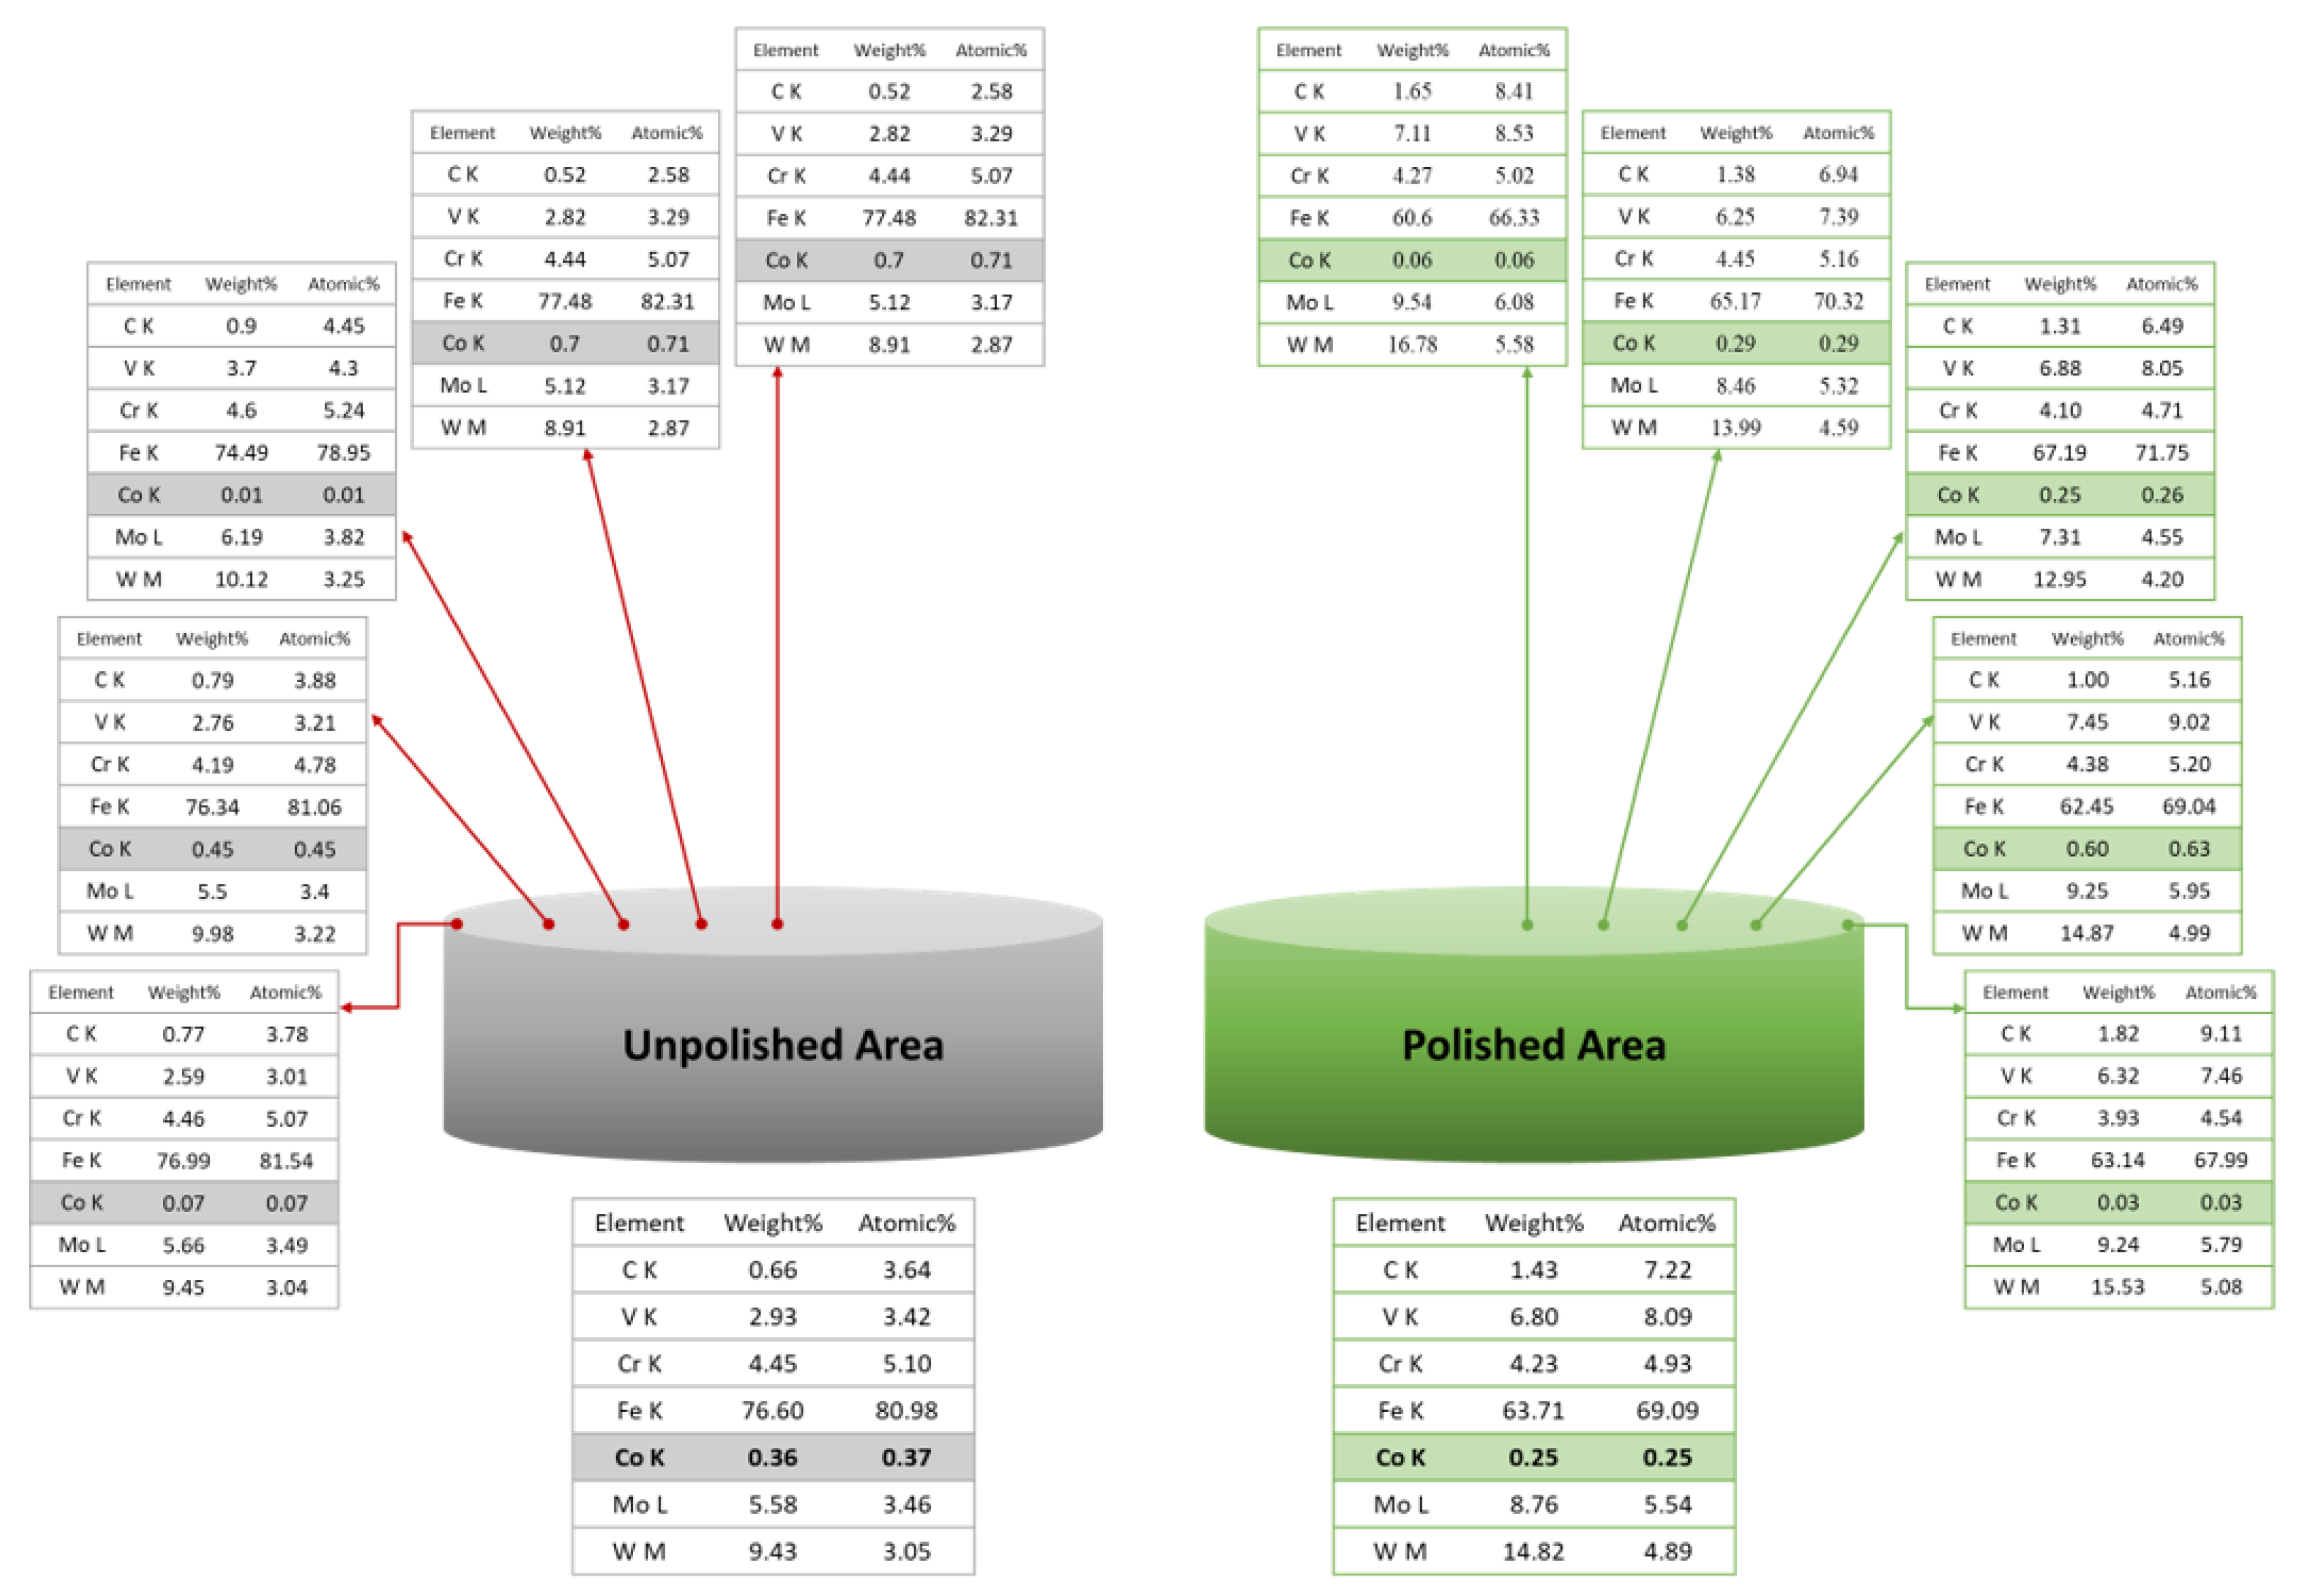
Figure 5.
Elemental analysis by EDX from centre to periphery part of cross-sectional WC sample on Unpolished and Polished area.
Figure 5.
Elemental analysis by EDX from centre to periphery part of cross-sectional WC sample on Unpolished and Polished area.
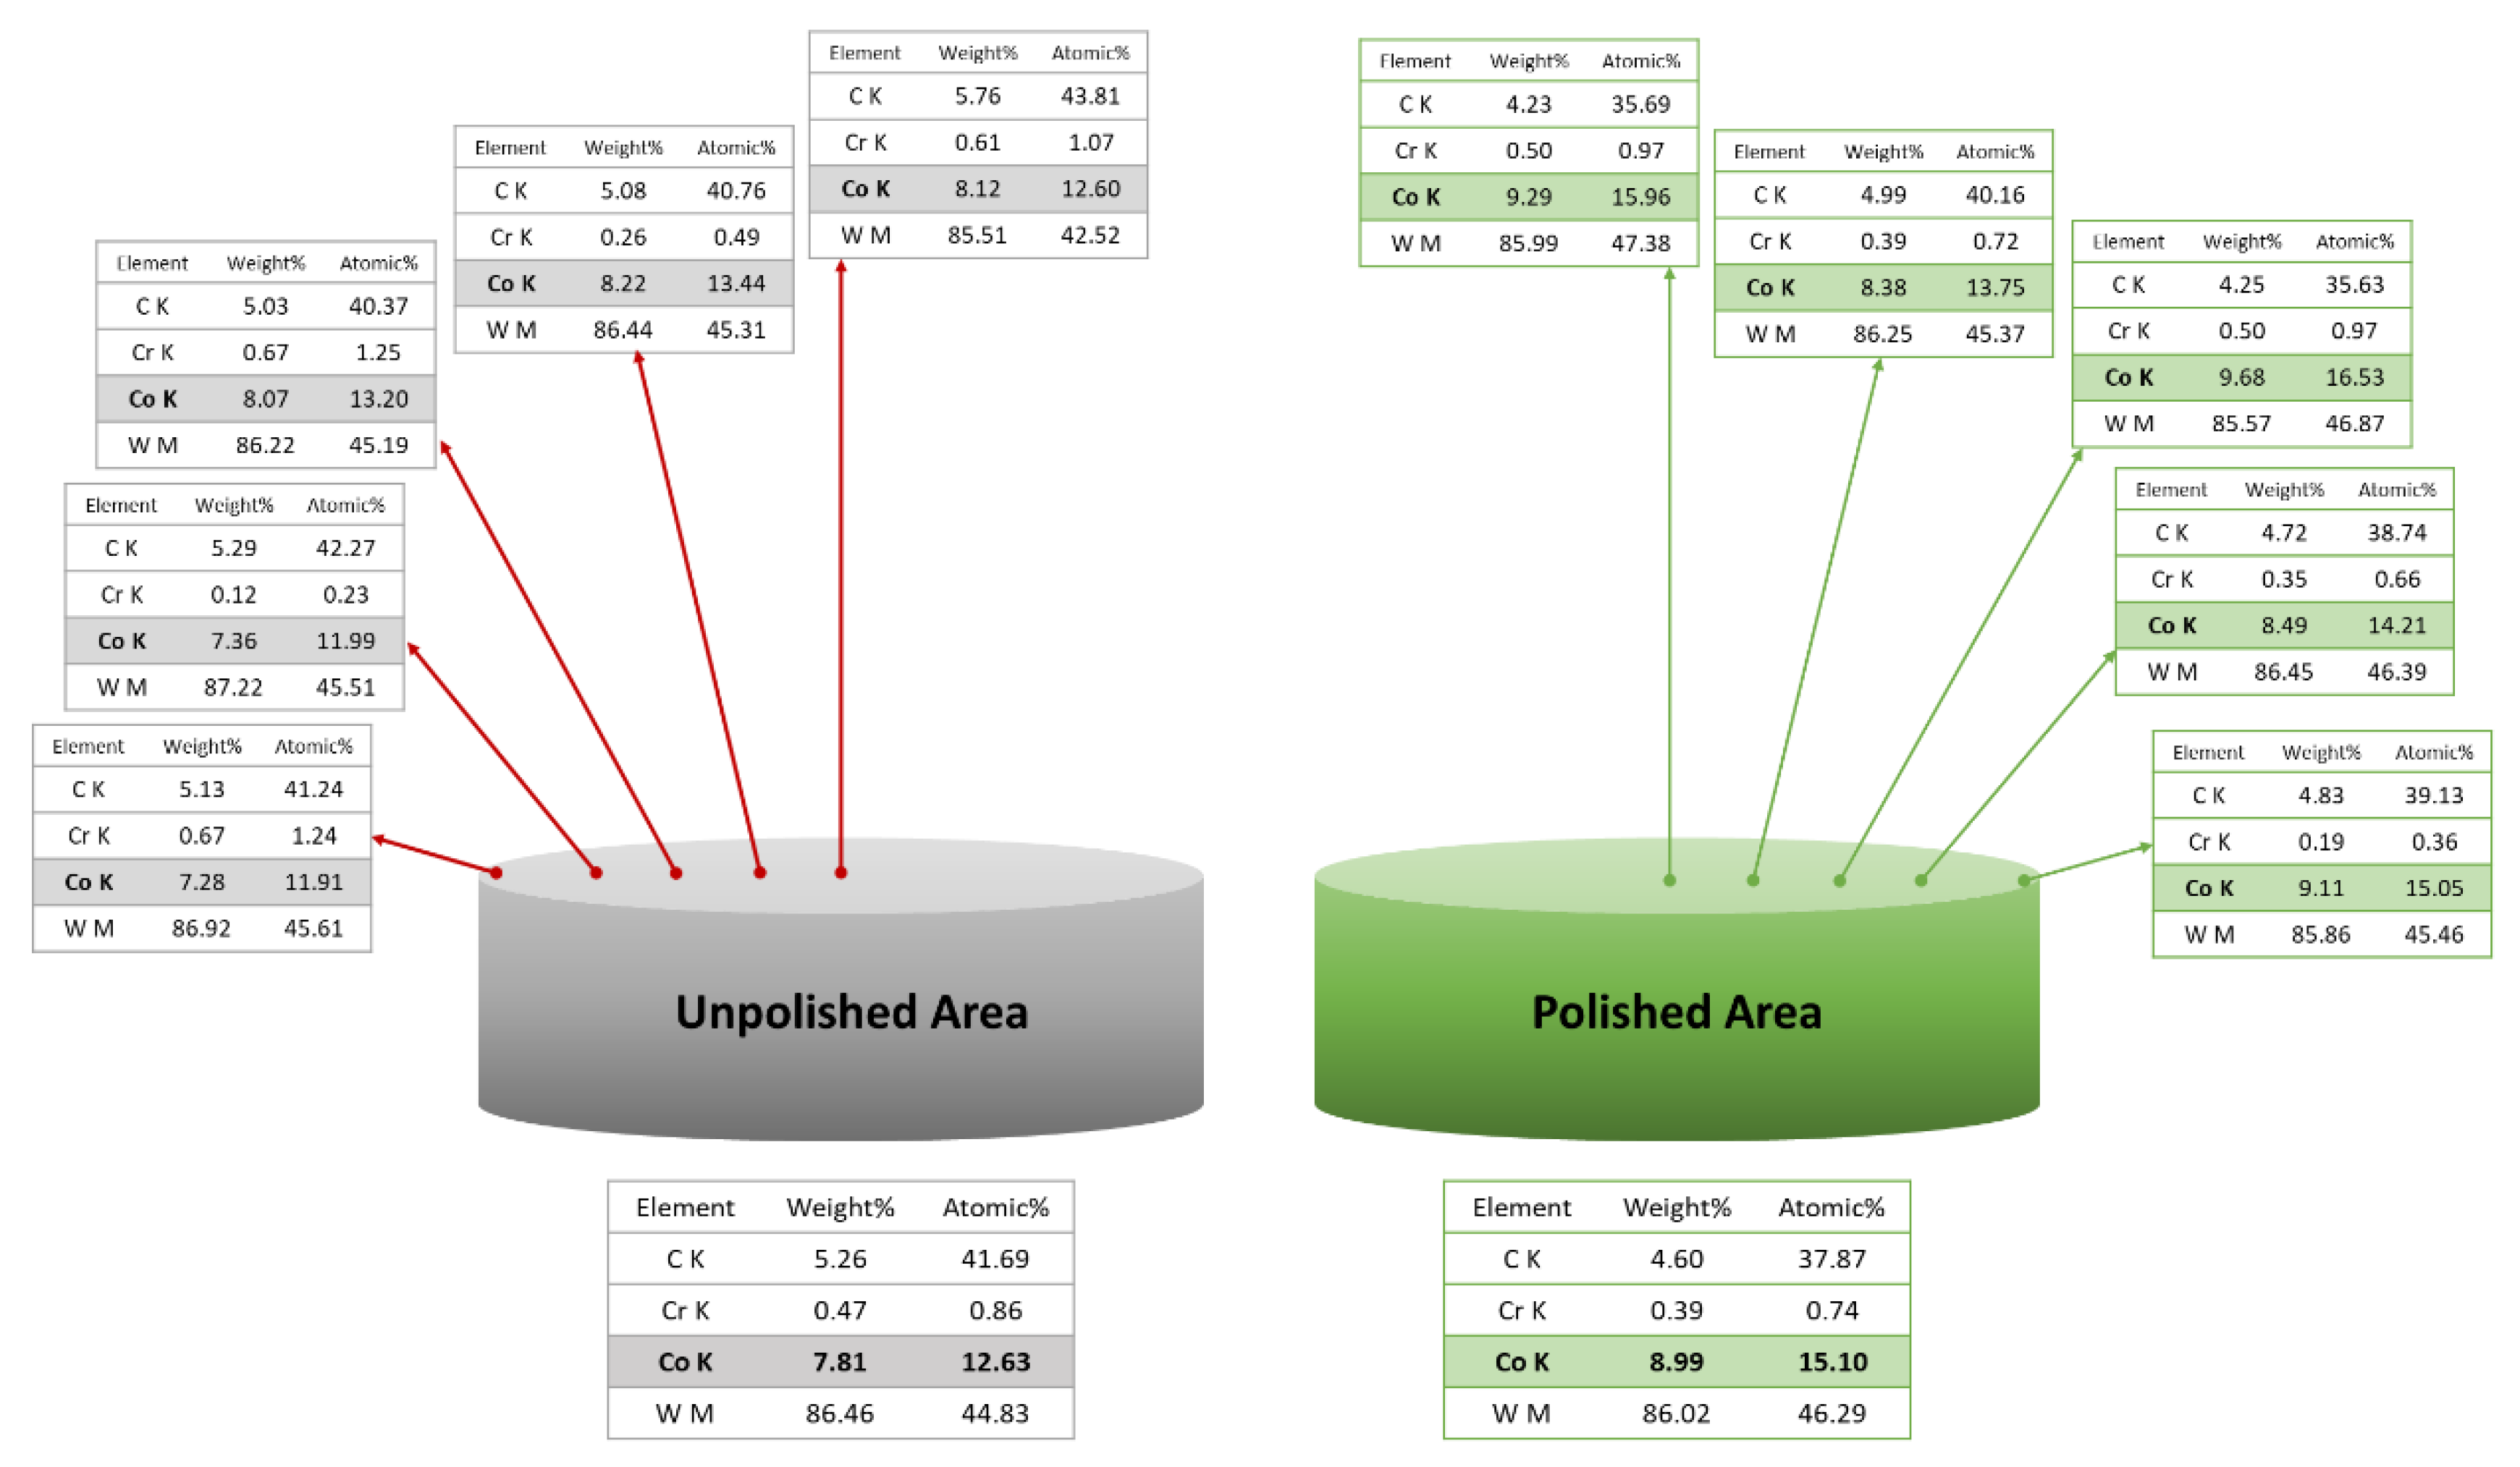
Figure 6.
Hardness measurement from centre to periphery part of cross-sectional region on (a) Unpolished and (b) Polished HSS sample; (c) Unpolished and (d) Polished WC sample.
Figure 6.
Hardness measurement from centre to periphery part of cross-sectional region on (a) Unpolished and (b) Polished HSS sample; (c) Unpolished and (d) Polished WC sample.
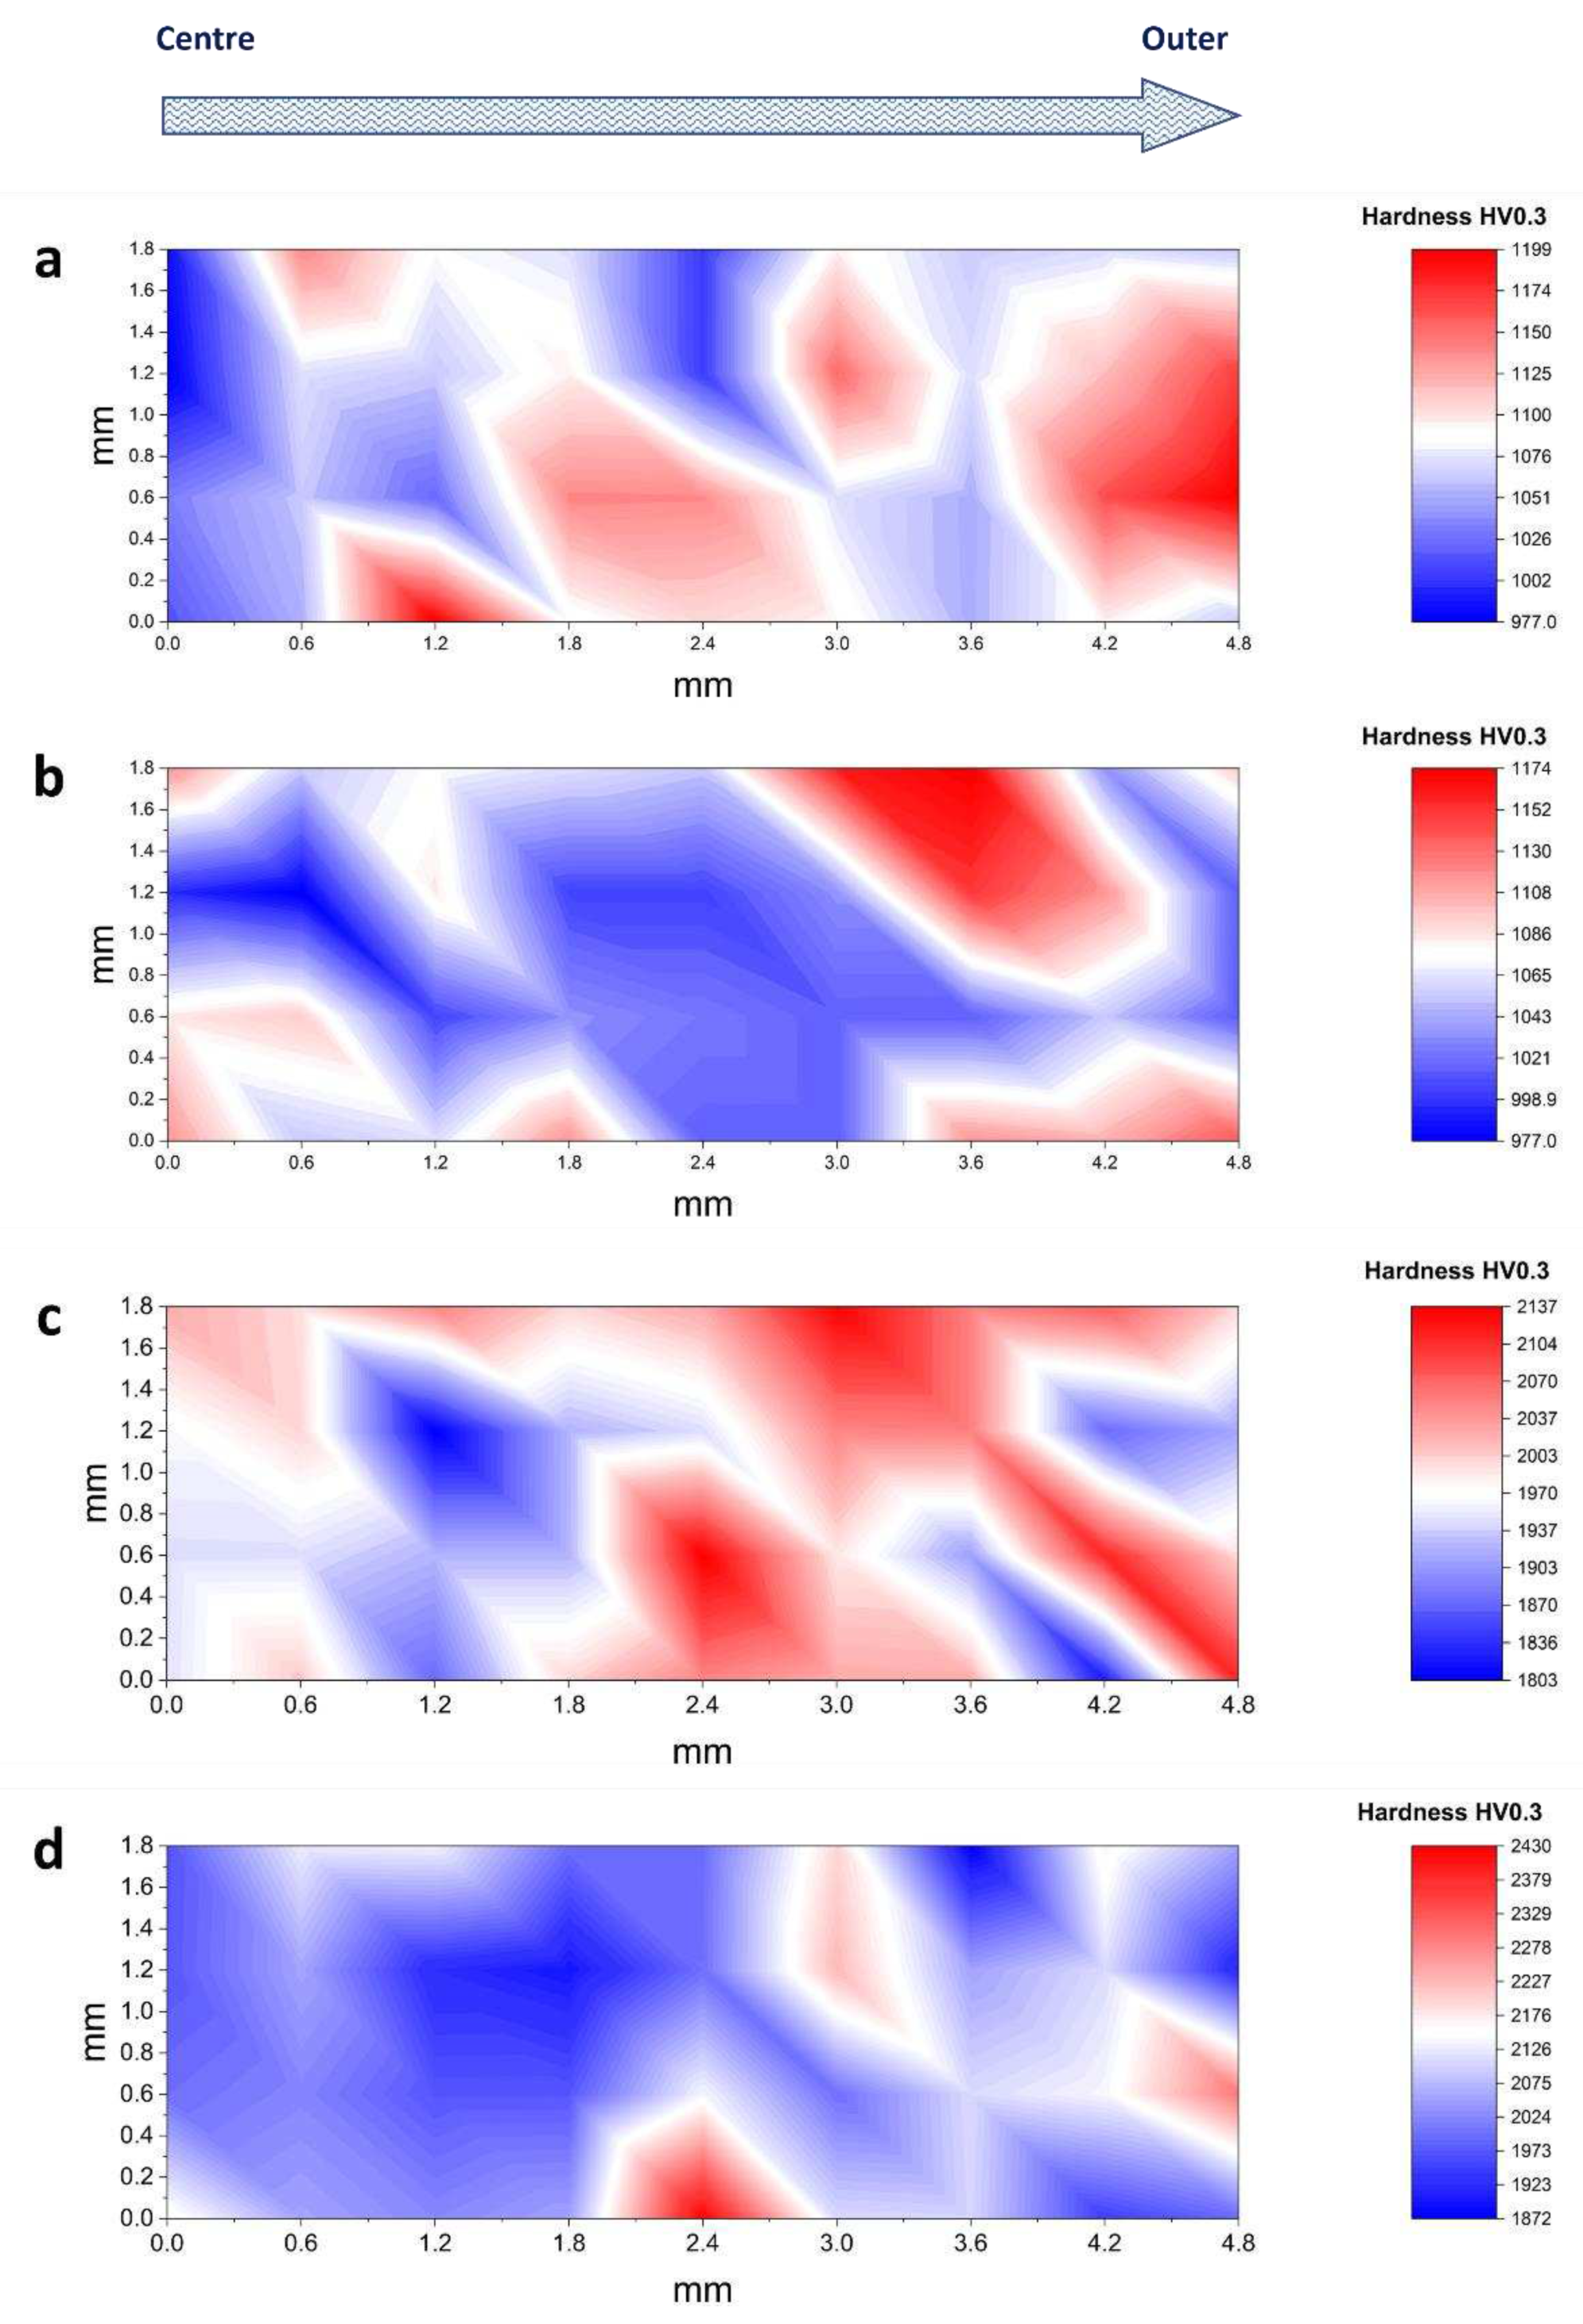
Figure 7.
Edge contour 3D scan of: (a) Unpolished and (b) Polished HSS sample. (c) Edge radius measurement with corresponding average radius values of unpolished and polished HSS sample.
Figure 7.
Edge contour 3D scan of: (a) Unpolished and (b) Polished HSS sample. (c) Edge radius measurement with corresponding average radius values of unpolished and polished HSS sample.
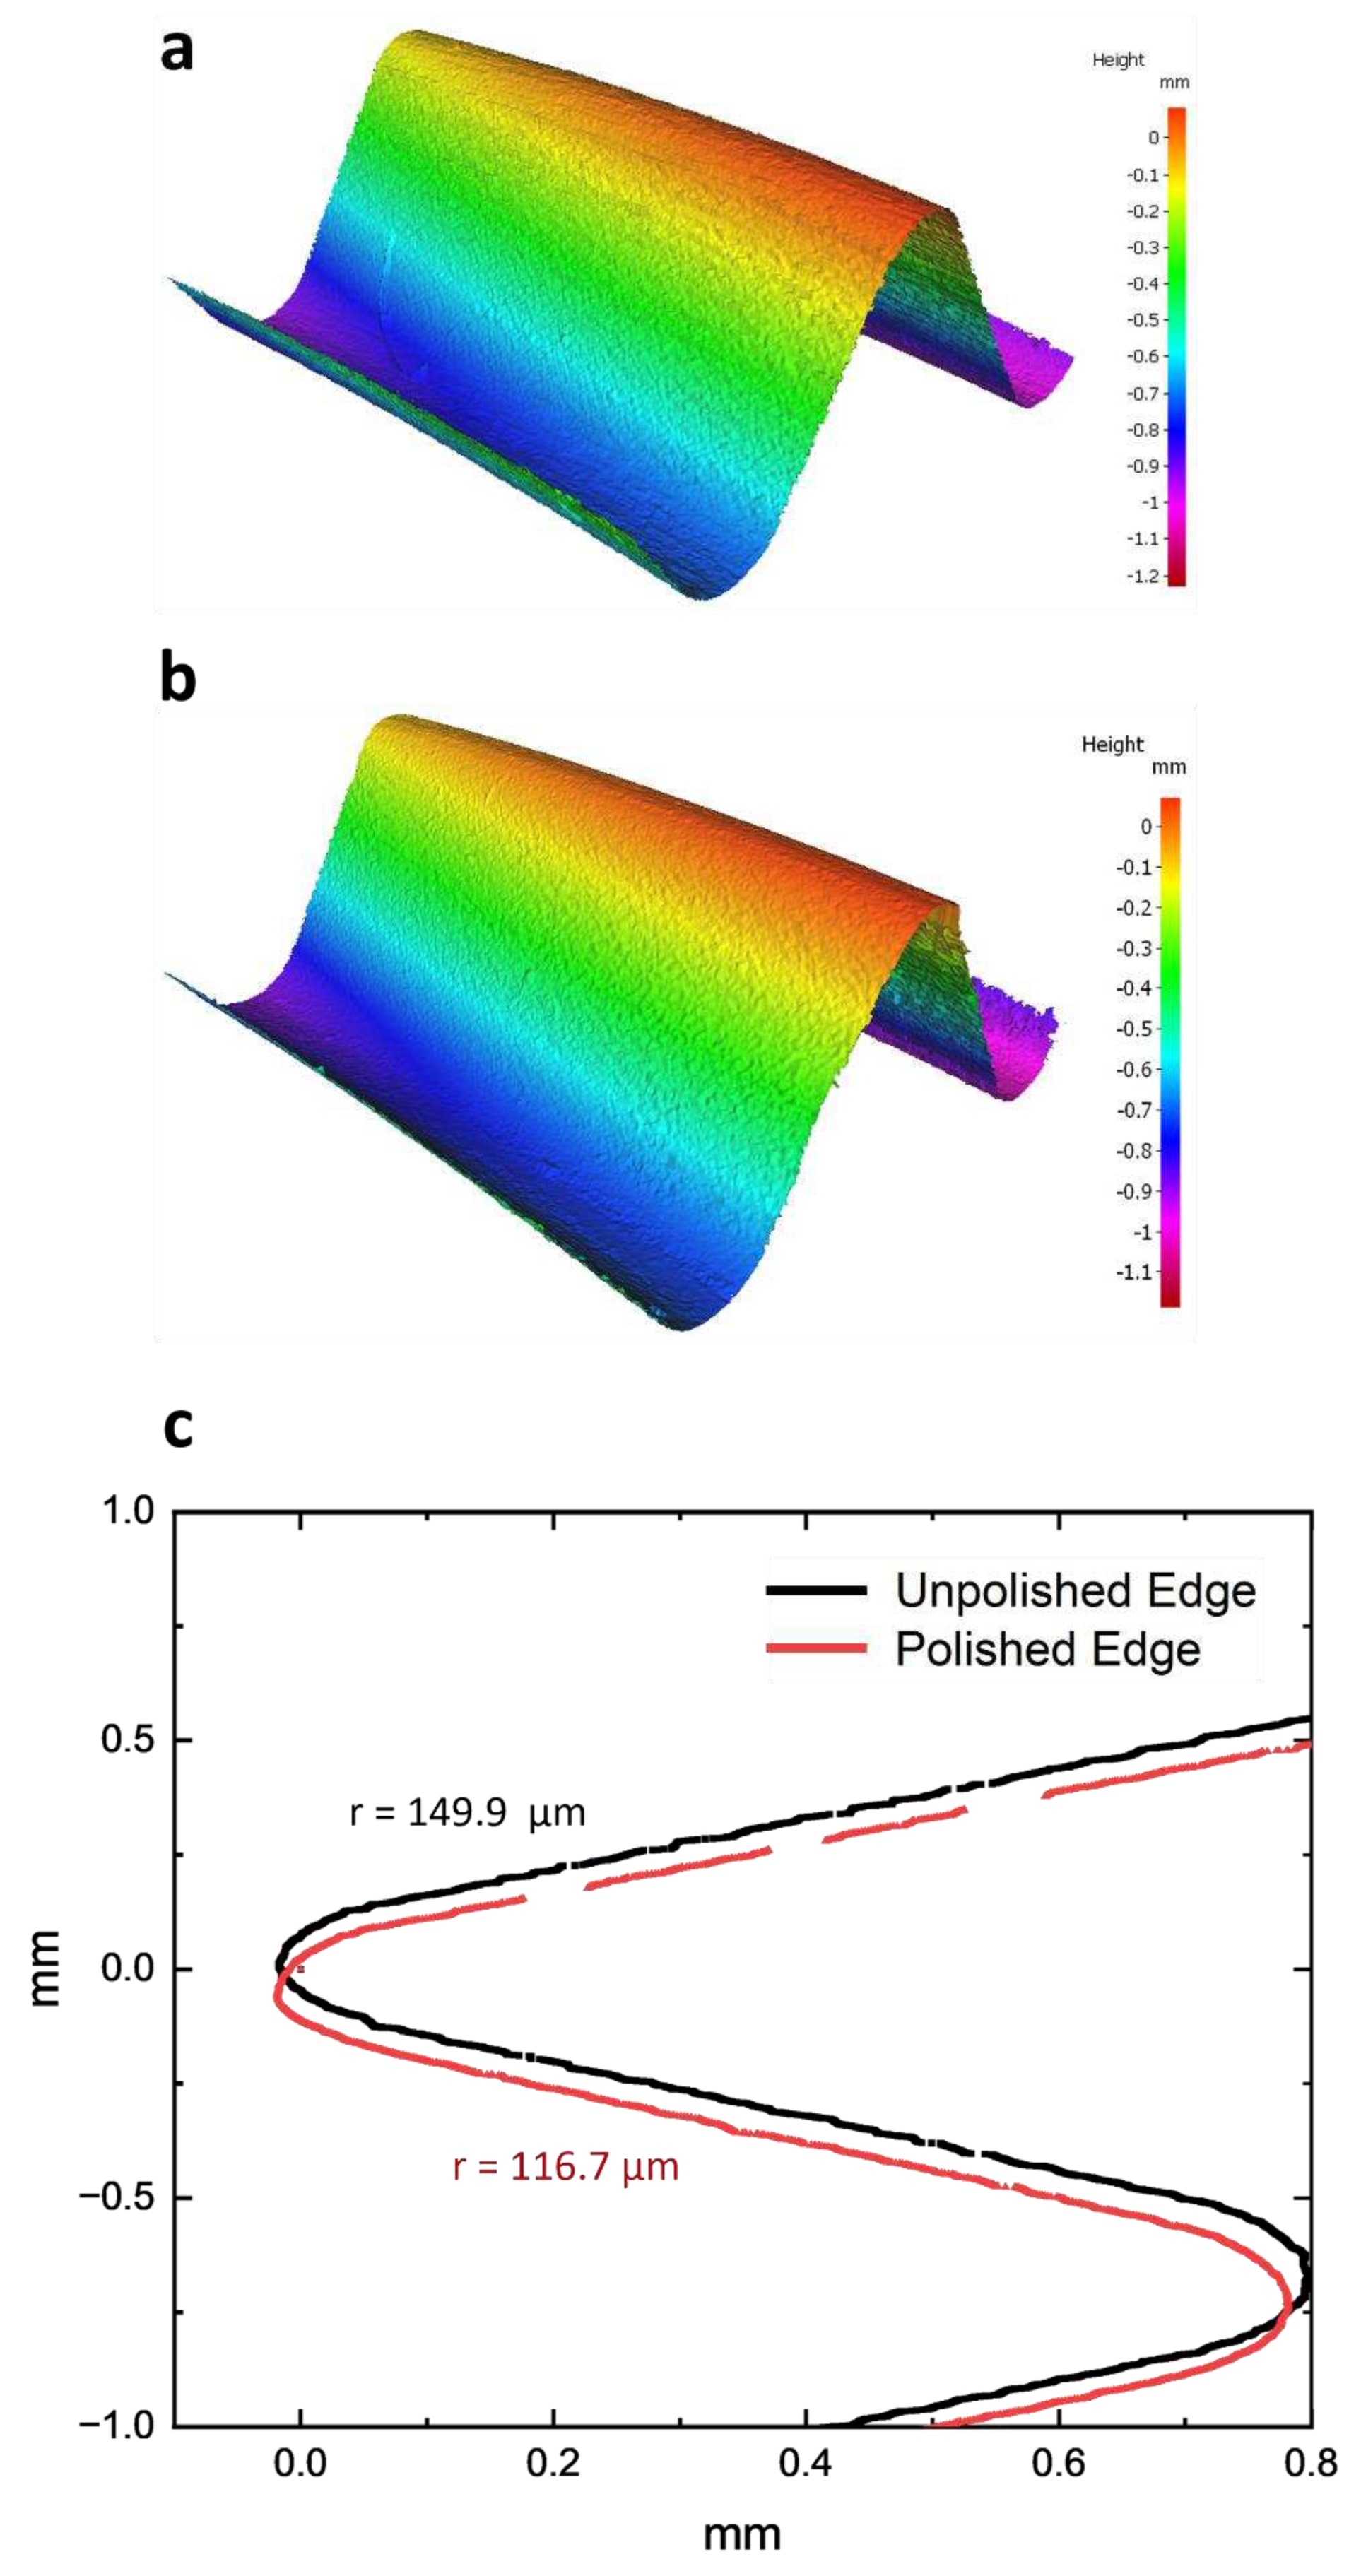
Aside from the obvious improvement in surface finishing, the micro-machining method also provides considerable edge honing benefits. To quantify these impacts, 3D metrological techniques were used to inspect the cutting edges of both unpolished and polished tools. The results show a more rounded cutting-edge radius for the HSS tool, with less evidence of micro-chipping. There was a specific increase from 116.7 µm to 149.9 µm (Figure 8). Despite this improvement, the presence of larger burrs was still noticeable. Similarly, the tungsten carbide tool improved edge roundness, with its radius increasing from 14.8 µm to 19.4 µm (Figure 8). Even after machining, the problem of micro-chipping remained. This edge rounding phenomena could be interpreted as an unintentional result of the micro-machining process's principal surface finishing goals. Detailed 3D scans revealed the existence of considerable grinding lines and pronounced burrs in both the untreated and treated specimens, a feature that was predicted to disappear after the micro-machining intervention.
In addition to employing the primary HSS and WC tools, we also submitted a range of alternative tools to diverse conditions for the purpose of micro-machining. The results of these additional examinations are presented in Table 1. The degree of reduction in roughness may vary from sample to sample due to various techniques used, but all samples have shown a consistent and noticeable decrease in surface roughness.
4. Conclusion
The micro-machining procedure performed on samples of high-speed steel and tungsten carbide results in significant alterations to the surface, while simultaneously exerting subtle influences on the internal structure. The HSS tool exhibits notable improvements in surface quality, as evidenced by enhanced clarity and glossiness in the finishes. These improvements are accompanied by substantial reductions in the roughness values, specifically Ra and Rz. On the other hand, the WC tool, despite its dramatically improved smoothness, exhibits a more profound and obscure polished appearance. It is worth mentioning that the utilisation of micro-machining techniques in tungsten carbide has been seen to enhance the leaching of cobalt, leading to the formation of structural voids and a decrease in hardness. Both HSS and WC tools undergo edge honing effect, which results in a more rounded cutting-edge. This unintentional by-product of surface finishing has the potential to extend the lifespan of the tool. To summarise, micro-machining is a process that enhances the surface characteristics of the cutting tools, resulting in a noticeable decrease in roughness and an overall improvement in surface quality of the cutting tools. However, it is important to note that the effects of the process are not only limited to the surface alterations, but also to the change in chemical composition, that could result in an enhancement in mechanical properties of the cutting tools. Nevertheless, the presence of continuous grinding lines, burrs, and unwanted edge rounding serves as a reminder of the imperative for precision and meticulousness when utilising micro-machining techniques in the realm of tool making.
Acknowledgments
This research is fully supported by the Australian Government through the Australian Research Council Industrial Transformation Training Centre funding scheme, in Surface Engineering for Advanced Materials (SEAM), with project ID IC180100005.
References
- Kirk, F.A. Problems in High-Speed Steel Manufacture and Use: A Challenge for Economic Powder Metallurgy Processing. Powder Metallurgy 1981, 24, 70–74. [Google Scholar] [CrossRef]
- Yang, H.; Yang, S.; Tong, X. Study on the Matching of Surface Texture Parameters and Processing Parameters of Coated Cemented Carbide Tools. Coatings 2023, 13, 681. [Google Scholar] [CrossRef]
- Mills, B. Recent developments in cutting tool materials. Journal of Materials Processing Technology 1996, 56, 16–23. [Google Scholar] [CrossRef]
- Rizzo, A.; et al. The Critical Raw Materials in Cutting Tools for Machining Applications: A Review. Materials 2020, 13, 1377. [Google Scholar] [CrossRef] [PubMed]
- Jiang, S.; et al. Study on the Microstructure and Mechanical Properties of Martensitic Wear-Resistant Steel. Crystals 2023, 13, 1210. [Google Scholar] [CrossRef]
- Santecchia, E.; et al. Wear resistance investigation of titanium nitride-based coatings. Ceramics International 2015, 41, 10349–10379. [Google Scholar] [CrossRef]
- Navarro-Devia, J.H.; Amaya, C.; Caicedo, J.C.; Martínez, J.H.; Aperador, W. Hafnium and vanadium nitride multilayer coatings [HfN/VN]n deposited onto HSS cutting tools for dry turning of a low carbon steel: a tribological compatibility case study. Int J Adv Manuf Technol 2019, 101, 2065–2081. [Google Scholar] [CrossRef]
- Zhao, J.; et al. Comparison of Surface Morphology and Tool Wear in the Machining of Ti-6Al-4V Alloys with Uncoated and TiAlN Tools under Dry, Minimum Quantity Lubrication, Flood Cooling, and Low-Temperature Spray Jet Cooling Conditions. Micromachines 2023, 14, 1263. [Google Scholar] [CrossRef] [PubMed]
- Spieser, A.; Ivanov, A. Recent developments and research challenges in electrochemical micromachining (µECM). Int J Adv Manuf Technol 2013, 69, 563–581. [Google Scholar] [CrossRef]
- Dornfeld, D.; Min, S.; Takeuchi, Y. Recent Advances in Mechanical Micromachining. CIRP Annals 2006, 55, 745–768. [Google Scholar] [CrossRef]
- Singh, S.; Ghai, V.; Agrawal, A.; Singh, H. Effect of machining parameters on cutting force during micro-turning of a brass rod. Materials and Manufacturing Processes 2019, 34, 1816–1823. [Google Scholar] [CrossRef]
- Li, G.; et al. Surface Quality and Material Removal Rate in Fabricating Microtexture on Tungsten Carbide via Femtosecond Laser. Micromachines 2023, 14, 1143. [Google Scholar] [CrossRef] [PubMed]
- Bolat, Ç.; et al. Effect of Drilling Parameters and Tool Geometry on the Thrust Force and Surface Roughness of Aerospace Grade Laminate Composites. Micromachines 2023, 14, 1427. [Google Scholar] [CrossRef] [PubMed]
- Ercetin, A.; Aslantaş, K.; Özgün, Ö.; Perçin, M.; Chandrashekarappa, M.P.G. Optimization of Machining Parameters to Minimize Cutting Forces and Surface Roughness in Micro-Milling of Mg13Sn Alloy. Micromachines 2023, 14, 1590. [Google Scholar] [CrossRef] [PubMed]
- Denkena, B.; Biermann, D. Cutting edge geometries. CIRP Annals 2014, 63, 631–653. [Google Scholar] [CrossRef]
- Zhuang, K.; Fu, C.; Weng, J.; Hu, C. Cutting edge microgeometries in metal cutting: a review. Int J Adv Manuf Technol 2021, 116, 2045–2092. [Google Scholar] [CrossRef]
- Badger, J.A. Understanding the causes of grinding burn helps alleviate the problem.
- Zhang, H.Q.; Jia, X.M.; Wang, F. Study of Inhibition Function of Grinding Fluid Additive to Leaching Cobalt from Cemented Carbide. KEM 2009, 416, 381–385. [Google Scholar] [CrossRef]
- Amini, K.; Akhbarizadeh, A.; Javadpour, S. Cryogenic heat treatment—A review of the current state. Metall Mater Eng 2017, 23, 1–10. [Google Scholar] [CrossRef] [PubMed]
Figure 8.
Edge contour 3D scan of: (a, b) Unpolished and (c, d) Polished WC sample. (e) Edge radius measurement with corresponding average radius values of unpolished and polished WC sample.
Figure 8.
Edge contour 3D scan of: (a, b) Unpolished and (c, d) Polished WC sample. (e) Edge radius measurement with corresponding average radius values of unpolished and polished WC sample.


Table 1.
Surface roughness of different micro-machined tool samples.
| Sample | Unpolished | Polished | ||||||
|---|---|---|---|---|---|---|---|---|
| Ra (nm) | Rq (nm) | Rz (µm) | Rp (µm) | Ra (nm) | Rq (nm) | Rz (µm) | Rp (µm) | |
| WC | 396.0±13.8 | 564.2±21.3 | 8.6±0.6 | 10.1±1.0 | 63.7±9.9 | 85.4±12.9 | 1.5±0.5 | 2.1±0.7 |
| HSS 1 | 359.8±17.7 | 503.0±26.8 | 8.0±0.8 | 9.9±1.5 | 320.7±23.6 | 458.0±32.1 | 8.2±0.3 | 9.9±1.2 |
| HSS 2 | 297.0±21.3 | 424.8±33.8 | 7.7±0.7 | 9.4±1.9 | 155.3±13.8 | 224.4±22.6 | 5.2±1.2 | 6.8±1.9 |
| HSS 3 | 283.3±10.1 | 395.5±14.4 | 6.1±0.8 | 7.2±1.2 | 43.6±4.0 | 57.7±9.1 | 1.0±0.8 | 1.9±1.2 |
| HSS 4 | 295.2±26.0 | 425.4±35.9 | 8.2±0.8 | 9.9±1.5 | 52.7±5.1 | 79.2±10.6 | 2.4±0.4 | 3.9±0.5 |
| HSS 5 | 269.3±16.3 | 376.9±27.1 | 6.1±0.7 | 7.5±1.0 | 66.2±9.7 | 92.1±16.0 | 2.2±0.8 | 3.3±1.0 |
Disclaimer/Publisher’s Note: The statements, opinions and data contained in all publications are solely those of the individual author(s) and contributor(s) and not of MDPI and/or the editor(s). MDPI and/or the editor(s) disclaim responsibility for any injury to people or property resulting from any ideas, methods, instructions or products referred to in the content. |
© 2023 by the authors. Licensee MDPI, Basel, Switzerland. This article is an open access article distributed under the terms and conditions of the Creative Commons Attribution (CC BY) license (http://creativecommons.org/licenses/by/4.0/).
Copyright: This open access article is published under a Creative Commons CC BY 4.0 license, which permit the free download, distribution, and reuse, provided that the author and preprint are cited in any reuse.


