Preprint
Article

Design and Multi-Objective Optimization of a Photovoltaic System by a Genetic Algorithm

Altmetrics

Downloads

93

Views

26

Comments

0

Submitted:

31 August 2023

Posted:

04 September 2023

You are already at the latest version

Alerts
Abstract
This study is focused on an optimal sizing method based on genetic algorithms (GA) in order to design a high-performance photovoltaic system that would be installed in the Alioune Diop University of Bambey, Senegal. The multi-objective optimization allowed us to find a better trade- off between the Total Life Cycle cost (TLCC) and the Loss of Power Supply Probability (LPSP). The goal is to minimize the TLCC while maintaining a good satisfactory of the system with a desired LPSP, under certain constraints. The expressions of the TLCC and the LPSP are established according to the total photovoltaic energy and the battery capacity. The toolbox of Matlab software is used to implement the optimization problem with twelve blocks of the site and its different corresponding loads. The obtained results have led to a several combinations of the photovoltaic and battery capacities of which the best one is selected based on the lowest LPSP, that guaranteed a better load coverage during the night. The results of this proposed method are compared with intuitive method that has been firstly applied. For the block with the lowest load demand, the proposed optimization model leads to a reduction a reduction of 70% and 48% in the storage capacity and the TLCC respectively for a LPSP of 0.007 %.
Keywords: 
Subject: Physical Sciences  -   Applied Physics

1. Introduction

The sizing is a very important step in the design of PV systems. It makes it possible to determine the size of the various components of the system. The installation of these systems offers more security to the environment and is an alternative to the disadvantages associated with the use of conventional energy sources. However, the high investment cost of these systems, and their limited technical performance, due to the environmental constraints, prompted researchers to deepen their research by making more accurate the optimization of the most expensive components, such as the storage device and the PV field. Several sizing and optimization methods have been used in the literature for the design of PV systems. The methods such as analytical, intuitive, numerical are used to obtain the optimum size of system components. A new analytical model has been developed by [1] to determine the sizing optimum of a stand-alone PV system. Formulas have been used for calculating the capacity (Ca) of the photovoltaic field and the capacity (Cb) of the storage battery. The main drawback of the analytical method is the complexity of derivation of the equations, but it is simple and precise[2].
With traditional optimization methods, it is not easy to find all the optimal solutions and are often constrained by the unavailability of meteorological data. However, to achieve better system sizing at minimum cost, several optimization techniques have been used but the most popular models have been revised in [3], such as graphical construction model, probabilistic model, iterative optimization techniques, artificial intelligence techniques. However, artificial intelligence techniques offer an alternative for the sizing of photovoltaic systems in many areas that lack complete data and have been presented in [4]. There are artificial neural networks (ANN), fuzzy logic (FL), genetic algorithm (GA) and hybrid systems.These methods each have their own characteristics but Genetic Algorithms are very effective for finding the global minimum, very suitable for optimization problems and overcome the unavailability of meteorological data [5]. The performance of standalone photovoltaic systems has been analyzed by several authors through the sizing and optimization of the size of these systems. For example, Dhaker Abdes et al.[6] study the total life cycle cost, embodied energy, loss of power probability for the optimal design of hybrid power systems. The proposed analysis uses a multi objective to minimize the total life cycle cost, stored energy and loss of system power probability. A multi-objective optimization based on genetic Algorithm has been used by [7] for the minimization of the total cost of electricity (TLCC) and the Loss of Power Supply Probability (LPSP) of the load, simultaneously. In another work, a procedure has been developed by M Zagrouba et al. [8], which identifies the parameters of solar cells and modules using genetic algorithms. The analysis shows that it is possible to perform a numerical technique based on genetic algorithms to identify the electrical parameters of photovoltaic solar modules and cells in order to find the maximum power point. Similarly, the work of Ami Sadio et al [9] analyzes the performance of PV systems through a comparative study based on the method of genetic algorithms for the optimal sizing of an autonomous photovoltaic system in the Ngoundiane site. To minimize the cost while covering the load demand with a specified value for the loss of load probability a sizing optimization of a hybrid system using genetic Algorithm has been applied in[10]. Effective analysis has been used to find the optimal PV/battery combination that satisfies load demand at minimal cost. Hence, D H Muhsen et al.[11], developed a multi-objective optimization algorithm to optimize the size of a photovoltaic pumping system (PVPS) based on two technical (reliability) and economic (cost) objective functions. Genetic algorithms are also used by Muhammad Shahzad Javed et al.[12], in their technical-economic evaluation study of a stand-alone hybrid solar-wind-battery system. In the literature, the use of genetic algorithms offers great performance in the studies carried out. In addition, the previous study of certain authors is based on simple sizing methods or on software like HOMER to solve their problems[12]. Among these methods, we can note the intuitive method or the use of evolutionary algorithms. The objective of the optimization problem in this study is to simultaneously minimize the cost and the energy deficit of the system. The optimization must make it possible to achieve the best possible compromise between these two criteria. The resolution of this type of problem involving two objectives with the same weight, leads to the research for several solutions called Pareto solutions and not single optimal solution.
Thus, in this study an optimization algorithm to solve a multi-objective problem is be developed. The two objective functions used, are the total life cycle cost (TLCC) and the loss of system power probability (LPSP). The mathematical expressions of these functions are expressed according to the photovoltaic and storage capacities, which represent the decision variables. The objective is to find the optimal configurations of photovoltaic and storage capacities corresponding to satisfactory reliability and minimum cost. In the following, Matlab software will be used to run the optimization problem. Thus, the two objective functions is transformed into mathematical functions, dependent on two variables. All the constraints are be expressed as a function of these two variables. After, the terminals the limit of the "objective" functions and the properties of the genetic algorithm is defined. Finally, the obtained results is presented and commented.

2. The Genetic Algorithm (AG)

The most widely heuristic approach used to solve nonlinear-variable problem is the AG.
Due to their very good ability to find the solutions when there is a nonlinear relationship between the variables of the problem, the GAs are considered as the best alternative to solve problems in different aspects of life.
It consists of randomly creating an initial population and using the rules of natural genetics to form the next generation from the one already created. Similarly, genetic algorithms are very effective in finding the global minimum and are used to overcome the unavailability of meteorological data [5]. To reduce the chances of obtaining a local minimum, the parameters of the algorithm are defined based on the following assumptions:
  • population size: the number recommended for less than five population variables decision is 200, but research has shown that a variation in size from 100 to 3000 has no significant change on the results [13];
  • selection and crossing: in most case, the roulette function are considered for the selection with the crossover fraction equal to 0.8[10];
  • mutation: GAs use a random mutation procedure to explore new solutions; research has shown that this procedure alters a small percentage of the population except the best individuals; thus a mutation rate between 1% and 20% is often used; for a higher mutation rate too many vouchers parameters can be mutated, then the algorithm stops[8].

3. Input parameters description Results

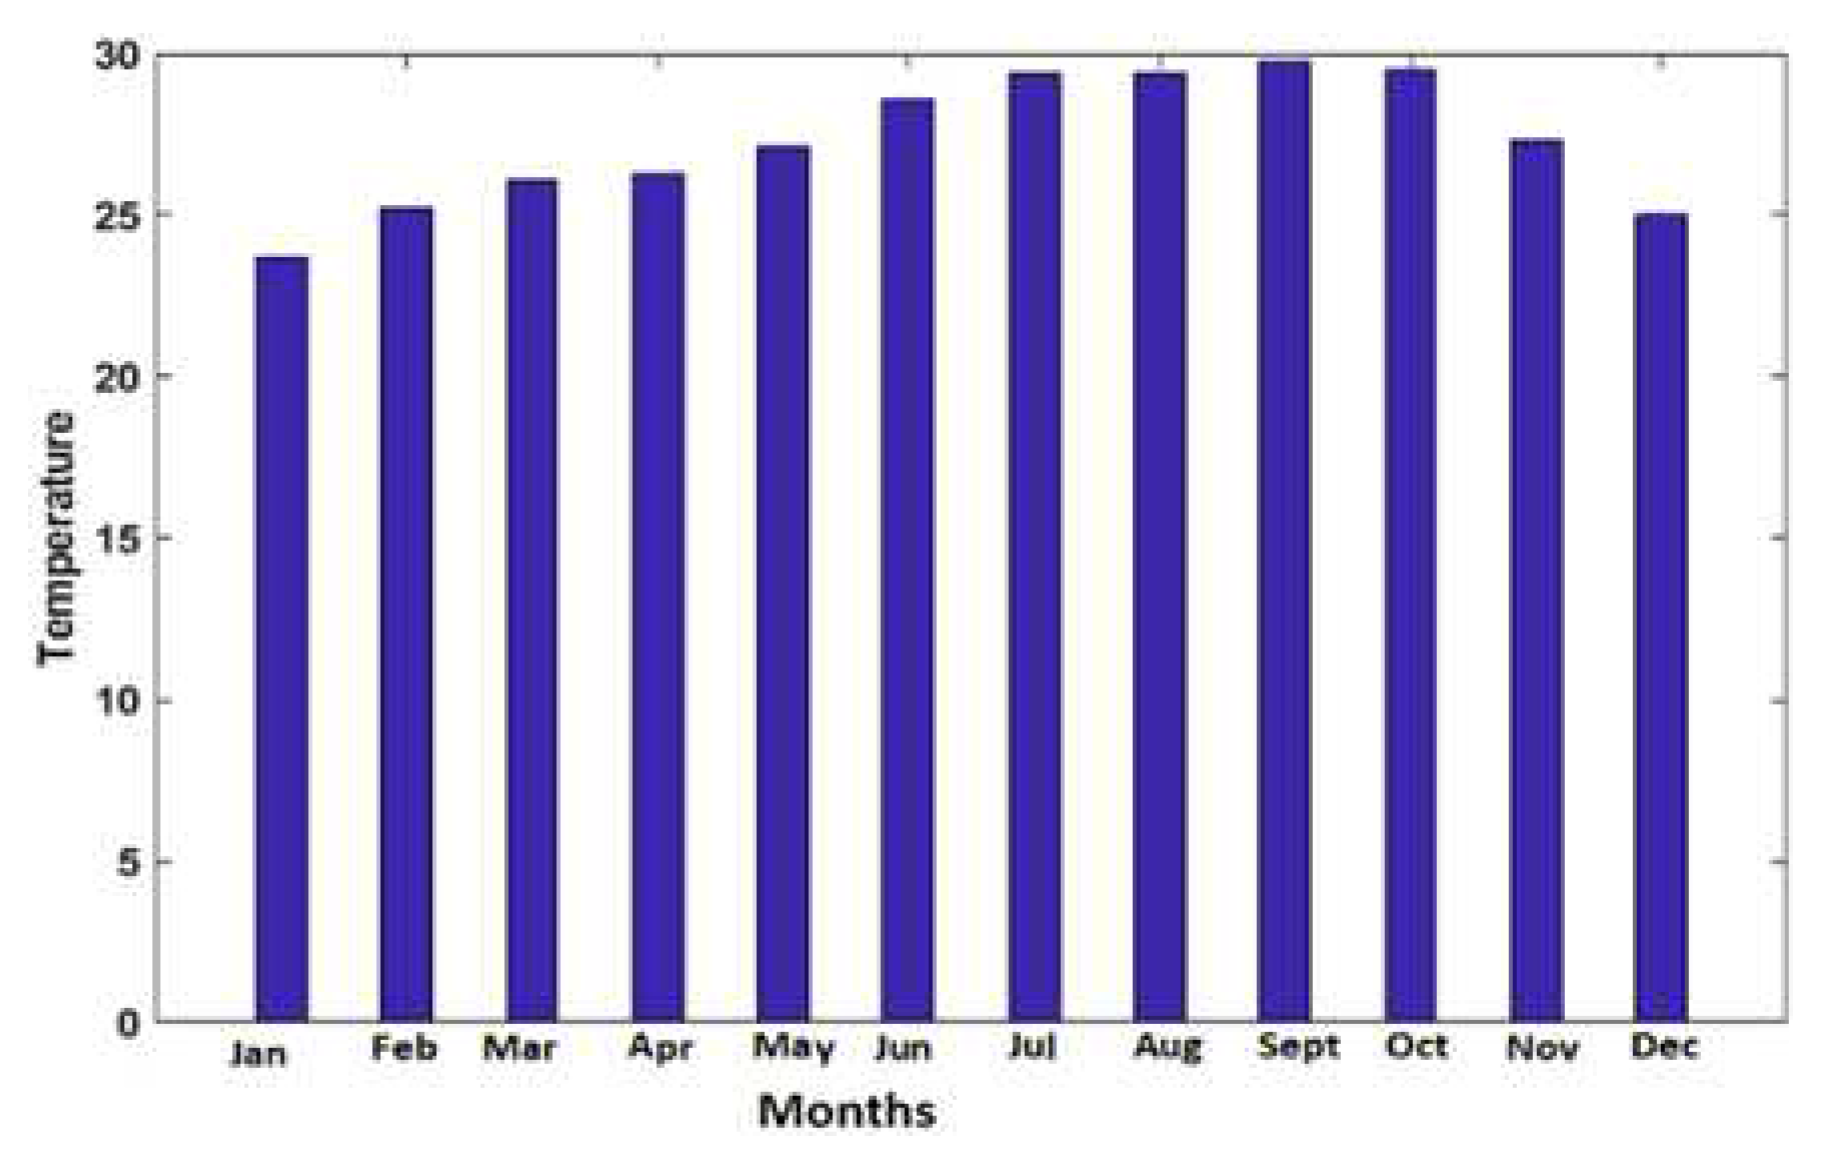
In our study, we used the sunshine data from the Ndem site which is located in the Bambey area and the load demand from building-block number 4, of Bambey University for the optimization. The average annual variations in temperature and irradiation are given by the following Figure 1 and Figure 2 respectively:
Figure1. Annual variation of solar irradiation in the Ndem area.
The site has a high average annual solar radiation of about 5.89 kWh/m2. The months of April and May are the sunniest with 7.06 kWh/m2, 6.87 kWh/m2 respectively. While the lowest average irradiation is noted in January and December with 5.26 kWh/m2, 4.88 kWh/m2 respectively, as shown in the Figure 1. The annual variation in ambient temperature is illustrated in the Figure 2. The analysis showed that the months of September and October present the highest average monthly ambient temperatures which are 29.8˚C and 29.5˚C, respectively. However, the months of February and December recorded the lowest average monthly ambient temperatures of around 25.2˚C and 25˚C, respectively.
The Table 1 shows the values of load demand for all the blocks of the site. Nevertheless, the case of the building-block number 4, corresponding to the lowest load demand, is used in this study.

4. Sizing method proposed

4.1. Formulation of the optimization problem

The elaboration of the optimization problem consists to the determination of the mathematical expressions of the two objective functions according to the two decision variables, as well as the constraints associated with the problem. Firstly, the expression of the objective function CTCV is determined, then after the objective function LPSP is established. Hence, a change of variable and the definition of the associated constraints is carried out. The total life cycle cost is used to make the economic evaluation of the system. It is given by the following equation.
C T C V = C c a p + C M 25 + C R ,
Where Ccap is the initial capital cost, which corresponds to the component, and the installation costs, CM25 is the maintenance cost and CR represents the replacement cost. The initial capital cost consist of the component costs and the maintenance cost. It is given by the following equation:
C c a p = C p v + C b a t + C i n v + C r e g + C i n s t ,
Where, Cpv, Cbat, Cond et Creg represent the costs spent for the acquisition of panels, batteries, inverters and regulators respectively; Cinst is the investment cost. To calculate the maintenance cost over the lifetime of the system and replacement cost, Equations (3) and (4) are used respectively
C M 25 = C M [ ( 1 + i ) N 1 i ( 1 + i ) N ] ,
C R = c o m p C C × F D ( i , C ) ,
Where, N is the lifetime of the component, CM the maintenance cost for each year, which represents 1% of the initial capital cost, CC, is the total cost of the components, FD the reduction factor which is a function of the market participation rate (i) and component type (C).The reduction factor is determined from the following equation:
F D = ( 1 1 + i ) N ,
The total life cycle cost of the system (TLCC) includes the total cost of materials, the cost of maintenance, and the replacement cost of the batteries, the inverters and the regulators. The maintenance cost represents 1% of the total cost of materials. As for the cost replacement, we assume that the modules have a lifetime equal to that of the project and therefore will not require any changes, while the other components such as the batteries, inverters and the regulators have a lifetime of 5, 10 and 10 years, respectively, and will require changes
C c a p = 311.358 P p v + 321.90 C a b a t + 4461434.909 ,
C M 25 = 66.49 P p v + 15.50 C a b a t + 407496.23709 ,
C R = 1210.05 C a b a t + 3850964.704 ,
PPV is the total power of the PV; Cabat corresponds to the total storage capacity of the batteries. This allowed us to come to the global equation of the TLCC depending on the variables of the optimization problem.
T L C C = 377.87 P p v + 1547.45 C a b a t + 8719895.85
The second objective function named loss of power supply probability (LPSP) is defined as the load demand not satisfied by the system over a given period. It is determined by the ratio between the energy deficit (LPS) which represents the load that is not satisfied by the system and the load demand (EL). This model is widely used in the literature to evaluate the reliability of the system. LPSP varies from 0 to 1. When the LPSP is 1, it means that there is an unmet load during the whole simulation period and when the LPSP is equal to 0, there is not an unmet load. Its expression is given by the following equation:
L P S P = L P S E L
The LPS is a function of the average energy produced by the photovoltaic system Epvav, the average energy stored in the batteries Ebatav, which are given respectively by the Equations (11) and (12)
E p v a v = A p v × η i n v × η w i r e × I × η r [ 1 β ( T t a m b + G r e f 800 ( T N O C T 20 ) T r e f ) ]
E b a t a v = E b a t min + ( E p v a v E L η i n v ) η b a t
Where Apv is the area of the PV array, η i n v ,   η w i r e and η b a t are the efficiencies of the inverter, wire, and the batteries respectively, η r is the nominal efficiency given by the manufacturer. I is the solar irradiance in W/m2, β is the temperature coefficient, Tamb is the ambient temperature, TNOCT is the nominal cell temperature of module, Tref is the reference temperature. So LPS is defined by the following equation:
L P S = E L ( E p v a v + E b a t a v + E b a t min ) η i n v
The mathematical expression is determined according to the two decision variables Ppv and Cabat by considering the input parameters. Thus, we obtained the Equations (14), (15) and (16):
E p v a v = 2.22 P P V
E b a t a v = 2.368 P p v + 34455.55556
L P S = 2.06 0.000142034 P P V + 0.000069654 C a b a t
To simplify the two objective functions, the following changes of variables are performed Hence, we set: X = TLCC, Y = LPSP, X1= PPV and X2 = Cabat. We thus obtain the Equations (17) and (18).
X = 377.848 X 1 + 1547.45 X 2 + 8719895.85
And
Y = 2.06 0.000142034 X 1 + 0.000069654 X 2

4.2. Delimitation of the research space with the intuitive method

To obtain the maximal power of the PV array and storage capacity of the batteries, the Equations (19) and (20) are used respectively.
P p v = 1000 × E d K × I
Constant 1000 represents the reference illumination under optimal conditions of sunshine and temperature, Ed is the daily energy consumed and K is the overall efficiency of the system:
C a b a t = N j × E d d p × U S × η b a t
Where, N j is the number of autonomous days, d p is the depth of discharge rate of batteries and U s is the voltage of the system. To delimit the research space and avoid obtaining unfeasible solutions, the objective functions and the decision variables will have in domains in which the constraints can be defined. Thus, all the possible solutions will appear in the defined space and the considered constraints will allow to choose the best solutions for each iteration. The delimitation of the research space is characterized by the lower and upper bounds of the decision variables which are thus given. The variable X1 is delimited by the unit power of the solar module (Pu) and the value of the maximum power (Ppv) obtained from the intuitive method. Similarly, the variable X2 is between its minimum value, which is represented by the unit capacity of a battery and its maximum value that is the maximum storage capacity obtained with the intuitive method. Thus, its two variables satisfy the following conditions:
280 X 1 16240
500 X 2 2153.47

4.3. Definition of the constraints

In the research space, we look for finding the optimal combination of the two decision variables that minimizes the two objective functions while satisfying the following constraints:
  • the average energy produced by the PV array must be able to supply the load of the building-block while recharging the storage system. This is governed by Equation (23):
0.148 X 1 3445.55556 = 0
  • the loss of power supply probability varies from 0 to 1.This is expressed by the following inequalities 24 and 25:
1.06 0.000142034 X 1 + 0.000069654 X 2 0
0.000142034 X 1 0.000069654 X 2 2.06 0
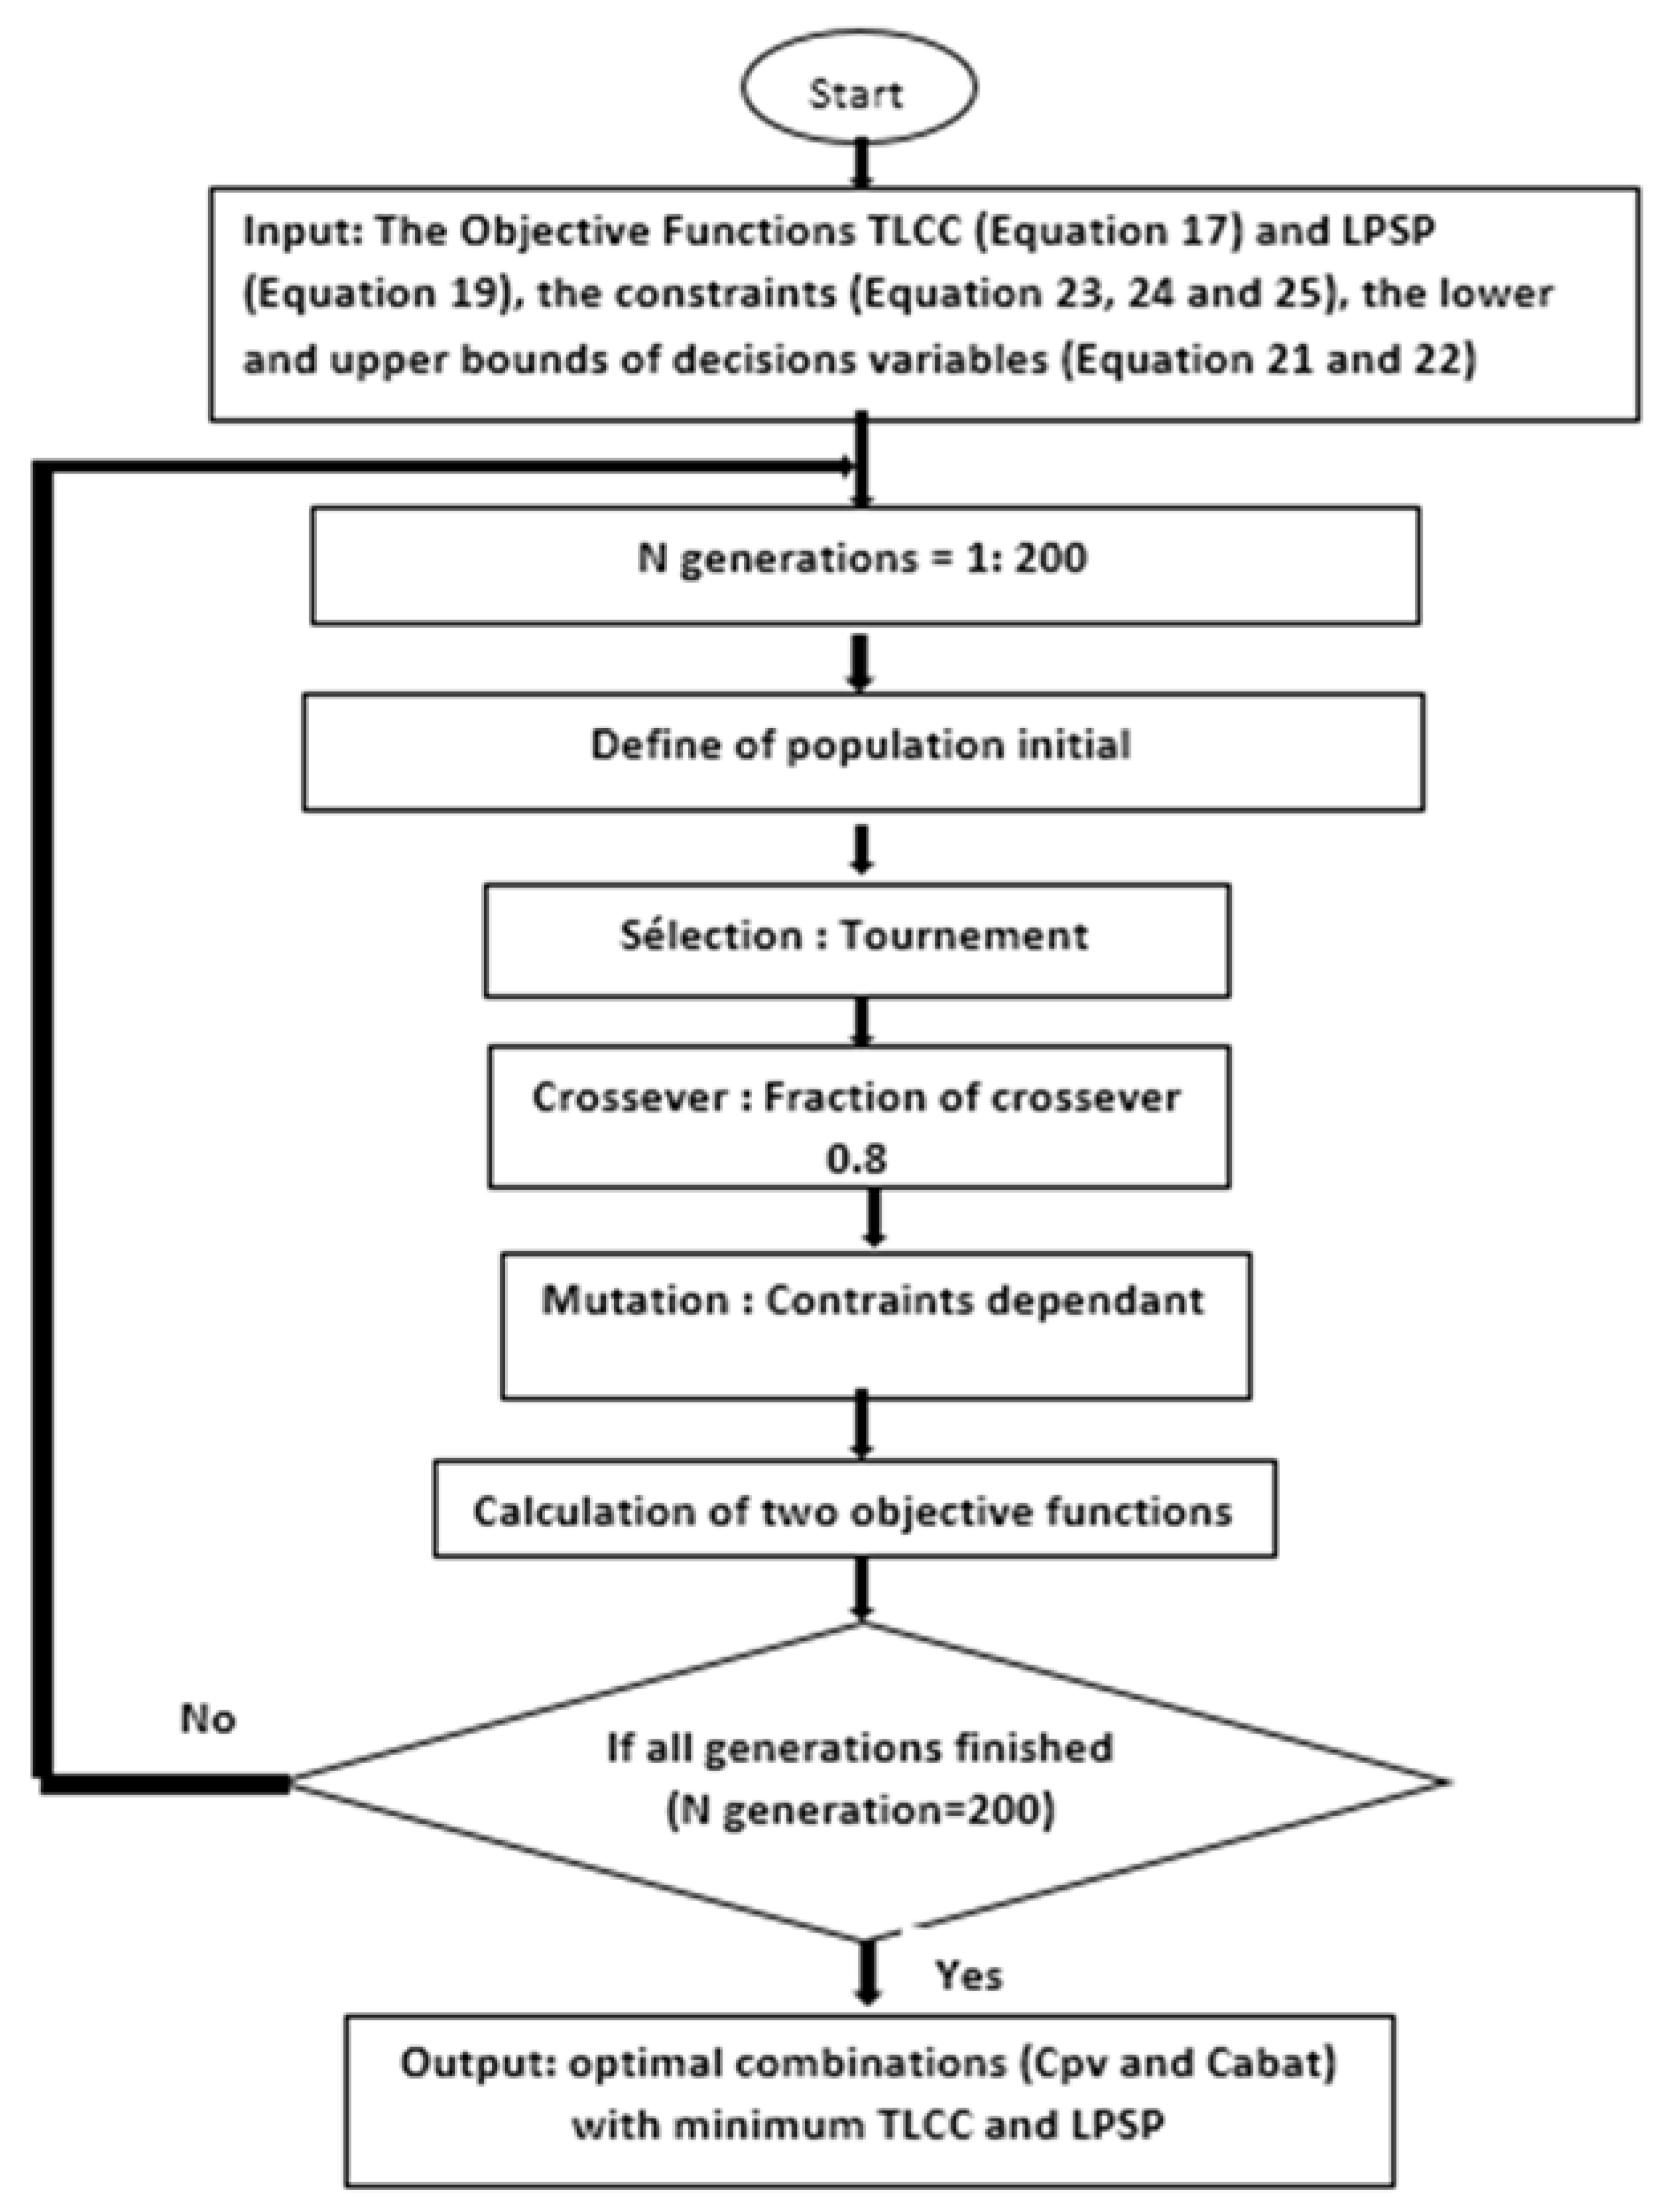
The GA interface of Matlab software is used to run the optimization process according to the principle of genetic algorithm given in Figure 3.
The parameters of the genetic are defined in the optimization toolbox as show in the table below
Specifications Values
Population size 200
Initial Population Random
Selection Tournement
Crossever Fraction of crossever 0.8
Mutation Contraints dependant

5. Results and discussion

After 13 iterations, the optimization provided the optimal values ​​of the objective function with their corresponding decision variables. The results obtained for the building-block number 4, is presented in the following table.
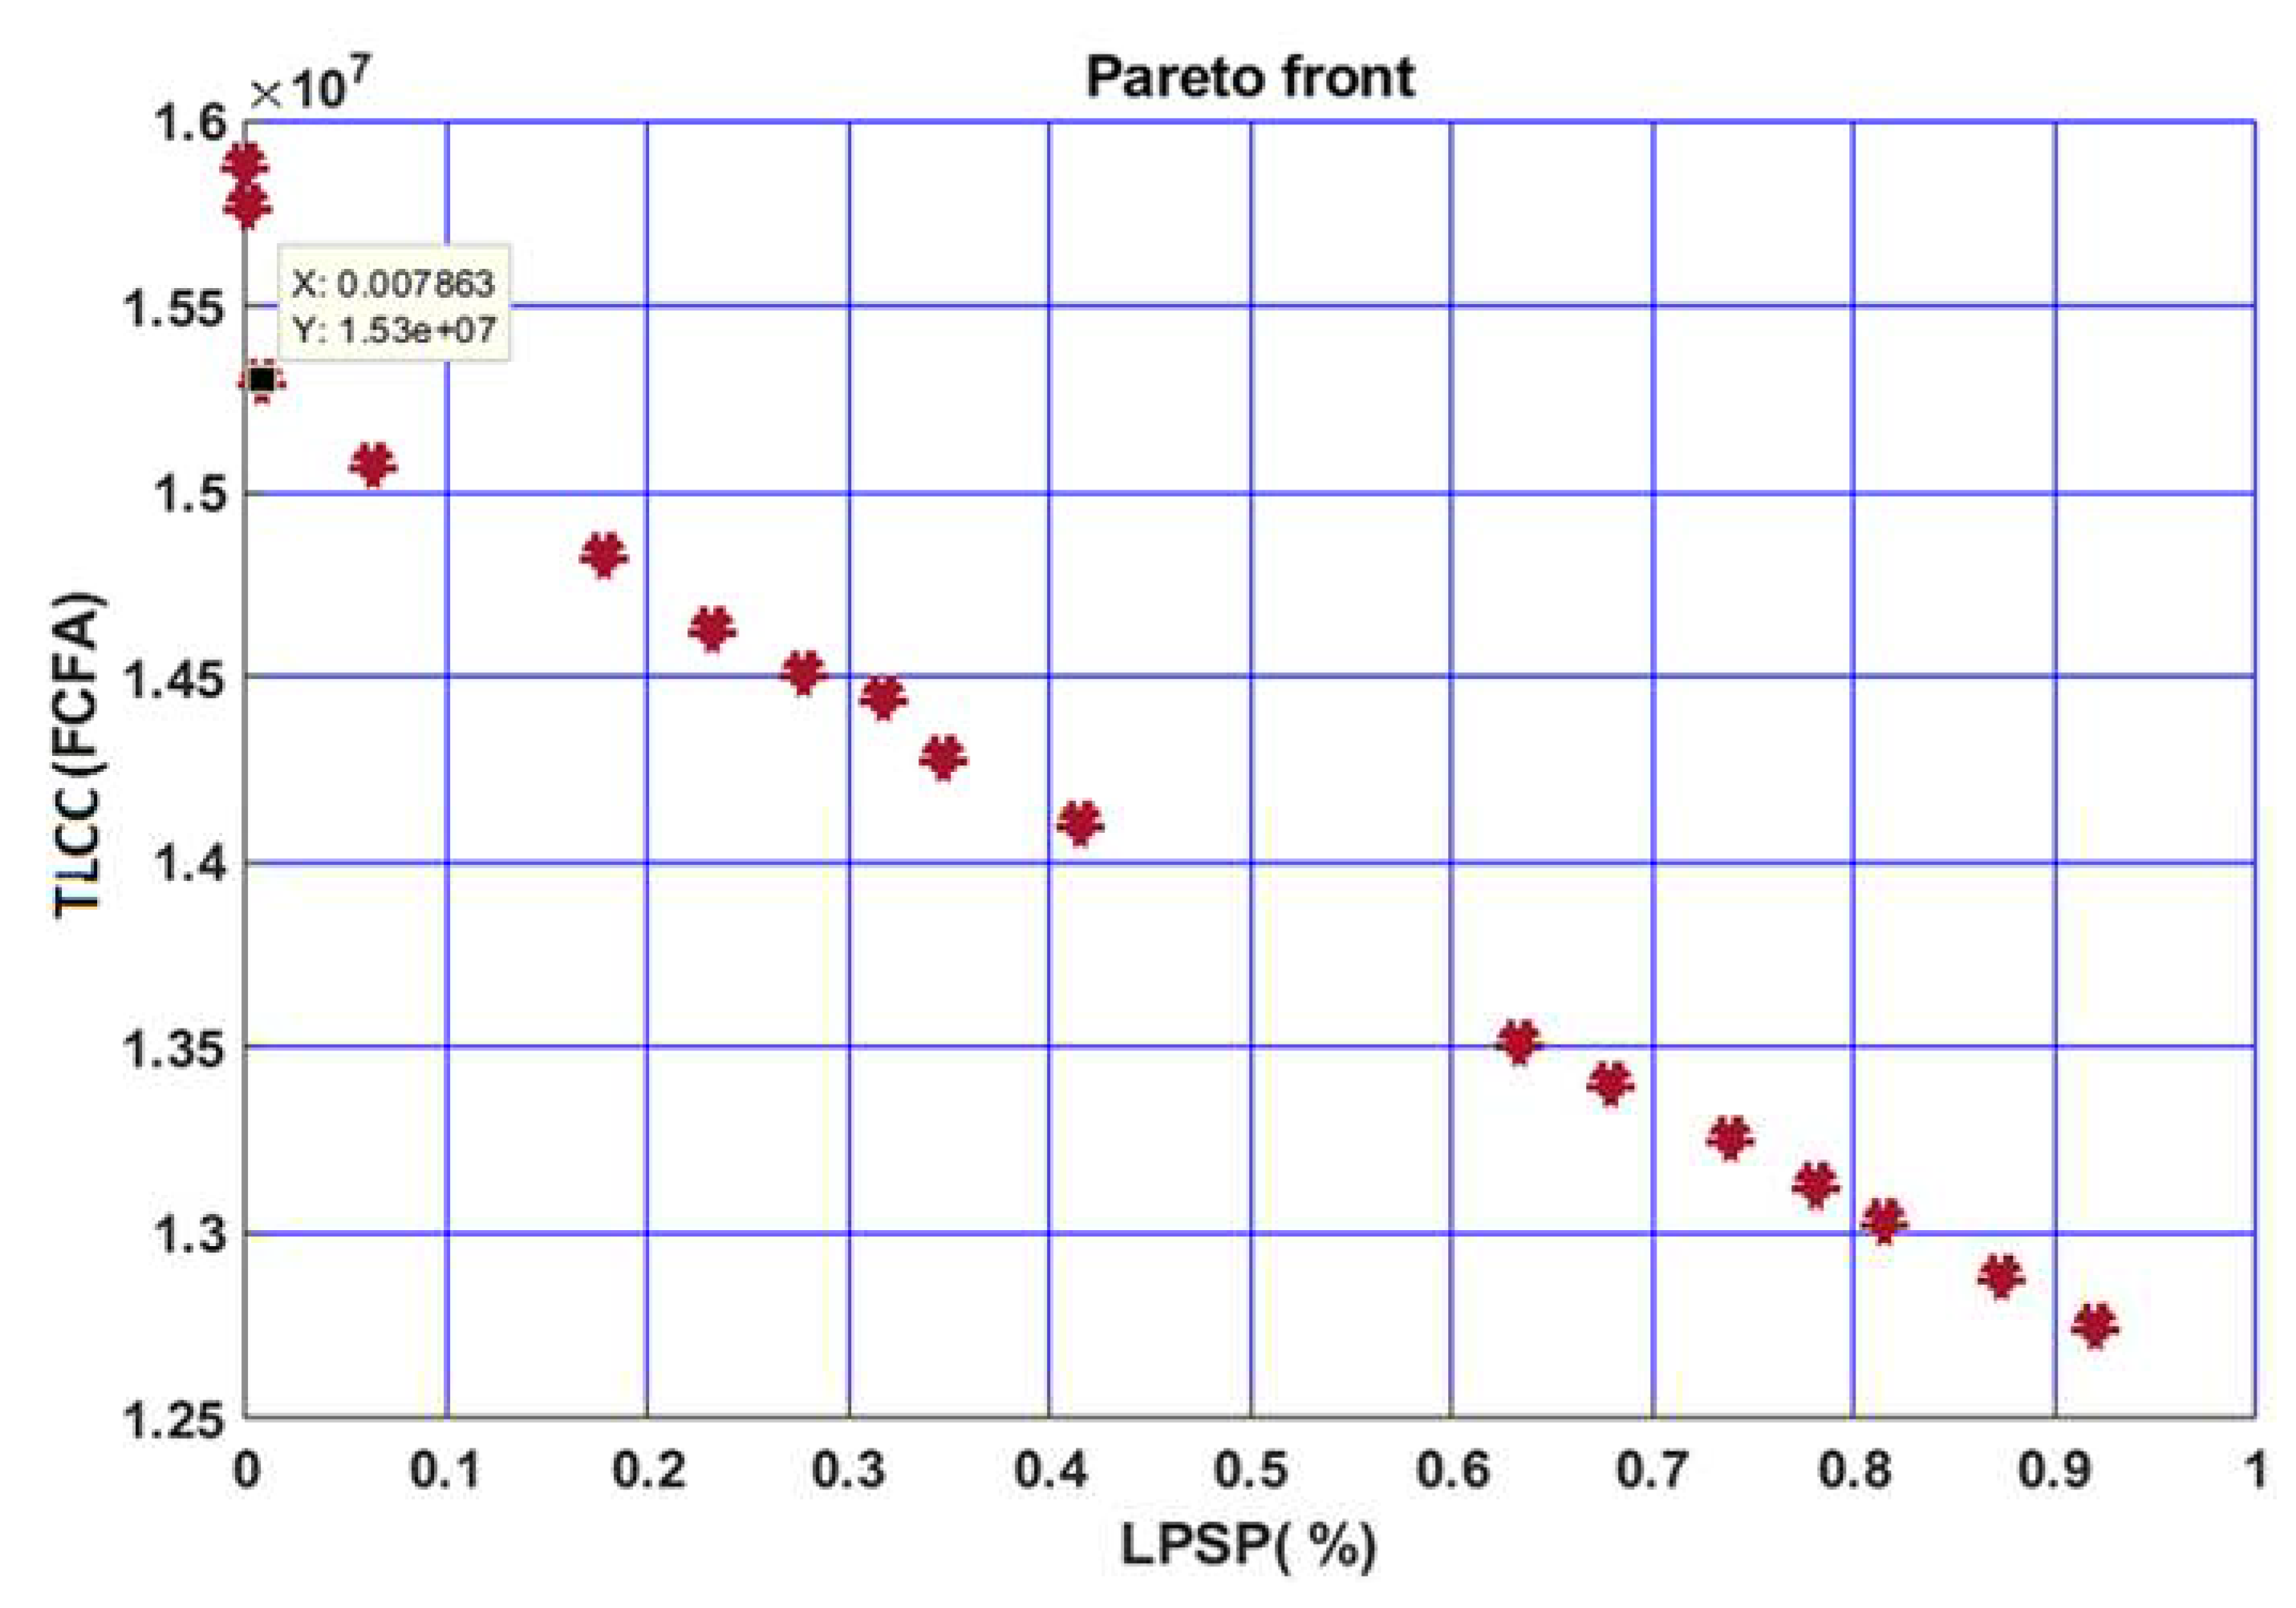
From the results of the optimization presented by Table 3, the Pareto front is generated; it gives the set of compromise solutions corresponding to a combination of PV and storage capacities. A set of optimal solutions has been found unlike to the multi-objective optimization method used by Amy sadio et al[9], who finds a single optimal solution. Among these solutions, the choice is made by considering the combination, which minimizes total life cycle cost while satisfying system needs. The optimal solutions are represented by the indices 2 from the Table 3 above. Figure 4 gives the variation of the total cost over the life cycle according to the Loss of Power Supply Probability.
Figure 4 shows that the two objective functions are antagonistic. Indeed, the increase of LPSP leads to a decrease in TLCC. This is explained by the fact that when the PV and storage capacities are low, the energy generated by the system becomes weak, which increases the risk of an energy deficit. At the same time, the TLCC is reduced. A decrease in the LPSP from 0.31% to 0.001% improves the reliability of 30.9% for a cost increase of 8.41%. While a decrease of the LPSP from 0.87% to 0.001% leads to an increase in the reliability of the system of 86.9% with a cost increase of only 18.28%. This shows that the reliability of the system can be increased significantly without a considerable increase of TLCC. This was justified by the work of Razman Ayop and al[14], who demonstrated that the reliability can be significantly improved without a significant increase in total life cycle cost. The optimal values ​​of the objective functions are chosen by considering the lowest LPSP, corresponding to the lowest capacity of the battery, capable to satisfy the load demand during night and at a minimal cost. Thus, the results of the optimization provide an optimal combination with an LPSP of 0.007% and a TLCC of 15303151.43FCFA corresponding to battery and PV capacities equal to 648.69Ah and 14766.33Wp, respectively. With the proposed method, the obtained results are satisfactory with a low LPSP at a reduced cost. In Carlos Eduardo et al.[15], it has been shown that if the LPSP increases, the system becomes less robust, with lower cost and lower energy production. This justifies the antagonistic relationship between the two objective functions.
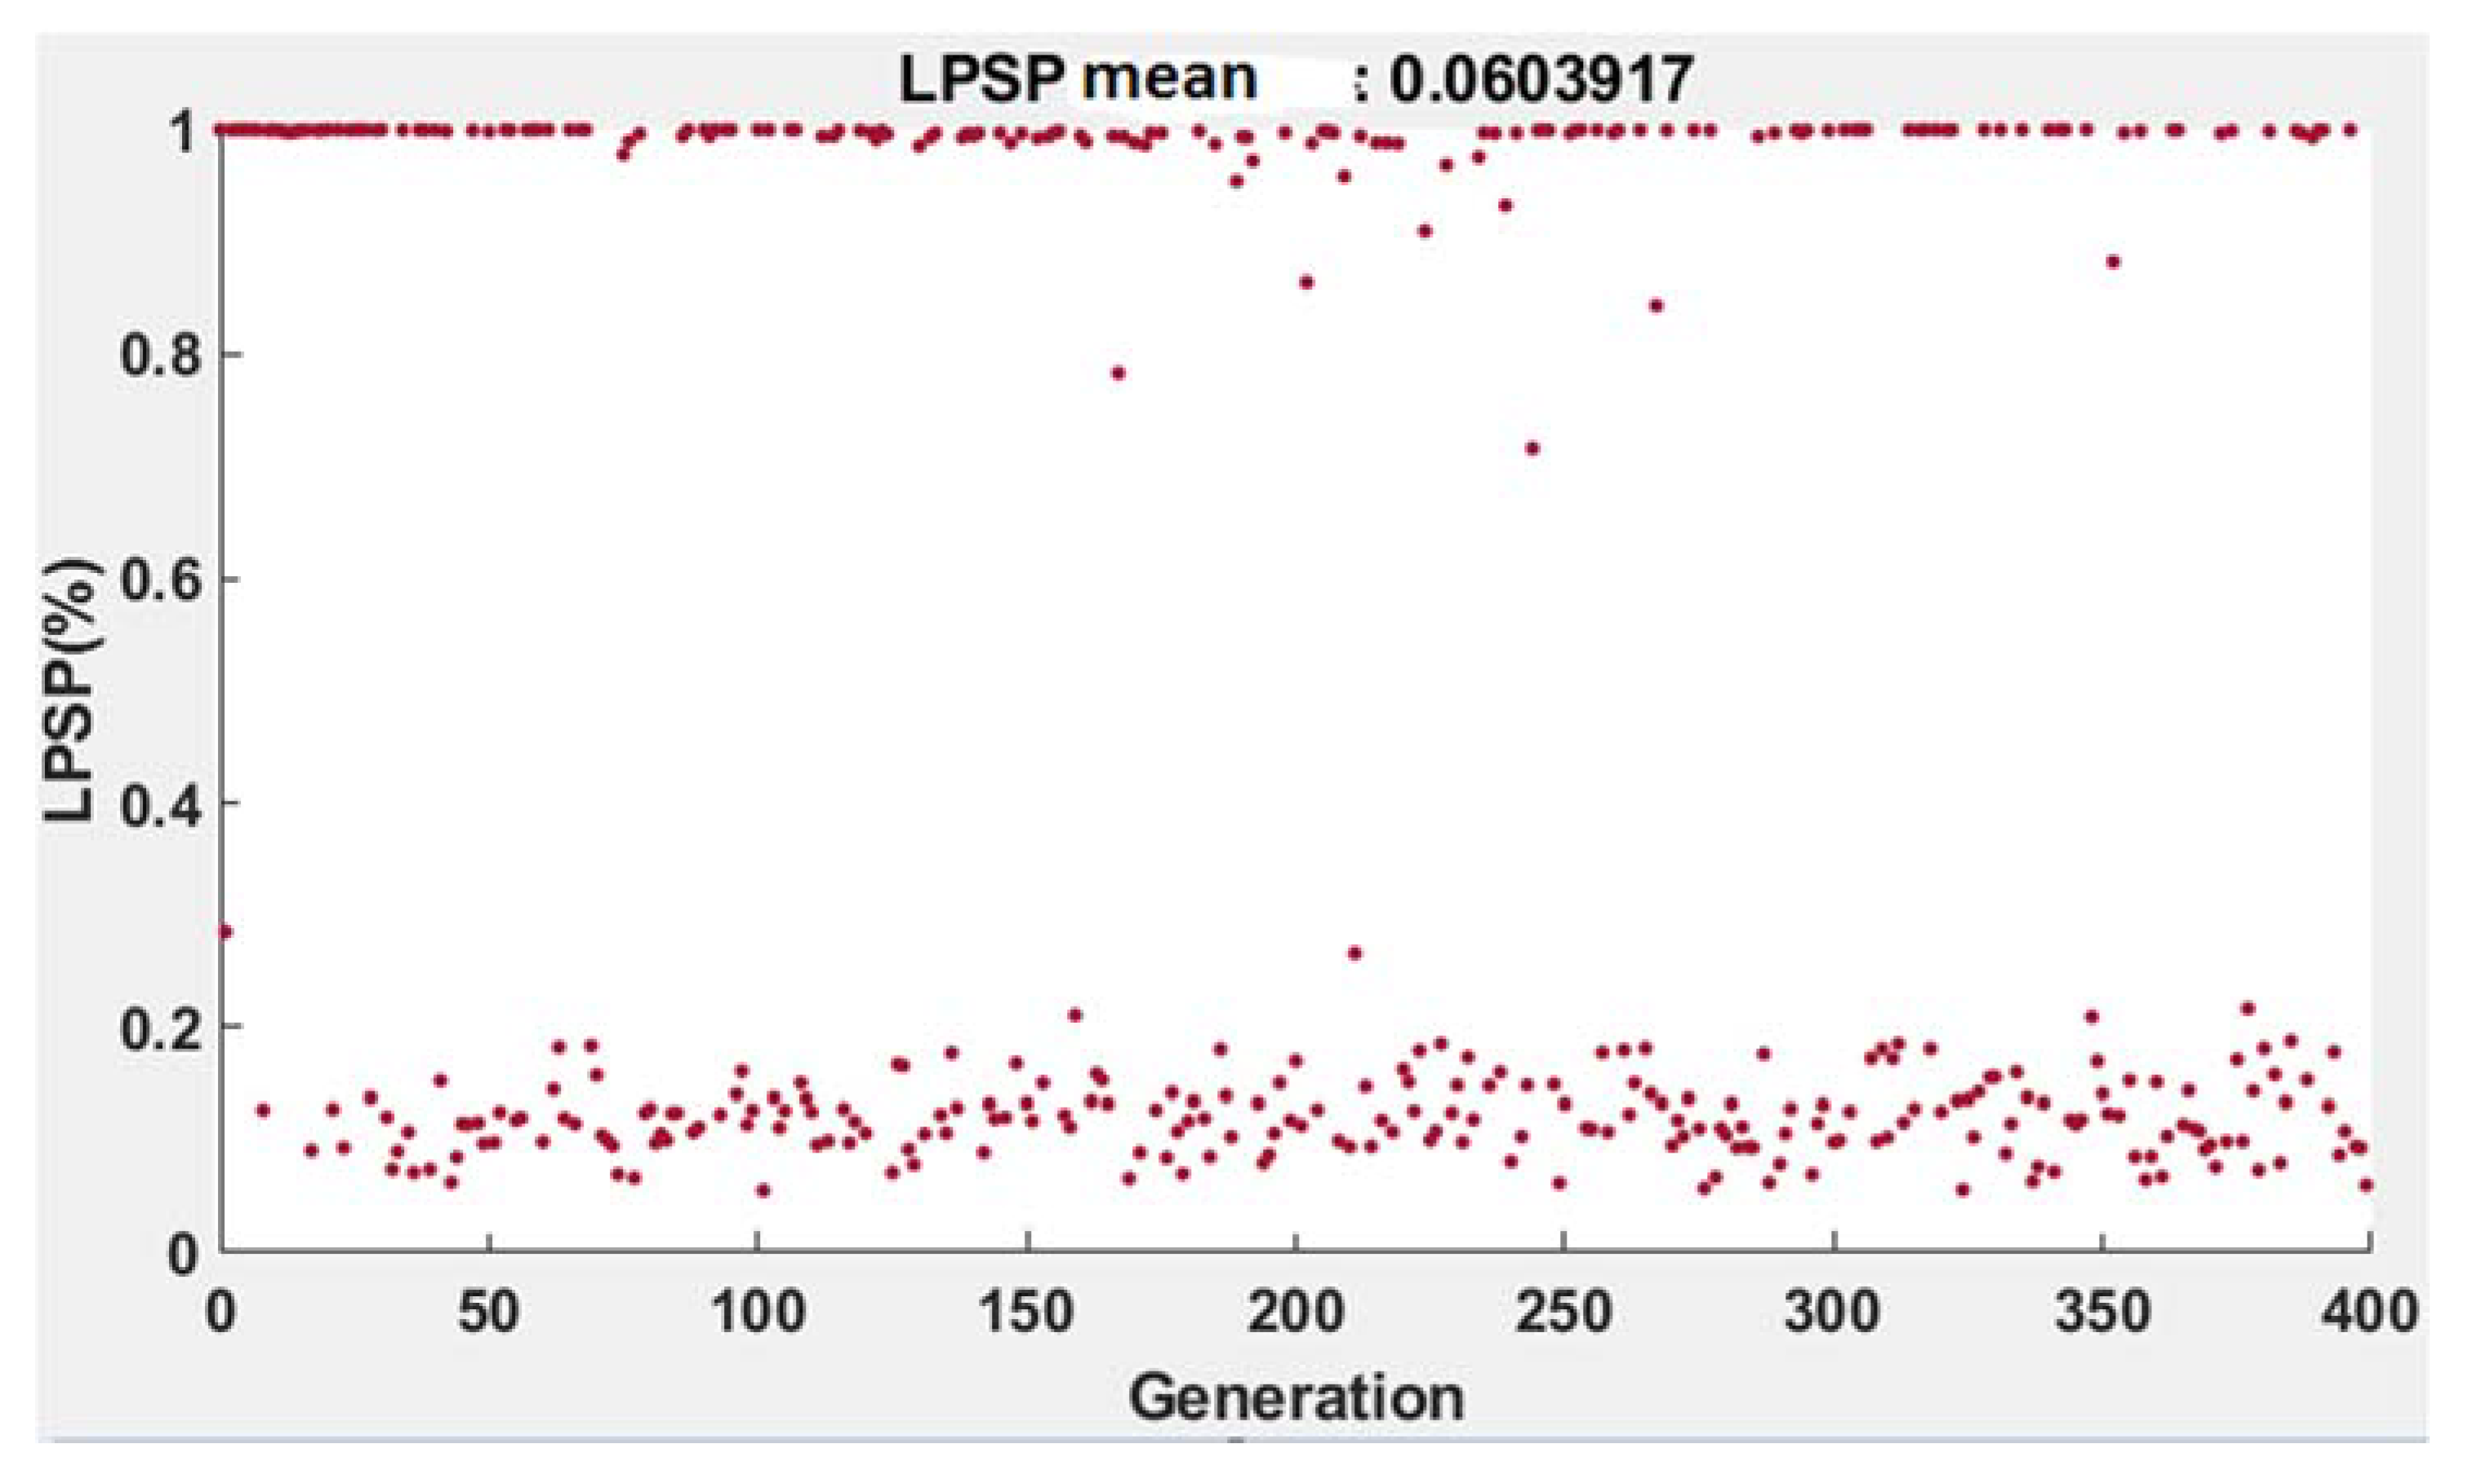
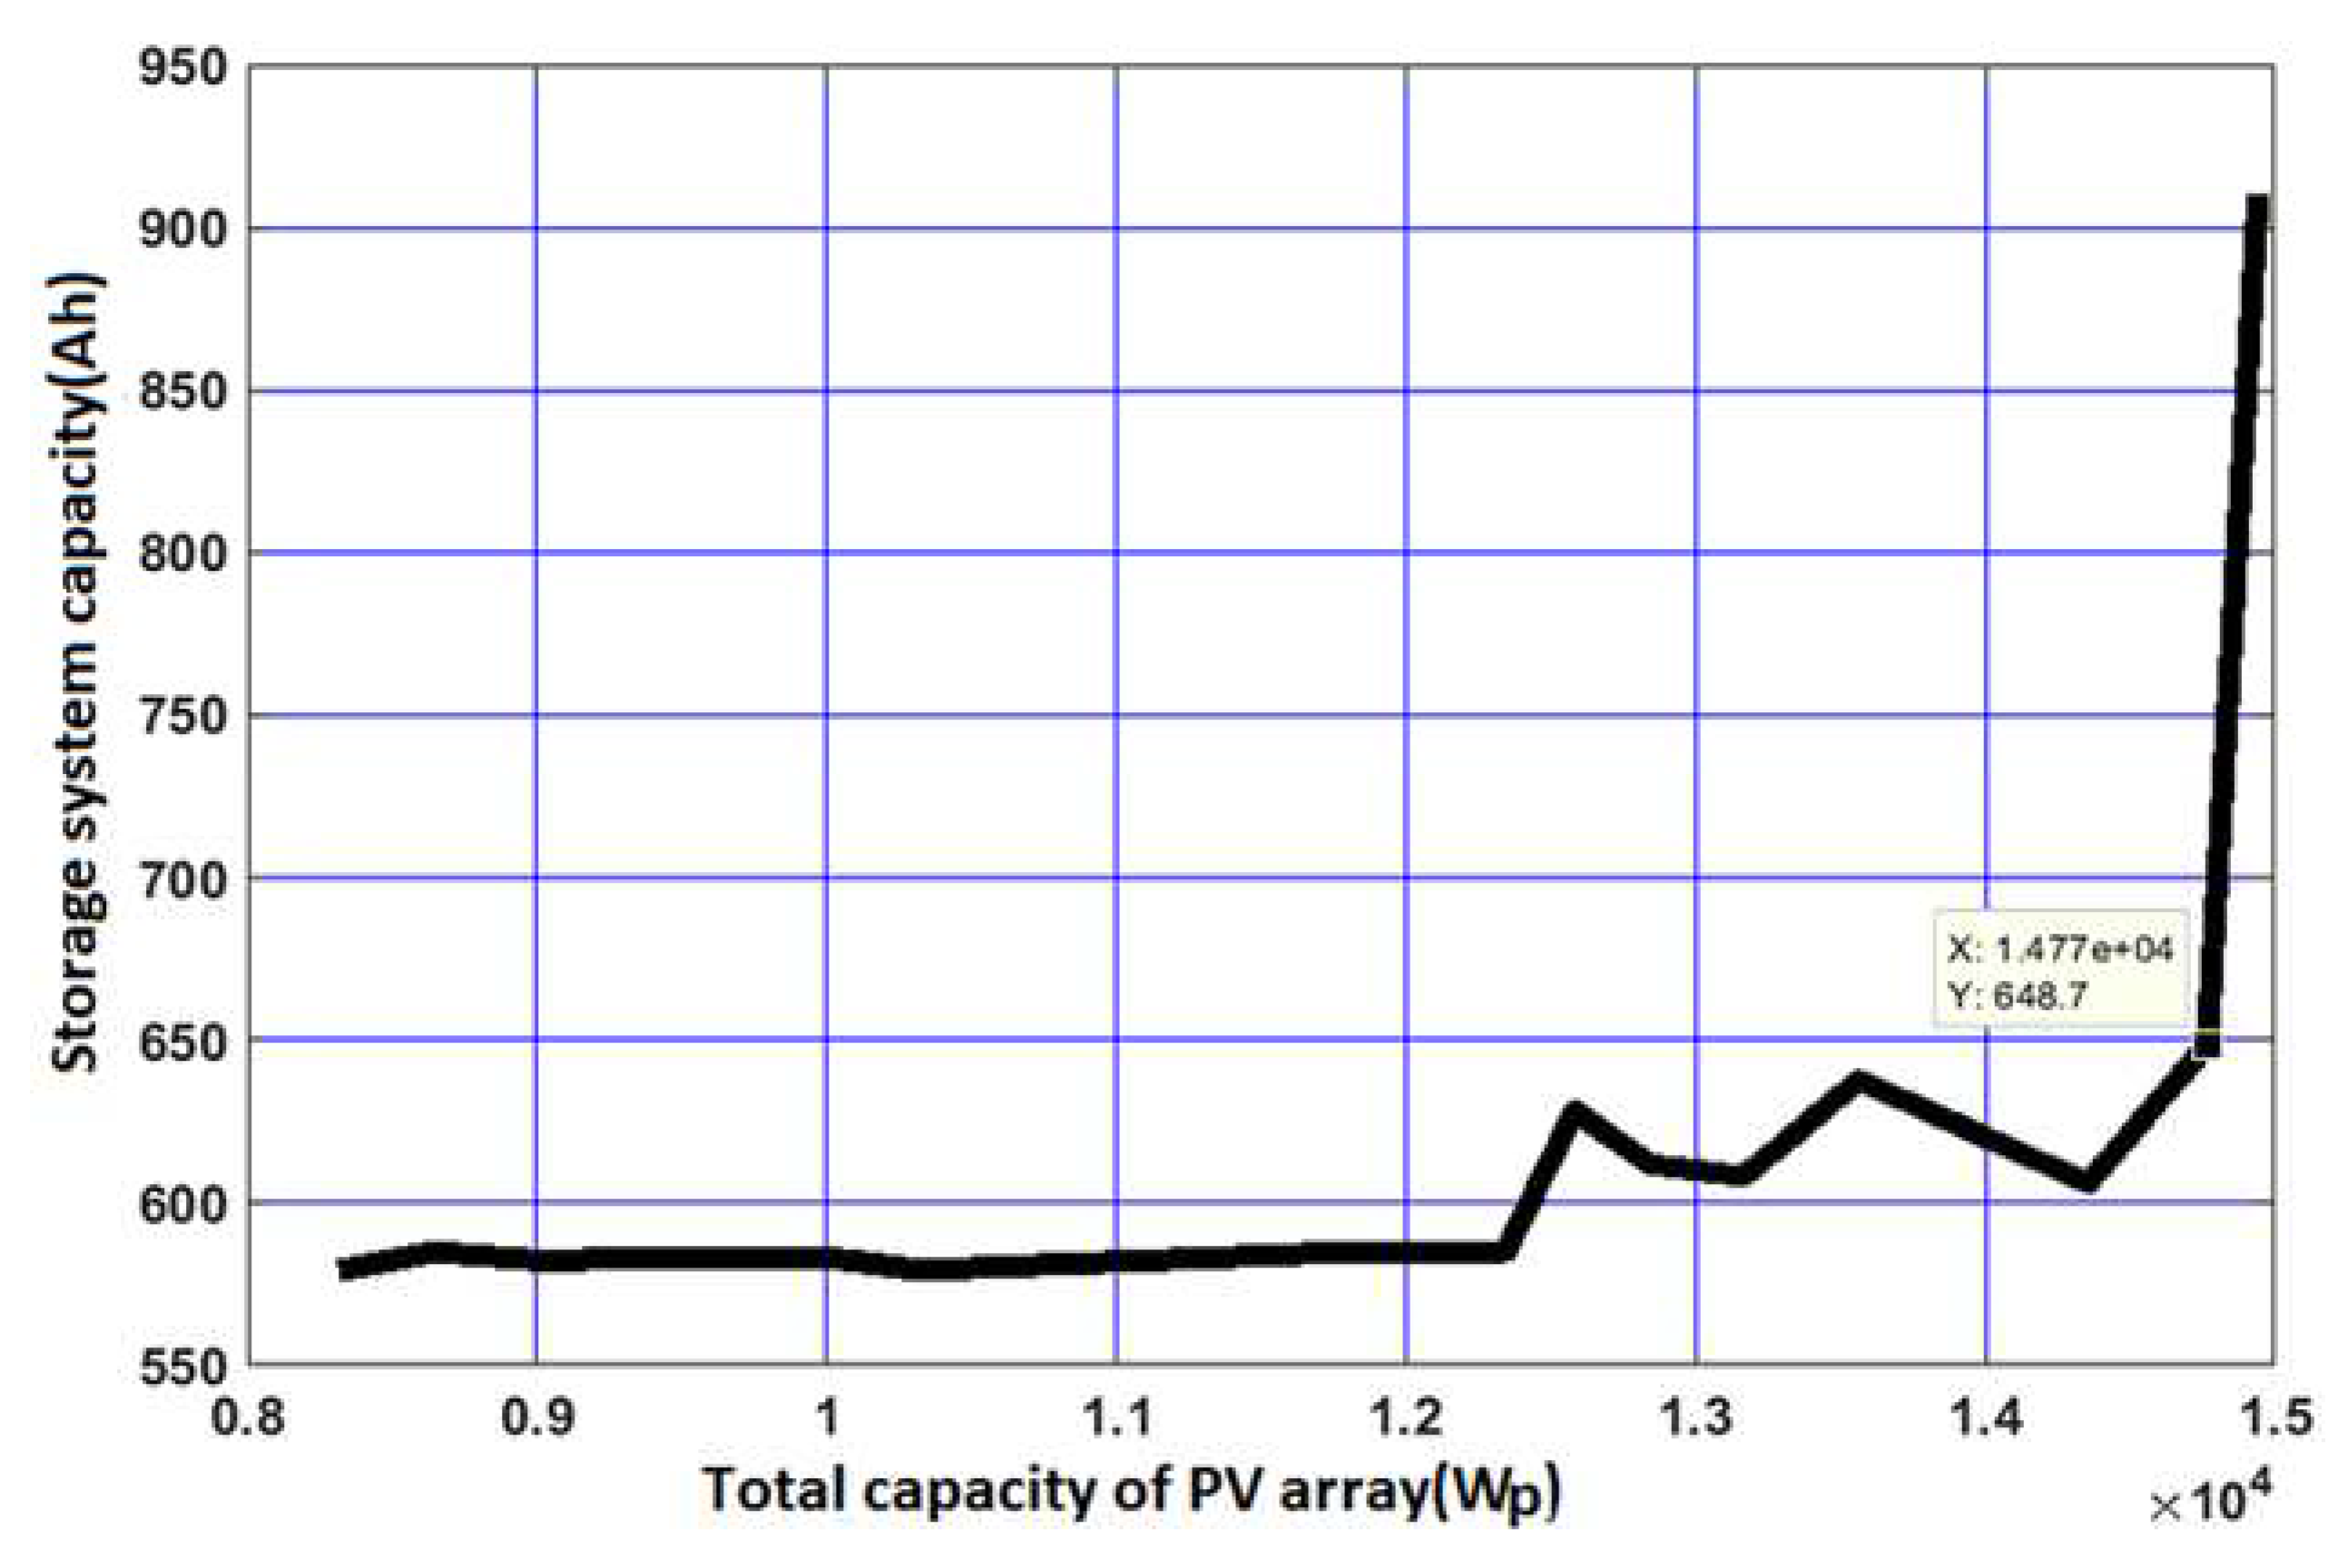
From Figure 5, we noted that the found average value of the LPSP is close to the optimal value that is obtained. In Figure 6 we have the variation of the capacity of storage system versus the total PV system.
From Figure 6, we note the evolution of the capacity of the storage system based on total PV capacity. For values included between 8642.18 Wp and 14766.33 Wp, the storage capacity varies slightly. Below 14766.33 Wp, corresponding to the optimal point, there is a strong increase in storage capacity from 648.69 Ah to 910.33 Ah. This is explained by the fact that, below the optimum point, the energy generated by the PV field is not very large to satisfy all the load requirement so the system does not require a large battery capacity. This is explained by the fact that, below the optimum point, the energy generated by the PV field is not very large to satisfy all the load requirement so the system does not require a large battery capacity. Beyond this point, a greater PV capacity is obtained and implies higher storage capacities. The optimal combination shown in Figure 4, gives an optimal capacity of the PV field equal to 14766.33 Wp which approximately requires a storage capacity of 648.69 Ah. The choice of the optimal combination is based on the satisfaction of the night load demand by the PV system. This criterion must also respect the optimization conditions, which minimizes the total cost over the life cycle and the loss of power supply probability of the system. These results have been compared to those found with the intuitive method through the table below.
The comparison made between the two methods shows that, The applied method leads both a reduction of the cost and the storage capacity by 48% and of 70%, respectively. This shows that the optimization method with Genetic algorithms is economically reliable and reduces the energy that is not consumed in the storage system.
Hussein A.Kazema et al [16] in their study obtained similar evolution curves of the PV capacity based on storage capacity to those generated in this study. Their results showed that the size of the storage battery found with the intuitive method represents 266% of the storage battery size obtained with the same method digital. The cost of the designed system with the intuitive method corresponds to 150% of the cost compared to the result of the numerical method. In fact, hourly values ​​of meteorological and load demand data were used in order to obtain precise results. While in our study, average values ​​of these data have been used. Indeed, the use of hourly data offers more precision in the sizing and optimization study of photovoltaic systems.

6. Conclusions

In this study, a multi-objective optimization problem is considered for the sizing of a PV system in the Bambey site using GAs. The optimization consisted in minimizing the total life cycle cost and the Loss of Power supply Probability in relation to the PV, and the storage capacities of the system. Thus, the research for a better compromise between the two-optimization parameters for a minimum cost and a satisfactory reliability is carried out using the optimization toolbox of the Matlab software. For this, the mathematical expressions of the two objective functions, the associated constraints and the limit have been established. An intuitive sizing method is used for a delimitation of the research space but also for a comparative study with the proposed optimization method. With the proposed methods, we obtain a cost reduction of 48% and a reliability of 99.3%, which show that the proposed method is reliable economically and technically, with a greater satisfaction of load demand, and a greater reduction of batteries capacities of 70%. The comparison made with the literature shows that this proposed method is reliable and especially with the use of the hourly data.

Funding

Please add: “This research received no external funding” or “This research was funded by NAME OF FUNDER, grant number XXX” and “The APC was funded by XXX”. Check carefully that the details given are accurate and use the standard spelling of funding agency names at https://search.crossref.org/funding. Any errors may affect your future funding.

Conflicts of Interest

Declare conflicts of interest or state The authors declare no conflict of interest.” in the decision to publish the results must be declared in this section. The funders had no role in the design of the study; in the collection, analyses, or interpretation of data; in the writing of the manuscript, or in the decision to publish the results.

References

  1. Jakhrani AQ, Othman AK, Rigit ARH, Samo SR, Kamboh SA. A novel analytical model for optimal sizing of standalone photovoltaic systems. Energy. 2012, 46, 675–682. [Google Scholar] [CrossRef]
  2. Luque RL, Reca J, Martinez J. Optimal design of a standalone direct pumping photovoltaic system for deficit irrigation of olive orchards. Applied Energie. 2015, 149, 13–23. [Google Scholar] [CrossRef]
  3. Said A, Busaidi A, Kazem HA, Al-badi AH. A review of optimum sizing of hybrid PV–Wind renewable energy systems in Oman. Renewable and Sustainable Energy Reviews 2016, 53, 185–193. [Google Scholar] [CrossRef]
  4. Mellit, A. Sizing of photovoltaic systems: a review. Renewable Energy Review. 2007, 10, 463–472. [Google Scholar]
  5. Khatib T, Ibrahim IA, Mohamed A. A review on sizing methodologies of photovoltaic array and storage battery in a standalone photovoltaic system. Energy Convers Manag. 2016, 120, 430–448. [Google Scholar] [CrossRef]
  6. Abbes D, Martinez A, Champenois G. Life cycle cost, embodied energy and loss of power supply probability for the optimal design of hybrid power systems. Math. Comput. Simul. 4014, 98, 46–62. [Google Scholar]
  7. Abdelkader A, Rabeh A, Mohamed Ali D, Mohamed J. Multi-objective genetic algorithm based sizing optimization of a stand-alone wind/PV power supply system with enhanced battery/supercapacitor hybrid energy storage. Energy. 2018, 163, 351–363. [Google Scholar] [CrossRef]
  8. Zagrouba M, Sellami A, Bouaïcha M, Ksouri M. Identification of PV solar cells and modules parameters using the genetic algorithms: Application to maximum power extraction.Sol. Energy. 2010, 84, 860–866.
  9. 9. Sadio A, Mbodji S, Fall I, Sow PLT. A comparative study based on the Genetic Algorithm (GA) method for the optimal sizing of the standalone photovoltaic system in the Ngoundiane site. EAI Indorsed Transactions on Energy Web and Information Technology. 2022.
  10. Ismail MS, Moghavvemi M, Mahlia TMI, Genetic algorithm based optimization on modeling and design of hybrid renewable energy systems. Energy Convers Manag. 2014, 85, 120–130. [CrossRef]
  11. Muhsen DH, Ghazali AB, Khatib T, Abed IA, Natsheh EM. Sizing of a standalone photovoltaic water pumping system using a multi-objective evolutionary algorithm. Energy. 2016, 109, 961–973. [Google Scholar] [CrossRef]
  12. Javed MS, Song A, Ma T. Techno-economic assessment of a stand-alone hybrid solar-wind-battery system for a remote island using genetic algorithm. Energy. 2019, 176, 704–717. [Google Scholar] [CrossRef]
  13. Starke AR, Cardemil JM, Escobar R, Colle S. Multi-objective optimization of hybrid CSP+PV system using genetic algorithm. Energy. 2018, 147, 490–503. [Google Scholar] [CrossRef]
  14. Ayop R, Isa NM, Tan CW. Components sizing of photovoltaic stand-alone system based on loss of power supply probability. Renewable and Sustainable Energy Reviews. 2018, 81, 2731–2743. [Google Scholar] [CrossRef]
  15. Nogueira CEC, Vidotto ML, Niedzialkoski RK. Sizing and simulation of a photovoltaic-wind energy system using batteries, applied for a small rural property located in the south of Brazil. Renewable and Sustainable Energy Reviews. 2014, 29, 151–157. [Google Scholar] [CrossRef]
  16. Kazem, H.A.; Khatib, T. Sopian, K. Sizing of a standalone photovoltaic/battery system at minimum cost for remote housing electrification in Sohar, Oman. Energy Build. 2013, 61, 108–115. [Google Scholar] [CrossRef]
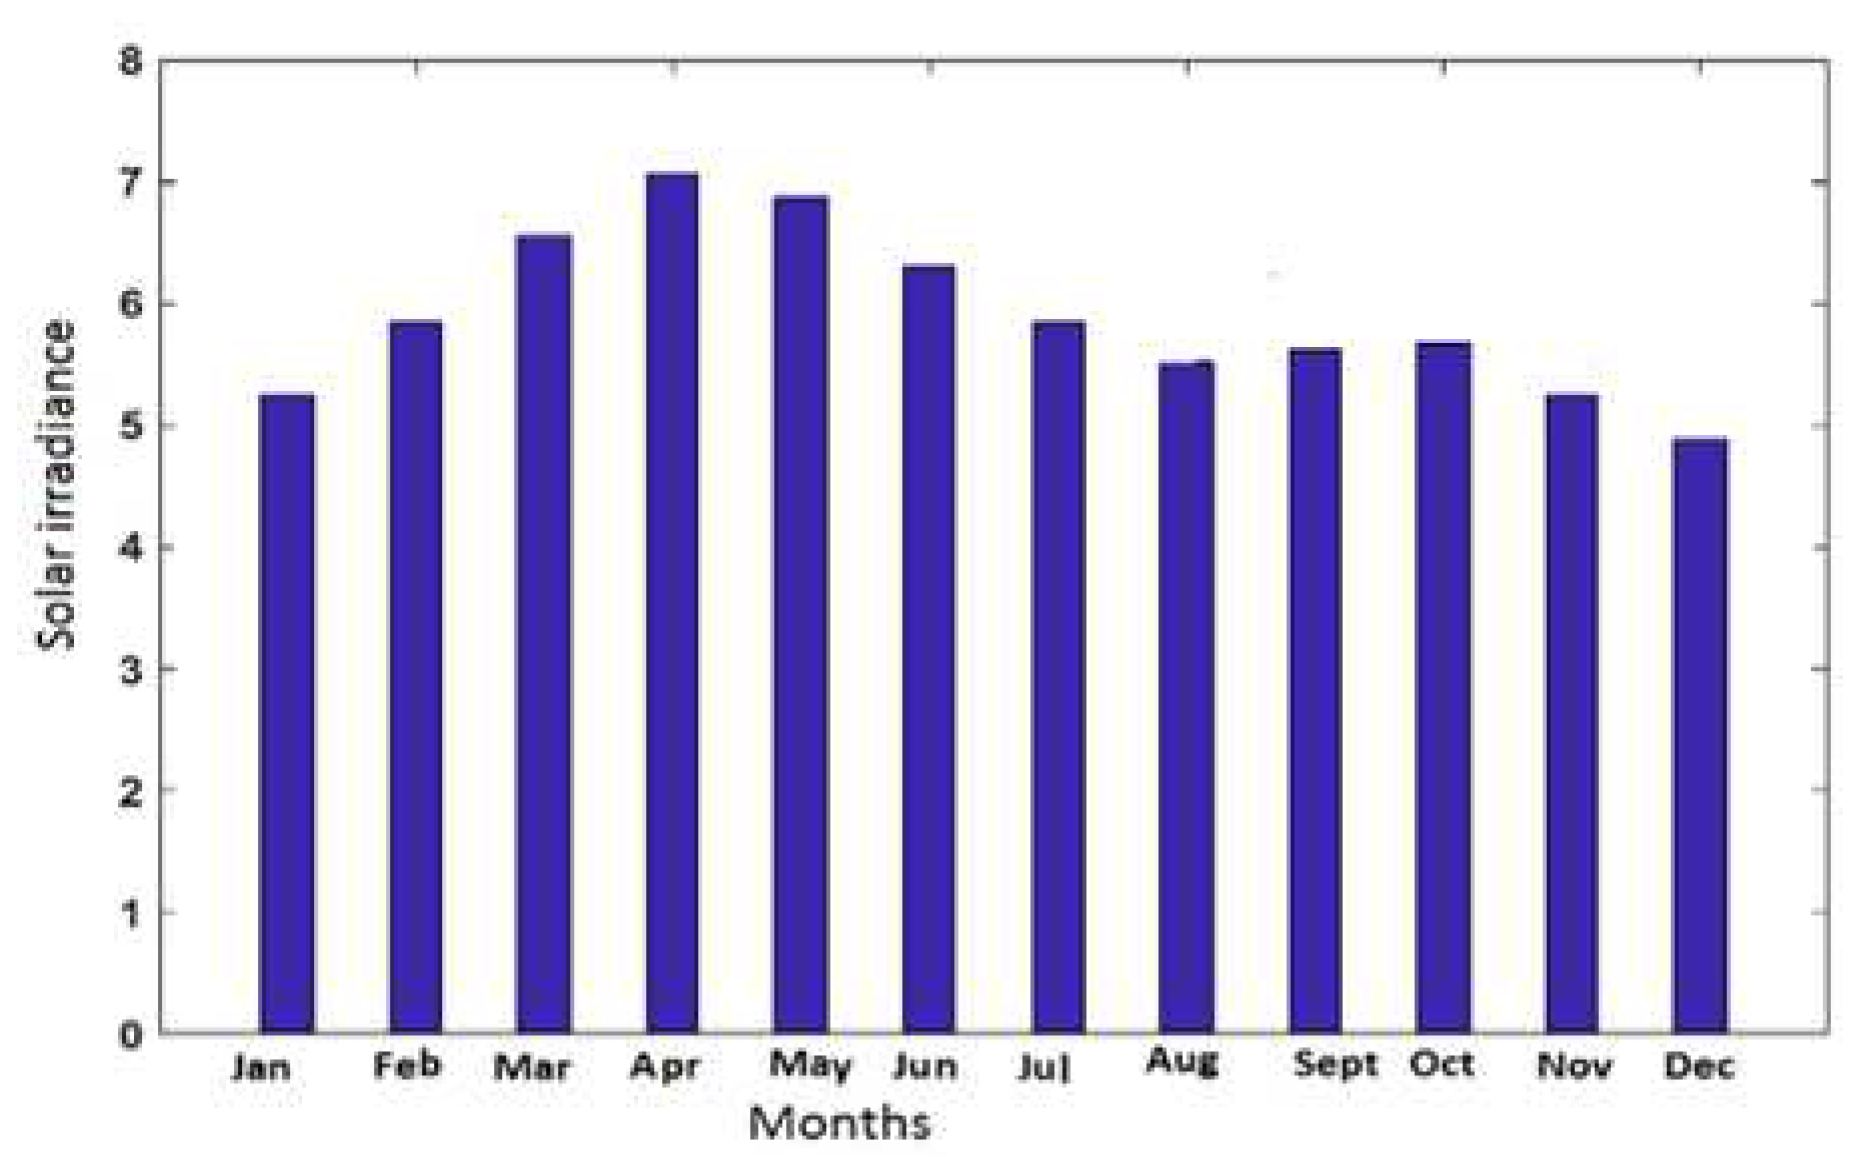
Figure 1. Annual variation of solar irradiation in the Ndem area.
Preprints 83849 g001
Figure 2. Annual variation in ambient temperature in the Ndem area.
Preprints 83849 g002
Figure 3. Flowchart of Genetic Algorithm.
Preprints 83849 g003
Figure 4. Variation of the total life cycle cost according to the loss of power supply probability of the building-block number 4.
Preprints 83849 g004
Figure 5. Variation of the loss of power supply probability according to the generations (building-block number4).
Preprints 83849 g005
Figure 6. Variation of the storage capacity according to that of the PV system for Block 4.
Preprints 83849 g006
Table 1. Load demand in the blocks
Blocs 1 2 3 4 5 6 7 8 9 10 11 12
EL(Wh) 244734 118687 51846 31010 67205 47680 122010 109207 101956 181339 46998 14227
EL corresponds to the load demands in the building-blocks
Table 3. Optimal sizing combinations for 13 iterations for the building-bloc 4.
Index X1 (Wp) X2(Ah) Y (%) X(FCFA)
1 14941.65 910.33 0.001 15 774271.29
2 14766.33 648.49 0.007 15 303151.43
3 14354.85 606.07 0.06 15 081720.69
4 13563.34 637.71 0.17 14 831706.10
5 13164.87 608.10 0.23 14 635226.57
6 12582.45 628.27 0.31 14 446375.46
7 12343.98 585.04 0.34 14 446375.46
8 11869.93 585.09 0.41 14 110327.77
9 10322.86 579.35 0.63 13 516892.63
10 10005.46 583.13 0.67 13 402 810.15
11 9590.56 591.06 0.73 13 258314.70
12 9047.481 582.03 0.81 13 039145.76
13 8642.18 584.87 0.87 12890387.24
Table 4. Comparison between the proposed method and the intuitive method.
Designation Intuitive method Genetic algorithm method
Total capacity of storage system (A h) 2153.47 648.49
Total capacity of PV array (Wp) 16240 14766.33
ALSP (%) 0.007
TLCC (FCFA) 29 998737.52 15 303151.43
Disclaimer/Publisher’s Note: The statements, opinions and data contained in all publications are solely those of the individual author(s) and contributor(s) and not of MDPI and/or the editor(s). MDPI and/or the editor(s) disclaim responsibility for any injury to people or property resulting from any ideas, methods, instructions or products referred to in the content.
Copyright: This open access article is published under a Creative Commons CC BY 4.0 license, which permit the free download, distribution, and reuse, provided that the author and preprint are cited in any reuse.
Prerpints.org logo

Preprints.org is a free preprint server supported by MDPI in Basel, Switzerland.

Subscribe

© 2024 MDPI (Basel, Switzerland) unless otherwise stated