
Submitted:
07 January 2024
Posted:
08 January 2024
You are already at the latest version
Abstract
Integrating photovoltaic (PV) systems plays a pivotal role in the global shift toward renewable energy, offering significant environmental benefits. In many instances, utility companies pay for both energy and peak demand. PV systems can effectively reduce energy consumption during their operational periods, while, their contribution during peak hours, particularly in the early morning and late evening, is often limited. To address this issue, battery storage systems are utilized for storing energy during off-peak hours and releasing it during peak times. However, finding the optimal size of PV-battery systems remains a challenge. This study proposes a novel statistical model to optimize PV-battery system sizing for enhanced peak demand reduction. The model aims to flatten 95% of peak demand days up to a certain demand threshold, ensuring consistent energy supply and financial benefit for utility companies. A straightforward and effective search methodology is employed to determine the optimal system sizes. Additionally, the model effectiveness is rigorously tested through a modified Monte Carlo simulation coupled with time series clustering to generate various scenarios to assess performance under different conditions. The results indicate that the optimal PV-battery system successfully flattens 95% of daily peak demand up to 2000 kW, yielding a financial benefit of $812,648 over 20 years.
Keywords:
Photovoltaic Systems
; Battery Storage
; Peak Demand Reduction
; Statistical Modeling
; Time Series Clustering
; Operational Optimization
; and Monte Carlo Simulations.
1. Introduction
The move towards renewable energy is a response to growing concerns about environmental concerns and the limited supply of non-renewable resources [1,2]. Photovoltaic (PV) systems are becoming increasingly important in this shift because of their ability to use solar energy, which is both abundant and environmentally friendly [3]. Integrating these systems into the existing energy grid is crucial for the environment. Although PV systems are critical to the sustainability of the environment, they present significant technological and economic challenges [4]. The installation of PV systems must yield financial benefits for utilities and meet technical requirements. In most instances, utility companies incur costs for both energy consumption and peak demand. Therefore, PV installations must not only reduce energy consumption but also diminish peak demand. Energy usage can be reduced whenever PV systems generate electricity, resulting in financial benefits for utility companies. However, reducing peak demand with PV systems requires additional analysis and is challenging. For example, during winter days, peak demand often occurs in the early morning when there is negligible or no PV generation [5]. Consequently, on such days, PV installations do not contribute to peak demand reduction. In addition, peak demand may coincide with minimal PV generation during certain days in spring and fall, limiting utility benefits.
Given that peak demand charges are typically high, it is important to leverage PV generation for peak demand reduction. To address this challenge, battery storage systems can be potentially useful [6]. By shifting energy from off-peak to peak hours, batteries can reduce peak demand, thereby providing greater financial benefits for utility companies. While the use of energy storage systems can aid in reducing peak demands and enhancing financial benefits, it also introduces additional costs associated with battery installation and energy losses during charging and discharging [7]. Therefore, determining the optimal size of PV-battery systems is critical to satisfy both technical and economic considerations. Many researches have been conducted to identify the optimal size of grid-connected PV-battery systems [8]. The methodologies explored in the existing literature for optimizing PV-battery systems can be categorized in the following sections.
Single objective optimization focuses on optimizing a single aspect of the PV-battery system, such as cost minimization, energy efficiency, or reliability [9]. The authors of [10] developed a single objective function model to maximize energy savings in PV-battery systems. Their findings suggest that residents could save 5% of their total electricity load without storage and 14% with storage. The researchers in [11] formulated a model for the economic assessment of residential PV systems with lithium-ion batteries. Their analysis showed that optimal sizing can make these systems more affordable than PV alone. In [12], a mixed integer nonlinear programming optimization model was created to optimize the operation and investment of PV-battery systems. The study revealed that the temporal resolution of electrical load and PV generation profiles significantly influences self-consumption and optimal system sizing. The authors of [13] proposed a methodology for determining the optimal size of PV-battery systems, focusing on the overall cost throughout the project lifetime. This approach, validated against realistic test cases, provides an economic analysis to ensure the investment feasibility. While single objective optimization methods are effective in determining the optimal PV-battery system they might not adequately address other crucial aspects of PV-battery systems. This narrow focus can result in solutions that may not be optimal when considering the broader operational needs and challenges of PV-battery systems. To address this limitation multi-objective optimization approaches have been developed.
Multi-objective function optimization involves optimizing multiple objectives simultaneously, such as cost, efficiency, reliability, and environmental impact [14]. The authors of [15] developed a multi-objective optimization model for PV and battery energy storage systems, implemented using particle swarm optimization. The objectives included loss minimization, voltage, and load ability improvement. The authors of [16] developed a multi-objective optimization for grid-connected PV-battery systems, utilizing machine learning techniques. The objective functions include minimizing energy bought from the utility grid, maximizing the battery state of charge, and reducing carbon dioxide emissions. In [17], a scenario-based multi-objective optimization for a rural PV-battery system, focusing on economic gains and grid interaction, was developed. Findings show an 87% improvement in grid interaction smoothness, highlighting its effectiveness in various scenarios and weather conditions. Similarly, Song, Guan, and Cheng [18] proposed a multi-objective optimization strategy for home energy management systems including PV and battery energy storage, emphasizing the integration of sustainable energy sources into the grid. However, a significant limitation shared by both single and multi-objective optimization methods is their lack of consideration for uncertainty. Real-world PV-battery systems operate under a variety of uncertain conditions, including fluctuating solar irradiance and changing load demands. The failure to incorporate these uncertainties into the optimization models can limit the applicability and resilience of the proposed solutions in real-word applications. To address this critical gap, stochastic and robust optimization methods were typically utilized.
Stochastic optimization can be used to determine the optimal size and operation of PV-battery systems under uncertain conditions [19]. By considering a range of possible scenarios, such as varying levels of solar irradiance and changes in energy demand, this method allows for the design of systems that are not only cost-effective but also resilient to changes in environmental conditions and energy market dynamics [20]. The authors of [21] employed a stochastic optimization approach to determine the optimal size of the PV-battery system, focusing on minimizing system unavailability and cost. Based on their findings, PV panel costs and efficiency significantly affect the optimal system. Using stochastic optimization, [22] developed a model for sizing battery storage integrated with PV systems, aiming to minimize battery cost and grid energy import. Their results indicate that combining financial and technical objectives is crucial for achieving economically feasible PV-battery sizing. According to [23], an integrated stochastic framework was developed to optimize the design and operation of PV-battery systems. In that study, feed-in tariffs and unit costs play a major role in determining PV-battery sizes. While stochastic optimization provides a robust framework for dealing with uncertainties, these methods often require large numbers of data and fitting the data into known probability distribution functions that can be complex and computationally intensive [24].
On the other hand, robust optimization addresses uncertainty by establishing parameter bounds. They are particularly useful when data is insufficient, or when probability distributions are either unknown or fitting them are statistically insignificant [25]. Robust optimization is a new method in PV-battery optimization that constructs solutions to perform effectively within a range of uncertainty, defined by intervals, ensuring consistency and resilience against variations in input data and model parameters [26]. In [27], a two-stage robust optimization model was presented for optimal sizing of PV systems with battery units. It addresses PV generation and load uncertainties using polyhedral uncertainty sets. The study [28]conducted robust optimization for grid-connected PV-battery systems. It emphasizes the importance of considering real-world uncertainties in system design. The study demonstrates a trade-off between minimizing the levelized cost of electricity mean and its standard deviation, using Pareto sets of optimized designs. While robust optimization offers a pragmatic approach to managing uncertainty, it tends to yield overly conservative solutions. Besides, accurately determining the appropriate uncertainty bounds is challenging, which can significantly impact the efficiency and feasibility of the optimized system.
Despite valuable studies on optimizing PV-battery system sizes, especially for grid-connected applications, a certain gap remains. Peak demand has not been sufficiently addressed in their optimization problems. This oversight is particularly relevant considering that utility companies often incur costs for both energy consumption and peak demand. The authors in [5] developed a model for optimizing PV-battery sizes with a focus on peak demand reduction. However, their approach, while effective at flattening load profiles with a specified probability, does not fully address utility limitations concerning the extent of load profile flattening. Accordingly, this study proposes a novel statistical model that prioritizes peak demand reduction in PV-battery system optimal sizing. This model enables utility companies to design systems that effectively flatten 95% of daily load demand profiles up to a certain demand threshold. This threshold is determined by the utilities, taking into account their operational capacity and risk management considerations. Further, due to the limitations of stochastic and robust optimization approaches, particularly in addressing the complex and dynamic nature of PV-battery systems under real-world conditions, this study utilizes a modified Monte Carlo simulation coupled with time series clustering to manage the uncertainties in the load demand and solar irradiance data. This innovative approach is designed to generate more realistic scenarios that reflect the inherent variability and interdependencies in solar irradiance and load demand. By clustering similar days based on solar irradiance and load profiles separately, we create distinct sets of scenarios that represent typical operational conditions. The Monte Carlo simulation then utilizes these clustered scenarios to explore a wide range of potential operational outcomes by using conditional probabilities.
In this study, actual demand and solar irradiance data from the City of Greensburg, Kansas, USA, to establish the methodology were collected. Initially, a specific PV size is selected, and modified daily load profiles are generated by subtracting the original load from the PV generation for that PV size. The needed batteries are calculated for each day to flatten the daily loads. Then, a range of battery sizes is chosen to calculate the updated daily peak demands after PV-battery installation by taking advantage of daily needed batteries. The updated peaks are then represented in histograms corresponding to each PV-battery combination and fitted with appropriate PDFs. When the 95th percentile value of a PDF matches the desired utility threshold, the corresponding PV and battery sizes are considered optimal. Otherwise, new PDF parameters are determined to align the 95th percentile with the utility threshold. By iterating this process across various PV sizes, we identified optimal combinations of PV-battery systems capable of flattening 95% of daily peaks up to a certain demand threshold. A benefit analysis is then conducted to identify the most economically beneficial configurations. Finally, a modified Monte Carlo simulation, coupled with time series clustering, is employed to rigorously test the optimal system under various load and solar irradiance conditions. The proposed model provides a practical and efficient approach for determining the optimal size of PV-battery systems, specifically tailored for utilities connected to the grid and incurring peak demand charges. Besides, the organizational flowchart of the simulation procedure in this study is shown in Figure 1.
The main contribution of this study can be summarized as follows:
- Development of a novel statistical model: We introduce a new statistical model specifically designed for optimizing PV-battery system sizes with a primary focus on peak demand reduction. This model addresses a critical gap in the current literature by considering both energy consumption and peak demand costs, which are essential factors for utility companies.
- Incorporation of modified Monte Carlo Simulation: The study utilizes a modified Monte Carlo simulation approach to generate realistic and varied operational scenarios. This methodological innovation allows for a more understanding of PV-battery system performance under diverse conditions, enhancing the robustness of our optimization model.
- Operational and financial analysis for utilities: By providing a method to effectively flatten up to 95% of daily load demand profiles, the model offers a practical tool for utility companies. It enables them to make informed decisions regarding the optimal sizing of PV-battery systems, balancing technical feasibility with financial viability.
2. Materials and Methods
This section provides an overview of the techniques used to determine the optimal size of the PV-battery system.
2.1. Data Collection Analyzing
For this study, actual solar irradiance and load demand data were collected over three years, from 2019 to 2021, for the City of Greensburg, Kansas, USA. The data were collected on an hourly basis. Tax credits of 30% are available for PV-battery installation costs. In the case of replacement batteries acquired after their lifetime, a tax credit is not available. Additionally, quantity values utilized in this study are presented in Table 1.
2.2. PV-Battery System Component Model
This study examines a system comprised of solar panels, inverters, transformers, and batteries. The solar panels are responsible for converting solar energy into electrical energy [29]. Considering a PV system with a size of X kW, the DC output power of this PV system at any given hour ℎ can be expressed by the equation [30]:
where, represents the DC output power of the PV system in kW at hour ℎ, denotes the solar irradiance in at hour ℎ and 1000 is the solar constant in .
The inverters convert the DC electricity generated by the solar panels into AC electricity. The performance of the inverter is modeled as follows [31]:
where, represent the AC output power of the inverter and is the inverter efficiency.
The primary task of the battery in PV-battery system is to store excess energy generated by the PV panels during peak sunlight hours and provide energy during periods of high demand. In this study, we used a simple but efficient approach to model battery operation [5]. We assume a daily battery cycle, which means the battery charges and discharges within a day while considering battery efficiency and utilization factor. For a PV system of X kW, the output AC power is given by Eq. 2. We then generate a modified daily load profile by subtracting the original load profile from the PV generation for each day. To determine the needed battery size for flattening the daily load profiles, a horizontal line is drawn such that the area above the line is equal to the roundtrip efficiency multiplied by the area below the line.
This method ensures that the battery charges when the modified load is below this line and discharges when above while keeping the peak load at the line value. The lower area, corresponding to energy drawn for battery charging, is adjusted by the battery charging efficiency and the battery utilization factor, leading to a needed battery size of:
Accordingly, each day requires a different battery size to flatten the daily load curve. However, it is not feasible to select different battery sizes for a single system. While choosing the largest battery size could flatten all daily load profiles, this approach is economically inefficient. Consequently, the objective is to identify an optimal battery size that can adequately flatten the load curve on most days, while accepting the risk of inadequate flattening on a few days. As the PV-battery system is connected to the grid, on these specific days, the demand shortage can be met by purchasing power from the grid. It is important to note that the inclusion of roundtrip efficiency in the battery sizing algorithm realistically simulates battery losses. Hence, while battery installation aims to reduce peak demands, operational losses may necessitate increased energy purchases from the grid.
2.3. Updated Peaks
The primary objective of this study is to determine the optimal size of a PV-battery system, with a focus on reducing peak demand. To achieve this, we need to identify the updated peak demands after integrating the battery into the PV system. Following the established methodology, we first calculated the needed battery sizes required to flatten the modified load profiles for a given PV size of X kW for each day. Subsequently, we select a battery size, denoted as Y in kWh. For each day, if Y is greater than or equal to the needed battery size, then this selected Y can flatten the modified load profile for those days. In these instances, the updated peaks are equivalent to the horizontal lines determined in the previous section. Conversely, if Y is smaller than the needed battery size, then it will not suffice to flatten the load profile on those days. In such cases, to determine the updated peak, we draw a new horizontal line. This line is positioned such that the area above it, up to the modified load curve, corresponds to the capacity of the battery Y, while also considering in the battery efficiency and utilization factor. These newly drawn horizontal lines represent the updated daily peak demands after battery integration. For example, Figure 2 demonstrates the application of the proposed methodology to a specific day in December 2020, with a PV system size of 2000 kW. On this day, we draw a horizontal line such that the area above it equals 1994 kWh, which is the product of the area under the line (2210 kWh) and the roundtrip efficiency (0.9025). Using equation (4), we determined that a battery size of 3000 kWh is required to effectively flatten the modified load profile. The figure shows this horizontal line at 1642 kW. If the selected battery capacity Y is greater than 3000 kWh, the peak demand after integrating the PV-battery system for that day remains at the horizontal line of 1642 kW. However, with a smaller battery size, like 2000 kWh, we draw a new horizontal line. This line is positioned such that the area above it equals the product of the battery capacity (2000 kWh), roundtrip efficiency, and utilization factor, all divided by the battery efficiency. Therefore, for a PV system of 2000 kW with a 2000 kWh battery, this new line, set at 1782 kW, indicates the updated peak demand for that day. As a result of this process, we can calculate the updated daily peak demands for each specific PV-battery system size. For each combination of PV size X and battery size Y, we collected these updated daily peaks and created a scaled histogram representing the distribution of these peaks. This process was repeated for a wide range of PV and battery size combinations, resulting in multiple scaled histograms, each histogram corresponds to a specific PV-battery system configuration.
2.4. Optimal Battery Sizes
The proposed methodology seeks to configure a PV-battery system capable of efficiently flattening approximately 95 percent of the daily load profiles up to a certain demand threshold. Furthermore, this approach incorporates a manageable level of operational risk. Specifically, there is a probability that the system may not fully meet the highest 5 percent of daily demand peaks. In these instances, it is anticipated that utilities will engage in supplementary energy procurement from their primary power suppliers. This adoption of a 5 percent threshold for demand exceedance is a strategic decision, rooted in detailed risk assessment and statistical analysis [32].
2.5. Statistical Analysis
This strategy is leveraged by fitting a PDF to the scaled histograms of the updated daily peaks. In this study, we used three well-known PDFs such as Gamma, lognormal, and Beta where their shapes were similar to the derived daily peaks in PV-battery histograms. The Gamma distribution is useful in modeling variables that are always positive and have asymmetric distributions. The PDF of a Gamma distribution is given by [33]:
where , , and are shape, scale, and location parameters, respectively, and is Gamma function and can be expressed as follows [33]:
The Beta distribution is a versatile statistical distribution used to model random variables and the PDF of a Beta distribution is given by [34]:
where and are shape and scale parameters for the Beta distribution.
The Lognormal distribution is suitable for modeling variables where the data are positively skewed and constrained to positive values, such as energy usage or peak demand levels. The PDF of a Lognormal distribution is [35]:
where indicates the mean of data, and represents the standard deviation. Besides, the Kolmogorov-Smirnov (KS) statistic test is utilized to evaluate the fitted PDFs for their accuracy in modeling the updated peak demands in this study. The KS test is particularly adept at assessing how well the selected PDFs conform to the empirical distribution of the updated peak demand data obtained from the system simulations. This test measures the largest difference between the empirical distribution of the observed peak demand data and the cumulative distribution functions of the theoretical models [36]. The distribution with the smallest KS statistic score and largest P-value (Typically, a p-value larger than 0.05 is set) is considered the best fit for the data [37]. This means it has the smallest maximum deviation and thus most closely represents the behavior of the observed peak demands. After identifying the most suitable PDFs for various combinations of PV and battery sizes, we undertake the following steps to determine the optimal PV-battery system configuration:
- 1.
- Selection of PV and battery sizes: We started by selecting a single PV size and evaluating it across a range of various battery sizes.
- 2.
- Histogram creation and PDF fitting: For each PV-battery size, we generated scaled histograms of daily peak demands following PV-battery installation. These histograms were then fitted with a PDF, specifically chosen for its relevance, characterized by PDF parameters
- 3.
- Determining the 0.95 threshold: For each PDF, we calculated the threshold value that corresponds to the 95th percentile. Mathematically, this is represented as:where is the inverse of the cumulative distribution function for the fitted PDF. This calculation yields multiple threshold values for each PV-battery combination.
- 4.
- Optimal sizing criteria: The objective is to find the PV-battery size combination that meets a predetermined threshold of T kW with a 95% probability. If the desired threshold T aligns with the thresholds found in equation (9), the corresponding battery size is considered optimal for the chosen PV size. In cases where the desired threshold T does not align with the previously determined thresholds, we adjust our approach and recalculate the parameters of a new PDF to match the T kW threshold with a 95% probability. This is achieved through the formula:After recalibrating the new parameters of a new PDF to align with the T kW threshold at a 95% probability level, we use interpolation between the newly found parameters and those determined in step 3. This interpolation helps us identify the corresponding battery size for these updated parameters.
- 5.
- Optimal PV-battery system: By repeating all the aforementioned steps for a wide range of PV sizes, we eventually compile an extensive set of optimal PV-battery combinations. Each of these combinations is capable of flattening 95% of the daily peaks up to a fixed threshold of T kW, which meets the technical requirement.
However, while these combinations technically satisfy the peak demand flattening criteria, the selection of the most suitable PV-battery system for actual implementation also requires a thorough economic analysis.
2.6. Economic Analysis
To determine the truly optimal PV-battery system for installation, it is essential to assess each determined PV-battery combination from an economic perspective. In this study, we rigorously evaluate the financial benefits of each PV-battery combination identified in our previous analyses. This economic evaluation for a PV size of X kW and battery size of Y kWh involves several key components:
2.6.1. Initial Investment Cost
We first assess the initial capital investment required for each PV-battery combination. This includes the costs of:
- PV Installation [38]:
Here, represents the total cost of the PV installation ($), and is the capital cost of PV panels in $/kW.
- Inverter Cost [39]:
- Labor cost [40]:
- Equipment costs [41]:
- Overhead costs:
- Battery cost:
Given that the battery lifespan is typically shorter than the project lifetime, it is anticipated that the battery will require replacement during the project duration. So, the initial cost of the first battery is as follows:
where, is the initial cost of the first battery ($), and is the capital cost of the first battery in $/kWh. However, with the rapid advancement in battery technology, the cost for a replacement battery is expected to decline. So, the cost of the replacement battery can be expressed as follows [42]:
where, is the total initial cost of the replacement battery ($), and is the capital cost of the replacement battery in $/kWh. Besides, the cost for the second battery must be adjusted to its present worth considering the expected decrease in cost and the time value of money. This is calculated using the formula for present worth, considering the discount rate of i and the period of M which the replacement is needed [43]:
where represent the present worth of the replacement battery ($). Accordingly, the total initial battery cost of , accounting for both the first installation and the present worth of the replacement battery, is then given by:
Finally, considering the cost of required transformers for the PV-battery system, the Total Initial Investment Costs (TIIC) can be expressed as follows:
2.6.2. Operation, Maintenance, and Insurance Costs
Once the PV-battery system is operational, there are ongoing costs that must be accounted for to ensure its continuous and efficient functionality. The annual operation costs, typically cover monitoring and routine inspections. Maintenance costs include regular cleaning, repair, and replacement of components. Lastly, insurance is crucial for protecting the investment against risks like damage, theft, and other liabilities. The annual costs associated with the operation, maintenance, and insurance of the PV-battery system are as follows:
where represent the annual costs of operation, maintenance, and insurance ($) and is the capital cost associated with them in $/kW. Given that these costs are incurred annually over the life of the system N, its present worth can be calculated as follows [43]:
2.6.3. Peak Demand and Energy Costs
An important component of the economic analysis is the peak demand charge, which represents the cost incurred by the highest level of demand recorded (measured in kW), typically within a month. Peak demand cost of for year n can be expressed as follows [44]:
where is the peak demand of month m and represent the peak demand rate in $/kW. Energy cost is the expense incurred for using electricity, determined by multiplying the quantity of electrical energy consumed by the rate charged by the electricity supplier. Energy cost of for year n can be expressed as follows:
where is the hourly using demand and represent the energy rate in $/kWh. To accurately compute the economic benefits of PV-battery installation, it is necessary to determine these costs before and after the implementation of the PV-battery system. Besides, these costs are annuities recurring at yearly intervals. So, the present value of these charges over the system lifetime N must be calculated to evaluate the economic benefit effectively.
The present value of peak demand charge before installation :
Similarly, present value of peak demand charge after installation :
where represents the yearly peak demand charge after PV-battery installation.
The present value of energy cost before PV-battery installation:
Similarly, the present value of energy cost, after PV-battery installation :
where represents the yearly energy cost after PV-battery installation.
2.6.4. Economic Benefit
The economic benefit of installing a PV-battery system is a critical aspect of this study, encompassing the overall financial advantages gained over the system lifespan. The economic benefit of the PV-battery system installation is quantified by comparing the total costs incurred before and after the PV-battery installation and is calculated as follows:
A positive economic benefit demonstrates that the PV-battery system is cost-effective. The savings on energy and peak demand charges outweigh the combined costs of installation, operation, and maintenance. We extend this economic evaluation across all optimal combinations of the PV-battery system that meet a predetermined threshold of T kW with a 95% probability. This comprehensive analysis enables the identification of the optimal PV-battery system configuration that maximizes utility benefit. Nonetheless, the inherent uncertainties within historical demand and solar irradiance data necessitate a rigorous validation of the robustness of the optimal PV-battery system under varied conditions. Variations in demand and irradiance are critical factors that could significantly influence the efficacy of the system. To consider these uncertainties and validate the resilience of the proposed solution, we have employed an effective Monte Carlo simulation methodology. This simulation generates multiple of scenarios, each representing distinct daily demand and solar irradiance conditions, thereby providing a holistic test of the model robustness.
2.7. Modified Monte Carlo Simulation
Monte Carlo simulation is a statistical technique that utilizes random sampling and probabilistic modeling for scenario analysis, decision-making, and predictive modeling. It operates by running a large number of simulations with random variables, thereby generating a wide range of possible outcomes and their probabilities [45]. However, in this study, the typical approach to Monte Carlo simulation requires modification due to the simultaneous consideration of two parameters: daily load and solar irradiance profiles. The goal is to generate multiple scenarios that accurately reflect the interdependence of solar irradiance and demand profiles throughout the year. A challenge in this methodology is the logical pairing of load and solar irradiance profiles to reflect realistic conditions. For instance, it is not methodologically unsound to associate a high demand profile, typical of summer conditions, with a solar irradiance profile of winter. Such contradictions lead to skewed results and impair the reliability of the simulation. To address this, we have integrated a clustering technique to categorize similar load demands and solar irradiance profiles into distinct groups to effectively generate load and solar irradiance scenarios.
2.7.1. Time Series Clustering
The time series clustering involves grouping similar temporal data patterns into distinct clusters. To cluster the time series data of load demands and solar irradiance, we categorized three years data on a monthly basis. Subsequently, within each month, daily time series for load and solar irradiance are clustered separately. In this study, we have employed a structured approach to cluster time series data, involving the following steps [46]:
- Data preprocessing: The first step involves comprehensive data preparation. This includes cleaning the data to remove any inconsistencies or errors, addressing outliers, and ensuring that all data is correctly formatted. Subsequently, we normalized the data values to fall between 0 and 1. This standardization is crucial for comparability analysis. Then, we grouped the data monthly, aggregating three years of data for further analysis.
- Similarity measures: The objective of time series clustering is to categorize time series datasets into clusters where datasets within each cluster exhibit maximum similarity among themselves and minimal similarity with datasets in other clusters. A similarity measure is crucial in quantifying the degree of resemblance between two time series datasets. In this study, we have employed Dynamic Time Warping (DTW), a technique that has demonstrated significant efficacy in assessing similarity, particularly in the energy management sector [47,48]. DTW compares each point of one time series with multiple points of another, finding the best alignment by minimizing the cumulative distance between these matched points. By allowing such flexibility in the alignment, DTW effectively captures the inherent patterns and shapes within the time series data, even when these occur at different rates or phases.
- Clustering algorithms: The next step is to employ an appropriate time series clustering algorithm.
In this study, we utilized two distinct clustering algorithms: K-means and Self-Organizing Maps (SOM). K-means requires a predefined number of clusters, offering a clear, straightforward partitioning method. Conversely, SOM, a neural network-based approach, does not require pre-specifying cluster numbers. This combination of K-means and SOM ensures a robust and thorough examination of the time series data, enhancing the reliability and depth of the clustering analysis.
K-means clustering aims to partition the data into K clusters in which each data belongs to the cluster with the nearest mean, serving as a prototype of the cluster. The K-means algorithm operates through the following iterative steps [48]:
- Initialization: The process began by randomly selecting k data points as the initial centroids of the clusters.
- Assignment step: In this phase, each data in the dataset was assigned to the nearest centroid. The closeness was determined based on the DTW distance.
- Update step: The centroids of the clusters were then recalculated as the mean of all points assigned to each cluster.
- Convergence: These steps were repeated until the positions of the centroids stabilized, indicating that the clusters had converged and were no longer changing significantly.
- Optimal number of clusters: Determining the optimal number of clusters is a critical aspect of the K-means algorithm. We employed the Elbow method to identify this number. To apply the Elbow method, we first executed the K-means algorithm over a range of K values from 1 to a predefined maximum, then computed the Within-Cluster Sum of Squares (WCSS) for each K, and finally plotted these WCSS values against their cluster number. By observing the WCSS curve, we looked for a point where the rate of decrease in WCSS significantly slows down, creating an elbow in the plot. The K value at this elbow point is considered the optimal number of clusters as it indicates a trade-off between maximizing the number of clusters and minimizing WCSS [49].
SOM is a type of artificial neural network that is trained using unsupervised learning to produce a low-dimensional, discretized representation of the input space, often referred to as a map. The methodology for applying SOM in this study is as follows [50]:
- Initialization: We start by initializing the SOM neural network with weight vectors, through random selection.
- Competitive learning: For each data point in our dataset, SOM identifies the Best Matching Unit (BMU) by finding the neuron with the closest weight vector to the data point.
- Weight adjustment: The weights of the BMU and its neighbors within the network are adjusted to become more similar to the input data point, with the adjustment magnitude decreasing over time and distance from the BMU.
- Iterative process: This cycle of competitive learning and weight adjustment was repeated across numerous iterations, allowing the SOM to evolve and form a map that reflects the intrinsic structure of the data.
- Cluster visualization: The final output is a map where similar data points are clustered together.
Finally, we systematically compare the results obtained from both K-means and SOM clustering techniques. Then the results were integrated into the modified Monte Carlo simulation to generate meaningful load and solar irradiance scenarios.
2.7.2. Modified Monte Carlo Simulation
After clustering the daily load and solar irradiance for each month, we implement a modified Monte Carlo simulation to generate realistic scenarios. Assuming we have solar irradiance, clusters labeled set and load demand clusters labeled set for a month, the steps for a typical month, are as follows:
- Assign probabilities to solar irradiance clusters: For each solar irradiance cluster (i = 1 to m), calculate its probability:
- Establish probability intervals: This is done by sequentially adding the probabilities of the clusters. For the first cluster , its probability interval is:For the second cluster , the interval is defined as:This continues for each cluster , where:
- Random cluster selection for solar irradiance: A random number R within the range [0, 1] is selected uniformly. Selecting the solar irradiance cluster for which the random number R falls within its probability interval.
- Determine the specific days that are included in the selected solar irradiance cluster.
- Match days with load clusters: For each identified day in the solar irradiance cluster , finding the corresponding days within the load demand clusters from to .
- Calculate conditional probability for load clusters: After selecting the solar irradiance cluster , the probability of each load demand cluster conditioned on the selection of is calculated. The conditional probability is calculated as:
- Establish probability intervals for each conditional probability like step 2.
- Random selection of load cluster based on conditional probability intervals.
- Final scenario selection: From the selected solar irradiance cluster and the randomly chosen load cluster , a specific pair of solar irradiance and load demand profile is identified. If multiple profile pairs are available within the selected clusters, one pair is selected randomly. This random selection can be done using a uniform distribution, ensuring each pair has an equal chance of being chosen.
Besides, all steps to generate load demand and solar irradiance are demonstrated in Figure 3. These steps ensure that the final scenario chosen for each day accurately reflects the interdependencies between solar irradiance and load demand patterns, as dictated by the conditional probabilities. This approach enhances the realism and applicability of the scenarios generated for the Monte Carlo simulation, crucial for robust and insightful analysis.
3. Results
3.1. Data Analysis
A comprehensive analysis was conducted to investigate the occurrence of daily peak demand hours and their correlation with solar irradiance levels. This analysis was particularly focused on the year 2019. For this purpose, the daily peak hours for each month were depicted and examined. The results of this analysis are presented in Figure 4. In the winter months, a significant trend was observed where the peak demand hours predominantly occurred during early morning times. Notably, these periods coincide with minimal solar irradiance, highlighting a critical gap in demand supply when relying solely on PV systems. Similarly, in the summer months of June, July, and August, peak demand hours were mostly observed in the late evening (18:00 to 20:00), when solar irradiance is not at its peak, despite it being higher during the noon hours throughout the year. These patterns across different months suggest that PV installations, might not substantially contribute to peak demand reduction on most days of the year due to this misalignment with solar irradiance. Accordingly, battery storage can be a potential solution, capable of storing excess energy during off-peak hours or energy purchased from the grid, to be later utilized during peak demand periods. This strategic use of battery storage can potentially enhance the effectiveness of PV systems in peak demand reduction, highlighting its importance in overall energy management.
3.2. Battery Operation Daily Needed Battery Sizes
In this study, we considered PV system sizes ranging from X1 = 200 kW to Xn = 10000 kW, paired with battery storage capacities from Y1 = 200 kWh to Yn = 10000 kWh, incrementing in steps of 100. For each PV size, the modified load profile was calculated by subtracting the original load profiles from the PV generations. Then, for each of these modified profiles, the needed battery sizes to flatten the daily load curves were determined. For example, Figure 5 illustrates this for a 2000 kW PV system, showing a histogram of the daily needed battery sizes that effectively flatten the load profiles for each day. The histogram has multiple peaks and wide spread indicating significant variability in daily needed battery size. The variety in sizes likely reflects fluctuations in daily solar generation and load profiles. The distribution of sizes underscores the challenge of selecting a single, optimal battery size for a PV size of 2000 kW. For instance, while a large battery, such as one with a capacity of 12000 kWh, could address peak demands on most days and effectively flatten the daily load profiles, it is not economically efficient due to its high cost. Conversely, a smaller battery might be more cost-effective but could lead to inadequate load flattening on days with higher energy demands.
3.3. Optimal PV-Battery System
Building upon the previous results of daily needed battery sizes for modified load profile flattening, this section examines optimal sizing for PV-battery systems. For each PV and battery size combination, we calculated updated daily peak demands after PV-battery system integration. Then, the scaled histograms of the updated daily peaks for each combination of the PV-battery sizes are created. Then three PDFs of Gamma, Lognormal, and Beta were fitted for each histogram. To assess the goodness-of-fit a KS statistic test was done on the fitted PDFs. The results revealed that the Gamma distribution fit the updated daily peak demands appropriately. Table 2 presents the results of the KS statistic test, comparing the fit of Gamma, Lognormal, and Beta distributions to the updated daily peak demands for a PV size of 2000 kW across various battery sizes. The KS statistics and P-values indicate that the Gamma distribution consistently offers a better fit for the data compared to the Lognormal and Beta distributions. This is evident from the generally lower KS statistic values and higher P-values for the Gamma distribution across all battery sizes. For instance, at a battery size of 2000 kWh, the Gamma distribution has a KS statistic of 0.031794 and a P-value of 0.65124, which are considerably more favorable than those for the Lognormal and Beta distributions, suggesting a more accurate and reliable fit.
After identifying the Gamma distribution as the best-fitted PDF for the updated daily peak demands, the next step involves determining a 0.95 percent threshold. For each fitted Gamma PDF, we calculated the value corresponding to the 95th percentile, effectively establishing a threshold that represents the maximum peak level that the PV-batter system is expected to flatten 95% of the days. For example, Figure 6 presents the fitted Gamma PDF for updated daily peaks with a PV size of 2000 kW and battery size of 3000 kWh. The Gamma distribution parameters are α=26.805 and β=57.668, with a threshold at 2041.996 kW, indicating only a 5% chance of exceeding this peak demand. The KS test yields a statistic of 0.0348 and a p-value of 0.1382, confirming a good fit.
Now, for each combination of PV and battery, unique Gamma PDF parameters, including shape, scale, and thresholds, were derived. However, the utility desired peak demand threshold is 2000 kW with a 95% probability, indicating that the system should not exceed 2000 kW peak demand more than 5% of the time. Since an exact 95% probability threshold of 2000 kW was not found among the calculated peak demand thresholds, we recalibrated a new Gamma distribution to meet this specific criterion, using the formula:
Given that the inverse CDF of the Gamma distribution is not available in closed form, numerical methods were employed for approximation. For instance, with a PV size of 2000 kW, the recalibrated shape and scale parameters were found to be 25.99 and 57.92, respectively. It is noteworthy to mention that the recalibrated Gamma parameters align closely with the actual data-derived parameters. This proximity suggests that the recalibrated parameters and associated Gamma distribution are strongly representative of actual daily peak demand data. Figure 7 illustrates the shape and scale parameters of the fitted Gamma PDFs for PV size of 2000 kW and various battery sizes. By aligning the new parameters on this plot, the corresponding optimal battery size was determined to be approximately 4000 kWh. As a result, a battery size of 4000 kWh has been identified as optimal for a PV system of 2000 kW, capable of flattening 95% of daily peak demands up to the desired threshold of 2000 kW. Accordingly, the proposed methodology performs well in determining the appropriate battery size to meet specific demands. Applying this method to a wide range of PV sizes, from 500 kW to 10,000 kW, the optimal battery size for each PV configuration can be determine d. Table 3 presents the optimal battery sizes for PV-battery systems to flatten 95% of daily peak demands. For PV sizes between 500 kW and 1000 kW, optimal battery sizes were not defined, implying these PV systems may not have a battery solution that can meet the peak flattening criteria within this study parameters. As the PV system size increases to 1200 kW, a substantial battery capacity of 9200 kWh is required. This indicates a significant need for battery storage to flatten peak demands effectively for relatively small PV size of 1200 kW. As the PV system size continues to increase, there is a gradual decrease in the required battery size. This trend suggests increasing efficiency in peak demand reduction with larger PV systems, requiring relatively smaller batteries.
3.4. Benefit Analysis
The proposed methodology provided a wide range of PV-battery configurations capable of effectively flattening 95% of daily peak loads up tp threshold of 2000 kW. While technical optimization is pivotal, the economic viability of each configuration is equally essential. To this end, we computed the financial benefits for all identified optimal PV-battery combinations. PV-battery size that provides maximum utility benefit is the most desirable. The financial benefit for each combination was calculated by grouping three years of data on a monthly basis. For example, for January, we had three sets of load demand and solar irradiance data for 2019, 2020,2021. Within each month, we determined the average peak demand charges and average energy costs. We then combined them all into one year and calculated the benefit over 20 years. Figure 8 illustrates the financial benefits associated with each optimal PV-battery combination. Notably, a PV system with a size of 2000 kW with a 4000 kWh battery emerges as the most economically advantageous, yielding a maximum benefit of $812,648 over the project lifetime. This optimal benefit is identified as providing the greatest economic return for utilities. Table 4 provides detailed economic information for the optimal PV-battery system. The total peak demand cost without the PV-battery system is almost twice the energy cost, thereby highlighting the substantial influence of peak demand charges on overall utility costs. Upon the installation of a PV-only, there is a notable decrease in energy costs by 19.8%, demonstrating the effectiveness of PV-only system in reducing energy costs. However, the peak demand costs have a relatively modest reduction of only 6%, underscoring that while PV installations contribute significantly to energy cost savings, their impact on peak demand reduction is comparatively limited. The economic assessment of the PV-only system presents a less advantageous outcome. The high costs associated with installation, maintenance, operation, and insurance of the PV system outweigh the savings costs, leading to a negative benefit for utilities. This highlights a critical limitation of relying solely on PV systems. In contrast, the integration of batteries with PV systems demonstrates a significant improvement in peak demand costs, with a reduction of up to 29%. This substantial decrease indicates the battery capability to effectively flatten daily peak demands. Although the addition of batteries incurs an extra energy cost of $25,155 due to losses inherent in battery operation, the overall peak demand charge savings are sufficient to offset these additional expenses. This results in a positive benefit of $812,648 over the project lifetime for utilities. Accordingly, the combined PV-battery system not only reduces peak demand charges effectively but also provides a positive financial benefit for utilities. In addition, to account for the inherent variability in load demand and solar irradiance, we employed a modified Monte Carlo simulation to rigorously test the performance of the optimal PV-battery system under diverse conditions.
3.5. Modified Monte Carlo simulation
To categorize similar load and solar irradiance data into distinct clusters, we segmented three years of data by month. For instance, January data comprised 93 daily load profiles for both demand and solar irradiance, spanning across three years. These data points were normalized between zero and one to effective clustering. We employed K-means and SOM clustering algorithms to group each month data. The K-means algorithm was applied with varying cluster numbers, and for each, the WCSS was calculated. To create elbow curves, we plotted the WCSS against various numbers of clusters to determining optimal number of clusters. For example, Figure 9 shows the elbow curve associated for January load demand profile clustering. The reduction in WCSS from 1 to 5 clusters is relatively gradual. After 5 clusters, the decreases continue but are less pronounced. Given these values, the optimal number of clusters could be around 5 clusters. By repeating this process for other months, the clusters are obtained for load demand and solar irradiance.
Since clustering is a complex process and determining the optimal number of clusters is challenging, the SOM technique was employed to validate these findings and offer deeper insights. Utilizing SOM with key parameters like a sigma of 0.01 and a learning rate of 0.5 over 1000 iterations, the SOM effectively identified similar data profiles. The process revealed distinct clusters within the data, as the SOM neuron grid self-organized based on the inherent similarities in load and solar irradiance profiles. This self-organization was evident in the final SOM grid, which visually represented the data topological relationships, demonstrating clear patterns and groupings within the load and irradiance profiles. For example, the results of the January load profile are depicted in Figure 10. The number of clusters identified is 5, aligning with the findings from the K-means analysis, thereby confirming the success of the clustering process. These 5 distinct clusters demonstrate varying patterns in energy consumption, reflecting different energy usage behaviors. Notably, one of the load demand profiles within cluster 1 exhibited a relatively different pattern between hours 11 to 13 and 21 to 23, differing from other profiles during these particular hours. Despite these differences, the SOM algorithm grouped this load profile into cluster 1 instead of isolating it into a new single cluster. This decision can be attributed to SOM overall pattern recognition approach, focusing on general daily energy usage trends rather than specific differences at certain hours. Furthermore, SOM clustering logic aims to avoid overfitting by not creating particular clusters for minor variations, ensuring a robust and generalizable grouping of load profiles. It should be noted that we employed clustering primarily to enhance the effectiveness of Monte Carlo simulation. Consequently, a thorough exploration of the clustering patterns, which would require an extensive analysis including detailed consumer types and environmental information, is beyond the scope of this study.
After clustering the monthly load demand and solar irradiance data, we applied the established modified Monte Carlo simulation to generate 10,000 daily load and solar irradiance scenarios for each month. These were then aggregated into annual sequences, yielding 10,000 yearly data sets. For the 20-year benefit analysis, we randomly selected 20 distinct daily load and solar irradiance pairs per iteration, ensuring no repetition in the selection process. This procedure was repeated 500 times, creating 500 unique samples of 20-year benefit calculations. Accordingly, the benefit analysis for the optimal system, considering PV sizes of 2000 kW and battery size of 4000 kW, was conducted under a various range of demand and solar irradiance scenarios. The results of this comprehensive evaluation are depicted as histograms in Figure 11. The histogram analysis indicates that the average benefit over a 20-year period for the optimal PV-battery systems is $810,364. This central value suggests that, on average, the integration of the PV-battery system is expected to yield substantial financial benefits over the long term. Besides, the standard deviation of $7,834.234 indicate a consistent performance of the PV-battery systems in terms of financial returns. The benefit histogram was fitted by a normal distribtuon with obtained mean and standard devision. The first standard deviation range lies between $802,529.82 and $818,198.28. This indicates that approximately 68% of the benefit values are expected to fall within this range, suggesting a high likelihood of achieving favorable financial outcomes close to the mean. Similarly, the second standard deviation extends the range to between $794,695.59 and $826,032.49. This wider range encompasses about 95% of the potential benefit outcomes, indicating that even when accounting for greater variability, the vast majority of benefits remain within an acceptable beenfit range. The alignment of these values around the central mean suggests that significant deviations from the expected average are relatively uncommon. These statistical insights, derived from the benefit data, provide a robust foundation for anticipating the financial performance of the optimal PV-battery systems over a 20-year period. The concentration of data within the first and second standard deviations reinforces the reliability and stability of these systems as a financially viable solution in the long-term planning.
4. Conclusions
This study introduced a novel statistical framework for optimally sizing grid-connected PV-battery systems, with a primary focus on reducing peak demand. The fact that utility companies incur both peak demand and energy costs underscores the importance of considering peak demand. The analysis of solar irradiance and load demand data demonstrated that peak loads often occur during periods of minimal PV generation or are misaligned with solar irradiance peaks. Findings underlined that solely PV installation contributions to peak demand reduction were limited. Thus, battery storages were utilized to store energy during off-peak times for use during peak times. Recognizing the importance of peak demand reduction, a novel statistical method was proposed to determine the optimal PV-battery system that can effectively flatten 95% of daily load profiles up to a threshold of 2000 kW, while accommodating the risk of not meeting the highest 5% of daily peak demands. Through a systematic and efficient search process, we identified optimal combinations of PV and battery sizes that meet these criteria. Based on economic analysis, the most cost-effective system for the utility company was a 2000 kW PV system with a battery of 4000 kWh, providing a benefit of $812,648 over 20 years. Moreover, the robustness of the optimal PV-battery system was rigorously tested against 10,000 diverse solar irradiance and load demand profiles. This was achieved through the integration of time series clustering and the application of conditional probabilities to effectively consider the interdependence between solar irradiance and demand profiles, using a modified Monte Carlo approach. However, this study is primarily applicable to utility companies connected to the grid and incurring peak demand charges. Future research is recommended in several areas:
- Integrating various energy technologies and evolving market dynamics into the model to enhance its scalability and adaptability.
- Examining the influence of grid topology and related constraints on the effectiveness of the proposed methodology.
- Extending the methodology to integrate other renewable energy sources, such as wind turbines, in a hybrid system.
- Refining the methodology to determine the desired demand threshold in alignment with specific utility company requirements and operational capacities.
Author Contributions
Conceptualization, A.P.; methodology, R.N., A.P. and BN; software, R.N.; validation, A.P. and B.N.; formal analysis, R.N.; investigation, R.N., A.P. and BN; resources, A.P.; data curation, R.N.; writing—original draft preparation, R.N.; writing—review and editing, A.P. and B.N.; visualization, R.N.; supervision, A.P. and B.N.; project administration, A.P.; funding acquisition, A.P. All authors have read and agreed to the published version of the manuscript.
Funding
This research was funded by NSF, grant number 2125548.
Institutional Review Board Statement
Not applicable.
Data Availability Statement
Not applicable.
Acknowledgments
The authors thank the City of Greensburg, Kansas, and Kansas Power Pool (KPP) for supporting this research by providing load and billing data. Also, thanks to Kansas State University Agricultural Extension for providing the solar irradiation data.
Conflicts of Interest
The authors declare no conflict of interest.
References
- Betancourt Schwarz, M.; Veyron, M.; Clausse, M. Impact of Flexibility Implementation on the Control of a Solar District Heating System. Solar 2023, 4, 1–14. [Google Scholar] [CrossRef]
- Nematirad, reza; Ardehali, M.M.; Khorsandi, A. Optimization of Residential Demand Response Program Cost with Consideration for Occupants Thermal Comfort and Privacy. arXiv preprint arXiv:2305.08077. 2023. [CrossRef]
- Banibaqash, A.; Hunaiti, Z.; Abbod, M. Assessing the Potential of Qatari House Roofs for Solar Panel Installations: A Feasibility Survey. Solar 2023, 3, 650–662. [Google Scholar] [CrossRef]
- Ali, A.; Volatier, M.; Darnon, M. Optimal Sizing and Assessment of Standalone Photovoltaic Systems for Community Health Centers in Mali. Solar 2023, 3, 522–543. [Google Scholar] [CrossRef]
- Nematirad, R.; Pahwa, A.; Natarajan, B.; Wu, H. Optimal Sizing of Photovoltaic-Battery System for Peak Demand Reduction Using Statistical Models. Front Energy Res 2023, 11. [Google Scholar] [CrossRef]
- Jayathunga, D.; Weliwita, J.A.; Karunathilake, H.; Witharana, S. Economic Feasibility of Thermal Energy Storage-Integrated Concentrating Solar Power Plants. Solar 2023, 3, 132–160. [Google Scholar] [CrossRef]
- Shavolkin, O.; Shvedchykova, I.; Gerlici, J.; Kravchenko, K.; Pribilinec, F. Use of Hybrid Photovoltaic Systems with a Storage Battery for the Remote Objects of Railway Transport Infrastructure. Energies (Basel) 2022, 15, 4883. [Google Scholar] [CrossRef]
- Agajie, T.F.; Ali, A.; Fopah-Lele, A.; Amoussou, I.; Khan, B.; Velasco, C.L.R.; Tanyi, E. A Comprehensive Review on Techno-Economic Analysis and Optimal Sizing of Hybrid Renewable Energy Sources with Energy Storage Systems. Energies (Basel) 2023, 16, 642. [Google Scholar] [CrossRef]
- Owosuhi, A.; Hamam, Y.; Munda, J. Maximizing the Integration of a Battery Energy Storage System–Photovoltaic Distributed Generation for Power System Harmonic Reduction: An Overview. Energies (Basel) 2023, 16, 2549. [Google Scholar] [CrossRef]
- Vossos, V.; Garbesi, K.; Shen, H. Energy Savings from Direct-DC in U.S. Residential Buildings. Energy Build 2014, 68, 223–231. [Google Scholar] [CrossRef]
- Beck, T.; Kondziella, H.; Huard, G.; Bruckner, T. Assessing the Influence of the Temporal Resolution of Electrical Load and PV Generation Profiles on Self-Consumption and Sizing of PV-Battery Systems. Appl Energy 2016, 173, 331–342. [Google Scholar] [CrossRef]
- Tervo, E.; Agbim, K.; DeAngelis, F.; Hernandez, J.; Kim, H.K.; Odukomaiya, A. An Economic Analysis of Residential Photovoltaic Systems with Lithium Ion Battery Storage in the United States. Renewable and Sustainable Energy Reviews 2018, 94, 1057–1066. [Google Scholar] [CrossRef]
- Bendato, I.; Bonfiglio, A.; Brignone, M.; Delfino, F.; Pampararo, F.; Procopio, R.; Rossi, M. Design Criteria for the Optimal Sizing of Integrated Photovoltaic-Storage Systems. Energy 2018, 149, 505–515. [Google Scholar] [CrossRef]
- Belboul, Z.; Toual, B.; Kouzou, A.; Mokrani, L.; Bensalem, A.; Kennel, R.; Abdelrahem, M. Multiobjective Optimization of a Hybrid PV/Wind/Battery/Diesel Generator System Integrated in Microgrid: A Case Study in Djelfa, Algeria. Energies (Basel) 2022, 15, 3579. [Google Scholar] [CrossRef]
- Mukhopadhyay, B.; Das, D. Multi-Objective Dynamic and Static Reconfiguration with Optimized Allocation of PV-DG and Battery Energy Storage System. Renewable and Sustainable Energy Reviews 2020, 124, 109777. [Google Scholar] [CrossRef]
- Shivam, K.; Tzou, J.-C.; Wu, S.-C. A Multi-Objective Predictive Energy Management Strategy for Residential Grid-Connected PV-Battery Hybrid Systems Based on Machine Learning Technique. Energy Convers Manag 2021, 237, 114103. [Google Scholar] [CrossRef]
- Zhi, Y.; Yang, X. Scenario-Based Multi-Objective Optimization Strategy for Rural PV-Battery Systems. Appl Energy 2023, 345, 121314. [Google Scholar] [CrossRef]
- Song, Z.; Guan, X.; Cheng, M. Multi-Objective Optimization Strategy for Home Energy Management System Including PV and Battery Energy Storage. Energy Reports 2022, 8, 5396–5411. [Google Scholar] [CrossRef]
- Park, H. A Stochastic Planning Model for Battery Energy Storage Systems Coupled with Utility-Scale Solar Photovoltaics. Energies (Basel) 2021, 14, 1244. [Google Scholar] [CrossRef]
- Javidsharifi, M.; Pourroshanfekr Arabani, H.; Kerekes, T.; Sera, D.; Guerrero, J.M. Stochastic Optimal Strategy for Power Management in Interconnected Multi-Microgrid Systems. Electronics (Basel) 2022, 11, 1424. [Google Scholar] [CrossRef]
- Guo, E.; He, B.; Zhang, J. Effects of Photovoltaic Panel Type on Optimum Sizing of an Electrical Energy Storage System Using a Stochastic Optimization Approach. J Energy Storage 2023, 72, 108581. [Google Scholar] [CrossRef]
- Ntube, N.; Li, H. Stochastic Multi-Objective Optimal Sizing of Battery Energy Storage System for a Residential Home. J Energy Storage 2023, 59, 106403. [Google Scholar] [CrossRef]
- Zheng, Z.; Li, X.; Pan, J.; Luo, X. A Multi-Year Two-Stage Stochastic Programming Model for Optimal Design and Operation of Residential Photovoltaic-Battery Systems. Energy Build 2021, 239, 110835. [Google Scholar] [CrossRef]
- Rong, S.; Zhao, Y.; Wang, Y.; Chen, J.; Guan, W.; Cui, J.; Liu, Y. Information Gap Decision Theory-Based Stochastic Optimization for Smart Microgrids with Multiple Transformers. Applied Sciences 2023, 13, 9305. [Google Scholar] [CrossRef]
- Chaerani, D.; Shuib, A.; Perdana, T.; Irmansyah, A.Z. Systematic Literature Review on Robust Optimization in Solving Sustainable Development Goals (SDGs) Problems during the COVID-19 Pandemic. Sustainability 2023, 15, 5654. [Google Scholar] [CrossRef]
- Bakhtvar, M.; Al-Hinai, A. Robust Operation of Hybrid Solar–Wind Power Plant with Battery Energy Storage System. Energies (Basel) 2021, 14, 3781. [Google Scholar] [CrossRef]
- Aghamohamadi, M.; Mahmoudi, A.; Haque, M.H. Two-Stage Robust Sizing and Operation Co-Optimization for Residential PV–Battery Systems Considering the Uncertainty of PV Generation and Load. IEEE Trans Industr Inform 2021, 17, 1005–1017. [Google Scholar] [CrossRef]
- Coppitters, D.; De Paepe, W.; Contino, F. Robust Design Optimization and Stochastic Performance Analysis of a Grid-Connected Photovoltaic System with Battery Storage and Hydrogen Storage. Energy 2020, 213, 118798. [Google Scholar] [CrossRef]
- Nematirad, R.; Pahwa, A. Solar Radiation Forecasting Using Artificial Neural Networks Considering Feature Selection. In Proceedings of the 2022 IEEE Kansas Power and Energy Conference (KPEC); IEEE, April 25 2022; pp. 1–4. [CrossRef]
- Mellit, A.; Massi Pavan, A.; Ogliari, E.; Leva, S.; Lughi, V. Advanced Methods for Photovoltaic Output Power Forecasting: A Review. Applied Sciences 2020, 10, 487. [Google Scholar] [CrossRef]
- Kaufhold, E.; Meyer, J.; Myrzik, J.; Schegner, P. Harmonic Stability Assessment of Commercially Available Single-Phase Photovoltaic Inverters Considering Operating-Point Dependencies. Solar 2023, 3, 473–486. [Google Scholar] [CrossRef]
- Li, R.; Huang, S.; Dou, H. Dynamic Risk Assessment of Landslide Hazard for Large-Scale Photovoltaic Power Plants under Extreme Rainfall Conditions. Water (Basel) 2023, 15, 2832. [Google Scholar] [CrossRef]
- de Figueiredo, F.A.P.; Dias, C.F.; de Lima, E.R.; Fraidenraich, G. Capacity Bounds for Dense Massive MIMO in a Line-of-Sight Propagation Environment. Sensors 2020, 20, 520. [Google Scholar] [CrossRef]
- Althubyani, F.A.; Abd El-Bar, A.M.T.; Fawzy, M.A.; Gemeay, A.M. A New 3-Parameter Bounded Beta Distribution: Properties, Estimation, and Applications. Axioms 2022, 11, 504. [Google Scholar] [CrossRef]
- Valvo, P.S. A Bimodal Lognormal Distribution Model for the Prediction of COVID-19 Deaths. Applied Sciences 2020, 10, 8500. [Google Scholar] [CrossRef]
- Upreti, D.; Pignatti, S.; Pascucci, S.; Tolomio, M.; Li, Z.; Huang, W.; Casa, R. A Comparison of Moment-Independent and Variance-Based Global Sensitivity Analysis Approaches for Wheat Yield Estimation with the Aquacrop-OS Model. Agronomy 2020, 10, 607. [Google Scholar] [CrossRef]
- Kyeong, S.; Kim, D.; Shin, J. Can System Log Data Enhance the Performance of Credit Scoring?—Evidence from an Internet Bank in Korea. Sustainability 2021, 14, 130. [Google Scholar] [CrossRef]
- Dehwah, A.H.A.; Asif, M.; Budaiwi, I.M.; Alshibani, A. Techno-Economic Assessment of Rooftop PV Systems in Residential Buildings in Hot–Humid Climates. Sustainability 2020, 12, 10060. [Google Scholar] [CrossRef]
- Hazim, H.I.; Baharin, K.A.; Gan, C.K.; Sabry, A.H.; Humaidi, A.J. Review on Optimization Techniques of PV/Inverter Ratio for Grid-Tie PV Systems. Applied Sciences 2023, 13, 3155. [Google Scholar] [CrossRef]
- Raza, F.; Tamoor, M.; Miran, S.; Arif, W.; Kiren, T.; Amjad, W.; Hussain, M.I.; Lee, G.-H. The Socio-Economic Impact of Using Photovoltaic (PV) Energy for High-Efficiency Irrigation Systems: A Case Study. Energies (Basel) 2022, 15, 1198. [Google Scholar] [CrossRef]
- Shepovalova, O.; Izmailov, A.; Lobachevsky, Y.; Dorokhov, A. High-Efficiency Photovoltaic Equipment for Agriculture Power Supply. Agriculture 2023, 13, 1234. [Google Scholar] [CrossRef]
- Ershad, A.M.; Ueckerdt, F.; Pietzcker, R.C.; Giannousakis, A.; Luderer, G. A Further Decline in Battery Storage Costs Can Pave the Way for a Solar PV-Dominated Indian Power System. Renewable and Sustainable Energy Transition 2021, 1, 100006. [Google Scholar] [CrossRef]
- Asad, M.; Mahmood, F.I.; Baffo, I.; Mauro, A.; Petrillo, A. The Cost Benefit Analysis of Commercial 100 MW Solar PV: The Plant Quaid-e-Azam Solar Power Pvt Ltd. Sustainability 2022, 14, 2895. [Google Scholar] [CrossRef]
- Boonluk, P.; Khunkitti, S.; Fuangfoo, P.; Siritaratiwat, A. Optimal Siting and Sizing of Battery Energy Storage: Case Study Seventh Feeder at Nakhon Phanom Substation in Thailand. Energies (Basel) 2021, 14, 1458. [Google Scholar] [CrossRef]
- Quiles-Cucarella, E.; Marquina-Tajuelo, A.; Roldán-Blay, C.; Roldán-Porta, C. Particle Swarm Optimization Method for Stand-Alone Photovoltaic System Reliability and Cost Evaluation Based on Monte Carlo Simulation. Applied Sciences 2023, 13, 11623. [Google Scholar] [CrossRef]
- Hoffmann, M.; Kotzur, L.; Stolten, D.; Robinius, M. A Review on Time Series Aggregation Methods for Energy System Models. Energies (Basel) 2020, 13, 641. [Google Scholar] [CrossRef]
- Yang, M.; Zhao, M.; Huang, D.; Su, X. A Composite Framework for Photovoltaic Day-Ahead Power Prediction Based on Dual Clustering of Dynamic Time Warping Distance and Deep Autoencoder. Renew Energy 2022, 194, 659–673. [Google Scholar] [CrossRef]
- Li, F.; Su, J.; Sun, B. An Optimal Scheduling Method for an Integrated Energy System Based on an Improved K-Means Clustering Algorithm. Energies (Basel) 2023, 16, 3713. [Google Scholar] [CrossRef]
- Onumanyi, A.J.; Molokomme, D.N.; Isaac, S.J.; Abu-Mahfouz, A.M. AutoElbow: An Automatic Elbow Detection Method for Estimating the Number of Clusters in a Dataset. Applied Sciences 2022, 12, 7515. [Google Scholar] [CrossRef]
- Criado-Ramón, D.; Ruiz, L.G.B.; Pegalajar, M.C. An Improved Pattern Sequence-Based Energy Load Forecast Algorithm Based on Self-Organizing Maps and Artificial Neural Networks. Big Data and Cognitive Computing 2023, 7, 92. [Google Scholar] [CrossRef]
Figure 1.
Organizational flowchart of the simulation procedure in this study.
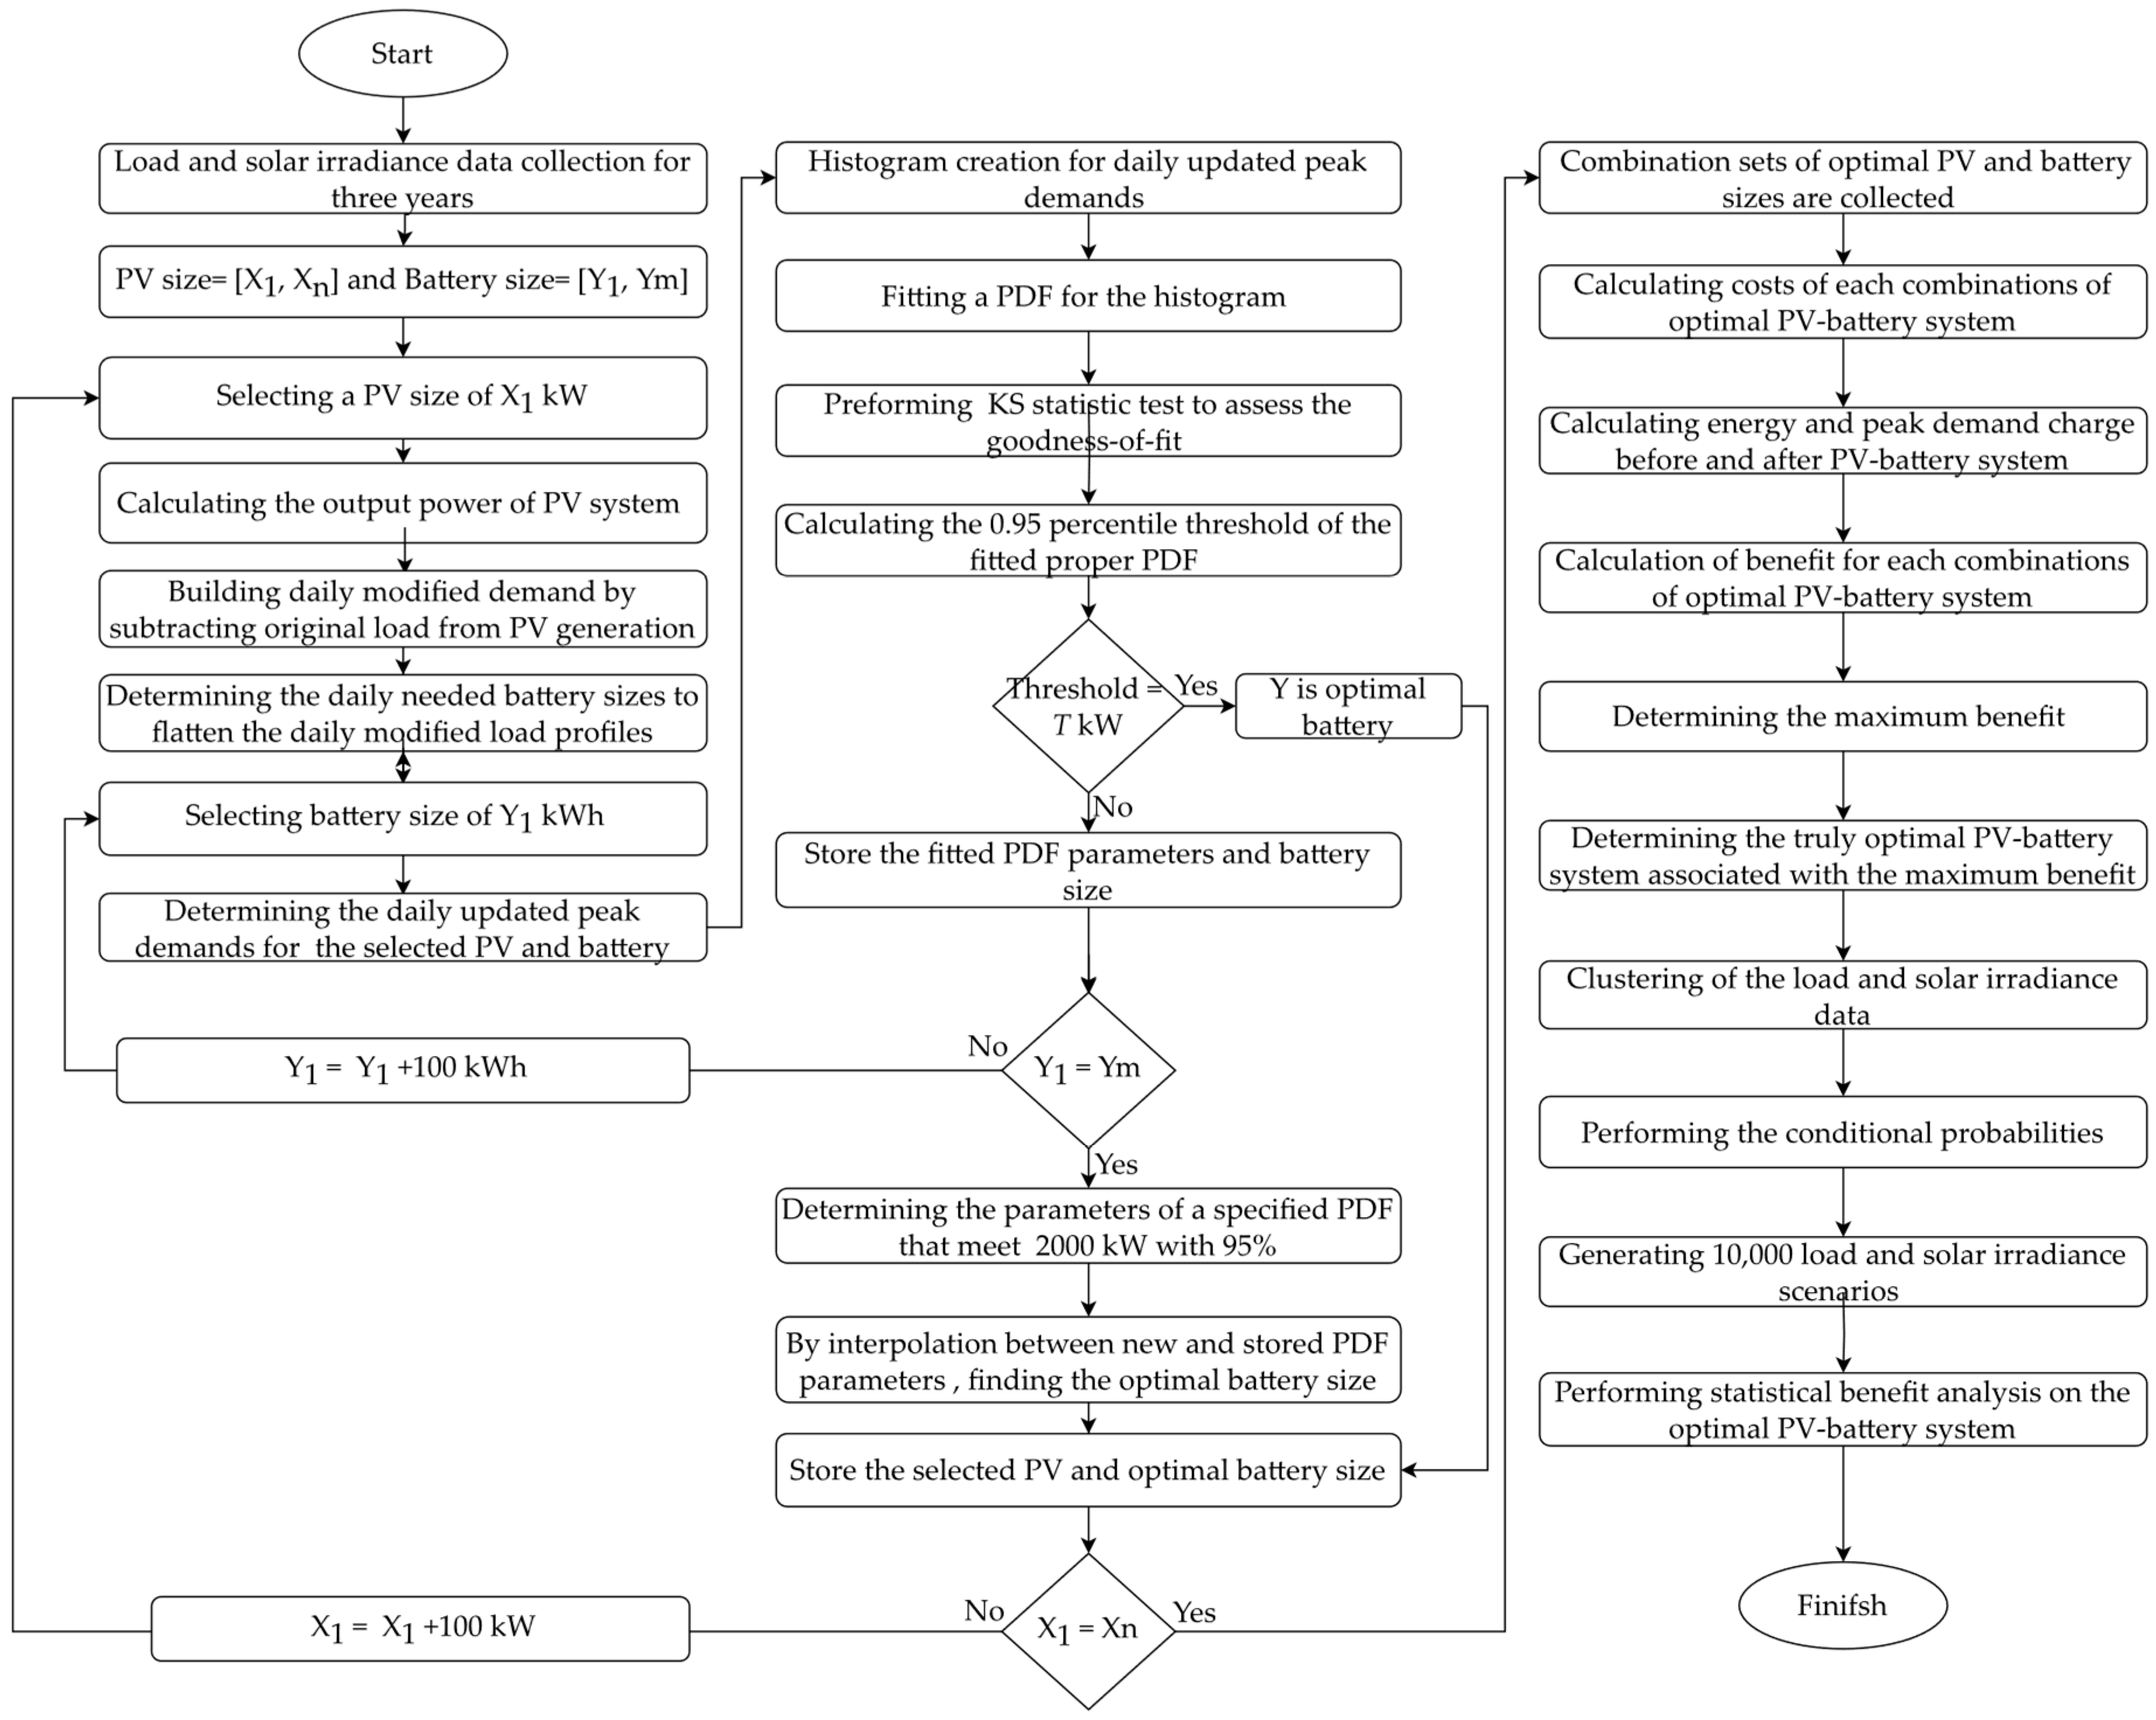
Figure 2.
Illustration of needed battery size and updated peak demand calculation for a 2000 kW PV system on a specific day in December 2020.
Figure 2.
Illustration of needed battery size and updated peak demand calculation for a 2000 kW PV system on a specific day in December 2020.
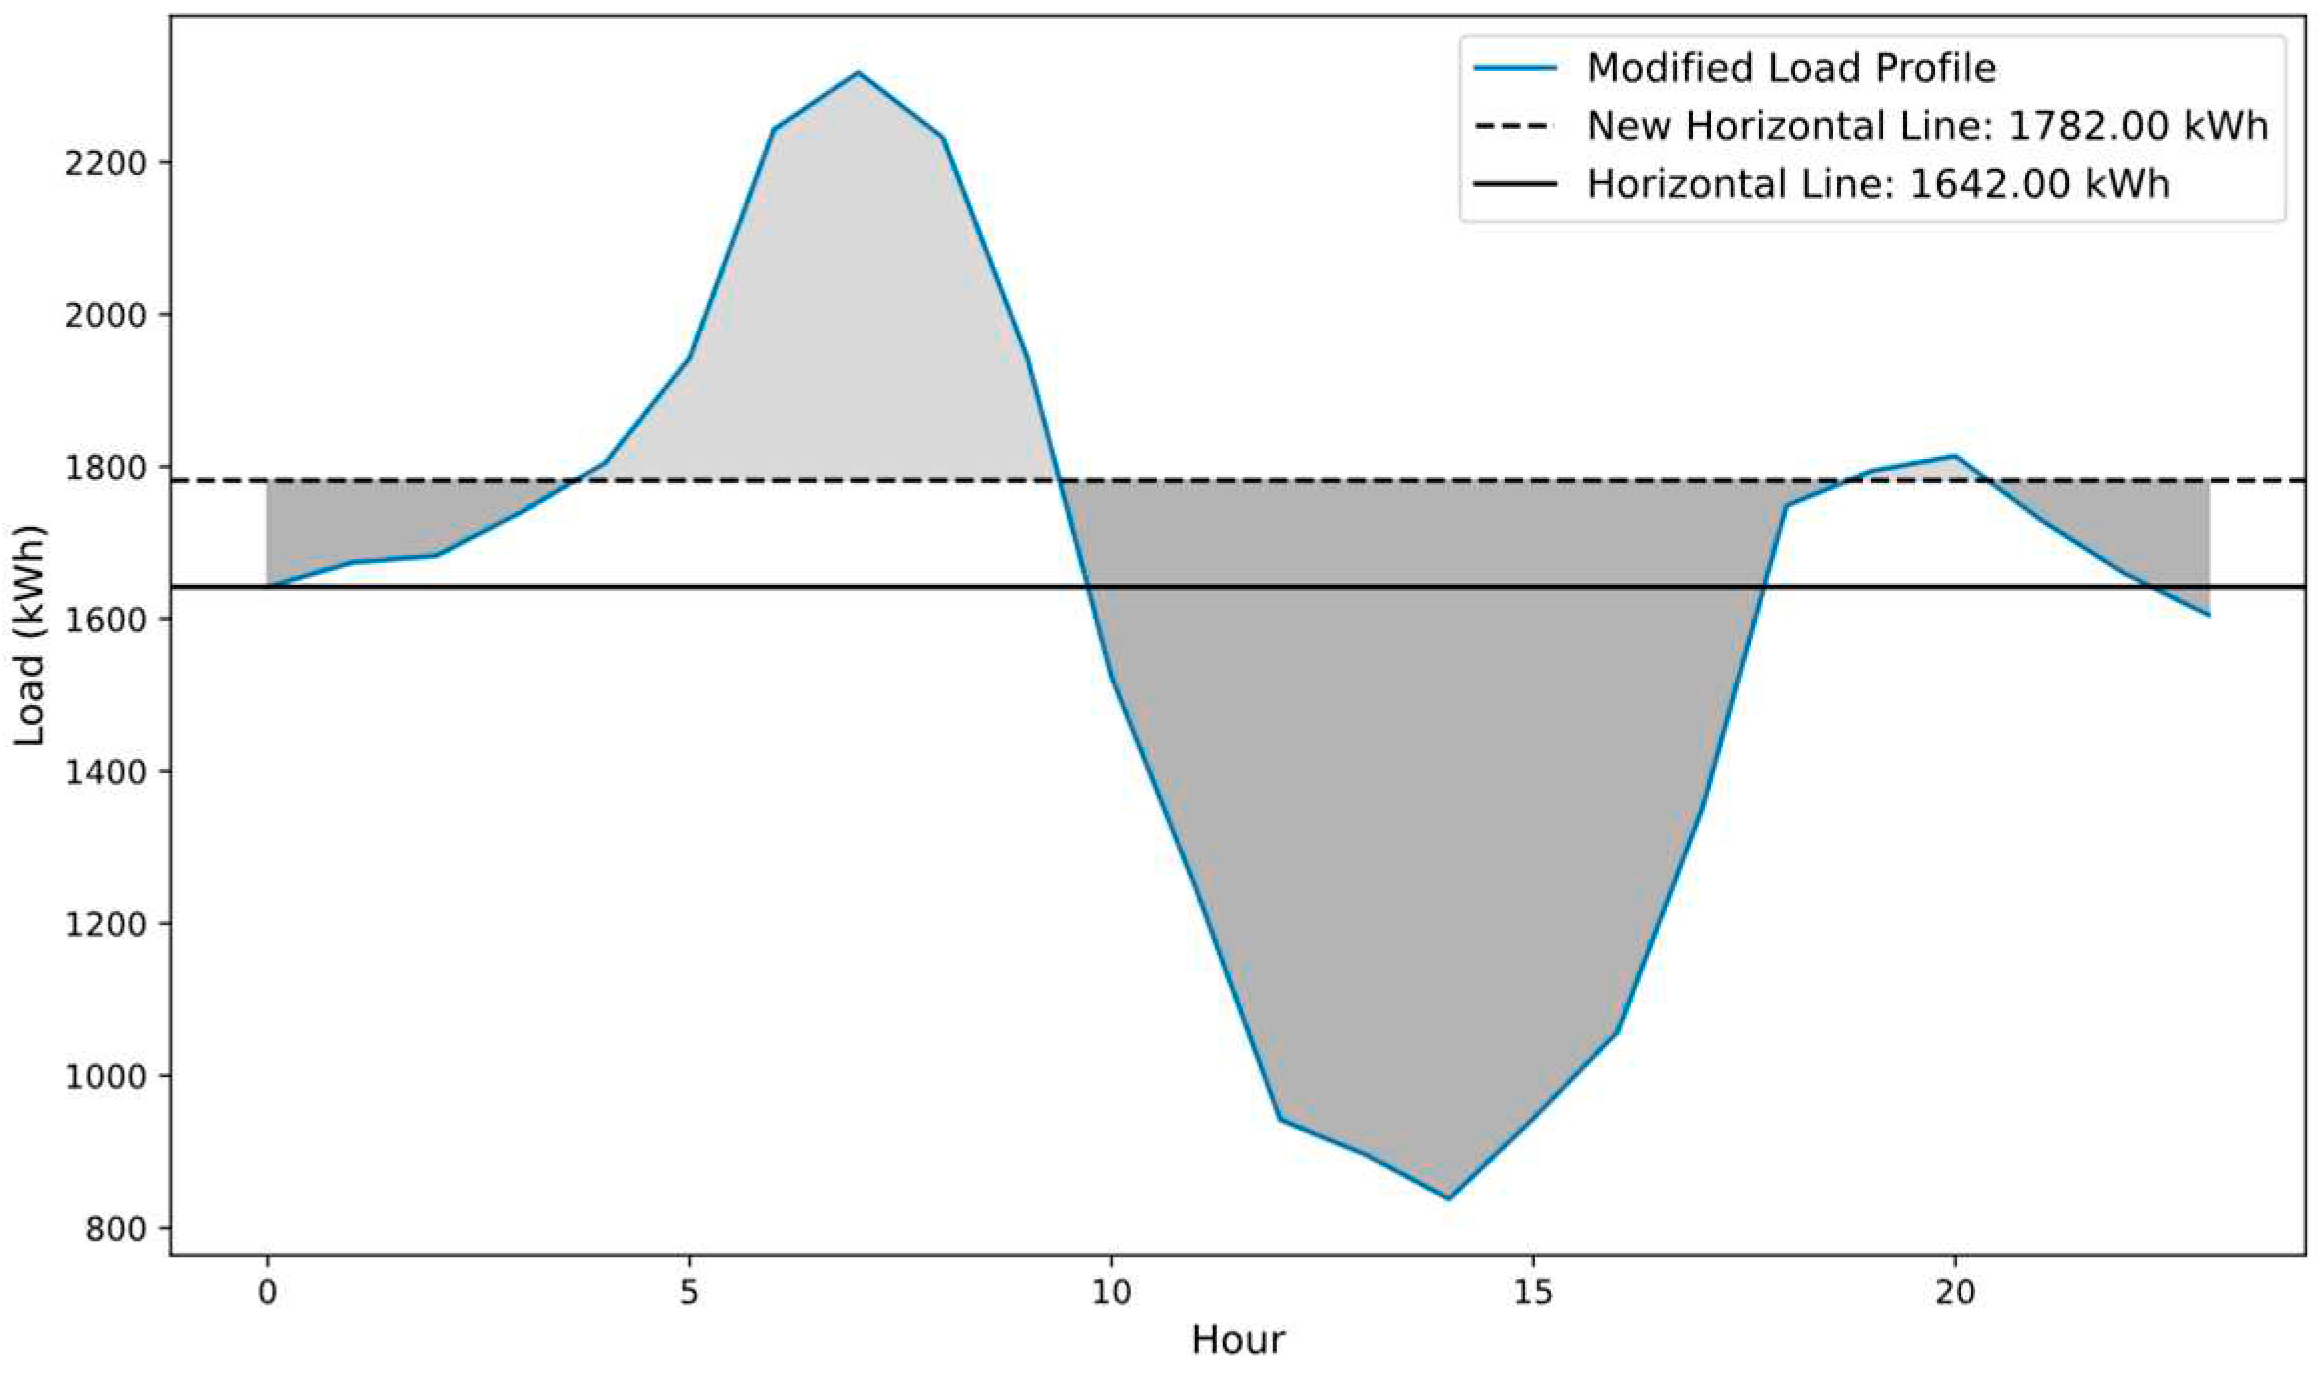
Figure 3.
Organizational flowchart to generate load and solar irradiance scenarios based on their interdependencies.
Figure 3.
Organizational flowchart to generate load and solar irradiance scenarios based on their interdependencies.
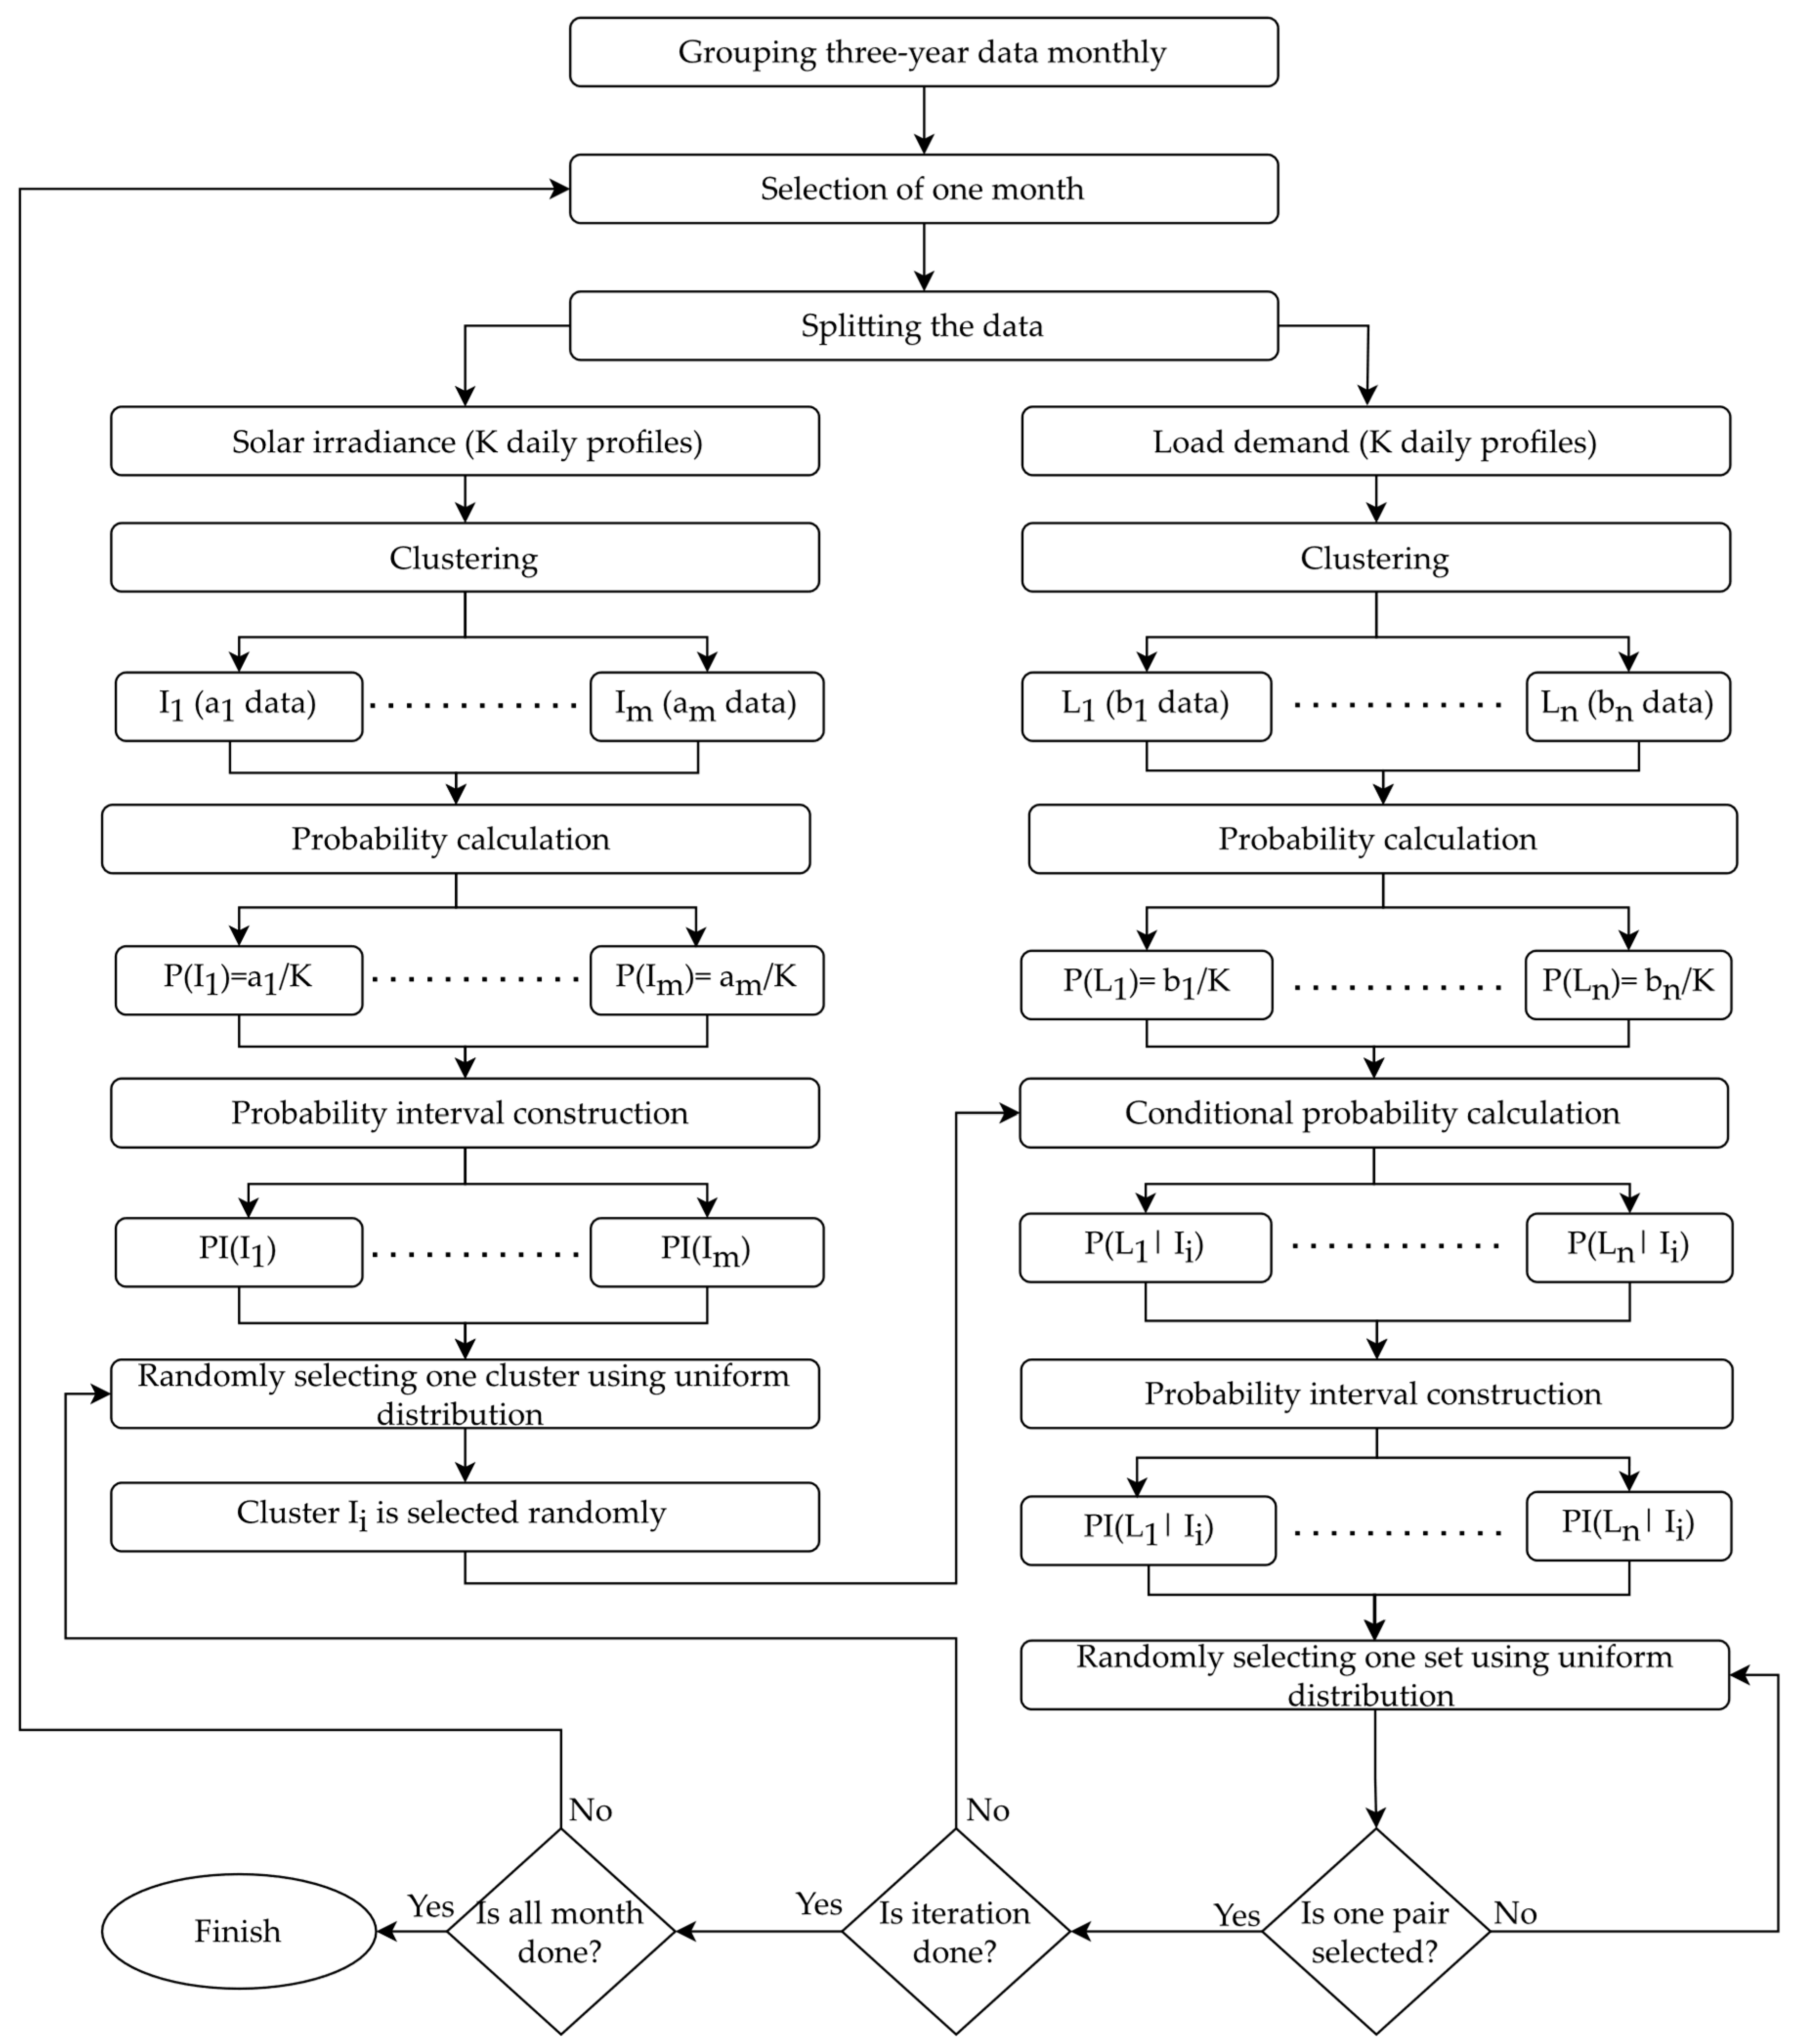
Figure 4.
Histogram of the daily peak demand hours for 2019.
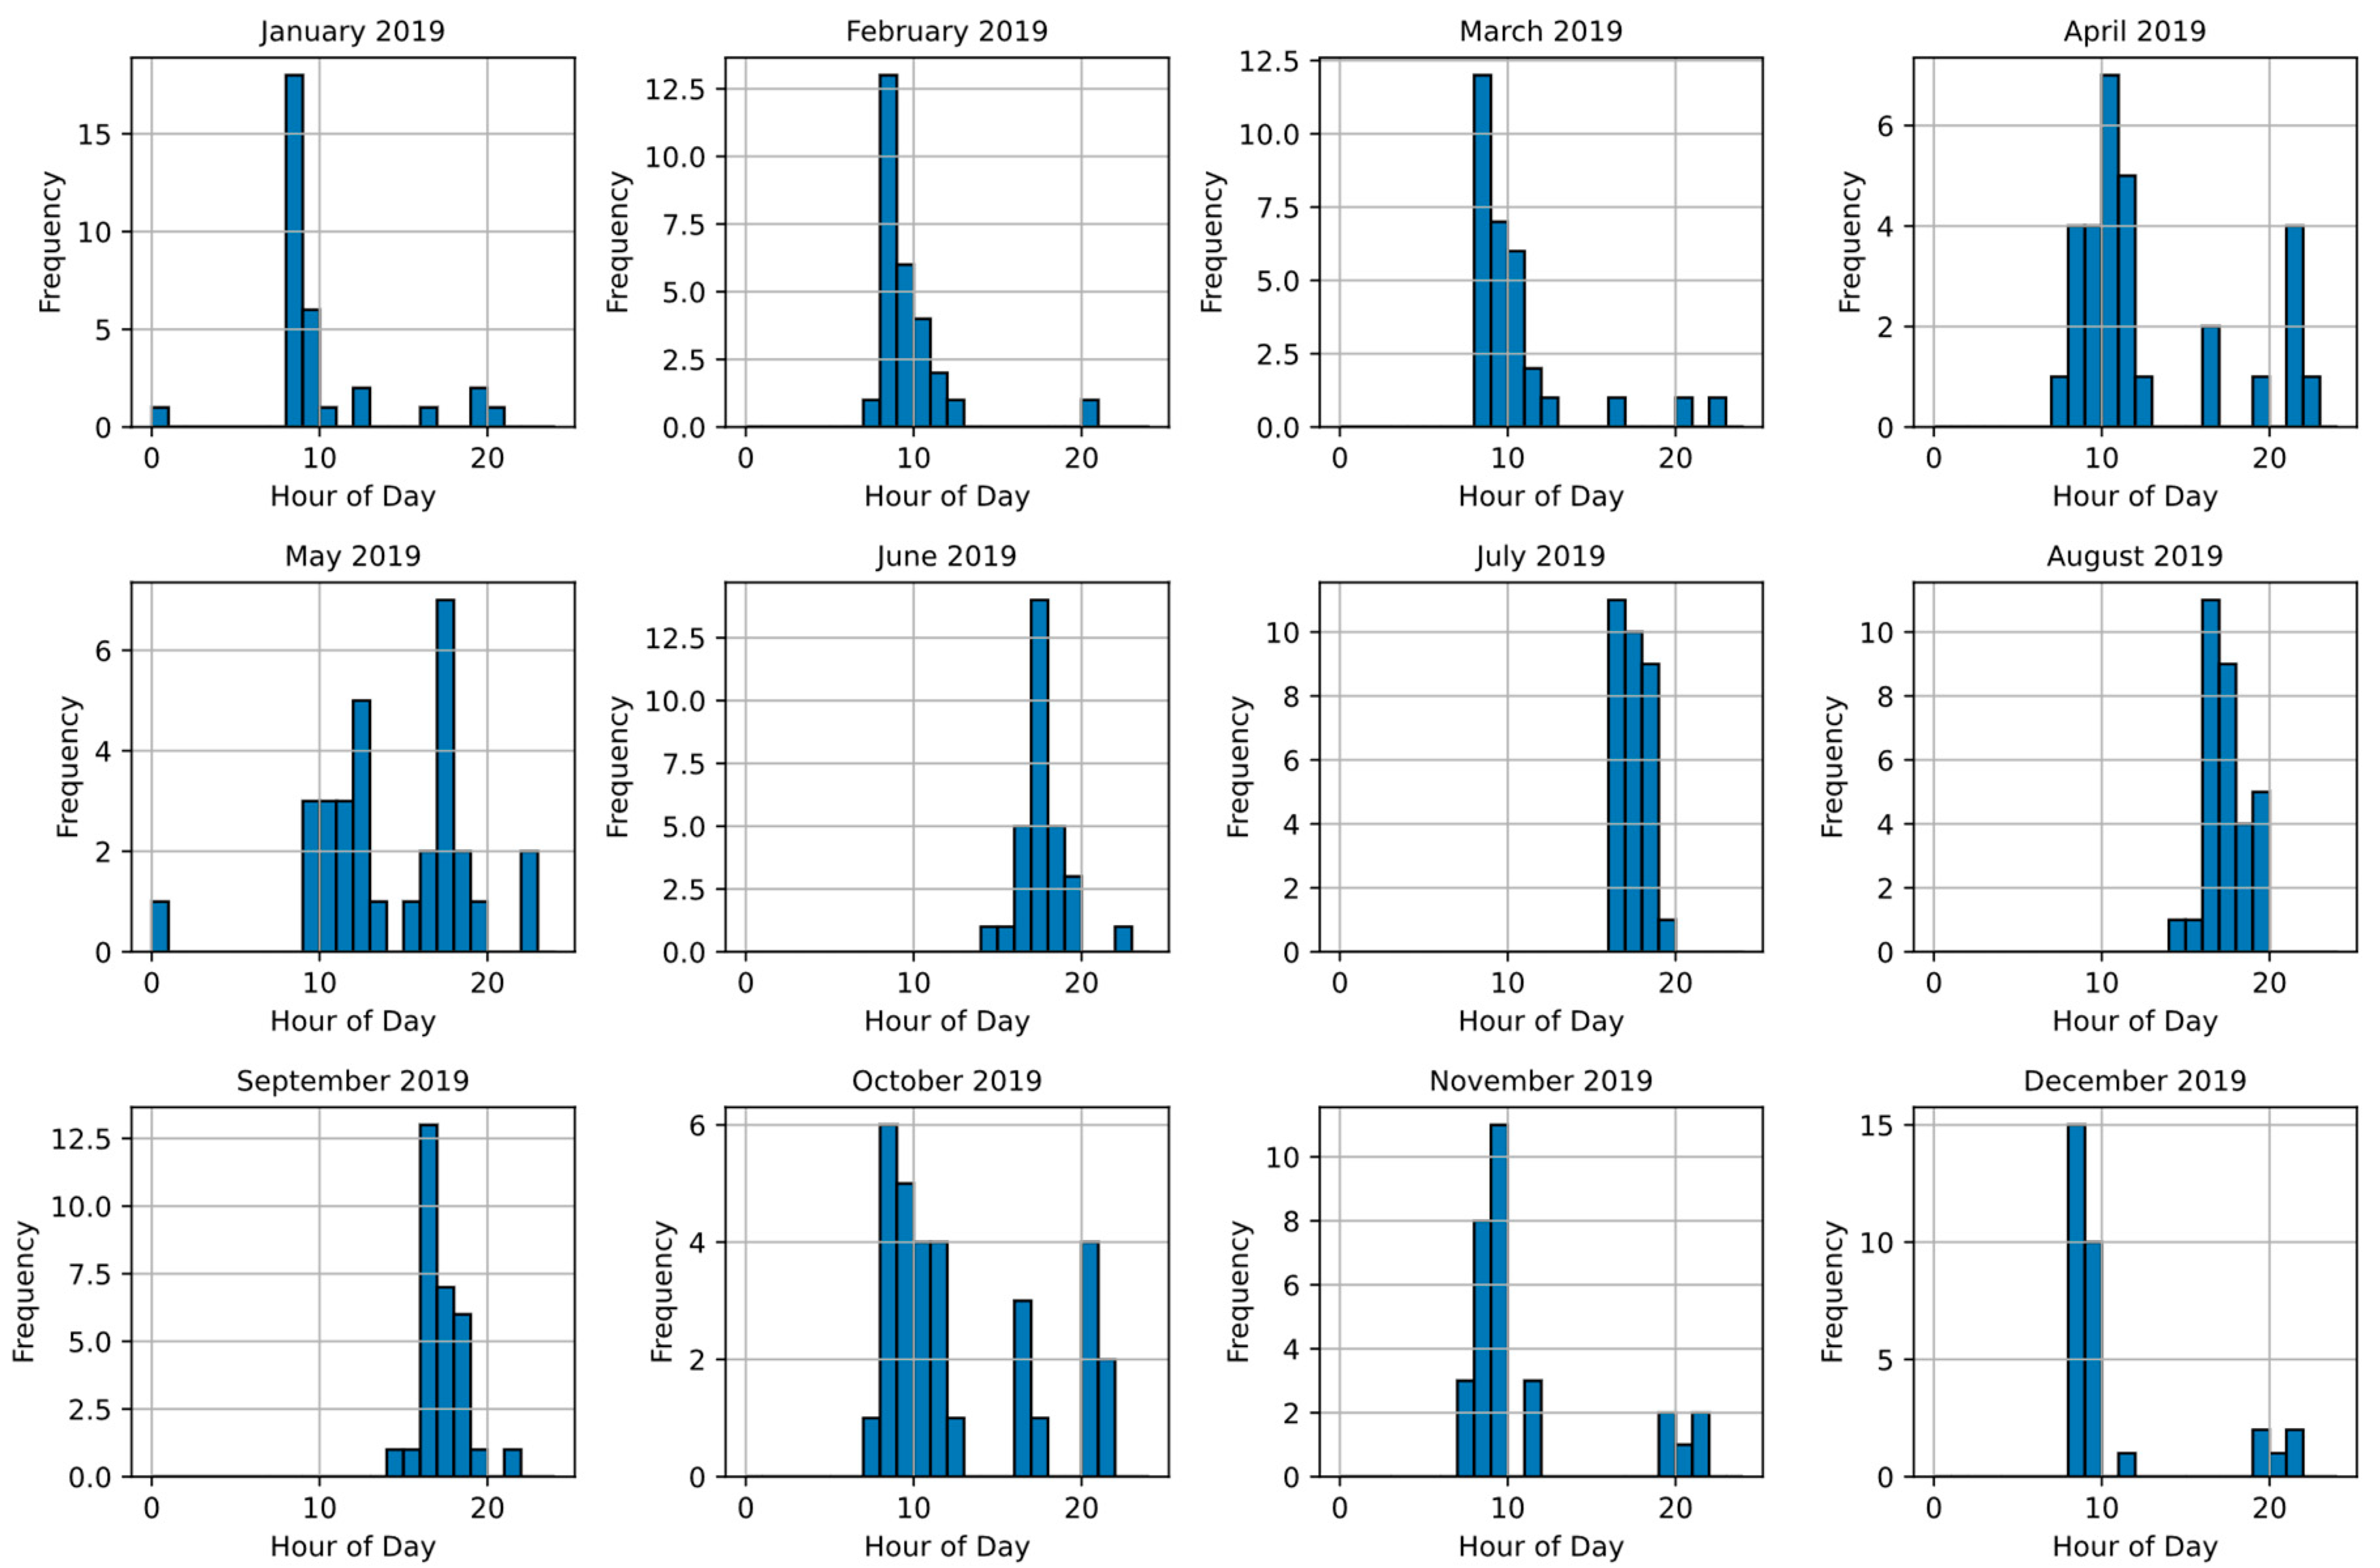
Figure 5.
Histogram of the daily needed battery sizes that effectively flatten the load profiles for PV=2000 kW.
Figure 5.
Histogram of the daily needed battery sizes that effectively flatten the load profiles for PV=2000 kW.
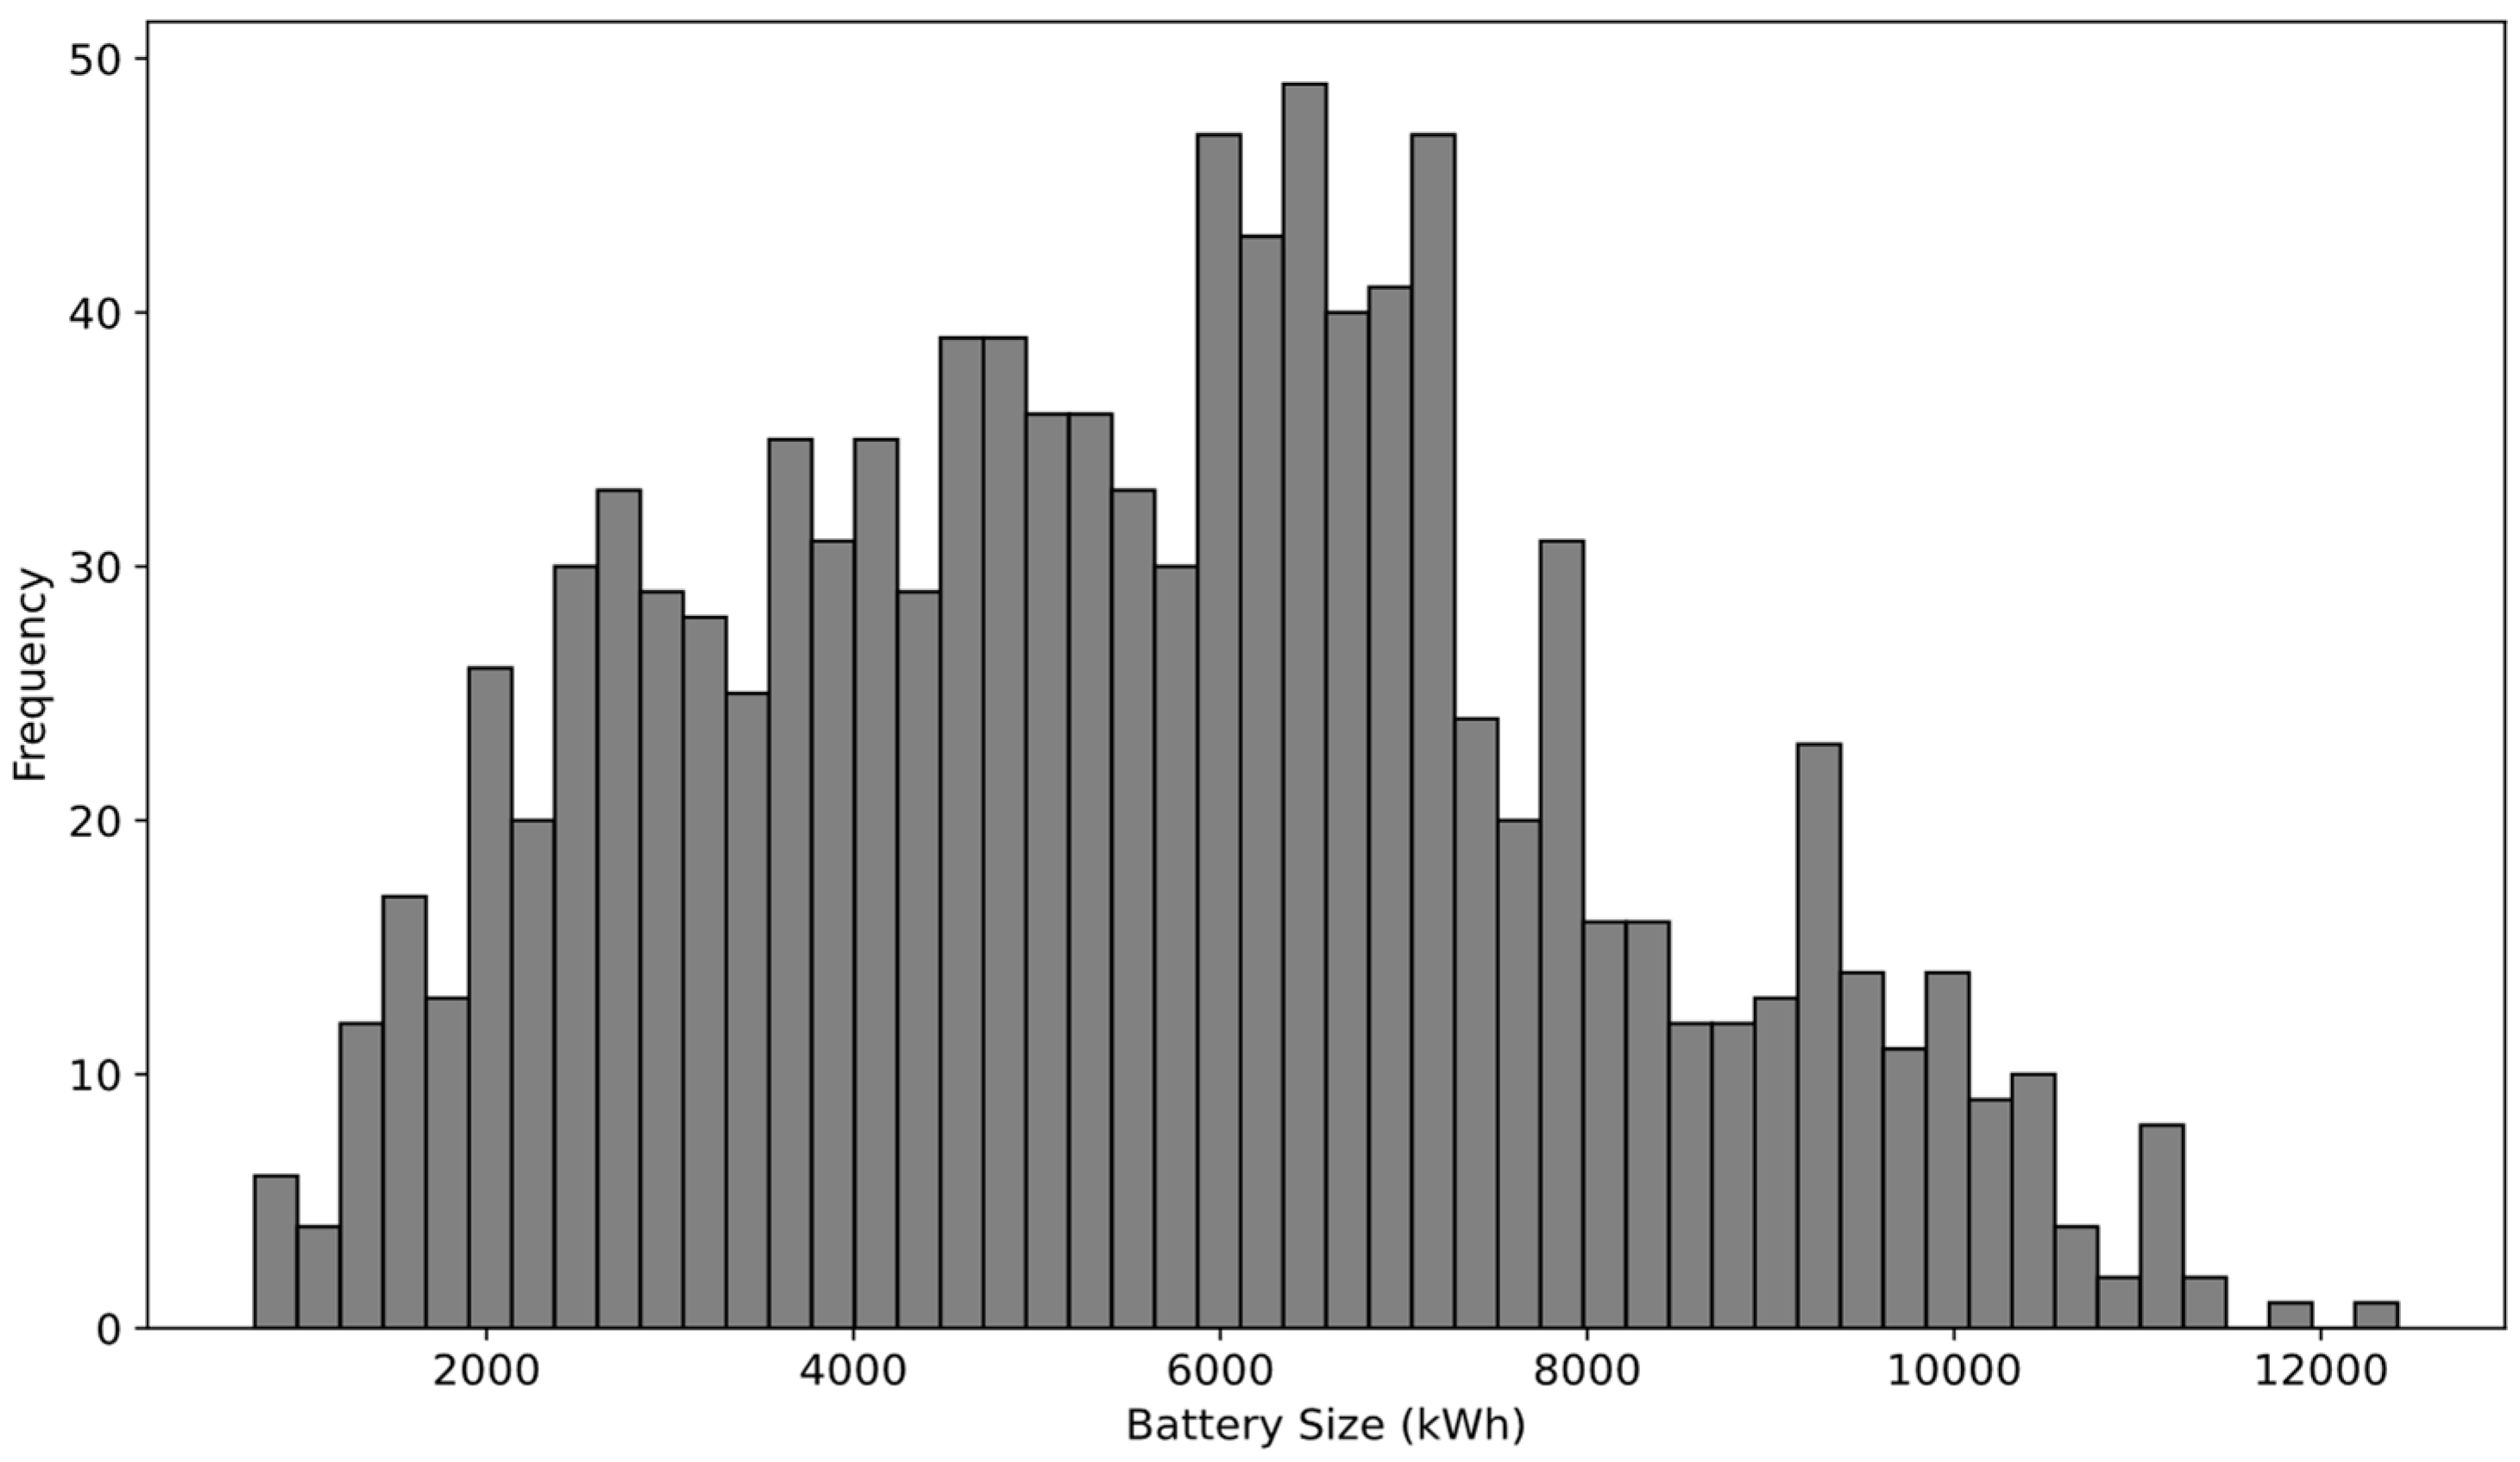
Figure 6.
Fitted Gamma PDF for updated daily peaks with PV =2000 kW and battery =3000 kWh.
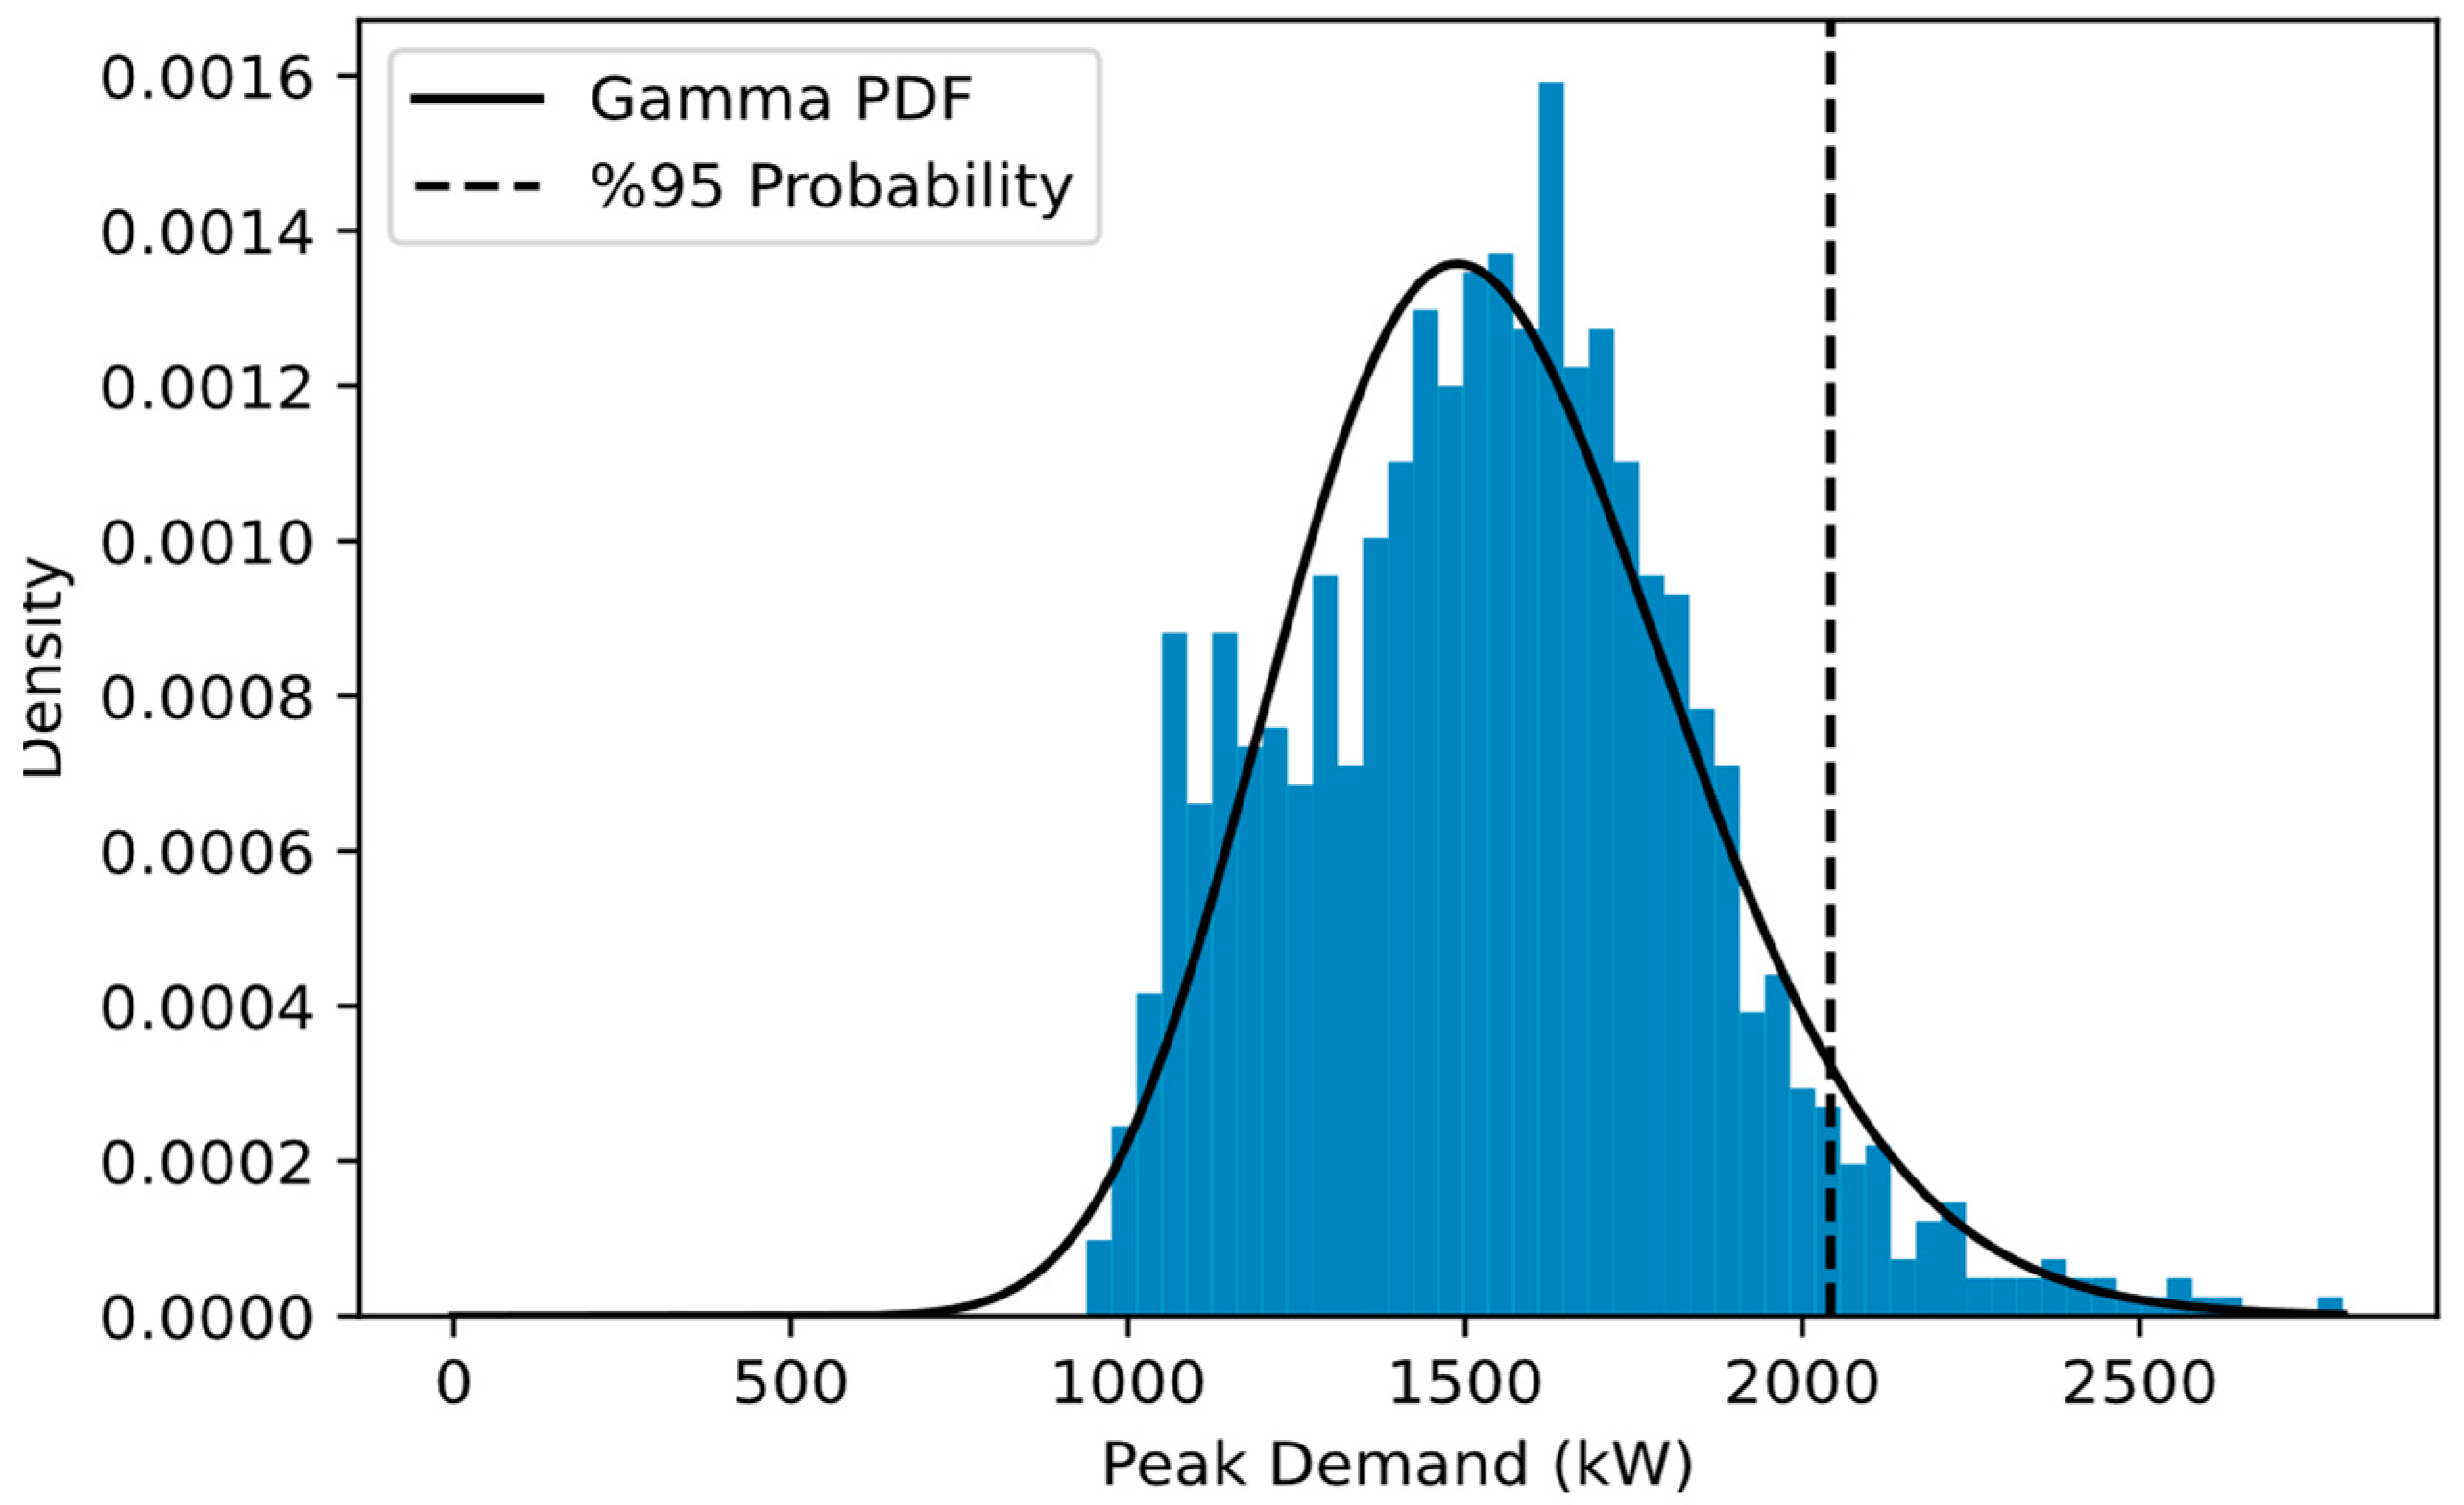
Figure 7.
Shape and scale parameters of the fitted Gamma PDFs for PV size of 2000 kW and various battery sizes.
Figure 7.
Shape and scale parameters of the fitted Gamma PDFs for PV size of 2000 kW and various battery sizes.
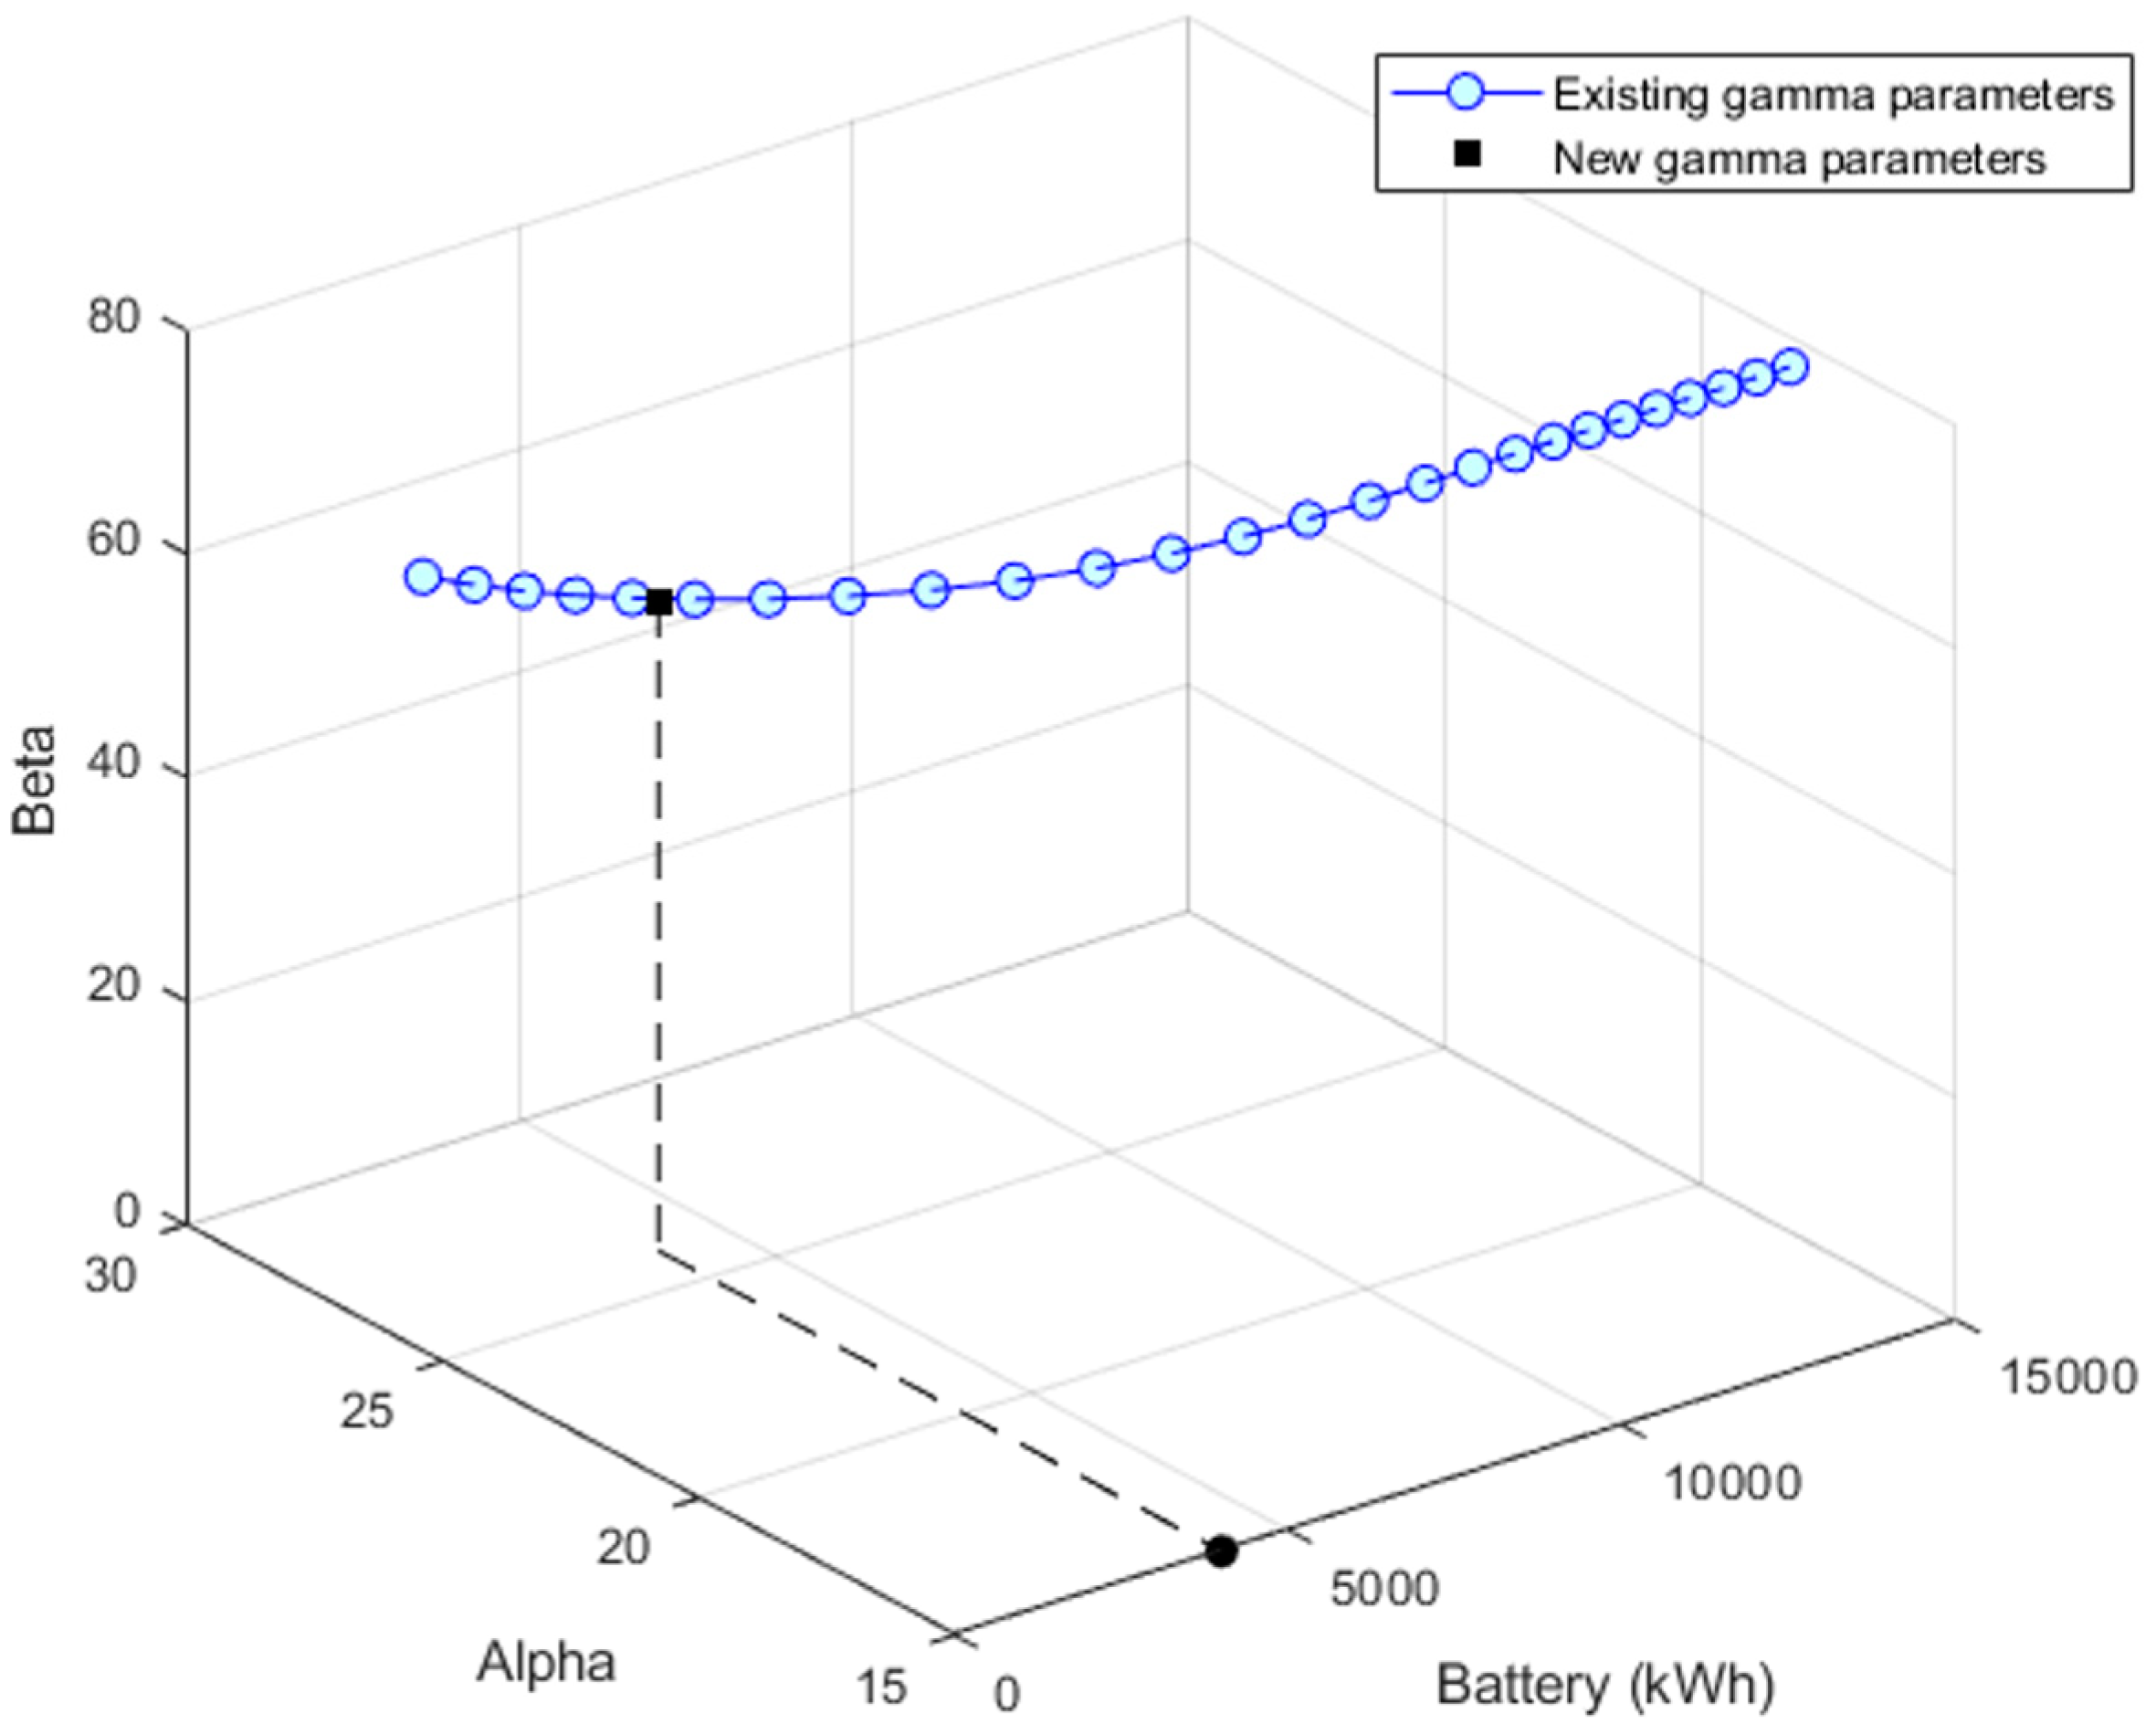
Figure 8.
Financial benefit of the optimal combinations of the PV-battery system.
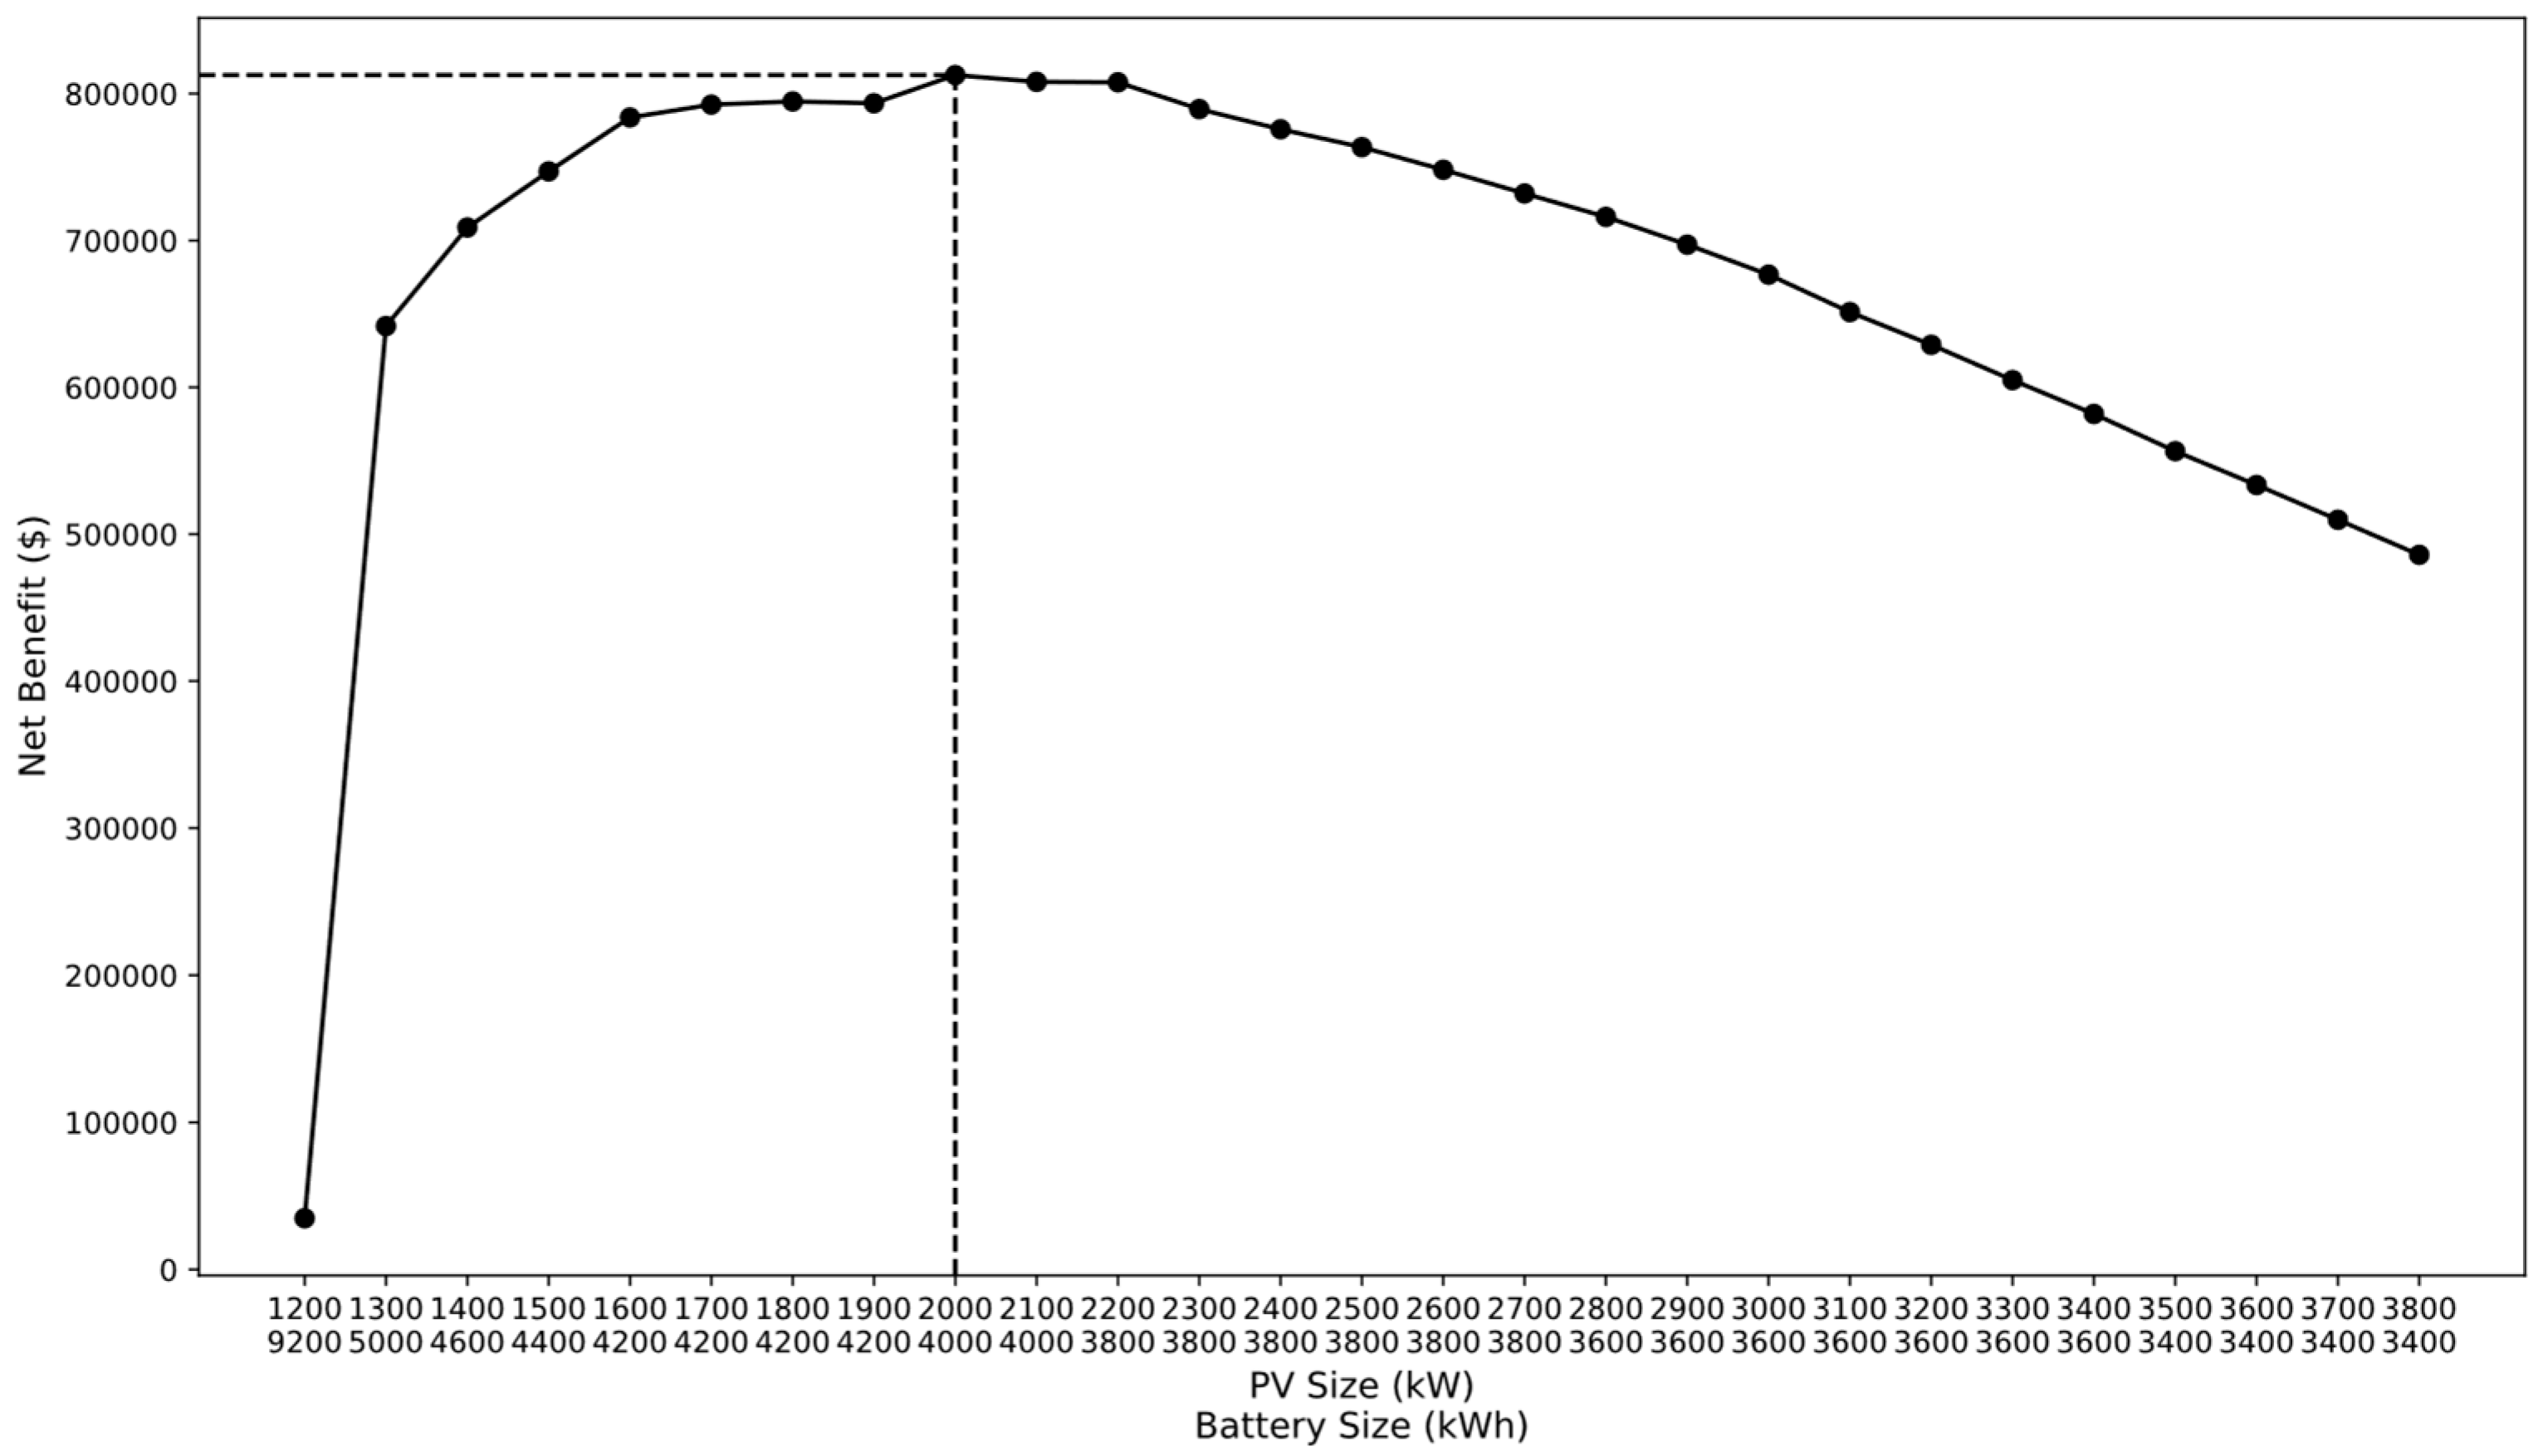
Figure 9.
Elbow curve of the K-Means clustering for January load profiles.
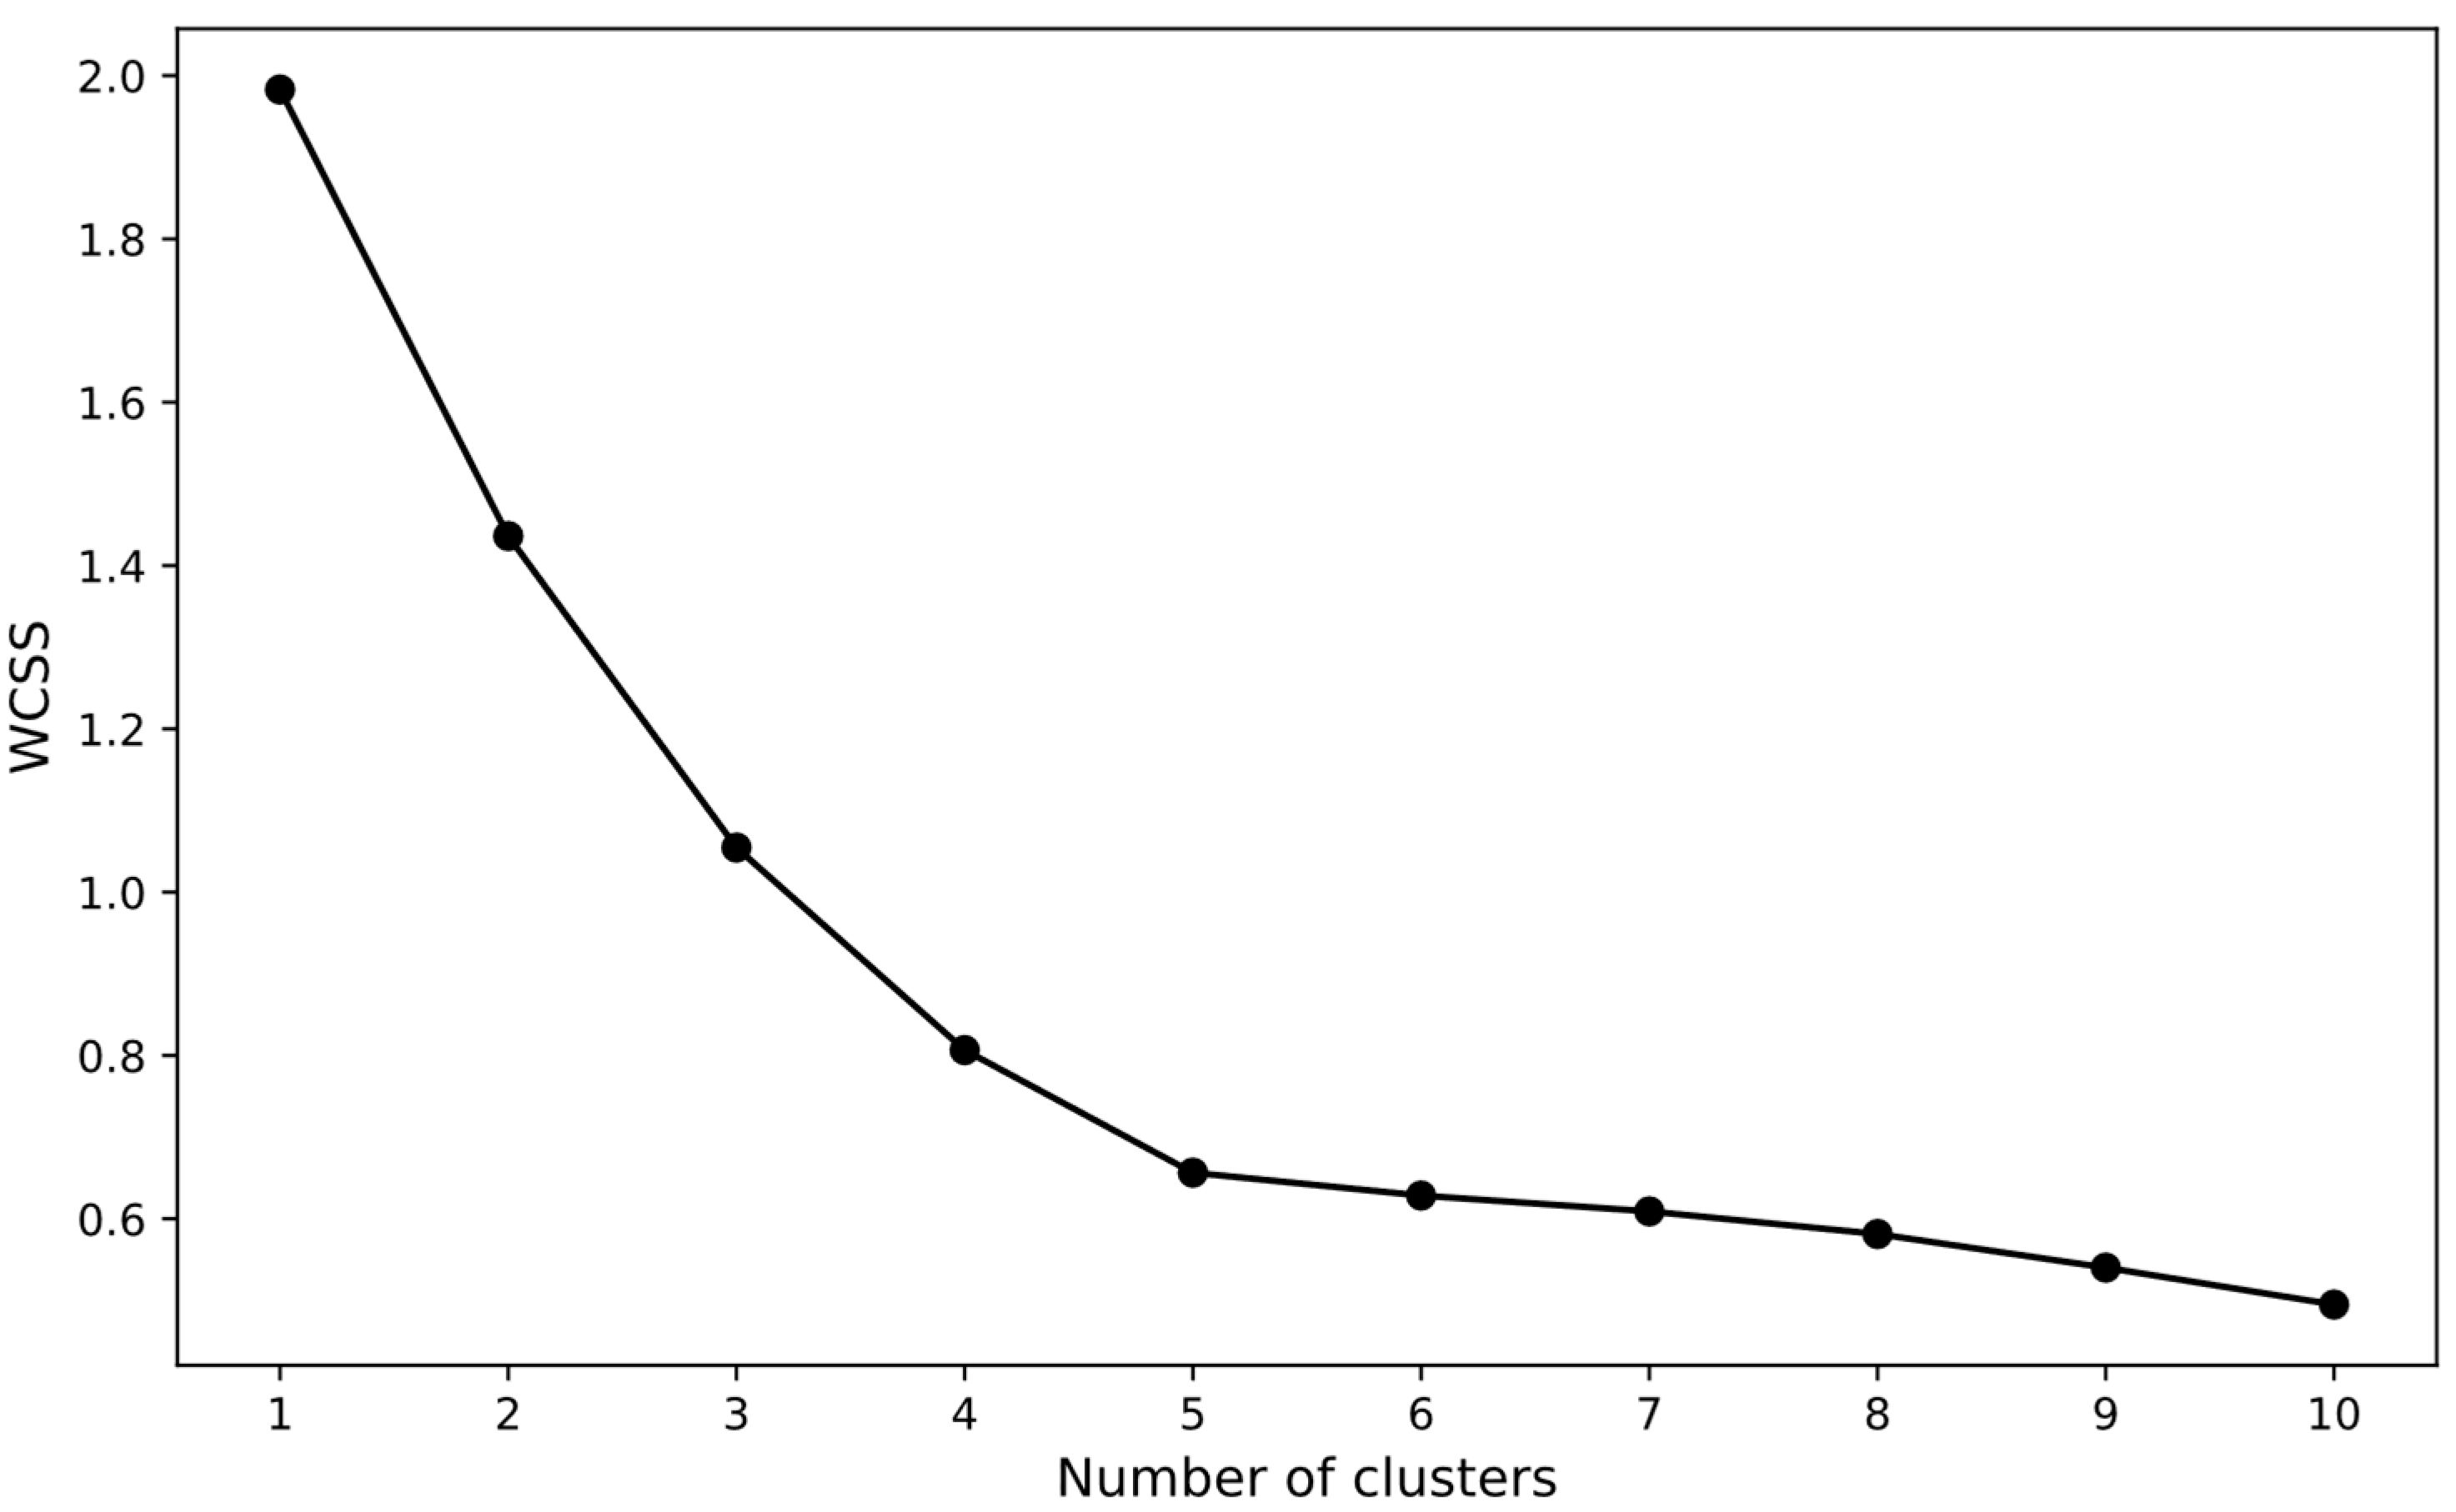
Figure 10.
Results of the January load demand clustering using self-organizing maps.
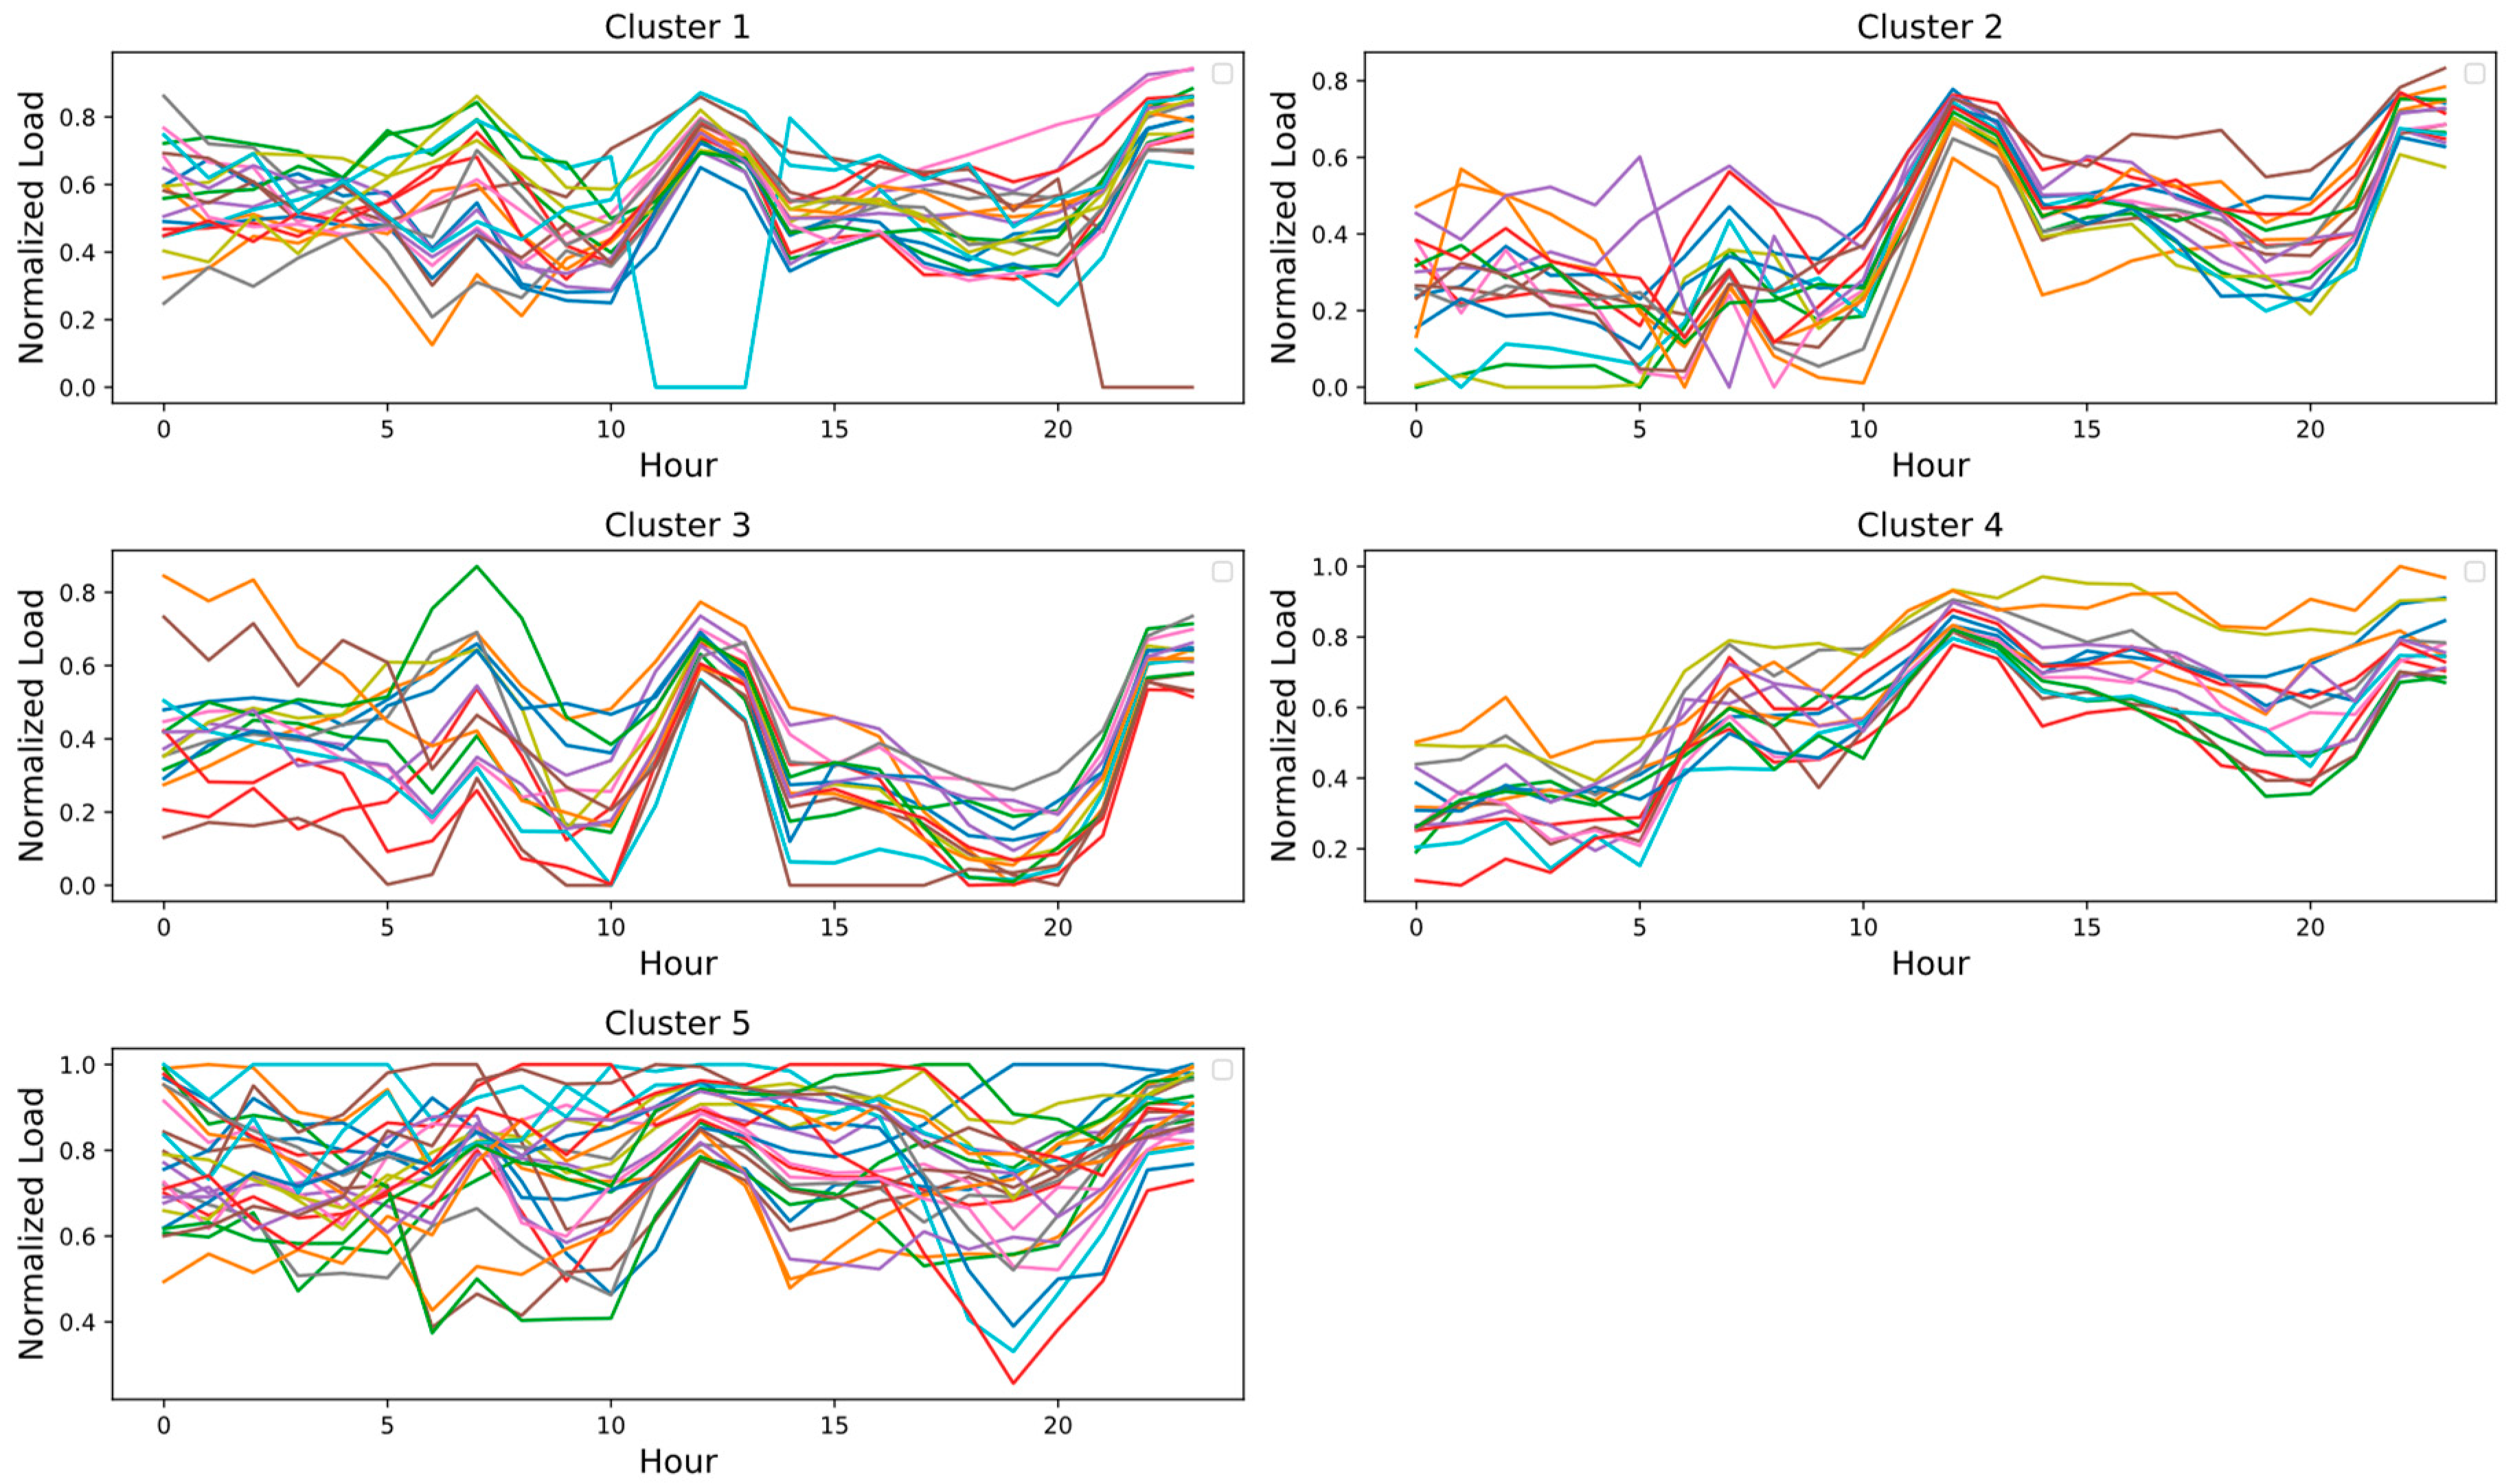
Figure 11.
Histogram and fitted normal distribution for financial benefit.
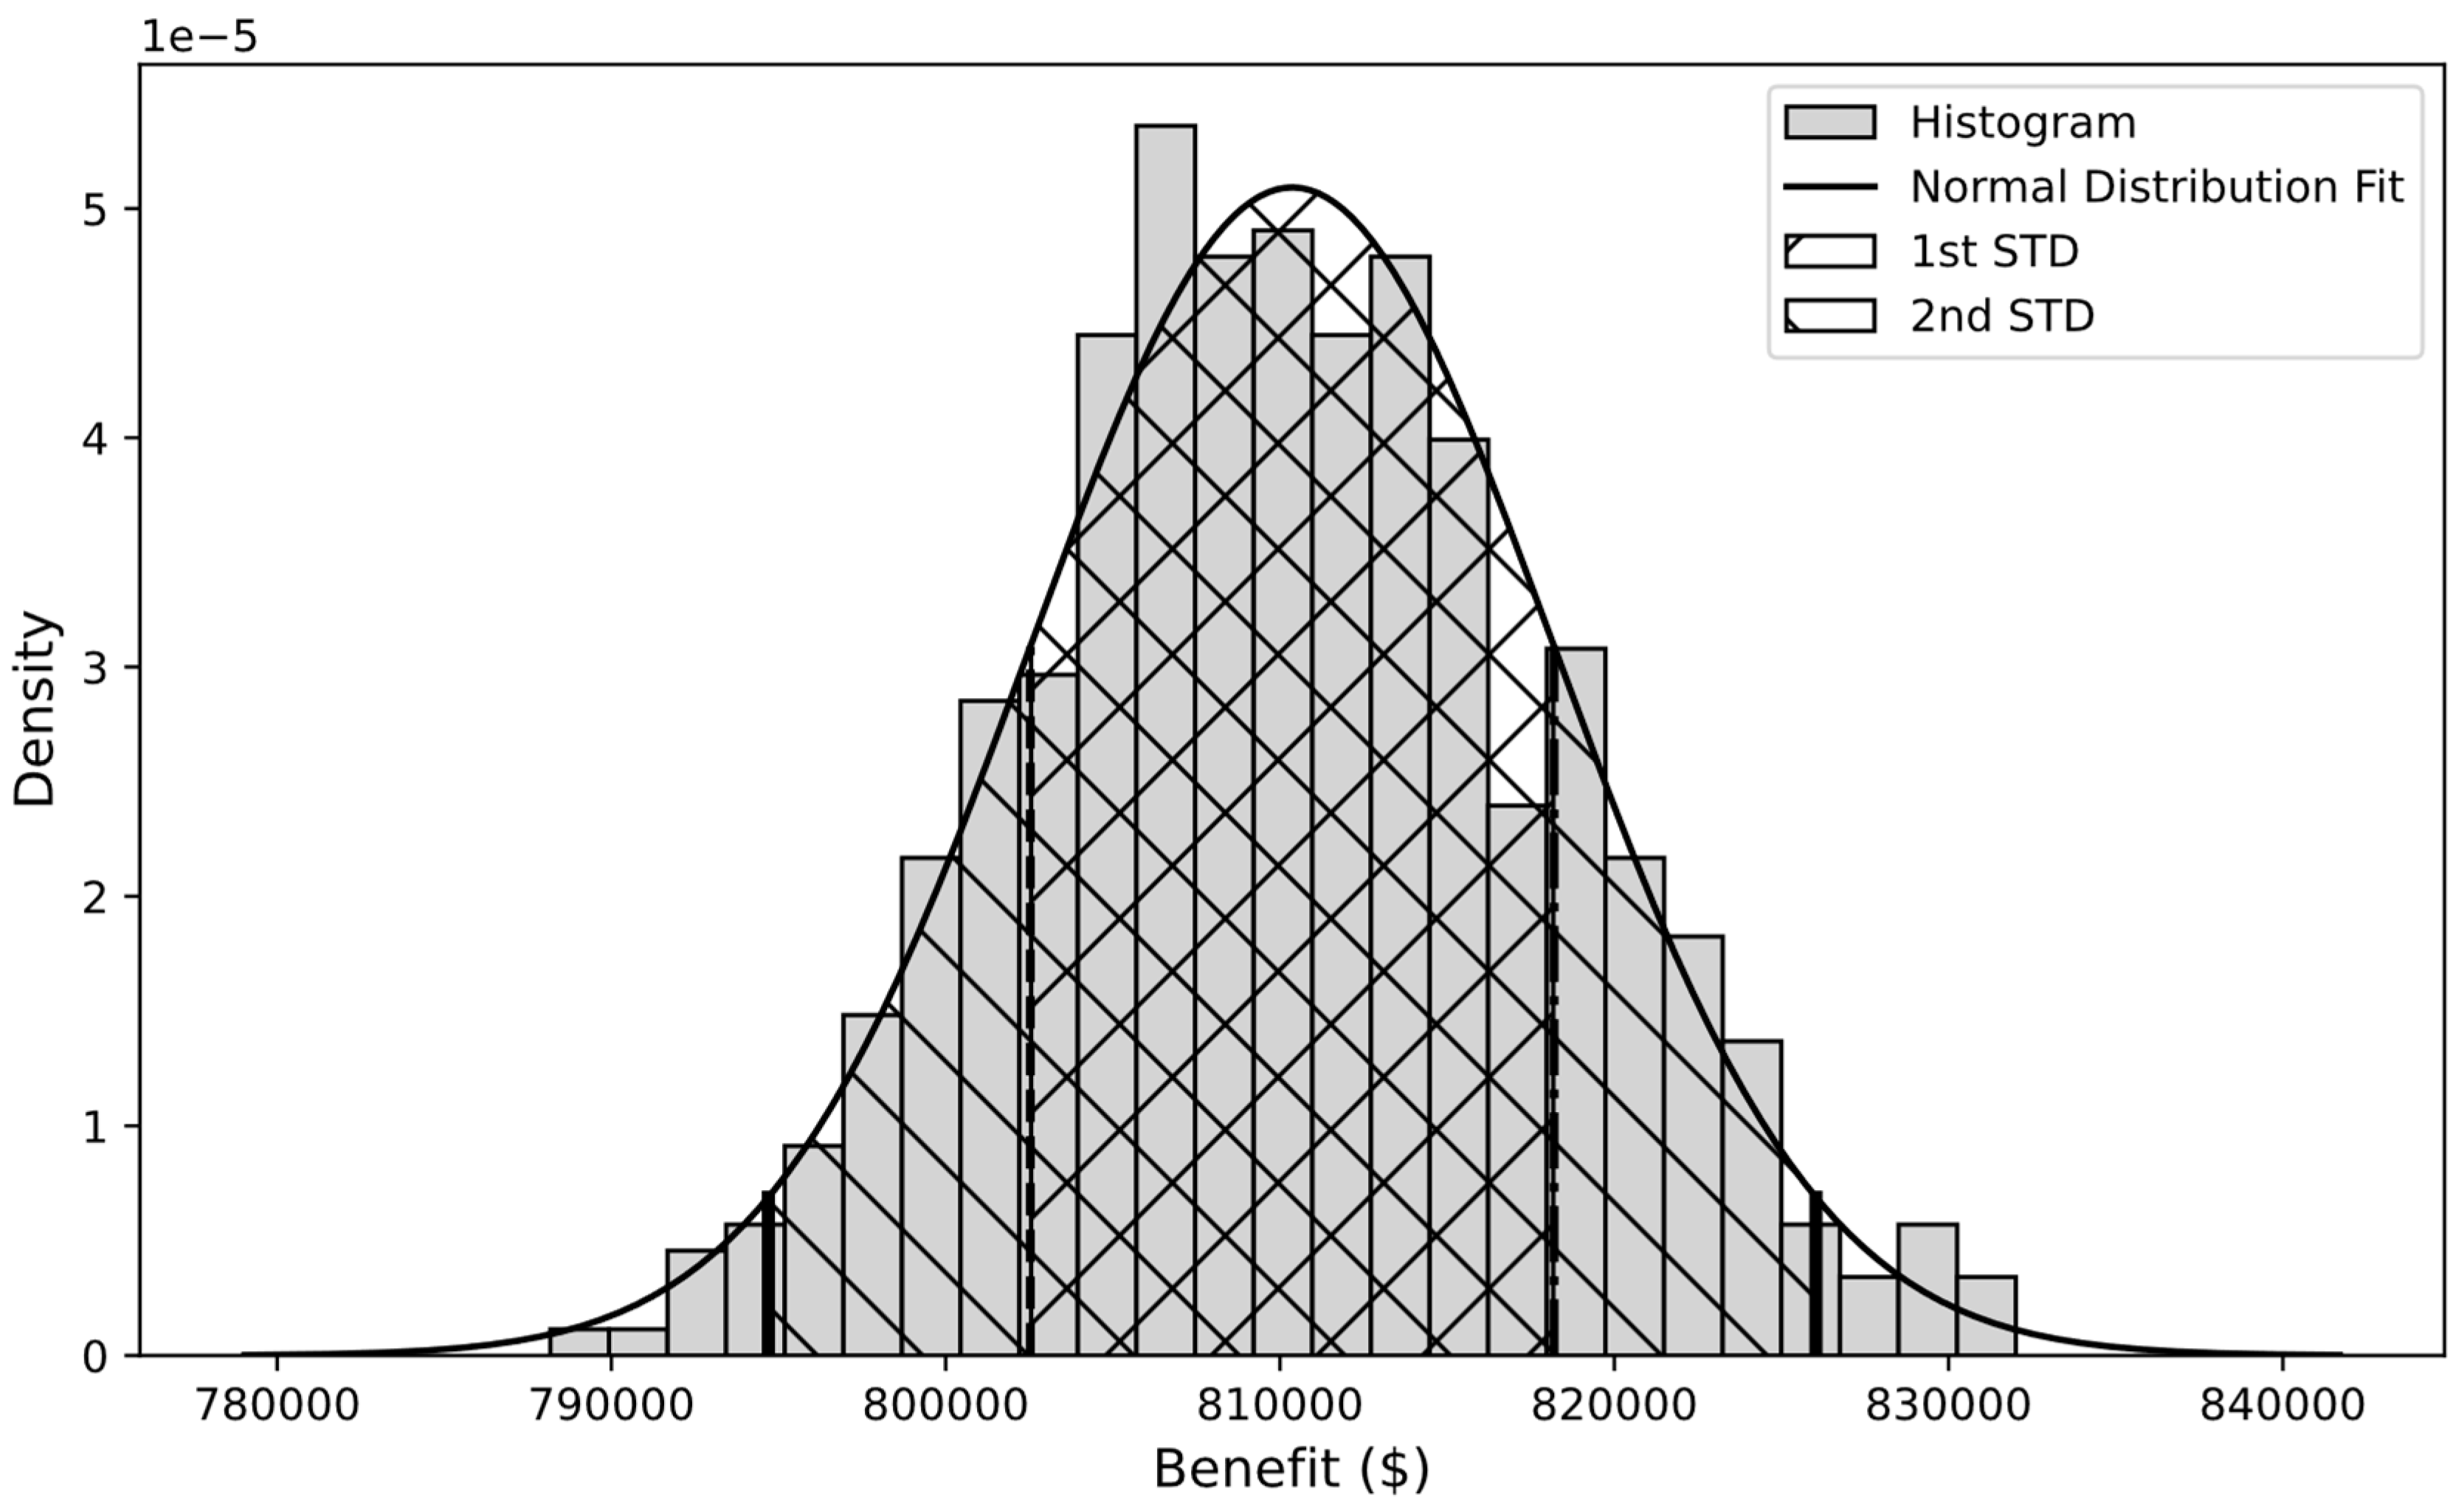

Table 1.
The Quantity values used in this study.
|
PV module ($/W) 0.035 |
Inverter ($/W) 0.04 |
Equipment ($/W) 0.18 |
| Overhead ($/W) | O&M ($/kW) | Transformer ($) |
| 0.1 | 15 | 150,000 |
| Energy cost ($/kWh) | Power cost ($/kW) | Tax credit (%) |
| 0.025 | 22 | 30 |
| Initial battery ($/kWh) | Replacement battery ($/kWh) | Project lifetime |
| 150 | 100 | 20 years |
| Labor ($/W) | Discount rate | Battery roundtrip efficiency |
| 0.1 | 0.08 | 0.9025 |
| Inverter coefficient | Battery efficiency | Battery utilization |
| 1.2 | 0.95 | 0.7 |
Table 2.
KS statistic test results for the fitted PDFs for PV=2000 kW and various batteries.
| Lognormal | Gamma | Beta | ||||
| Battery | KS_statistic | P-value | KS_statistic | P-value | KS_statistic | P-value |
| 2000 | 0.041089 | 0.0480 | 0.031794 | 0.65124 | 0.08 | 0.005355 |
| 2500 | 0.03537 | 0.12579 | 0.029497 | 0.55618 | 0.11 | 0.027578 |
| 3000 | 0.040364 | 0.15470 | 0.026193 | 0.56416 | 0.09 | 0.005044 |
| 3500 | 0.026193 | 0.43233 | 0.053331 | 0.42345 | 0.12 | 0.04289 |
| 4000 | 0.062428 | 0.037 | 0.027589 | 0.65164 | 0.16 | 0.01455 |
| 4500 | 0.039343 | 0.06544 | 0.03461 | 0.32136 | 0.13 | 0.004353 |
| 5000 | 0.046593 | 0.01660 | 0.030778 | 0.32103 | 0.14 | 0.000539 |
| 5500 | 0.051666 | 0.00554 | 0.062428 | 0.27564 | 0.15 | 0.000127 |
| 6000 | 0.054413 | 0.00292 | 0.034076 | 0.24565 | 0.25 | 5.58E-05 |
Table 3.
Optimal battery sizes for PV-battery systems to flatten 95% of daily peak demands.
| PV (kW) | 500 | 1000 | 1200 | 1500 | 2000 | 2500 | 3000 | 3500 | 4000 |
| Battery (kW) | NAN | NAN | 9200 | 4400 | 4000 | 3800 | 3600 | 3400 | 3300 |
Table 4.
Economic Analysis of Optimal PV-Battery System (PV=2000 kW, Battery=4000 kWh).
| Before PV-battery | PV-only | After PV-battery | |
| Equipment cost ($) | 0 | 1,638,688 | 2,015,246 |
| Energy Cost ($) | 3,788,907 | 3,036,927 | 3,023,569 |
| Peak demand charge ($) | 6,913,926 | 6,472,805 | 4,901,679 |
| Benefit ($) | 0 | -445,587 | 812,648 |
Disclaimer/Publisher’s Note: The statements, opinions and data contained in all publications are solely those of the individual author(s) and contributor(s) and not of MDPI and/or the editor(s). MDPI and/or the editor(s) disclaim responsibility for any injury to people or property resulting from any ideas, methods, instructions or products referred to in the content. |
© 2024 by the authors. Licensee MDPI, Basel, Switzerland. This article is an open access article distributed under the terms and conditions of the Creative Commons Attribution (CC BY) license (http://creativecommons.org/licenses/by/4.0/).
Copyright: This open access article is published under a Creative Commons CC BY 4.0 license, which permit the free download, distribution, and reuse, provided that the author and preprint are cited in any reuse.


