
Submitted:
23 August 2023
Posted:
24 August 2023
You are already at the latest version
Abstract
The smart management of water resources is an increasingly important topic in today's society. In this context, the paradigm of Smart Water Grids (SWGs) aims at a constant monitoring through a network of smart nodes deployed over the water distribution infrastructure. In such a way, a continuous assessment of water quality and state of health of the pipeline infrastructure can be achieved, allowing an early detection of leaks and water contamination. Acoustic wave-based technology has arisen as a viable communication technique among the nodes of the network. Such technology can be suitable to replace traditional wireless networks in SWGs, as the acoustic channel is intrinsically embedded in the water supply network. However, the fluid-filled pipe is one of the most challenging media to be employed for data communication. This paper aims at reviewing those works dealing with acoustic-based communication networks in real large-scale urban water supply networks. An overview on the characteristics, trends and design challenges of existing works is provided as a guideline for future research.
Keywords:
Acoustic wave communication
; channel characterization
; data transmission
; underwater communication
; urban water supply system
; guided wave propagation
1. Introduction
In recent years, the paradigm of Smart Water Grids (SWGs) has arisen, in an attempt to improve the management of water resources through constant monitoring [1,2,3,4,5]. Such paradigm is enabled by the Internet of Things (IoT) technologies, which allow for network of smart nodes, deployed over an Urban Water Supply Network (UWSN), to continuously acquire information on the state of the UWSN. The measured data is then typically gathered on a cloud server, where signal elaboration and visualization is performed. Measured information include but are not limited to pressure, temperature, flow, pH, turbidity. Such quantities can be used to assess water quality [6,7], detect and locate leaks [3,8] and monitor the health state of the structure in general [9,10]. Data transfer among the nodes of the Water Sensor Network (WSN) relies on radio-based communication in the vast majority of cases. However, other types of physical signals, such as optic and acoustic, are increasingly used in all those instances where traditional wired or wireless infrastructure is unavailable or ineffective. In those cases the information can be conveyed through the water distribution pipeline instead of the radio channel.
The underwater communication channel has proven to be very challenging for the development of communication systems based on such technologies. For instance, data exchange based on optic signals in underwater environments is vulnerable to absorption, scattering and dispersion, besides being affected by the water turbidity [11]. Nevertheless, one technology has emerged in the underwater communication field, which is the one based on acoustic waves. Such technology has become very popular due to its lower absorption, allowing for long communication range.
In recent years, the number of works investigating acoustic communication technology in fluid-filled pipelines has constantly increased [12,13,14,15,16,17,18,19,20,21], with applications to industrial communication [22,23], drilling applications [24,25], and offshore oil and gas extraction [11,26,27]. The common denominator of these different contexts is the existence of a fluid-filled pipeline which can act as a guide for the acoustic signals that carry the information. Existing research has highlighted several challenges of the use of acoustic waves to transmit data in water pipelines but a literature review on this subject is still missing.
The present work provides a survey of research papers investigating the data transmission in water pipes through acoustic waves, targeting a real large-scale UWSS. To this purpose, possible applications and communication channel parameters have been investigated referring to standard radio-based SWGs, with the aim of replacing the radio communication among nodes in a SWG with acoustic one. The goal of this work is to underline the main challenges and suggest future developments on SWGs based on in-pipe acoustic communication. The reminder of the paper is organized as follows: in Section 2 a brief review of SWGs based on traditional WSNs is reported to provide the reader with some background on the topic. Then, in Section 3, the SWG architecture based on local acoustic communication among nodes is introduced. Existing works dealing with acoustic communication in water pipes are briefly reviewed with a strong emphasis on those targeting real, large-scale UWSNs. A detailed comparison on different aspects of these works is provided in Section 4, focusing on the channel characterization, noise characterization and communication layer design. Concluding remarks are drawn in Section 5.
2. Review of SWG Based on Standard Radio Communication
As was pointed out in the introduction to this paper, several works proposed the integration of IoT in water supply networks with the purpose for improving water management, for detecting and localizing leaks, and for assessing water quality thoroughly.
The outlook presented in what follows aims at providing the reader with an overview of the state-of-the-art systems based on traditional wireless communication networks, such as GPRS and WiFi, for the monitoring of water supply networks. It is intended to provide some details regarding the possible applications, the sensors exploited, and the characteristics of the wireless communication channel. More exhaustive reviews on such topics can be found in the literature [2,4,6,28,29,30,31].
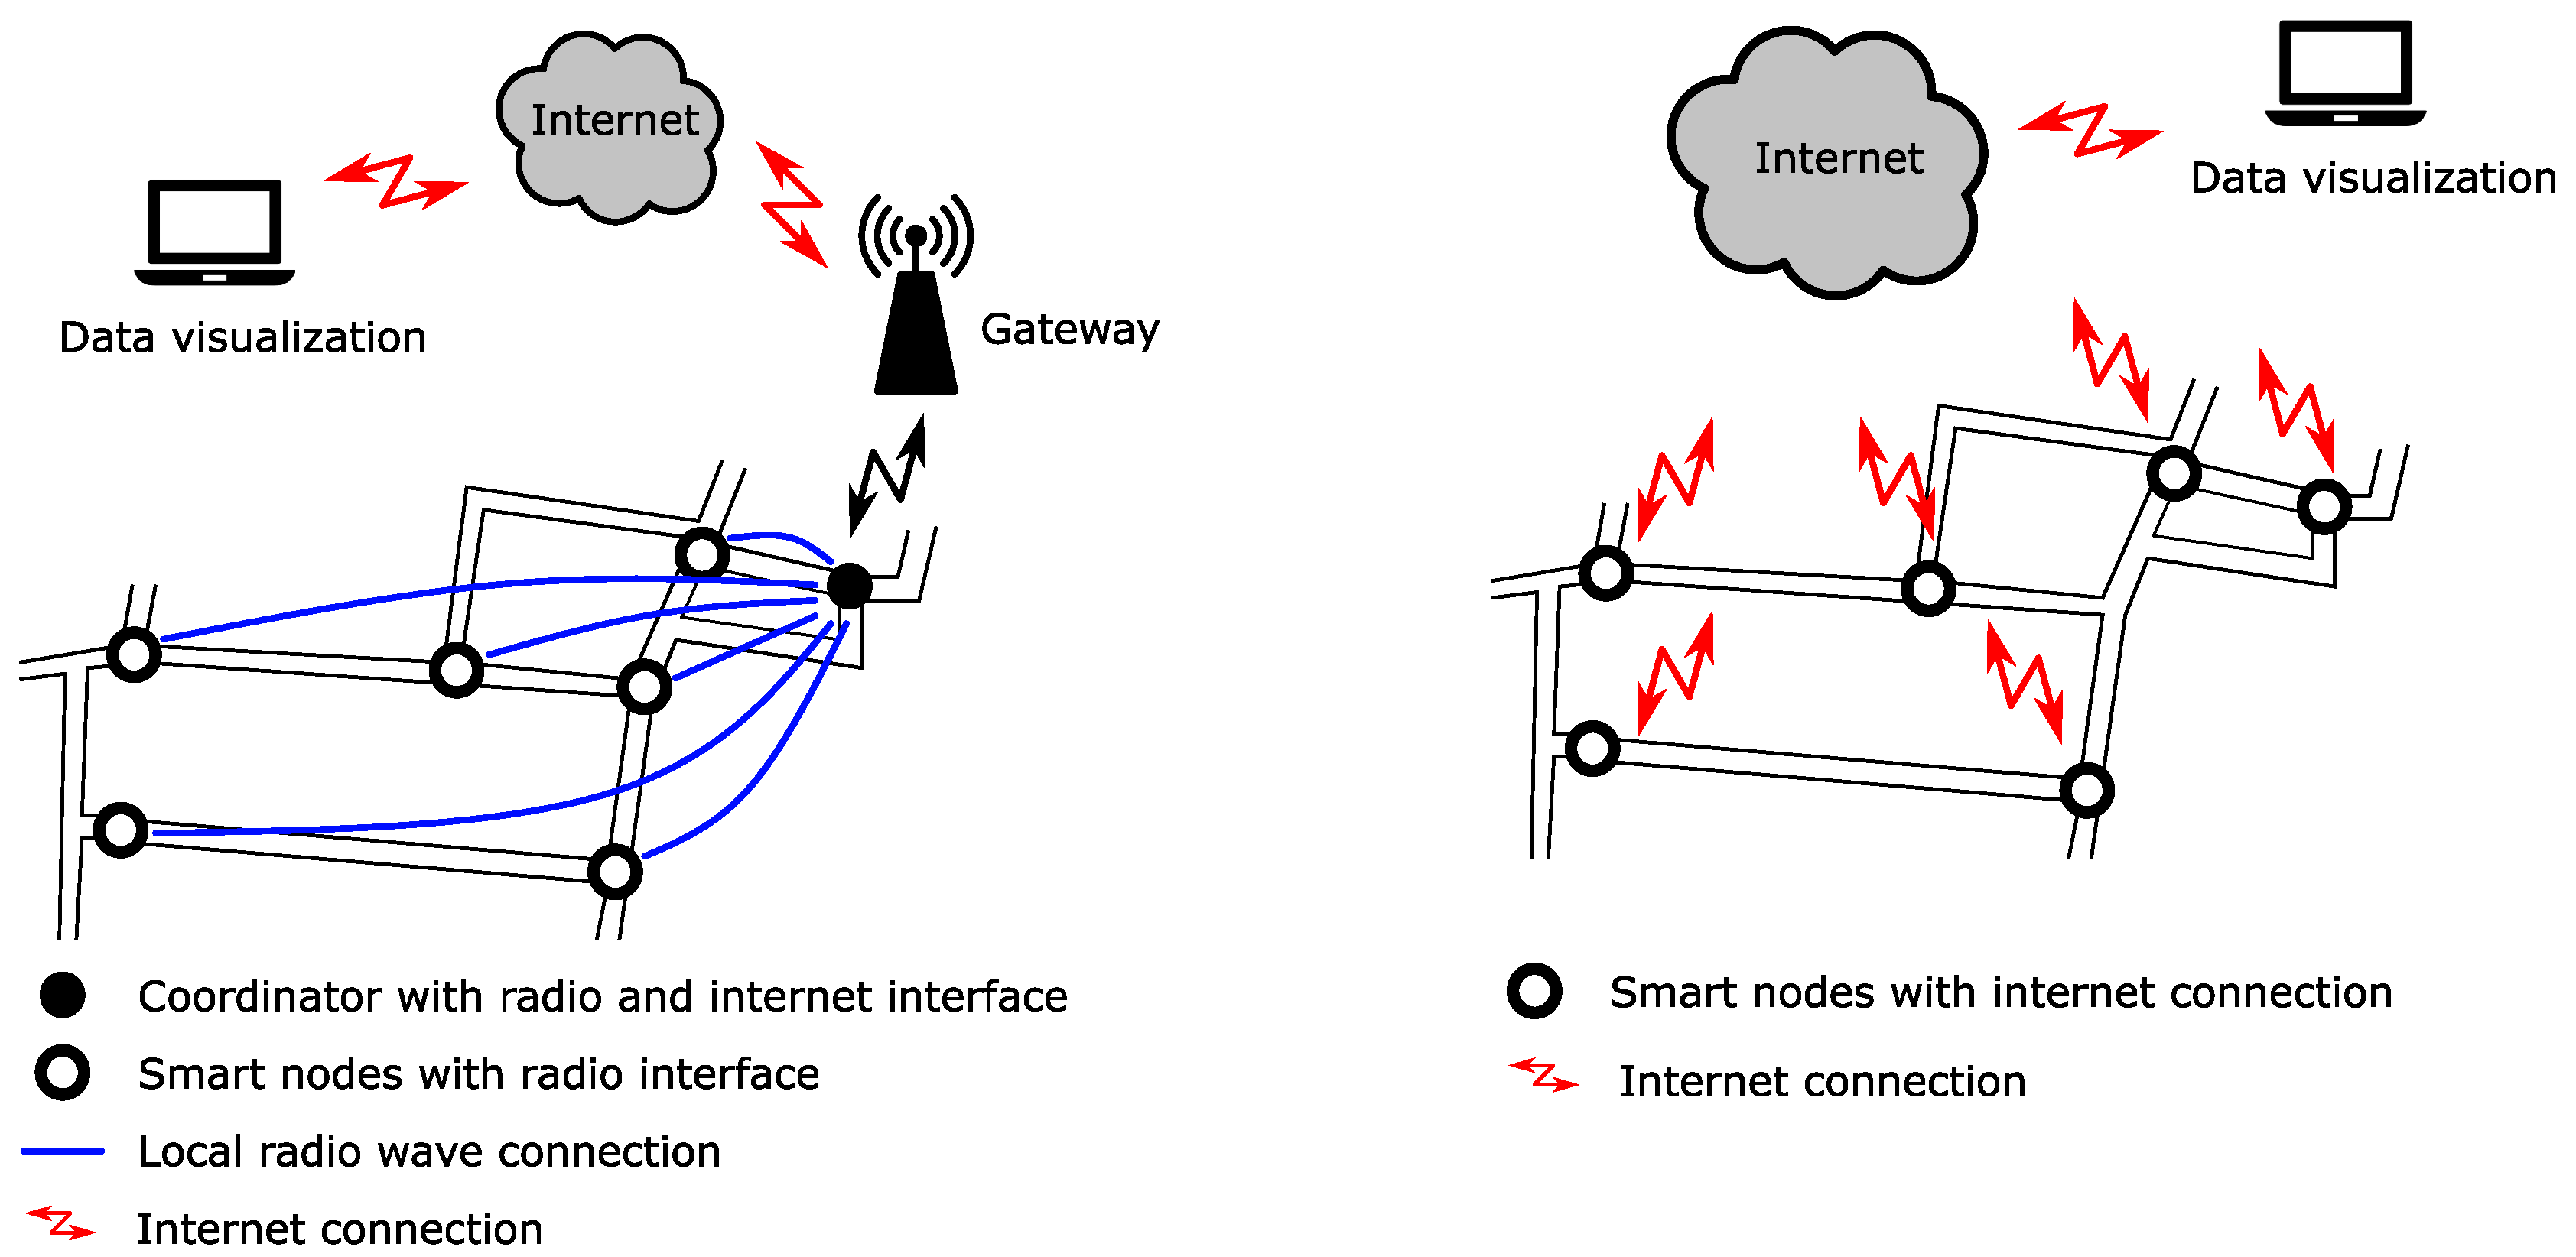
A typical case scenario is that shown in Figure 1, which depicts the architecture of a SWQ for UWSN. The hydraulic network comprises the pipelines themselves, reservoirs, air valves, pumping stations, hydrants attacks, etc. The topology of such hydraulic networks is rather complex, with bifurcations, loops, dead pipes, and it is characterized by a significant geographical extension of tens of squared km in case of urban context. The monitoring nodes are typically placed in key points of the water supply network, e.g., close to reservoirs, or exploit the existing access points, such as the fire hydrants. Therefore, in most of the applications, the monitoring nodes are fixed in pre-determined positions. Besides this solution, also mobile nodes have been designed, such as those in [32], in which the monitoring units flow into the pipe and can anchor itself in a predetermined location by means of mechanical arms.
Regarding the scenarios depicted in Figure 1, each of the monitoring nodes can be either provided with Internet connection (see Figure 1 on the right), e.g., using an on-board GPRS modem, or not (see Figure 1 on the left). The former does not require practitioners to set up a local wireless network, and it is mostly suitable for the monitoring of urban area with a large geographical extension. On the contrary, the latter requires the use of a gateway as interface between the local area network and the Internet, and it may be more convenient than the former case in term of costs for small networks. The cloud server typically comprises a back-end, which includes a database to store the collected data and some computational module to extrapolate further information, and a front-end, which is mainly responsible for visualizing data to UWSS operators.
Figure 1.
Radio-based architectures.
Depending on the target application, previous works can be classified as designed for water quality, for monitoring the hydraulic network itself, e.g., leak detection and localization, and for both water quality and hydraulic assessment. In Table 1, the main characteristics of existing SWGs are reported, including which sensors have been exploited, the radio protocol, and the deployed location.
2.1. Water Quality Assessment
Water quality assessment deals with the monitoring of physical, chemical, and biological parameters of the supplied water and their compliance with the limits imposed by national regulations. Amongst the several parameters which are required to be monitored, turbidity is a measure of suspended organic and non-organic matter. A high turbidity level causes water to seem dirty, damage the fixtures and may prevent water treatments from being effective. A pH level lower than 6.5 is an indicator of possible lead or iron contamination from the aquifer, the plumbing fixtures and the pipes, resulting in a soft and corrosive water. In the case of conductivity, this parameter measures the concentration of ions. High conductivity can be caused by natural sources, e.g., minerals and rocks, or by anthropogenic ones, including industrial activity and run-off from roads. The Oxidation Reduction Potential (ORP) can be exploited to classify substances as oxidizing or reducing agent, depending on whether the substance is lacking or it has extra electrons.
Water quality may be affected due to poor water treatments or to the presence of unwanted contaminants, leading to health issues for the final consumers, bad water taste, and corrosion of the pipelines. For all these reasons, a periodic monitoring is scheduled by water supply companies in accordance with government regulations. It consists of collecting water samples and having them analyzed by a certified laboratory. On the contrary, a continuous water quality monitoring, which would assess the presence of contaminates in advance, is typically not performed. Therefore, several attempts have been reported with regard to a distributed and continuous water quality monitoring through wireless connected sensors. In [38], an on-line water quality system is proposed, in which water flow, pH, conductivity, temperature and ORP are monitored and data transmitted by means of a XBee module, allowing for a 20 m distance communication with the base station. The monitoring unit is equipped with a buzzer which is activated when the measured parameters indicate a poor water quality. Similarly, the monitoring unit proposed in [45] exploited a Wi-Fi module to transmit the data collected, and it was also provided with a motion sensor to detect possible hackings. The experiments were carried out in the laboratory. A real time water quality system for smart cities was also designed in [46], where data from pH, turbidity, dissolved oxygen, and temperature sensors were collected and transmitted over a 1.5 km Lo-Ra link. A thorough literature and market research were carried out in [40] to identify which low cost sensors can be used to monitor the water quality reliably. Based on the selected sensors, an array was developed along with several micro-systems for analog signal conditioning, processing, logging, and remote visualization of collected data. The output of each on-board sensor is sampled every 5 s, and later transmitted over a Zigbee link. The same wireless protocol was also exploited in [47], where two nodes were deployed to assess water quality along pipes. Each node was equipped with pH, turbidity, conductivity, temperature and ORP sensors. A contamination detection algorithm based on fuzzy logic was implemented on the node itself, allowing the node to shut off a solenoid valve to block the water flow through the pipeline whenever a contamination is detected. The integration of an existing remote controlling system with IoT technology was proposed in [48], in which temperature, flow and color sensor are connected to an Arduino node, which is interfaced with the server through a GPRS module. The authors also designed a mobile platform to facilitate the operators not in the control room to access the collected data.
2.2. Monitoring and Optimization of Pipeline Network
Besides water quality assessment, a continuous monitoring of the state-of-health of pipeline network is beneficial as well, as it can detect early failures, i.e., leaks, or helping in optimizing the water distribution across several reservoirs. Although the architecture of proposed systems is rather similar to that of systems for water quality, the exploited sensors and algorithms are different. Pressure, water level in tanks, water flow, and the in-pipe acoustic noise can be indeed exploited to optimize the pipeline network management.
A small-case spin-off is the smart water metering for domestic applications. The related works were found to be effective in estimating the current and accumulated water consumption, in detecting anomalous water consumption [39], and in raising awareness among final users about water waste [34,49]. Although these works have a positive social impact, they were deployed in domestic buildings, and miss some challenges of a water supply network.
Targeting to optimize the water distribution among storage reservoirs, [35] deployed five nodes to monitor water level in tanks, and to open or to close valves remotely. The proposed wireless network was based on the Lo-Ra protocol, which was combined with the GSM network to increase the overall reliability. Similarly, [44] exploited ultrasound based sensor level to optimize the water distribution across five overhead tanks and as many ground level reservoirs. The developed sensors level were found to have a 1.5 % accuracy over a 10 m full range, and a sub-GHz network allows one to collect data each minute. Some nodes were provided with relaying capability, resulting in a reliable data transfer even when a direct connection with the gateway results in a low Received Signal Strength Indicator (RSSI).
To avoid the use of flow meters, the Demand Reverse Deduction (DRD) technology was assessed in [36] with the purpose of estimating the water demand. To serve this scope, only pressure sensors were exploited, whose output values were collected, transmitted over Zigbee, and then fed to a purely hydraulic model. The experimental case study assessed the proposed model especially when the water demand was low. Hydraulic models can be exploited also to assist a proactive management of the water supply network. However, to serve this scope, the model input data should be continuously up to date to drive simulations representative of the actual conditions of the network [41].
Another possible application of SWGs is the detection and localization of pipe leaks, with several investigations carried out on this topic in the last decades. A multi-parameter decision system based on artificial neural networks and fuzzy logic was proposed in [37] to detect and localize leaks. More precisely, the risk of failure for each segment of the pipe network can be estimated based on historical data by a neuro-fuzzy system. Data regarding pressure, the in-pipe acoustic noise and flow rate are collected by purposely designed nodes, which are provided with 433 MHz radio transceivers.
The WAIter tool was instead proposed in [42], which is based on IoT devices collecting pressure measurements every 11 minutes. Such data are sent via Sigfox to a cloud server, in which they are stored in a database. A failure detection algorithm is there implemented using a decision tree and it is able to discern between a sensor failure, supply cut off, leaks downstream from the sensor, and leaks upstream from the sensor. In [43], 305 acoustic loggers, built up using magnetically clipped accelerometers, have been deployed to measure the in-pipe noise. As a result of a 2 years long measurement campaign in the Adelaide city center, the system was able to detect leaks before break, being successful on 55 % of the cases. Classification between circumferential and longitudinal cracks was achieved on the basis of the noise signature and how it changes over time.
2.3. Hydraulic and Water Quality Monitoring
A few works have proposed a system which includes both water quality and pipeline network on-line monitoring. A first attempt made with this regard is the PIPENET project [50] which aims at detecting, localizing and quantifying burst and leaks and other anomalies in water pipelines. The deployed monitoring units were divided into three clusters: the first including pressure and pH sensors, the second pressure only ones, and the third was provided with level meters to monitor reservoirs levels. Preliminary deployment in lab environment shows promising results, however, during the in-field tests in Boston several critical issues were found. Indeed, as it was the case of a real large-scale deployment, harsh environment, data transfer loss and time synchronization amongst nodes were identified as critical aspects to develop further.
More recently, the WaterWise system proposed in [33] combines the assessment of water quality with leak detection using a in-pipe hydrophone. The monitoring unit was designed as a multi-probe installed on the pipe through a gate valve. It included pressure, hydrophone, flow, pH, conductivity, temperature and ORP sensors, whose data are sent every 5 minutes through the 3G network. Amongst the decision support scenarios WaterWise can cope with, the authors emphasized the detection and resolve of a leak and the optimization of the pump scheduling.
2.4. Wireless Communication Parameters
On the basis of the works previously reviewed, some common indicators were collected. The aim is to highlight the characteristic of a wireless link suitable for SWGs at system level, independently on the adopted protocol. They include the maximum distance between two wireless-connected nodes, which can either that between two monitoring nodes or a node and the gateway, depending on which is higher, and how often data are transmitted over the wireless channel. The former, i.e., the distance, is reported in Figure 2, in which circle markers refer to works in which the experimental validation was carried out in a laboratory, and diamond ones to those deployed in a real case pipeline. What stands out in Figure 2 is that in practical water supply networks the distance between two nodes was ranging from about 70 m up to 2 km. As far as the time between two data transmissions is concerned, which is named report time in Figure 3, it is worth noting that for laboratory-assessed works (circle markers), the report time is not longer than 1 min, while it can span up to 20 h in a real pipeline scenario (diamond markers).
3. Acoustic Based Communication
As was presented in the previous Sect., SWGs deal with the management of water distribution networks [1]. As far as the communication network of such SWGs is concerned, it results from previous reviews [2,3,4,5] that the vast majority of the cases employ radio wave communication for information transfer between sensor nodes of the network. However, the review [1], among the various wireless techniques, also considered acoustic wave-based communication as a possible way to transfer information, since it is effectively a wireless communication technique.
The reason for preferring underwater communication to terrestrial one is related to the fact that in urban scenarios the sensor nodes are placed underground, close to the water pipeline. In such scenarios the radio technology suffers from the radio penetration issue [1], which requires that a portion of the sensor node be placed near ground, making the node less compact. Acoustic waves instead, lend themselves well since they travel over the fluid-filled pipe, conveying information among various sensor nodes. Moreover, the GSM network might be unavailable in remote areas, making communication directly through the pipe the best option. Lastly, even where GSM connectivity is available, some mis-operations of the GSM network might occur, leading to a temporary unsupervised operation of the UWSN. On the contrary, acoustic-based communication network relies on a physical channel which is not affected by service outage intrinsically, as the water flow must always be guaranteed.
Acoustic wave-based communication allows for long propagation distance in underwater environment, as compared to other techniques, due to the low sound absorption underwater. In order to cover long propagation distances, the transmission frequency must be low, hence acoustical communications are limited to bandwidths that are lower with respect to those used for terrestrial radio communications. Although [1], among others, states that distances of the order of km can be reached with acoustical communication, this is mainly true for the open sea underwater case, where acoustic transducers can have large size and high power consumption. In the urban area instead, mounting spaces are limited by the size of the manholes, hence acoustic transducers cannot be so large. Also the power consumption must be reduced, aiming to move towards a system where the sensor nodes are supplied by batteries or by recovering energy from the environment. Moreover, it is anticipated that sound attenuation for the guided wave propagation is much larger than the one in the free-space case. The combination of these factors limits the communication distances to few tens of meters.
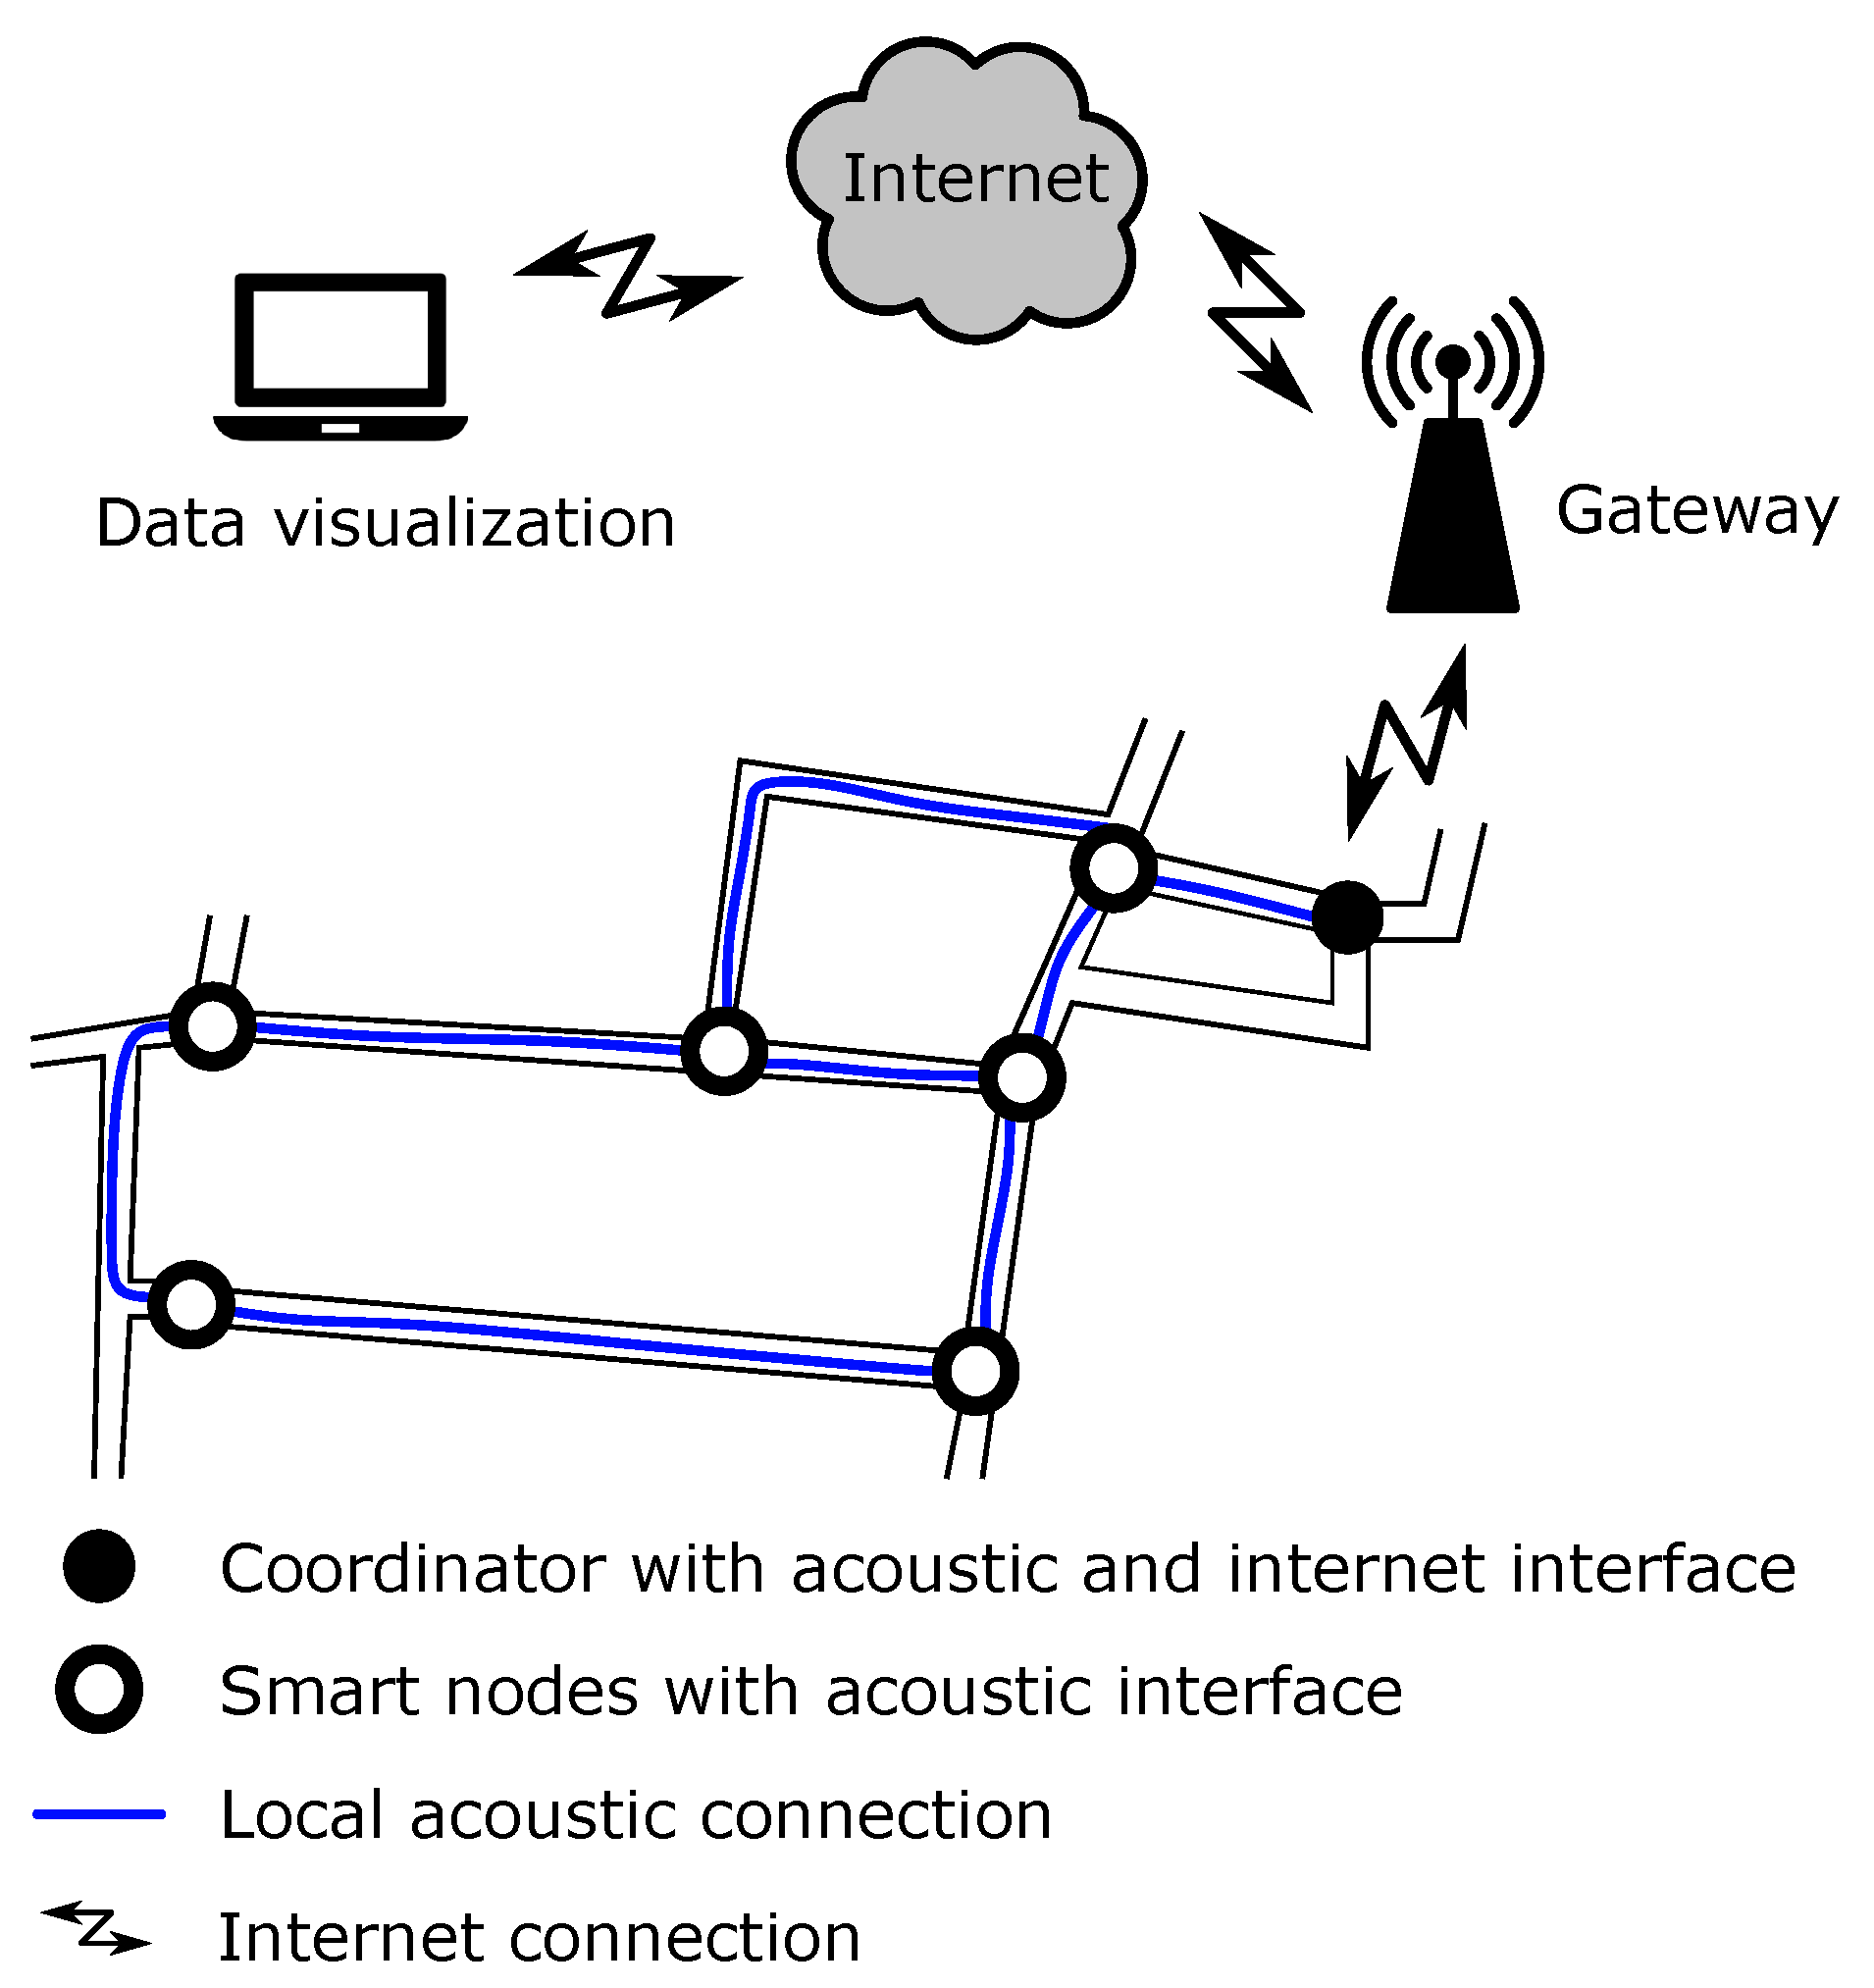
According to what presented so far, a schematic description of an SWG with acoustic wave-based communication can be seen in Figure 4. It is important to notice that the acoustic communication channel is intrinsically meshed, which makes it more robust since multiple paths exist between two sensor nodes. As shown, the same concept as in traditional SWGs shown in Figure 1 on the left can be applied, where only the local connections between sensor nodes are replaced by acoustical communication. A few nodes with internet access, named coordinators, are needed in order to convey the gathered information to the common server, where the data processing takes place. It must be stressed that even though the communication medium has changed, the remainder of the SWG, including the sensed quantities and signal processing algorithms discussed in Section 2 can remain the same.
In order to enable the data transfer through the pipeline network itself, a communication system has to be set up. The propagation medium is the ensemble water-pipe-soil, although it is desirable that most of the energy propagates inside the fluid in order to yield a longer reach [13]. The traditional sensor nodes have to be altered so that they are able to generate and sense acoustic waves. This is achieved by equipping them with electroacoustical transducers, the needed electronic interface circuitry, and a proper communication layer implemented on the controller. Conversely to the use of radio wave-based communication, where standard solutions are readily available as commercial modules, nodes with acoustic transmission and reception capabilities must be custom built, since the specifications in terms of pipeline geometries, available mounting space, and maximum power consumption are heavily case-dependent.
Figure 4.
Schematic representation of an SWG with communication based on the propagation of acoustic waves.
Figure 4.
Schematic representation of an SWG with communication based on the propagation of acoustic waves.
3.1. Existing Works Based on Guided Acoustic Communication
Works dealing with underwater WSNs based on acoustic communication are mainly concerned with the open sea case [51,52,53], while the number of works meant for urban applications in much more limited. However, in the last years, this topic has acquired more and more importance. Although SWGs employing acoustical communication have not yet been reported, several works have started to lay the foundations for such a wireless network. Among these, [14] was one of the first to investigate the data transmission through acoustic waves in water pipelines. Its study provided many useful insights on the dispersive nature of the channel and highlighted its low-pass frequency response. The work was mainly theoretical and it investigated the effect of various physical parameters of the system on the sound propagation. After that, various research works presented point-to-point communication systems, confirming the feasibility of the data transmission. Chakraborty et al. [23] reported a system for data transmission along a cylindrical pipe using ultrasonic waves. The system employed a chirp On Off Keying (OOK) modulation scheme with carrier frequency of 455 kHz. Experimental tests were carried out across a distance of 4.8 m over a pipe both in air and in water. Jing et al. [12] presented the characterization of pipelines as acoustic waveguides for data transmission. The characterization was performed over a frequency band of 1-50 kHz by using a mode-based model. However, experimental measurements on a 5.8 m long water filled pipe did not show a good agreement with the analytical model. The design of a stress wave communication system for underwater applications was reported in [11]. In such a case, the channel was characterized in the frequency band from 20 kHz to 60 kHz and PSK modulation was employed with a 40 kHz carrier frequency. Experimental tests were carried out on a steel pipe with length 3 m both in air and in water. Farai et al. [18] presented a low-frequency acoustic system for digital communication along exposed and buried pipes. The employed frequencies were sub kHz and the work showed that analytical models do not accurately predict the acoustic signal attenuation. Measurement results on a test rig were used to estimate the maximum communication range. The test setup made use of a 40 m long polyethylene pipe and it included also a vibration motor to generate the sound waves on the pipe wall and accelerometers to sense said waves. Experimentally measured acoustic attenuation over a distance of 6 m yielded estimations of maximum distance of 18 m and 5 m for exposed and buried pipes, respectively. The works presented so far have in common the fact that experimental validation was performed in ad-hoc built test rigs, with communication distance below 10 m. This is in contrast with the nature of real, large-scale water distribution networks, where the distance between adjacent access points can be of several 10 s of m. The only reported works dealing with acoustic communication in real, large-scale urban water distribution networks are Joseph et al. [13] and Fishta et al. [21]. These works will be presented briefly at first and then, in the following section, a comparative study in the communication system implementation will be provided.
3.2. Joseph et al. [13]
This work was the first to report the use of a large-scale water distribution network for data transmission through acoustical waves. An iron buried pipe with a length of 110 m was considered as data transmission channel. The pipe was divided in two sections with the transmitter placed in the middle and the receivers being placed at distances of 40 m and 70 m. The test structure is schematically shown in Figure 5. Transducers were of the piezoelectric type and they were mounted externally to the pipe wall. Such transducers were used both for the signal generation and for the signal reception. Channel characterization was performed by applying a chirp signal with 120 s duration and by observing the spectrum of the received signal. Such spectrum was compared to the one in absence of signal, in order to identify a suitable transmission band with large Signal-to-Noise Ratio (SNR). In particular, a frequency band around 500 Hz was identified and chosen for the data transmission, where the SNR was about 4 dB. The nodes were custom and relied on the use of a microcontroller for the system management. The power consumption of the node had peaks between 330 mW and 660 mW. As far as the communication layer is concerned, tests were performed with different data modulation schemes. In particular, the basic binary digital modulations were tested with a central frequency of 500 Hz. It was found that the OOK scheme was the most effective one.
3.3. Fishta et al. [21]
A method was discussed in [21] to design the acoustic wave-based communication system, starting from the experimental characterization of the channel. The case study was a large-scale water distribution network with a ring structure providing two main propagation paths with length of 73 m and 165 m. The test structure is schematically shown in Figure 6. The transducer was of the magnetic field kind while the sensors were piezoelectric. Differently from [13], the transducers were mounted so that they are in contact with the water inside the pipes. This makes the coupling of the acoustical energy to the medium much more efficient, at equal electrical energy absorption. The channel response was measured by single tone injection from 40 Hz to 200 Hz and it was found that the channel had a low-pass behavior, with frequencies above 100 Hz heavily attenuated. In addition, even for frequencies below 100 Hz, the channel exhibited a severe frequency selectivity. A local maximum of the channel transfer function was identified at 71 Hz which was chosen as the carrier frequency for the data transmission. The nodes were custom and a microcontroller was used to govern the operation of the system. The communication layer relied on the use of a modified OOK modulation, allowing for a reliable communication of pressure, water temperature and self power consumption from the remote node.
4. Characterization and Design of Acoustic Communication Systems
The exploitation of acoustic-based communication for SWGs has been investigated in the previous Section referring to a system-level analysis. To gain insight on such a communication technology, this Sect. provides more details regarding the characterization of the acoustic channel and the corresponding design methodologies. To this purpose, a generic communication system based on guided propagation of acoustic waves is described by the block diagram in Figure 7. The central block is the communication channel, through which the information is propagated under the form of acoustic waves. At the transmission side it can be seen that the message is encoded through a certain bit sequence and modulated, from which an analog voltage results. Such voltage is conditioned before being applied to a voltage-to-pressure transducer, which translates the voltage signal into a pressure one. The pressure signal then propagates through the channel and is sensed at the receiving side by a pressure-to-voltage transducer. The resulting voltage is a distorted version of the signal generated at the transmitter side, depending on the characteristics of the channel and the added noise. Said voltage is conditioned, before being converted to digital form, and then demodulation and decoding are performed in order to reconstruct the starting message. The design of the system is strongly related to the properties of the communication system, which will be treated next.
4.1. Channel Characterization
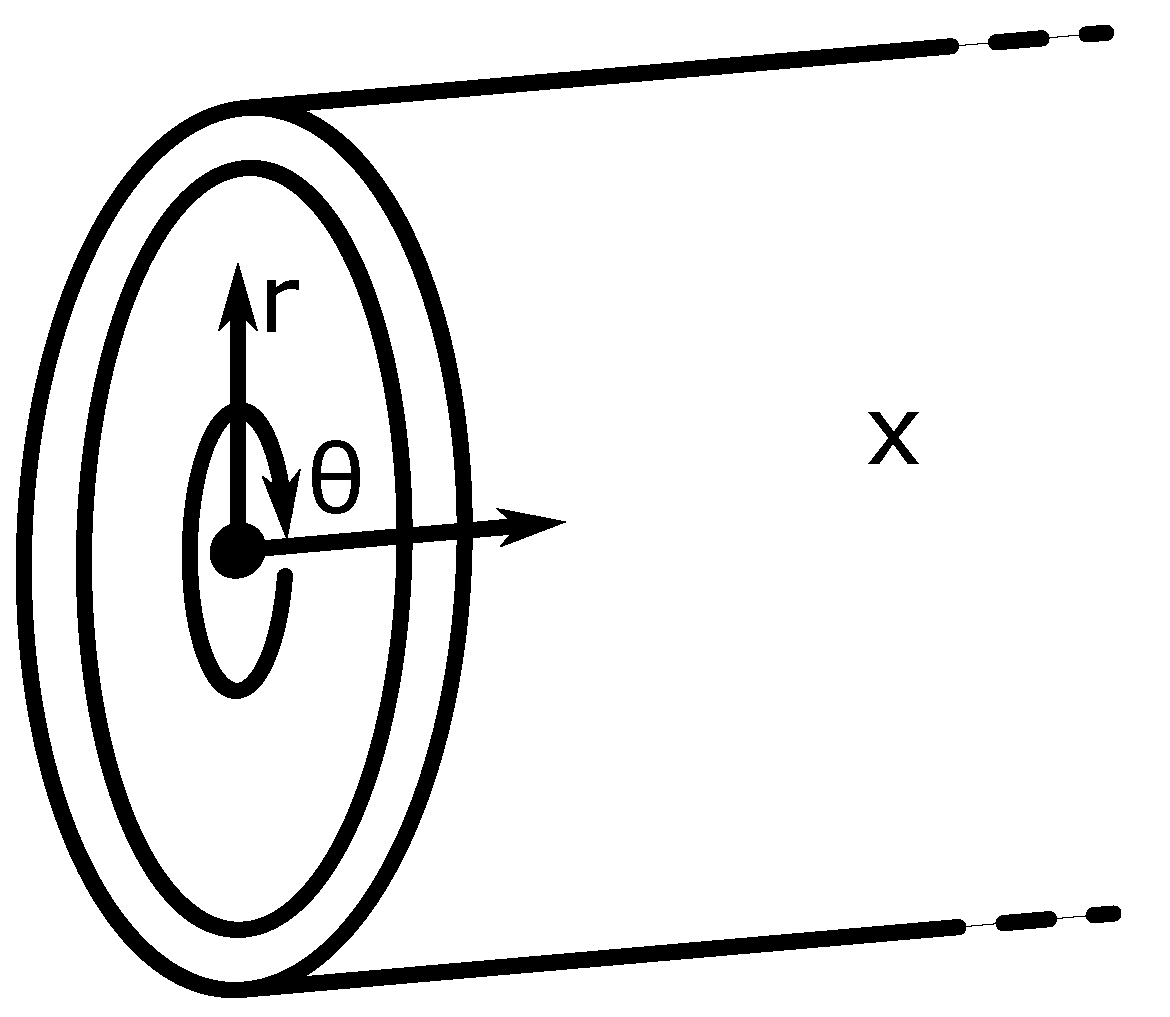
The channel characterization is required to properly design a communication system on the basis of the exploited physical channel. This step is of the utmost importance in case of water-filled pipes, as they show a severe frequency selectivity because of the meshed nature of the water pipeline network, which provides multiple paths for the signal propagation. In the water-filled pipe a guided propagation takes place, with the acoustic energy being guided from the pipe wall. Such acoustic propagation is usually expressed as a superposition of modes [12,14], similarly to what is done in the case of electromagnetic waveguides. Assuming a cylindrical pipe and the propagation direction to be aligned with the x axis, the cylindrical coordinate system shown in Figure 8 is adopted. The channel is then characterized by determining the ratio between the received pressure signal due to the application of a pressure signal . By using the classical expression for the acoustic pressure inside a cylindrical waveguide, the required transfer function is found as a superposition of modes using the Bessel functions [12], resulting in
where the modes are indicated by the integer pair . The function represents the amplitude of mode , as a function of frequency, are combinations of Bessel functions, is the modal wave number and is the exponential attenuation of the mode. A particular case that is commonly considered is that in which the pressure source is located at the center of the cross section of the waveguide. In such a case, the system has a circular symmetry, which corresponds to and the pressure transfer function becomes
The modal decomposition method is not suitable for the solution of complex acoustical problems, other than regular-shaped objects or hard-walled cavities. The reason is that when the boundary becomes irregular or elements such as branches, joints and bends are introduced, the solution of the differential equations becomes challenging, to say the least. In these cases, numerical simulation can be employed instead [54] to solve the acoustical problem.
Figure 8.
Cylindrical coordinate system used for the circular cross section duct.
In any case, when targeting real, large-scale networks, the previously presented techniques, which make use of the physical properties of the acoustical waveguide result unusable, because of the uncertainty of material properties and waveguide geometry. As an alternative, a black box modeling approach can be considered instead. Black box models ignore the internal structure of the system and the physical laws governing its operation, and rely on information gathered from experimental measurements on the system. If the considered system is linear and time-invariant it can be described by means of its impulse response in the time domain or the transfer function in the frequency domain. Black-box characterization of the channel can be performed by applying known stimuli to the channel and observing its response. Different excitations can be employed to obtain the response of the channel, such as the chirp signal [13] or the single tone excitation [55].
In [13], a linear sweep was performed from 0 to 1.2 kHz over a time interval of 120 s, in order to measure the frequency response of the channel. Referring to the schematic in Figure 5, the excitation signal was composed by the transmitting node placed in the middle and it was acquired by the two receiving nodes. Then a Power Spectral Density (PSD) transform was used to obtain the frequency content of the received signal, which was compared with the PSD of ambient noise in order to get the SNR at the two receiving locations. It was found that the signal was indistinguishable from noise over the whole frequency band, except for a narrow band of 30 Hz, centered on 500 Hz, where was measured. Such value is not very high and it can result in an unreliable communication. Indeed, for the case of OOK digital modulation, the Bit Error Rate (BER) can be expressed as
which is relatively large. It can also be noticed that the characterization procedure described in [13] does not allow one to extract the frequency response of the water-filled pipe channel. In fact, only the received signal is analyzed while the actual excitation provided to the channel is not measured.
Conversely, [21] proposed a channel characterization procedure based on the frequency response measurement performed for electronic devices [55,56]. The proposed system architecture for the channel characterization is shown in Figure 9. One key difference that can be noticed with respect to [13] is the presence of a near-side hydrophone, which allows for the frequency response estimation of the pipe channel alone, excluding the contribution of the transducers. Another difference consisted in the mounting of the transducers, which were place in direct contact with water. Such a solution allows for a better coupling between the transducers and the medium, but it also requires the transducers to properly operate under a large hydrostatic pressure, as well as an invasive mounting. Also the probing signal employed in [21] for the characterization differs from that proposed in [13]. Instead of the chirp signal, the channel is probed with single tones and the frequency response in magnitude and phase is extracted for each tested frequency point. More in detail, the characterization procedure is carried out with a frequency step = 0.5 Hz, between 40 Hz and 200 Hz. Voltages , with the index of the acquired port and m the index of the tested frequency, are acquired and digitized into the sequences , where n is the discrete-time index. The digitized signals are processed by means of the Discrete Fourier Transform (DFT) and the frequency-domain sample arrays
are obtained, with k being the discrete-frequency index and N the number of samples. For each tested frequency, only the component that has been excited by the actuator is considered, while all the other points are discarded, yielding the complex transfer function of the channel
where is the index of the excited frequency inside the DFT sequence. An example provided in Figure 10 for the particular case of shows that the received signal is much stronger than the background noise, making the characterization process very robust. The extracted frequency response can then be employed for modeling purposes in order to build a simulatable model for the channel. The comparison between the measured transfer function and a vector fitting model over the frequency band 50 Hz to 120 Hz can be seen in Figure 11.
4.2. Noise Characterization
Besides the frequency response of the channel, environmental noise that is present in the pipes is crucial for the data communication reliability, since its presence decreases the SNR. In UWSNs background noise can result from the operation of pumps, opening and closing of valves, vehicle traffic and nearby human activity. A characterization phase can be conducted in order to understand the noise levels present in the pipe. In [13], a noise measurement procedure was put in place. Acquisitions in different times of the day were transformed into the frequency domain in order to be compared among them, as well as against the useful signal. Results showed significant fluctuations during the day. It was seen that the largest noise levels were at low frequencies, below 500 Hz. Similarly, in [21] a noise measurement campaign was performed over a 24 hour interval. Measurements confirmed that the dominant noise is located at frequencies below 500 Hz. The results of the complete acquisition can be seen in Figure 12. In this case, some time intervals during the day showing increased noise levels, like between 15 and 18, were correlated with human activity nearby the pipeline, conversely from [13]. Comparing some slices of the noise spectra with the received signal during characterization, the plots in Figure 13 are achieved. By considering a communication carrier frequency of 71 Hz, which is a local maximum, and taking the loudest of the noise records, an was observed, yielding a theoretical BER
4.3. Communication Layer
From the characterization phase, several undesirable features of the communication channel result, which make the design and implementation of the communication system challenging. Among these, the frequency response of the channel is found to be highly selective, with small coherence bandwidth. This is related to the multi-path nature of the channel, which is due to a long delay spread [57]. Another challenge is represented by the background noise, which shows to be time-variant. Moreover, non observed phenomena such as the possible variation of the channel frequency response with the properties of soil, state of the pipelines etc should be investigated and taken into consideration. In [13] three digital modulation schemes were tested, namely Binary Amplitude Shift Keying (BASK), Binary Frequency Shift Keying (BFSK) and Binary Phase Shift Keying (BPSK). The amplitude modulation scheme was used jointly with a non coherent demodulation, with threshold set based on statistical analysis on the data. A data transmission success of over 70% was reported. Tests at any frequency other than 500 Hz led to the impossibility of data demodulation. In [21], the same binary digital modulation schemes were taken into consideration, and high level simulations were carried out with the help of a vector fitting model of the characterized channel. Simulation results showed that increasing the symbol time beyond the channel delay spread results in a BER decrease [57]. This, however, also results in a decreased data rate. As the symbol time duration is decreased in order to increase the data rate, the BER varies with the carrier frequency and it is higher for frequencies at which the transfer function presents deep notches. This is related to the fact that at such frequencies the SNR decreases, but also the channel frequency response is less flat when compared to the local maxima, causing more distortion. It was also seen that adding a gap after transmitting each symbol helped mitigating the Inter Symbol Interference (ISI), caused by the delayed arrivals through longer propagation paths. The BER performance was similar between BASK and BFSK modulations, where non coherent, threshold detection was employed in both cases. For the BFSK demodulation, two equal chains were needed, each centered around one of the carrier frequencies. The BPSK scheme with coherent demodulation showed better results [57]. However, the demodulation complexity is much higher with respect to the non coherent schemes and a reliable carrier recovery at such low frequencies and noisy environment is very challenging. For this reason, an OOK modulation with a time gap between symbols was implemented for the communication tests. Experimental results yielded a successful half-duplex bidirectional data communication over a 73 m section of the water distribution pipeline. However, the low coherence bandwidth of the channel limited the data rate to 2.5 bps in order to achieve a reliable communication.
5. Conclusions and Future Trends
SWGs have developed very quickly in the last years, and acoustic wave-based technology has arisen as a plausible communication technique among smart nodes deployed over an UWSN. Although SWGs based on the acoustic wave communication have not yet been reported, several works have investigated the data transmission through the water-filled pipes based on acoustic signals. This paper aims at reviewing such works in order to highlight the main design challenges and to underline future research developments. In order to motivate the use of acoustic communication, a literature survey of existing SWGs, based on traditional radio communication, was carried out. The goal was to highlight possible applications of SWGs, as well as the employed sensors and the physical characteristics of the wireless channel. It was found that SWGs employ sensors of pH, conductivity, temperature, ORP, turbidity as well as water level, flow, pressure and acoustic noise, in order to monitor the water quality, pipeline health state, or both. In these contexts, it was found that a cost-convenient communication infrastructure between nodes employs a local area network which exchanges data with the internet through a gateway. From the survey stands out that in practical water supply networks the distance between two nodes ranges from about 70 m up to 2 km. As far as the time between two data transmissions is concerned, it can span up to 20 h in a real pipeline scenario.
From the literature review of acoustic-based communication systems, it was found that the majority of considered works perform experimental verification on ad-hoc structures, over communication distances below 10 m. Since the focus of this work is on real, large-scale UWSNs, these research items have not been treated in detail but only an overview of some aspects such as the frequency band and type of transducers have been presented. The only two works providing experimental results on large-scale UWSNs were found to be [13] and [21]. The covered distance was similar in both cases, around 70 m, which is comparable with that of standard-radio SWGs employing a local wireless network. The employed frequency band was around 500 Hz in [13] while [21] used a carrier frequency of 71 Hz. Such frequencies were chosen after measurement of the signal attenuation. Another main difference was the configuration of the acoustic actuator: while in [13] the actuator was externally mounted onto the pipe wall, the actuator in [21] was mounted such that its vibrating surface was in direct contact with water. Both works performed a noise characterization campaign, finding that the background noise is dominated by the low-frequency components, below 500 Hz. Finally, also the communication layer implementation was similar with both works employing the amplitude modulation. The reason for this was that of maintaining a low complexity, in order to implement the demodulation scheme on a low-cost, low-power microcontroller. Non coherent demodulation based on threshold detection, however, needs calibration in order to make it robust with respect to noise and channel distortion.
The main design challenges observed were the severe frequency selectivity of the channel and the presence of time-varying ambient noise. The first is caused by the intrinsically meshed nature of UWSNs, which provides multiple paths for the signal to travel from the transmitter to the receiver. Such feature causes a severe limitation in the data rate when using simple digital modulations. The presence of time-varying ambient noise might cause errors in the demodulation when a simple threshold detection scheme, which needs calibration, is employed. For this reason, future research on this topic should focus on the design of more sophisticated data modulation schemes or channel equalization techniques in order to cope with channel frequency selectivity. These can already be found in the literature applied to other kind of communication systems but they have yet to be tested in large-scale UWSNs. Also, research should be performed in order to make the demodulation process robust with respect to time-varying noise, so as to increase the communication reliability. Finally, an experimental assessment of the frequency response dependence on parameters such as the topology of the network, geometry of the pipes and properties of the surrounding soil should be performed. This way, the operation of the communication system in varying conditions can be pursued.
Author Contributions
Data curation, E.R., investigation, M.F., E.R.; writing M.F., E.R., F.F.; supervision, F.F. All authors have read and agreed to the published version of the manuscript.
Funding
This research received no external funding.
Data Availability Statement
No new data were created or analyzed in this study. Data sharing is not applicable to this article.
Conflicts of Interest
The authors declare no conflict of interest.
References
- Lalle, Y.; Fourati, M.; Fourati, L.C.; Barraca, J.P. Communication Technologies for Smart Water Grid Applications: Overview, Opportunities, and Research Directions. Computer Networks 2021, 190, 107940. [Google Scholar] [CrossRef]
- Palermo, S.A.; Maiolo, M.; Brusco, A.C.; Turco, M.; Pirouz, B.; Greco, E.; Spezzano, G.; Piro, P. Smart Technologies for Water Resource Management: An Overview. Sensors 2022, 22, 6225. [Google Scholar] [CrossRef] [PubMed]
- Tariq, S.; Hu, Z.; Zayed, T. Micro-Electromechanical Systems-Based Technologies for Leak Detection and Localization in Water Supply Networks: A Bibliometric and Systematic Review. Journal of Cleaner Production 2021, 289, 125751. [Google Scholar] [CrossRef]
- Bharani Baanu, B.; Jinesh Babu, K.S. Smart Water Grid: A Review and a Suggestion for Water Quality Monitoring. Water Supply 2021, 22, 1434–1444. [Google Scholar] [CrossRef]
- Obeid, A.M.; Karray, F.; Jmal, M.W.; Abid, M.; Manzoor Qasim, S.; BenSaleh, M.S. Towards Realisation of Wireless Sensor Network-Based Water Pipeline Monitoring Systems: A Comprehensive Review of Techniques and Platforms. IET Science, Measurement & Technology 2016, 10, 420–426. [Google Scholar] [CrossRef]
- de Camargo, E.T.; Spanhol, F.A.; Slongo, J.S.; da Silva, M.V.R.; Pazinato, J.; de Lima Lobo, A.V.; Coutinho, F.R.; Pfrimer, F.W.D.; Lindino, C.A.; Oyamada, M.S.; et al. Low-Cost Water Quality Sensors for IoT: A Systematic Review. Sensors 2023, 23, 4424. [Google Scholar] [CrossRef] [PubMed]
- Jo, W.; Hoashi, Y.; Paredes Aguilar, L.L.; Postigo-Malaga, M.; Garcia-Bravo, J.M.; Min, B.C. A Low-Cost and Small USV Platform for Water Quality Monitoring. HardwareX 2019, 6, e00076. [Google Scholar] [CrossRef]
- Sitaropoulos, K.; Salamone, S.; Sela, L. Frequency-Based Leak Signature Investigation Using Acoustic Sensors in Urban Water Distribution Networks. Advanced Engineering Informatics 2023, 55, 101905. [Google Scholar] [CrossRef]
- Giurgiutiu, V. Structural Health Monitoring with Piezoelectric Wafer Active Sensors; Academic Press, an imprint of Elsevier: Amsterdam, 2014. [Google Scholar]
- Su, Z.; Ye, L. Identification of Damage Using Lamb Waves: From Fundamentals to Applications; Number 48 in Lecture Notes in Applied and Computational Mechanics; Springer: Berlin, 2009. [Google Scholar]
- He, S.; Wang, N.; Ho, M.; Zhu, J.; Song, G. Design of a New Stress Wave Communication Method for Underwater Communication. IEEE Transactions on Industrial Electronics 2021, 68, 7370–7379. [Google Scholar] [CrossRef]
- Jing, L.; Li, Z.; Li, Y.; Murch, R.D. Channel Characterization of Acoustic Waveguides Consisting of Straight Gas and Water Pipelines. IEEE Access 2018, 6, 6807–6819. [Google Scholar] [CrossRef]
- Joseph, K.M.; Watteyne, T.; Kerkez, B. Awa: Using Water Distribution Systems to Transmit Data: Awa: Using to Transmit Data. Transactions on Emerging Telecommunications Technologies 2018, 29, e3219. [Google Scholar] [CrossRef]
- Kokossalakis, G. Acoustic Data Communication System for In-Pipe Wireless Sensor Networks. Thesis, Massachusetts Institute of Technology, 2006. [Google Scholar]
- Sakuma, H.; Nakamura, K.; Ueha, S. Two-Way Communication over Gas Pipe-Line Using Multicarrier Modulated Sound Waves with Cyclic Frequency Shifting. Acoustical Science and Technology 2006, 27, 225–232. [Google Scholar] [CrossRef]
- Kantaris, G.S.; Makris, N.A. Underwater Wireless In-Pipe Communications System. In Proceedings of the 2015 IEEE International Conference on Industrial Technology (ICIT); 2015; pp. 1945–1950. [Google Scholar] [CrossRef]
- Joseph, K.M.; Kerkez, B. Enabling Communications for Buried Pipe Networks. In Proceedings of the World Environmental and Water Resources Congress 2014, Portland, Oregon; 2014; pp. 899–910. [Google Scholar] [CrossRef]
- Farai, O.; Metje, N.; Anthony, C.; Chapman, D. Analysis of Acoustic Signal Propagation for Reliable Digital Communication along Exposed and Buried Water Pipes. Applied Sciences 2023, 13, 4611. [Google Scholar] [CrossRef]
- Afkhami Meybodi, S.; Pardo, P.; Dohler, M. Magneto-Inductive Communication among Pumps in a District Heating System. In Proceedings of the Proceedings of the 9th International Symposium on Antennas, Propagation and EM Theory; 2010; pp. 375–378. [Google Scholar] [CrossRef]
- Wang, M.; Jing, L.; Lu, Y.; Stojanovic, M.; Murch, R. Performance of Coherent OFDM and Differentially Coherent OFDM Communication Systems in Water Pipeline Channels. In Proceedings of the Global Oceans 2020: Singapore – U.S. Gulf Coast; 2020; pp. 1–4. [Google Scholar] [CrossRef]
- Fishta, M.; Raviola, E.; Fiori, F. A Wireless Communication System for Urban Water Supply Networks Based on Guided Acoustic Waves. IEEE Access 2022, 10, 108955–108964. [Google Scholar] [CrossRef]
- Heifetz, A.; Shribak, D.; Huang, X.; Wang, B.; Saniie, J.; Young, J.; Bakhtiari, S.; Vilim, R.B. Transmission of Images With Ultrasonic Elastic Shear Waves on a Metallic Pipe Using Amplitude Shift Keying Protocol. IEEE Transactions on Ultrasonics, Ferroelectrics, and Frequency Control 2020, 67, 1192–1200. [Google Scholar] [CrossRef] [PubMed]
- Chakraborty, S.; Saulnier, G.J.; Wilt, K.W.; Curt, E.; Scarton, H.A.; Litman, R.B. Low-Power, Low-Rate Ultrasonic Communications System Transmitting Axially along a Cylindrical Pipe Using Transverse Waves. IEEE Transactions on Ultrasonics, Ferroelectrics, and Frequency Control 2015, 62, 1788–1796. [Google Scholar] [CrossRef]
- Kumar, L.S.; Han, W.K.; Guan, Y.L.; Lee, Y.H.; Sun, S. Optimization of Acoustic Communication for Industrial Drilling. In Proceedings of the 2013 IEEE Conference on Information Communication Technologies; 2013; pp. 1060–1063. [Google Scholar] [CrossRef]
- Su, N.; Liu, J.; Liu, Q.; Wang, W. A Robust Underwater Acoustic Communication Approach for Pipeline Transmission. In Proceedings of the 2016 IEEE International Conference on Signal Processing, Communications and Computing (ICSPCC); 2016; pp. 1–6. [Google Scholar] [CrossRef]
- Wei, D.; Qi, C.; Huang, C.; Chen, J.; Song, A.; Song, G.; Pan, M. Riding Stress Wave: Underwater Communications Through Pipeline Networks. IEEE Journal of Oceanic Engineering 2021, 46, 1450–1462. [Google Scholar] [CrossRef]
- He, S.; Zhang, G.; Song, G. Design of a Networking Stress Wave Communication Method along Pipelines. Mechanical Systems and Signal Processing 2022, 164, 108192. [Google Scholar] [CrossRef]
- Tuptuk, N.; Hazell, P.; Watson, J.; Hailes, S. A Systematic Review of the State of Cyber-Security in Water Systems. Water 2021, 13, 81. [Google Scholar] [CrossRef]
- Di Nardo, A.; Boccelli, D.L.; Herrera, M.; Creaco, E.; Cominola, A.; Sitzenfrei, R.; Taormina, R. Smart Urban Water Networks: Solutions, Trends and Challenges. Water 2021, 13, 501. [Google Scholar] [CrossRef]
- Rousso, B.Z.; Lambert, M.; Gong, J. Smart Water Networks: A Systematic Review of Applications Using High-Frequency Pressure and Acoustic Sensors in Real Water Distribution Systems. Journal of Cleaner Production 2023, 410, 137193. [Google Scholar] [CrossRef]
- Khoa Bui, X.S.; Marlim, M.; Kang, D. Water Network Partitioning into District Metered Areas: A State-Of-The-Art Review. Water 2020, 12, 1002. [Google Scholar] [CrossRef]
- Lai, T.T.T.; Chen, W.J.; Li, K.H.; Huang, P.; Chu, H.H. TriopusNet: Automating Wireless Sensor Network Deployment and Replacement in Pipeline Monitoring. In Proceedings of the Proceedings of the 11th International Conference on Information Processing in Sensor Networks; New York, NY, USA, 2012. IPSN’12. pp. 61–72. [Google Scholar] [CrossRef]
- Allen, M.; Preis, A.; Iqbal, M.; Whittle, A.J. Water Distribution System Monitoring and Decision Support Using a Wireless Sensor Network. In Proceedings of the 2013 14th ACIS International Conference on Software Engineering, Artificial Intelligence, Networking and Parallel/Distributed Computing; 2013; pp. 641–646. [Google Scholar] [CrossRef]
- Alves, A.J.R.; Manera, L.T.; Campos, M.V. Low-Cost Wireless Sensor Network Applied to Real-Time Monitoring and Control of Water Consumption in Residences. Revista Ambiente & Água 2019, 14, e2407. [Google Scholar] [CrossRef]
- Authors: Chinnusamy, S. IoT Enabled Monitoring and Control of Water Distribution Network: (084). WDSA / CCWI Joint Conference Proceedings 2018, 1. [Google Scholar]
- Cai, L.; Wang, R.; Ping, J.; Jing, Y.; Sun, J. Water Supply Network Monitoring Based on Demand Reverse Deduction (DRD) Technology. Procedia Engineering 2015, 119, 19–27. [Google Scholar] [CrossRef]
- Christodoulou, S. Wireless Sensor Networks for Water Loss Detection. 2010. [Google Scholar]
- Cloete, N.A.; Malekian, R.; Nair, L. Design of Smart Sensors for Real-Time Water Quality Monitoring. IEEE Access 2016, 4, 3975–3990. [Google Scholar] [CrossRef]
- Fuentes, H.; Mauricio, D. Smart Water Consumption Measurement System for Houses Using IoT and Cloud Computing. Environmental Monitoring and Assessment 2020, 192, 602. [Google Scholar] [CrossRef]
- Lambrou, T.P.; Anastasiou, C.C.; Panayiotou, C.G.; Polycarpou, M.M. A Low-Cost Sensor Network for Real-Time Monitoring and Contamination Detection in Drinking Water Distribution Systems. IEEE Sensors Journal 2014, 14, 2765–2772. [Google Scholar] [CrossRef]
- Machell, J.; Mounce, S.R.; Boxall, J.B. Online Modelling of Water Distribution Systems: A UK Case Study. Drinking Water Engineering and Science 2010, 3, 21–27. [Google Scholar] [CrossRef]
- Pérez-Padillo, J.; Puig, F.; García Morillo, J.; Montesinos, P. IoT Platform for Failure Management in Water Transmission Systems. Expert Systems with Applications 2022, 199, 116974. [Google Scholar] [CrossRef]
- Stephens, M.; Gong, J.; Zhang, C.; Marchi, A.; Dix, L.; Lambert, M.F. Leak-Before-Break Main Failure Prevention for Water Distribution Pipes Using Acoustic Smart Water Technologies: Case Study in Adelaide. Journal of Water Resources Planning and Management 2020, 146, 05020020. [Google Scholar] [CrossRef]
- Verma, P.; Kumar, A.; Rathod, N.; Jain, P.; Mallikarjun, S.; Subramanian, R.; Amrutur, B.; Kumar, M.S.M.; Sundaresan, R. Towards an IoT Based Water Management System for a Campus. In Proceedings of the 2015 IEEE First International Smart Cities Conference (ISC2); 2015; pp. 1–6. [Google Scholar] [CrossRef]
- Das, B.; Jain, P. Real-Time Water Quality Monitoring System Using Internet of Things. In Proceedings of the 2017 International Conference on Computer, Communications and Electronics (Comptelix); 2017; pp. 78–82. [Google Scholar]
- Simitha, K.M.; Raj, S. IoT and WSN Based Water Quality Monitoring System. In Proceedings of the 2019 3rd International Conference on Electronics, Communication and Aerospace Technology (ICECA); 2019; pp. 205–210. [Google Scholar] [CrossRef]
- Priya, S.K.; Shenbagalakshmi, G.; Revathi, T. Design of Smart Sensors for Real Time Drinking Water Quality Monitoring and Contamination Detection in Water Distributed Mains. International Journal of Engineering & Technology 2018, 7, 47–51. [Google Scholar] [CrossRef]
- Saravanan, K.; Anusuya, E.; Kumar, R.; Son, L.H. Real-Time Water Quality Monitoring Using Internet of Things in SCADA. Environmental Monitoring and Assessment 2018, 190, 556. [Google Scholar] [CrossRef]
- S, A.; N, S.M.; S, A.; Natarajan, K.; Shobha, K.R.; Paventhan, A. An IoT Based 6LoWPAN Enabled Experiment for Water Management. In Proceedings of the 2015 IEEE International Conference on Advanced Networks and Telecommuncations Systems (ANTS); 2015; pp. 1–6. [Google Scholar] [CrossRef]
- Stoianov, I.; Nachman, L.; Madden, S.; Tokmouline, T.; Csail, M. PIPENET: A Wireless Sensor Network for Pipeline Monitoring. In Proceedings of the 2007 6th International Symposium on Information Processing in Sensor Networks; 2007; pp. 264–273. [Google Scholar] [CrossRef]
- Chitre, M.; Shahabudeen, S.; Stojanovic, M. Underwater Acoustic Communications and Networking: Recent Advances and Future Challenges. Marine Technology Society Journal 2008, 42, 103–116. [Google Scholar] [CrossRef]
- Akyildiz, I.F.; Pompili, D.; Melodia, T. Underwater Acoustic Sensor Networks: Research Challenges. Ad Hoc Networks 2005, 3, 257–279. [Google Scholar] [CrossRef]
- Rice, J.; Green, D. Underwater Acoustic Communications and Networks for the US Navy’s Seaweb Program. In Proceedings of the 2008 Second International Conference on Sensor Technologies and Applications (Sensorcomm 2008); 2008; pp. 715–722. [Google Scholar] [CrossRef]
- Howard, C.; Cazzolato, B. Acoustic Analyses Using Matlab and Ansys, zeroth ed.; CRC Press, 2014. [Google Scholar] [CrossRef]
- Fishta, M.; Raviola, E.; Fiori, F.; Calza, F.; Tornaboni, A. Experimental Characterization of In-Pipe Acoustic Communication Channels Through Measurement of Pressure Transfer Functions. In Proceedings of the 2022 IEEE 27th International Conference on Emerging Technologies and Factory Automation (ETFA); 2022; pp. 1–7. [Google Scholar] [CrossRef]
- Fishta, M.; Raviola, E.; Fiori, F. A Baseband Wireless VNA for the Characterization of Multiport Distributed Systems. IEEE Transactions on Instrumentation and Measurement 2023, 72, 1–8. [Google Scholar] [CrossRef]
- McCune, E. Practical Digital Wireless Signals, 1. publ ed.; The Cambridge RF and Microwave Engineering Series; Cambridge Univ. Press: Cambridge, 2010. [Google Scholar]
Figure 2.
Maximum distance between two wireless-connected nodes in SWNs reviewed so far. The case of GPRS/3G connection is not considered.
Figure 2.
Maximum distance between two wireless-connected nodes in SWNs reviewed so far. The case of GPRS/3G connection is not considered.
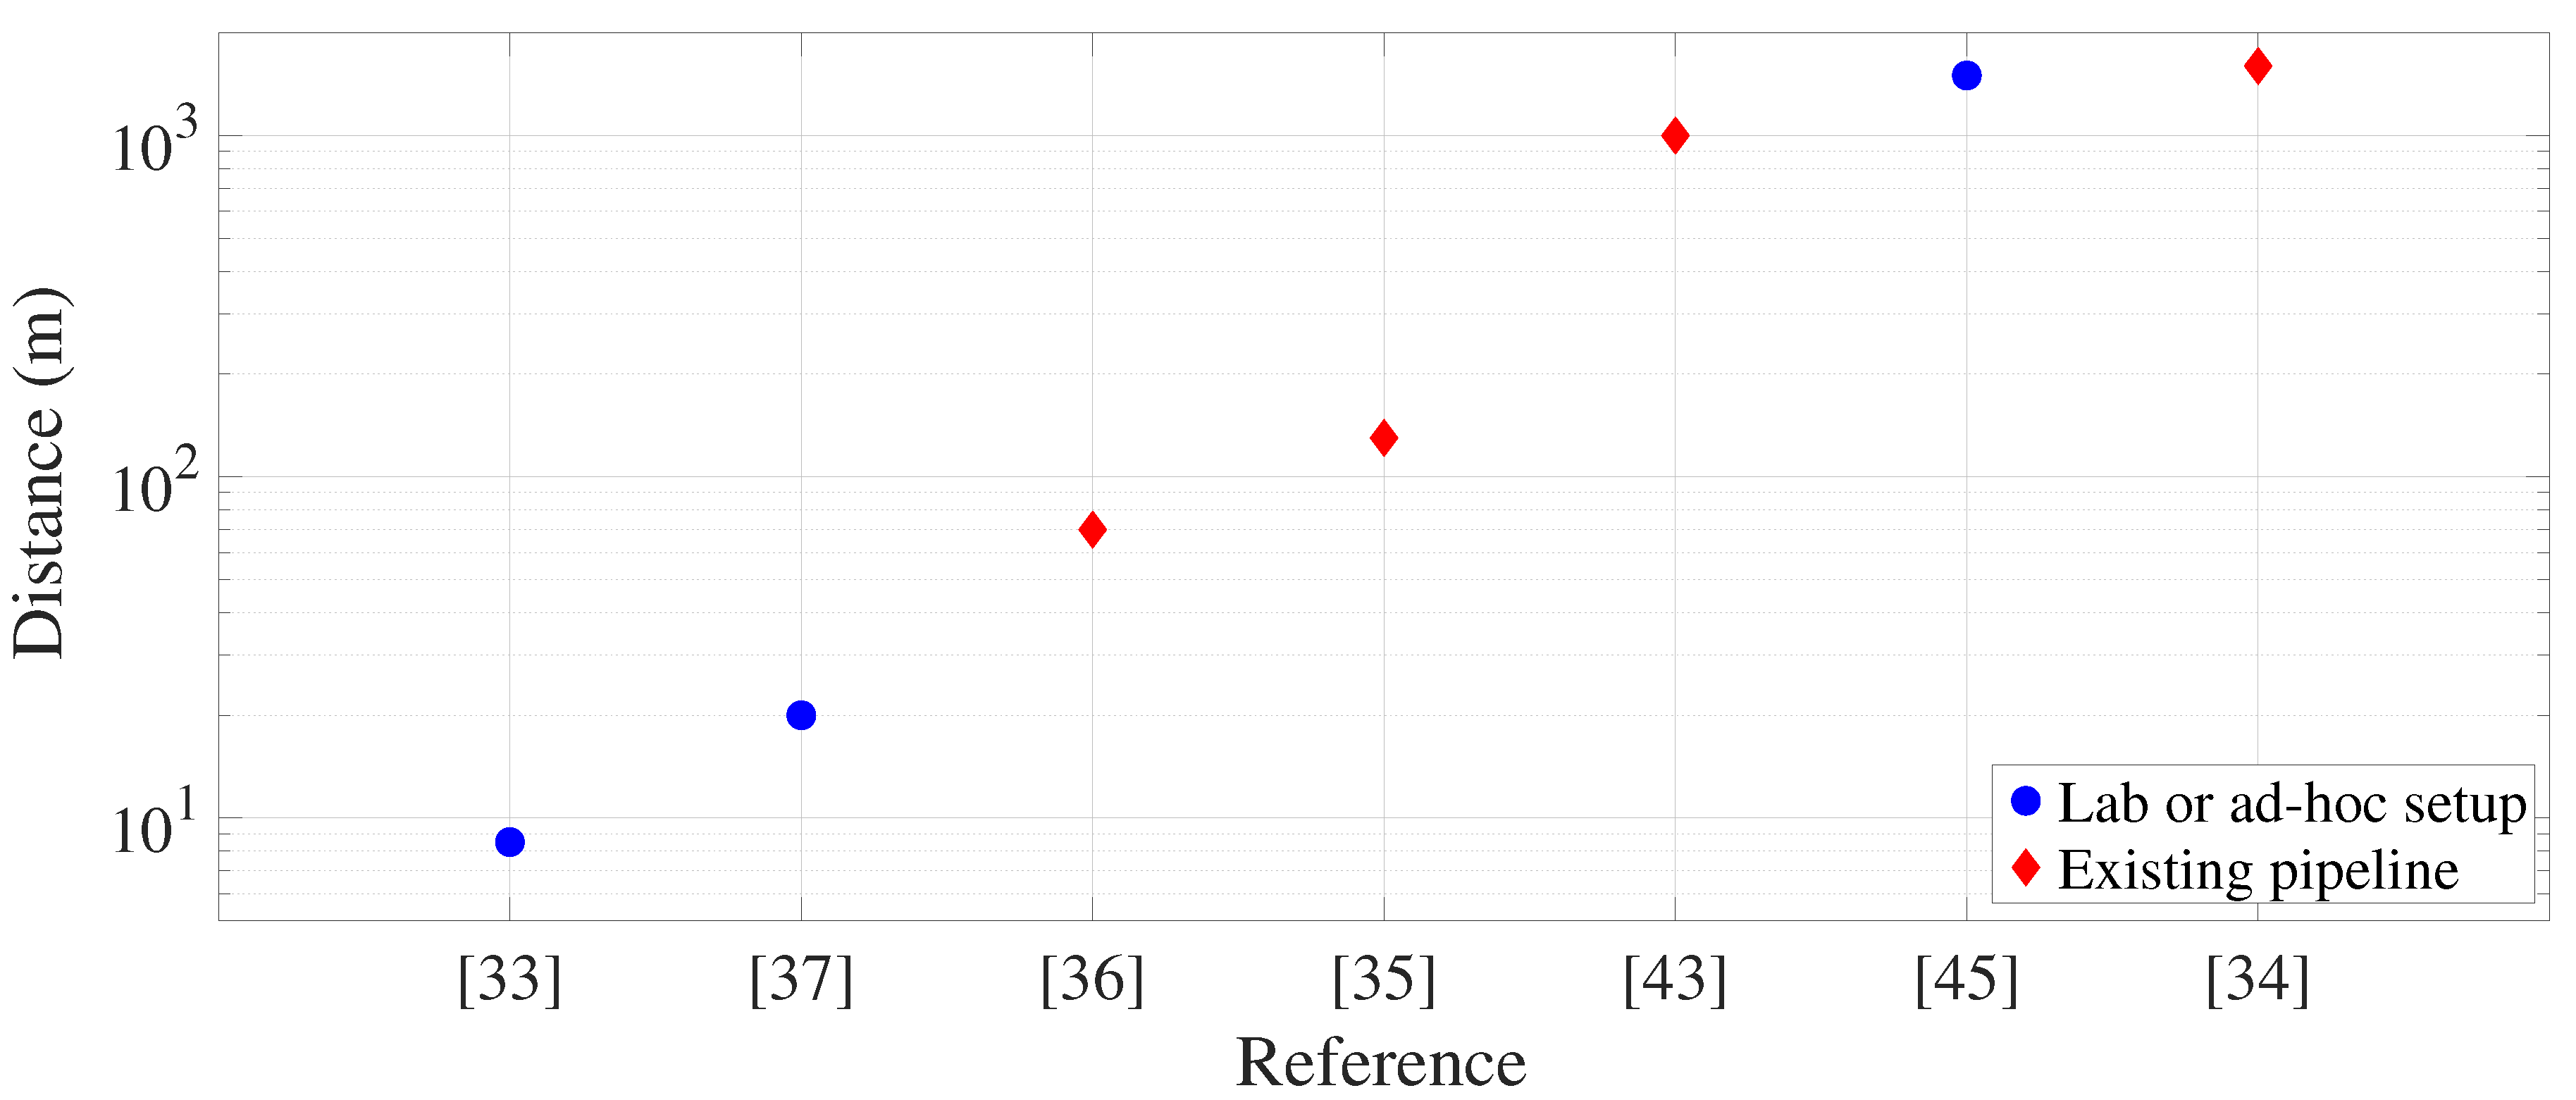
Figure 3.
Time between two data transmissions from a remote monitoring unit to the central one/gateway.
Figure 3.
Time between two data transmissions from a remote monitoring unit to the central one/gateway.
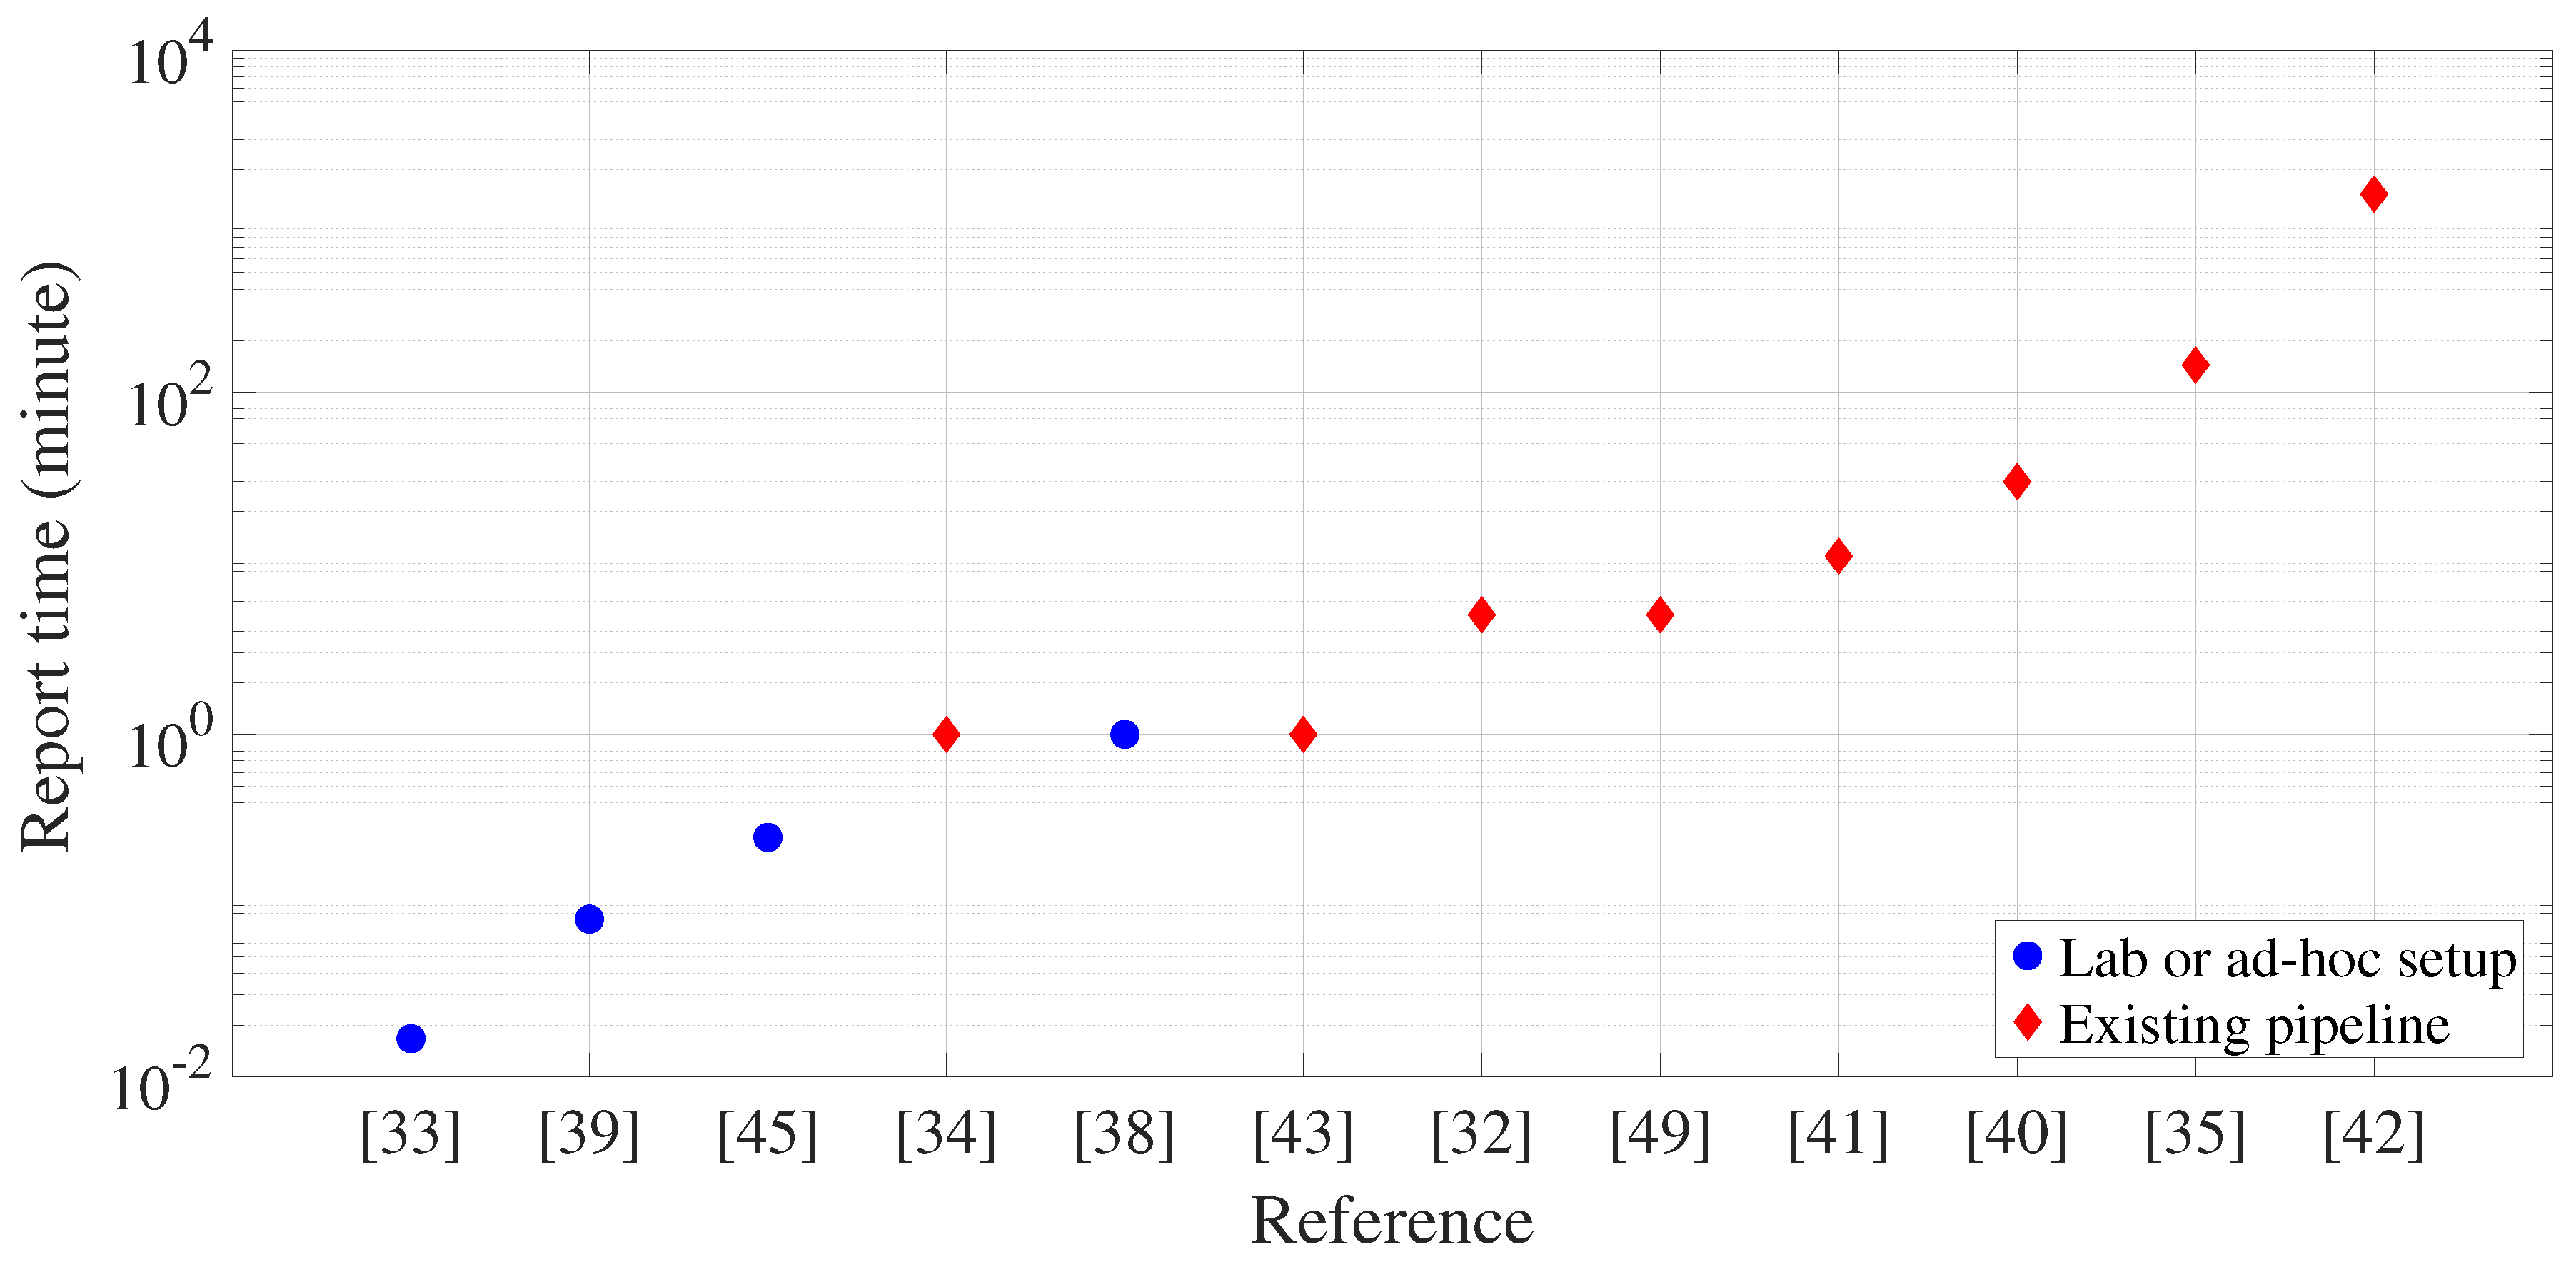
Figure 5.
Schematic representation of the test structure employed in [13].
Figure 5.
Schematic representation of the test structure employed in [13].
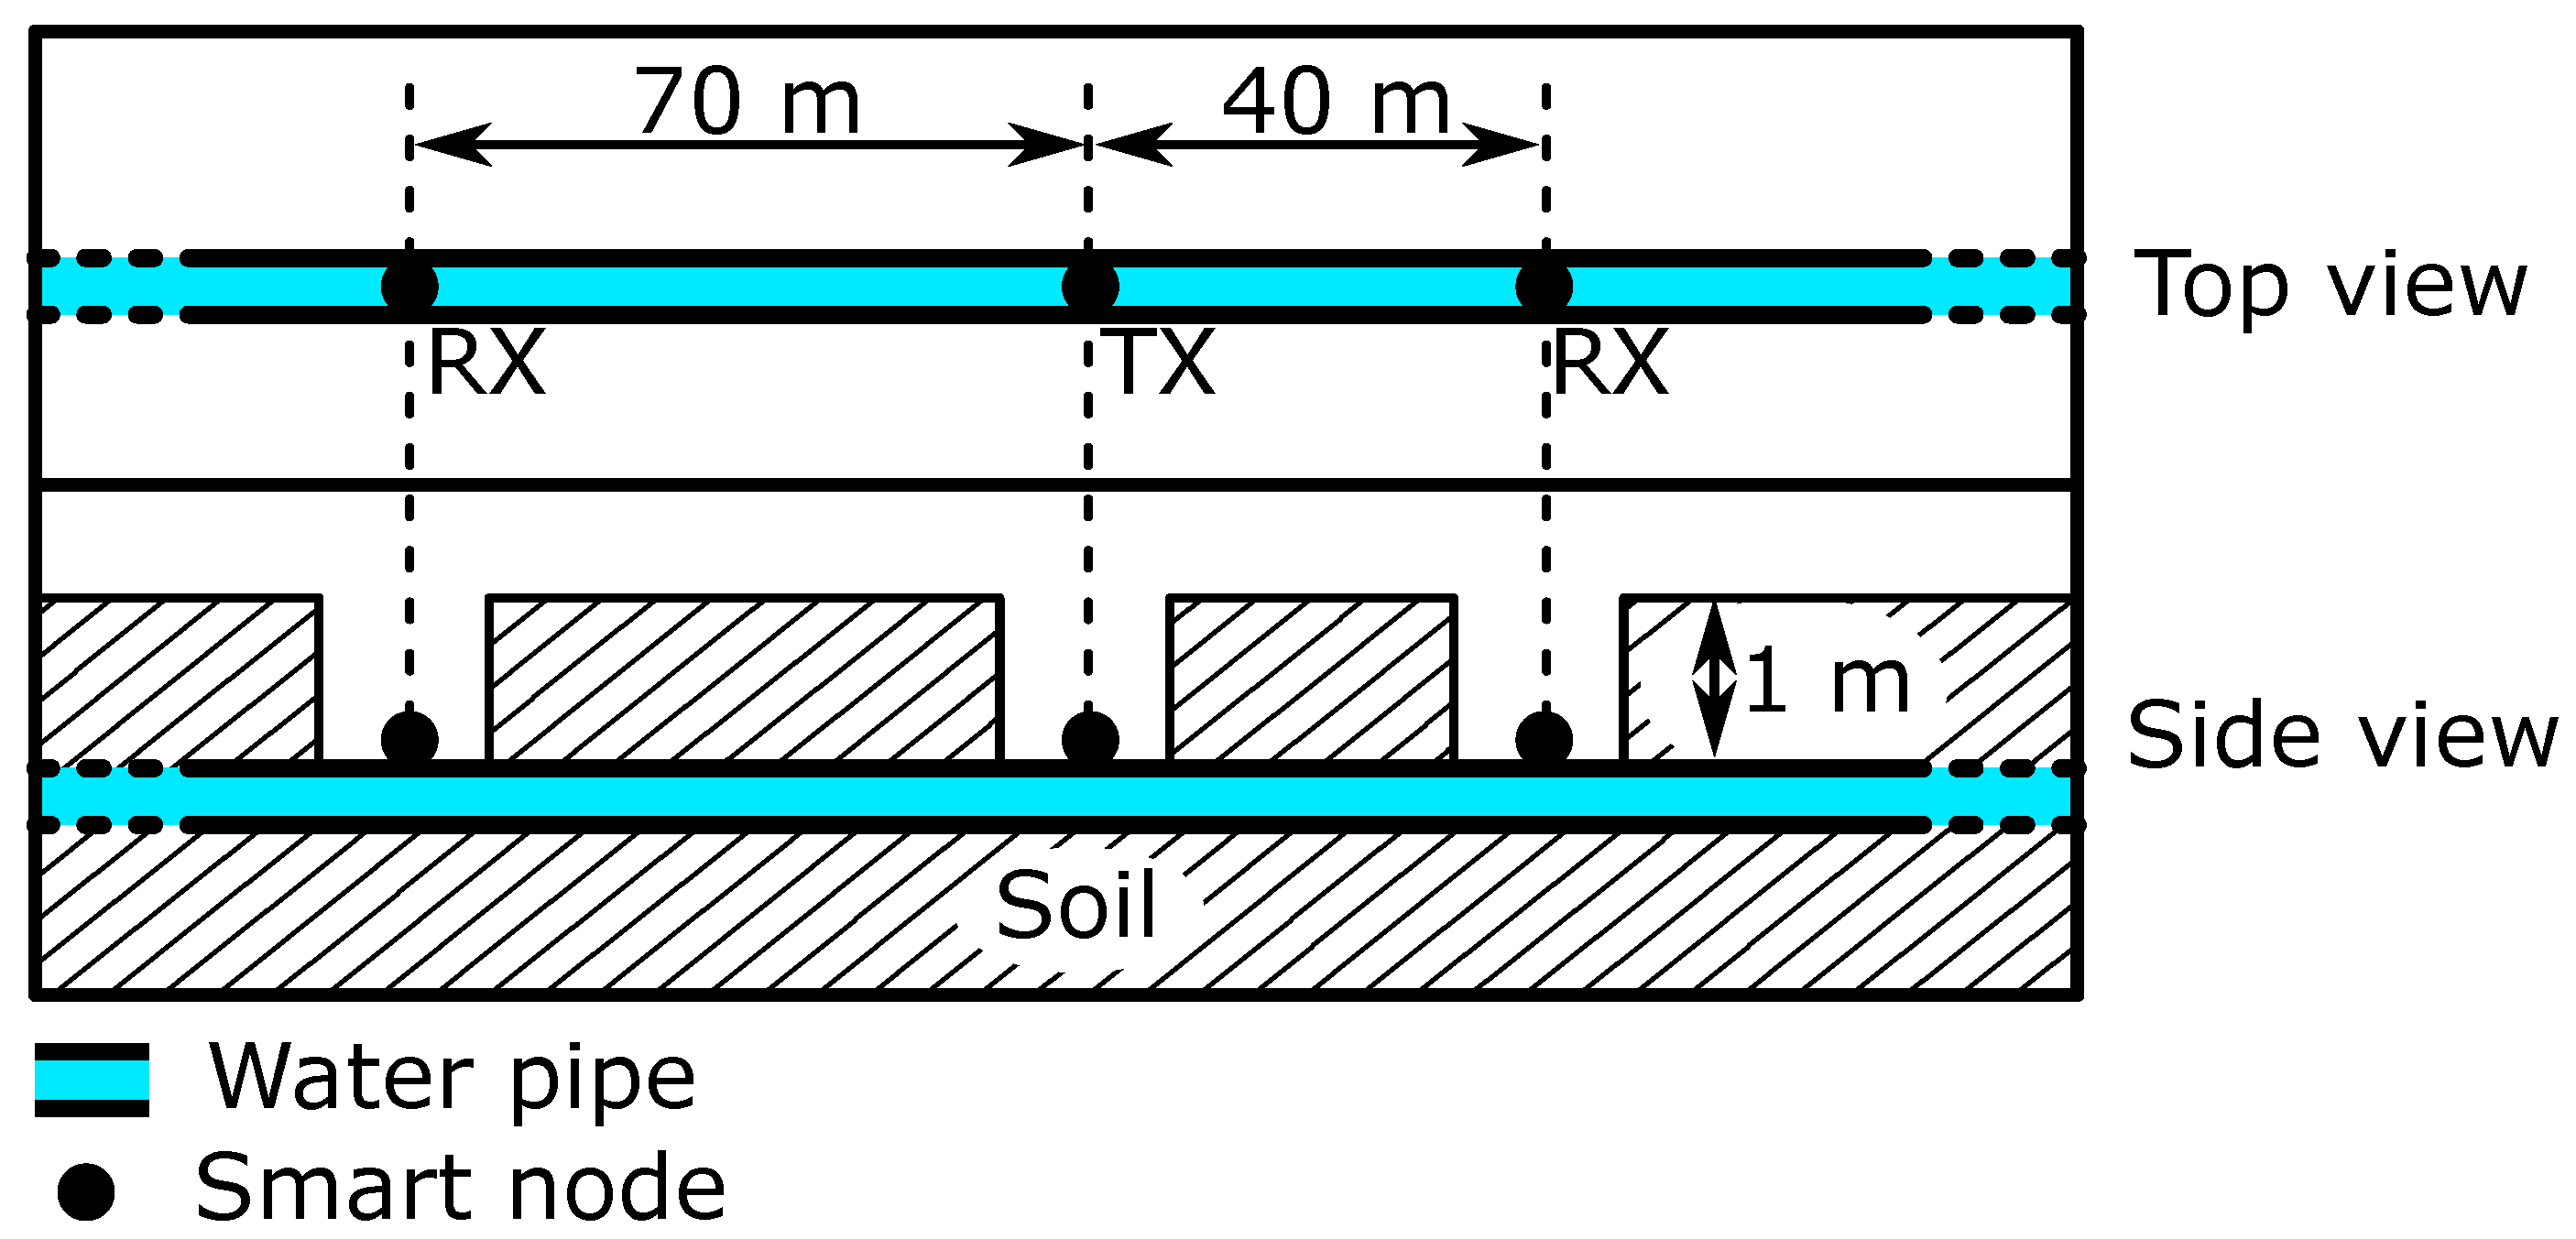
Figure 6.
Schematic representation of the test structure employed in [21].
Figure 6.
Schematic representation of the test structure employed in [21].
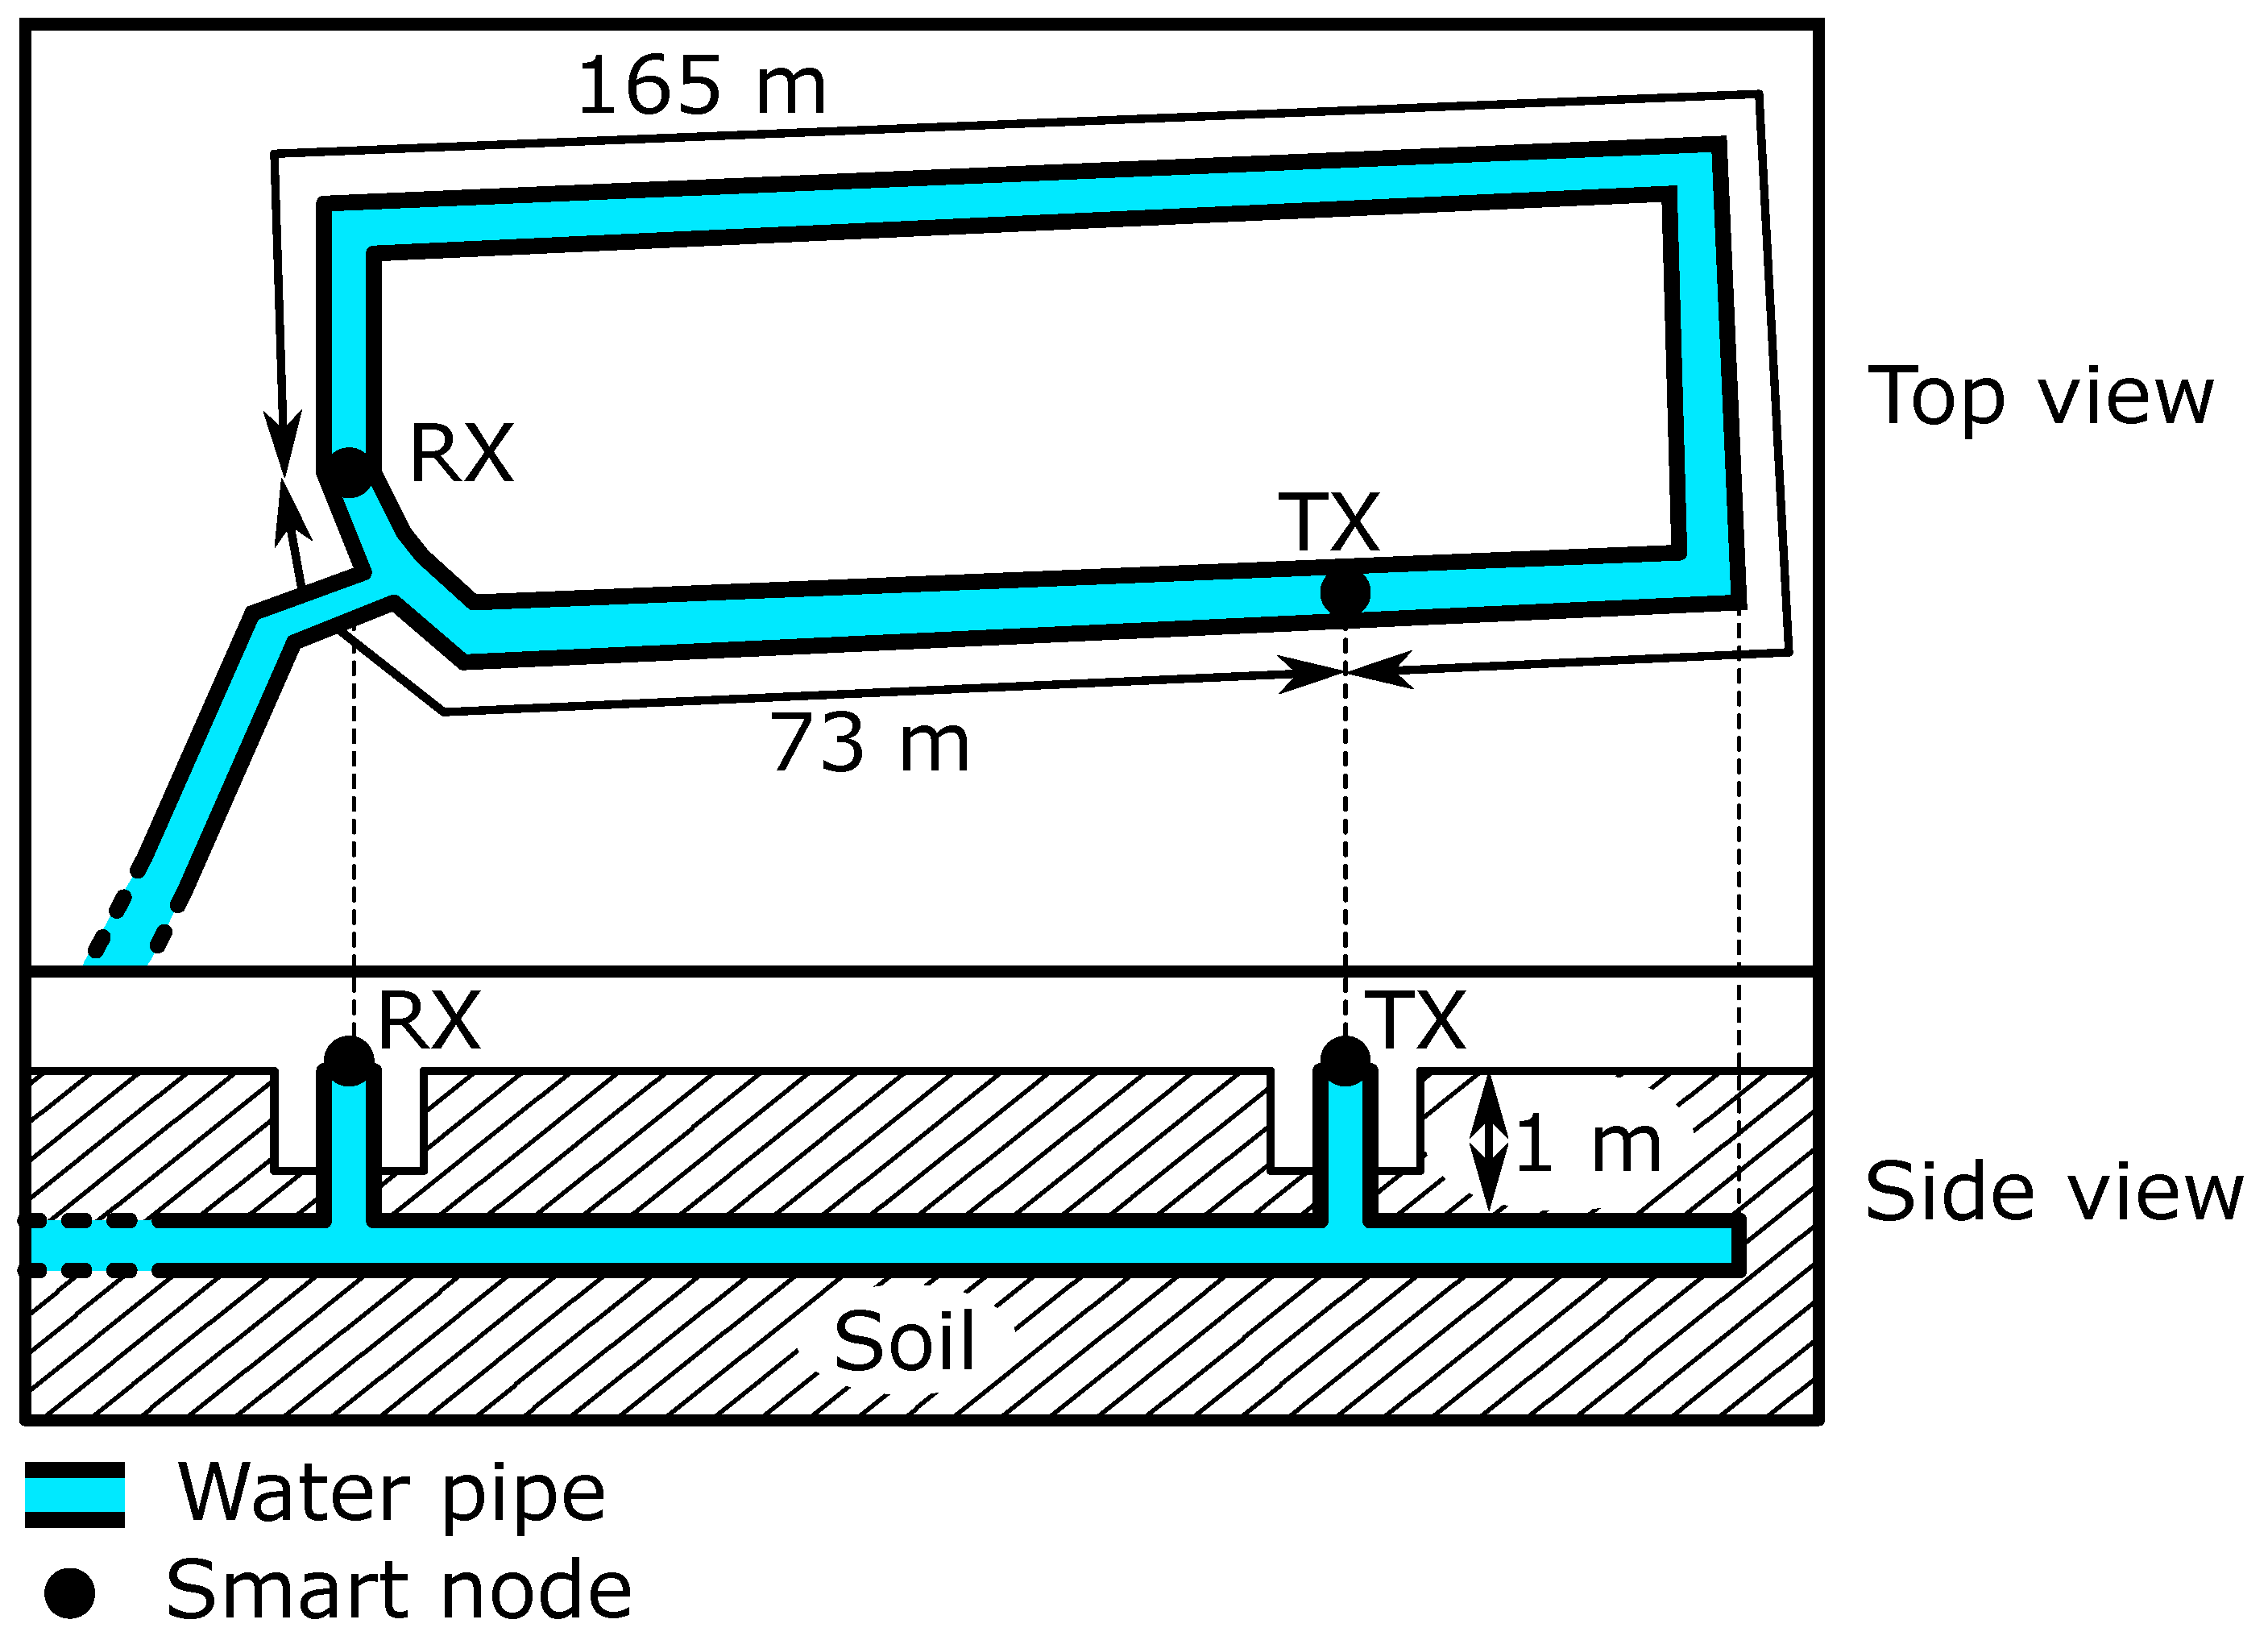
Figure 7.
Block diagram description of a generic communication system based on the propagation of guided acoustic waves.
Figure 7.
Block diagram description of a generic communication system based on the propagation of guided acoustic waves.
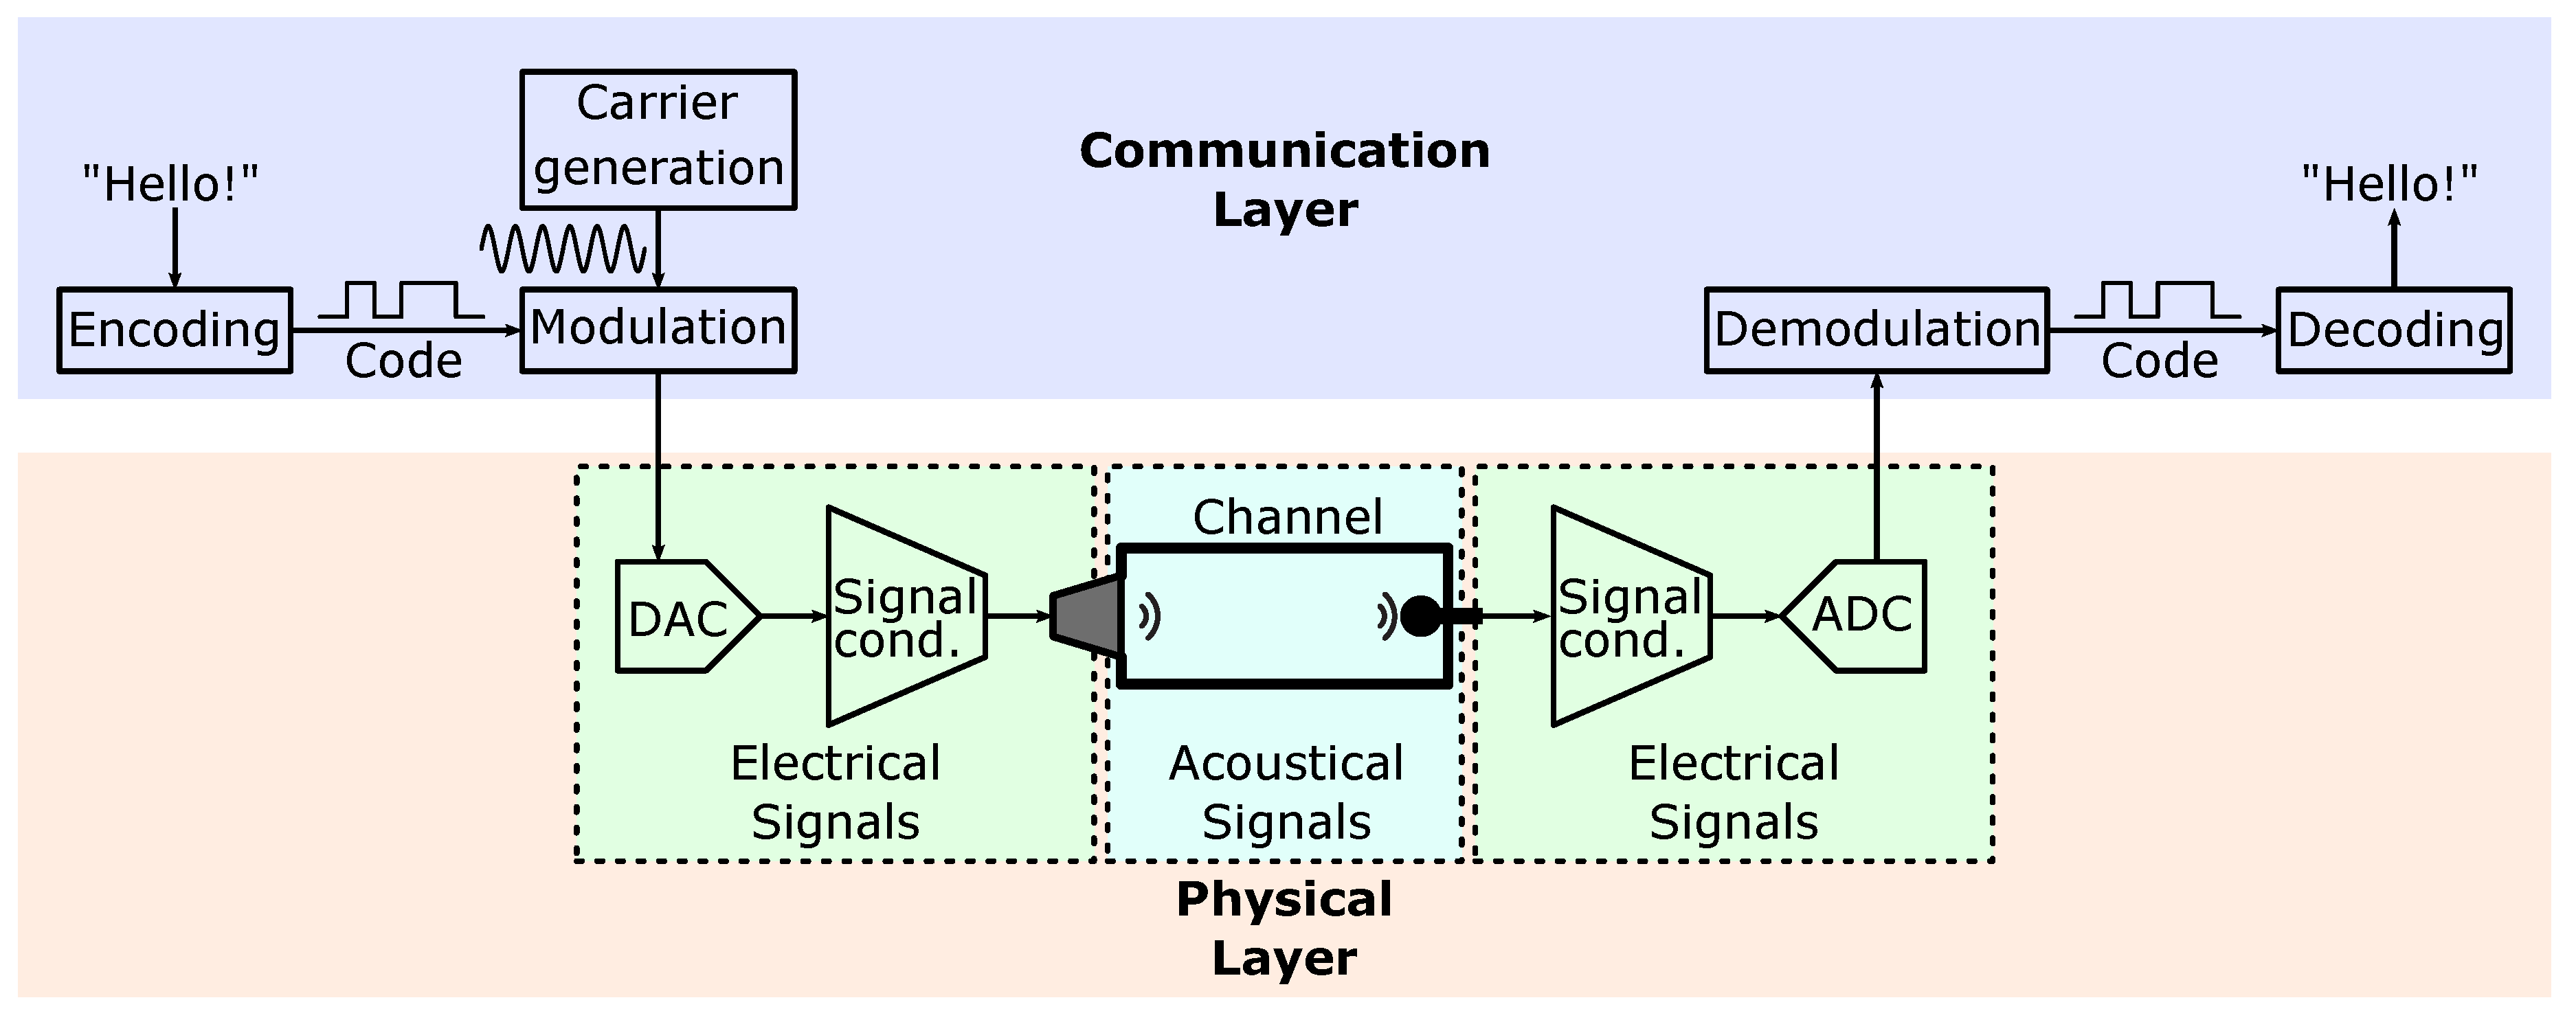
Figure 9.
Block diagram of the pipe channel characterization system proposed in [55].
Figure 9.
Block diagram of the pipe channel characterization system proposed in [55].
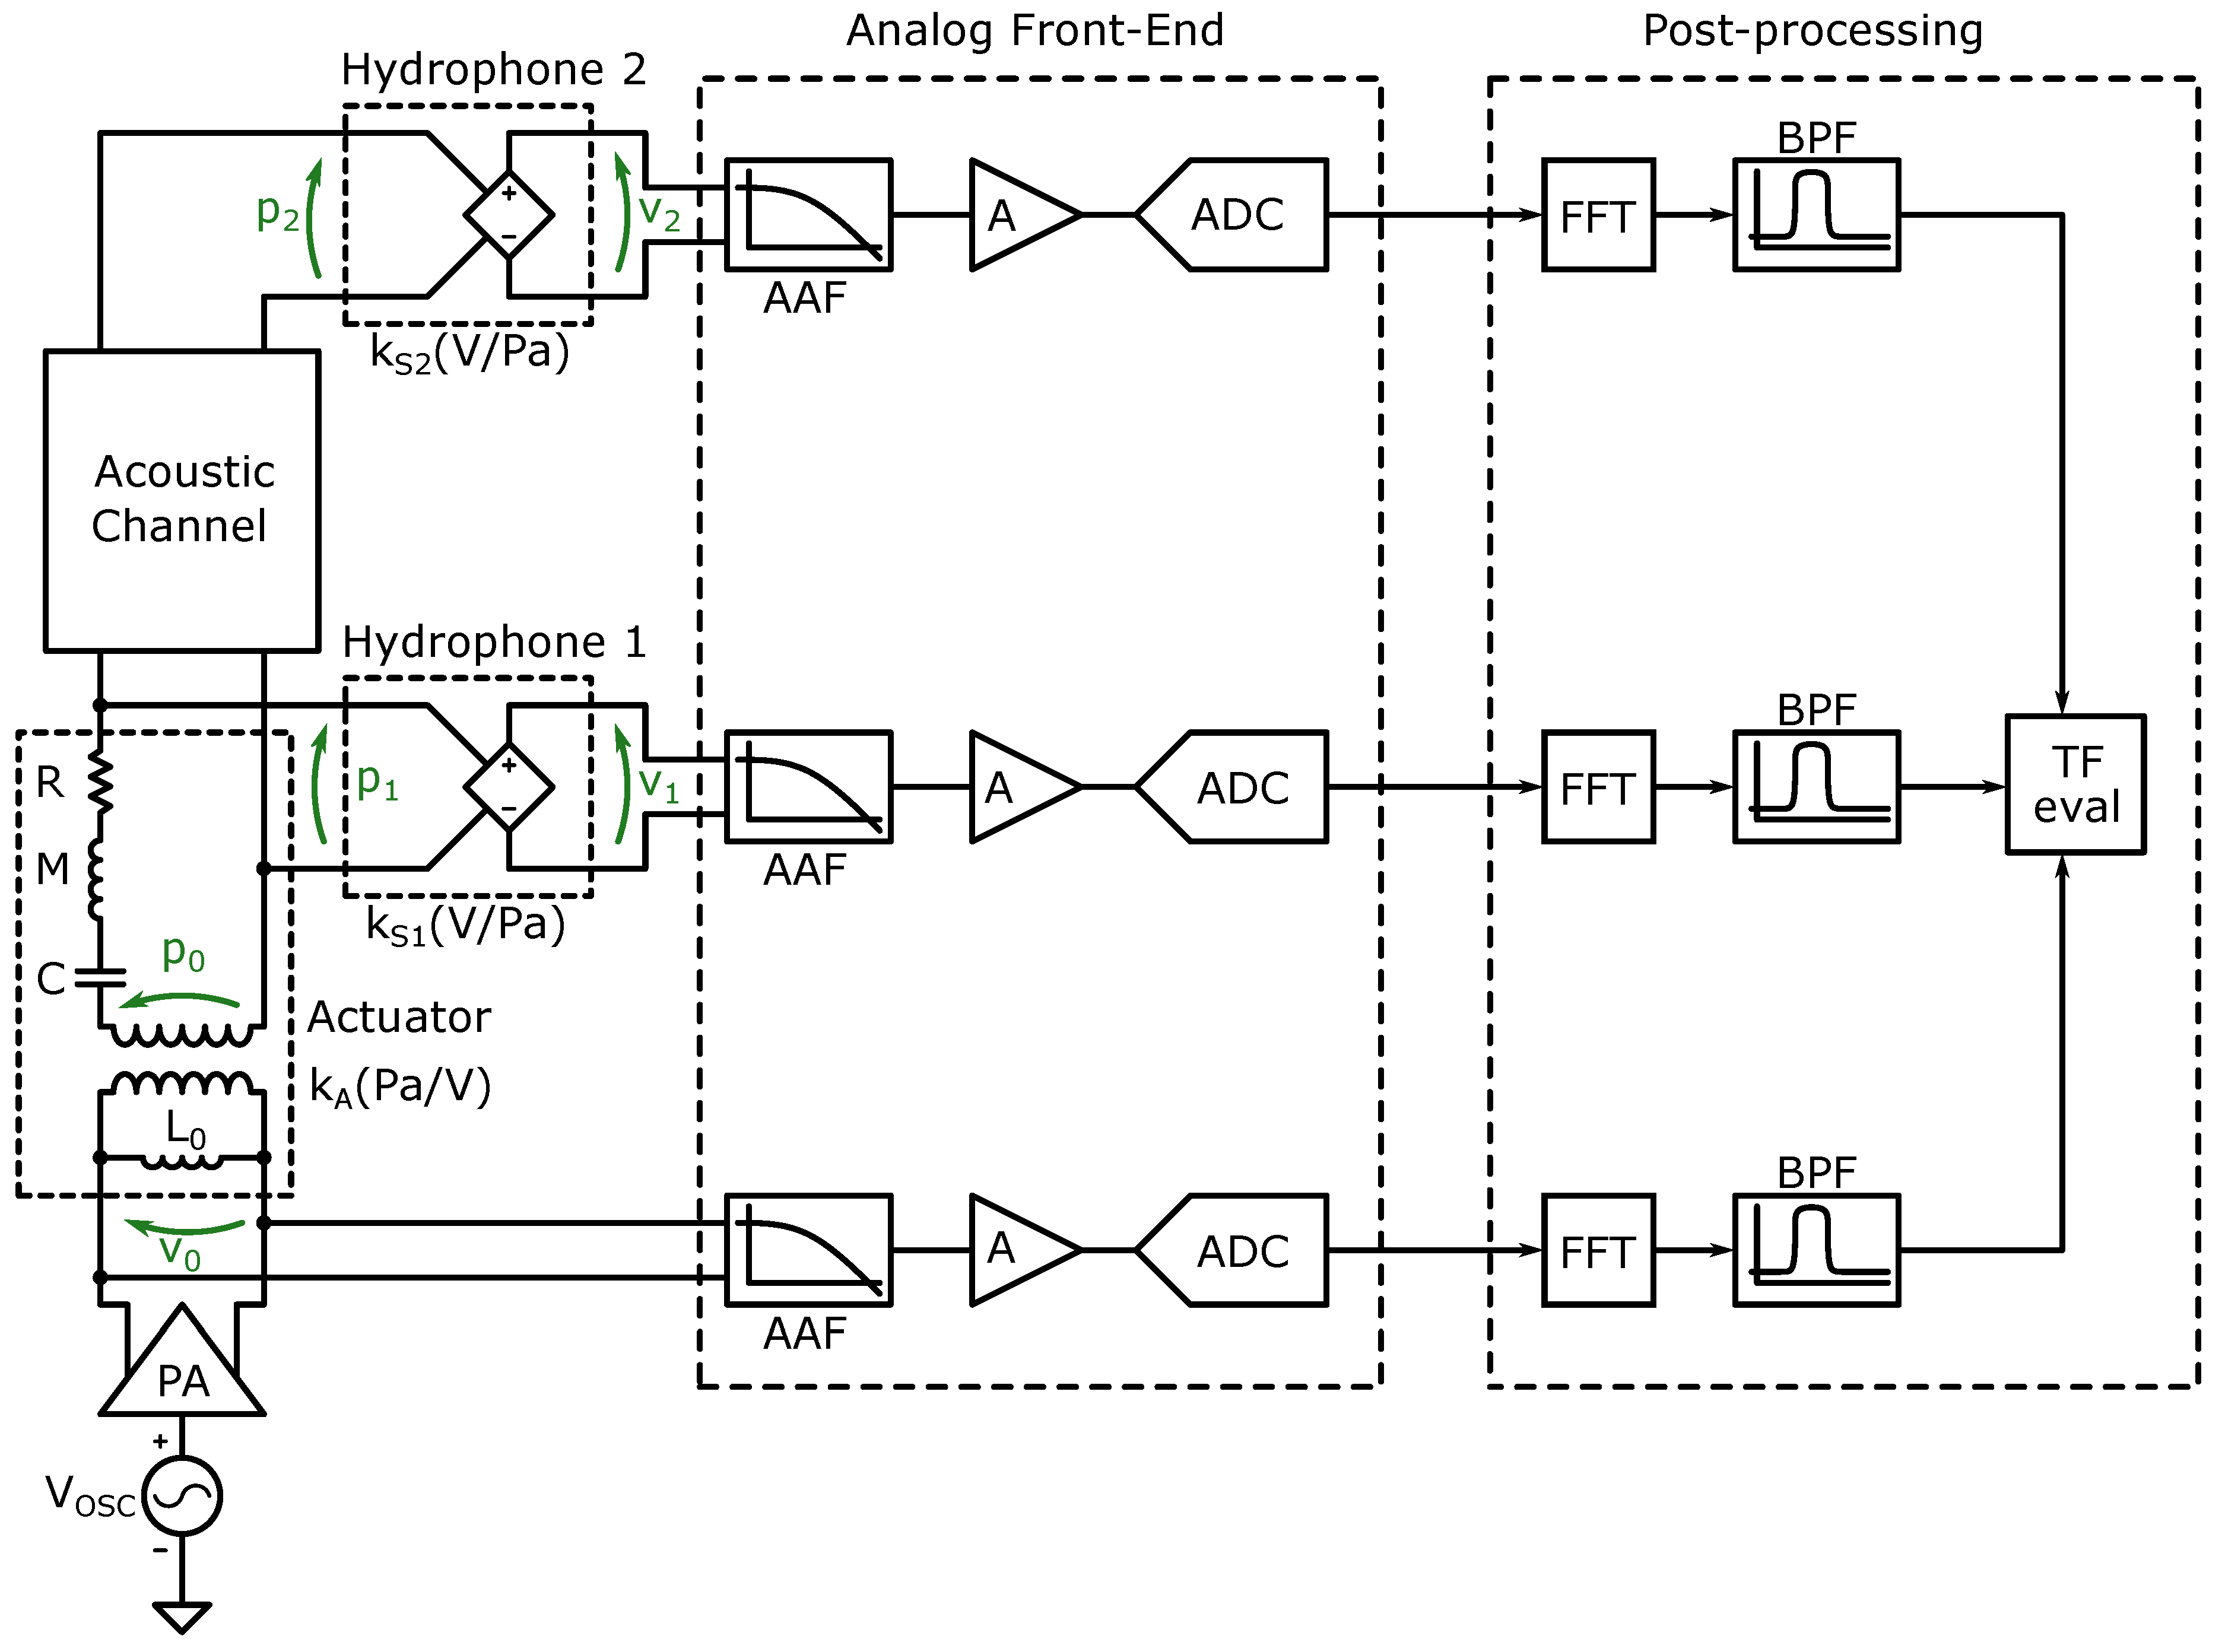
Figure 10.
Example of the DFT evaluated sequences at the near and far ends from [21], for the case . The channel transfer function is evaluated by taking the magnitude and phase difference at the excited frequency point.
Figure 10.
Example of the DFT evaluated sequences at the near and far ends from [21], for the case . The channel transfer function is evaluated by taking the magnitude and phase difference at the excited frequency point.
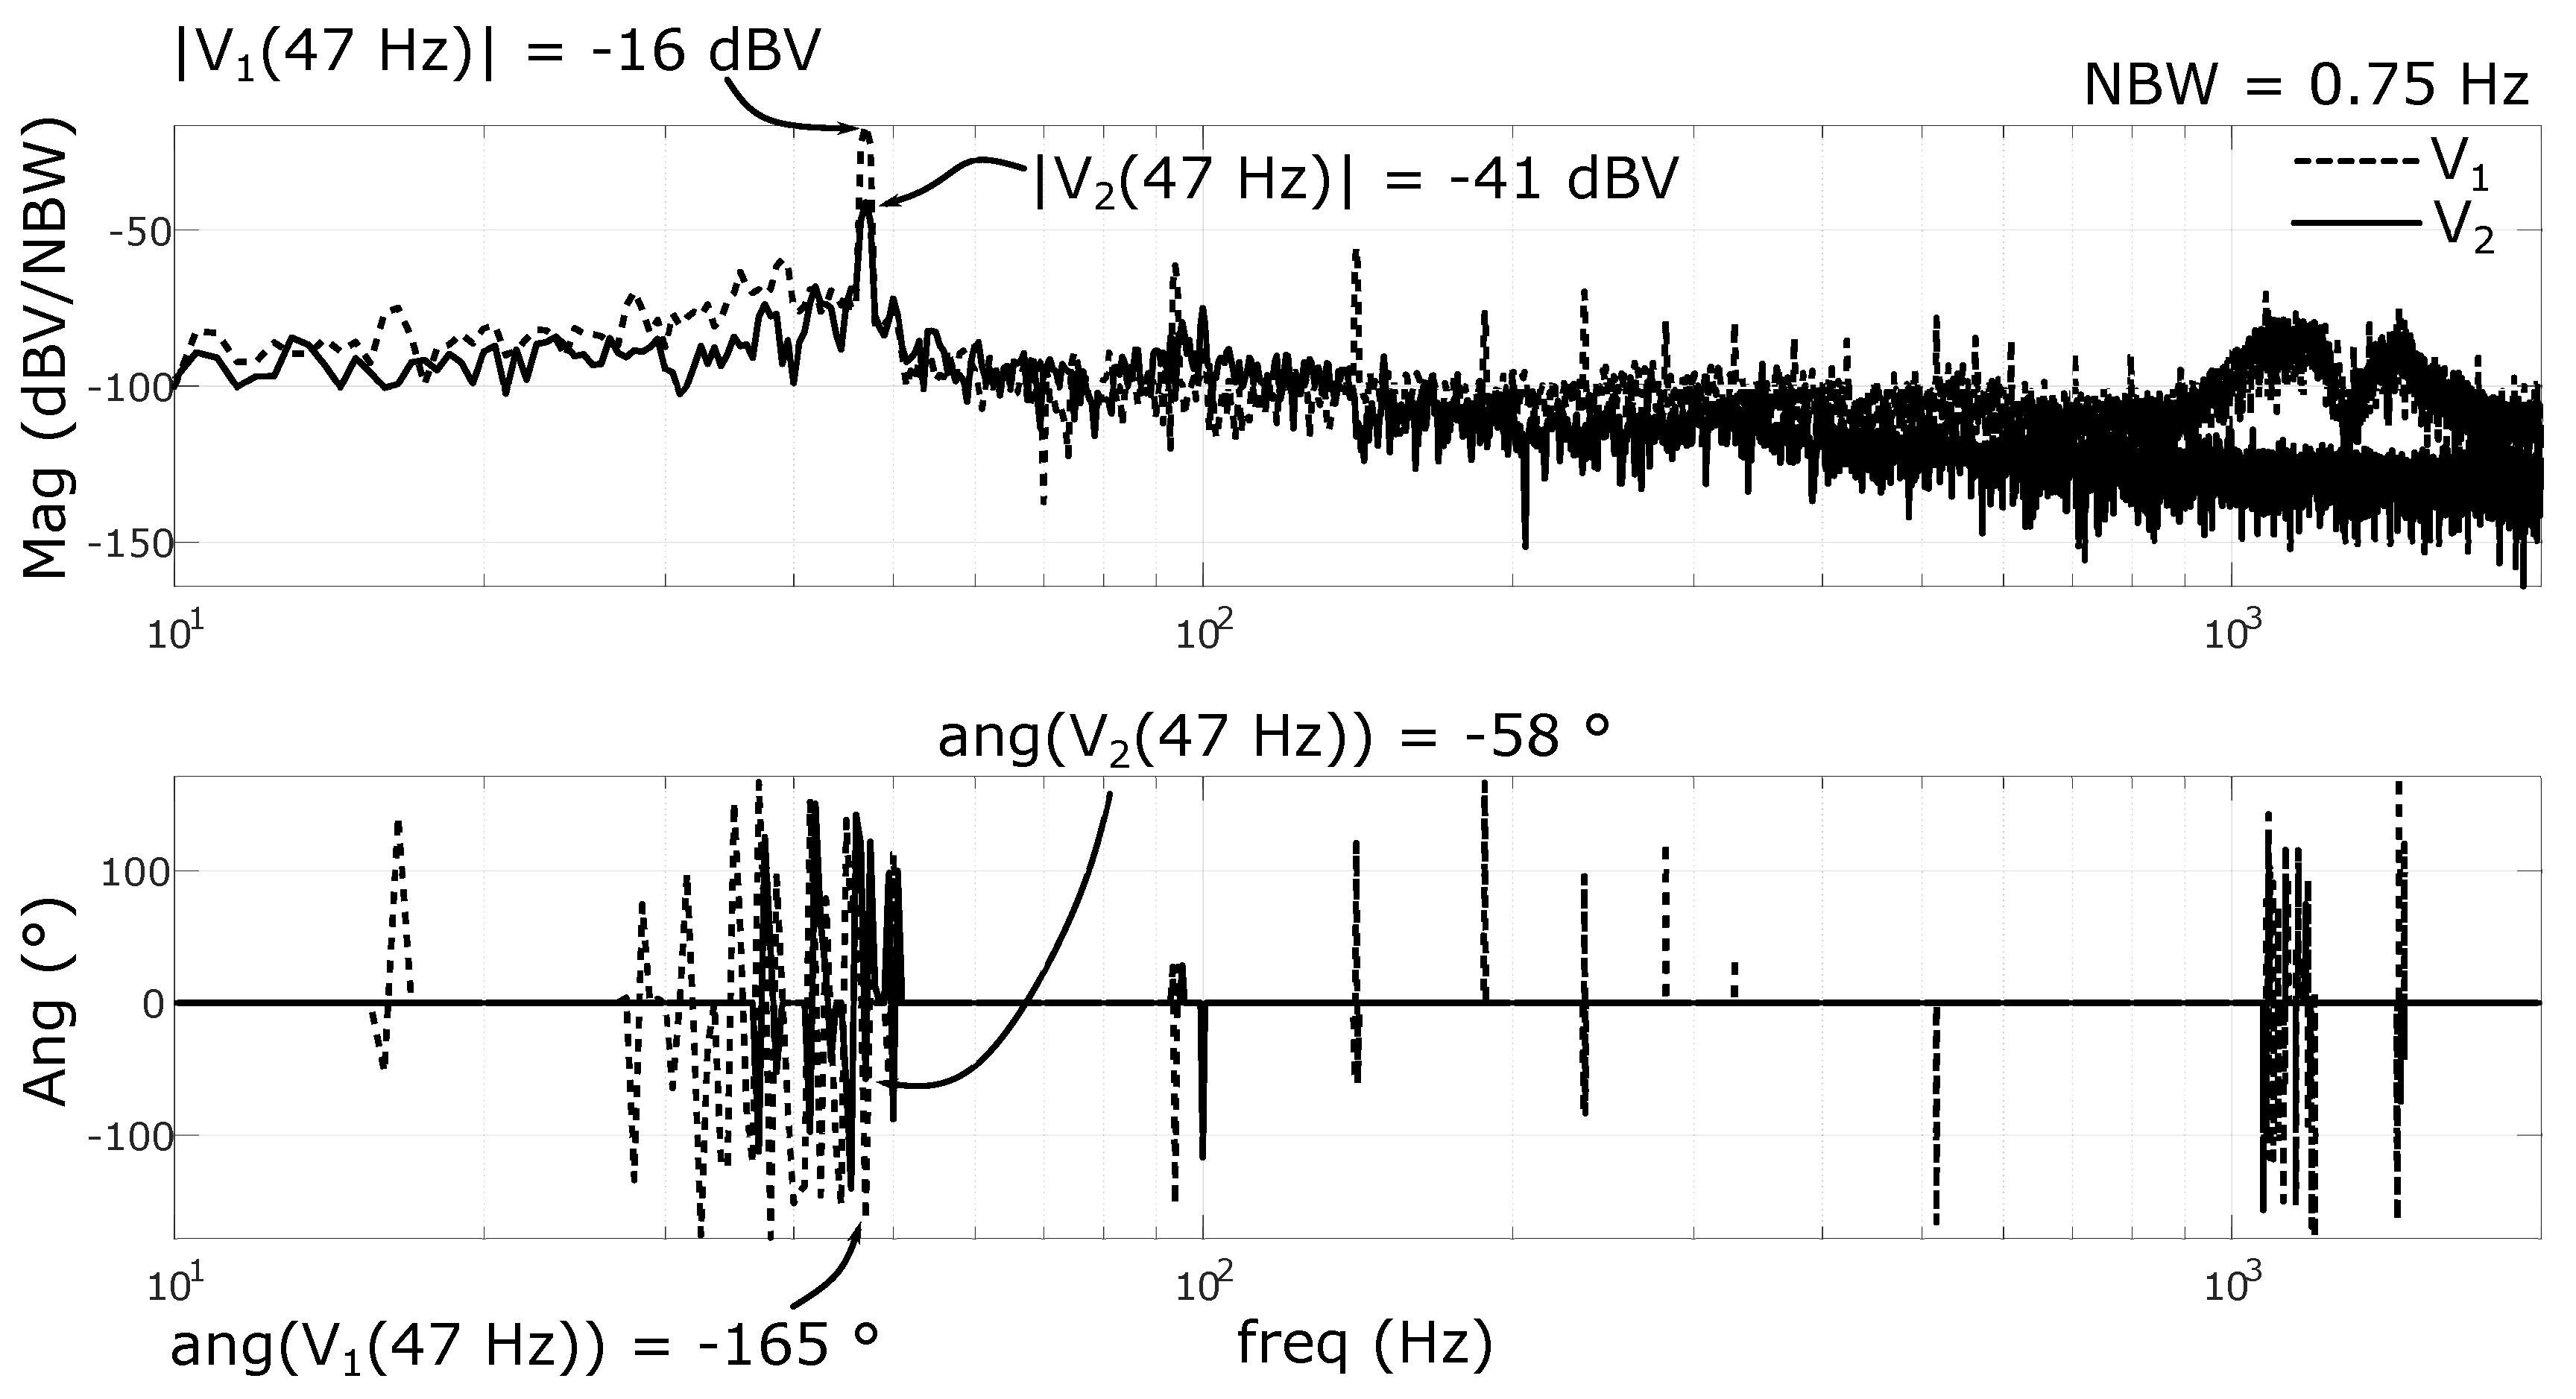
Figure 11.
Results of channel characterization and modeling from [21]. The dots represent experimental measurements while the line represents the derived model.
Figure 11.
Results of channel characterization and modeling from [21]. The dots represent experimental measurements while the line represents the derived model.
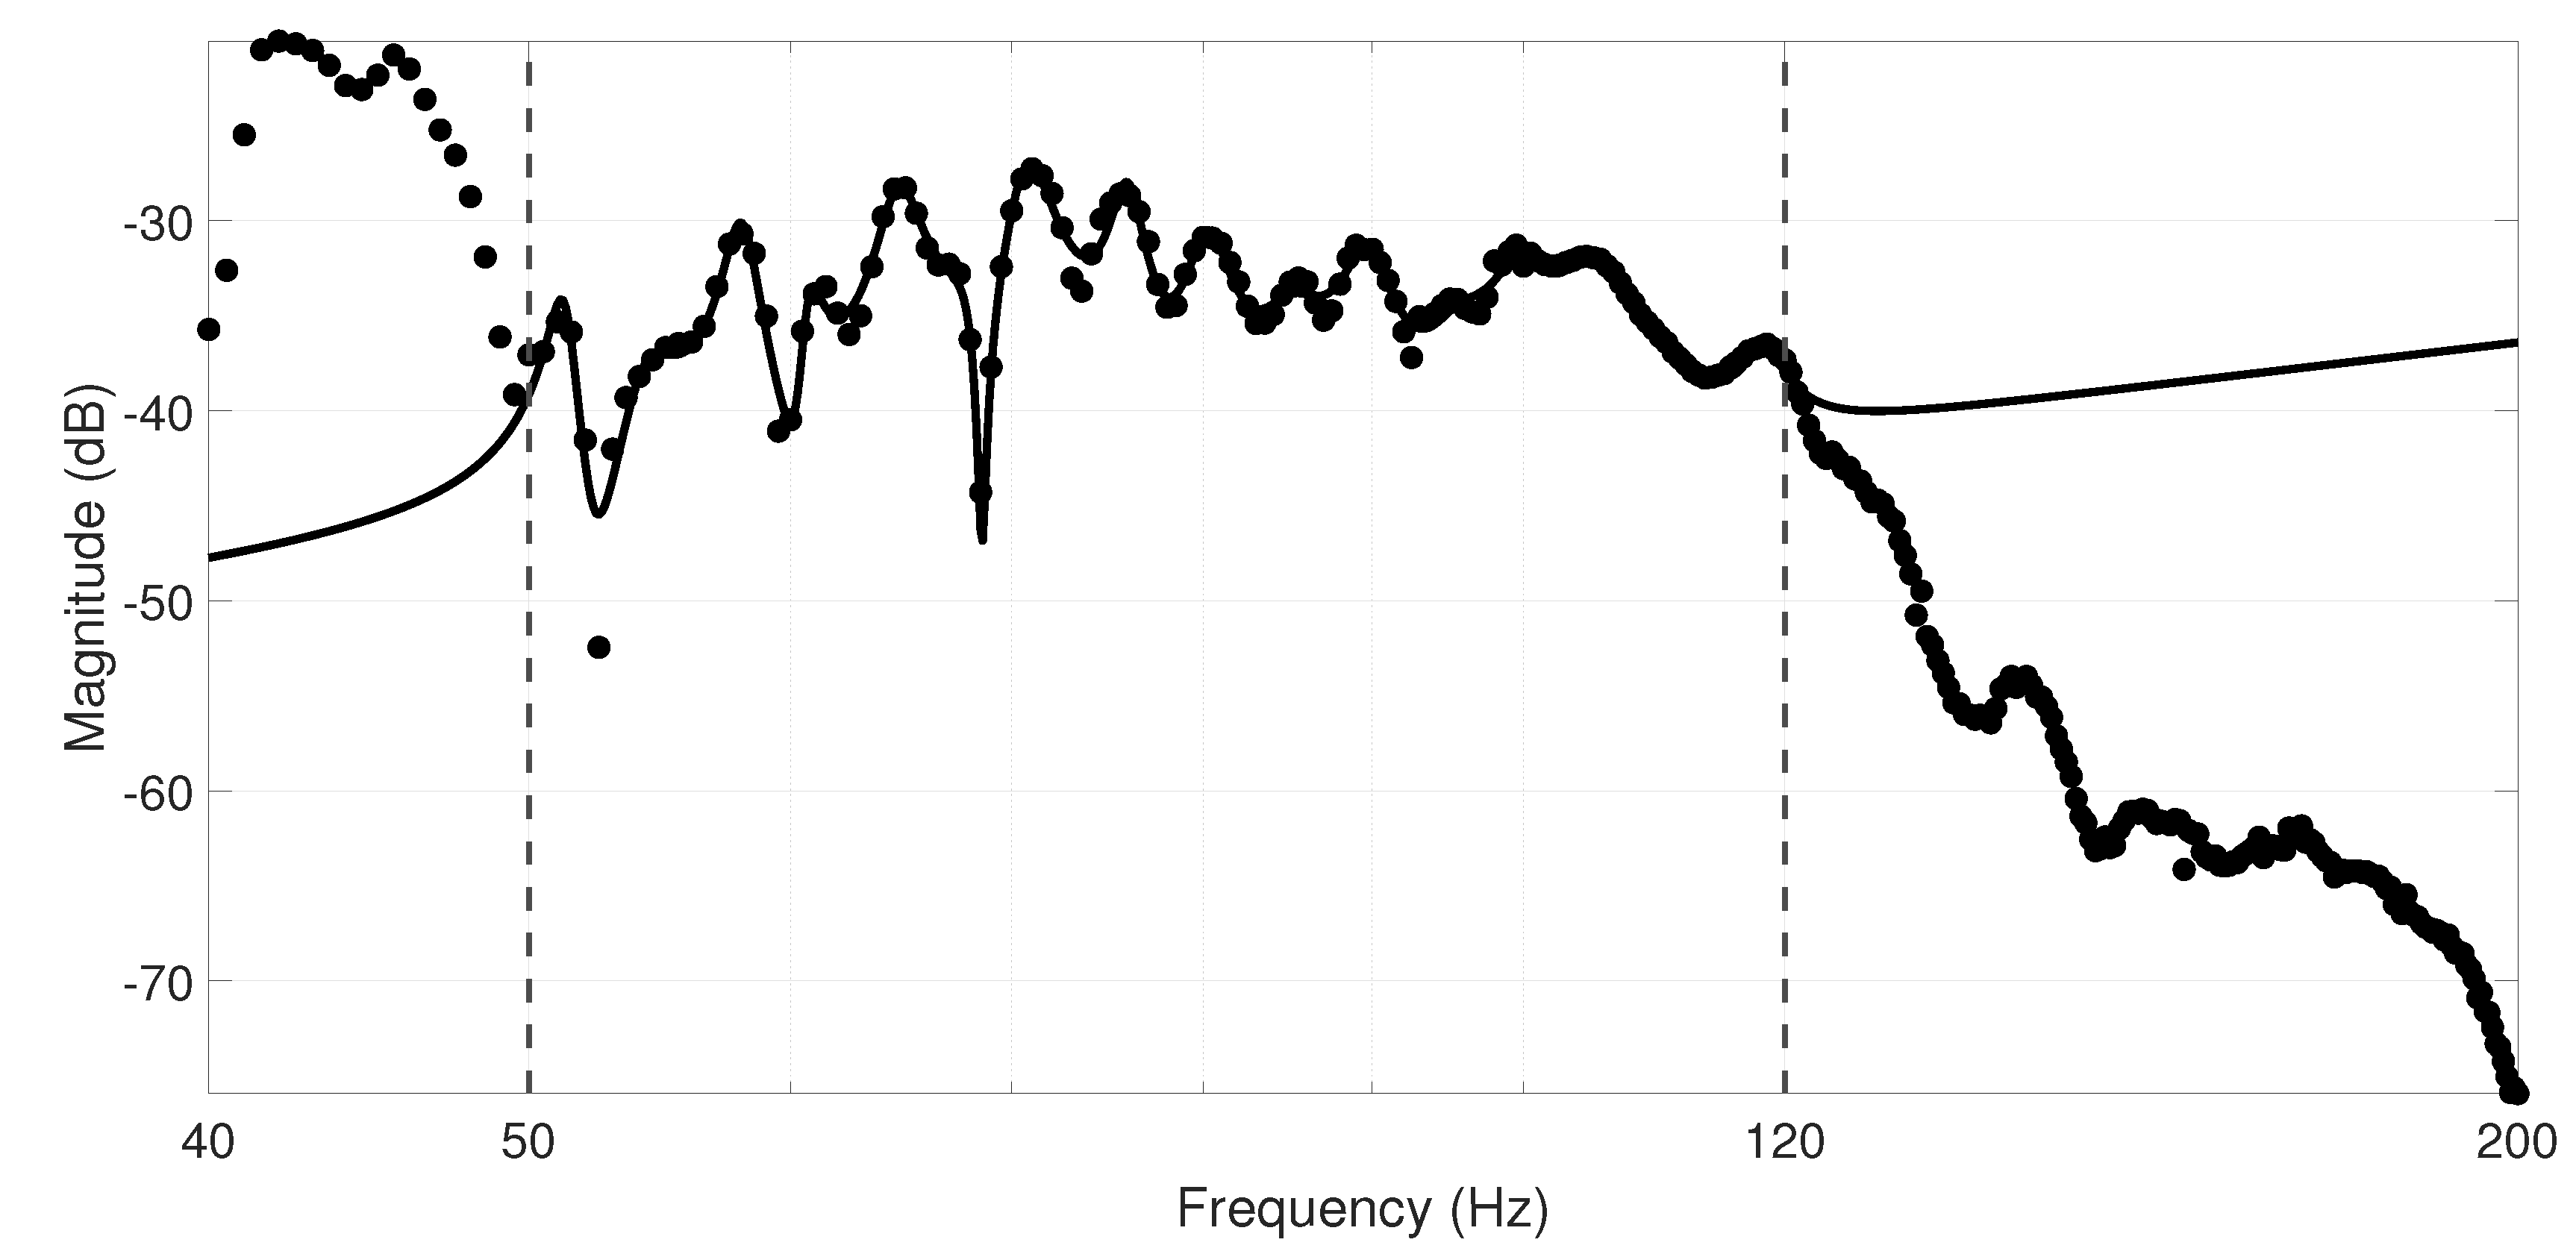
Figure 12.
Results of noise acquisition campaign from [21].
Figure 12.
Results of noise acquisition campaign from [21].
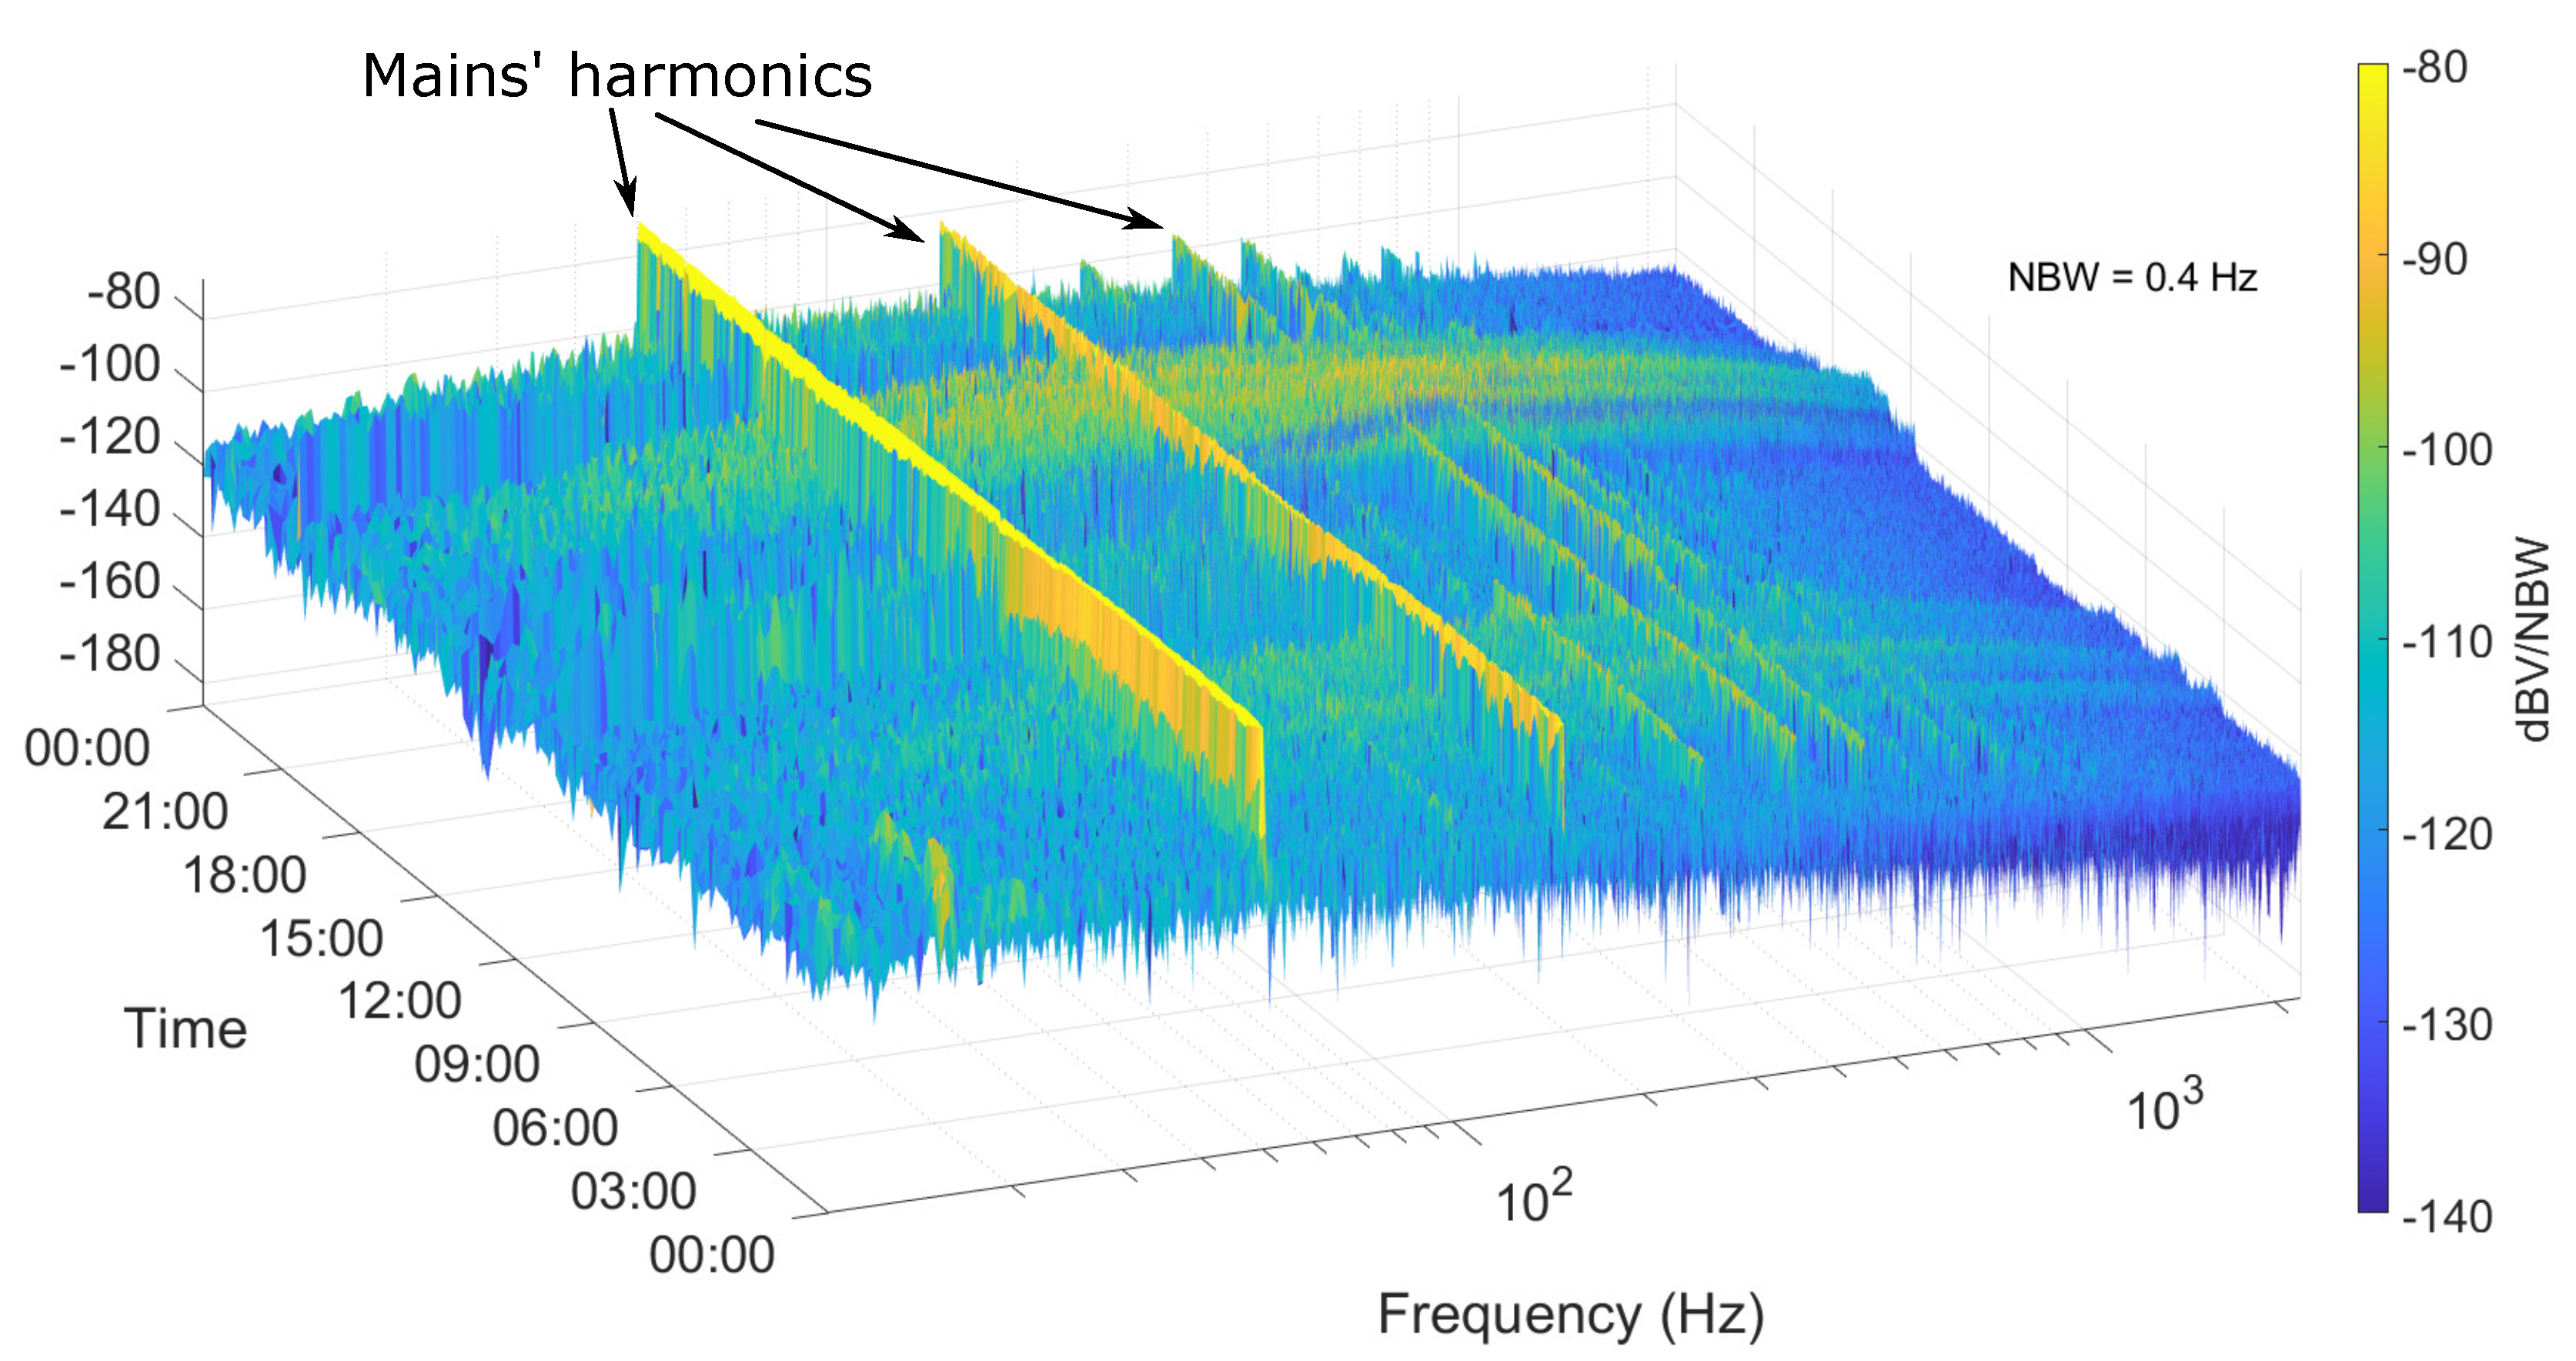
Figure 13.
Comparison between received signal and noise levels in the pipe. Signal trace is in dBV as it is measured in single tone conditions. Noise traces are amplitude densities and must be integrated over the desired bandwidth in order to provide absolute amplitudes. Each noise trace is identified by the acquisition time.
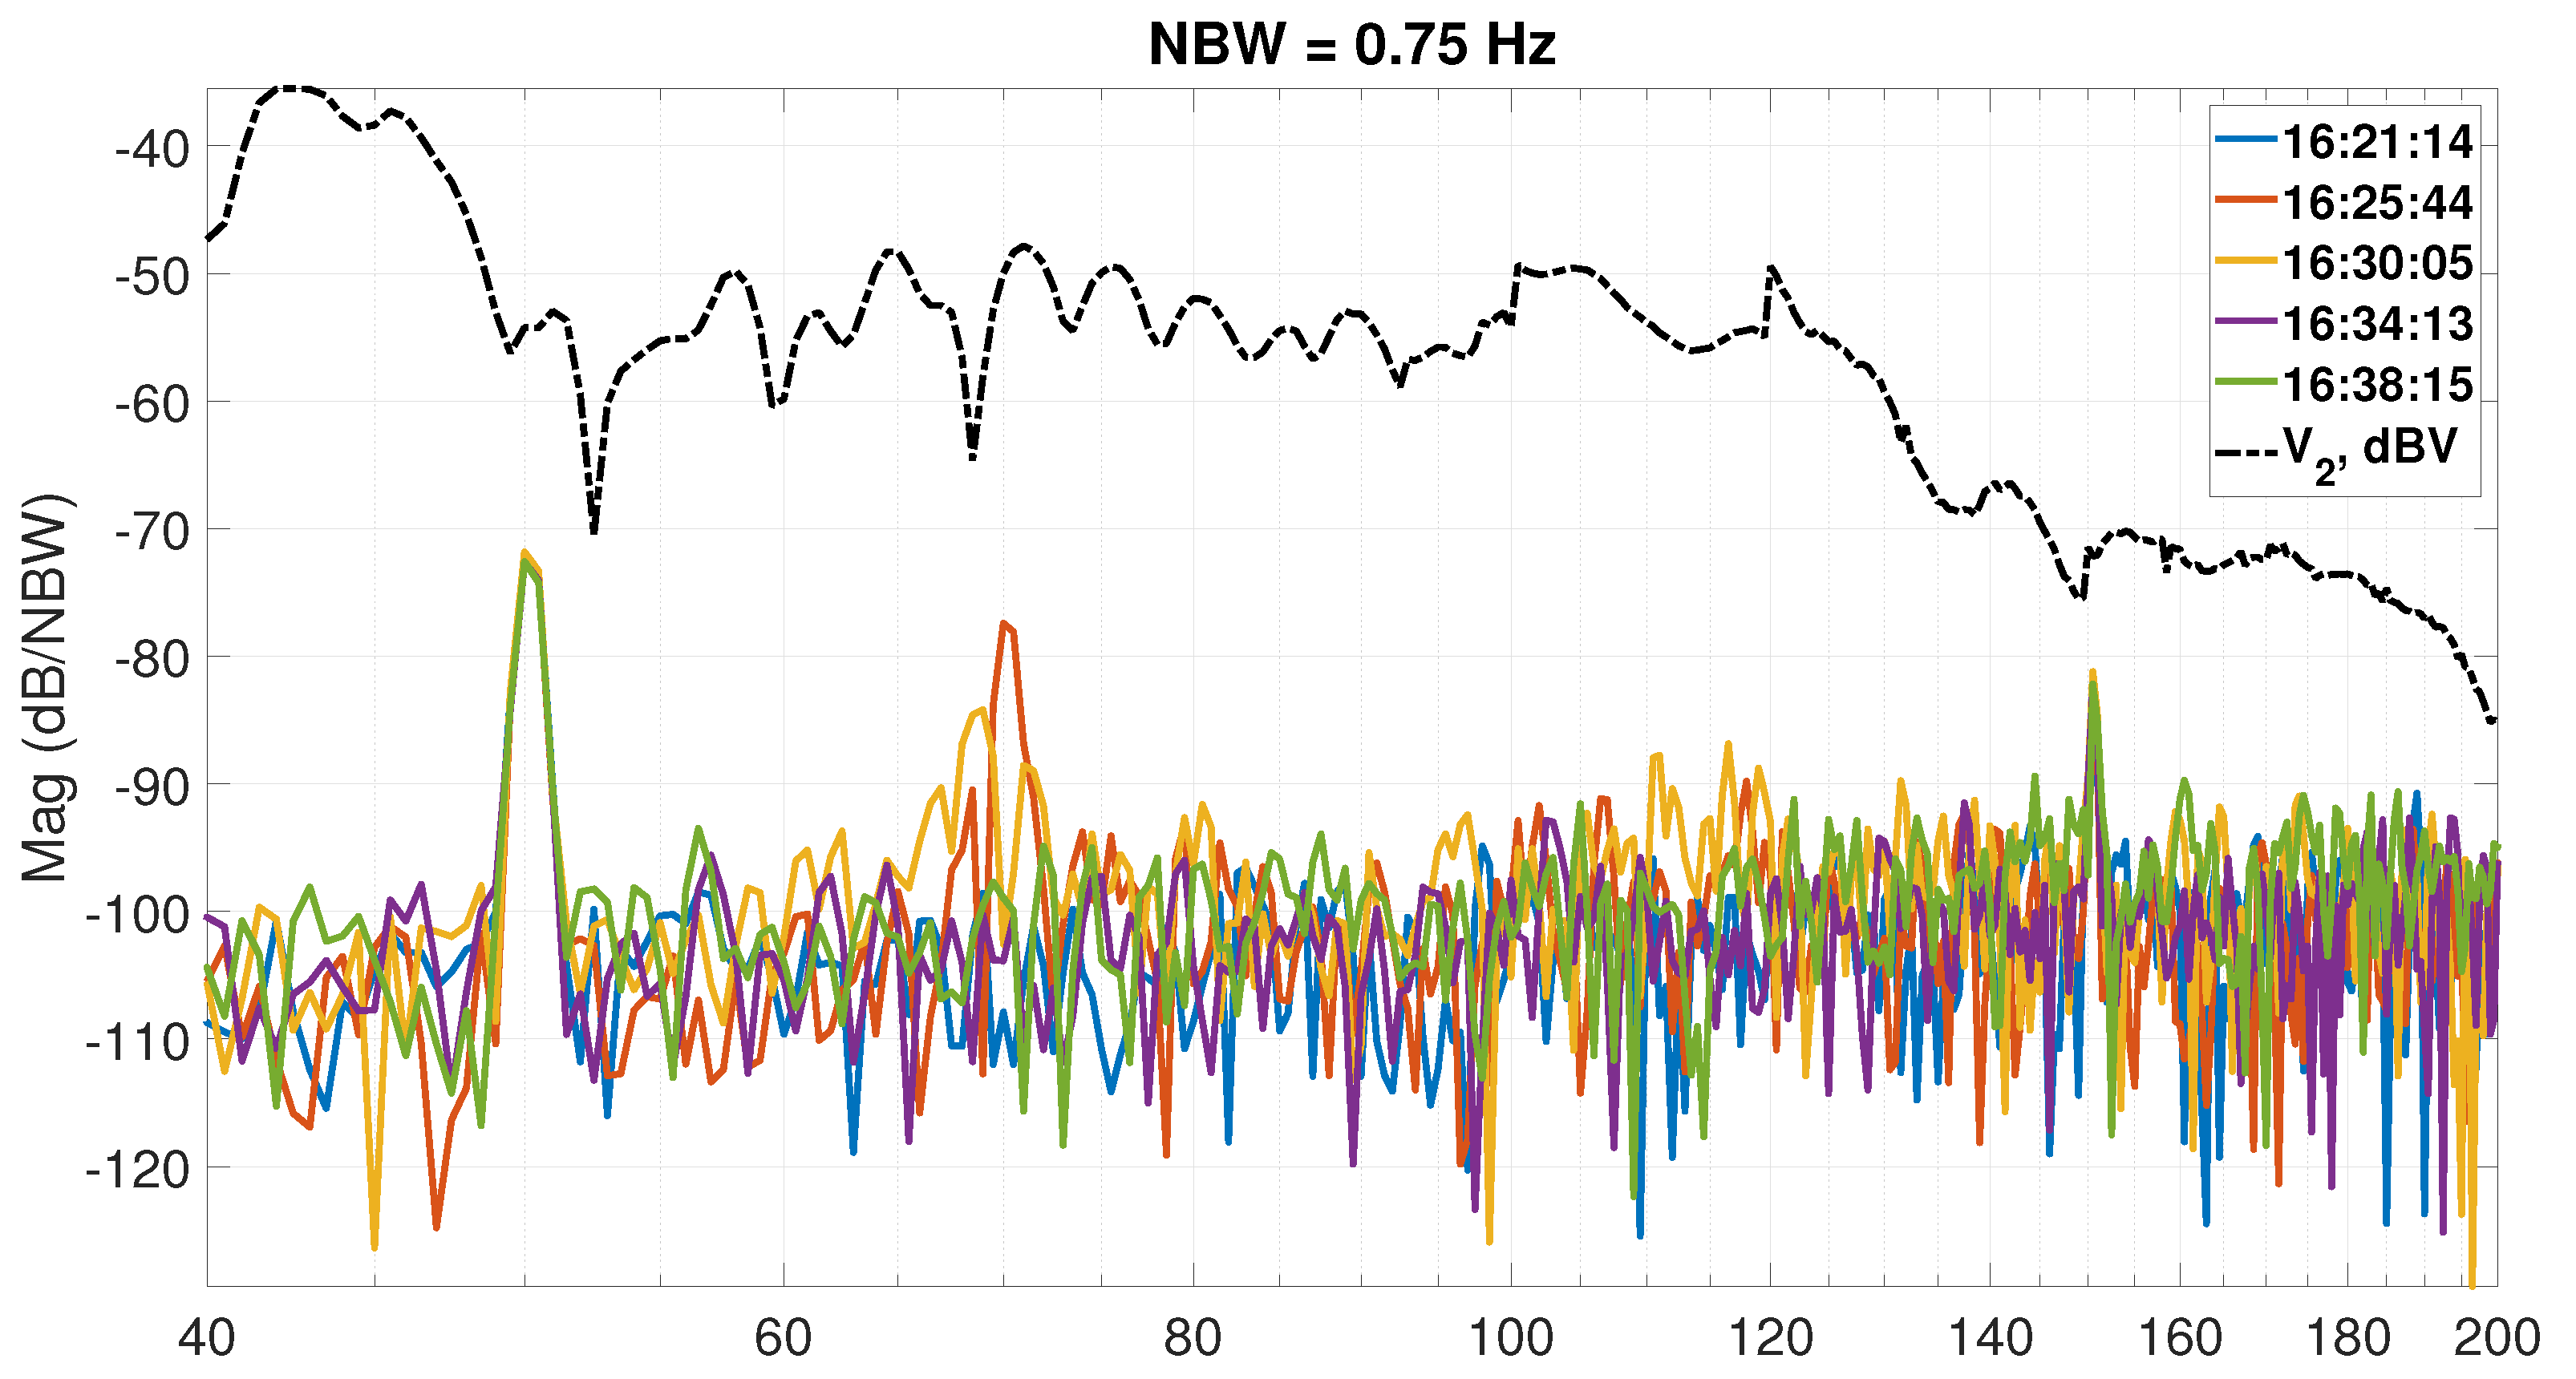

Table 1.
Existing smart water grids.
| Ref. | Deployed location |
Aim | Water quality sensors |
Hydraulic sensors |
Wireless protocol |
Nro. nodes |
Extension or distance |
|---|---|---|---|---|---|---|---|
| [33] | Singapore | leak detection, water quality monitoring, on-line hydraulic calibration, model-based prediction | pH, conductivity, temperature, ORP | pressure, hydrophone, flow | 3G | 10s | 80 km2 |
| [34] | laboratory | domestic water consumption monitoring | none | flow | Zigbee | 1 | 8.5 km |
| [35] | IIT Madras campus, Chennai, India | Remote water level monitoring and valve attuation | none | water level | LoRa and GSM | 5 | 1.6 km |
| [36] | Portion of UWSS in Shenzen, China | Water demand estimation without flow sensors | none | pressure | Zigbee | 24 | 130 m |
| [37] | Civil Eng. dept., Strovolos, Cyprus | multi-parameter decision system for leak detection and localization | none | pressure, hydrophone, flow | 433 MHz motes | 4 | 70 m |
| [38] | laboratory | real-time water quality monitoring | pH, conductivity, temperature, ORP | flow | Xbee | 1 | 20 m |
| [39] | laboratory | Domestic water consumption monitoring and leak alert | none | flow | WiFi | 1 | n/a |
| [40] | laboratory | Online water quality monitoring | pH, turbidity, conductivity, ORP temperature | flow | Zigbee | 1 | n/a |
| [41] | 160k people city in UK | Hydraulic model to optimize UWSS management | none | pressure, flow | GPRS | n/a | n/a |
| [42] | ten municipalities near Cordova, Spain | Detection and classification of incidents in water supply network | none | pressure | Sigfox | 8 | 600 km2 |
| [43] | Adelaide city center Australia | Leaks detection and localization | none | hydrophone | 3G | 305 | 6.2 km2 |
| [44] | India Institute of Science campus, Bangalore, India | Water distribution management, water level in tanks | none | water level | sub-1 GHz radio | 10 | 1 km |
Disclaimer/Publisher’s Note: The statements, opinions and data contained in all publications are solely those of the individual author(s) and contributor(s) and not of MDPI and/or the editor(s). MDPI and/or the editor(s) disclaim responsibility for any injury to people or property resulting from any ideas, methods, instructions or products referred to in the content. |
© 2023 by the authors. Licensee MDPI, Basel, Switzerland. This article is an open access article distributed under the terms and conditions of the Creative Commons Attribution (CC BY) license (http://creativecommons.org/licenses/by/4.0/).
Copyright: This open access article is published under a Creative Commons CC BY 4.0 license, which permit the free download, distribution, and reuse, provided that the author and preprint are cited in any reuse.


