
Submitted:
22 August 2023
Posted:
24 August 2023
You are already at the latest version
Abstract
Deficiency, with its two constituents of protein-energy deficiency and micronutrient deficiencies, remains a substantial health burden in underdeveloped nations. It is the largest cause of sickness and death worldwide, particularly harming hundreds of millions of small children and pregnant women. In order to improve the protein-energy and micro- macro needs of developing countries, food products made from compositing flours are required. Ethiopian injera is a fermented, leavened flatbread produced primarily from teff flour. However, when compared to teff injera, injera made from sorghum flour and its blend has been found to have textural flaws. Uncontrolled staling of sorghum flour incorporated teff injera resulted in limited softness, freshness, rollability, brittleness anddryness which create big problems during storage. Due to its numerous health advantages and nutritional worth, fenugreek is regarded as a key functional food element. As a result, this study was conducted to identify the regression equation of injera formulations and optimise the teff, sorghum, and fenugreek flour blending ratios that result in injera with higher quality properties. Using mixture design methods and a D-optimal design, the effects of blending flour ratios on injera quality were examined. Teff flour alone injera was used as the control. Fourteen injera formulations were created using limited mixtures of teff (50-100%), sorghum (0-50%), and fenugreek (0-5%). Proximate, staling rate, mineral, antinutritional components, and sensory qualities were all taken into account as response variables in this study. The study's findings showed that increasing the proportion of fenugreek flours in injera made from teff-sorghum-fenugreek mixing ratios improved nutritive values, improved sensory appeal, textural characteristics and reduced staling rate. Generally speaking, the best injera blending ratio was found to be 64.1% teff, 32% sorghum, and 3.80% fenugreek in terms of overall qualitative qualities.
Keywords:
malnutrition
; antinutrients
; staling
; fenugreek
; sorghum
; teff
; injera
1. Introduction
Protein-energy malnutrition, and micro- macro nutrients malnutrition are the most serious public health issues in many developing countries, particularly in Africa (Rizwana et al., 2015). It is a significant burden because it is linked to poor health and physical function. Increasing the amount of dietary protein and micro- macro nutrients in staple foods is critical. Composting readily available, and highly nutritious foods provides an inexpensive way of preventing and alleviating this condition. Cereals are known to be high in carbohydrates and dietary fiber, while have a low protein content. In order to improve the protein-energy and micro- nutrient demand of emerging nations, food products made from compositing cereals and legumes are required.
The injera, a traditional leavened bread from Ethiopia that is fermented, soft, and round with eyes on the top surface due to carbon dioxide (CO2) production during fermentation and baking (Yetneberk et al., 2005; Bultosa et al., 2002; Girma et al., 2013). Teff (Eragrostis tef (Zucc.) Trotter) is a small cereal grain that is high in essential nutrients than common cereal grains (wheat, barley, sorghum, maize, and rice) due to its utilization as whole grain (Yetneberk et al., 2004; Abraha & Abay, 2017) and its out performs other cereal grains in the production of injera, which the majority of Ethiopians enjoy and eat on a daily basis (Bekabil et al., 2011). Teff is advised for celiac patients due to its lack of gluten and excellent potential as a functional meal. It's high in B-vitamins and minerals, and it has larger quantities of critical amino acids than wheat and barley, making it a great source of those nutrients (Bultosa, 2016). Depending on availability and abundance, injera can be made from a variety of cereals, including teff, barley, sorghum, maize, and wheat, or a combination of some of these cereal flours (Bultosa, 2007).
Teff, on the other hand, is less accessible and affordable to all members of the country's society and thus is primarily consumed in metropolitan areas with greater household incomes (Berhane et al., 2011). As a result, currently, most of the Ethiopians cannot afford to prepare injera made from teff alone, and even in the foreseeable future one cannot expect the reduction in teff price. Thus, encouraging the already started partial substitution of teff by affordable and abundant cereals is necessary to reduce the current food problems in Ethiopia.
Like other grains, sorghum (Sorghum bicolor L. Moench) is a great source of protein and starch and is the main source of food for a sizable portion of the population in semi-arid tropical areas. It is a gluten-free grain, which is important in today's world, where the prevalence of celiac disease, an immune response to gluten intolerance, is on the rise. Sorghum mix flour injera recipe, on the other hand, has poor injera-making qualities, such as staling and fragile texture during storage (Kebede, 2018). The uncontrolled staling of sorghum injera resulted in limited softness, freshness, rollability, brittleness and dryness which create big problems during storage. Study carried out by Yetneberk et al. (2005) reported that a good injera could be prepared from teff-sorghum mix with the ratio of 50:50 and the authors came at the conclusion that injera quality continued to improve as the composite's teff flour content surpassed 50%. However, there is limited research reports on the value addition of sorghum flour mix injera. Given that fenugreek (Trigonella foenum-graecum L.) offers a variety of health advantages in addition to nutritional value, it is regarded as a primary functional food ingredient. Fenugreek acts as a fortified component, plasticizer, providing the necessary uniformity of the dough, the elasticity of the crumb, reducing the rate of staling, and improving the nutritional value of baked products. It also contains carminative, analgesic, antipyretic, anticancer, and antioxidant qualities, in addition to anti-diabetic, anti-fertility, antibacterial, antiparasitic, and antileptic characteristics, according to Chauhan et al. (2011). The seeds have good levels of protein (26.2%), carbs (44.1%), fibres (7.2%), and minerals (3%), as well as alkaloids (trigonelline and choline), while having low levels of fixed & volatile oil, mucilage, saponin, foetid, and nicotinic acid (Bhajbhuje, 2013). Fenugreek also contains large amounts of a variety of derived metabolites, including as tannins, terpenoids, alkaloids, and flavonoides, which have been demonstrated in vitro to have antimicrobial effects. Phenolic compounds aid plants in warding off bacteria, viruses, fungi, and insects in addition to signalling molecules, tastes, and colours that can attract or repel pests (Ranpariya and Chudasama, 2010).
The incorporation of fenugreek in teff-sorghum is either for improving baking quality, sensorial quality and organoleptic properties or shelf life. Several studies shown injera made cereal flours enriched with fenugreek improves the injera's protein composition and sensory attributes (Yigzaw et al., 2004; Godebo et al., 2019).
Due to these probems touched above, the need for mixing sorghum with teff and fenugreek is increasing more and more than ever before. However, for the required quality attributes of injera, the blending of these cereal flours must be at the right proportion, which optimization needs work. In order to improve the qualitative features of injera derived from these cereals, this research aims to identify the regression equation of injera formulation and the ideal mixing ratio of teff, sorghum, and fenugreek flours.
2. Materials and Methods
2.1. Sample collection and Preparation
Experimental materials used for laboratory analysis consisted of sorghum (variety Melkam), fenugreek (variety Burka), and teff (variety Boni) seeds were obtained from Melkassa, Kulumsa, and Debre Zeit agricultural research centers, EIAR, Ethiopia, respectively grown in the main season 2021/2022. These grain verities are reported to have high yield per unit area, have relatively good disease resistance and have been released, recently, for mass production. Because of the abundance of different varieties of sorghum, fenugreek, and teff, these study sites were chosen to obtain pure breed. The samples were manually cleaned, sorted and milled. Teff and sorghum were grounded using a Perten laboratory mill (PM 120, Finland) while fenugreek was grounded using a coffee grinder mill (XFYC810, China) and sieved using a fine sieve of size 0.50 mm. Then the corresponding flours were packed separately in dry polyethylene bags and store in a dry area until further analysis carried out. The laboratory activities were conducted at food science and nutrition research laboratories of Kulumsa, Melkassa and Debrezeit Agricultural research centers, EIAR head quarter quality research laboratory and Addis Ababa University in the Centre for Food Science's lab & nutrition, and department of applied chemistry.
2.2. Experimental design and Composite flour formulation
A D-optimal mixture design with three factors and two levels was employed. At the Melkassa Agricultural Research Center, the maximum and minimum values of independent variables were first evaluated by performing a preliminary study.The three independent variables (factors) used were teff flour (X1:A) in the range 50 to 100%, sorghum (X2:B) in the range of 0 to 50% and fenugreek (X3:C) in the range 0 to 0.5% and the dependent variables (responses) were proximate composition, mineral, antinutritional factors, staling rate, alkaline water retention capacity and sensorial attributes.
To reduce residual errors, the expanded design (Table 1) was employed to reproduce vertices and binary mixes at the edges. That is, the greatest coded value of the other two mixture components added to the smallest coded value of the first component of the combination equals one. The greatest coded value of the other two combination components added to the largest coded value of the first component also equals one.
To create test formulations and analyze the results, the software design expert version 13.0.5.0 was used. Fourteen (14) baking trials - with six for model points, four for lack of fit estimation, and four replicates in random order are created and the responses parameters were evaluated (Table 2). In order to determine the link between the dependent variable (Y) and the independent variable (X), a second order polynomial model of the following form was fitted:
where: β0, β1–β3, β11–β33 and β12–β23 are the regression coefficients of the respective variables (for interception (constant), linear, quadratic) and interaction coefficients respectively, X1–X3 are coded independent variables, X1X2–X2X3 are interaction regression, 𝟄 is an error term ad Y is the responses.
Y = β0 + β1X1 + β2X2 + β3X3 + β11X12 + β22X22 + β33X32 + β12X1X2 + β13X1X3 + β23X2X3 + 𝟄

Table 1.
Coded values with levels and design constraints are used in D-optimal mixture designs.
| Level | Constraints | |
|---|---|---|
| low | high | |
| 0.50 | 1.00 | 0.5 ≤ X1 = A: teff ≤ 1.00 |
| 0.00 | 0.50 | 0 ≤ X2 = B: sorghum ≤ 0.50 |
| 0.00 | 0.050 | 0 ≤ X3 = C: fenugreek ≤ 0.050 |
| Total = X2 + X3 = 0.50; X1 + X2 + X3 = 1.00 | ||
The formulation for the teff, sorghum, and fenugreek-containing flour composite blends is provided in Table 2. On the basis of a limited mixture D-optimal design, these formulations were created. Each dry ingredient was blended consistently to homogenise it before being placed in a clean, tight-fitting plastic container and maintained at room temperature (25 ± 2 °C) until it was used. Among these 14 trails, the trail 1 and 10, 2 and 12, 3 and 5, 13 and 14 are similar.
Table 2.
D-optimal coded design for injera preparation from teff, sorghum and fenugreek.
| Formulation/TRIAL/ | Xi = Factors (Independent variables) | Yi = Responses (dependent variables) | ||
|---|---|---|---|---|
| X1 = A: Teff | X2 = B: sorghum | X3 = C: fenugreek | Proximate, mineral, Antinutrient, pH, sensory quality, and staling | |
| T1 | 0.95 | 0.00 | 0.05 | |
| T2 | 1.00 | 0.00 | 0.00 | |
| T3 | 0.75 | 0.25 | 0.00 | |
| T4 | 0.87 | 0.12 | 0.01 | |
| T5 | 0.75 | 0.25 | 0.00 | |
| T6 | 0.84 | 0.12 | 0.04 | |
| T7 | 0.62 | 0.37 | 0.01 | |
| T8 | 0.73 | 0.24 | 0.03 | |
| T9 | 0.62 | 0.34 | 0.04 | |
| T10 | 0.95 | 0.00 | 0.05 | |
| T11 | 0.50 | 0.45 | 0.05 | |
| T12 | 1.00 | 0.00 | 0.00 | |
| T13 | 0.50 | 0.50 | 0.00 | |
| T14 | 0.50 | 0.50 | 0.00 | |
2.3. Preparation of fermented dough and baking
The injera were made using the traditional teff dough preparation method. (Abraha & Abay 2017; Leykun et al., 2020) with minor modification. For each formulated composite flour weighed (200 g) + water (180 mL) + 16% ersho (yellow like liquid accumulated at the top of batter created during fermentation) were added and knead properly for about 5 minutes. To avoid contamination, the ersho was produced from the flour used for analysis. The fermentation process of the resulting batter was carried out at room temperature in a closed container (plastic bowl) and proceeded in two stages: the first stage of fermentation was held for 72 hrs. After adding ersho which used as a starter culture. After the first stage of fermentation, the yellowish liquid that is present on the dough's surface was runoff and about 25% of the fermented dough (paste) was thinned with boiled water for 3-5 min. This formed thinning of fermented batter with water is called “Absit” which used for subsequent fermentationa (left for 30min-1hr.) and baked on an electrically heated circular clay based gridle called Mitad (traditional oven) to get ‘injera.’ In such a way that injera was baked for each fourteen formulated composite flours.
2.4. Determination of proximate composition
2.4.1. Moisture content
The moisture content of the samples was evaluated using eqn. (1) from the Association of Official Analytical Chemistry, AOAC (2000), method 925.10 by drying 2.5 g of injera sample in an oven at 105 °C for 1 hour.
where W1 is the weight of the crucible, W2 is the starting weight of the sample, and W3 is the final weight of the sample after drying.
2.4.2. Total ash
The ash content of injera which literally measures the mineral composition of the injera was determined using eqn. (2) according to the Association of Official Analytical Chemistry (200) using the method 923.03 by taking about 2.5 g sample (in duplicate) after carbonization and ignition at 550 °C for 3 hours in the muffle furnace (Nobertherm, Germany).
where W1: the weight of the ash+ crucible after ashing, W2: the weight of the empty crucible, and W: the weight of the sample.
2.4.3. Fat content
The AOAC (2000) official method 4.5.01 was used to calculate crude fat. In the soxhlet extractor, 2 g of injera sample (in duplicate) was extracted with 50 mL petroleum ether or diethyl ether for a minimum of 4 hours. The solvent was then removed, and the extracted fat was baked and chilled in a desiccator. The crude fat was calculated using Equation (3).
where W1: weight of the extraction flask, W2: weight of the extraction flask plus the dried crude fat, and Sw: weight of the sample.
2.4.4. Crude fiber content
The crude fibre content of the injera samples was evaluated using eqn. (4) and the Association of Official Analytical Chemistry (AOAC) (2000) method 962.09. Fresh injera samples of 2 g (in duplicate) (W3) were placed in a 660 mL beaker, and 200 mL of 1.25% sulfuric acid was added before gently boiling for 30 minutes. After 30 minutes, 20 mL of 28% KOH was added and gently cooked for another 30 minutes, with periodic stirring. A sintered glass crucible's bottom was covered with a 10 mm sand layer and wetted with distilled water. The solution was put into a sintered glass crucible and vacuum filtered (High performance vacuum pump, Robin Air method, SPX Corporation, Monteplier, USA). The beaker wall was cleaned multiple times with hot distilled water; the washings were transferred to the crucible and filtered. The crucible residue was rinsed with hot distilled water and filtered twice. The residue was then transferred to a crucible cup, dried for 2 hours at 130 °C in an oven, chilled for 30 minutes in a desiccator, and weighed (W1). The crucible was weighed after cooling in desiccators (W2).
where W1 is weight of crucible containing the sample after drying; W2 is weight of crucible with sample after ashing; W3 is fresh sample weight.
2.4.5. Determination of crude protein
The Kjeldahl method was used to quantify protein content in accordance with AOAC (2000) using the recognised method 920.87. A sample of 0.5 g of dried injera flour was obtained, mixed with 6 mL of an acid mixture (ortho-phosphoric acid and concentrated sulfuric acid), and then gradually added 3.5 mL of 30% hydrogen peroxide. After that, 3 g of the catalyst solution—0.5 g of selenium metal and 100 g of potassium sulfate—was poured to several test tubes, and they were let to stand for around 10 minutes. The digestion was then permitted to continue until a clear solution was attained. De-ionized water was added in a quantity of around 25 mL, and the mixture was agitated to prevent sulphate precipitation. To begin the distillation process, pour 25 mL of boric acid and 25 mL of distilled water into a 250 mL conical flask. The digested solution was transferred to the distiller's sample container. A 35% sodium hydroxide solution (40 mL) was added to the digested and diluted solution. The distillation process was repeated for 9 minutes until a total volume of 200 mL to 250 mL was obtained. Finally, 0.1 N hydrochloric acid was used to titrate the distillate until a reddish colour developed. After calculating the Nitrogen% from the titration method, the crude protein was determined using eqn. (5).
Protein (%) = 6.25 × %Nitrogen
2.4.6. Utilizable carbohydrate
The developed injera's carbohydrate content was calculated by the method of difference according to Fitsum et al. (2019) that is carbohydrate (%) = 100 − [Moisture (%) + Protein (%) + Fat (%) + Ash (%)]
2.4.7. Gross food energy
The difference approach was used to compute the gross energy and Atwater's conversion factors (FAO, 2002). Energy (kcal/g) = (%carbohydrate − %crude fiber) × 4 + (%crude fat × 9) + (%crude protein × 4)
2.5. Determination of mineral (Fe, Zn and Ca)
Using eqn. (6) and data from a flame atomic absorption spectrophotometer, the samples' iron, zinc, and calcium concentrations were computed (Model No. AAS-700, Perkin Elmer) process of each formulated injera sample employing the standard AOAC, (2000) method 985.35. After obtained ash using eqn. (2), in a 50 mL volumetric flask, a blank solution was made using the same method as for the minerals reading. Then sample reading was conducted. Preparation of standard solutions: Six sets of working standard metal solutions (0.0, 0.5, 1, 1.5, 2.0, and 2.5 ppm for Ca, and 0.0, 0.5, 1.0, 2.0, 3.0 and 4.0 ppm for Fe & 0.000, 0.125, 0.250, 0.500, 0.750, and 1.000 for Zn) of the metal stock solution was properly diluted to prepare the minerals (nitrate of the metal) with deionized water in 10 mLvolumetric flask. Calibration curve (concentration vs. absorbance) for each element were derived using the absorbance process. Finally, the mineral element content was calculated as follow:
where, W is weight of sample on a dry matter basis, V is volume of extract in liters, A: is concentration (mg/L) of sample solution, B is Concentration (mg/L) of blank solution and Df is Dilution factor (50 mL for Ca, Fe and Zn).
2.6. Determination of anti-nutritional factors
2.6.1. Condensed tannin content
The condensed tannin was evaluated using vanillin-HCL assay methods and a UV spectrophotometer, as described by Burns (1971) and revised by Maxson and Rooney (1972) grain chemistry. A gram of sample was measured in a screw cap test tube, and 10 mL of 1% HCl in methanol was added to the tube holding the material to be tested. The sample-containing tube was shaken for 24 hours at room temperature using a mechanical shaker (KS501 digital, ink laboratory CHNIK). The tube was then centrifuged for 5 minutes at 1000 rpm. In another test tube, an mL of supernatant was combined with 5 mL of vanillin-HCl. Finally, the specimen was left to sit for 20 minutes to allow the reaction to complete before measuring the absorbance of the coloured intensity of the sample with a UV-visible spectrophotometer at 500 nm.
Preparation of standard solutions: A 40 mg D-catechin reference was mixed in 1000 mL of 1% HCl solution in methanol, and standard solutions (0, 0.2, 0.4, 0.6, 0.8, and 1 mL) were taken in test tube. The absorbance of standard solutions was determined at 500 nm with a UV-VIS Spectrophotometer following 20 minutes. The D-catechin calibration was utilised to quantify the concentration of condensed tannins. The Tannin content was further evaluated as follows:
where, As: absorbance of sample solution, Ab: the blank absorbance, Int.: intercept from the absorbance equation curve, D: density of solution (0.791 g/mL), and W: weight of the sample in gram, and 10 is the aliquot.
2.6.2. Phytate content
Phytate was determined by a Modified colorimetric method (Marolt and Kolar, 2020). About 0.5 g of samples (in duplicates) was taken in 15 mL centrifuge tubes and 10 mL of 2.4% (0.64 N) HCl was added and mix vigorously with vortexer, and shaked mechanical shaker (KS501 digital, ink laboratory CHNIK) at 300 rpm for 16 hours at room temperature. The materials were then centrifuged for 20 minutes at 3000 rpm. The supernatant was filtered through Whatman grade 1 filter paper into tubes containing previously weighed NaCl and carefully mixed on vortex to dissolve the salt. One millilitre of supernatant was placed in a 25 millilitre volumetric flask and diluted to the desired level with deionized water. One millilitre (1 mL) of the reagent (0.03% solution of FeC13·6H2O in water containing 0.3% sulfosalicylic acid) was mixed into 3mL of the diluted sample. Finally, the read absorbance of the colour response was measured in a spectrophotometer at 500 nm wavelength, and the spectrophotometer was zeroed using pure water.
Preparation of standard solutions: Seven typical solutions with 5-40 mg/mL phytic acid in 0.2 M Hcl were created. The standard concentrations were (0, 1, 4.5, 9, 18, 27, and 36) ppm. 3 mL of the standard was pipetted into 15 mL centrifuge tubes, along with 3mL of distilled water as a blank. The solution was then mixed for 5 seconds on a vortex mixer with 1 mL of the wading reagent. The combination was centrifuged at 3000 rpm for 10 minutes, and the supernatant was measured at 500nm using a UV spectrometer with distilled water as a blank.
where As: absorbance of sample solution, Ab: the blank absorbance, Int.: intercept from the absorbance equation curve, D: density of the solvent and W: weight of the sample in gram
2.7. Determination of staling rate and alkaline water retention capacity
The alkaline water retention capacity (AWRC) of samples were determined using eqn. (9) as modified by Licciardello et al. (2014). A reagent containing 0.1N sodium bicarbonate (NaHCO3) solution was prepared by dissolving 8.4 g sodium bicarbonate in 1 liter water. The AWRC was determined by weighing 1g (in duplicate) of samples of in 15 mL tubes (W1), was added, then 5 mL of 0.1 N NaHCO3 was added, mixed, and left at room temperature for 20 minutes. The slurry was centrifuged for 15 minutes at 3000 rpm, the supernatant was discarded, and the tubes were left to drip upside down for 10 minutes. After that, the dried tubes were weighed (W2).
where W1: weight of tube containing the dry sample; W2: weight of tube containing the dripped sample. Then staling rate is calculated as follows:
where AWRC0 denotes AWRC at zero time and AWRCn denotes AWRC on a certain storage day.
2.7.1. pH
A digital pH meter (pH-013 High Accuracy Portable pH Meter) was used to determine the pH of the specimens. The pH metre was adjusted using standard buffering solutions at pH 4 and 7, and each injera suspension (a well homogenised mixture of 10 g ground injera and 100 mL distilled water) was determined (Parra et al., 2010).
2.7.2. Sensory attributes
A preliminary sensory acceptability test of injera was performed in order to figure out the greatest acceptable limit of sorghum-teff-fenugreek substitution level in the injera producing process. The sensory analysis of injera samples was conducted out by 32 semi-trained panellists from Melkassa Agricultural Research Centre, who varied in age from 24 to 35. The samples were tested following Zewdu et al. (2018) procedures for softness, stickiness, rollability, sourness, bitterness, color, odour, flavor, injera eyes, and overall sensory acceptability parameters using a seven-point hedonic scale with the crateria: 1=dislike extremely and 7=like extremely.
2.8. Statistical analysis and optimization
To establish the level of significance within means, Duncan's Multiple Range test (IBM SPSS statistical software package, version 23.0) was used. In each response, the reliability of the terms in the regression equations was tested using analysis of variance, with the significance test level set at 5% (p < 0.05).
Design-Expert was used to produce formulation tests, best-fit regression models of responses, build contour plots, response surface plots, overlaid plots, and optimise the results. Using the Design-Expert®, TM version 13.0.5.0 software (State Ease Inc.), both numerical and graphical optimisation techniques were used with a requirement of lowest teff while sorghum and fenugreek were left in ranges.
2.9. Model validation
The product was created utilising the optimised ingredient formulation to confirm the D-optimal design. To verify the accuracy of the estimation capacities, the baked product's fat, fibre, protein, energy, iron, zinc, and calcium content were examined empirically once once again. The expected responses from the design expert software were compared to the observed data. The outcomes will be verified via relative standard error:
3. Results and Discussion
3.1. Proximate composition of the formulated injera
Moisture, total ash, crude fiber, crude fat, crude protein, carbohydrate content and energy of all formulated injera are presented in Table 3. Except for moisture content, all properties are stated on a dry basis (% DM) while moisture is expressed on wet basis (Wb).
3.1.1. Protein content
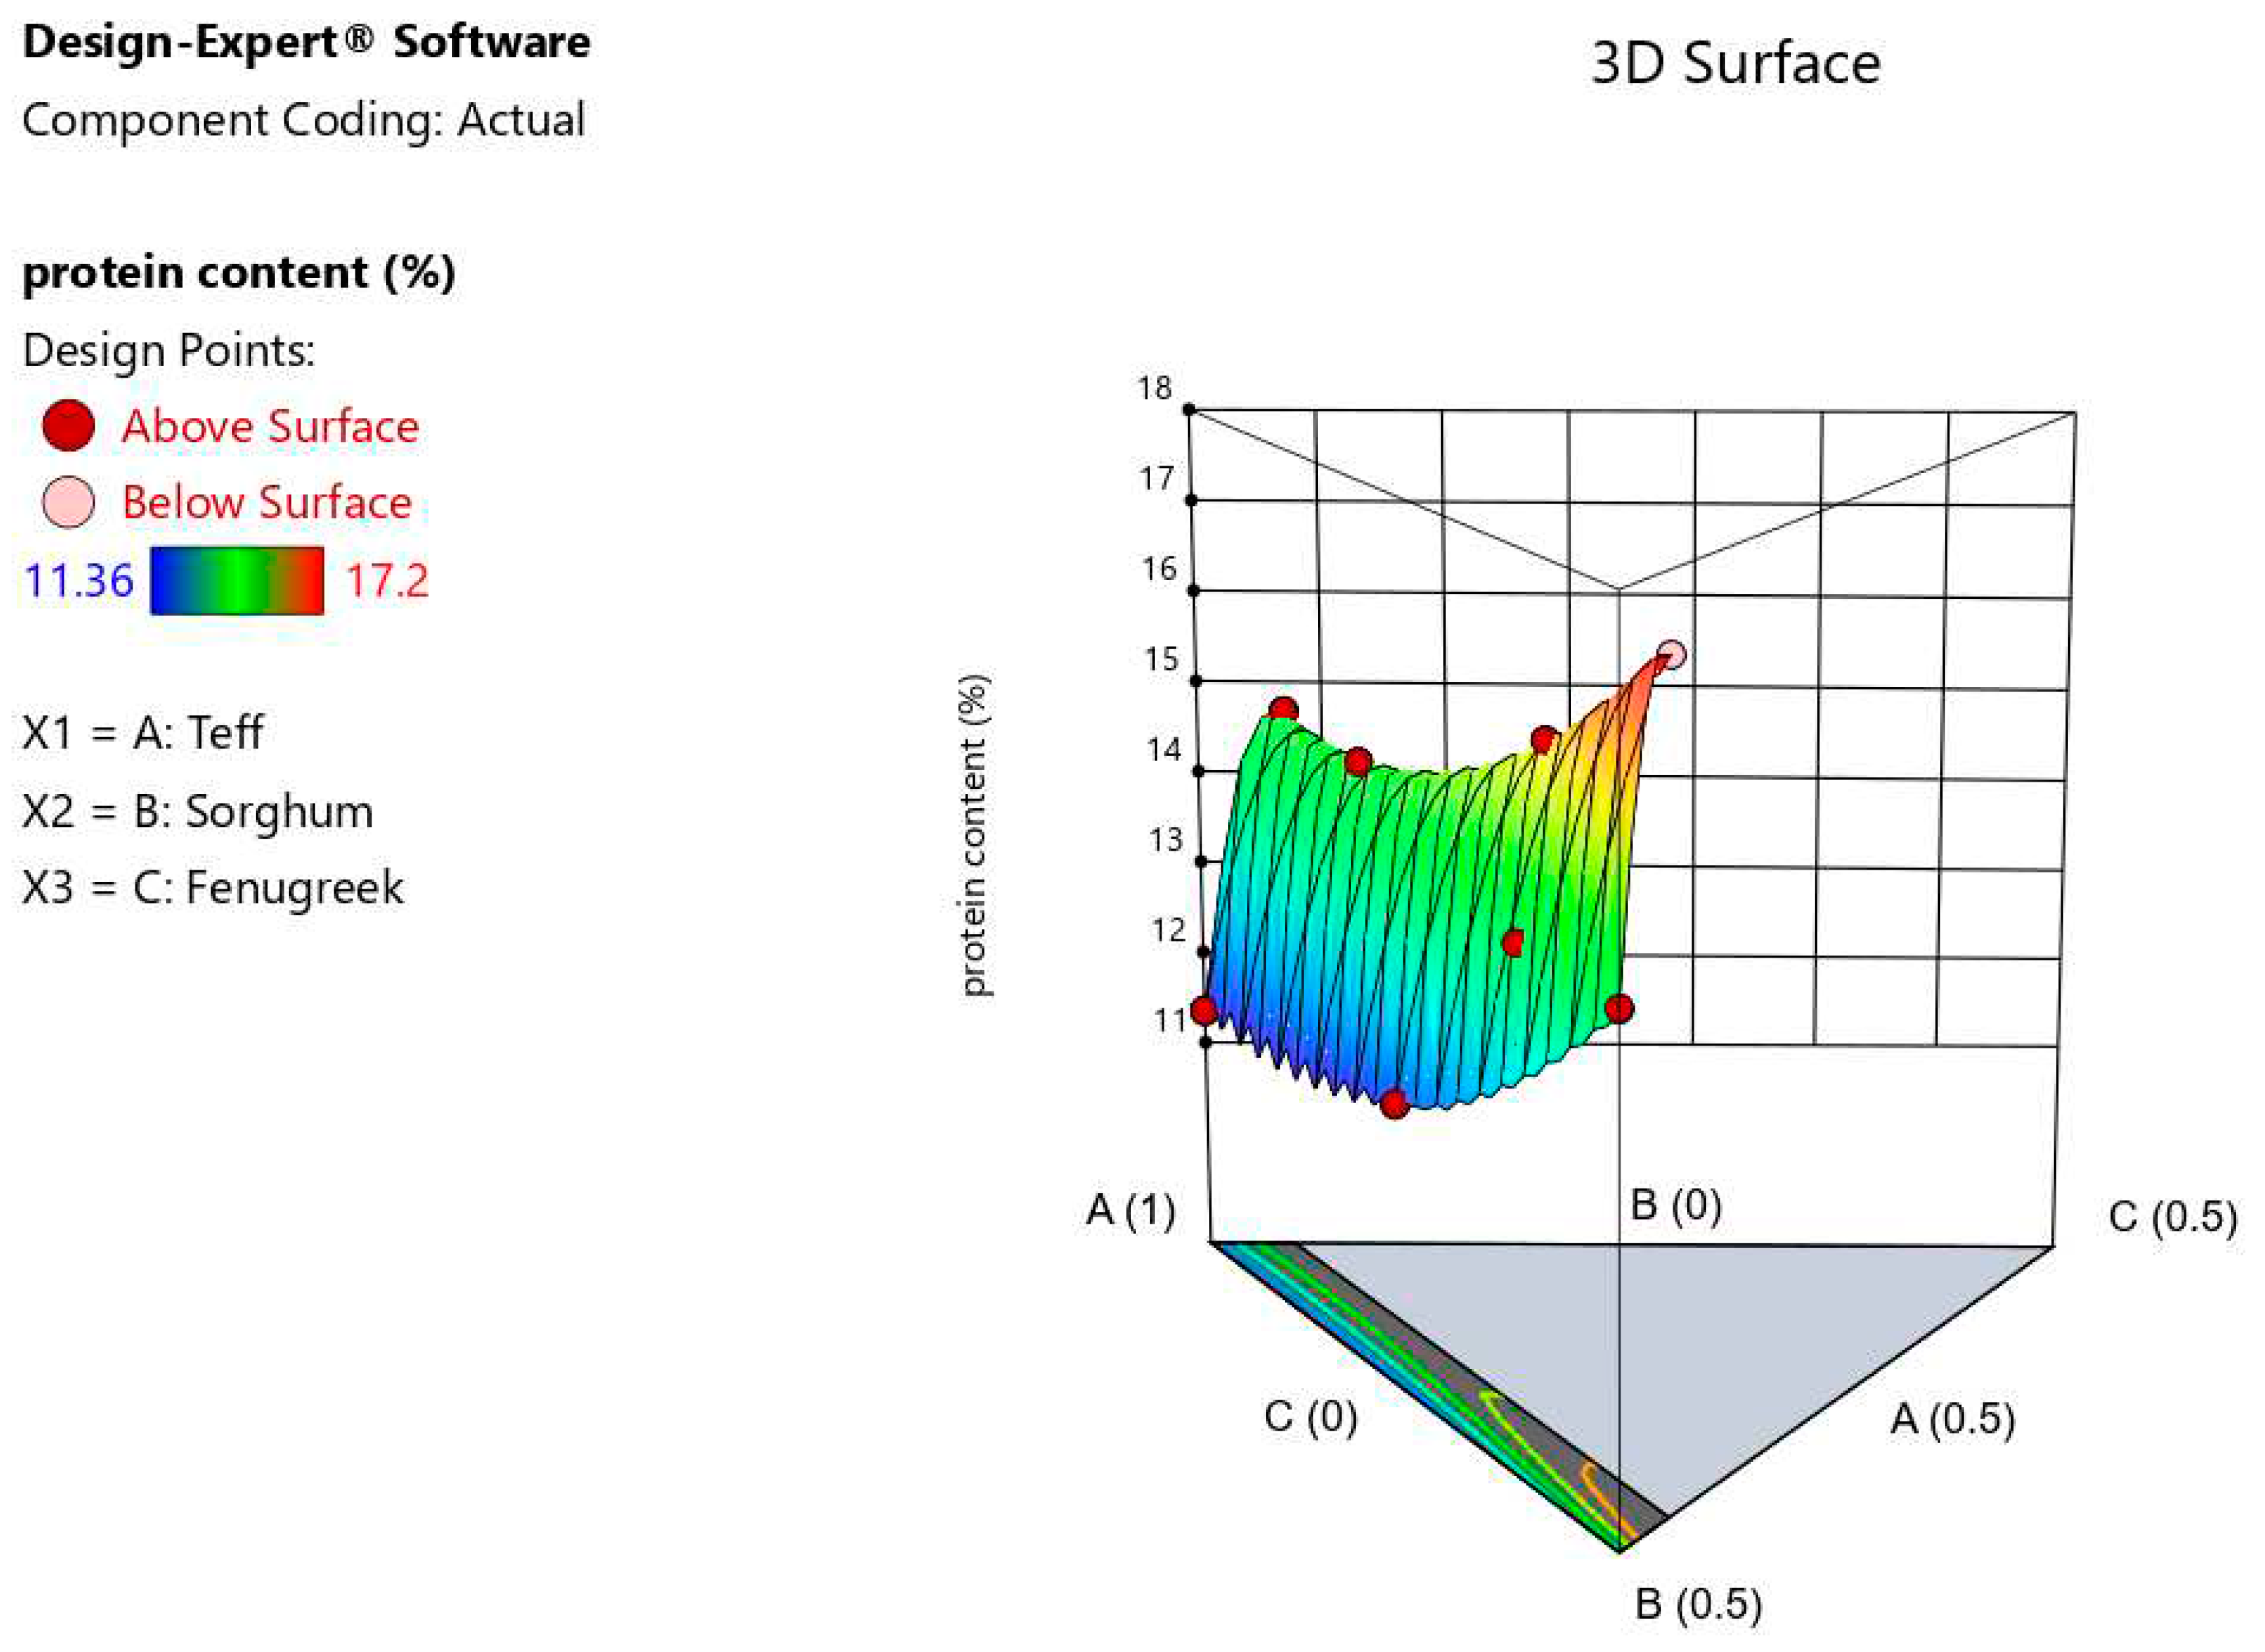
Sorghum, teff, and fenugreek had a significant effect on response protein content.The average protein level of all injera varied from 11.37 to 17.19% DM (Table 3) which is in in close agreement with Lamesgen et al. (2021), who obtained from substituting lupine flour to teff flour in injera making in a range of 11.78% to 18.84%. The relative highest crude protein content of injera product was obtained for 50% of teff, 45% sorghum, and 5% fenugreek blended injera, whereas the relative lowest crude protein content was observed in 100% teff injera as control with no sorghum and fenugreek blend. Injera made from composite flours containing a high ratio of fenugreek has a high protein content. Figure 1 shows the relationship of proportion of flour ingredients to the protein of the formulated injera.The increase in protein content observed may be due to the blending and composites flours improved or optimized the protein content of products (Girma et al., 2013; Zewdu et al., 2018) and it might due to the synthesis of enzymes or compositional proportion changes followed by the degradation of the components.
The higher level interactions (special cubic effects), teff*sorghum, and teff*sorghum*fenugreek amounts had a negative impact on response protein content whereas teff*sorghum, and sorghum*fenugreek amounts had a positive impact on response. Each factor had a linear and special cubic effect on the response; this is exemplified by the special cubic model (Figure 1), which is represented by:
Y = +11.36 ∗ A + 14.08 ∗ B − 355.23 ∗ C − 4.00 ∗ AB + 444.78 ∗ AC + 445.05 ∗ BC − 5.47 ∗ ABC
The higher level interactions (special cubic effects), teff*sorghum, and teff*sorghum*fenugreek amounts had a negative impact on response protein content whereas teff*sorghum, and sorghum*fenugreek amounts had a positive impact on response. Each factor had a linear and special cubic effect on the response; this is exemplified by the special cubic model (Figure 1), which is represented by:
Y = +11.36 ∗ A + 14.08 ∗ B − 355.23 ∗ C − 4.00 ∗ AB + 444.78 ∗ AC + 445.05 ∗ BC − 5.47 ∗ ABC
Figure 1.
3D (three-dimensional) response surface plot representing interaction effects of the amount of ingadients on the protein content of injera.
Figure 1.
3D (three-dimensional) response surface plot representing interaction effects of the amount of ingadients on the protein content of injera.
Fitting model
In order to make sure that the fitted model provides a suitable representation of the real conditions, it is crucial to assess the correctness of the model. The regression model may yield false or deceptive results if the model is poorly fitting.
Table 4 contains the findings of the sequential model comparison, which show if a model could adequately represent a response. As seen from the table, the linear, quadratic and the special cubic models were statistically significant (p: < 0.0001, < 0.0001 and 0.0010, respectively), that is, all the three models adequately describe the response (protein content). The lack of fit test was then carried out to show even more how appropriate a particular model was. The residual sum of squares-based lack-of-fit test determines if a model sufficiently fits the data. As can be seen in table 4, the special cubic model was the only one with a p > 0.05 for the protein level response, making it the sole model that could fit the data. Despite being able to accurately predict the response protein content, the linear and quadratic model failed the lack of-fit test and was consequently disqualified from further investigation.
Table 5 lists other statistical data that were used to compare the six models—linear, quadratic, special cubic, cubic, special quartic, and quartic. As seen from the table, the special cubic model that were deemed suitable to describe protein content response, respectively, had small large predicted R2 (1.000) values, standard deviations (Std. Dev. = 0.0088), and small predicted residual sum of squares (PRESS = 0.0021), which further exemplifies its suitability to fit the data.
Detailed analysis of variance (ANOVA) for the responses protein content response is summarized in Table 6.The best fit obtained model obtained was a special cubic model. By applying ANOVA test it was obtained highly significant model with a desired not-significant lack of fit. All the linear mixture components: teff, sorghum, and fenugreek and the special cubic terms teff*sorghum, teff*fenugreek, sorghum*fenugreek, and teff*sorghum*fenugreek were significant.
The goodness of model fit was recognized by the coefficient of determination (R2) and should be ≥ 80%. Accordingly, the modeling of the results was successful using the D-optimal mixture design (adopted design) as demonstrated by the values of R2 (1.0000), adjusted R2 (1.0000) and predicted R2 (1.0000). As seen in Table 7 the predicted R2 is in reasonable agreement with the adjusted R2; i.e. R2 (Adjusted - predicted) < 0.2. The high value of adequate precision (938.4305) > 4 indicates the sufficiency of the model to navigate the space with the high signal to-noise ratio of the results.
Protein content diagnostics of model adequacy tests
The diagnostics report and diagnostics plot for the protein response in Figure 2, Figure 3, Figure 4, Figure 5, Figure 6 and Figure 7, as shown in Table 8, supported the validity of the models (Getachew et al., 2022; Jalali-Heravi et al., 2009). The residuals for the response protein content's normal probability plot were normally distributed since they were pretty close to the straight line and did not deviate from it in terms of variance (figure 2). Another crucial diagnostic tool for determining whether the fitted model is adequate for predicting the response is the analysis of residuals and the variation of the predicted and experimental responses.
In order to retain the generated model's excellent fit, an internally studentized residual plot was used, and Figure 3 demonstrates that all the data points are within limits (±3). This suggests that there were no outliers in the plot for predicting protein content versus residual; instead, all of the points fell within the range of -3 to +3, suggesting that the model has a little amount of fitted value variation from observed. The experimental and projected values are hence closely correlated. The experimental results and the anticipated values from the generated model were both about centered around the straight line. They showed a good level of agreement with the available data (Figure 4).
The model's estimate correlations between the experimental and theoretical responses are good. As a result, the "R2" is reasonably consistent with the "R2, Adjusted." Furthermore, it can be shown that the models can predict a completely acceptable (100%) of the response, showing that the factors addressed in the suggested models are substantial enough to produce acceptable predictions.
Difference in fits (DFFITS), leverages, and Cook's distance for protein content models are indicted in Figure 5, Figure 6 and Figure 7. Figure 5, showed that the leverage values were confirmed the validity of the models (Jalali-Heravi et al., 2009). Thus, Figure 5 indicates that there were no outliers or unexpected mistakes in the model, because the leverage values were <0.5. Cook's distance (Figure 6) and difference in fits plots (Figure 7) also verified the precision of the models (Jalali-Heravi et al., 2009).
Figure 2.
Relation between normal % probability and external studentized residual protein (%) values.
Figure 2.
Relation between normal % probability and external studentized residual protein (%) values.
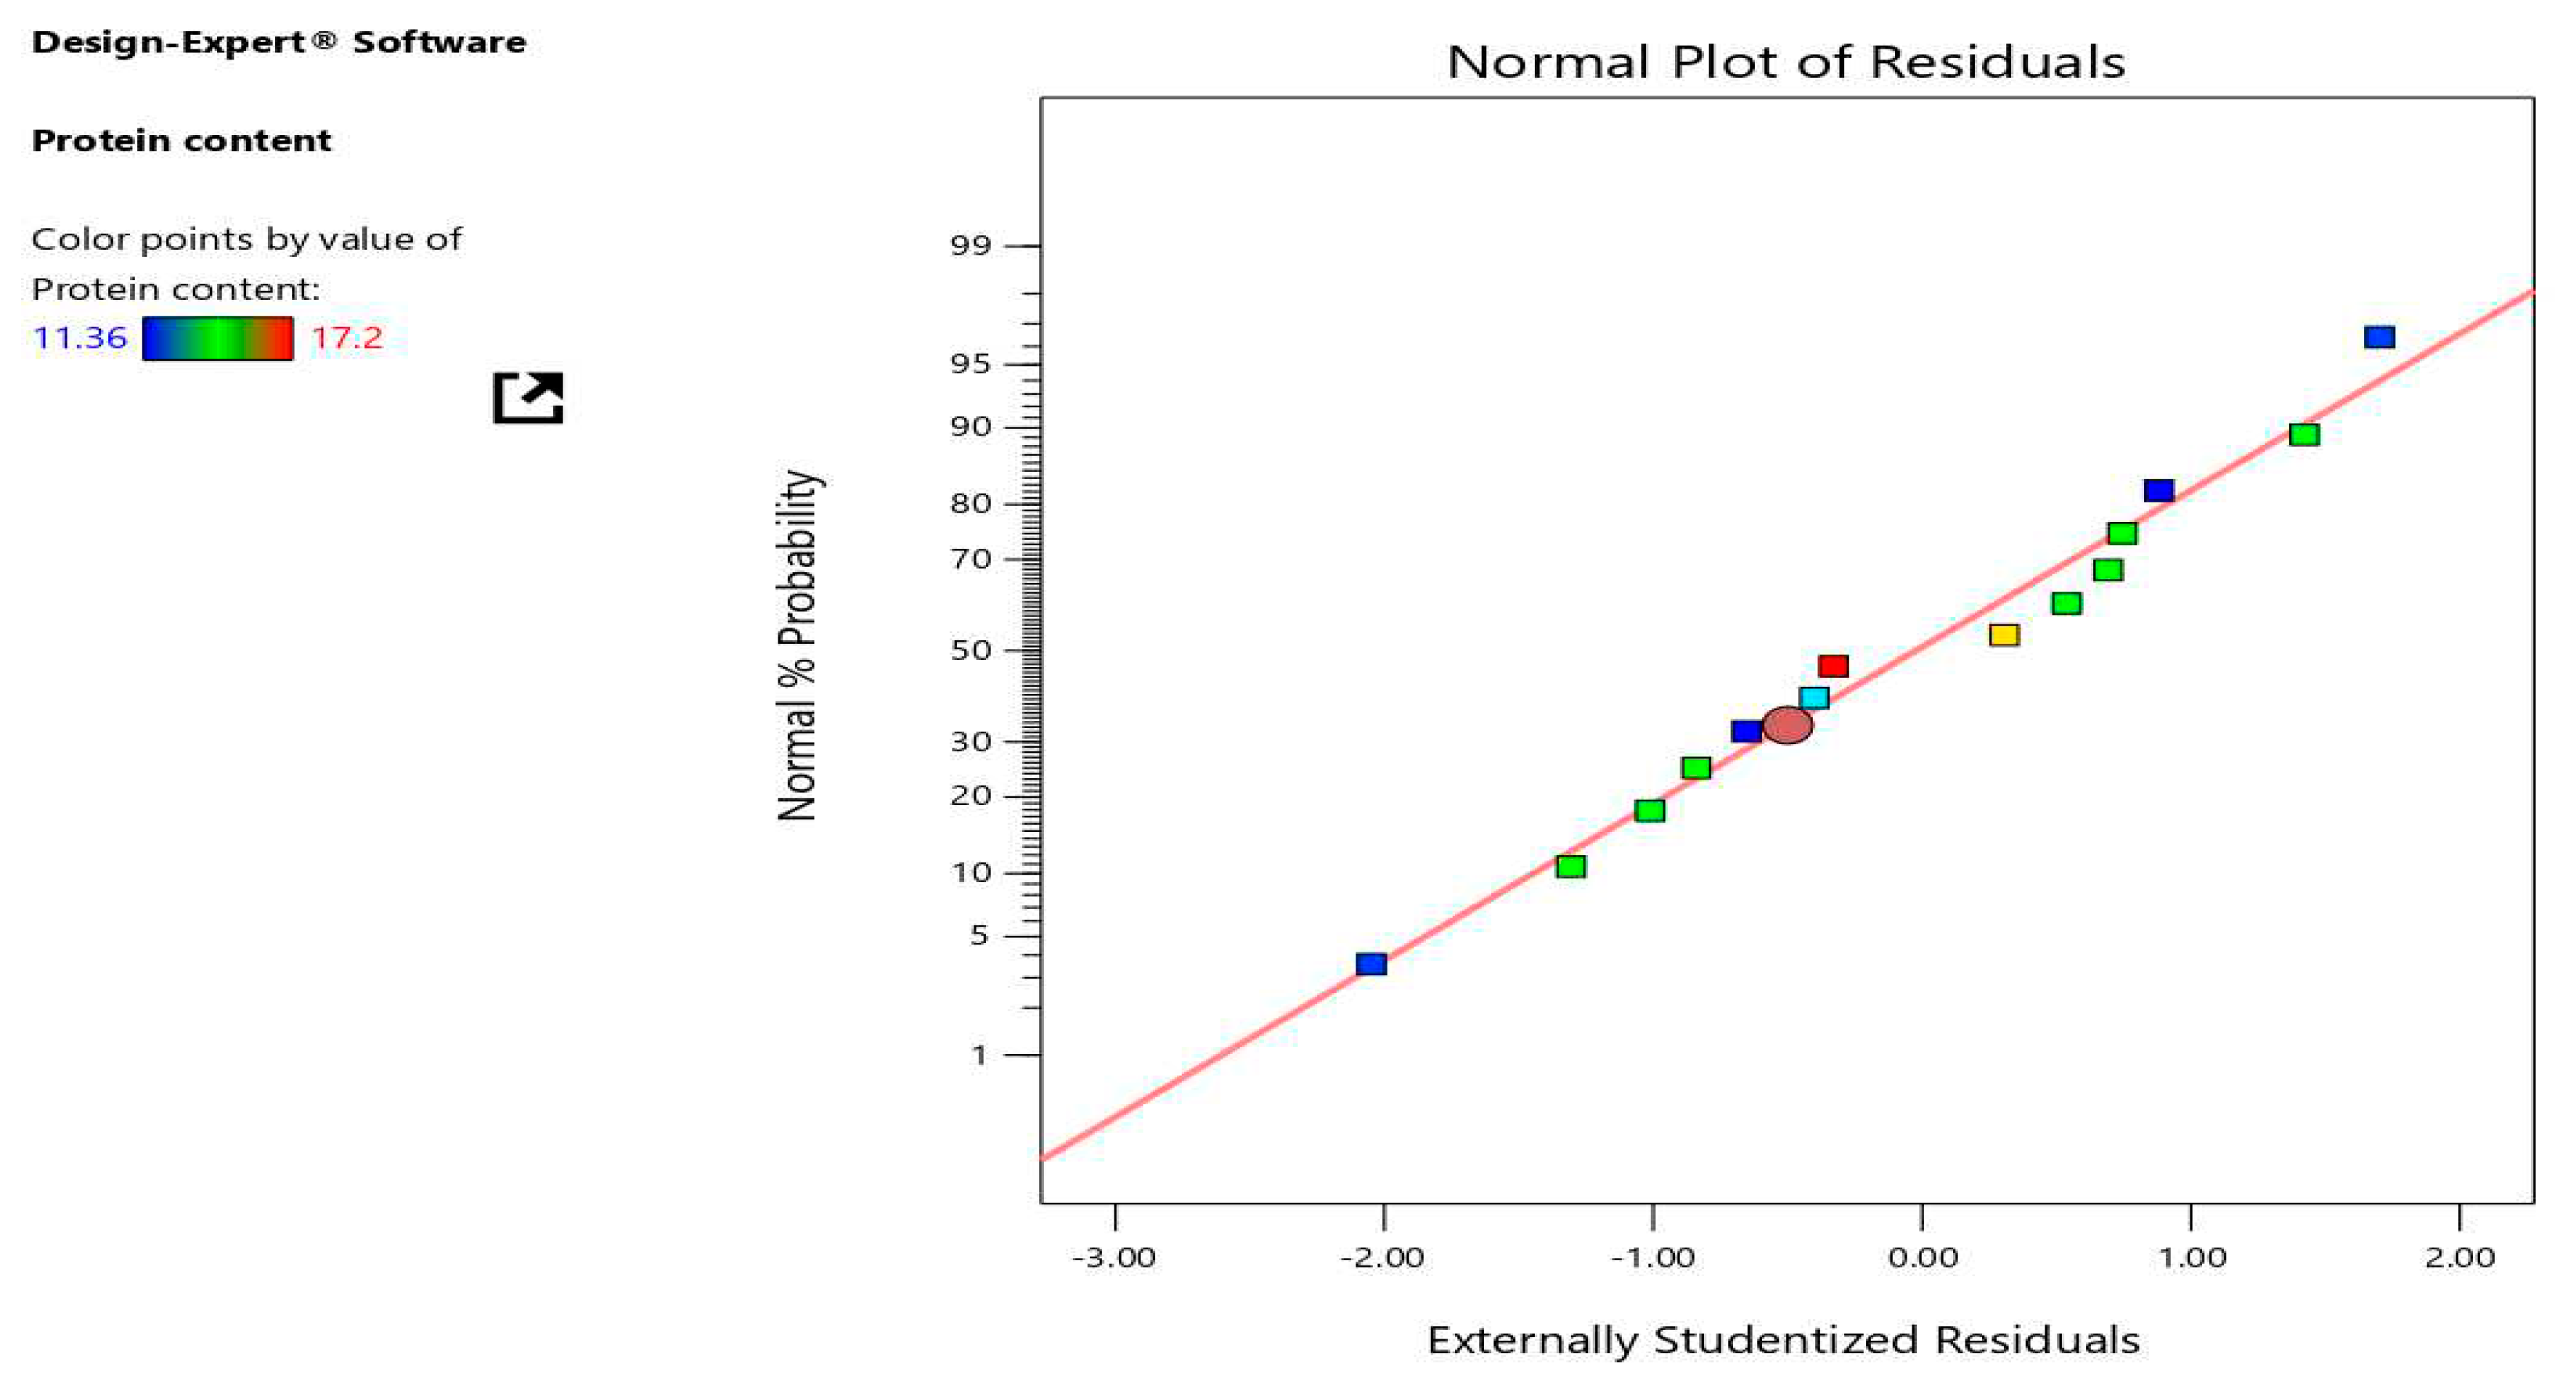
Figure 3.
Relation between externally studentized residuals versus run percentage of protein content values.
Figure 3.
Relation between externally studentized residuals versus run percentage of protein content values.
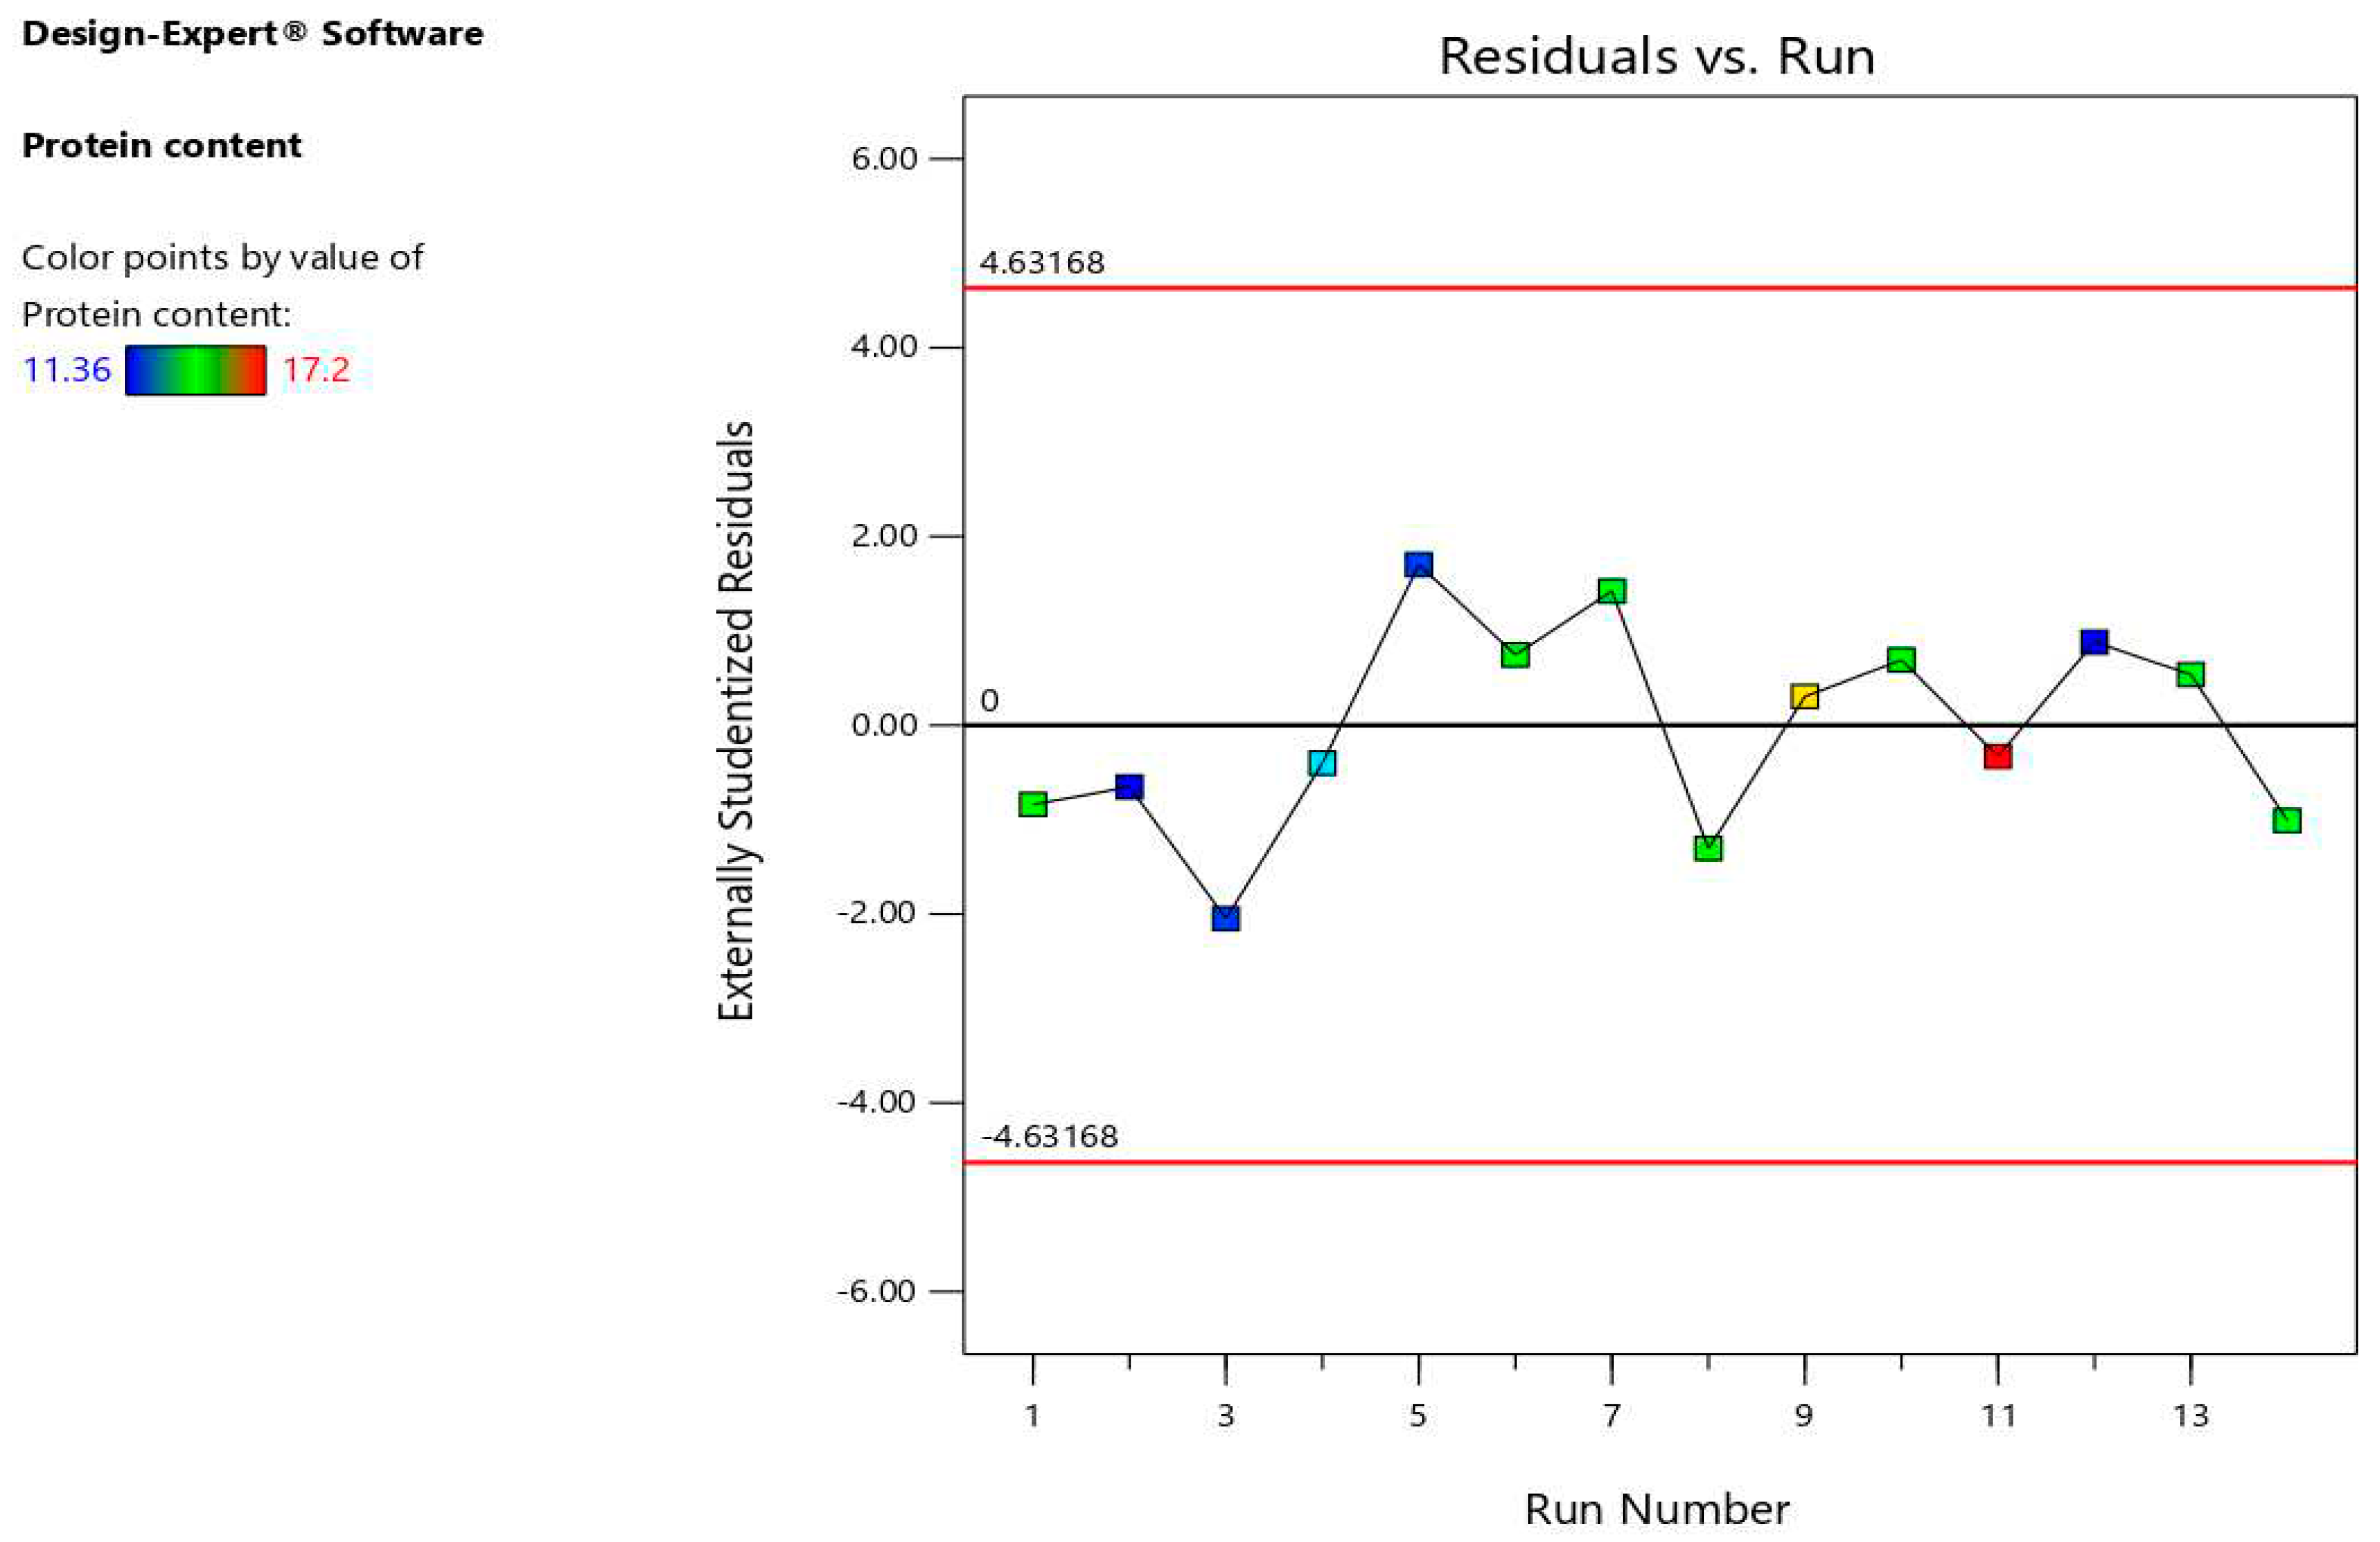
Figure 4.
Relation between observed and predicted percentage of protein content values.
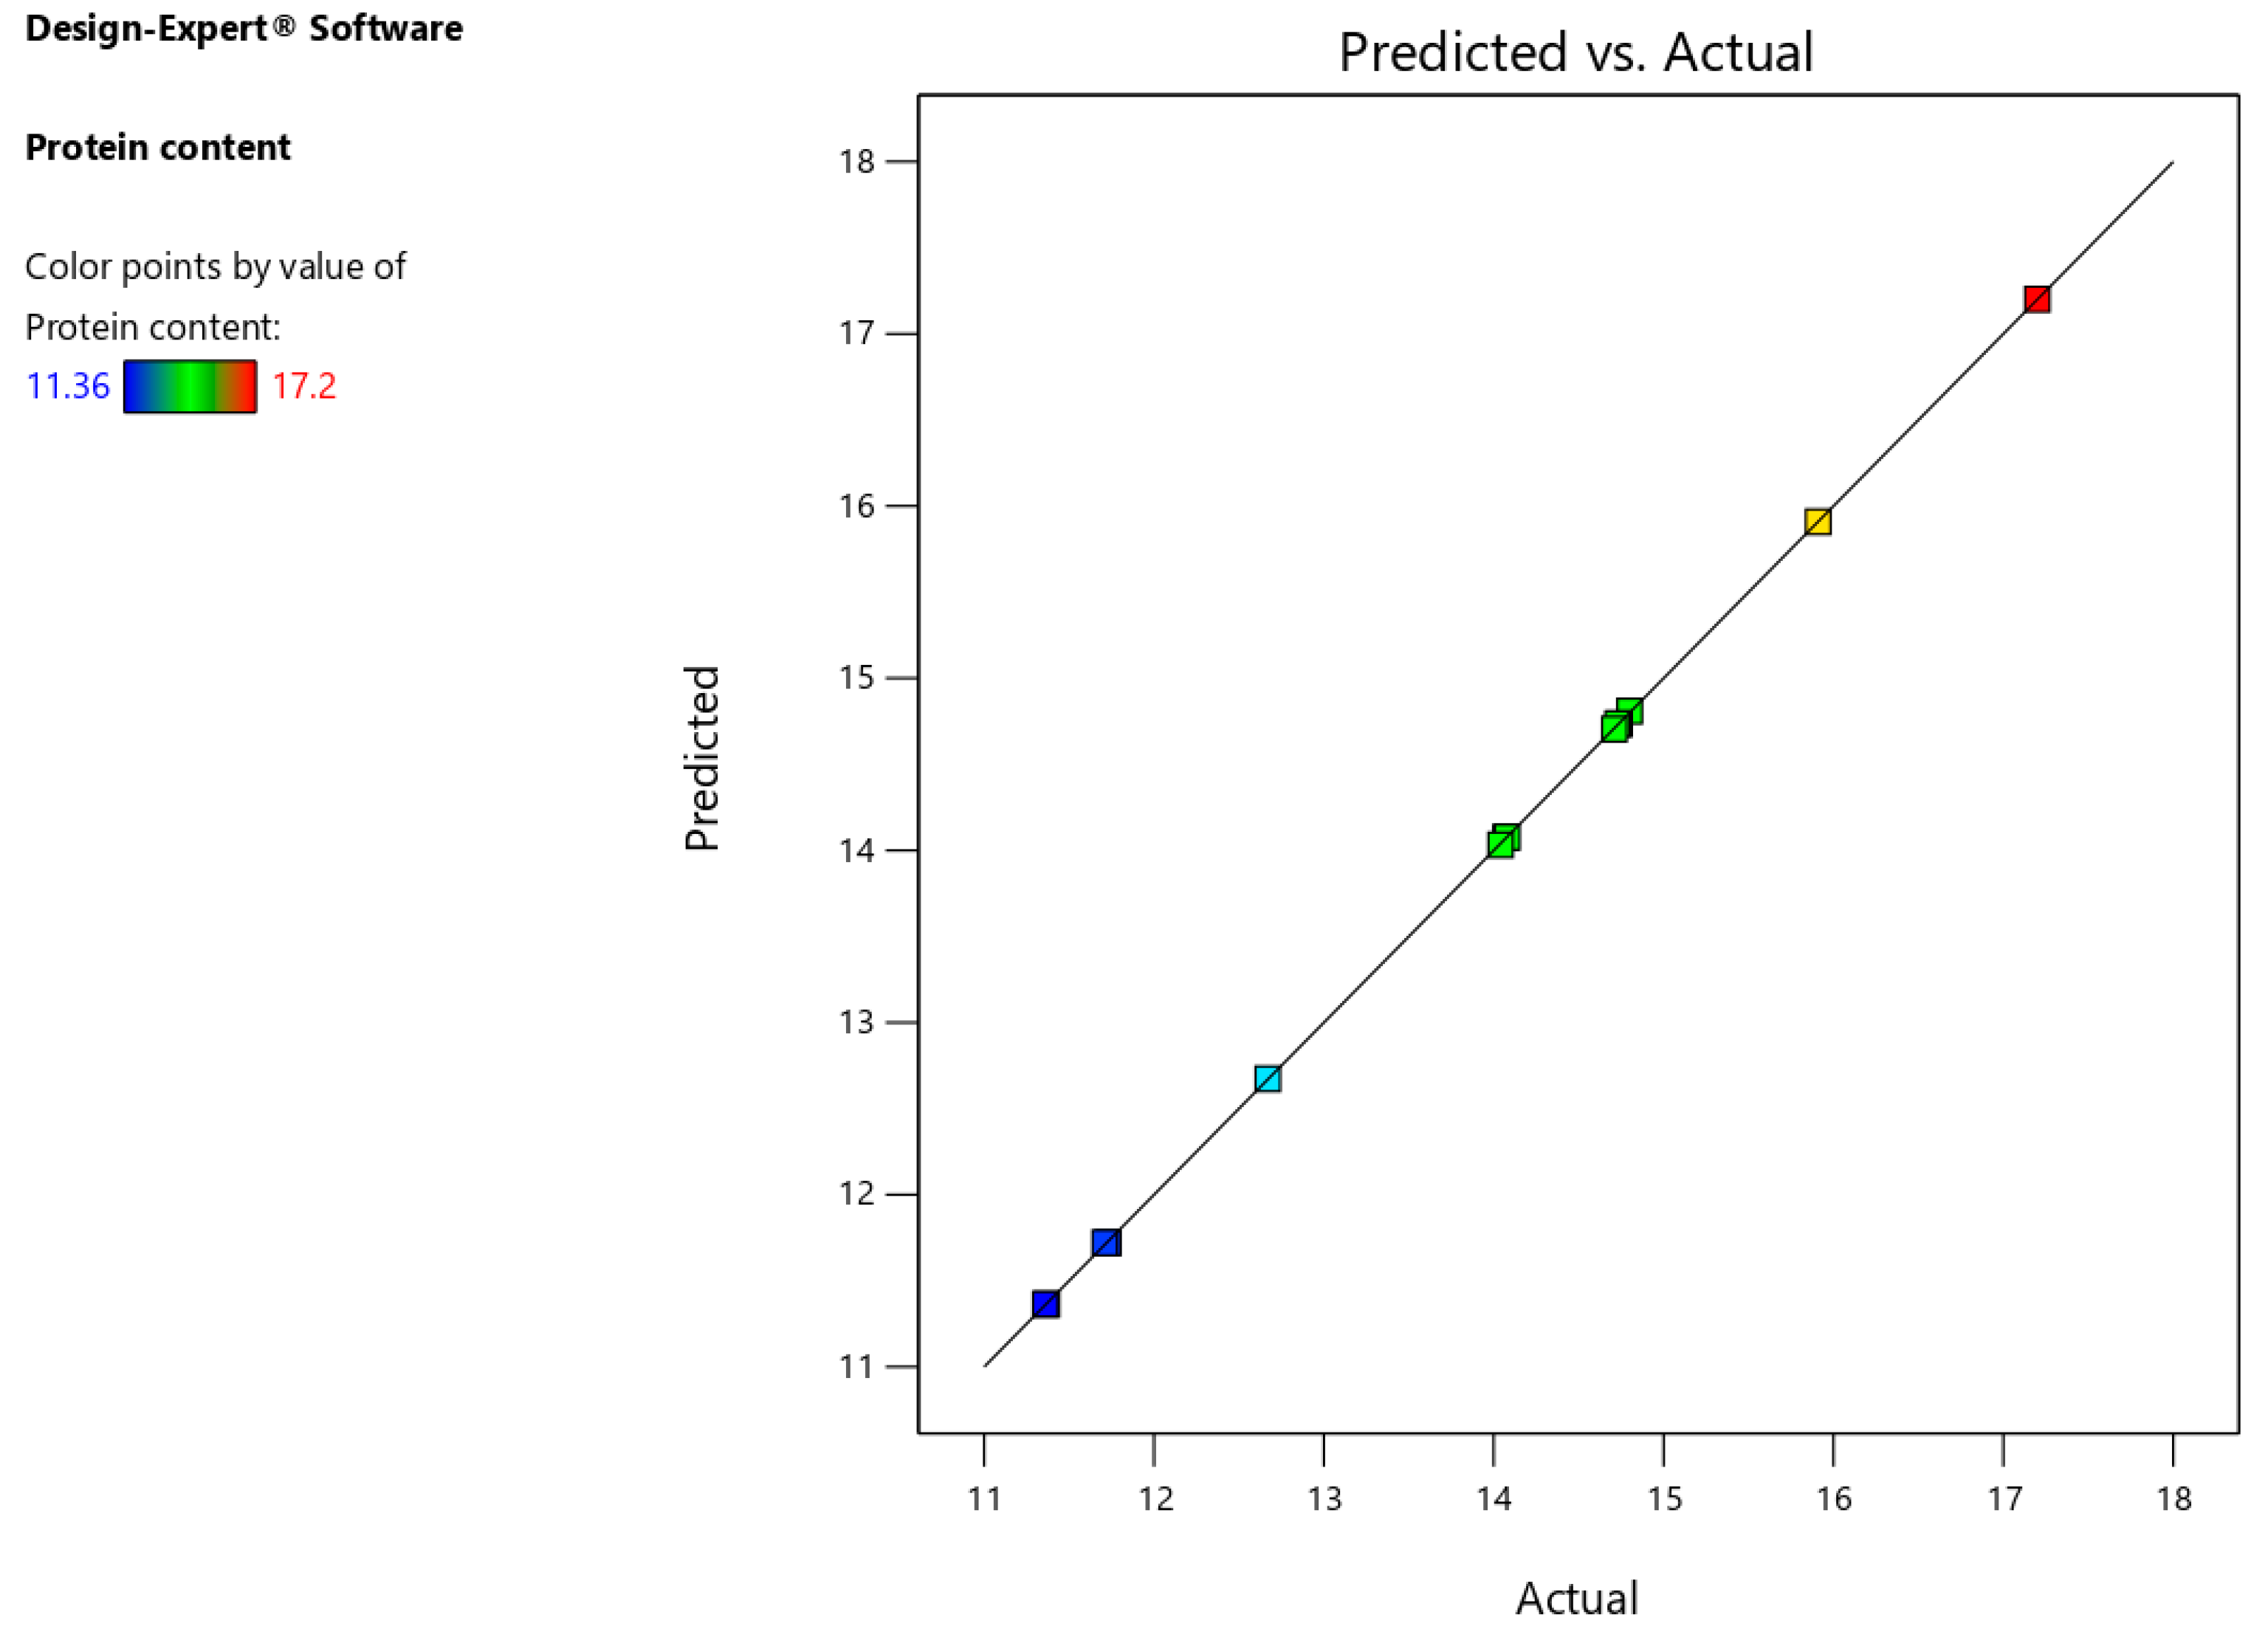
Figure 5.
Relation between leverage and run percentage of protein content values.
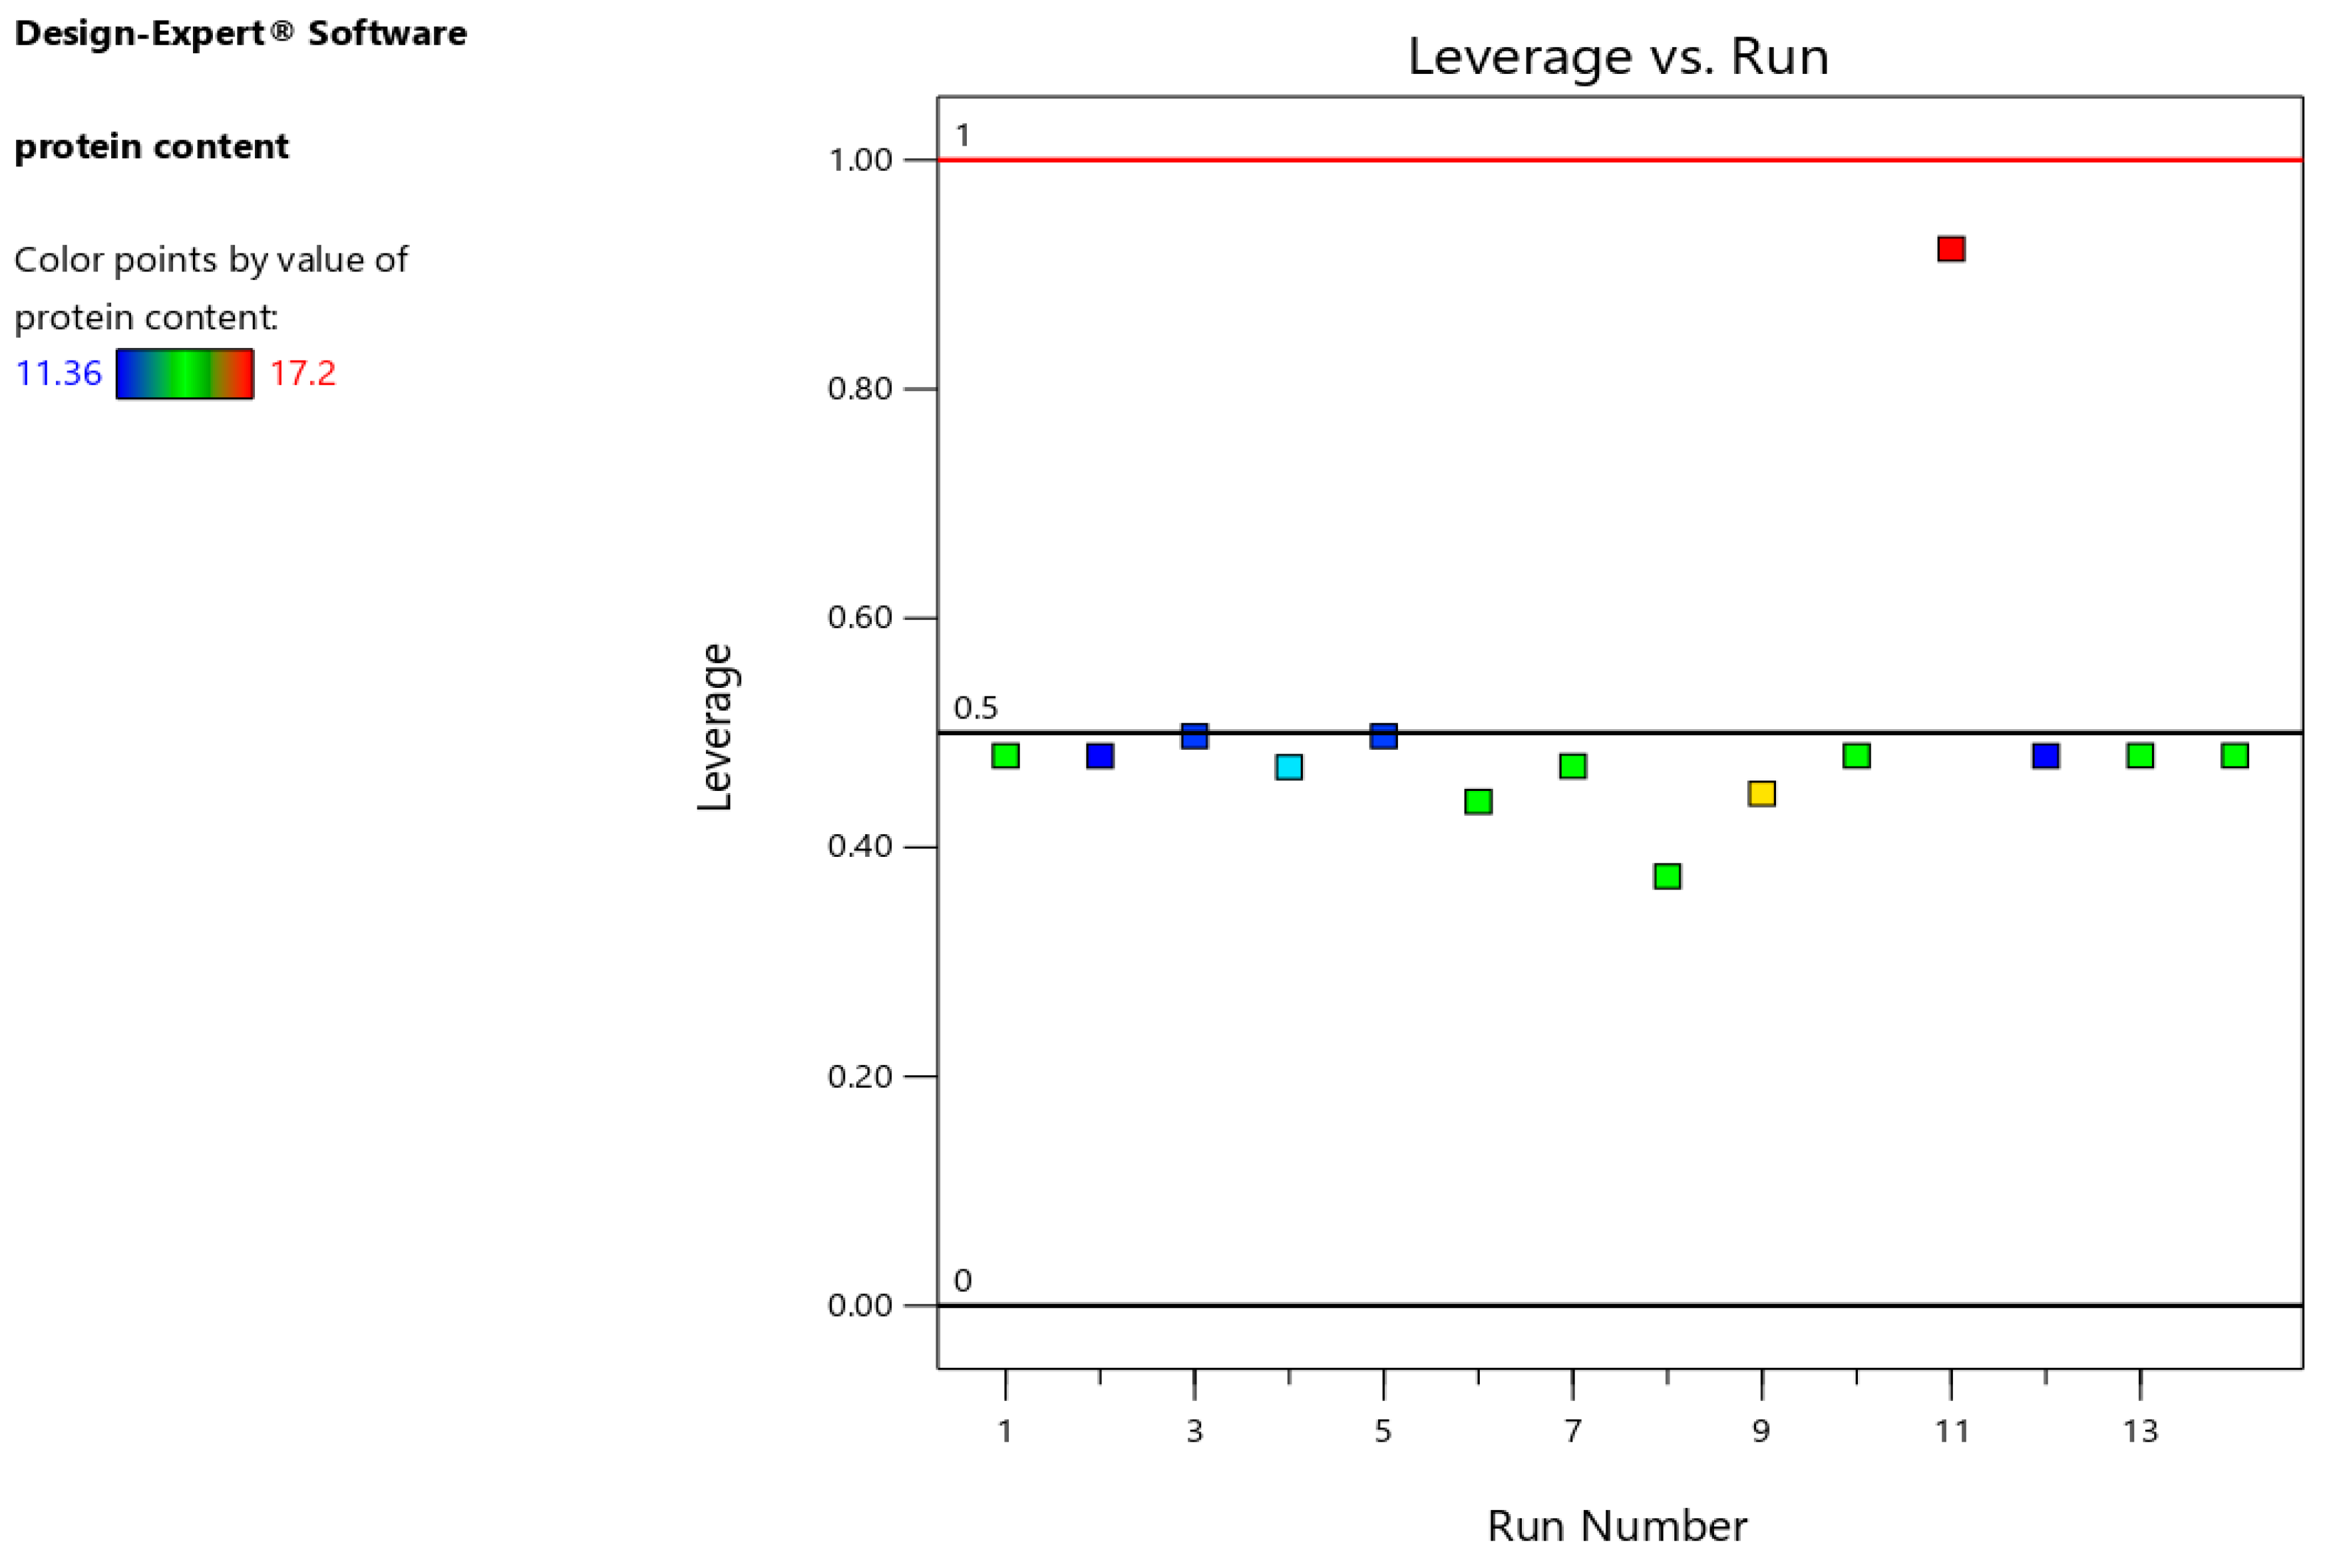
Figure 6.
Relation between cook distance and run percentage of protein content values.
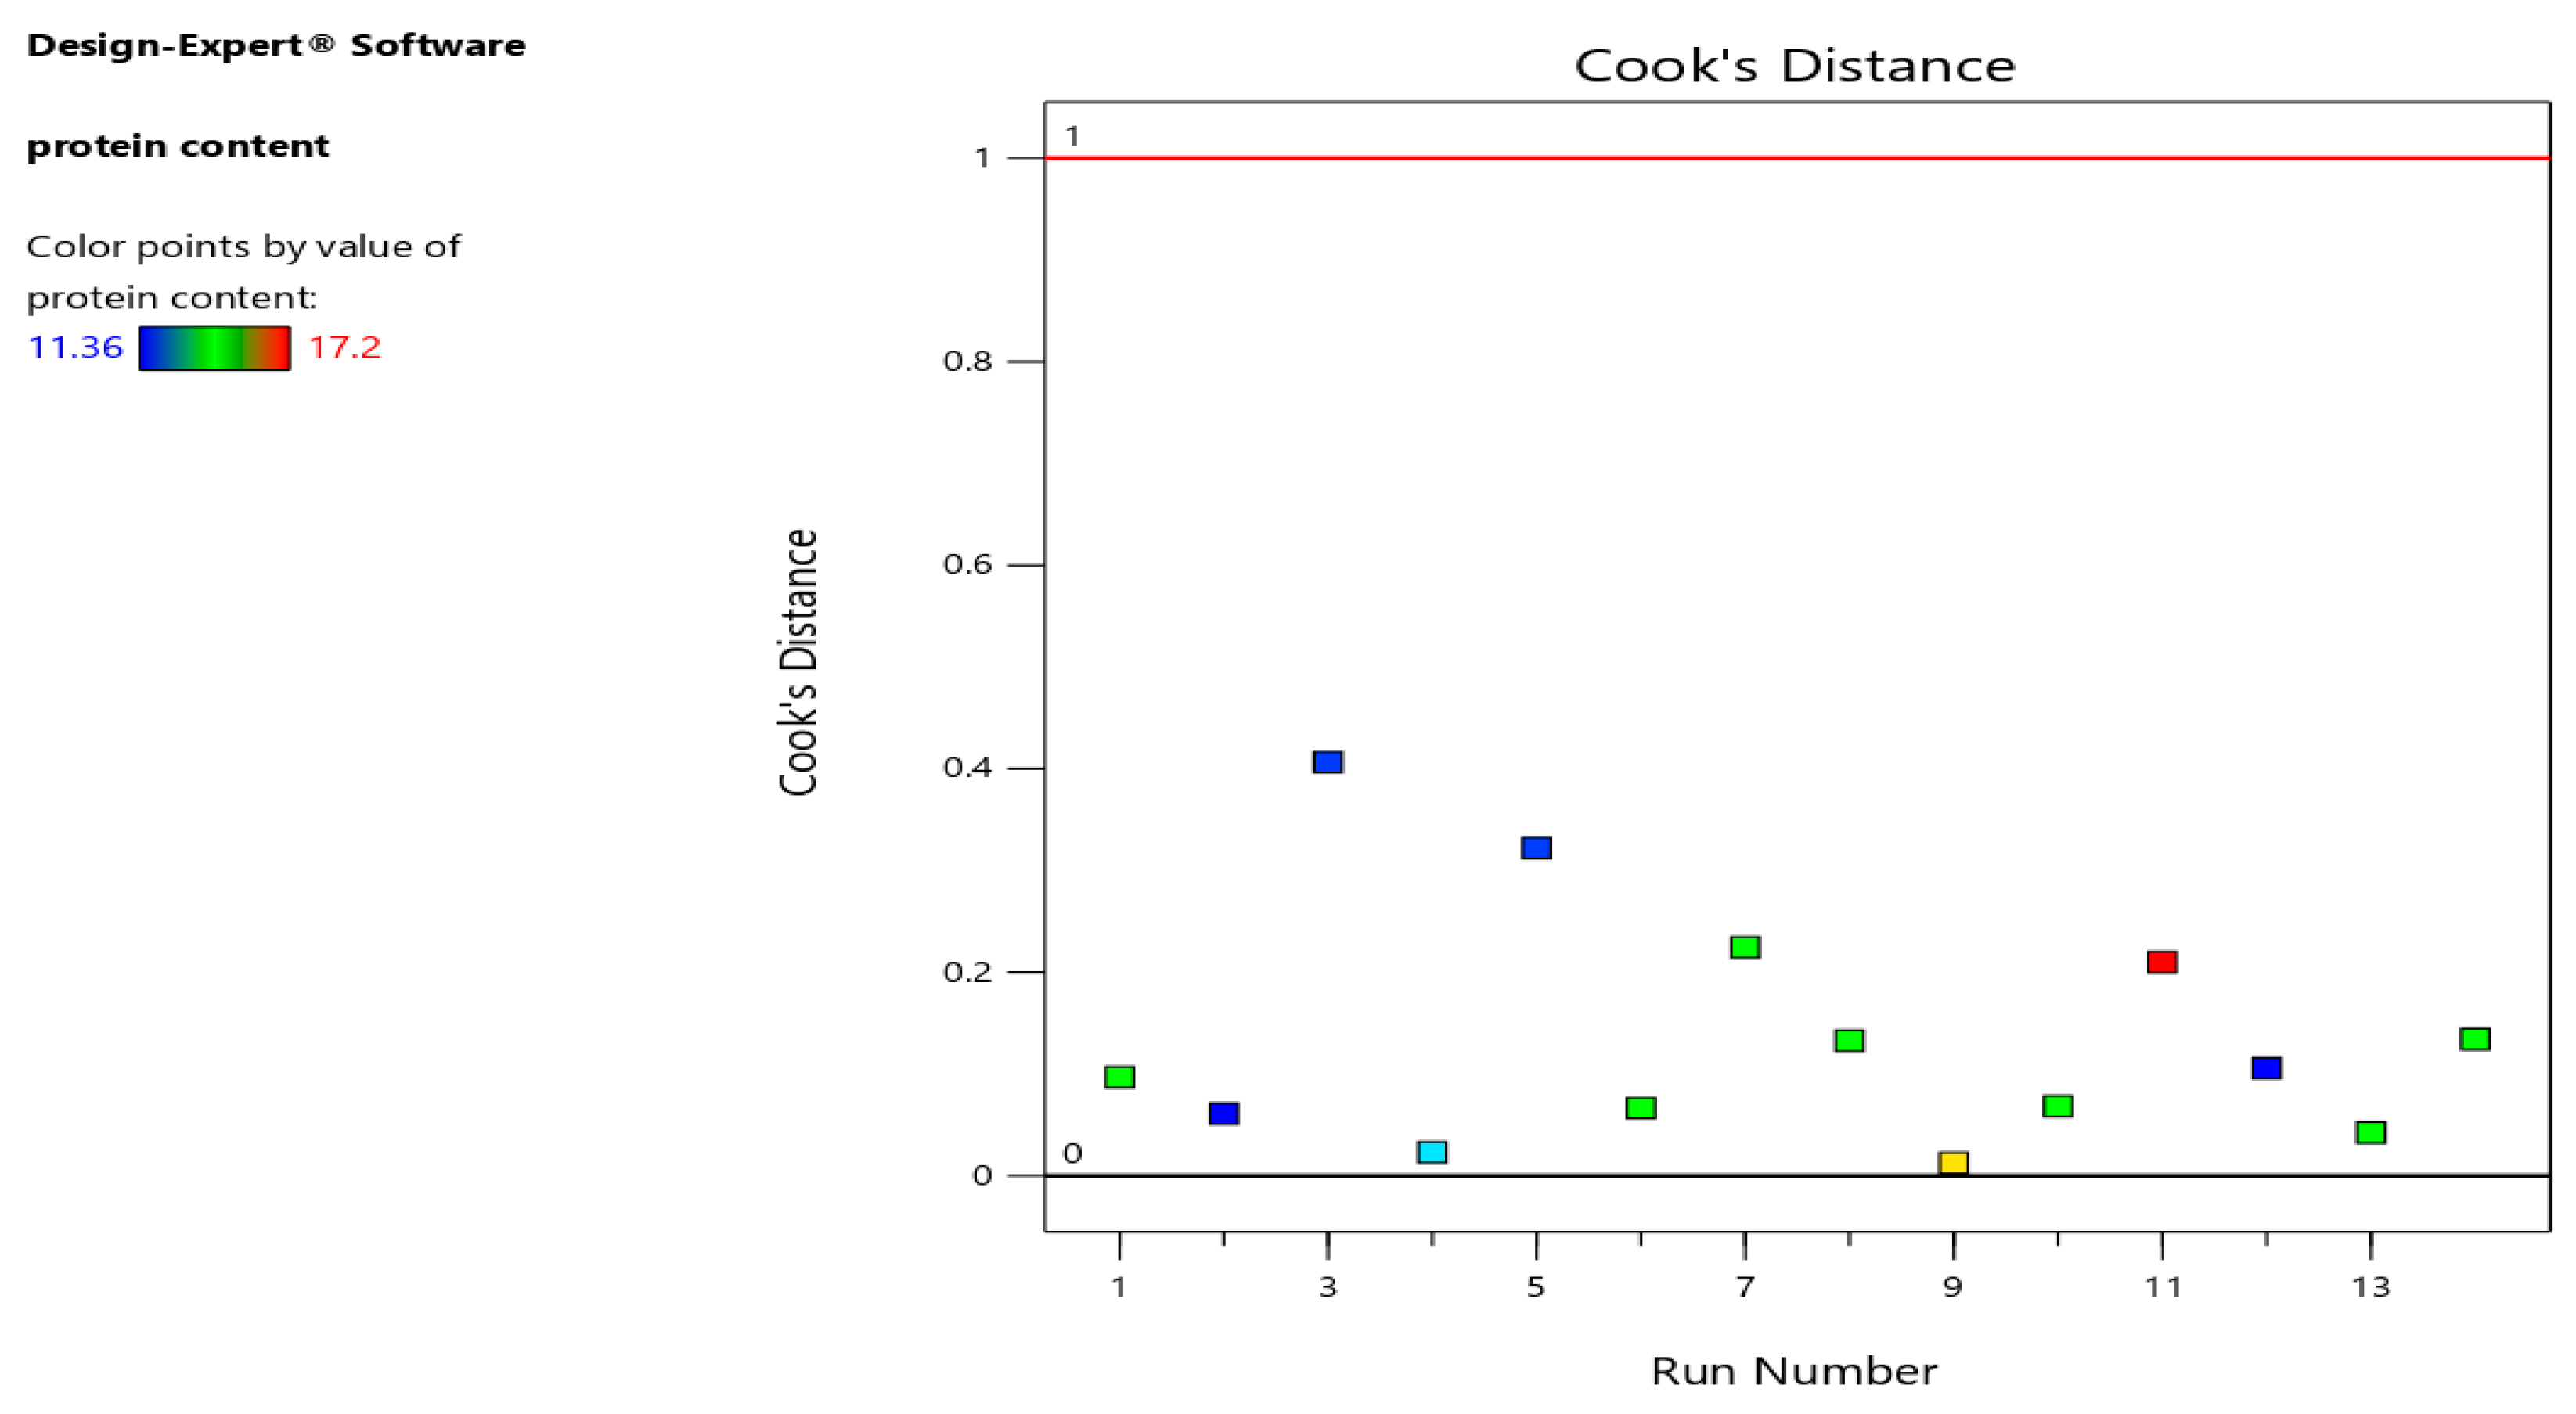
Figure 7.
Relation between differences in fits (DFFITS) and run number.
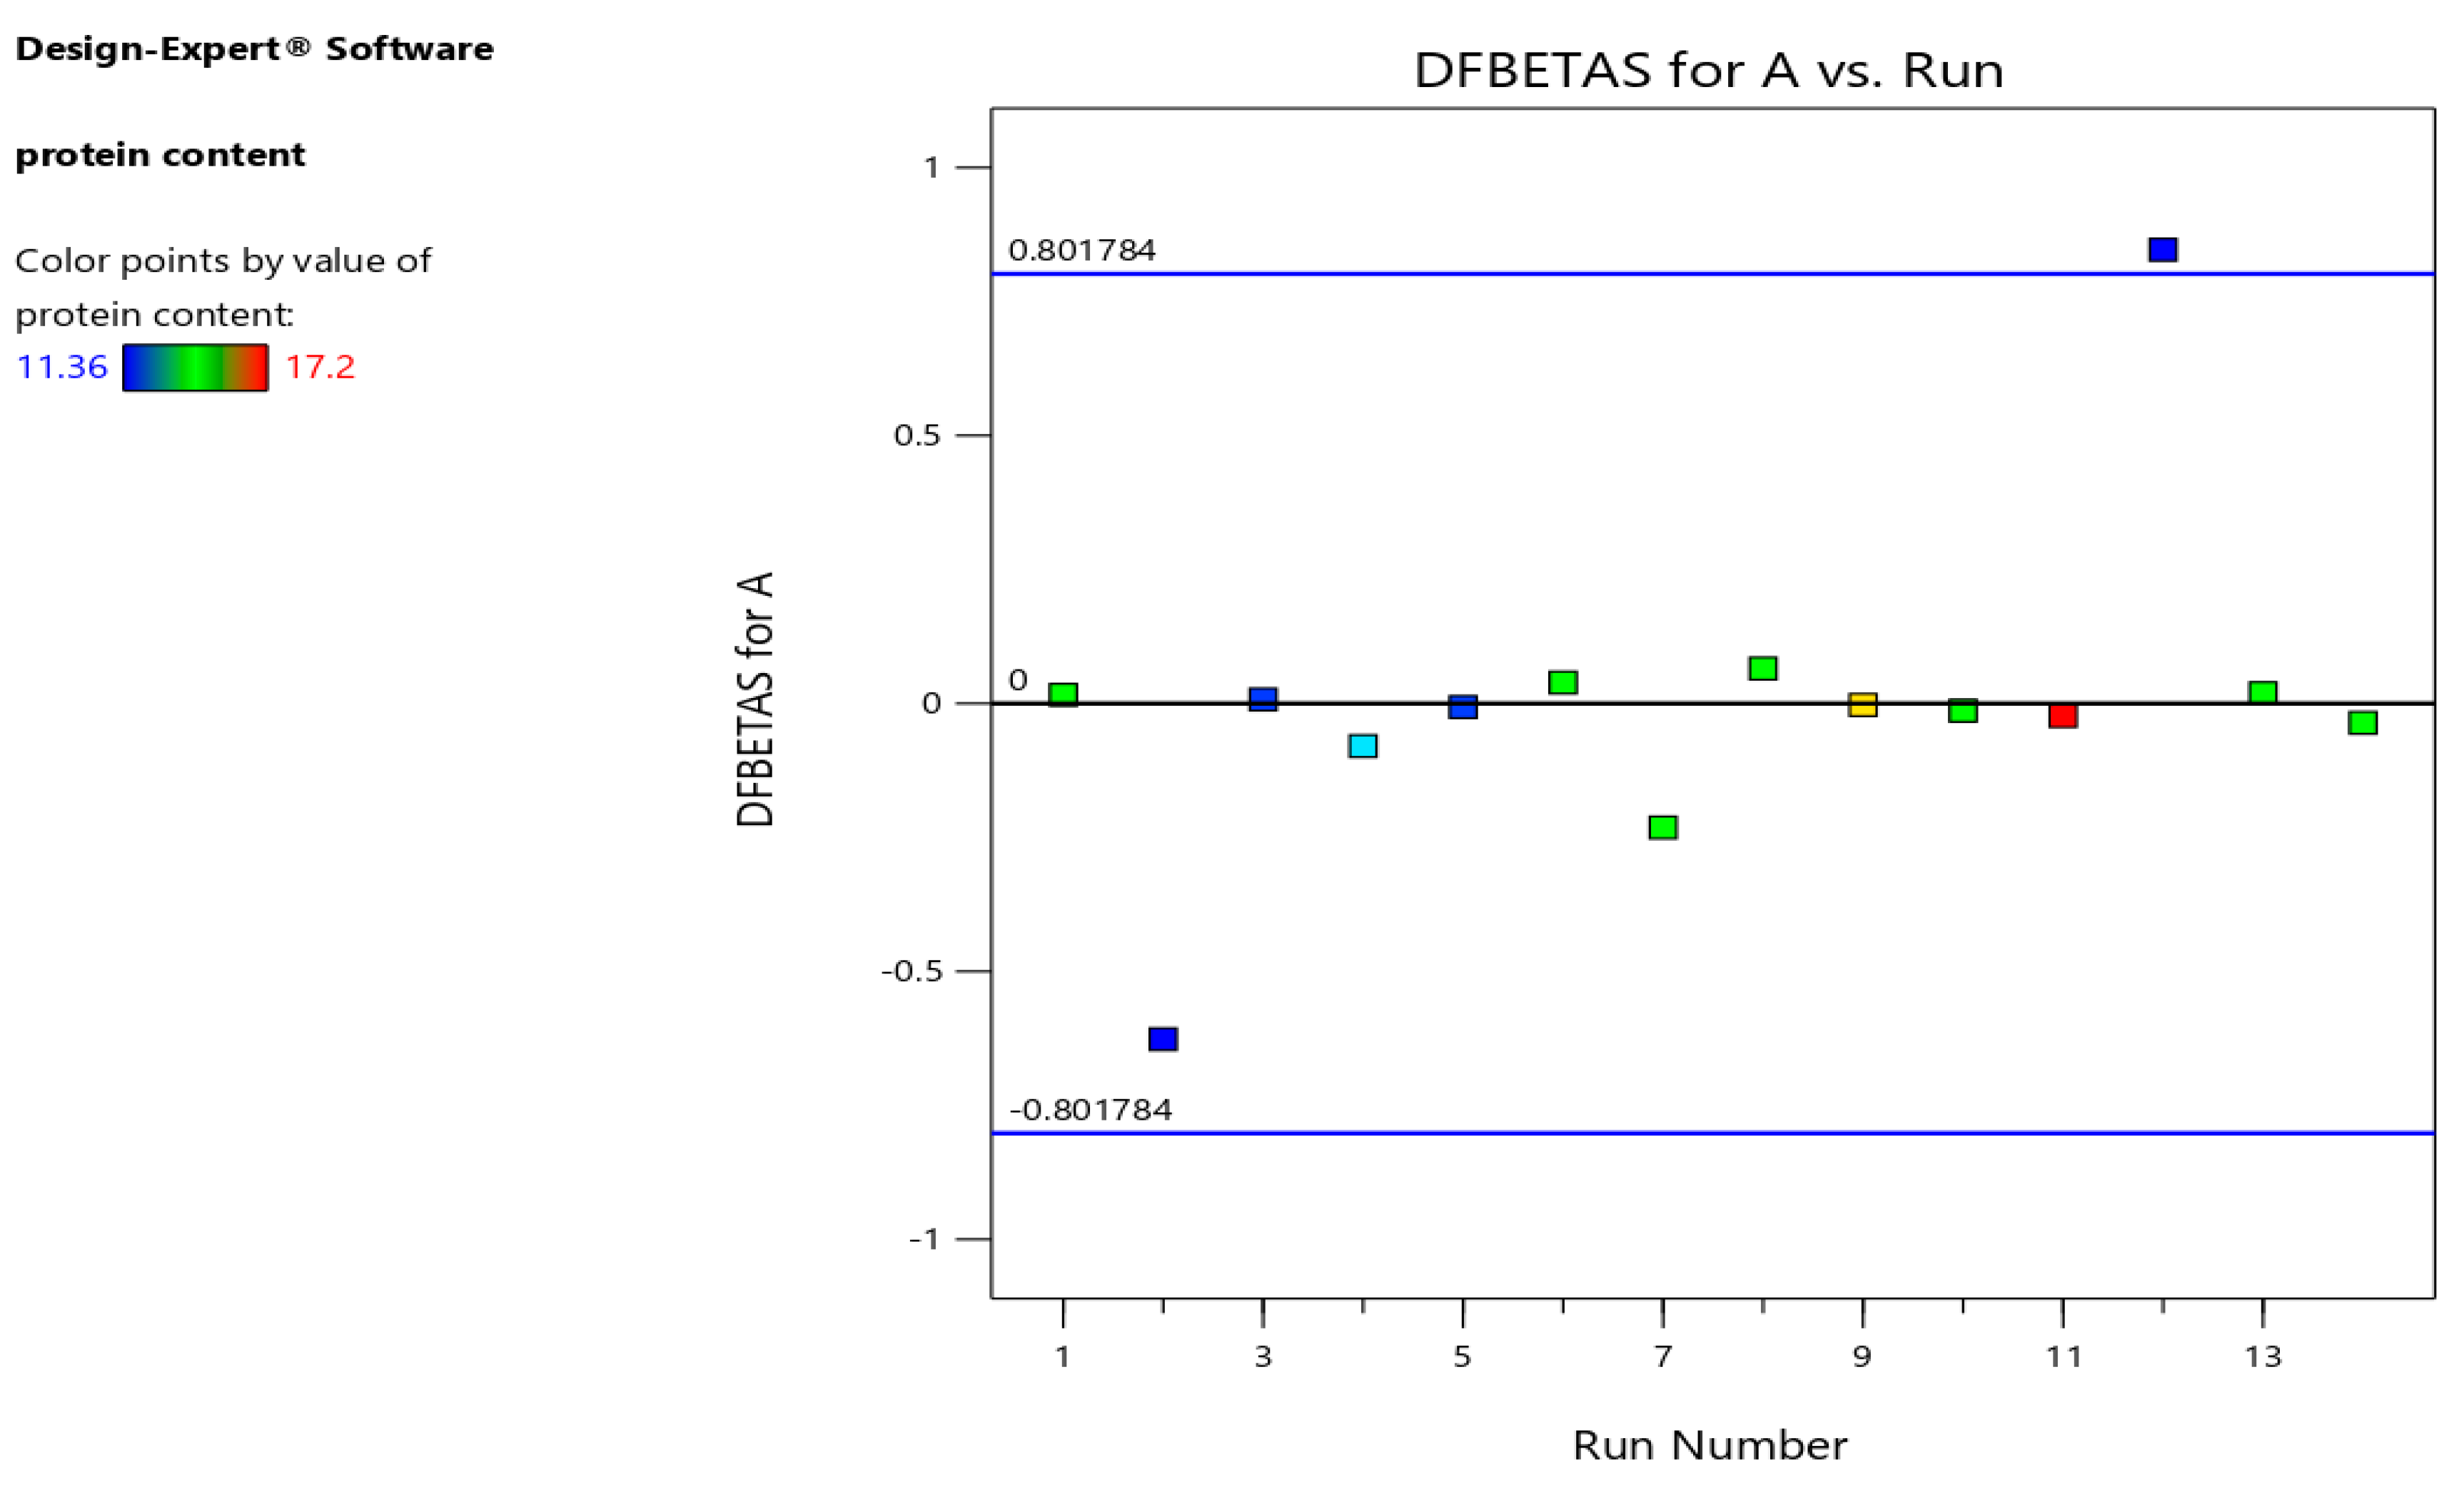
3.1.2. Moisture content
The mean moisture content of the composite injera samples was significantly affected by the blending ratios at p < 0.05. The formulated injera's mean moisture content ranged from 59.67 to 69.92%. The injeras made from 50% teff blended with 45% sorghum, 5% fenugreek had the highest mean moisture content, while teff alone injera had the lowest moisture content (66.67%). Because raw sorghum and fenugreek have a higher fibre content than teff varieties, and fibers have a tendency to absorb water. This shows that blending ratio affects the softness of injera products and moisture varation at controlled time-temprsture baking condition. It can be seen in Figure 8 that moisture content of injera increases as the fenugreek and sorghum blending ratio increases. Previous research by Zewdu et al. (2018) and Lamesgen et al. (2021) indicates injera made from various cereals has a moisture content of 59.34-66.97%. Moisture content was found to be a significant difference in the model and linear mixture (p < 0.0001). The regression equation formulated injera for moisture content was,
Y = +59.84 ∗ A + 63.50 ∗ B − 12110.65 ∗ C + 0.5600 ∗ AB + 13598.58 ∗ AC + 13598.18 ∗ BC − 7750.62 ∗ A2BC − 7707.34 ∗ AB2C + 67890.35 ABC2, R2 = 0.9965.
3.1.3. Total ash
The product has an average total ash content of 2.64-3.91% DM. Injera prepared from composite flours with a larger proportion of 74% teff, 24% sorghum, and 3% fenugreek had a higher ash level. This was explained by the presence of ash in fenugreek seed flour at higher amount (up to 3.38) (Sowmya and Rajyalakshmi, 1999), followed by teff flour (up to 3.16) (Bultosa, 2007) than in sorghum (up to 2.29%) (Masresha and Belay, 2020). The ash content was obtained highly significant difference in model and linear mixture (p < 0.0001) (Table 9).
3.1.4. Crude fiber content
The crude fiber content of the composite injera was significantly affected by the blending products (p < 0.05). The baked injera's crude fiber content ranged from 6.988 to 4.179%. The highest fiber content (6.988%) was found in injera made from 50 % teff and 50% sorghum with no fenugreek, while the lowest crude fiber content was found in injera made entirely of teff (4.179%). However, According to (Ashenafi, 2006), who found that injera made from different cereals had crude fiber content varies from 5.2-0.8% DM. The crude fiber content of formulated injera varied from previous studies, it might be due to variation of composition amount and variety used. It can be seen in model graphs that proportion of sorghum and fenugreek flour in injera increased in tandem with the increase in crude fiber content (Figure 9) It's possible that this is due to the fact that raw sorghum and fenugreek flours have more fiber than teff flours. Crude fiber content was found to be a highly significant difference in the cubic model and linear mixture (p < 0.0001).The predictive model equation obtained for crude fiber content (Yc) was,
Yc = +4.18 ∗ A + 6.99 ∗ B − 8499.79 ∗ C − 0.7930 ∗ AB + 14137.28 ∗ AC + 12474.18 ∗ BC − 9718.62 ∗ ABC* + 20.87 ∗ AB*(A-B) − 5858.90 ∗ AC*(A-C) − 3792.58 ∗ BC*(B-C), R2 = 1.00.
3.1.5. Utilizable carbohydrate content
The baked injera's carbohydrate content ranged from 59.54 to 77.74 %. Injera prepared from different composite flours mean utilizable carbohydrate varied content in the range (73.89 - 86.8%) (Zewdu et al., 2018; Woldemariam et al., 2019). The CHO of formulated injera varied from previous studies, it might be due to variation of composition amount, variety used, and any factors contributed for CHO content such as fermentation temperature and relatively the higher content of protein, crude fat content, and total ash contribute relatively to be lower from the previous studies.
Injera made from 100% teff had a significantly higher amount of utilizable carbohydrate (CHO) (77.74%) while the lowest CHO content (59.54%) of injera was made from 50% teff, 45% sorghum, and 5%). This could be because the carbohydrate content of raw fenugreek, followed by sorghum, was lower than the teff flour sample. Those, each mean formulated blending ratio injera CHO content shown a significant difference (p < 0.05) and the formulated composite ratio injera CHO was a highly significant difference (p < 0.0001) in the cubic and linear mixture models of the interaction composite flours.
3.1.6. Crude fat content
The crude fat content of injera products showed significant differences (p < 0.05). Injera blend crude fat content ranged from 3.237 to 10.838 %. The highest crude fat content obtained by blending of 50% of teff, 45% sorghum and 5% fenugreek and the lowest crude fat content was recorded of 87% teff, 12% sorghum and 1% fenugreek injera. The crude fat content of injera increased as the proportion of fenugreek ingredient increased. These findings are consistent with those of Godebo et al. (2019), who found that injera containing fenugreek flour had a higher crude fat content than injera made entirely of teff flour. Cubic model equation obtained for fat content (Yf) was,
Yf = +2.46 ∗ A + 2.26 ∗ B − 15521.70 ∗ C + 0.8540 ∗ AB + 23869.54 ∗ AC + 25128.95 ∗ BC − 18027.37 ∗ ABC − 15.83 ∗ AB (A-B) − 8166.22 ∗ AC (A-C) − 9730.99 ∗ BC (B-C), R2 = 1.0000.
3.1.7. Gross energy
Blended injera had a gross energy content of 361.59 to 385.62 kcal/100g. The highest gross energy values were obtained when 95% teff injera was blended with 5% fenugreek, while the lowest value was obtained when 100% teff injera was used alone. As a result, all of the energy contents in the blend injera sample appeared to be higher than those in the control injera sample. Multiple regression for gross energy suggested that the addition of fenugreek resulted in highest gross energy followed by teff and sorghum respectively. The interaction effect of injera made from *B, A*C, B*C, * A*B*C, A*C (A-C), B*C*(B-C), A2*B*C, AB2C, ABC2 was shown highly significantly different at p < 0.05, but interaction effect of injera made from A*B*(A-B) was non-significance difference (p < 0.05). The cubic regression model for gross injera energy (Yge) was,
Yge = +361.82 ∗ A + 348.39 ∗ B + (2.033E+05) ∗ C + 6.04 ∗ AB − (3.203E+05) ∗ AC − (3.083E+05) ∗ BC + (2.252E+05) ∗ ABC − 151.29 ∗ AB*(A-B) + (1.188E+05) ∗ AC*(A-C) + (1.040E+05) ∗ BC (B-C), R2 = 0.9992.
3.2. Antinutritional factors, total mineral content of injera
Table 10.
Antinutritional factors and minerals of injera formulations.
| Antinutritional factors (mg/100 g DM) and minerals (mg/100 g DM) of injera | |||||
|---|---|---|---|---|---|
| Formul ations | C. tannin | Phytic acid | Iron | Zinc | Calcium |
| T1 | 4.11 ± 0.030 a | 174.84 ± 0.042 a | 21.21 ± 0.028 a | 2.31 ± 0.014 a | 151.13 ± 0.028 a |
| T2 | 0.89 ± 0.565 g | 132.93 ± 0.014 d | 20.13 ± 0.014 b | 2.36 ± 0.014 a | 146.88 ± 0.000 b |
| T3 | 0.67 ± 0.000 fg | 102.64 ± 0.000 i | 16.48 ± 0.000 f | 1.86 ± 0.014 c | 111.37 ± 0.000 f |
| T4 | 1.23 ± 0.001 e | 126.36 ± 0.028 f | 18.59 ± 0.000 d | 2.13 ± 0.028 b | 130.65 ± 0.014 d |
| T5 | 0.67 ± 0.000 fg | 102.42 ± 0.000 j | 16.49 ± 0.014 f | 1.85 ± 0.014 c | 111.34 ± 0.000 f |
| T6 | 2.76 ± 0.001 b | 152.03 ± 0.000 b | 19.24 ± 0.014 c | 2.10 ± 0.014 b | 133.16 ± 0.028 c |
| T7 | 1.01 ± 0.000 ef | 96.82 ± 0.000 k | 14.94 ± 0.000 h | 1.59 ± 0.000 d | 95.13 ± 0.014 h |
| T8 | 2.02 ± 0.001 d | 130.59 ± 0.000 e | 17.47 ± 0.028 e | 1.89 ± 0.000 c | 116.74 ± 0.028 e |
| T9 | 2.33 ± 0.001 c | 126.14 ± 0.028 g | 16.34 ± 0.014 g | 1.63 ± 0.000 d | 101.93 ± 0.000 g |
| T10 | 4.11 ± 0.000 a | 174.80 ± 0.000 a | 21.23 ± 0.000 a | 2.30 ± 0.000 a | 151.10 ± 0.141 a |
| T11 | 2.71 ± 0.000 b | 121.56 ± 0.014 h | 14.63 ± 0.014 i | 1.33 ± 0.028 e | 87.11 ± 0.000 i |
| T12 | 0.89 ± 0.000 ef | 133.03 ± 0.000 c | 20.11 ± 0.000 b | 2.36 ± 0.014 a | 146.86 ± 0.042 b |
| T13 | 0.45 ± 0.001 g | 72.83 ± 0.028 l | 12.84 ± 0.014 j | 1.19 ± 0.000 f | 75.28 ± 0.000 j |
| T14 | 0.45 ± 0.001 g | 72.84 ± 0.028 l | 12.83 ± 0.014 j | 1.20 ± 0.000 f | 75.26 ± 0.028 j |
| Mean | 1.74 | 122.85 | 17.32 | 1.86 | 116.71 |
| CV (%) | 0.068 | 0.071 | 0.065 | 0.33 | 0.015 |
Note: Values are mean ± standard deviation in duplicate run. Values followed by different letters within a column indicate significant difference (p < 0.05).
3.2.1. Mineral content of injera: Among the interaction and blended component mixtures, teff-fenugreek caused the greteast increase in total iron content followed by teff injera
The combination of sorghum and teff lowered the iron level of the injera. The iron content of the composite injera ranges from 12.83 mg/100 g to 21.21 mg/100 g.The iron content of injera processed from teff-fenugreek without sorghum is significantly (p < 0.05) higher (21.21 mg/100 g) than the injera processed from pure teff other composite injera because grain fenugreek has iron contents (up to 33.5 mg/100 g) (Nasim et al., 2016) than teff grain iron content higher (25.13 mg/100 g) followed by sorghum (4.1 mg/100 g) (Baye, 2014). A minimum value (21.21 mg/100 g) was obtained at 95% teff, 5% fenugreek & 0% sorghum. Due to the lower iron content of this sorghum grain, the iron content of injera appeared to decrease as the percentage of sorghum increased. The iron content was found to be significant different (p<0.05) in linear and cubic models. The interaction effect of A*C, A*B*C, A*B*(A-B), and A*C*(A-C) flours shown significant difference at p < 0.05 and whereas the interaction of and A* B, B*C, and B*C*(B-C) flours were non-significant difference at p<0.05. The Fe content regression equation Y (Fe) was,
Y (Fe) = +20.12 ∗ A + 12.84 ∗ B − 2616.84 ∗ C + 0.0300 ∗ AB + 5259.25 ∗ AC + 3005.54 ∗ BC − 2989.56 ∗ ABC + 25.40 ∗ AB (A-B) − 2896.34 AC (A-C) − 79.67 ∗ BC (B-C), R2 = 1.0000.
The total zinc content ranged from 1.19 to 2.36 mg/100 g. Injera prepared from pure teff had significantly (p < 0.05) higher zinc content (2.36 mg/100 g) than other formulations. The lowest values (1.19 mg/100 g) were recorded in injera having 50% teff, and 50% sorghum. This is due to the lower zink content of both raw sorghum seeds with respect to tef grain. This is explained by the higher content of zinc (2.4–6.8 mg/100 g) in teff flour than sorghum (1.4-1.7mg/100 g) (Baye, 2014) and fenugreek higher (up to 2.5mg/100 g) (Nasim et al., 2016). The interaction injera made from composite flours of BC, A*B*C, AB*(A-B), A*C*(A-C), and A* B, B*C, B*C*(B-C) are not-significant difference (p<0.05) where as A*B is significantly different at p < 0.05. The regression model obtained for zinc content =
+2.36 ∗ A + 1.20 ∗ B − 818.52 ∗ C + 0.3100 ∗ AB + 1220.41 ∗ AC + 1318.70 ∗ BC − 904.73 ∗ ABC − 1.29 ∗ AB*(A-B) − 386.16 ∗ AC*(A-C) − 508.01 ∗ BC*(B-C), R2 = 0.9999.
The calcium contents of all composite injera varied from 75.26 to 151.13 mg/100 g. The highest value (151.26 mg/100 g) was obtained when the sample is processed from 95% teff-0% sorghum-5% fenugreek and the lowest value (75.26 mg/100 g) was obtained when 50% teff, 50% sorghum and 0% fenugreek were blended. Calcium content of injera increased when the proportion of teff and fenugreek in the blend increased. The observed high calcium content may be contributed by high calcium content of teff (165.2 mg/100 g) (Bultosa et al., 2002) than sorghum (5.0-5.8 mg/100 g) (Baye, 2014) and fenugreek (176 mg/100 g) (Nasim et al., 2016). Predictive model obtained for calcium content was,
= +146.87 ∗ A + 75.27 ∗ B − 79970.12 ∗ C + 1.14 ∗ AB + 1.243E+05 ∗ AC + 1.249E+05 ∗ BC − 89724.82 ∗ ABC − 7.89 ∗ AB*(A-B) − 44040.18 ∗ AC*(A-C) − 44771.34 ∗ BC*(B-C), R2 = 1.0000.
Table 11.
Coefficient of determination (R2), Adjusted R2 and analysis of variance for mixture compositions p-values of mineral content and antinutritional factors response variables.
Table 11.
Coefficient of determination (R2), Adjusted R2 and analysis of variance for mixture compositions p-values of mineral content and antinutritional factors response variables.
| Source | Condensed tannin | Phytic acid | Iron | Zinc | Calcium |
| Model | < 0.0001 | < 0.0001 | < 0.0001 | < 0.0001 | < 0.0001 |
| (1)Linear Mixture | < 0.0001 | < 0.0001 | < 0.0001 | < 0.0001 | < 0.0001 |
| AB | 1.0000 | 0.0073 | 0.4818 | 0.0001 | < 0.0001 |
| AC | 0.0003 | 0.0003 | 0.0132 | 0.1465 | < 0.0001 |
| BC | 0.0058 | 0.0003 | 0.0744 | 0.1270 | < 0.0001 |
| ABC | 0.0008 | 0.0003 | 0.0290 | 0.1394 | < 0.0001 |
| AB(A-B) | < 0.0001 | 0.4214 | 0.0001 | 0.2397 | 0.0457 |
| AC(A-C) | < 0.0001 | 0.0003 | 0.0029 | 0.1882 | < 0.0001 |
| BC(B-C) | 0.0623 | 0.0003 | 0.8714 | 0.1150 | < 0.0001 |
| R2 | 1.0000 | 1.0000 | 1.0000 | 0.9999 | 1.0000 |
| Adjusted R2 | 1.0000 | 1.0000 | 1.0000 | 0.9998 | 1.0000 |
NB: A = teff, B = sorghum and C = fenugreek.
3.2.2. Anti-nutrient content of injera
The interaction of teff, sorghum, fenugreek flour, and blending ratios affected the condensed tannin significantly (p < 0.05). The content of condensed tannins ranges from 0.45 to 4.11 mg/100 g. The lowest values (0.45 mg/100 g) were found in injera made with 50% teff, 50% sorghum, and 0% fenugreek, while the highest was 4.11 mg/100 g in injera made with 95% teff, and 5% fenugreek. This could also be due to tannin's heat lability and thermal degradation during baking. Woldemariam et al. (2019) claim that processing reduces the tannin content of cereals. The linear mixture and cubic model was significant different (p < 0.0001). The interaction injera made from composite flours except A*B, all the interaction effect of AC, BC, A*B*C, AB*(A-B), A*C*(A-C), and B*C*(B-C) are significant difference at p < 0.05. The combined effects of the independent variables under investigation in terms of coded components (model (Equation) for condensed tannin content):
Y = +0.8875 ∗ A + 0.4505 ∗ B − 701.08 ∗ C + 0.0000 ∗ AB + 1576.33 ∗ AC + 705.22 ∗ BC − 854.95 ∗ ABC + 9.07 AB*(A-B) − 950.76 ∗ AC*(A-C) + 124.19 ∗ BC*(B-C), R2 = 1.0000.
The Phytate (phytic acid) content of tef-sorghum-fenugreek injeras was significantly affected by the interaction of varieties and blending ratios (p < 0.05) and there was significance mean difference (p < 0.05) between each blending ratio and controls with phytete content in the product as shown Table 9. The teff blend with 95% teff, 0% sorghum, and 5% fenugreek had the highest phytic acid content in the composite injera. 50% teff and 50% fenugreek had the lowest value. The phytic acid content of the blends had lower values with blend with teff-sorghum flours than teff-fenugreek flours. The predicted model also, shown that the phytic acid content of composite flour influenced by fenugreek flour > teff flour > sorghum flour. Studies on the spontaneous fermentation of teff dough showed different magnitudes of phytic acid degradation in the range of 42–80% (Fischer et al., 2014). Those fermentation process has capacity to reduce phytic acid in the preparation of teff injera.
The interaction injera made from composite flours of AC, BC, A*B*C, A*C*(A-C), and B*C*(B-C) are found significant difference at p < 0.05, but AB*(A-B) was shown not-significant difference at p < 0.05.
Regression model of phytate content = +132.98 ∗ A + 72.84 ∗ B − 75182.72 ∗ C − 1.51 ∗ AB + 1.174E+05 ∗ AC + 1.182E+05 ∗ BC − 84904.49 ∗ A*BC − 11.85 ∗ AB*(A-B) − 41522.12 ∗ AC*(A-C) − 42564.96 ∗ BC*(B-C), R2 = 1.0000.
3.3. Alkaline water retention capacity and staling rate of the formulated injera
3.3.1. Effect of formulation ingredients on the Alkalin water retention capacity of injera
Alkalin water retention capacity (AWRC) of the formulated injera was taken as indication on staling degree and freshness. At zero time, after 24, 48, and 72 hr of storage, has the alkaline water retation capacity, AWRC (%) value for the composite flour injera was varies from 49.42 to 84.0, 32.92 to76.49, 32.64 to 76.01, and 23.57 to 73.66, respectively (Table 12). The AWRC of the formulated injera stored at 0 hr, after 24 hrs, and 48 hrs the responses for linear mixture and model terms of components had shown significance difference at (< 0.0001). The interaction effect of mix flour proportion of injera made from A*B, A*C, B*C, A*B*C, A*B*(A-B), A*C*(A-C), and B*C*(B-C) of alkaline retention capacity at zero time and after 48 hours–and A*B of alkaline retention capacity after 72 hours were found extremely significance difference at (p < 0.05), but A*C and B*C after 72 hours had shown not-significantly different at p < 0.05.
The addition of fenugreek to the various sorghum-teff injera formulations increased AWRC when compared to the control (teff alone) injera and teff-sorghum blend injera, owing to fenugreek's higher fiber content. When compared to the zero-time period, the freshness of all formulated injera blends and the injera control decreased over time. Furthermore, during storage at room temperature for 24, 48, and 72 hours, the rate of decrease of all blends in formulated injera was reduced. This effect is attributed to fiber's well-known water binding capacity, which prevents water loss during storage, as well as a possible interaction between fiber and starch, which slows starch retrogradation (Gomez et al., 2003).
Table 13.
Coefficient of determination (R2), Adjusted R2 and analysis of variance (ANOVA) for mixture compositions p-values of AWRC, SR and pH variables.
Table 13.
Coefficient of determination (R2), Adjusted R2 and analysis of variance (ANOVA) for mixture compositions p-values of AWRC, SR and pH variables.
| Source | AWRC @0 time | AWRC after 24 hrs. | Staling after 24 hrs. | AWRC after 48 hrs. | Staling after 48 hrs. | AWRC after 72 hrs. | Staling after 72 hrs. |
|---|---|---|---|---|---|---|---|
| Model | < 0.0001 | < 0.0001 | < 0.0001 | < 0.0001 | < 0.0001 | < 0.0001 | < 0.0001 |
| (1)Linear Mixture | < 0.0001 | < 0.0001 | < 0.0001 | < 0.0001 | < 0.0001 | < 0.0001 | < 0.0001 |
| AB | < 0.0001 | < 0.0001 | < 0.0001 | < 0.0001 | 0.0001 | 0.0155 | 0.0003 |
| AC | < 0.0001 | 0.9737 | 0.0056 | 0.0066 | 0.1297 | 0.3605 | 0.8217 |
| BC | < 0.0001 | 0.0610 | 0.0022 | 0.0096 | 0.0585 | 0.3287 | 0.5624 |
| ABC | < 0.0001 | 0.2335 | 0.0034 | 0.0080 | 0.0839 | < 0.0001 | |
| AB(A-B) | 0.0184 | < 0.0001 | 0.0002 | 0.0111 | 0.0028 | ||
| AC(A-C) | 0.0001 | 0.0332 | 0.0305 | 0.0045 | 0.3906 | ||
| BC(B-C) | < 0.0001 | 0.0052 | 0.0010 | 0.0160 | 0.0265 | ||
| A2BC | 0.0827 | ||||||
| AB2C | 0.1235 | ||||||
| ABC2 | 0.4747 | ||||||
| Lack of Fit | 0.0421 | 0.3312 | |||||
| R2 | 0.9999 | 1.0000 | 0.9999 | 0.9999 | 0.9989 | 0.9983 | 0.9983 |
| Adjusted R2 | 0.9998 | 0.9999 | 0.9996 | 0.9997 | 0.9965 | 0.9956 | 0.9968 |
NB: A = teff, B = sorghum and C = fenugreek.
3.3.2. Effect of formulation ingredients on the response percentage of staling
The primary determinants and limitations in sorghum mix content injera recipe the physical acceptability of staling during storage. After 24 hrs, 48 hrs, and 72 hrs of storage, the staling rate value for the teff injera alone (control) and injera made from composite flours of teff, sorghum, and fenugreek was determined to be in the ranges of 8.95-33.43%, 9.52-34.58%, and 12.32-52.31%, respectively. The staling rate of formulated injera stored as mentioned above responses for the linear mixture and model interaction of components was highly significance difference at (p < 0.0001). The interaction effect of mix flour proportion of injera made from A*B, A*C, B*C, A*B*C, A*B*(A-B), AC*(A-C), and B*C*(B-C) after 24 hrs; A*B, A*B*(A-B), and B*C*(B-C) after 48 hrs and A*B and A*B*C after 72 hrs were found highly significance difference at p < 0.05 whereas AC BC, ABC, AC(A-C) after 48 hrs -and A*C, and B*C after 72 hrs had shown not-significantly different at (p < 0.05).
The staling rate (SR) decreased when fenugreek flour were added, delaying staling compared to the control after 0, 24, 48, and 72 hours of storage. The higher fat and protein content of formulated injera and teff injera could explain these findings (Table 3). These findings matched with the previous studies by Calle et al. (2020), who concluded that the high fat and protein content contributed to the reduced staling rate. Multiple regression for staling were generally indicated that increase the level of fenugreek produced the decrease for in rate of staling while sorghum produced the highest increase of staling rate followed by teff in response of formulated injera.The model equation for staling rate percentage (Y1, 2, and 3 after 24, 48 and 72 hours respectively) obtained were as follows:
Y1 = +23.40 ∗ A + 33.41 ∗ B + 64540.75 ∗ C − 19.96 ∗ AB − 86938.10 ∗ AC − 1.130E+05 ∗ BC + 72010.12 ∗ ABC + 300.94 ∗ AB*(A-B) + 18874.64 ∗ AC*(A-C) + 51321.47 ∗ BC*(B-C), R2 = 0.9999.
Y2 = +25.18 ∗ A + 34.27 ∗ B + 68819.81 ∗ C − 22.47 ∗ AB − 89579.04 ∗ AC − 1.249E+05 ∗ BC + 78045.57 ∗ ABC + 424.95 ∗ AB*(A-B) + 16254.18 ∗ AC*(A-C) + 60213.55 ∗ BC*(B-C), R2 = 0.9989, and
Y3 = +39.87 ∗ A + 51.59 ∗ B − 82.19 ∗ C − 15.71 ∗ AB − 110.38 ∗ AC − 286.93 ∗ BC + 1029.88 ∗ ABC, R2 = 0.9983.
3.4. Effect of blending ratios on sensory acceptability and pH of injera
Table 14.
Sensory acceptability test result of the mean formulated fresh injera using 7-point hedonic scale.
Table 14.
Sensory acceptability test result of the mean formulated fresh injera using 7-point hedonic scale.
| Formulations | Sourness | Bitterness | Softness | stickiness | Roll ability | Odour |
|---|---|---|---|---|---|---|
| T1 | 5.57 ± 0.156 bc | 6.29 ± 0.41 a | 6.14 ± 0.113 abc | 5.64 ± 0.240 abc | 5.93 ± 0.042 b | 5.71 ± 0.849 bc |
| T2 | 6.37 ± 0.099 a | 5.86 ± 0.085 ab | 6.19 ± 0.256 abc | 5.88 ± 0.000 ab | 6.24 ± 0.325 ab | 5.71 ± 0.014 bc |
| T3 | 5.71 ± 0.127 bc | 5.87 ± 0.028 ab | 6.34 ± 0.113 abc | 5.86 ± 0.071 abc | 6.29 ± 0.113 ab | 5.57 ± 0.141 c |
| T4 | 5.57 ± 0.141 bc | 5.71 ± 0.268 ab | 5.93 ± 0.028 abc | 5.86 ± 0.156 abc | 6.29 ± 0.071 ab | 5.57 ± 0.141 c |
| T5 | 5.57 ± 0.141 bc | 6.29 ± 0.014 a | 6.57 ± 0.028 a | 6.43 ± 0.141 a | 6.57 ± 0.255 b | 5.93 ± 0.042 bc |
| T6 | 5.64 ± 0.566 bc | 5.29 ± 0.569 b | 5.14 ± 0.170 d | 5.14 ± 0.184 c | 6.00 ± 0.283 b | 6.29 ± 0.127 ab |
| T7 | 5.57 ± 0.156 bc | 5.93 ± 0.042 ab | 6.14 ± 0.198 abc | 5.71 ± 0.976 abc | 6.00 ± 0.141 ab | 5.86 ± 0.085 bc |
| T8 | 6.00 ± 0.141 ab | 6.00 ± 0.848 ab | 5.86 ± 0.057 bc | 6.00 ± 0.141 ab | 6.43 ± 0.028 ab | 6.57 ± 0.028 a |
| T9 | 6.00 ± 0.424 ab | 5.86 ± 0.071 ab | 6.43 ± 0.042 ab | 6.29 ± 0.000 ab | 6.29 ± 0.156 ab | 6.57 ± 0.141 a |
| T10 | 5.29 ± 0.057 cd | 5.83 ± 0.042 ab | 5.71 ± 0.021 d | 5.71 ± 0.014 abc | 6.00 ± 0.424 b | 5.57 ± 0.156 c |
| T11 | 5.00 ± 0.141 d | 5.43 ± 0.042 b | 5.86 ± 0.099 bc | 6.29 ± 0.283 ab | 6.43 ± 0.042 ab | 5.71 ± 0.156 bc |
| T12 | 6.29 ± 0.255 a | 6.00 ± 0.566 ab | 6.43 ± 0.255 ab | 6.29 ± 0.014 ab | 6.14 ± 0.127 ab | 5.71 ± 0.000 bc |
| T13 | 5.40 ± 0.283 cd | 5.24 ± 0.283 b | 5.79 ± 0.141 bc | 6.00 ± 0.283 ab | 6.27 ± 0.099 ab | 6.10 ± 0.000 abc |
| T14 | 5.86 ± 0.071 b | 5.43 ± 0.141 b | 6.00 ± 0.849 abc | 6.14 ± 0.099 ab | 6.23 ± 0.297 ab | 6.29 ± 0.141 ab |
| Mean | 5.70 | 5.79 | 6.04 | 5.95 | 6.22 | 5.94 |
| CV (%) | 4.15 | 4.07 | 3.41 | 4.28 | 1.75 | 2.69 |
| Formulations | Flavor | Eye distr. | color | Over all acceptability | pH | |
| T1 | 6.64 ± 0.184 a | 5.86 ± 0.085 bc | 5.00 ± 0.283 cd | 5.86 ± 0. 219 ab | 3.83 ± 0.014 cd | |
| T2 | 5.71 ± 0.028 def | 6.14 ± 0.170 ab | 5.84 ± 0.042 b | 5.99 ± 0. 047 ab | 3.82 ± 0.001 cd | |
| T3 | 5.81 ± 0.127 cde | 5.86 ± 0.028 bc | 5.86 ± 0.028 b | 5.91 ± 0. 083 ab | 3.98 ± 0.014 b | |
| T4 | 5.43 ± 0.028 f | 5.64 ± 0.127 c | 5.00 ± 0.000 cd | 5.67 ± 0. 024 ab | 4.08 ± 0.014 a | |
| T5 | 6.14 ± 0.085 bc | 6.43 ± 0.269 a | 6.00 ± 0.000 ab | 6.21 ± 0. 086 a | 3.98 ± 0.000 b | |
| T6 | 6.07 ± 0.099 bc | 6.29 ± 0.099 a | 5.29 ± 0.127 c | 5.68 ± 0. 778 ab | 4.11 ± 0.000 a | |
| T7 | 5.57 ± 0.0.014 ef | 5.57 ± 0.057 c | 5.14 ± 0.042 cd | 5.72 ± 0. 016 ab | 3.98 ± 0.003 b | |
| T8 | 6.71 ± 0.042 a | 6.43 ± 0.113 a | 5.86 ± 0.085 b | 6.21 ± 0. 125 a | 3.86 ± 0.014 c | |
| T9 | 6.14 ± 0.084 bc | 6.43 ± 0.028 a | 6.00 ± 0.141 ab | 6.22 ± 0. 089 a | 3.67 ± 0.000 e | |
| T10 | 6.27 ± 0.099 b | 5.49 ± 0.297 c | 4.87 ± 0.085 d | 5.64 ± 0. 124 b | 3.81 ± 0.014 cd | |
| T11 | 5.86 ± 0.141 cde | 6.29 ± 0.127 a | 6.14 ± 0.113 ab | 5.89 ± 0. 026 ab | 3.75 ± 0.000 de | |
| T12 | 5.43 ± 0.000 f | 6.29 ± 0.000 a | 5.86 ± 0.156 b | 6.05 ± 0. 560 ab | 3.82 ± 0.014 cd | |
| T13 | 5.91 ± 0.000 cde | 5.81 ± 0.000 bc | 6.14 ± 0.085 ab | 5.85 ± 0. 447 ab | 3.80 ± 0.014 cd | |
| T14 | 6.04 ± 0.057 bcd | 6.29 ± 0.283 a | 6.29 ± 0.269 a | 6.06 ± 0. 147 ab | 3.80 ± 0.000 cd | |
| Mean | 5.98 | 6.06 | 5.66 | 5.93 | 3.88 | |
| CV (%) | 3.45 | 4.39 | 1.52 | 2.58 | 0.15 | |
Note: Values are mean ± standard deviation in duplicate run. Values followed by different letters within a column indicate significant difference (p < 0.05).
The color of the baked injera ranged from 4.87 to 6.29. Across the 14 experimental trials, the panelists' choices varied considerably (p < 0.05). Due to their super color, the 50% teff and 50% sorghum placed top in color approval. The color intensity decreased as the level of fenugreek substitution was increased. The influence of varied quantities of fenugreek seed flour on color acceptance evaluation of fenugreek flour replacement teff injera samples was found to follow a similar pattern by Godebo et al. (2019). The interacttion effect of injera made from AC, BC, ABC, AC(A-C), and BC(B-C) was shown highly significantly different at p < 0.5, but interacttion effect of injera made from AB, and AB(A-B) were non-significance difference at p < 0.5 and each mean number gross enery value of formulated injera was significance difference (p < 0.5).
Color model equation = +5.85 ∗ A + 6.22 ∗ B − 36039.16 ∗ C − 0.4100 ∗ AB + 57417.12 ∗ AC + 55186.45 ∗ BC − 40962.07 ∗ ABC + 26.02 ∗ AB (A-B) − 21721.59 ∗ AC (A-C) − 18921.08 ∗ BC (B-C), R2= 0.9906.
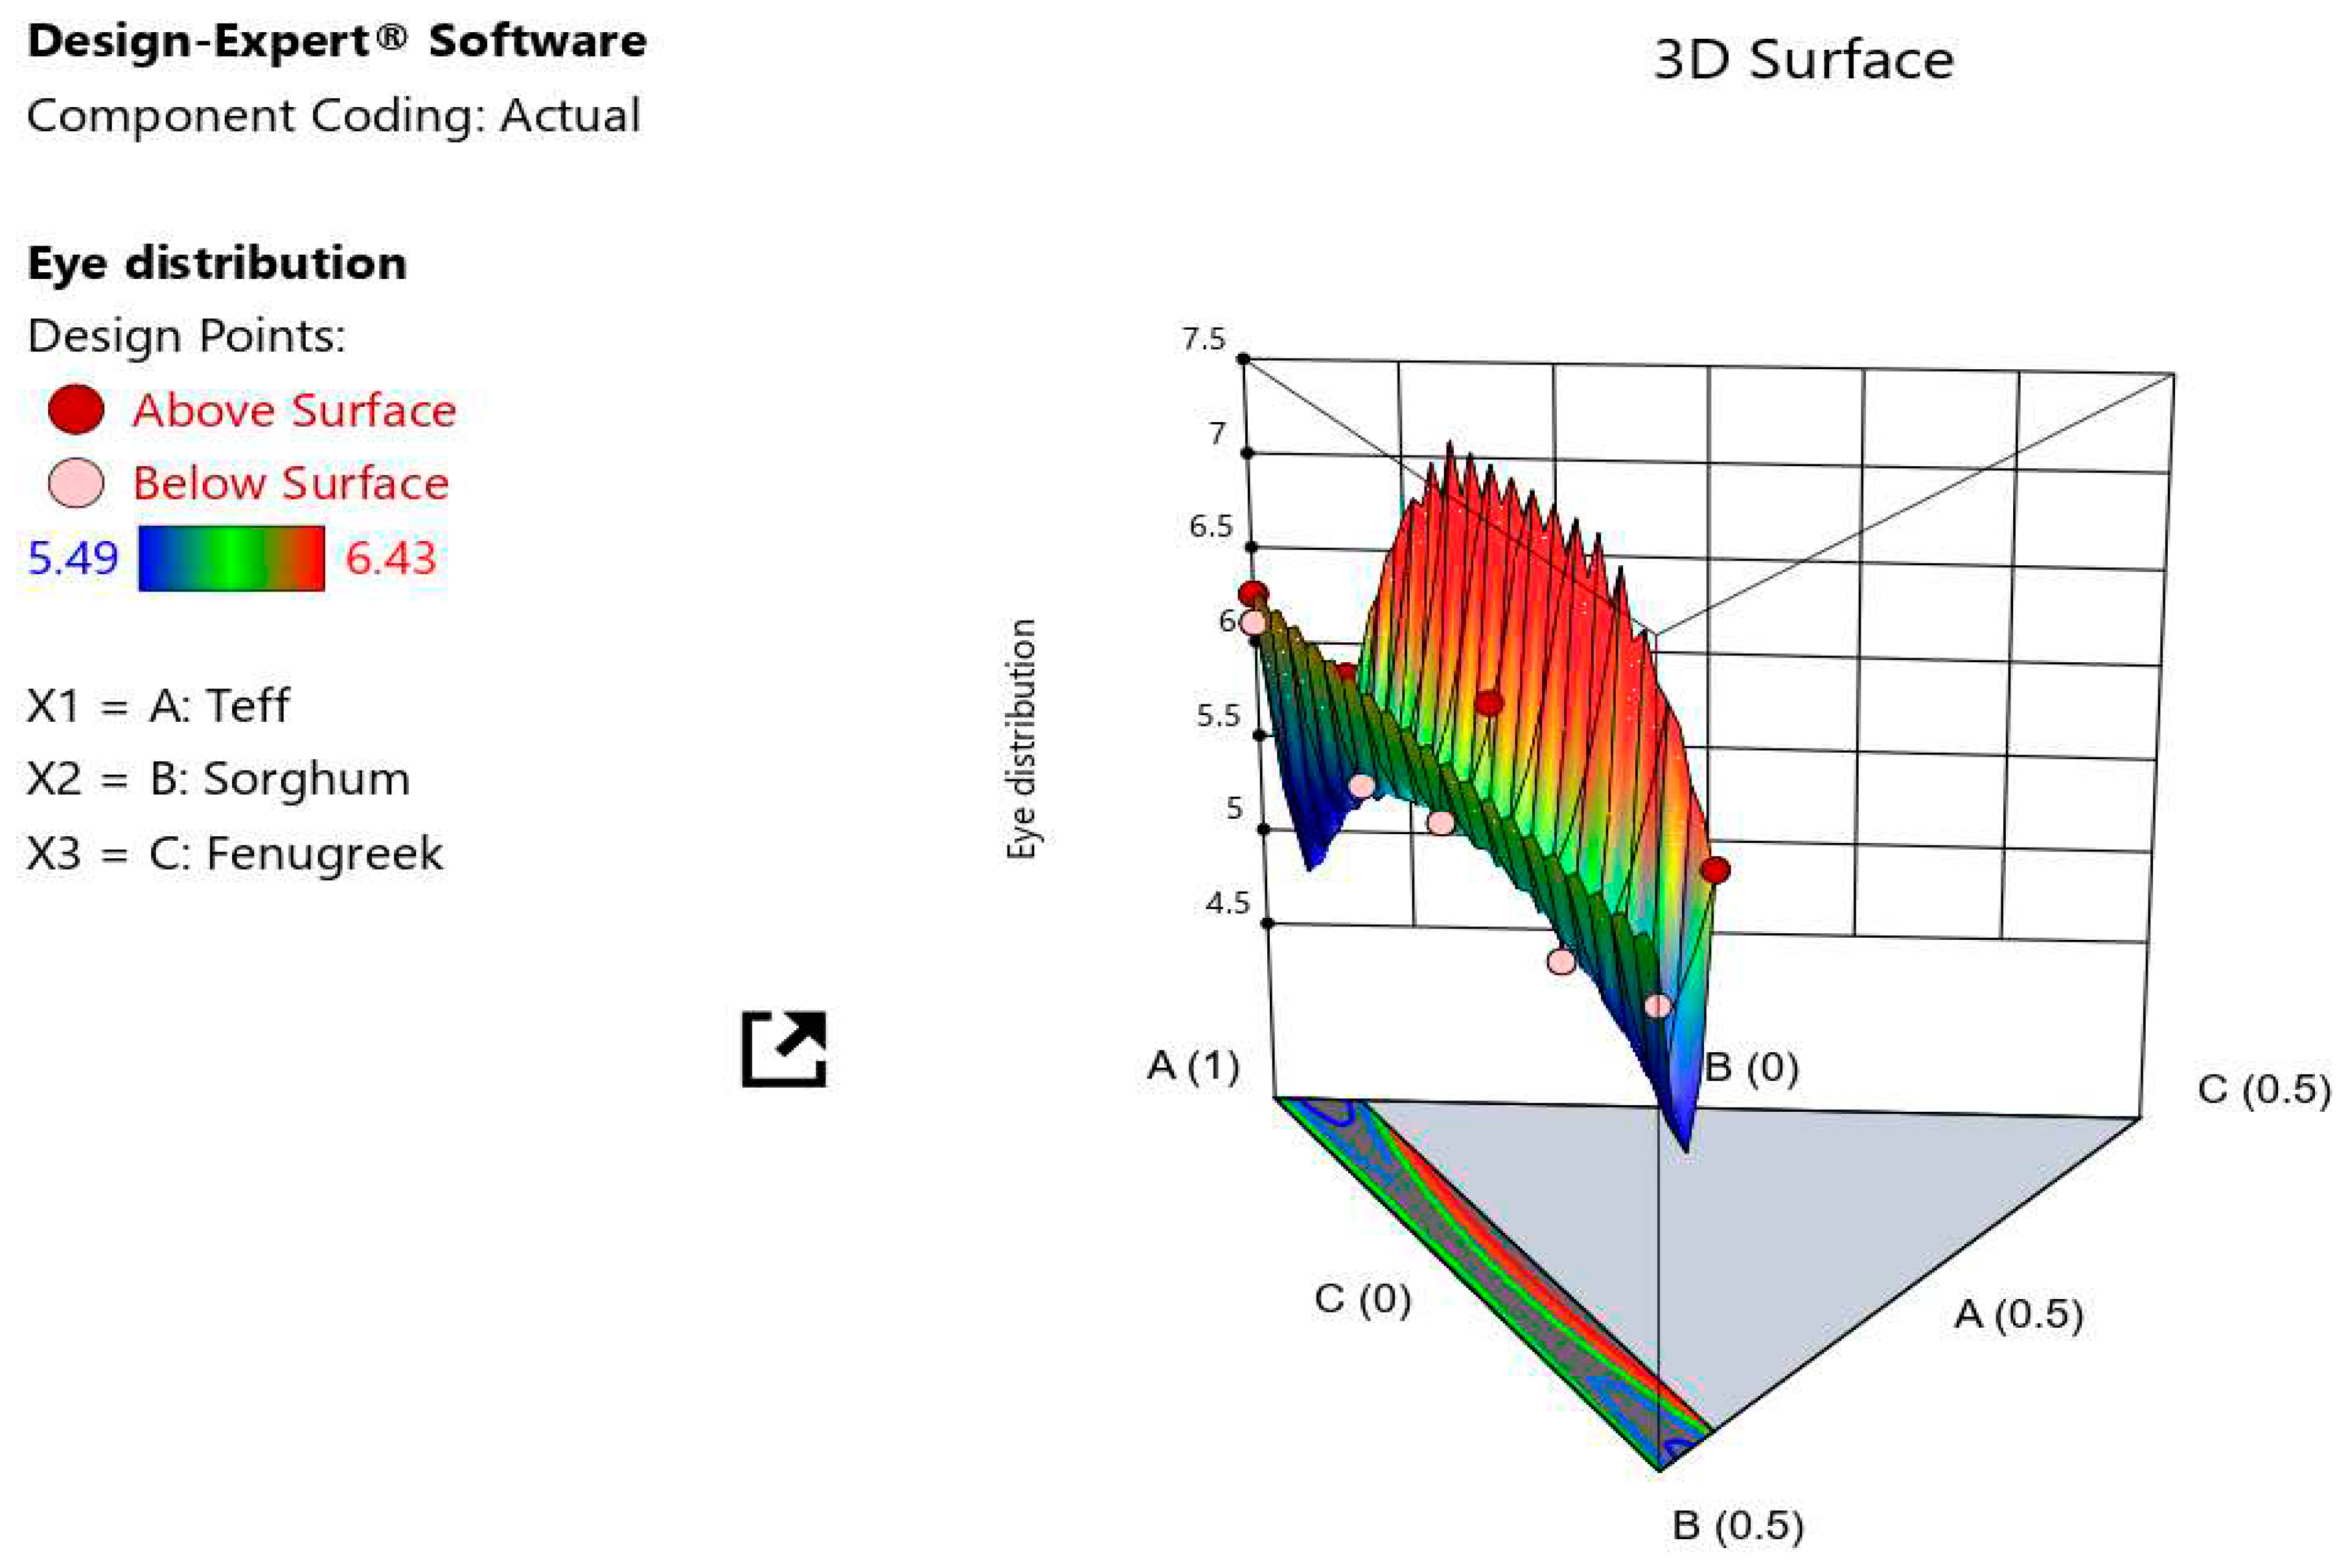
The eye distribution result of all formed injera ranged from 5.49 to 6.43. At p < 0.05, the analysis of variance blending ratios had no significant impact on the eye distribution result of all formulated injera. According to a predictive model for eye distribution, the addition of teff resulted in the highest hedonic ratings for eye distribution, followed by sorghum and fenugreek. The lowest panelist scores of the injera eyes were recorded at 95% teff and 5% fenugreek blends. The inclusion of additional fenugreek flour reduced the injera's eye appearance score when compared to injera prepared solely with teff, as determined by the panelists. It could be because fermentation produces less carbon dioxide. The eyes of injera at the top surface produced during cooking due to releasing CO2 bubbles. Sorghum injera has low sensory quality and fewer gas holes on the surface, according to Yetneberk et al. (2004).
The analysis of variance at p < 0.05 was show blending ratios had significant impact on the flavor result of all formulated injera, with the flavor result ranging from 5.43 to 6.71. The linear mixture and special quartic models interaction of composition ingredients, ANOVA interaction between flavor acceptance and injera mixing ratio was substantially different at P < 0.05. The analysis of variance was shown the interaction effect of injera made from the blending flour ratios of A*C, B*C, A2*B*C, A*B2*C and A*B*C2 had significantly different at p < 0.05, whereas A*B was not shown significant difference at p < 0.05.
The ANOVA odour result of all formulated injera had significant impact in the linear mixture and special quartic models at (p < 0.05). T8 and T9 injera, which is produced with 74 % teff, 24 % sorghum, and 3 % fenugreek, and 62 % teff, 34 % sorghum, and 4 % fenugreek, are preferred by the panelists. According to multiple regression for taste, the addition of sorghum resulted in the greatest hedonic scores for odour, followed by teff and fenugreek. This could be due to taste molecules being generated by lactic acid bacteria. Fermentation increases the flavor of food, according to blandino et al. (2003).
The formulated injera's roll ability and its interaction effect were not substantially different at (p < 0.05). The baked injera rollability score ranges from 5.93 to 6.57, according to the panelists. T5 (75% teff, 25% sorghum) had the highest rollability score, whereas T1 (95% teff, 0% sorghum, and 5% fenugreek) had the lowest. The roll ability of the fenugreek replaced injera reduced as the amount of fenugreek flour in the Injera substitution rose. It could be related to the gelatinization capability of cassava (fenugreek), which affects Injera's ability to roll (Habteab et al., 2016).
The formulated injera's softness and its interaction impact were not substantially different at (p < 0.05). The baked injera rollability score, according to the panelists, ranges from 5.14-6.57. T6 (84% teff, 12% sorghum, and 4% fenugreek) had the lowest softness score, while the best was obtained at 75 teff, 25 % sorghum. Yetneberk et al. (2004) observed that teff injera is softer than sorghum injera, and this is consistent with their findings.
The blending items had a substantial impact on the taste of injera (p < 0.05). The control injera had the most sourness acceptance, while 50% teff, 45% sorghum, and 5% fenugreek injera had the lowest sourness acceptance. The acceptance of sourness reduced as the level of fenugreek substitution rose. This could be due to the fact that fenugreek has stronger antinutritive properties than teff and sorghum. Fenugreek has a harsh taste due to saponins (anti-nutritional elements), which limits its acceptance in dishes (Hemlata and Pratima, 2015).
The baked injera bitterness score, according to the panelists, ranges from 5.24-6.29. The injera made from 50 % teff and 50 % sorghum had the lowest level of bitterness acceptance, whereas injera made from 95% teff and 5% fenugreek had the highest. The analysis of variance for bitterness had shown no significant difference at p < 0.05 in the blending ratios and model items.
Predictive model for bitterness = +5.91 ∗ A + 5.36 ∗ B + 512.12 ∗ C + 1.79 ∗ AB − 560.77 ∗ AC − 562.26 ∗ BC + 186.81 ∗ A2BC + 349.49 AB2C − 2644.27 ∗ ABC2, R2 = 0.8262.
The eye distribution result of all formed injera ranged from 5.49 to 6.43. In trail number T10, the lowest panelist scores of the injera eyes were recorded (95 % teff 0 % sorghum and 5 % fenugreek). The model graphs of the simultaneous effects of flour ingredients was shown inclusion of additional fenugreek flour reduced the injera's eye appearance score when compared to injera prepared solely with teff, as determined by the panelists (Figure 10). It could be because fermentation produces less carbon dioxide. The eyes of injera at the top surface produced during cooking due to releasing CO2 bubbles, as explained by (Yetneberk et al., 2005) and it depends on second fermentation gas bubbles formation for escaping of CO2 (Bultosa et al., 2002; Girma et al., 2013).
Table 15.
Coefficient of determination (R2), Adjusted R2 and analysis of variance for mixture compositions p-values of sensory quality response variables.
Table 15.
Coefficient of determination (R2), Adjusted R2 and analysis of variance for mixture compositions p-values of sensory quality response variables.
| Source | Sourness | bitterness | Softness | stickiness | Roll ability | Odour | Flavor | Eye distr. | color | OAA | pH |
|---|---|---|---|---|---|---|---|---|---|---|---|
| Model | 0.0300 | 0.1226 | 0.0332 | 0.2407 | 0.1014 | 0.0090 | 0.0254 | 0.1247 | 0.0011 | 0.1480 | < 0.0001 |
| (1)Linear Mixture | 0.0162 | 0.1011 | 0.0606 | 0.2111 | 0.0897 | 0.0156 | 0.0192 | 0.7033 | 0.0004 | 0.2892 | < 0.0001 |
| AB | 0.0845 | 0.0691 | 0.0785 | 0.7745 | 0.0900 | 0.1469 | 0.2620 | 0.9809 | 0.2415 | 0.2179 | < 0.0001 |
| AC | 0.2660 | 0.3018 | 0.6154 | 0.3094 | 0.0703 | 0.0787 | 0.0066 | 0.0387 | 0.0038 | 0.0464 | < 0.0001 |
| BC | 0.2676 | 0.3006 | 0.6210 | 0.4265 | 0.0930 | 0.0773 | 0.0065 | 0.0414 | 0.0046 | 0.0467 | 0.0002 |
| ABC | 0.3612 | 0.0798 | 0.0184 | 0.0041 | < 0.0001 | ||||||
| AB(A-B) | 0.0897 | 0.1143 | 0.1193 | < 0.0001 | |||||||
| AC(A-C) | 0.2088 | 0.0522 | 0.0032 | < 0.0001 | |||||||
| BC(B-C) | 0.6183 | 0.1367 | 0.0060 | 0.0008 | |||||||
| A2BC | 0.3496 | 0.4685 | 0.6609 | 0.0836 | 0.0095 | 0.0908 | |||||
| AB2C | 0.1697 | 0.1996 | 0.4980 | 0.0592 | 0.0074 | 0.0507 | |||||
| ABC2 | 0.4079 | 0.2580 | 0.8546 | 0.1718 | 0.0103 | 0.0924 | |||||
| Lack of Fit | 0.6567 | 0.5105 | 0.9174 | 0.9249 | 0.9088 | 0.7335 | 0.6065 | ||||
| R2 | 0.9083 | 0.8262 | 0.9042 | 0.8282 | 0.8977 | 0.9451 | 0.9148 | 0.6847 | 0.9906 | 0.8098 | 0.09993 |
| Adj. R2 | 0.7616 | 0.5484 | 0.7509 | 0.4418 | 0.6677 | 0.8574 | 0.7785 | 0.4145 | 0.9693 | 0.5054 | 0.9979 |
NB: A = teff, B = sorghum and C = fenugreek.
According to a predictive model for eye distribution, the addition of fenugreek resulted in the highest hedonic ratings for eye distribution, followed by teff and sorghum. Predictive regression equation for injera eye distribution (Ye) was found,
Ye = +6.21 ∗ A + 6.03 ∗ B + 412.85C + 0.0224 ∗ AB − 457.84 ∗ AC − 449.62 ∗ BC + 92.10 ∗ ABC.
The overall acceptability of formulated injera received ratings between 5.64 and 6.22. The response for each composition received a degree of acceptability above 5 on a 7-point hedonic scale. All blends received a mean rating far above average, which is an indicator of product goodness. The special quartic polynomial equation obtained for overall acceptability quality (Yoa);
pH is a physicochemical properties and indicate the sourness of injera products. The present study shown the pH value ranged from 3.67 to 4.105. The lowest pH value was found in injera made from 62% teff, 34 % sorghum, and 0.04% fenugreek; while the highest was found in injera made from 84% teff, 12 % sorghum and 4 % fenugreek flours.The samples are acidic this may be due to the presence of more quantity of fermentable carbohydrates in the formulated ingradients and good enough for eliminating spoilage microbes.
Yoa = +5.92 ∗ A + 5.91 ∗ B + 732.31 ∗ C + 0.6900 ∗ AB − 809.50 ∗ AC − 808.10 ∗ BC + 314.50 ∗ `A2BC + 382.18 ∗ AB2C − 2717.35 ∗ ABC2, R2 = 0.8098.
According to Girma et al. (2013), who was found the pH of injera sample ranges in 3.4-4.49, wich is consistence with the current study. The blending interaction and the model items had shown at p < 0.05. The multiple regression for pH was suggested that the addition of fenugreek resulted highest pH response followed by teff and sorghum.Polonomial model equation obtained for pH = +3.82 ∗ A + 3.80 ∗ B + 6479.65 ∗ C + 0.6750 ∗ AB − 11267.87 ∗ AC − 8939.39 ∗ BC + 7331.33 ∗ ABC − 25.72 ∗ AB*(A-B) + 5090.63 ∗ AC*(A-C) +2179.24 ∗ BC*(B-C), R2 = 0.09993.
Figure 10.
3D response surface plot showing the interaction effect of the proportion of ingradients (X1: A = teff, X2: B = sorghum, and X3: C = fenugreek) on the eye distribution of injera.
Figure 10.
3D response surface plot showing the interaction effect of the proportion of ingradients (X1: A = teff, X2: B = sorghum, and X3: C = fenugreek) on the eye distribution of injera.
3.5. Optimal mixture compositions
The processes were optimized for the response using the derived regression model equation linking the dependent and independent variables. The levels of X1: A through X3: C were obtained by optimization in order to optimize the injera quality qualities under the restrictions given in Table 1 for answers. In order to get an optimum flour ratio formulation that produces higher injera quality qualities, restrictions were put in place.
During overall numerical optimization maximum bitterness, color, eye distribution, overall acceptability, Fe, Zn, Ca, protein content, crude fiber, crude fat, and gross energy responses were given top priority while staling rate was minimized with high relative importance of “5” for protein content, gross energy, Fe, Zc, Ca and overall acceptability, where as relative importance of “3” for others. This is owing to the fact that bitterness, apperance (eye distribution and color), the overall acceptability affect consumers or panelists to a product (Tipwichai & Sriwattana, 2012; Habteab et al., 2016), protein-energy malnutrition, Fe, Ca, Zn and staling is a common problem (Rizwana et al., 2015; Black et al., 2008). The optimum factor variable levels for teff, sorghum, and fenugreek, according to numerical optimization are found: 64.1, 32.0, and 3.8 % with desirability and 0.590, respectively. Those, the optimum predicted response values obtained for this developed injera for crude fat, crude fiber, crude protein, gross energy, Fe, Zn, Ca, bitterness, Color, eye distribution, Overall acceptability, staling rate after 24, 48 and 72 hours were 8.549%, 5.445%, 15.691%, 374.505 kcal/100g, 16.610 mg/100 g, 1.681 mg/100 g, 104.761 mg/100 g, 5.946, 5.987, 6.540, 6.230, 24.309%, 23.140%, and 33.032%.
3.6. Model validation
For fat, fiber, protein, energy, Fe, Zn, and Ca proportion injera, the optimized formulation revealed a non-significant difference between predicted and actual values (Table 16). As a result, the design expert 13.0.5.0 software's completed equation for fat, fiber, protein percentage, energy (kcal/100 g), and mineral contents (mg/100 g), of composition is appropriate for usage in injera formulation.
4. Conclussion
An efficient approach based on mathematical modelling was employed in this work to determine blending ratios for injera preparation with optimal injera quality features. Each element had an important influence in the quality of injera. This flour blending ratios contributed to maximize the quality attribute of injera. Optimized formulation was predicted according to the polynomial models generated by the design. D-optimal mixture expert design was successfully applied to find the best combination of teff, sorghum, and fenugreek for injera production.The optimization done indicated that injera produced from 64.1% teff, 32% sorghum and 3.8% fenugreek had enhanced protein(15.691 g/100 g), energy (374.505 kcal/100 g), fat (8.549 g/100 g), fiber (5.445 g/100 g), iron (16.610 mg/100 g), zinc (1.681 mg/100 g), calcium (104.761 mg/100 g) without affecting bitterness, Color, eye distribution, and overall acceptability of the injera and had found the staling rate after 24hours (24.309%), after 48hours (23.140%) and 72hours (33.032%). This could ultimately help to avail nutritionally improved, reduced staling rate and acceptable injera to the consumer. As a result of the findings of this investigation, a follow-up study on the shelf life, storage materials, and an extensive overview of the role that making injera plays in the standard absit preparation for second phase fermentation are recommended. It is advisable to develop a starting culture and meet the standards for this kind of goods.
Authors Contributions
The Idea was conceived by Mr. Melaku Tafese Awulachew and guided by Dr. Kumsa Delessa Kuffi. The proposal writing, laboratory analysis, data management and manuscript was prepared by Melaku Tafese Awulachew. Dr. Kumsa Delessa Kuffi helped to develop review of the manuscript. Finally, both the authors are reviewed the manuscript and accepted to communicate.
Acknowledgements
We thank the staff of the Kulumsa, Melkassa and Debrezeit Agricultural research centers and Addis Ababa University for providing the teff, sorghum and fenugreek products, their rounded facilitation and execution of experimental work.
Conflicts of Interest
The authors state that they have no conflict of interest with relation to the publication of this research.
References
- Abraha, A.; Abay, F. Effect of different cereal blends on the quality of Injera a staple food in the highlands of Ethiopia. Momona Ethiopian Journal of Science 2017, V9, 232–241. [Google Scholar] [CrossRef]
- Ahmad, A.; Alghamdi, S.S.; Mahmood, K.; Afzal, M. Fenugreek a multipurpose crop: Potentialities and improvements. Saudi Journal of Biological Sciences 2016, 23, 300–310. [Google Scholar] [CrossRef] [PubMed]
- Ashenafi, M. A review article on the microbiology of indigenous fermented foods. Ethiop. J. Biol. Sci. 2006, 5, 189–245. [Google Scholar]
- Association of Official Analytical Chemistry. Approved methods of American association of cereal chemists. Arlington, TX, USA, 2000.
- Baye, K. Teff: Nutrient composition and health benefits; International Food Policy Research Institute: Washington, DC, USA, 2014; Volume 67. [Google Scholar]
- Berhane, G.; Paulos, Z.; Tafere, K.; Tamru, S. Food grain consumption and calorie intake patterns in Ethiopia (IFPRI Ethiopia Strategy Support Program II (ESSP II) Working Paper, 23). 2011. [Google Scholar]
- Bhajbhuje, M.N. Karyotoxicity of fungal metabolites in Trigonella foenum-graceum L. Int. Res. J. Sci. Eng. 2013, 1, 47–54. [Google Scholar]
- Black, R.; Allen, L.; Bhutta, Z.; Caulfield, L.; de Onis, M.; Ezzati, M.; Mathers, C.; Rivera, J. Maternal and child undernutrition: global and regional exposures and health consequences. The Lancet 2008, 371, 243–260. [Google Scholar] [CrossRef] [PubMed]
- Blandino, A.; Al-Aseeri, M.; Pandiella, S.; Cantero, D.; Webb, C. Cereal-based fermented foods and beverages. Food Research International 2003, 36, 527–543. [Google Scholar] [CrossRef]
- Bultosa, G. Physicochemical characteristics of grain and flour in 13 tef [Eragrostis tef (Zucc.) Trotter] grain varieties. Journal of Applied Sciences Research 2007, 3, 2042–2050. [Google Scholar]
- Bultosa, G. Teff: Overview. In Encyclopedia of food grains; 2nd ed.; Elsevier Ltd.: Amsterdam, The Netherlands, 2016. [Google Scholar]
- Bultosa, G.; Hall, A.; Taylor, J. Physico-chemical characterizationof grain teff (Eragrostis tef (Zucc.)Trotter) starch. Starch/Starke 2002, 54, 461–468. [Google Scholar] [CrossRef]
- Burns, R. Method for Estimation of Tannin in Grain Sorghum1. Agronomy Journal 1971, 63, 511–512. [Google Scholar] [CrossRef]
- Calle, J.; Benavent-Gil, Y.; Rosell, C. Development of gluten free breads from Colocasia esculenta flour blended with hydrocolloids and enzymes. Food Hydrocoll. 2020, 98, 105243. [Google Scholar] [CrossRef]
- Chauhan, G.; Sharma, M.; Kharkwal, H.; Varma, A. Pharmacognostic, preliminary phytochemical studies and anticancerous potential of Trigonellafoenum-graecum. Int. J. Pharm. Sci. Res. 2011, 2, 72–81. [Google Scholar]
- FAO. Report of a Technical Workshop. 2002.
- Fikreselassie, M.; Zeleke, H.; Alemayehu, N. Correlation and path analysis in Ethiopian fenugreek (Trigonella foenum-graecum L.) landraces. Crown Research Education 2012, 2, 132–142. [Google Scholar]
- Fischer, M.M.; Ines, M.E.; Isabelle, A.; Richard, F.H.; Leo, M. Phytic acid degrading lactic acid bacteria in Tef-injera fermentation. International Journal of Food Microbiology 2014, 190, 54–60. [Google Scholar] [CrossRef]
- Fitsum, W.; Ali, M.; Tadesse, F.; Hailay, G. Optimization of amaranths–teff– barley flour blending ratios for better nutritional and sensory acceptability of Injera. Cogent Food & Agriculture 2019, V, 1565079. [Google Scholar]
- Forinash, A.; Yancey, A.; Barnes, K.; Myles, T. The use of galactogogues in the breastfeeding mother. Annals of Pharmacotherapy 2012, 46, 1392–1404. [Google Scholar] [CrossRef]
- Gebrekidan, B.; GebreHiwot, B. Sorghum Injera preparation and quality parameters. In Proceedings of the International Symposium on Sorghum Grain Quality; Rooney, L.W., Murty, D.S, Eds.; ICRISAT: Patancheru, India, 1982; pp. 55–66. [Google Scholar]
- Tenkolu, G.A.; Kuffi, K.D.; Gindaba, G.T. Optimization of fermentation condition in bioethanol production from waste potato and product characterization. Biomass Conversion and Biorefnery 2022. [Google Scholar] [CrossRef]
- Girma, T.; Bultosa, G.; Bussa, N. Effect of grain tef [Eragrostis tef (Zucc.) Trotter] flour substitution with flaxseed on quality and functionality of injera. Int. J. Food Sci. Technol. 2013, 48, 350–356. [Google Scholar] [CrossRef]
- Godebo, D.; Dessalegn, E.; Niguse, G. Nutritional Composition, Microbial Load and Sensory Properties of Fenugreek (Trigonella foenum-graecum L.) Flour Substituted Injera. J. Food Process Technol. 2019, 10, 799. [Google Scholar]
- Gómez, M.; Ronda, F.; Blanco, C.; Caballero, P.; Apesteguía, A. Effect of dietary fibre on dough rheology and bread quality. Eur. Food Res. Tech. 2003, 216, 51–56. [Google Scholar] [CrossRef]
- Habteab, M.; Hussein, A.; Kevin, P.; Mark, D.; Tafadzwanashe, M. Nutritional and sensory evaluation of injera prepared from tef and Eragrostis curvula (Schrad) Nees flours with sorghum blends. Front. Plant Sci. 2016, 7, 1059. [Google Scholar]
- Hegazy, A. Influence of using fenugreek seed flour as antioxidant and antimicrobial agent in the manufacturing of beef burger with emphasis on frozen storage stability. World J. Agric. Sci. 2011, 7, 391–399. [Google Scholar]
- Jalali-Heravi, M.; Parastar, H.; Ebrahimi-Najafabadi, H. Characterization of volatile components of Iranian saffron using factorial-based response surface modeling of ultrasonic extraction combined with gas chromatography–mass spectrometry analysis. Journal of Chromatography A 2009, 1216, 6088–6097. [Google Scholar] [CrossRef] [PubMed]
- Kebede, A. Comparison of Waxy and Non-Waxy Sorghum (Sorghum bicolor) with High Protein Digestibility Traits and Teff (Eragrostis tef) in Ethiopian Injera Making Performance Global Conference, Sorghum in the 21st Century, Cape Town, South Africa. 2018. [Google Scholar]
- Leykun, T.; Admasu, S.; Abera, S. Evaluation of the mineral content, phyto-chemicals profile and microbial quality of tef Injera supplemented by fenugreek flour. Journal of Food Science and Technology 2020, 57, 2480–2489. [Google Scholar] [CrossRef]
- Lamesgen, Y.; Solomon, A.; Melese, T. Nutritional composition and sensory quality of injera prepared from tef (Eragrostis tef (Zucc.)Trotter) complemented with lupine (Lupinus spp.). Cogent Food & Agriculture 2021, 7, 1–20. [Google Scholar]
- Licciadello, F.; Cipri, L.; Muratore, G. Influence of Packaging on the quality maintenance of industrial bread by comparative shelf life testing. Food Packagaing and Shelf-life 2014, 1, 19–24. [Google Scholar] [CrossRef]
- Masresha, M.; Belay, G. Characterization of Nutritional, Antinutritional, and Mineral Contents of Thirty-Five Sorghum Varieties Grown in Ethiopia. Hindawi International Journal of Food Science 2020, 2020, 1–11. [Google Scholar]
- Maxson, E.; Rooney, L. Evaluation of methos for tanning analysis in sorghum grain. Cereal Chem. 1972, 49, 719–728. [Google Scholar]
- Marolt, G.; Kolar, M. Analytical Methods for Determination of Phytic Acid and Other Inositol Phosphates: A Review. Molecules 2020. [Google Scholar] [CrossRef]
- Mehrafarin, A.; Rezazadeh, S.; Naghdi, B.; Noormohammadi, G.; Qaderi, A. A review on biology, cultivation and biotechnology of fenugreek (Trigonella foenum-graecum L.) as a valuable medicinal plant and multipurpose. J. Med. Plants 2011, 10, 6–24. [Google Scholar]
- Mihrete, Y. The Effect of Blending Ratio of Tef [Eragrostis Tef (Zucc) Trotter], Sorghum (Sorghum bicolor (L.) Moench) and Faba Bean (Vicia faba) and Fermentation Time on Chemical Composition of Injera. J. Nutr. Food Sci. 2017, 7, 583. [Google Scholar]
- Nasim, K.; et al. Fenugreek: potential applications as a functional food and nutraceutical. Nutrition and Food Sciences Research 2016, 3, 5–16. [Google Scholar]
- Ranpariya, M.; Chudasama, R. Evaluation of total phenols and antibacterial activity of certain drug plants against some bacterial species. J. Appl. Nat. Sci. 2010, 2, 140–144. [Google Scholar] [CrossRef]
- Parra, V.; Viguera, J.; Sánchez, J.; Peinado, J.; Espárrago, F.; Gutierrez, I.; Andrés, A. Modified atmosphere packaging and vacuum packaging for long period chilled storage of dry-cured Iberian ham. Meat Sci. 2010, 84, 760–768. [Google Scholar] [CrossRef]
- Rizwana, B.; Sadiq, B.; Tauseef, S.; Farhan, S.; Rabia, N. Protein-energy malnutrition: a risk factor for various ailments. Critical Reviews in Food Science and Nutrition 2015, 55, 242–253. [Google Scholar]
- Srinivasan, K. Fenugreek (Trigonella foenum-graecum): a review of health beneficial physiological effects. Food Rev. Int. 2006, 22, 203–224. [Google Scholar] [CrossRef]
- Stone, H.; Sidel, J. Sensory Evaluation Practices; Academic Press: London, UK, 1985. [Google Scholar]
- Thomas, J.; Bandara, M.; Lee, E.; Driedger, D.; Acharya, S. Biochemical monitoring in fenugreek to develop functional food and medicinal plant variants. New Biotechnol. 2011, 28, 110–117. [Google Scholar] [CrossRef]
- Tipwichai, B.; Sriwattana, S. Optimization of strawberry-longan bar formulation using response surface methodology. Journal of Natural Sciences 2012, 11, 171–180. [Google Scholar]
- Woldemariam, F.; Tadesse, A.; Teferra, F.; Gebremedhin, H. Optimization of amaranths– teff–barley flour blending ratios for better nutritional and sensory acceptability of injera. Cogent Food & Agriculture 2019, 5, 1565079. [Google Scholar]
- Yamazaki, W.T. An alkaline water retention capacity test for the evaluation of cookie baking potentialities of soft winter wheat flours. Cereal Chem. 1953, 30, 242. [Google Scholar]
- Yetneberk, S.; DeKock, L.; Rooney, W.; Taylor, J. Effects of sorghum cultivar on Injera quality. Cereal Chem. 2004, 8, 314–321. [Google Scholar] [CrossRef]
- Yetneberk, S.; Rooney, W.; Taylor, J. Improving the quality of sorghum injeraby decortication and compositing with tef. Journal of the Science of Food and Agriculture 2005, 85, 1252–1258. [Google Scholar] [CrossRef]
- Yigzaw, Y.; Gorton, L.; Solomon, T.; Akalu, G. Fermentation of seeds of teff (Eragrostis teff), grass-pea (Lathyrus sativus), and their mixtures: Aspects of nutrition and food safety. Journal of Agricultural and Food Chemistry 2004, 52, 1163–1169. [Google Scholar] [CrossRef] [PubMed]
- Zewdu, C.; Gregory, R.; Habtamu, F.; Ashagrie, Z. Optimization and modeling of teff-maize-rice based formulation by simplex lattice mixture design for the preparation of brighter and acceptable injera. Cogent Food & Agriculture 2018, 4, 1–19. [Google Scholar]
Figure 8.
3D plot representing interaction efects of ingradients (flours) on the moisture content of injera.
Figure 8.
3D plot representing interaction efects of ingradients (flours) on the moisture content of injera.
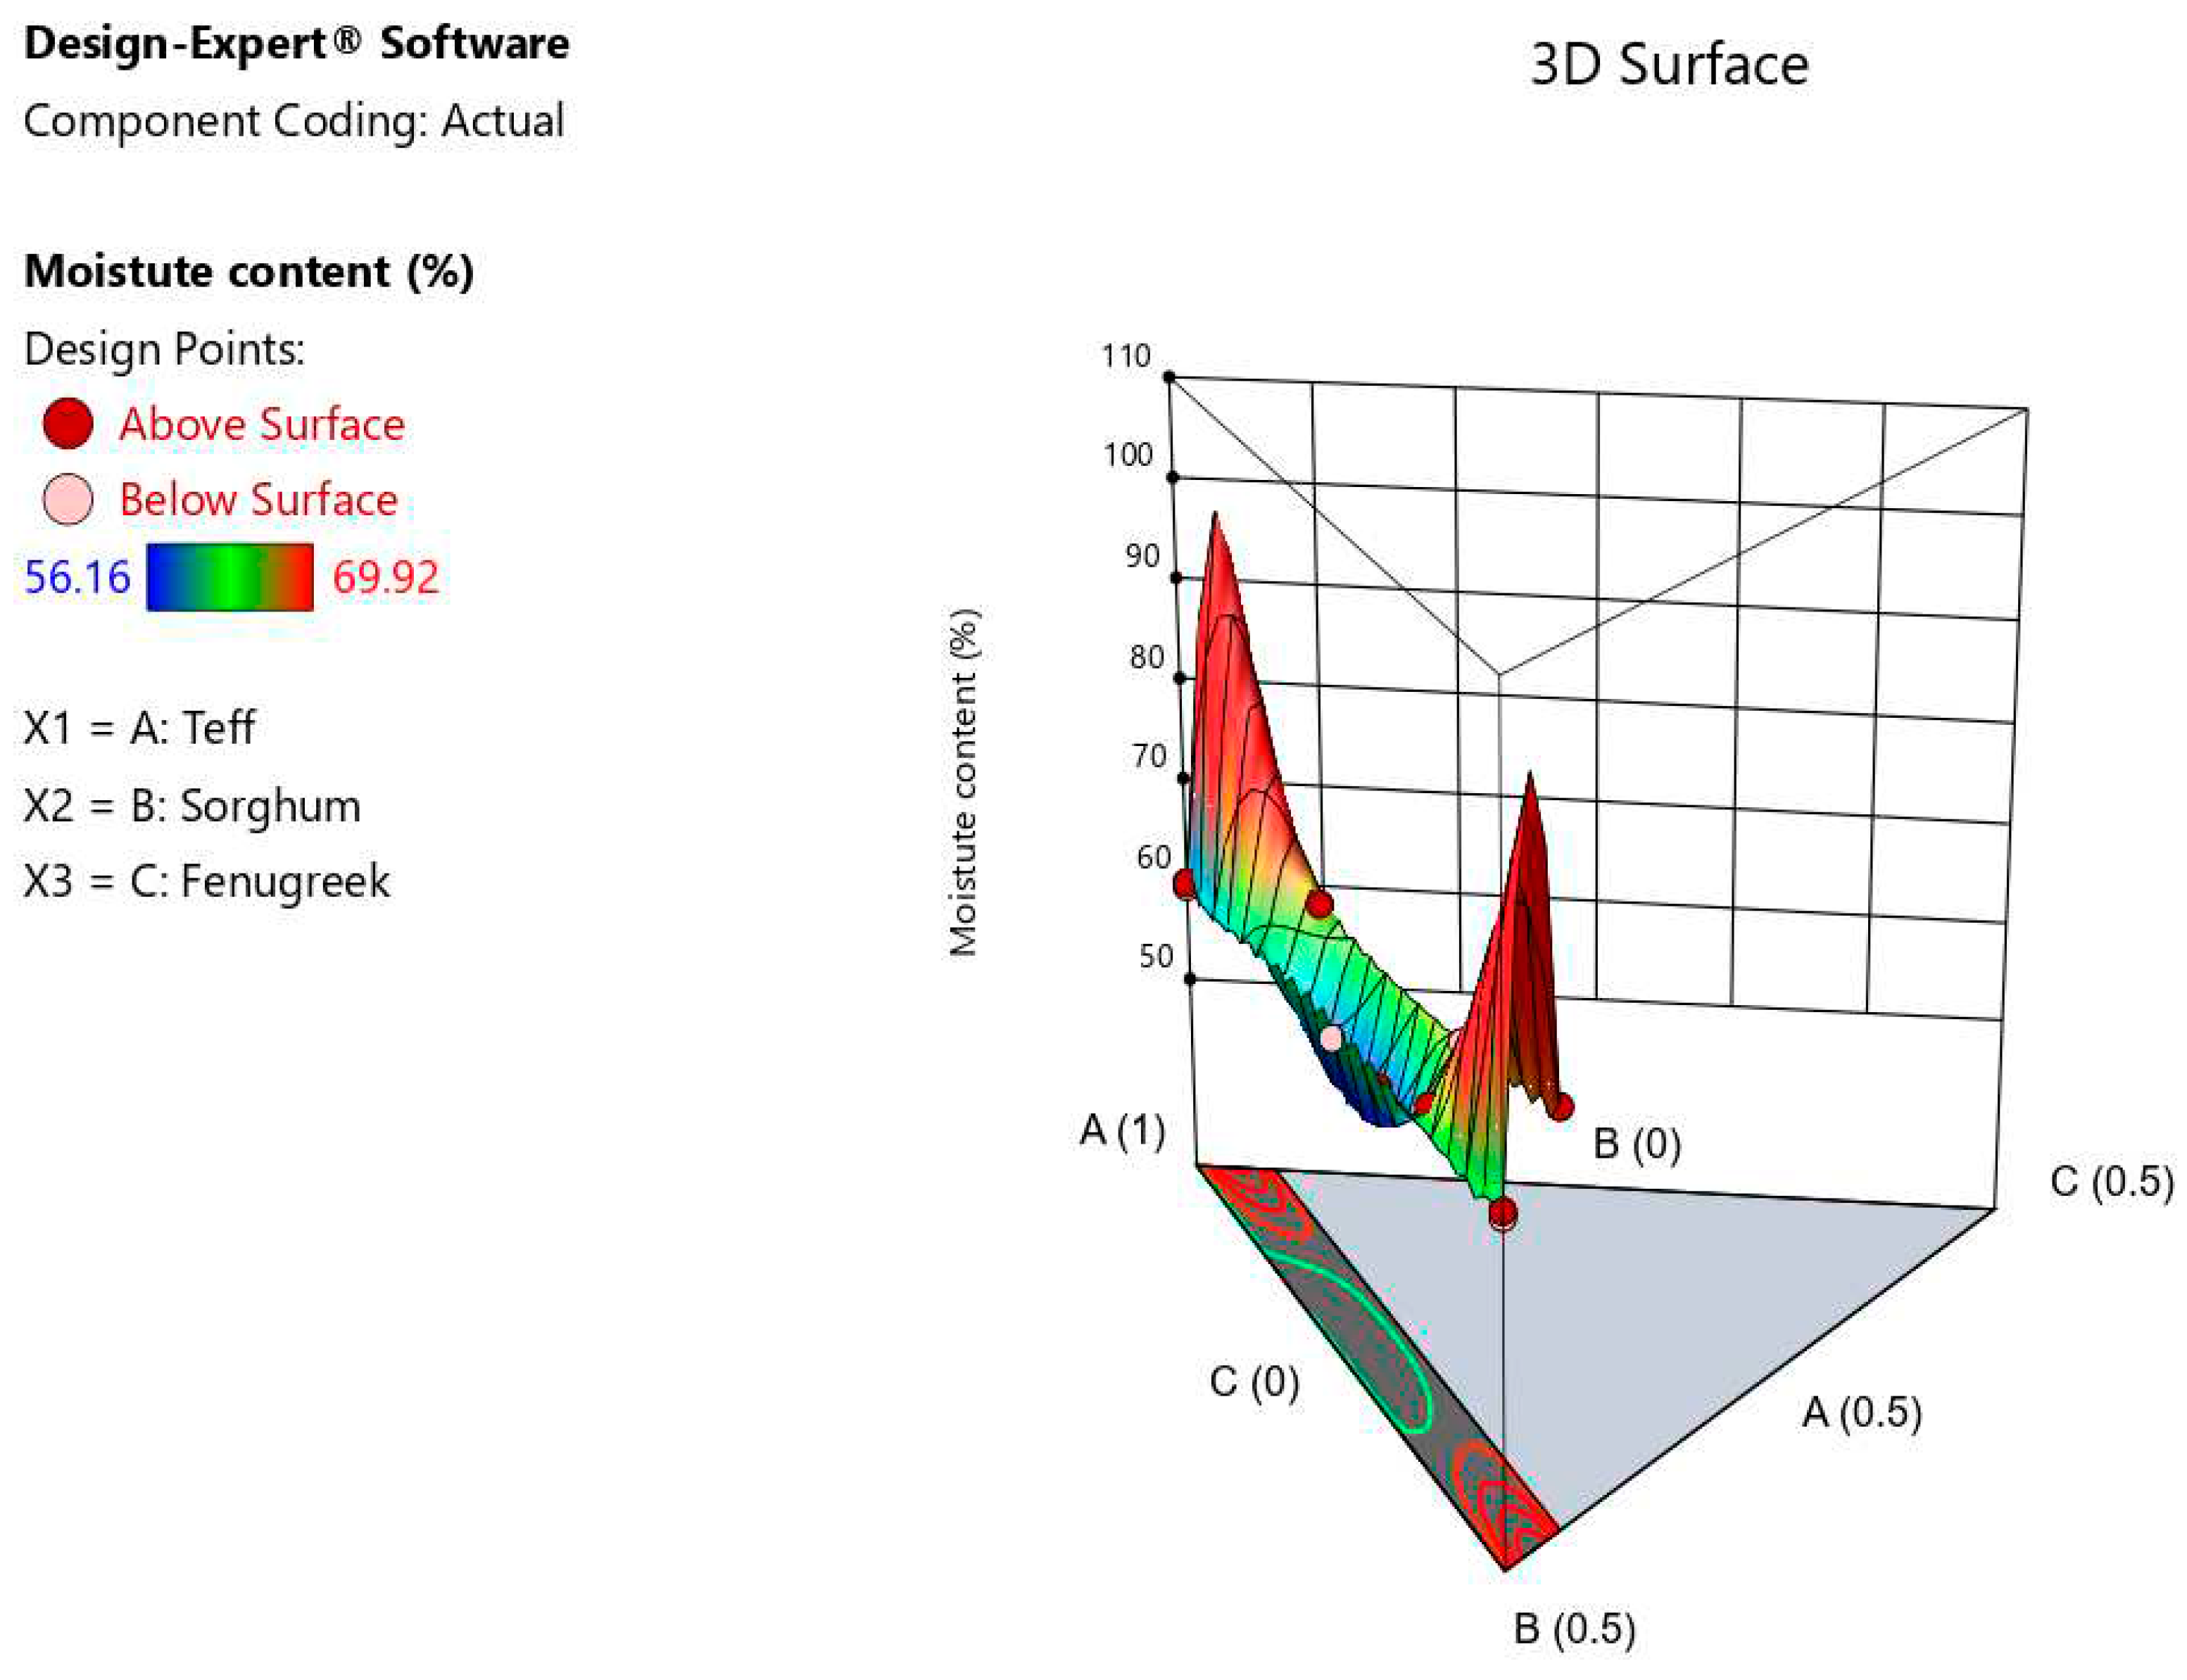
Figure 9.
3D plot showing the interaction efects of ingradients (flours) on the response crude fiber content of injera.
Figure 9.
3D plot showing the interaction efects of ingradients (flours) on the response crude fiber content of injera.
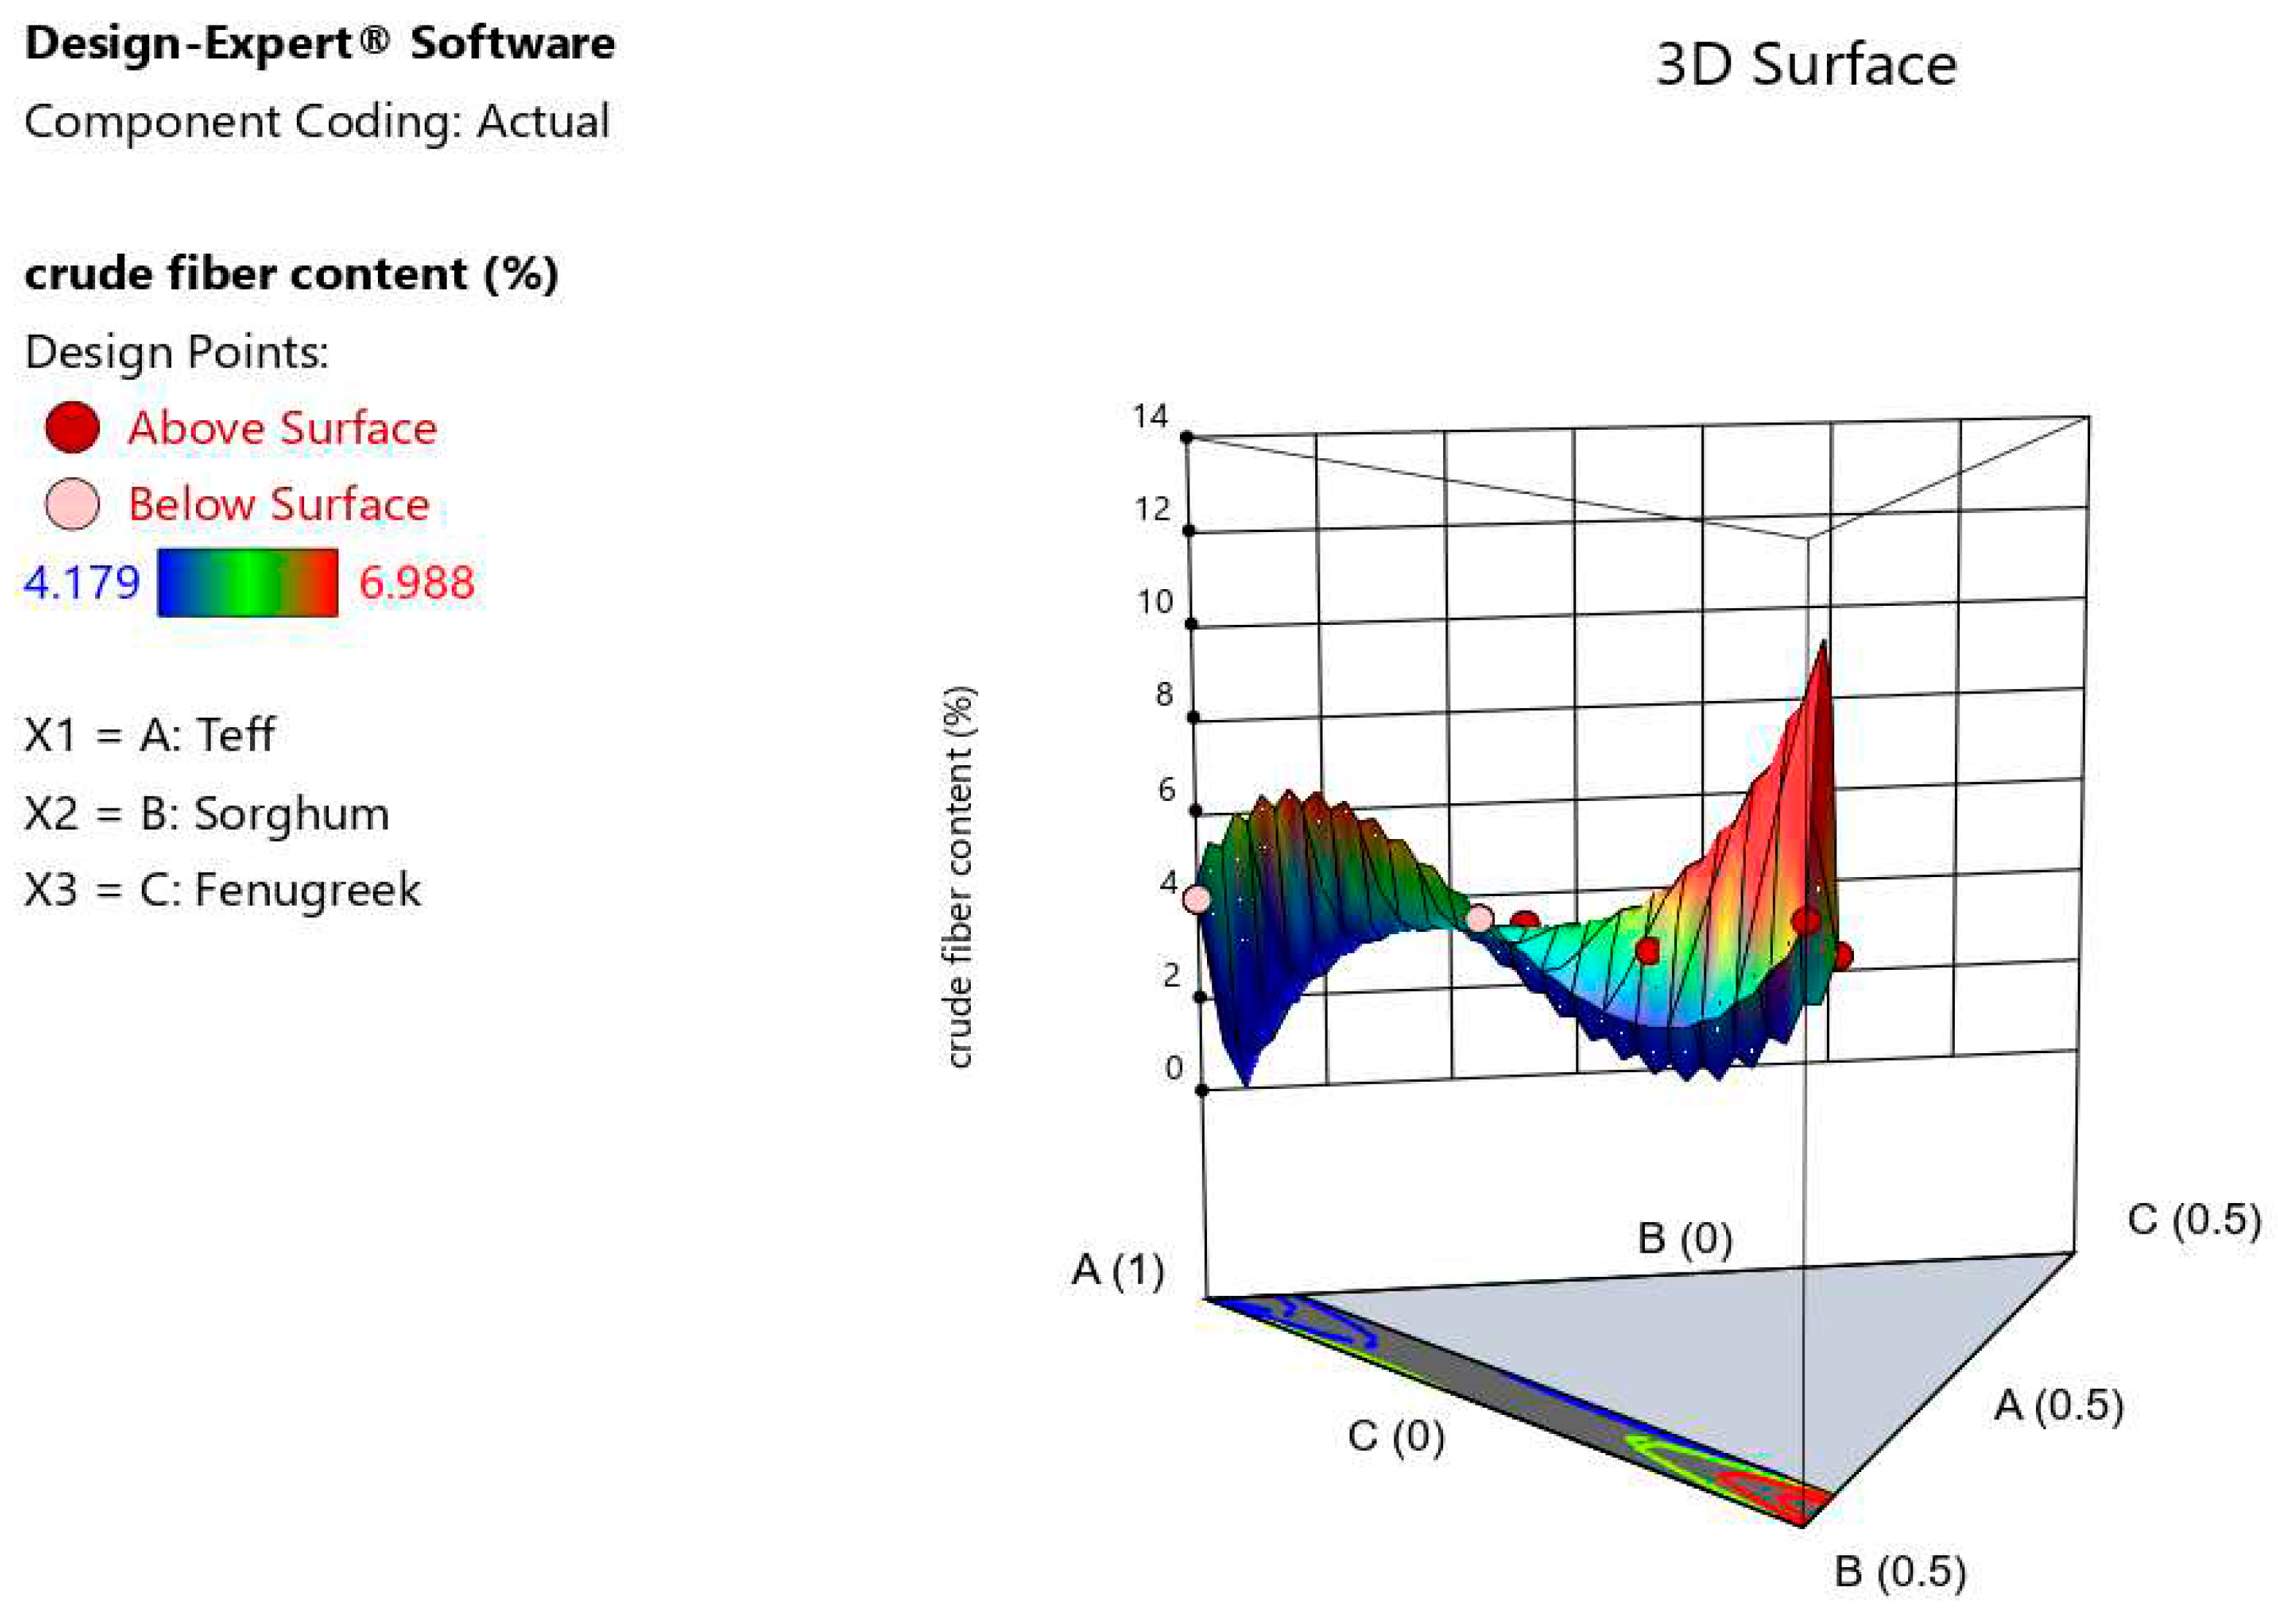
Table 3.
Proximate composition of injera formulations.
| Proximate composition of injera | |||||||
|---|---|---|---|---|---|---|---|
| Formul ations | Moisture (%Wb) | Ash (%DM) | C. Fat (%DM) | C. Fiber (%DM) | C. Protein (%DM) | U. CHO (%DM) | Energy (kcal/100g) |
| T1 | 66.44 ± 0.113 cd | 3.06 ± 0.014 c | 10.34 ± 0.001 b | 4.30 ± 0.001 ef | 14.73 ± 0.041 c | 62.72 ± 0.007 i | 385.62 ± 0.495 a |
| T2 | 60.04 ± 0.177 h | 3.14 ± 0.014 b | 2.50 ± 0.001 h | 4.18 ± 0.000 f | 11.36 ± 0.014 g | 77.71 ± 0.014 a | 362.05 ± 0.007 f |
| T3 | 62.19 ± 0.127 f | 2.92 ± 0.014 e | 2.58 ± 0.000 h | 5.38 ± 0.003 bcd | 11.71 ± 0.014 f | 76.91 ± 0.00 b | 356.14 ± 0.495 g |
| T4 | 61.75 ± 0.354 fg | 3.02 ± 0.014 cd | 3.24 ± 0.003 g | 4.64 ± 0.001 cdef | 12.67 ± 0.014 e | 74.84 ± 0.05 d | 360.64 ± 0.219 f |
| T5 | 61.43 ± 0.608 g | 2.92 ± 0.014 e | 2.57 ± 0.001 h | 5.39 ± 0.001 bcd | 11.73 ± 0.028 e | 76.15 ± 0.028 c | 357.09 ± 0.014 g |
| T6 | 65.99 ± 0.014 d | 2.97 ± 0.014 de | 8.66 ± 0.000 d | 4.71 ± 0.007 cdef | 14.71 ± 0.014 c | 65.01 ± 0.014 g | 378.00 ± 0.028 cd |
| T7 | 63.79 ± 0.014 e | 2.78 ± 0.014 f | 3.52 ± 0.000 f | 5.54 ± 1.413 def | 14.04 ± 0.0028 d | 73.07 ± 0014 e | 357.96 ± 5.713 f |
| T8 | 56.16 ± 0.678 i | 3.91 ± 0.014 a | 7.00 ± 0.028 e | 5.16 ± 0.003 bcde | 14.80 ± 0.424 c | 66.29 ± 0.297 f | 366.73 ± 2.022 e |
| T9 | 67.79 ± 0.339 b | 2.76 ± 0.014 f | 8.91 ± 0.001 c | 5.50 ± 0.000 bc | 15.91 ± 0.014 b | 63.56 ± 0.057 h | 376.06 ± 0.177 d |
| T10 | 66.89 ± 0.198 c | 3.05 ± 0.071 c | 10.34 ± 0.000 b | 4.30 ± 0.003 ef | 14.74 ± 0.014 c | 62.34 ± 0.00 j | 384.21 ± 0.184 ab |
| T11 | 69.92 ± 0.028 a | 2.64 ± 0.014 g | 10.84 ± 0.000 a | 6.00 ± 0.124 b | 17.20 ± 0.000 a | 59.54 ± 0.014 k | 380.79 ± 0.446 bc |
| T12 | 59.67 ± 0.014 h | 3.15 ± 0.00 b | 2.43 ± 0.028 h | 4.18 ± 0.000 f | 11.37 ± 0.014 g | 77.74 ± 0.014 a | 361.59 ± 0.255 f |
| T13 | 63.21 ± 0.297 e | 2.68 ± 0.014 g | 2.26 ± 0.000 i | 6.99 ± 0.004 a | 14.08 ± 0.014 d | 74.99 ± 0.028 d | 348.68 ± 0.149 h |
| T14 | 63.76 ± 0.085 e | 2.67 ± 0.028 g | 2.26 ± 0.004 i | 6.99 ± 0.001 a | 14.07 ± 0.014 d | 74.86 ± 0.064 d | 348.10 ± 0.269 h |
| Mean | 63.50 | 2.98 | 5.53 | 5.23 | 13.86 | 70.41 | 365.98 |
| CV (%) | 0.61 | 0.21 | 0.44 | 0.024 | 2.04 | 0.43 | 0.18 |
Note: Values are mean ± standard deviation in duplicate run. Values followed by different letters within a column indicate significant difference (p < 0.05). DM=dry matter, CV = coefficient of variance, C = crude, U. CHO = Utilizable carbohydrate content and energy = gross energy.
Table 4.
Sequential model comparison and the corresponding lack-of-fit tests for protein content response.
Table 4.
Sequential model comparison and the corresponding lack-of-fit tests for protein content response.
| Model Comparison | |||
|---|---|---|---|
| Source | Sequential p-value | Lack of Fit p-value | |
| Linear | < 0.0001 | < 0.0001 | |
| Quadratic | < 0.0001 | 0.0433 | |
| Special cubic | 0.0010 | 0.5857 | Suggested |
| Cubic | 0.5857 | ||
| Special quartic vs quadratic | 0.0171 | 0.4172 | |
| Quartic vs cubic | Aliased | ||
| Quartic vs special quartic | 0.4172 | Aliased | |
Table 5.
Model comparison: Summary statistics for the percent protein content.
| Summary statistics for protein content responses | ||||||
|---|---|---|---|---|---|---|
| Source | Std. Dev. | R2 | Adjusted R2 | Predicted R2 | PRESS | |
| Linear | 0.3658 | 0.9646 | 0.9582 | 0.9485 | 2.14 | |
| Quadratic | 0.0187 | 0.9999 | 0.9999 | 0.9997 | 0.0121 | |
| Special Cubic | 0.0088 | 1.0000 | 1.0000 | 1.0000 | 0.0021 | Suggested |
| Cubic | 0.0094 | 1.0000 | 1.0000 | * | ||
| Special Quartic | 0.0092 | 1.0000 | 1.0000 | * | ||
| Quartic | 0.0094 | 1.0000 | 1.0000 | * | Aliased | |
* PRESS = Small predicted residual sum of squares.
Table 6.
ANOVA and fit statistics for the special cubic model of the response protein.
| ANOVA for protein content responses | ||||||
|---|---|---|---|---|---|---|
| Source | Sum of Squares | Df | Mean Square | F-value | p-value | |
| Model | 41.59 | 6 | 6.93 | 89587.64 | < 0.0001 | significant |
| ⁽¹⁾Linear Mixture | 40.11 | 2 | 20.06 | 2.593E+05 | < 0.0001 | |
| Teff*sorghum | 1.33 | 1 | 1.33 | 17236.47 | < 0.0001 | |
| Teff*fenugreek | 0.4148 | 1 | 0.4148 | 5361.53 | < 0.0001 | |
| Sorghum*fenugreek | 0.4151 | 1 | 0.4151 | 5365.81 | < 0.0001 | |
| Teff*sorghum*fenugreek | 0.0022 | 1 | 0.0022 | 29.05 | 0.0010 | |
| Residual | 0.0005 | 7 | 0.0001 | |||
| Lack of Fit | 0.0002 | 3 | 0.0001 | 0.7297 | 0.5857 | not significant |
| Pure Error | 0.0003 | 4 | 0.0001 | |||
| Cor Total | 41.59 | 13 | ||||
Table 7.
Fit statistics (regression coefcients of the model).
| Std. Dev. | Mean | C.V. % | R2 | Adjusted R2 | Predicted R2 | Adeq Precision |
|---|---|---|---|---|---|---|
| 0.0088 | 13.79 | 0.0638 | 1.0000 | 1.0000 | 1.0000 | 938.4305 |
Table 8.
Diagnostics report for the protein response.
| Run order | Actual value | Predicted value | Residual | Leverage | Internally studentized residuals | Externally studentized residuals | Cook's distance | Influence on fitted value DFFITS |
|---|---|---|---|---|---|---|---|---|
| 1 | 14.73 | 14.74 | −0.0058 | 0.480 | −0.917 | −0.905 | 0.111 | −0.870 |
| 2 | 11.36 | 11.36 | −0.0045 | 0.480 | −0.708 | −0.681 | 0.066 | −0.654 |
| 3 | 11.71 | 11.72 | −0.0105 | 0.497 | −1.705 | −2.065 | 0.411 | −2.054 |
| 4 | 12.67 | 12.67 | −0.0025 | 0.470 | −0.392 | −0.367 | 0.019 | −0.346 |
| 5 | 11.73 | 11.72 | 0.0095 | 0.497 | 1.530 | 1.736 | 0.330 | 1.726 |
| 6 | 14.71 | 14.70 | 0.0066 | 0.440 | 1.005 | 1.005 | 0.113 | 0.891 |
| 7 | 14.04 | 14.03 | 0.0079 | 0.471 | 1.243 | 1.304 | 0.196 | 1.230 |
| 8 | 14.80 | 14.81 | −0.0081 | 0.375 | −1.173 | −1.212 | 0.118 | −0.939 |
| 9 | 15.91 | 15.91 | 0.0002 | 0.447 | 0.029 | 0.027 | 0.000 | 0.024 |
| 10 | 14.74 | 14.74 | 0.0042 | 0.480 | 0.673 | 0.645 | 0.060 | 0.619 |
| 11 | 17.21 | 17.21 | −0.0001 | 0.922 | −0.035 | −0.033 | 0.002 | −0.113 |
| 12 | 11.37 | 11.36 | 0.0055 | 0.480 | 0.882 | 0.866 | 0.103 | 0.832 |
| 13 | 14.08 | 14.08 | 0.0038 | 0.480 | 0.602 | 0.572 | 0.048 | 0.550 |
| 14 | 14.07 | 14.08 | −0.0062 | 0.480 | −0.989 | −0.987 | 0.129 | −0.949 |
Table 9.
Analysis of variance p-value, Coefficient of determination (R2) and Adjusted R2 of proximate composition.
Table 9.
Analysis of variance p-value, Coefficient of determination (R2) and Adjusted R2 of proximate composition.
| Source | Moisture | Ash | Fat | fiber | Protein | carbohydrate | Energy |
|---|---|---|---|---|---|---|---|
| Model | < 0.0001 | < 0.0001 | < 0.0001 | < 0.0001 | < 0.0001 | < 0.0001 | < 0.0001 |
| (1)Linear Mixture | < 0.0001 | < 0.0001 | < 0.0001 | < 0.0001 | < 0.0001 | < 0.0001 | < 0.0001 |
| AB | 0.6657 | 0.0941 | 0.0005 | < 0.0001 | < 0.0001 | 0.4463 | 0.0564 |
| AC | < 0.0001 | < 0.0001 | 0.0009 | < 0.0001 | < 0.0001 | 0.0092 | 0.0116 |
| BC | < 0.0001 | < 0.0001 | 0.0008 | < 0.0001 | < 0.0001 | 0.0093 | 0.0137 |
| ABC | 0.0008 | < 0.0001 | 0.0010 | 0.0128 | |||
| AB(A-B) | 0.0129 | < 0.0001 | 0.2054 | ||||
| AC(A-C) | 0.0011 | < 0.0001 | 0.0104 | ||||
| BC(B-C) | 0.0006 | < 0.0001 | 0.0184 | ||||
| A2BC | < 0.0001 | < 0.0001 | 0.0102 | ||||
| AB2C | < 0.0001 | < 0.0001 | 0.0093 | ||||
| ABC2 | < 0.0001 | < 0.0001 | 0.0115 | ||||
| Lack of Fit | 0.7990 | 0.6956 | 0.5857 | 0.5443 | |||
| R2 | 0.9965 | 0.9999 | 1.0000 | 1.0000 | 1.0000 | 0.9993 | 0.9992 |
| Adjusted R2 | 0.9908 | 0.9997 | 1.0000 | 1.0000 | 1.0000 | 0.9958 | 0.9973 |
NB: A = teff, B = sorghum and C = fenugreek.
Table 12.
Alkaline water retation capacity and staling rate of injera.
| Alkaline water retation capacity and staling rate | |||||||
|---|---|---|---|---|---|---|---|
| Formul ations | % AWRC at zero time | % AWRC after 24 hr | % SRafter 24 hr | % AWRC after 48 hr | % SRafter 48 hr | % AWRC after 72 hr | % SRafter 72 hr |
| T1 | 78.68 ± 0.210 b | 71.11 ± 0.231 b | 9.62 ± 0.22 b | 68.25 ± 0.11 b | 13.26 ± 0.12 j | 64.57 ± 0.120 b | 17.93 ± 0.221 h |
| T2 | 52.09 ± 0.211 i | 39.83 ± 0.131 h | 23.54 ± 0.152 b | 38.93 ± 0.311 i | 25.26 ± 0.251 d | 31.07 ± 0.121 f | 40.35 ± 0.181 e |
| T3 | 53.75 ± 0.140 h | 41.09 ± 0.090 g | 23.55 ± 0.121 b | 40.65 ± 0.212 h | 24.37 ± 0.180 e | 31.22 ± 0.160 f | 41.92 ± 0.300 c |
| T4 | 58.28 ± 0.061 g | 41.09 ± 0.150 g | 21.33 ± 0.111 b | 43.22 ± 0.231 f | 25.84 ± 0.152 c | 34.46 ± 0.211 ef | 40.87 ± 0.131 e |
| T5 | 53.61 ± 0.163 h | 41.13 ± 0.132 g | 23.28 ± 0.292 b | 40.83 ± 0.241 h | 23.84 ± 0.211 f | 31.26 ± 0.321 h | 41.69 ± 0.240 c |
| T6 | 67.08 ± 0.441 d | 53.44 ± 0.232 d | 20.33 ± 0.322 b | 52.61 ± 0.412 d | 21.57 ± 0.390 i | 45.7 ± 0.280 cd | 31.87 ± 0.361 g |
| T7 | 60.87 ± 0.160 f | 46.43 ± 0.241 f | 23.72 ± 0.213 b | 46.28 ± 0.513 f | 23.97 ± 0.321 f | 35.69 ± 0.411 ef | 41.37 ± 0.272 c |
| T8 | 62.62 ± 0.331 e | 48.43 ± 0.290 e | 22.66 ± 0.312 b | 47.99 ± 0.351 e | 23.36 ± 0.340 g | 39.41 ± 0.171 de | 37.06 ± 0.251 f |
| T9 | 72.93 ± 0.312 c | 55.88 ± 0.241 c | 23.39 ± 0.221 b | 56.93 ± 0.342 c | 21.94 ± 0.330 h | 49.86 ± 0.180 c | 31.63 ± 0.241 g |
| T10 | 78.72 ± 0.212 b | 71.05 ± 0.231 b | 9.74 ± 0.221 b | 68.96 ± 0.11 b | 12.40 ± 0.001 k | 64.86 ± 0.120 b | 17.61 ± 0.221 i |
| T11 | 84.01 ± 0.421 a | 76.49 ± 0.362 a | 8.95 ± 0.381 b | 76.01 ± 0.282 a | 9.52 ± 0.351 l | 73.66 ± 0.271 a | 12.32 ± 0.342 g |
| T12 | 52.11 ± 0.191 i | 39.99 ± 0.121 h | 23.26 ± 0.142 b | 39.03 ± 0.301 i | 25.10 ± 0.243 d | 32.74 ± 0.110 ef | 37.17 ± 0.171 f |
| T13 | 49.42 ± 0.163 j | 32.92 ± 0.082 j | 33.39 ± 0.121 b | 32.64 ± 0.152 j | 33.95 ± 0.172 b | 23.57 ± 0.091 gh | 52.31 ± 0.131 a |
| T14 | 49.92 ± 0.141 j | 33.23 ± 0.100 i | 33.43 ± 0.121 b | 32.66 ± 0.132 j | 34.58 ± 0.141 a | 24.38 ± 0.061 gh | 51.16 ± 0.102 b |
| Mean | 62.44 | 49.44 | 21.44 | 48.93 | 22.78 | 41.60 | 35.38 |
| CV (%) | 0.30 | 0.25 | 0.67 | 0.53 | 1.86 | 1.60 | 4.38 |
Note: Values are mean ± standard deviation in duplicate run. Values followed by different letters within a column indicate significant difference (p < 0.05).
Table 16.
Predicted and actual values of fat, fiber, protein, Fe, Zn, Ca, and energy proportion contents of optimal formulation.
Table 16.
Predicted and actual values of fat, fiber, protein, Fe, Zn, Ca, and energy proportion contents of optimal formulation.
| Independent variables | Values | Percentage (%) of | Energy, kcal/100 g | Minerals (in mg/100 g) | ||||
|---|---|---|---|---|---|---|---|---|
| C. fat | C. fiber | Protein | Fe | Zn | Ca | |||
| X1:A = 64.1, X2:B = 32.0, and X3:C = 3.8 % | P. value | 8.549 | 5.445 | 15.691 | 374.505 | 16.610 | 1.681 | 104.761 |
| Ac. value | 8.552 | 5.447 | 15.694 | 374.569 | 16.615 | 1.684 | 104.763 | |
| % RSE | 0.035 | 0.037 | 0.019 | 0.017 | 0.030 | 0.178 | 0.002 | |
* A = Actual, P = Predicted.
Disclaimer/Publisher’s Note: The statements, opinions and data contained in all publications are solely those of the individual author(s) and contributor(s) and not of MDPI and/or the editor(s). MDPI and/or the editor(s) disclaim responsibility for any injury to people or property resulting from any ideas, methods, instructions or products referred to in the content. |
© 2023 by the authors. Licensee MDPI, Basel, Switzerland. This article is an open access article distributed under the terms and conditions of the Creative Commons Attribution (CC BY) license (http://creativecommons.org/licenses/by/4.0/).
Copyright: This open access article is published under a Creative Commons CC BY 4.0 license, which permit the free download, distribution, and reuse, provided that the author and preprint are cited in any reuse.


