

Submitted:
22 August 2023
Posted:
24 August 2023
You are already at the latest version
Abstract
The present study aimed to develop a feeding strategy for pregnant sows which involved the prenatal administration of a mixture of pancreatic-like fungal enzymes, such as lipase, amylase, and protease, at (1) 1–115 days of gestation (group D1) and (2) 80–115 days of gestation (group D2) and to carry out a comparison with groups of sows that were not receiving such supplementation (negative control [NC] and positive control [PC]). It was found that the administration of the enzyme supplement resulted in a significant shortening of gestation (P ≤ 0.01). The pancreatic enzymes administered to sows had a significant effect on the number of liveborn piglets and weaned piglets, which was higher compared to the control groups that did not receive supplementation respectively: D1-12.1±1.1 and 11.12±1.1; D2- 12.8±1.3 and 11.75±0.07 vs. control groups KN-10.7±1.0 and 9.62±0,95 and KP 10.9±1.2 and 10.15±1.0 (P<0.006). Significant changes in piglet growth were observed after weaning up to 70 days of age. During this period, the most favorable growth parameters were found in groups D2 (420±91g) and PC (407±103g), in which piglets were given a mixture of pancreatic enzymes (lipase, amylase, and protease) at 3 weeks of age, and significantly higher weight gain and feed intake were observed compared to groups NC (378±114g) and D1 (381±96g) (P ≤ 0.007). In contrast, insulin levels were significantly lower in groups D1 and D2, respectively 6,8 IU/ml and 6,7 IU/ml compared to groups NC (14,6 IU/ml) and PC (16,6 IU/ml) ( (P ≤ 0.01). Piglets in group D2 had a significantly better feed conversion ratio (FCR) 1.604±0.10 compared to the other dietary groups: KN– 1.986±0.14; KP– 1.704±0.11; D1 – 1.932±0.15 (P ≤ 0.03). Histological imaging confirmed significantly thicker intestinal epithelium and intestinal mesenteron in animals from groups D2 and PC (P ≤ 0.03). Animals from the groups KP, D1 and D2 receiving enzymes showed a highly significant increase in the surface area of pancreatic follicles and pancreatic surface area compared to the group without KN supplementation (P<0.01). Furthermore, significantly higher activity of the brush border enzyme lactase was observed in groups D1; D2 and PC compared, respectively 32.90±3.99; 30.00±6.83 and 29.60±29.60 to group NC – 21.80± 3.27 (P ≤ 0.01).
Keywords:
piglets rearing
; pancreatic-like enzymes (PLEM)
; IUGR
1. Introduction
Despite continuous improvements in herd management and intensive research into mammalian nutritional requirements with the use of modern analytical techniques, the intrauterine growth restriction (IUGR) syndrome remains a challenge in animal husbandry due to the unavailability of adequate literature on the effect of nutrition on fetal growth regulation mechanisms [1]. Increasing the number of fetuses in the uterus without expanding the uterine volume results in relative placental failure and low birth weight of the newborn [2]. Similar to humans, the IUGR syndrome arises spontaneously in piglets affecting 6–8% of newborns and increases in proportion to the increasing number of piglets in a litter. This high incidence of the syndrome has increasing economic consequences in livestock production. Animals with the IUGR syndrome are characterized by a high mortality rate of approximately 85% in the first 2–3 days of postnatal life.
In livestock, the primary cause of the IUGR syndrome is an imbalanced diet. Interestingly, both a diet that is low in protein and a diet containing an excess of protein can leavd to the development of the IUGR syndrome [3]. In rats and mice, the use of a high-protein diet in the second half of pregnancy has been shown to cause a significant reduction in neonatal birth weight [4]. These findings are in agreement with the growth slowdown observed during the last trimester of pregnancy in women who prefer a high-protein diet [5]. The main reasons for this observation are a delay in blastocyst development caused by excessive amount of toxic protein breakdown products circulating in the body of the mother [6]. A high-protein diet is also associated with an increase in the energy cost of urine production and hepatic gluconeogenesis, which can reduce the supply of energy components to the fetus. Earlier studies on pregnant female rodents and sheep showed that high protein intake and an increase in ammonia concentration (up to 300% higher compared to the control group) result in a reduction in the number of developing blastocysts, impaired embryo metabolism, and fetal growth disorders [7]. In pregnant mothers who are on a high-protein diet, the amino acid profile of the plasma is altered and the concentration of threonine, glutamine, glycine, alanine, and serine decreases, which slow down the growth of fetal tissues [8]. In mice, a high-protein diet had an impact on the GH/JAK/STAT/IGF signaling pathway, which was reflected by decreased growth hormone concentrations in the placenta and a consequent decrease in fetal weight gain [9]. The changes in lipid metabolism lead to an increase in the levels of annexin IV, a protein responsible for adipocyte differentiation and adipose tissue growth [10]. This is manifested by an increased predisposition to obesity in adults. Furthermore, an indirect consequence of a high-protein diet during pregnancy, which can have an effect even in the adulthood of individuals born with the IUGR syndrome, is the changes in the cardiovascular system, leading to the development of cardiovascular diseases in humans [11] at the postnatal stages. Studies have also shown that in pregnant mice fed with a high-protein diet the plasma concentrations of nonesterified fatty acids increased to levels recorded in the blood of 24-hour fasted animals. This indicates an increase in lipolysis and fat oxidation to compensate for the energy deficit in a developing fetus [15]. Similar to a high-protein diet, consumption of a diet with reduced protein during pregnancy results in a decrease in the birth weight of the newborn [13]. Reduced dietary protein supply leads to a decrease in the pool of amino acids in maternal plasma and, consequently, in fetal plasma and uterine fluid. This in turn translates into stunted fetal growth [14]. Studies on pigs have shown that a reduced dietary supply of amino acids decreased the efficiency of the amino acid transport protein system in the placenta [14]. In the placenta, the amino acid transport mechanisms are mainly based on the active transport of protein and require energy supply to overcome the concentration gradient. In pregnant rats on a low-protein diet, there was a decrease in the plasma concentrations of the regulators of fetal development, such as insulin, leptin, low-density lipoprotein (LDL), and insulin-like growth factor 2 (IGF-2), which reduced the expression of the sodium-coupled neutral amino acid transporter 2 (SNAT2) protein involved in the placental transport of amino acids to the fetus [15]. Despite the restricted nutrient supply, increased fat accumulation by the fetus was observed which was attributed to an increase in the expression of annexin V, a protein that stimulates adipocyte proliferation and differentiation [10]. Research on the effects of maternal diet imbalance during pregnancy and/or the influence of other factors relevant in humans, such as smoking, alcohol consumption, and drug intake, gave rise to the “thrifty phenotype” hypothesis. Thrifty phenotype is characterized not only by a low birth weight but also by a number of changes in the structure and function of the internal organs, which were caused by an inadequate supply of glucose and amino acids to the fetus. These changes include alterations in the function of the kidneys, the endocrine and exocrine parts of the pancreas, intestines, skeletal muscles, liver, and nervous system. Some of these changes may level off over time, such as the changes in the function of brush border enzymes in the intestinal mucosa, while some may not, such as the changes in the morphology of the kidney (number of nephrons) and pancreas (number and size of pancreatic islets). Later stages of life and adulthood may be characterized by further effects associated with the IUGR syndrome, such as hypertension, type 2 diabetes, and other symptoms that are typical of the metabolic syndrome [16]. Other diseases observed in adults with the IUGR syndrome include visceral obesity and cardiovascular diseases as a consequence of hyperlipidemia and hypertension [11].
Proper sow nutrition is an important factor affecting the course of pregnancy and lactation, and thus the growth, development, and survival of piglets. When a sow becomes pregnant, malnutrition from the preceding time period, combined with the limited feed intake of the gestating sow, negatively affects the growth and development of the early-stage embryo and fetuses [17]. Both malnutrition and overfeeding of gestating sows result in delayed growth of the fetus [18].
An excessive high energy and/or protein content of the mixture given to the female after insemination and during early pregnancy increases embryonic and fetal mortality. Mostly, the IUGR syndrome occurs naturally in pigs due to the high fertility of the species. In advanced pregnancy, uterine capacity becomes a limiting factor for fetal growth. The development of fetuses depends on their location and number; the ones placed at the ends of the uterine horns are larger than those placed in the center due to the difference in blood pressure and nutritional status [19]. The increase in fetal weight difference magnifies during late pregnancy when the number of fetuses per horn exceeds 5 [20]. At birth, the body weight of the piglet with the IUGR syndrome may only range from half to one-third the body weight of the largest piglet in the litter [21]. The changes in the number and size of primary and secondary muscle fibers and the proportion of adipocytes during the prenatal period affect the quality of raw slaughter material and pork in the postnatal period and after the animals are fattened [22]. This has been confirmed by a national study conducted by Rekiel et al. [23], which determined the relationship between the weight of piglets at birth and the quality of raw slaughter material and pork. Thus, understanding the mechanisms behind the development of the IUGR syndrome and developing effective strategies to reduce the intensity of the syndrome as well as its consequences will help to improve the profitability of pig production. Currently, several factors are cited as the causes of the IUGR syndrome, but the course of its development is not yet sufficiently explained.
The hypothesis of this study is that the administration of fungal pancreatic-like enzymes of microbial origin (PLEM) to sows during pregnancy would contribute to a significant improvement in placental function in terms of nutrient permeability to the fetus and in fetal development and growth while reducing the probability of the IUGR syndrome.
2. Materials and Methods
- a)
- Research scheme, animals, and feeding
The experiment was carried out on 24 Polish Landrace sows with their offspring. The sows were randomly divided into four groups, each group with six animals, with a minimum of 12 liveborn piglets. The animals were fed with compound feed according to the nutrient requirements according to DLG standards [24]. Two control groups of six animals each (n = 6) were fed with a standard feed for farrowing sows without enzyme additives (Table 2). The difference between the two control groups (positive control [PC] and negative control [NC]) was that the piglets in one group (PC) received PLEM supplementation between 14 and 21 days of age. In addition to the above-mentioned groups, two experimental groups were also set up, each with six sows. One experimental group (group D1) received mixed feed for pregnant sows supplemented with microbial pancreatic enzymes throughout the pregnancy, while the other (group D2) received enzyme supplementation only in the last 4 weeks from day 80 of gestation (Table 1). Pregnant sows were maintained in individual farrowing pens, and piglets had constant access to the mother. The sows were maintained under standard conditions with controlled day light length (7.00–7.00 p.m.) and temperature (22 ± 2°C). After parturition, the piglets were reheated with radiant heaters to maintain the temperature at around 30 ± 2°C. Piglets after weaning from sows were kept in separate pens by litters.
Throughout the study, the production cycle of sows and piglets was monitored. To evaluate the long-term effects of enzymes fed with sow feed on the body development of piglets from each litter, two piglets were euthanized immediately after birth and biological material was collected for structural (gastrointestinal tract including the stomach, pancreas, small intestine, and colon) and functional (concentrations of intestinal hormones namely ghrelin, leptin, and insulin, and peptide-C, activity of brush border enzymes) analyses. Piglets were weaned after a 4-week lactation period, and the average weaning age was about 28 days. After weaning, until 70 days of age, the piglets were reared in the piggeries in group pens with litters. From day 7 onward, all piglets were fed a standard super prestarter mixture (Table 3). A weaning prestarter mix was fed until day 14. From day 15, the piglets were fed a starter mixture for the next 28 days until 70 days of age (Table 3). Both the weaning prestarter mixture and the starter mixture were fed ad libitum. The chemical composition of compound feed was analysed according to AOAC [25] methods.
The enzymes (Amano Enzyme, Nagoya, Japan) used in this study were of microbial origin. Amylase with an activity of 90 000 DU/g was obtained from the fermentation of the fungus Aspergillus oryzae, protease with an activity of 150 000 HUT/g from the fermentation of the fungus Aspergillus melleus, and lipase with an activity of 15 000 U/g from the fermentation of the fungus Aspergillus niger.
- b)
- Analysis of brush border enzyme activity
Determination of saccharase, lactase, and maltase activity in the brush border
The activity of saccharase, lactase, and maltase was determined in the brush border of the jejunum using a modified method of Dahlquist [26]. Briefly, the intestinal epithelium collected at postmortem was weighed, diluted in distilled water (1:4, v/v) and thoroughly homogenized using a mechanical homogenizer. The resulting homogenates were placed on ice. Then, these samples were mixed with a solution containing substrate (sucrose, lactose, or maltose, respectively) and reaction buffer with maleic acid. All the samples were incubated at 37°C for 1 hour, followed by which the activity of disaccharidases was stopped immediately by adding an inhibitory solution containing Tris. At the same time, blank samples were prepared, in which an inhibition solution was immediately added to the mixture of homogenates, substrate, and reaction buffer. The prepared samples were applied to a microplate, and then commercially available Glucose RTU reagent was added to determine glucose concentration. A glucose standard was prepared by mixing it with the inhibition solution, and a standard curve was plotted. The microplate containing samples was incubated for 15 min at 37°C, and the absorbance was read at 490 nm using a spectrophotometer. To convert the enzymatic activity of the disaccharidases, the total protein content of the homogenates was determined using a commercial assay and spectrophotometric method, following the manufacturer’s instructions.
- c)
- Determination of the activity of aminopeptidases A and N and dipeptidylpeptidase IV in the brush border
The activity of aminopeptidases A and N and dipeptidylpeptidase IV was determined in the brush border of the jejunum using a modified method of Maroux et al. [27]. Briefly, the intestinal epithelium collected at postmortem was weighed, diluted in distilled water (1:4, v/v), and thoroughly homogenized using a mechanical homogenizer. The homogenates were placed on ice. The enzyme activity was measured by spectrophotometry using the following synthetic substrates: l-glutamic acid p-nitroanilide, leucine p-nitroanilide, or glycyl-l-prolyl p-nitroanilide tosylate for aminopeptidase A, aminopeptidase N, or dipeptidylpeptidase IV, respectively. The homogenates were mixed with the appropriate substrate and reaction buffer, and the reactions were carried out in cuvettes at 37°C. The concentration of the final reaction product, para-nitroaniline, was determined by measuring the kinetic absorbance at 410 nm. A solution of the substrate for the corresponding enzyme was used as blank. To convert the enzyme activity, the total protein content of the homogenates was determined using a commercial assay and spectrophotometric method, following the manufacturer’s instructions.
- d)
- Analysis of hormones in blood plasma by radioimmunoassay (RIA)
To determine the brush border enzyme activity, the epithelium was collected after the animals were euthanized and the digestive tract was dissected. After removing the digestive contents from the lumen of the small intestine, the mucosal layer was collected, placed immediately in dry ice, and transported to the laboratory. The samples were refrigerated at −80℃ until the analysis. For the analyses, blood was collected from six piglets in each feeding group on empty stomach from the icteric vein into EDTA-treated tubes. The collected blood sample was slightly cooled and then centrifuged for 10 minutes at 3,000 rpm. The plasma hormone concentrations were determined using commercial RIA kits. Leptin and insulin were determined in porcine plasma with an animal species-dedicated kit (Merck Millipore Inc.), while ghrelin was assayed with a commercial porcine Ghrelin RIA kit (Phoenix Pharmaceuticals Inc.). Each test was carried out by applying an appropriate methodology for the determination of the respective compound. All determinations were performed according to the accompanying protocol for each test. The commercial RIA test kit included tubes coated with a high-affinity antibody to the compound under study. The kit also included calibrators, standards, J-125 isotope, antibodies, and a wash solution.
During the incubation of standards, controls, and test samples, a number of hormone molecules labeled with the iodine isotope J-125 compete with the test hormone for a certain number of antihormone antibody-binding sites that are bound to the antibodies immobilized on the wall of the tube. After incubation (incubation time and temperature depend on the type of compound under study), the reaction was stopped by aspiration. Then, the tubes were rinsed with the working rinse solution, aspirated, and placed in an LKB Wallac 1275 Miniggama ionizing radiation reader. For each tube, the radiation reading was taken for 60 seconds. Based on the radioactivity measurement of the radioactive isotope, a calibration curve was plotted and the concentration of hormone in the sample was determined by interpolating the dose from the calibration curve.
- e)
- Statistical analyses
Statistical analyses of the results of piglet rearing analysis, histological analysis, enzyme and hormone analyses were performed using one-way analysis of variance. To evaluate the dierence among groups, multiple comparisons were conducted using Student’s t-test. Pens were used as experimental units for the analysis of ADFI and F:G, and for other parameters, each pig was used as the experimental unit.Statistical significance was assumed at P ≤ 0.05. All calculations were performed using the Statgraphics Plus 6.0 [2001] statistical package.
3. Results
During the lactation period, sows from groups D1 and D2 consumed more feed compared to the NC and PC groups as follows: 6.6 and 6.8 kg vs. 6.2 and 6.3 kg, respectively. Weight loss of sows from farrowing to weaning was as follows: group NC, 28.8 kg; group PC, 33.2 kg; group D1, 32.8 kg; and group D2, 33.5 kg. Litters from the sows of both NC and PC groups were characterized by a lower number of liveborn piglets compared to the sows of the experimental groups, amounting to 10.7, 10.9, 12.1, and 12.8 piglets, respectively, while on the day of weaning, litter counts were as follows: group NC, 9.62; group PC, 10.15; group D1, 11.12; and group D2, 11.75 (P ≤ 0.01). The average weight of a piglet on the day of birth varied significantly between the control and experimental groups as follows: group NC, 1.65 kg and group PC, 1.67 kg vs. group D1, 1.73 kg and group D2, 1.76 kg, respectively (P ≤ 0.0214). On the other hand, the average number of piglets born with the IUGR syndrome characterized by a reduced body weight of less than 1.1 kg was significantly different between group PC (0.98) and group D1 (0.61), in which sows received enzymes throughout pregnancy (P ≤ 0.012).
The statistically significant variations in piglet weight between groups NC and PC and groups D1 and D2 persisted until the end of the period of rearing piglets at the mother, that is, until day 28 of life, and were as follows: group NC, 6.79 kg; group PC, 6.72 kg; group D1, 6.92 kg; and group D2, 7.52 kg (P ≤ 0.009). On day 14 after weaning, the weight of the piglets was as follows: group NC, 8.90 kg; group PC, 9.17 kg; group D1, 9.39 kg; and group D2, 9.61 kg (P ≤ 0.0632). At the end of weaning, on day 70, the weight of piglets was as follows: group NC, 19.75 kg; group PC, 20.58 kg; group D1, 20.06 kg; and group D2, 21.67 kg. There were significant differences between group NC and group D2 (P ≤ 0.0396).
During the entire period of rearing piglets at the mother, between 1 and 28 days of age, a favorable effect of the additives on piglet weight gain was observed. In the experimental groups, the weight gain was as follows: group D1, 185 g (+2.7%) and group D2, 205 g (+13.8%) vs. group NC, 183 g (+1.6%) and group PC, 180 g (+0.0%) (P ≤ 0.1545). After weaning between day 28 and day 42, piglet weight gain varied significantly between groups NC and PC and groups D1 and D2 as follows: 150 g (0%), 175 g (+16.6%), 176 g (+17.3%), and 171 g (+11.1%) (P ≤ 0.0375), respectively. Between day 42 and day 70, the weight gains were as follows: group NC, 378 g (0%); group PC, 417 g (+11.0%); group E1, 381 g (+10.1%); group D2, 420 g (+11.1%) (P ≤ 0.007). For the entire rearing period between 1 and 70 days of age, there were significantly higher piglet weight gains in groups D2 and PC compared to the control groups: group D2, 284 g (+11.0%); group PC, 270 g (+4.6%); group NC, 258 g (0%); and group D1, 260 g (+0.7%) (P ≤ 0.0362). The average feed intake of piglets during the rearing period at the sow was similar in all piglet groups and ranged from 28g in group NC to 29, 34, and 33 g in groups PC, D1, and D2, respectively. After the piglets were weaned at day 28, a limited feed intake of piglets was observed: group NC, 216 g; group PC, 235 g; group D1, 218 g; and group D2, 238 g (P ≤ 0.052). An increase in feed intake occurred after 42 days of age and between day 42 and day 70 in groups D2 and PC, while feed intake was significantly lower in groups NC and D1 (P ≤ 0.028). For the entire rearing period between 1 and 70 days of age, a significantly higher feed intake was found in group D2 (412 g; +12.2%) and control group PC (392 g, +11.5%) compared to the control group NC (338 g; 0%) and group D1 (344 g, +1.7%) (P ≤ 0.038). The index of feed conversion rate in the first period of piglet life was similar in all groups and ranged between 0.09 and 0.16 kg/kg. For the piglet rearing period between day 28 and day 42, the feed conversion ratio (FCR) index was 1.986 kg/kg in group NC and 1.932 kg/kg in group D1 and differed significantly compared to group D2 (1.604 kg/kg) and group PC (1.704 kg/kg) (P ≤ 0.0308). For the entire rearing period from day 1 to day 70, the FCR index in groups NC, PC, D1, and D2 was 1.26, 1.18, 1.27, and 1.16 (P = 0.1016), respectively. Piglet losses during the entire piglet rearing period between 1 and 70 days of age were as follows: group NC, 16.9%; group PC, 6.9%; group D1, 10.3%; and group D2 7.3%.

Table 4.
Sow health indicators during piglet rearing.
| Specification | Nutritional group | *P-value | |||
| NC | PC* | D1 | D2 | ||
| Number of sows | 6 | 6 | 6 | 6 | |
| Length of pregnancy (days) | 115.8 ± 2.4b | 115.2 ± 2.0 b | 114.7 ± 2.2a | 114.9 ± 2.2a | 0.01 |
| Average feed intake during lactation (kg) | 6.2 ± 0.7 | 6.3 ± 0.9 | 6.6 ± 0.8 | 6.8 ± 0.9 | ≤0.122 |
| Average number of piglets per litter | 10.7 ± 1.0a | 10.9 ± 1.2a | 12.1 ± 1.1b | 12.8 ± 1.3b | ≤0.006 |
| Average number of piglets with IUGR syndrome ≤ 1.1 kg b.w. | 0.86 ± 0.09ab | 0.98 ± 0.11b | 0.61 ± 0.06 a | 0.77 ± 0.07 ab | ≤0.012 |
| Number of piglets after weaning | 9.62 ± 0.95a | 10.15 ± 1.0a | 11.12 ± 1.1b | 11.75 ± 1.2b | 0.009 |
| Average weight loss of the sow during the piglet feeding period (kg) | 28.8 ± 2.8 | 29.2 ± 3.1 | 32.8 ± 3.2 | 33.5 ± 3.3 | 0.068 |
| Number of cases of MMA (mastitis, metritis and agalactia) syndrome in sows (heads) | 1 | 0 | 0 | 0 | |
| Piglet falls between 1 and 70 days of age (%) | 16.9 | 6.9 | 10.3 | 7.3 | |
a,b Mean values denoted by the same letters are significantly different from each other at P ≤ 0.05.
Table 5.
Piglet rearing indicators.
| Specification | Nutritional group |
P-value |
|||
| NC | PC | D1 | D2 | ||
| Body weight at birth (g) Age at weaning (days) Body weight on weaning day or day 28 of life (kg) Daily gain from day 1 to day 28 of life (g) Body weight on day 42 of life (kg) Daily gain from day 1 to day 42 of life (g) Daily gain from day 28 to day 42 of life (g) Body weight on day 70 of life (kg) Daily gain from day 1 to day 70 (kg) Daily gain from day 42 to day 70 (kg) |
1,651 ± 366 27.4a ± 0.8 6.79 ± 1.54 183 ± 50 8.90 ± 2.05 173 ± 46 150 ± 67 abc 19.50 ± 4.84ab 255 ± 66a 378 ± 114 aA |
1,666 ± 317 27.2b ± 1.3 6.72 ± 1.95 180 ± 59 9.17 ± 2.37 177 ± 50 175 ± 75a 20.58 ± 3.91a 270 ± 56ab 407 ± 103 bA |
1,731 ± 308 26.7ab ± 0.8 6.92 ± 1.43 185 ± 49 9.39 ± 1.55 182 ± 35 176 ± 58b 20.06 ± 3.60c 262 ± 51a 381 ± 96aA |
1,756 ± 362 27.1 ± 1.7 7.52 ± 1.48 205 ± 49 9.91 ± 1.71 187 ± 37 171 ± 71c 21.67 ± 3.68bc 284 ± 49b 420 ± 91 cB |
0.2143 0.0248 0.052 0.1545 0.0632 0.0596 0.0375 0.0384 0.0362 0.0078 |
a,b,cMean values denoted by the same letters are significantly different from each other at P ≤ 0.05.
Table 6.
Feed utilization by piglets per kg of weight gain (kg/kg).
| Specification | Nutritional group |
P-value |
|||
| NC | PC | D1 | D2 | ||
| FCR during the rearing period, 1–28 days | 0.16 ± 0.02 | 0.10 ± 0.01 | 0.12 ± 0.01 | 0.09 ± 0.01 | 0.6362 |
| FCR during the rearing period, 28–42 days | 1.986 ± 0.14a | 1.704 ± 0.11ab | 1.932 ± 0.15a | 1.604 ± 0.10b | 0.0308 |
| FCR during the rearing period, 1–70 days | 1.26 ± 0.012 | 1.18 ± 0.013 | 1.27 ± 0.014 | 1.16 ± 0.011 | 0.1016 |
a,bMean values denoted by the same letters are significantly different from each other at P ≤ 0.05.
Table 7.
Average feed intake of piglets during rearing (g/day/head).
| Specification | Nutritional group |
P |
|||
| NC | PC | D1 | D2 | ||
| Rearing period, 1–28 days (g) | 28 ± 4 | 33 ± 5 | 27 ± 4 | 34 ± 5 | ≤0.346 |
| Rearing period, 28–42 days (g) | 216 ± 16 | 235 ± 19 | 218 ± 17 | 238 ± 20 | ≤0.524 |
| Rearing period, 1–70 days (g) | 338 ± 24ab | 392 ± 28a | 344 ± 25ab | 412 ± 32b | ≤0.038 |
a,bMean values denoted by the same letters are significantly different from each other at P ≤ 0.05.
Histological analyses and determination of brush border enzyme activity were performed on samples from six animals representing each nutritional group. Histological analysis of selected sections of the gastrointestinal tract did not reveal any pathological changes or inflammation in the analyzed tissues. No lysosomal vacuoles were observed in any section of the small intestine or the hindgut. The results of the histological analysis of the pancreas are shown in Table 8. A highly significant increase in pancreatic follicle area and pancreatic cell area was noticed in groups D1 and D2 and the control group PC compared to the control group NC (P ≤ 0.01). The number of pancreatic follicle cells was significantly lower number in group D1 compared to group NC (P ≤ 0.05).
The results of the histometric analysis of the stomach are shown in Table 9. The mucosa thickness was significantly lower in groups NC D1 compared to groups PC and D2 (P ≤ 0.01). Similar results were observed for mucosa membrane thickness, with significant differences in groups NC and D1 compared to group D2 (P ≤ 0.05).
Table 10 shows the results of the histometric analysis of the duodenal mucosa. Dietary supplementation of sows with pancreatic enzymes did not affect the length of intestinal villi of the duodenum but caused a significant increase in the depth of intestinal crypts and thickness of the mucosa in animals from group PC in which piglets received enzymes at 3 weeks of age and group D2, compared to animals from groups NC and D1 (P ≤ 0.01). In the case of duodenal muscle membrane thickness, significantly higher membrane thickness was found in groups PC and D2 compared to groups NC and D1(P ≤ 0.05).
As in the case of the duodenum, and also in the initial section of the small intestine, the length of the intestinal villi was not influenced by the additives fed to the sows (Table 11). Similarly, the diet had no effect on the depth of intestinal crypts. However, statistically significant differences were found in the mucosa and muscle membrane thickness, with significantly higher values in groups PC and D2 compared to groups NC and D1 (P ≤ 0.01). The feed additives used did not affect the length of intestinal villi and the depth of intestinal crypts in the middle section of the intestine in all the analyzed nutritional groups (Table 11). A highly significant increase in the mucosa and muscle membrane thickness was noted in the animals of groups D2 and PC compared to groups NC and D1 (P ≤ 0.01). The results of morphometric analyses of the terminal intestine revealed that the addition of PLEM to the diet fed to sows throughout the gestation period and to piglets in group PC led to a highly significant increase in the depth of crypts, and mucosa and muscle membrane thickness compared to groups NC and D1 (P ≤ 0.01). The results of the histometric analysis of the iliac colon wall structure are shown in Table 12. Microscopic analysis showed no differences in the length of intestinal villi between the study groups. A highly significant increase in the depth of intestinal crypts and mucosa and muscle membrane thickness was found in groups D2 and PC compared to groups NC and D1 (P ≤ 0.01).
In the proteins of the epithelium in the initial (prox), middle (mid), and distal (dist) parts of the jejunum, the activities of the brush border enzymes, saccharase, lactase, maltase, aminopeptidase A and N, and dipeptidylpeptidase IV, were determined (Table 13). Significantly higher lactase activity in the initial part of the jejunum was observed in the piglets of groups D1, D2, and PC compared to group NC: 32.9, 32.00, and 29.60 vs. 21.80 nM/min/mg protein (P ≤ 0.01), respectively. In the case of the other enzymes, no significant differences were noted between the groups.
In the blood plasma of euthanized piglets, the indicators of immunity and body inflammation were determined. The results showed that the level of immunoglobulin IgA was the same in all nutritional groups (Table 14). A significantly higher level of acute-phase protein haptoglobin was found in group D1 and group NC compared to groups PC and D2 (P ≤ 0.01) (Table 14).
The plasma content of hormones responsible for lipid and sugar metabolism was determined. A significantly higher plasma level of ghrelin was noted in the piglets of group NC compared to group D1: 765 vs. 448 pg/mL (P ≤ 0.01) (Figure 1).
Regarding the plasma leptin content, no significant differences were found between the experimental groups and the values determined in groups NC, PC, D1, and D2 were 5.10, 4.05, 5.31, and 6.01 ng/mL, respectively (Figure 2).
The plasma insulin content of piglets from sows in groups D1 and D2 was significantly lower compared to that in groups NC and PC: 6.8 and 6.7 IU/mL vs. 14.6 and 16.6 IU/mL, respectively (P ≤ 0.01) (Figure 3).
4. Discussion
This study was designed to investigate the effects of the addition of PLEM to the diet fed to sows on the development of pig fetus and fetal size/weight at birth, the growth in subsequent stages, and the maturity and development of the digestive tract.
IUGR syndrome is a condition characterized by the disruption of fetal development by nongenetic factors, mainly environmental ones, in the second and/or third trimester of pregnancy. Newborns with this syndrome are born at term with a low birth weight of around 1.1 kg, which is taken as the cutoff value for bacon breeds of pigs. A serious economic challenge for pig farms is that individuals born with the IUGR syndrome have a much higher mortality rate compared to normal piglets [28]. In Europe and Asia, where large numbers of pigs are raised, the average mortality rate among live piglets before weaning—depending on the source—is 11–13%, while the percentage of piglets born dead is 7–8% [28]. The main causes of death of newborn piglets are low body weight (14%), starvation (7%), crushing by the mother (5%), and diarrhea (4%), while limited milk intake is the most significant cause of all falls. Piglets with limited or no milk intake are at risk of starvation, crushing, or diarrhea. Piglet survival is associated with complex interactions between the sow, the piglet, and their environment. In fact, it has been reported that in the European Union countries, 20% of liveborn piglets die before weaning and the most risky group is the piglets with a low birth weight. About 50% of piglet losses can be attributed to hypothermia and crush, that is, factors primarily related to the piglets’ poor condition/apathy, their ability to escape from a moving sow, or competition for access to colostrum/milk during the first days of life. Genetic selection strategies have increased litter size and practically reduced the birth/death rates of pigs. The results of this study indicate the positive effect of exogenous pancreatic enzymes administered to pregnant sows, which was reflected by a higher number of liveborn piglets and better piglet survival. These piglets were characterized by, among others, higher weight gain, higher feed intake, and final body weight at 70 days of age. All these favorable results could have been due to better fetal nutrition during the prenatal period and balanced body weight.
Studies conducted on sows giving birth to a large number of low-weight piglets showed that mortality in the first 2–3 days of postnatal life can be as high as 85% [29]. This relationship between litter size and piglet mortality can be attributed to a number of factors such as prolonged farrowing and associated hypoxia in the offspring and increased competition for access to the nipples and nutrients in the milk after birth. The major factor predisposing to increased mortality in the litters of hyperproliferative sows is the reduced viability of newborn piglets, low motility of piglets (failure to suckle, crushes by the mother, chronic stress, and subsequent high susceptibility to diseases mainly those affecting the gastrointestinal tract such as diarrhea), and an ill-balanced diet in terms of the amount of protein and/or energy consumed [30]. In intensive swine production farms, the incidence of the IUGR syndrome is at 6–10% of all births [31]. Several causes of the IUGR syndrome have been identified in recent years, but the course of development of this syndrome is not yet sufficiently elucidated. There are many papers describing the etiology and underlying mechanisms of IUGR, which are related to deficiencies in both embryo quality and uterine capacity [32]. The environmental factors associated with the IUGR syndrome include viral and bacterial infections, which can account for up to 40% of cases. The present study revealed a positive effect of the administration of microbial pancreatic enzymes to sows during gestation, which became apparent in piglets, especially during the weaning period. This outcome was maintained until the end of the experiment (day 70), as manifested by higher gains and higher piglet survival, which may indicate the stimulating and long-term effect of the enzyme mixture. A number of recent studies have shown the close relationship between fetal and neonatal nutrition in the early postnatal period and proper body function in adulthood [3, 11]. The most obvious consequence of the IUGR syndrome is increased piglet mortality in the neonatal period. The relationship between birth weight and survival rate has been well established. It was shown that preweaning survival rate decreased progressively from 95% to 15% as piglet birth weight decreased from 1.80 to 0.61 kg [31]. In addition, low-birth-weight piglets that survive consistently show lower postnatal growth rates. The long-term effects of IUGR on piglet welfare have not been investigated in detail to date. An important factor determining the productivity of sows is adequate nutrition, which affects the course of pregnancy and lactation, and thus the growth, development, and survival of offspring. Low feed intake by lactating sows during the lactation period preceding mating/insemination causes mobilization of the body’s reserves for milk production and results in overfeeding of pregnant sows causing delayed fetal growth [18]. Administration of feed mixture with excessively high energy and/or protein content to the female after mating and during early pregnancy increases embryonic and fetal mortality. A study conducted by Bee [33] showed that an approximately 43% higher intake of protein and energy by day 50 of gestation (relative to the standard feeding level for pregnant multiparous sows) resulted in a reduction in neonatal body weight. The small intestine plays an important role in the final digestion and absorption of nutrients, and thus in the postnatal growth of animals [14]. Naturally occurring or experimentally induced IUGR is associated with abnormal morphology of the small intestine, which worsens the animal’s utilization of nutrients [34 ] and disrupts skeletal muscle development [35]. Newborns with the IUGR syndrome often suffer from necrotizing enterocolitis. This condition impairs intestinal function, including the synthesis of arginine, an amino acid that is essential for newborns but deficient in sow’s milk. It is also one of the leading causes of neonatal death [36]. Compared to fetuses or piglets with optimal weight, those with the IUGR syndrome show a slower growth rate and higher content of intramuscular fat and connective tissue, mainly collagen I [8; 23; 37].
The newborn abnormalities characterized by low birth weight do not affect only piglets; every year, in Poland, about 6% of human infants are born with a low birth weight and other features characteristic of the IUGR syndrome. In addition, the IUGR syndrome not only has been described in the offspring of humans and pigs, but also affects rodents, rabbits, calves, and lambs, which has important implications for breeding. The digestive system of piglets born with the IUGR syndrome is characterized by delayed development, lower weight, abnormalities in motility, and improper digestion and absorption of nutrients compared to animals born with normal birth weight. Piglets with the IUGR syndrome have significantly thinner mucosa and muscle membrane, and a significantly increased proportion of fetal-type enterocytes in the mucosa. The present study showed that the administration of pancreatic-like fungal enzymes to sows at the end of gestation caused an increase in the thickness of the mucosa and muscle membrane of the intestine in piglets as well as an increase in the entire length of the small intestine and the hind intestine. In a study on the dietary administration of pancreatic enzymes in suckling piglets, Slupecka et al. [38] found that the growth of the small intestine was stimulated by the enzymes, as manifested by the increased mitotic index of crypts, height of villi, and depth of crypts. In the same study, the authors observed a decrease in mucosa membrane thickness and shortening of villi and crypts as a result of direct dietary administration of microbial-derived enzymes (PLEM), which may indicate the sensitivity of piglets to endogenous enzymes [38]. In the present study, in which enzymes were administered to sows during gestation, a significant variation in the length of enterocytes was observed in piglets; however, the cells were shaped differently in different sections, and hence, it is difficult to draw a clear conclusion regarding the effect of prenatal administration of exogenous pancreatic enzymes on the size of enterocytes. Feeding sows with an enzyme preparation had no inhibitory effect on the pancreas of piglets, and even stimulated the proliferation of pancreatic cells, which indicates that the enzyme preparation had a trophic effect on the organ. In a study performed by Mickiewicz et al. [3], a number of maturation abnormalities of the small intestinal mucosa were observed in piglets born with the IUGR syndrome. Similar findings were presented by Amdi et al. [39], suggesting that growth abnormalities noted in piglets with the IUGR syndrome may not be due to nutrient deficiency, but rather to impaired nutrient uptake and impaired transfer of biologically active factors from the intestinal lumen to the blood. The increased proportion of fetal-type enterocytes in the mucosa of piglets with the IUGR syndrome may be due to the inhibition of apoptosis within the villi peaks and reduced number of mitotic divisions within the intestinal crypts. The results of the presented studies indicate modified mucosal development in piglets with the IUGR syndrome compared to piglets born with normal birth weight. According to the literature, the course of development of the gastrointestinal tract in individuals with the IUGR syndrome is different from that of individuals born with normal birth weight, and these changes may be responsible for, among others, the disorders in the closing of the intestinal barrier and absorption [40].
This study also investigated the effect of exogenous pancreatic enzyme administration on the level of brush border enzyme activity. Interestingly, in piglets from sows receiving the enzymes (groups D1, D2, and PC) during the rearing period at the sow, significantly higher lactase activity was found after weaning of the piglets which is consistent with the results of Marion et al. [41]; however, most authors have shown a decrease in the activity of this enzyme [42; 43]. It can be speculated that the prenatal administration of enzymes contributed to an improvement in the development of the intestine, including the muscle and mucosa membrane of the duodenum and small intestine, sites where brush epithelial enzymes are synthesized after birth. In addition, the relatively high proportion of skimmed milk in the piglet mix (16%) may have affected the activity of lactase. On the other hand, no significant differences were found in the activity levels of the other examined epithelial enzymes.
Based on the above findings, it can be concluded that the effects of weaning may affect the activity of intestinal enzymes which appear to be age-dependent at weaning. Such age-dependent differences in the activity of brush border enzymes may be due to changes in the rate of cellular renewal (crypt cell proliferation, epithelial cell migration from crypts, villus cell apoptosis) and protein synthesis (gene expression, protein maturation, and stability) [41]. The activity of pancreatic and gastric enzymes may be sufficient in pigs, except for the postweaning period. Studies clearly indicate that diet is the most important factor affecting the development of the digestive system, especially the reorganization of the small intestinal mucosa. Thus, administration of feed with an unfavorable composition to the newborns may disrupt the development of the gastrointestinal tract and even the entire body [44].
The present study also analyzed the levels of selected hormones responsible for cellular metabolism. Ghrelin is a key hormone influencing appetite stimulation, and hence known as the “hunger hormone.” It is synthesized mainly in the fundus and body of the stomach by X/A neuroendocrine cells [45]. In addition, this hormone participates in the regulation of the body’s carbohydrate and lipid metabolism by reducing insulin secretion in the pancreas and enhancing the process of adipogenesis. The significant reduction in blood insulin levels correlates with lower levels of ghrelin, as observed in the present study on piglets from sows receiving exogenous pancreatic enzymes.
The presence of ghrelin in the perinatal period and its important physiological and endocrine functions indicate that this hormone may also play a role in the development of the gastrointestinal tract, and perhaps in its adaptations associated with the IUGR syndrome [34]. However, only a few studies have described the role of ghrelin in the development of the gastrointestinal tract in neonatal and suckling animals [46]. In the present study, reduced levels of ghrelin were observed in piglets from sows receiving exogenous pancreatic enzymes in the diet, while insulin levels were significantly increased, which is consistent with the results reported by Xiong et al. [47]. In a study conducted by Chen et al.[ 48], significantly lower plasma levels of adiponectin and leptin were observed in normal-weight piglets affected by the IUGR syndrome, compared to normal-weight piglets without the syndrome. In the present study, no significant differences in leptin levels were found between the groups, which may be due to the fact that the average body weight of piglets was similar, and thus their metabolic levels were also similar.
Based on the results, it can be concluded that the formulation of pancreatic-like digestive enzymes administered to piglets allowed increasing the assimilation of nutrients by the fetus, resulted in weight-adjusted newborns, and had a stimulating effect on the growth and normal development of piglets. It can be further concluded that the IUGR syndrome can be induced in pigs by the mother’s diet during pregnancy. The use of a fungal PLEM supplement was effective in reducing the occurrence of this syndrome in piglets. Research on the development of the digestive system can contribute to improving the welfare of farm animals. The resulting knowledge may allow developing optimal feeding strategies for both preweaned and weaned animals. Current methods of intensive pig breeding applied in large farms are often based on the introduction of artificial feeding programs using solid feed. However, it should be noted that the mucosa of the small intestine is not fully mature and prepared to digest and absorb this type of feed, and this leads to disturbances in digestive processes, resulting in intestinal inflammation, diarrhea, and animal falls.
Author contributions
Marek Pieszka - conceptualization, study design, methodology, manuscript preparation, supervision; Paulina Szczurek– formal analysis, writing original draft; Sylwia Orczewska- Dudek – validation, formal analysis; Marian Kamyczek – investigation, data curation, read and agreed to the published version of the manuscript; Magdalena Pieszka - statistical analysis, manuscript review and editing.
Financial support statement
This work was conducted within the framework of statutory activity of the State Institute of Animal Production, task no. 01-16-01-11.
Ethics approval
All experimental procedures were approved by the second Local Ethical Review Committee for Animal Experiments in Cracow, Poland (approval no 80/2020) and were performed according to the approved guidelines.
Data and model availability statement
None of the data were deposited in an official repository. Data that support the findings of this study are available on request from the corresponding author.
Declaration of interest
The authors declare any conflicts of interest.
References
- McMillen I.C., Robinson J.S. Developmental origins of the metabolic syndrome: Prediction, plasticity, and programming. Physiol. Rev. 2005, 85, 571–633. [CrossRef] [PubMed]
- Gootwine E., Zenu A., Bor A., Yossafi S., Rosov A., Pollott G.,E. Genetic and economic analysis of introgression the B allele of the FecB (Booroola) gene into the Awassi and Assaf dairy breeds. Livestock Prod. Sci. 2001, 71, 49–58. [CrossRef]
- Mickiewicz M., Zabielski R., Grenier B., Le Normand L., Savary G., Holst J.J., Oswald I.P., Metges C.C., Guilloteau P. Structural and functional development of small intestine in intrauterine growth retarded porcine offspring born to gilts fed diets with differing protein ratios throughout pregnancy. J. Physiol. Pharmacol. 2012, 63, 225–239.
- Kucia M., Langhammer M., Gors S., Albrecht E., Hammon H.M., Nurnberg G., Metges C.,C. High-protein diet during gestation and lactation affects mammary gland mRNA abundance, milk composition and pre-weaning litter growth in mice. Animal 2011, 5, 268–277. [CrossRef] [PubMed]
- Andreasyan K., Ponsonby A.L., Dwyer T., Morley R., Riley M., Dear K., Cochrane J. Higher maternal dietary protein intake in late pregnancy is associated with a lower infant ponderal index at birth. Europ. J. Clinic. Nutr. 2007, 61, 498–508. [CrossRef]
- Meza-Herrera C.A., Ross T., Hallford D., Hawkins D., Gonzalez-Bulnes A. High periconceptional protein intake modifies uterine and embryonic relationships increasing early pregnancy losses and embryo growth retardation in sheep. Reprod. Domestic Animals 2010, 45, 723–728. [CrossRef]
- Gardner DK, Stilley KS and Lane M. High protein diet inhibits inner cell mass formation and increases apoptosis in mouse blastocysts developed in vitro by increasing the levels of ammonium in the reproductive tract. Reproduction, Fertility and Development 2004, 16, 190. [CrossRef]
- Rehfeldt C., Lang I.S., Gors S., Hennig U., Kalbe C., Stabenow B., Brussow K.P., Pfuhl R., Bellmann O., Nurnberg G., Otten W. Metges C.C. Limited and excess dietary protein during gestation affects growth and compositional traits in gilts and impairs offspring fetal growth. J. Anim. Sci. 2011, 89, 329–341. [CrossRef]
- Vanselow J., Kucia M., Langhammer M., Koczan D., Rehfeldt Ch. Metges C.C. Hepatic expression of the GH/JAK/STAT/IGF pathway, acute-phase response signaling and complement system are affected in mouse offspring by prenatal and early postnatal exposure to maternal high-protein diet. Europ. J. Clinic. Nutr. 2011, 50, 611-623. [CrossRef]
- Sarr O., Gondret F., Jamin A., Le Huerou-Luron I., Louveau I. A high-protein neonatal formula induces a temporary reduction of adiposity and changes later adipocyte physiology. Amer. J.Physiol.-Regul., Integr. Comparative Physiol. 2011. 300, 387-397. [CrossRef]
- Barker, D.J.P. Maternal nutrition, fetal nutrition, and disease in later life. Nutrition 1999, 13, 807–813. [Google Scholar] [CrossRef] [PubMed]
- Metges C.C., Lang I., Hennig U., Brussow K-P., Kanitz E., Tuchscherer M., Schneider F., Weitzel J.M., Steinhoff-Ooster A., Sauerwein H., Bellmann O., Nürnberg G., Rehfeldt Ch. Otten W. Intrauterine growth retarded progeny of pregnant sows fed high protein:Low carbohydrate diet is related to metabolic energy deficit. PLoS One 2012, 7, e31390. [CrossRef]
- Davis T.A., Fiorotto M.L., Burrin D.G., Pond W.G., Nguyen H.V. Intrauterine growth restriction does not alter response of protein synthesis to feeding in newborn pigs. Amer. J. Physiol. 1997, 272, E877-E884. [CrossRef]
- Wu G., Pond W.G., Ott T., Bazer F.W. Maternal dietary protein deficiency decreases amino acid concentrations in fetal plasma and allantoic fluid of pigs. J. Nutr. 1998, 128, 894-990. [CrossRef]
- Desforges M., Lacey H.A., Glazier J.D., Greenwood S.L., Mynett K.J., Speake P.F., Sibley C.P. SNAT 4 isoform of system A amino acid transporter is expressed in human placenta. Amer. J. Physiol.-Cell Physiol. 2006, 290, 305-312. [CrossRef]
- Hales C.N., Barker D.J. The thrifty phenotype hypothesis. Brit. Med. Bulletin 2001, 60, 5-20. [CrossRef]
- Vinsky M.D., Novak S., Dixon W.T., Dyck M.K., Foxcroft G.R. Nutritional restriction in lactating primiparous sows selectively affects female embryo survival and overall litter development. Reprod. Fertiil. Development 2006, 18, 347–355. [CrossRef]
- Cole, D.J.A. Nutritional strategies to optimize reproduction in pigs. J. Reprod. Fertility 1990, 40, 67–82. [Google Scholar]
- Rekiel A., Więcek J., Batorska M., Kulisiewicz J. Effect of sow prolificacy and nutrition on pre- and postnatal growth of progeny – a review. Annals Anim. Sci. 2014, 14, 3–15. [CrossRef]
- Perry J.S., Rowell J.G. Variations in fetal weight and vascular supply along the uterine horn of the pig. J. Reprod. Fertil. 1969, 19 (3), 527–534. 3). [CrossRef]
- Widdowson, E.M. Intra-uterine growth retardation in the pig. I. Organ size and cellular development at birth and after growth to maturity. Biol. Neonate 1971, 19, 329–340. [Google Scholar] [CrossRef] [PubMed]
- Gondret F., Lefaucheur L., Louveau I., Lebret B. The long-term influence of birth weight on muscle characteristics and eating meat quality in pigs individually reared and fed during fattening. Archiv für Tierzucht 2005, 48, 68–73. [Google Scholar]
- Rekiel A., Bartosik J., Więcek J., Batorska M., Kuczyńska B., Łojek A. Effect of piglet birth weight on selected characteristics of pork. Annals Anim. Sci. 2014, 14, 967–975. [CrossRef]
- DLG. DLG- Futterwerttabellen Schweine. 2014, 7. Auflage 2014, DLG-Verlag, Frankfurt am Main. In .
- AOAC. Official methods of analysis of AOAC International. 2000, (17th ed.), Gaithersburg, MD, USA.
- Dahlquist, A. Assay of intestinal disaccharidases. Scand. J. Clinic. Labor. Investigation 1964, 44, 169–172. [Google Scholar] [CrossRef]
- Maroux S., Louvard D., Baratti J. The aminopeptidase from hog intestinal brush border. Biochim. Biophysica Acta 1973, 321, 282–295. [CrossRef]
- Matyba P., Florowski T., Dasiewicz K., Ferenc K., Olszewski J., Trela M., Galemba G., Słowiński M., Sady M., Domańska D.; Gajewski Z., Zabielski Z. Performance and Meat Quality of Intrauterine Growth Restricted Pigs. Animals 2021, 11, 254. [CrossRef]
- Feldpausch J.A., Jourquin J., Bergstrom J.R., Bargen J.L., Bokenkroger C.D., Davis D.L., Gonzalez J.M., Nelssen J.L., Puls Ch.L., Trout W.E., Ritter M.J. Birth weight threshold for identifying piglets at risk for preweaning mortality. Transl. Anim. Sci. 2019, 3, 633–640. [CrossRef]
- Pandolfi F., Edwards S.A., Robert F., Kyriazakis I. Risk factors associated with the different causes of piglet perinatal mortality in French farms. Prevent. Vet. Med. 2017, 137: 1-12. [CrossRef]
- Koketsu Y., Iida R., Piñeiro C. A 10-year trend in piglet pre-weaning mortality in breeding herds associated with sow herd size and number of piglets born alive. Porcine Health Management 2021, 7. [CrossRef]
- Riddersholm K.V., Bahnsen I., Bruun T.S., de Knegt L.V. Amdi C. Identifying Risk Factors for Low Piglet Birth Weight, High Within-Litter Variation and Occurrence of Intrauterine Growth-Restricted Piglets in Hyperprolific Sows. Animals 2021, 11, 2731. [CrossRef]
- Bee, G. Effect of early gestation feeding, birth weight, and sex of progeny muscle fiber characteristics of pigs at slaughter. J. Anim. Sci. 2004, 82, 826–836. [Google Scholar] [CrossRef] [PubMed]
- Wang T., Huo Y.J., Shi F.X., Xu R.J., Hutz R.J. Effects of intrauterine growth retardation on development of the gastrointestinal tract in neonatal pigs. Biol. Neonate 2005, 88, 66–72. [CrossRef]
- Greenwood P.L., Hunt A.S., Hermanson J.W., Bell A.,W. Effects of birth weight and postnatal nutrition on neonatal sheep. II. Skeletal muscle growth and development. J. Anim. Sci. 2000, 78, 50–61. [CrossRef]
- Wu G., Bazer F.W., Cudd T.A., Meininger C.J., Spencer T.E. Maternal nutrition and fetal development. J. Nutr. 2004, 134, 2169–2172. [CrossRef]
- Wolter B.F., Ellis M., Corrigan B.P., Dedecker J.M. The effect of birth weight and feeding of supplemental milk replacer to piglets during lactation on pre-weaning and post-weaning growth performance and carcass characteristics. J. Animal Sci. 2002, 80, 301–308. [CrossRef]
- Słupecka M., Woliński J., Prykhodko O., Ochniewicz P., Gruijc D., Fedkiv O., Weström B.R., Pierzynowski S.G. Stimulating effect of pancreatic-like enzymes on the development of the gastrointestinal tract in piglets. J. Anim. Sci. 2012, 90, 311–314. [CrossRef]
- Amdi C., Krogh U., Flummer C., Oksbjerg N., Hansen C.F., Theil P.K. Intrauterine growth restricted piglets defined by their head shape ingest insufficient amounts of colostrum. J. Anim. Sci. 2013, 91, 5605–5613. [CrossRef]
- Ferenc K., Pilżys T., Skrzypek T., Garbicz D., Marcinkowski M., Dylewska M., Gładysz P., Skorobogatov O., Gajewski Z., Grzesiuk E., Zabielski R. Structure and Function of Enterocyte in Intrauterine Growth Retarded Pig Neonates. Disease Markers 2017, ID: 5238134. [CrossRef]
- Marion J., Petersen Y.M., Rome V., Thomas F., Pe Sangild P.T., Le Dividich J., Le Huërou I. (2005). Early Weaning Stimulates Intestinal Brush Border Enzyme Activities in Piglets, Mainly at the Posttranscriptional Level. J. Pediat. Gastroenterol. Nutr. 2005, 41, 401–410. [CrossRef]
- Hampson D.J., Kidder D.E. Influence of creep feeding and weaning on brush border enzyme activities in the piglet small intestine. Res. Vet. Sci. 1986, 40, 24–31. [CrossRef]
- Pluske J.R., Kerton D.K., Cranwell P.D., Campbell R.G., Mullan B.P., King R.H., Power G.N., Pierzynowski S.G., Westrom B., Rippe C., Peulen O., Dunshea F.R. Age, sex, and weight at weaning influence organ weight and gastrointestinal development of weanling pigs. Austral. J. Agric. Res. 2003, 54, 515-527. [CrossRef]
- Hedemann M.S., Dybkjær L., Jensen B.B. Pre-weaning eating activity and morphological parameters in the small and large intestine of piglets. Livest. Prod. Sci. 2007, 108, 128–131. [CrossRef]
- Casanueva, F.F. and Dieguez C. Leptin and Ghrelin: What is the Impact on Pituitary Function? Rev. Endoc. & Metabol. Disorders 2005, 39–45. [Google Scholar] [CrossRef]
- Kotunia A., Zabielski R. Ghrelin in the postnatal development of the gastrointestinal tract. J. Physiol. Pharmacol. 2006, 57, 97–111. [Google Scholar]
- Xiong L., You J., Zhang W., Zhu Q., Blachier F., Yin Y., Kong X. Intrauterine growth restriction alters growth performance, plasma hormones and small intestinal microbial communities in growing-finishing pigs. J. Anim. Sci. Biotechnol. 2020, 11(1), 86. [CrossRef]
- Chen L., Mao X., Han F., Yu B., He J., Zheng P., Yu J., Luo J., Chen D. The effect of high nutrient on the growth performance, adipose deposition and gene expression of lipid metabolism in the neonatal intrauterine growth-retarded piglets. J. Appl. Anim. Res. 2017, 45, 39-44. [CrossRef]
Figure 1.
Plasma ghrelin levels in piglets.
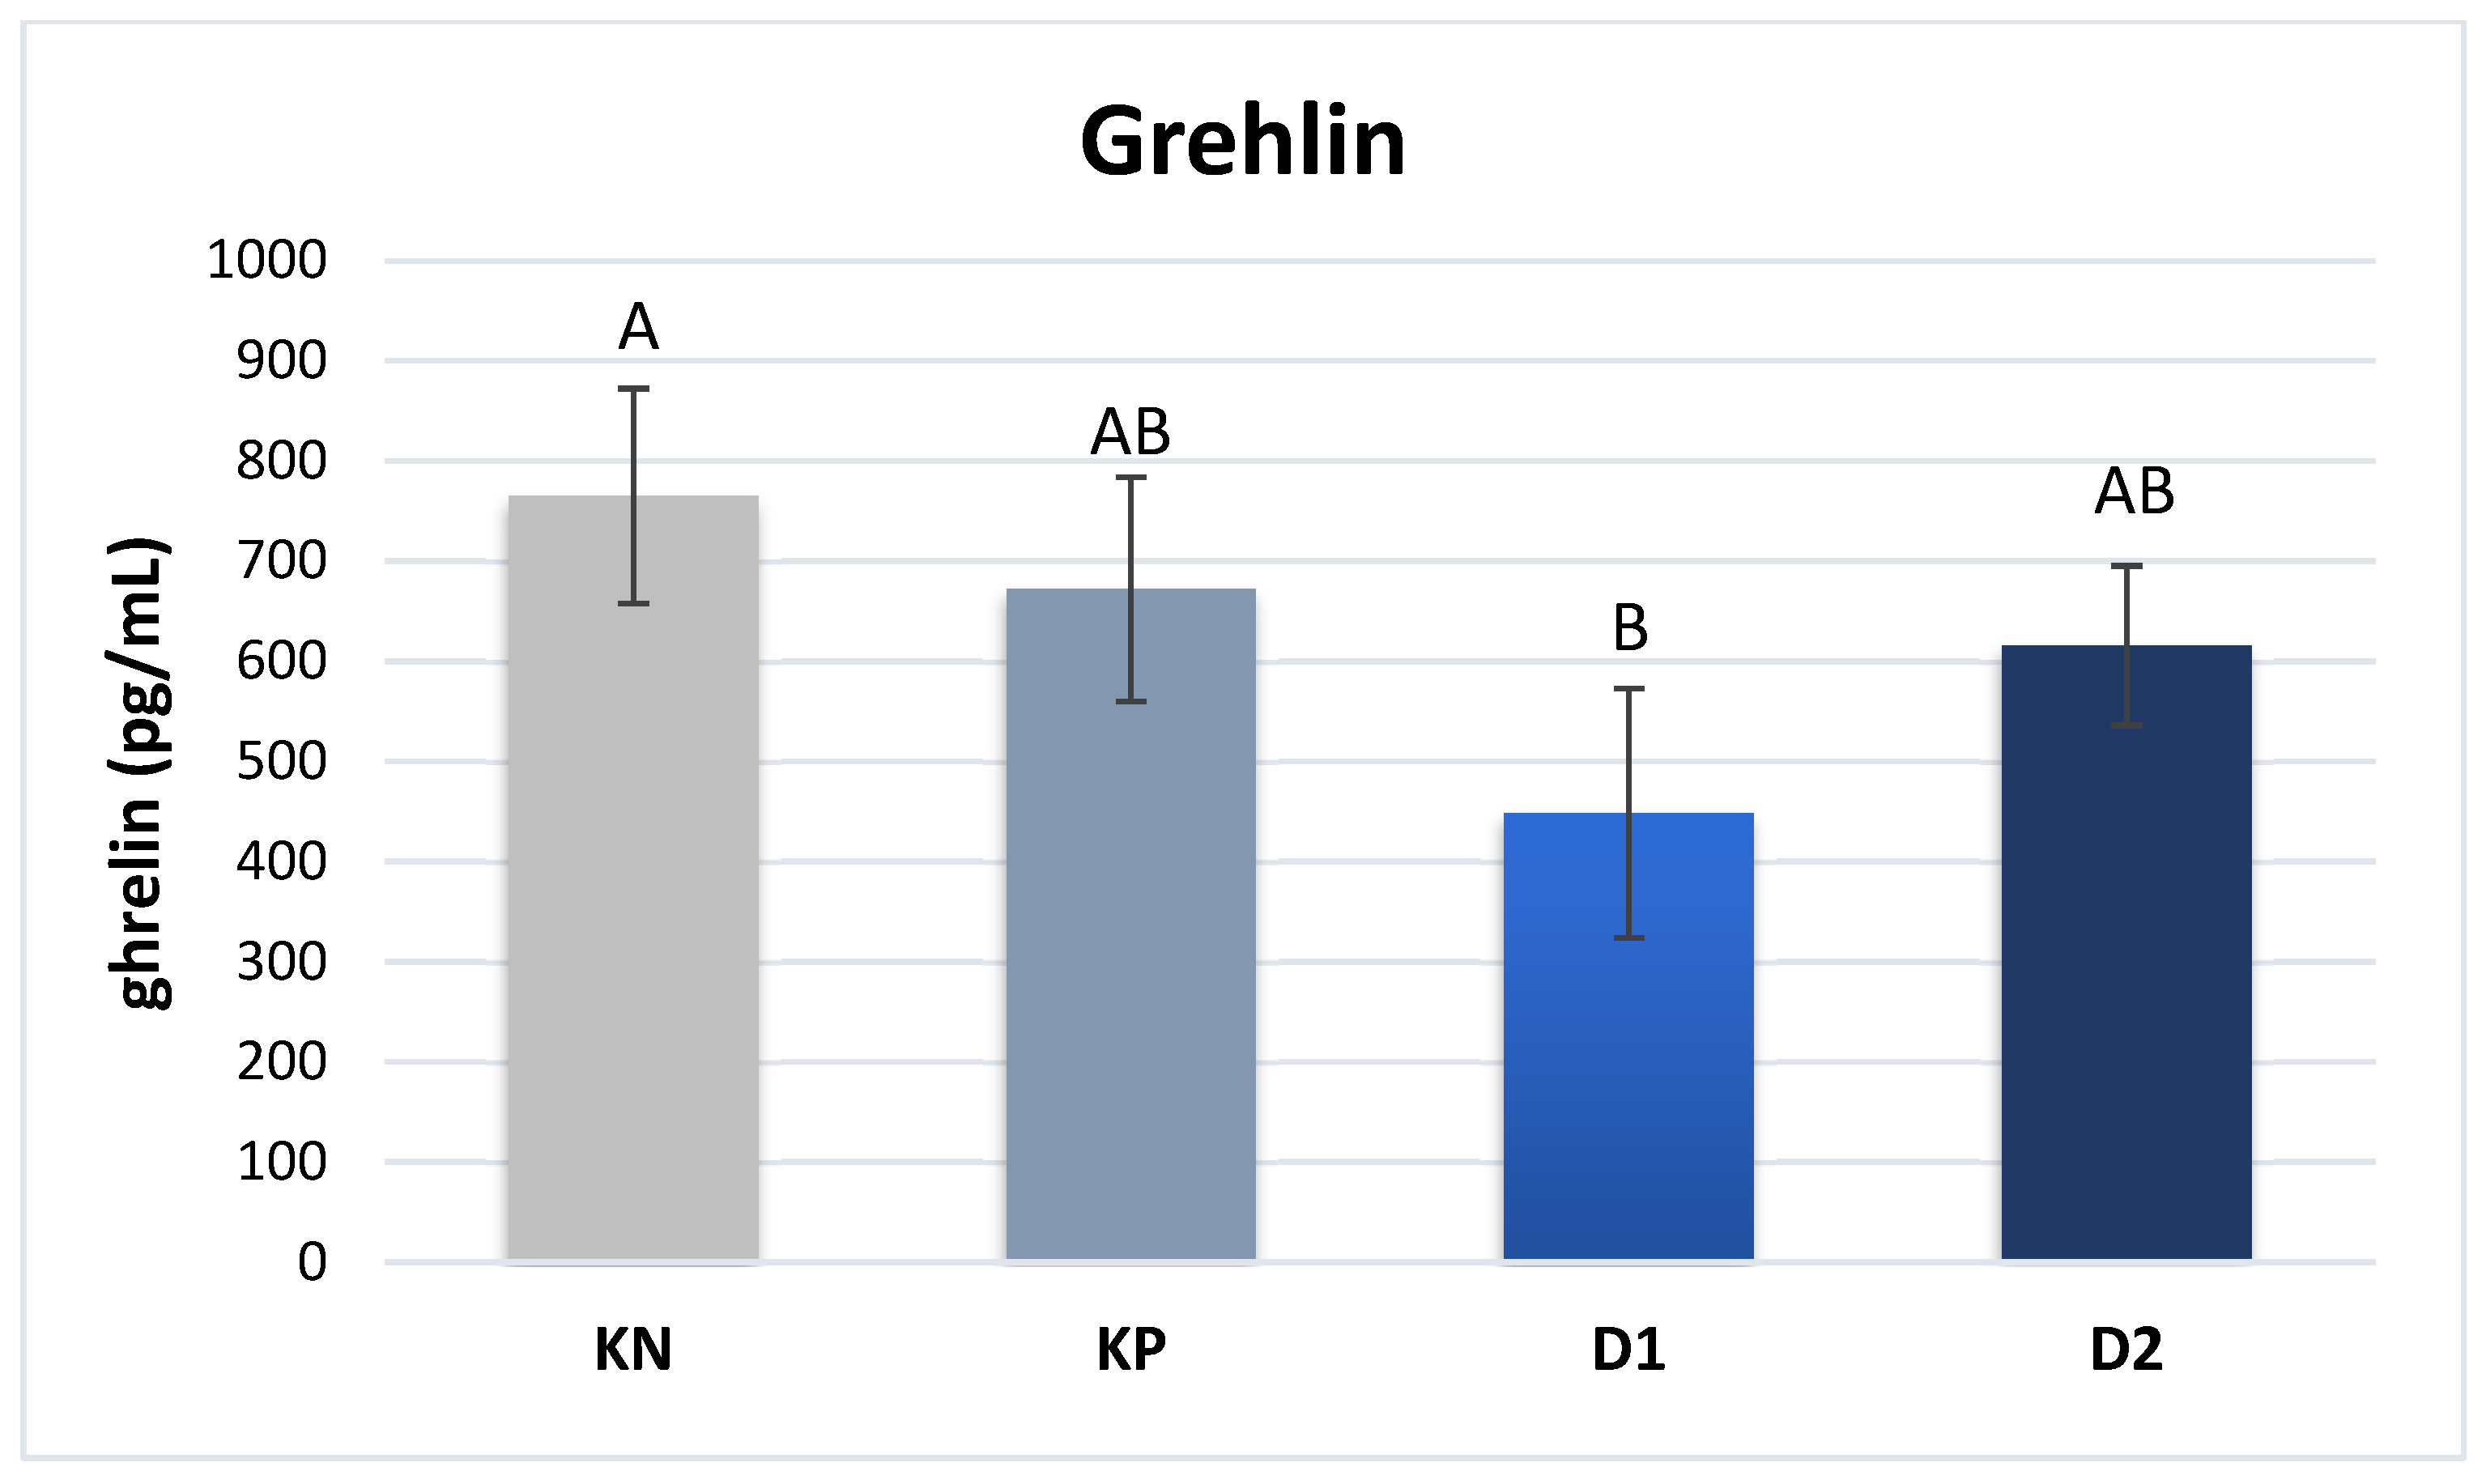
Figure 2.
Plasma leptin levels in pigs.
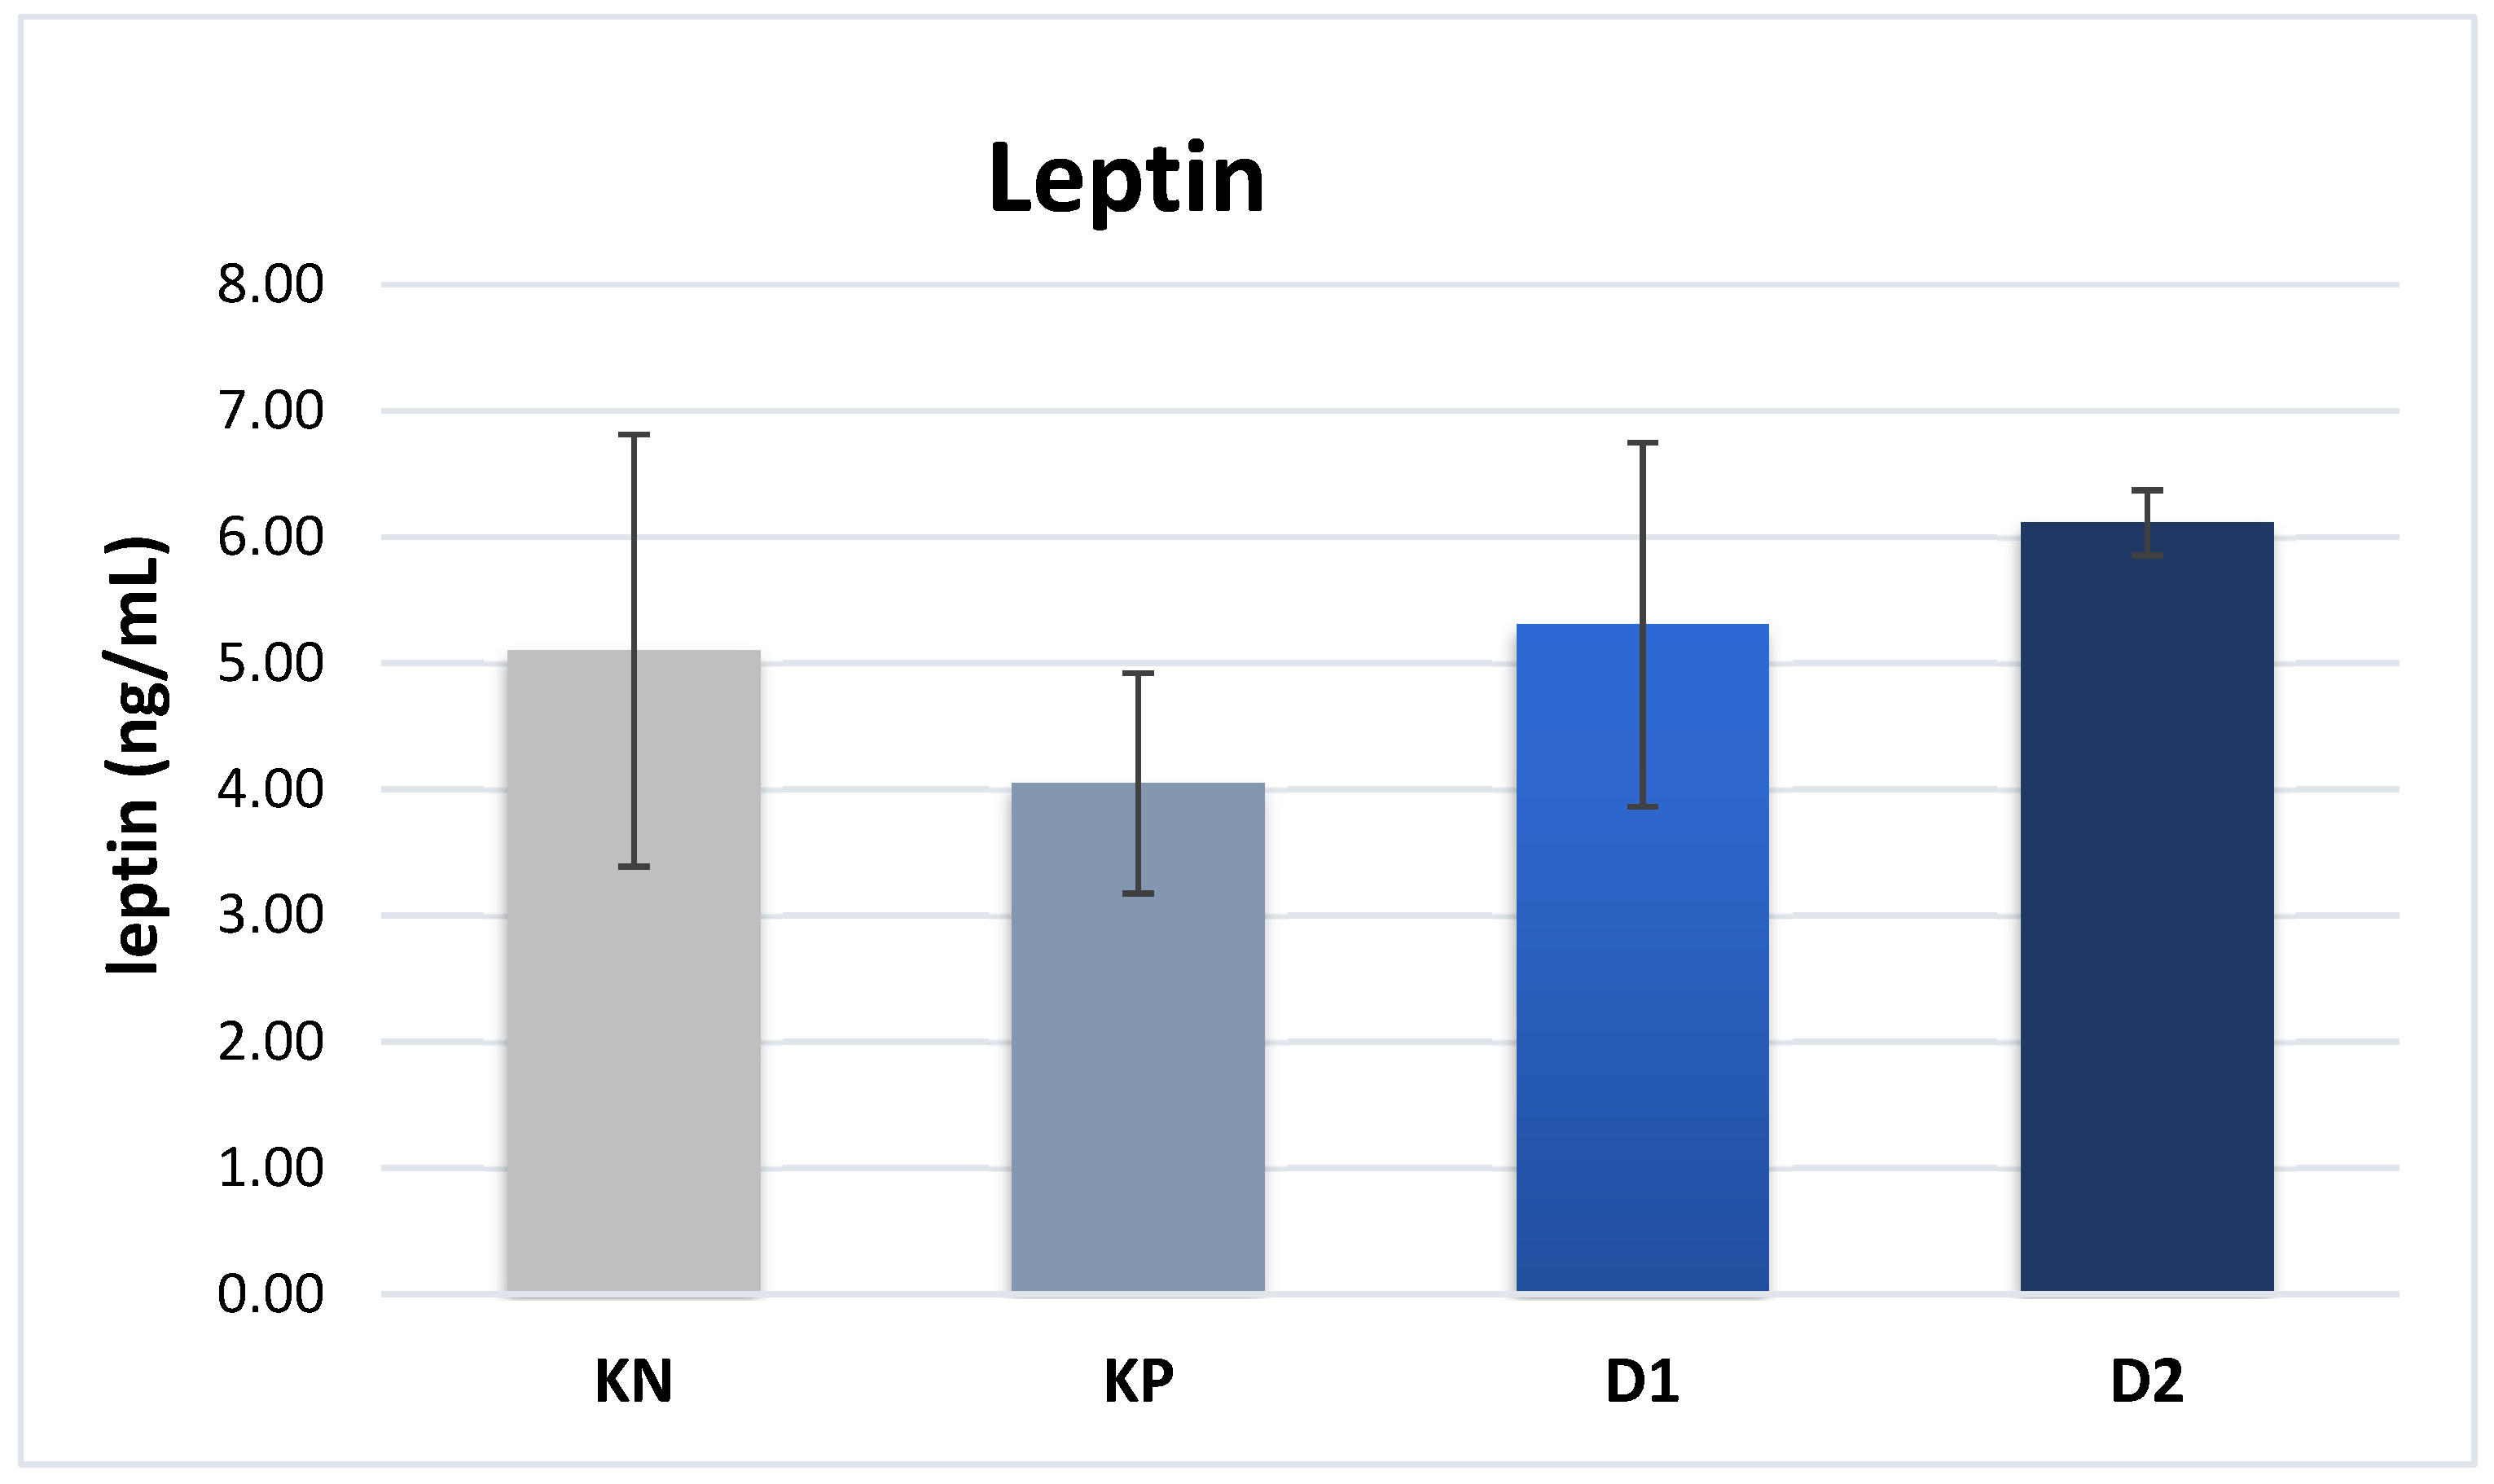
Figure 3.
Plasma insulin content in piglets.
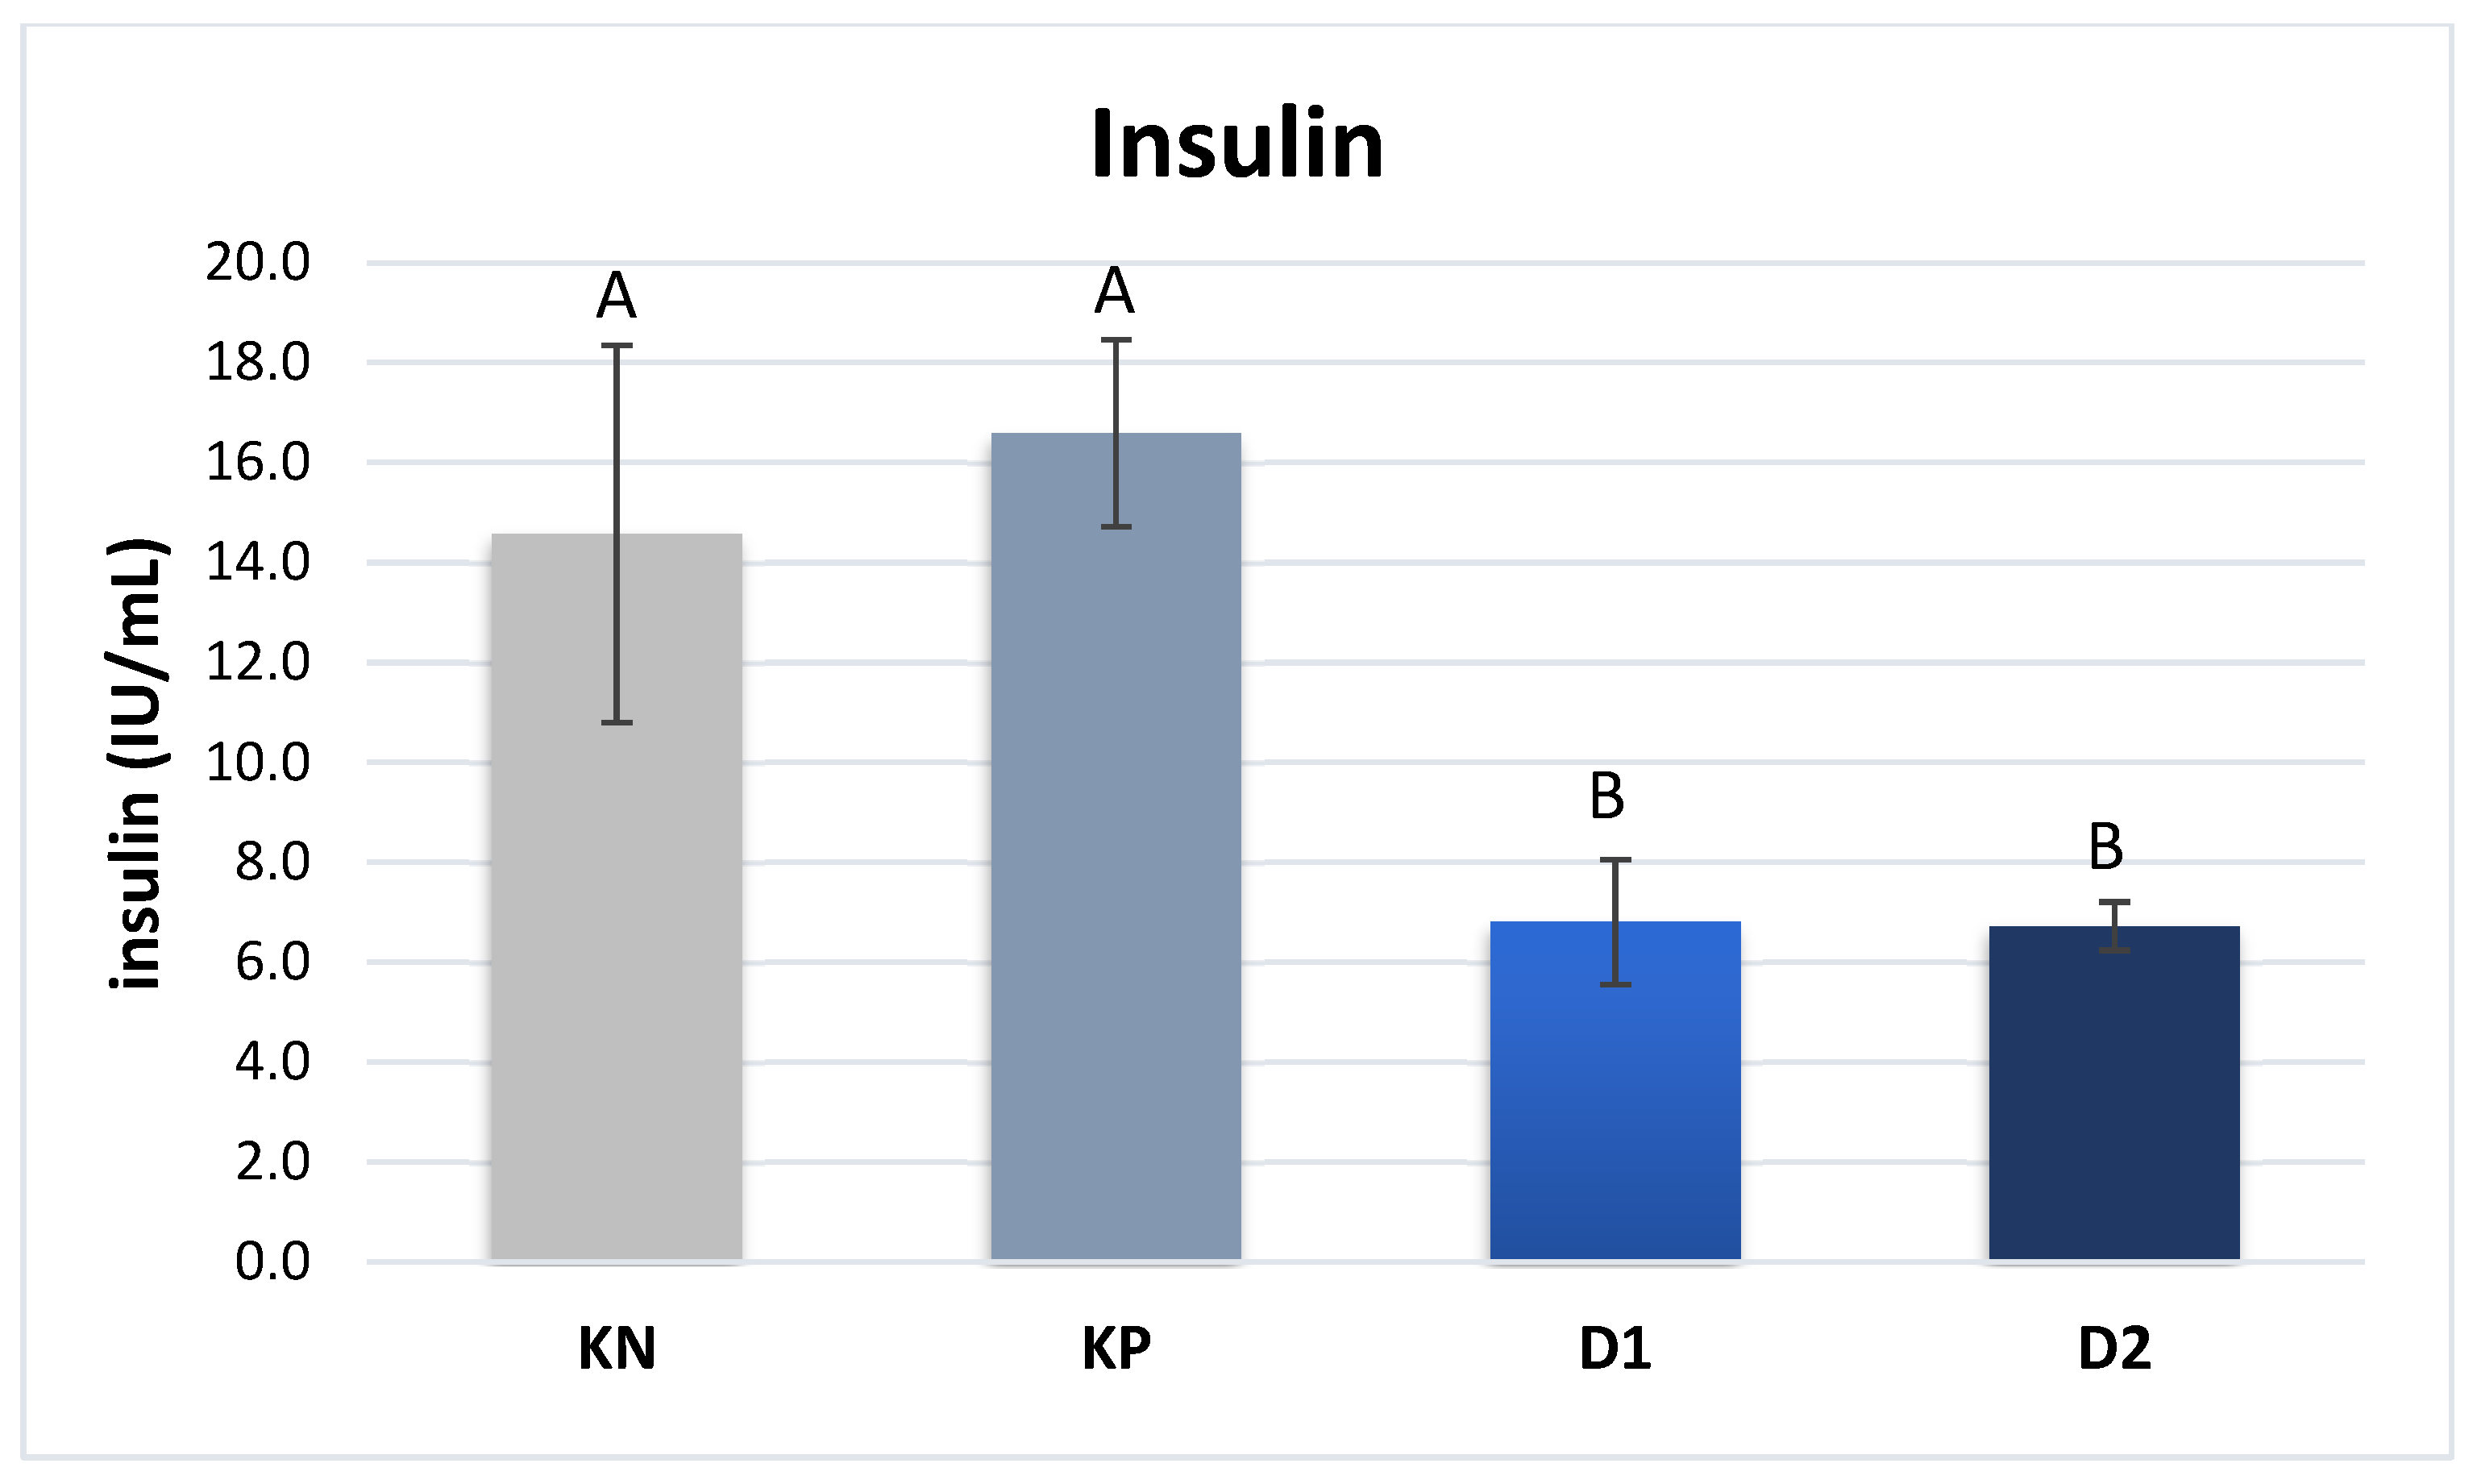
Table 1.
Enzyme doses administered to sows during the experiment.
| Specification | Nutritional group | |||
| NC | PC* | D1 | D2 | |
| Administration period (days) | 0 | 0 | 1–114 | 80–114 |
| Dose, IU/kg b.w. | ||||
| Lipase | 0 | 0 | 1000 | 1000 |
| Protease | 0 | 0 | 1350 | 1350 |
| Amylase | 0 | 0 | 4000 | 4000 |
*Administration of microbial pancreatic enzymes (lipase: 10,000 IU/kg b.w.; protease: 650 IU/kg b.w.; amylase: 6,650 IU/kg b.w.) to piglets in the super prestarter mixture between 14 and 21 days of age. b.w.: body weight.
Table 2.
Composition and nutritional value of mixtures for sows.
| Mixture composition | Type of feed mixture | ||
| Unit | Sows in early gestation | Sows in late gestation | |
| Barley meal Oatmeal Triticale meal Wheat meal Wheat bran Pszenmix Dried grasses Soybean meal Forage chalk Monocalcium phosphate Feed salt L-lysine Mineral and vitamin premix Rapeseed oil Binder |
% % % % % % % % % % % % % % % |
30.00 26.00 19.00 - 15.69 - 2.00 4.00 1.00 0.50 0.40 0.11 0.50 0.50 0.30 100.00 |
25.0 - 20.00 20.00 - 3.31 - 14.00 0.70 0.70 0.45 0.33 0.50 0.50 - 100.00 |
| Nutrient content in 1-kg DM | |||
| Metabolic energy Crude fiber Crude protein Lysine Methionine + cystine Threonine Tryptophan Calcium Phosphorus Sodium |
MJ g g g g g g g g g |
11.5 70 129 6.0 4.6 4.2 1.6 6.0 5.7 1.9 |
13.1 162 33 9.4 5.7 6.1 1.9 7.5 5.5 2.0 |
DM: dry matter.
Table 3.
Composition and nutritional value of mixtures for piglets.
| Mixture composition | Unit | Type of feed mixture | |||
| Super prestarter | Weaning prestarter | Starter | |||
| Barley meal | % | 13.06 | 40.00 | 40.00 | |
| Wheat meal | % | 30.00 | 20.00 | 22.00 | |
| Corn meal | % | 20.00 | 10.00 | 10.00 | |
| Soybean meal | % | 5.00 | - | 17.00 | |
| HP 300 | % | 10.00 | 14.00 | - | |
| Skimmed milk powder | % | 16.00 | 7.00 | 4.00 | |
| Pszenmix | % | - | 3.55 | 4.00 | |
| Bergafat | % | - | 2.00 | 1.00 | |
| Calcium formate | % | 1.50 | 1.20 | - | |
| Phosphate 1-Ca | % | 0.70 | 0.80 | 0.80 | |
| Feed salt | % | 0.26 | 0.30 | 0.40 | |
| L-lysine | % | 0.31 | 0.40 | 0.45 | |
| DL-methionine | % | 0.02 | 0.05 | 0.08 | |
| L-threonine | % | 0.07 | 0.13 | 0.14 | |
| L-tryptophan | % | 0.03 | 0.03 | - | |
| Probiotic preparation | % | 0.05 | 0.04 | 0.06 | |
| PP | % | 0.50 | 0.50 | 0.50 | |
| Plant oil | % | 2.50 | - | 0.5 | |
| 100.00 | 100.00 | 100.00 | |||
| Nutrient content in 1 kg DM | |||||
| Metabolic energy | MJ | 13.9 | 13.5 | 13.2 | |
| Crude fiber | g | 26 | 30 | 37 | |
| Crude protein | g | 212 | 189 | 182 | |
| Lysine | g | 13.5 | 12.5 | 11.9 | |
| Methionine + cystine | g | 7.18 | 6.6 | 6.5 | |
| Threonine | g | 8.52 | 8.0 | 7.6 | |
| Tryptophan | g | 2.76 | 2.5 | 2.2 | |
| Calcium | g | 8.66 | 7.6 | 7.6 | |
| Phosphorus | g | 5.92 | 6.5 | 6.0 | |
| Sodium | g | 1.50 | 1.6 | 2.0 | |
DM: dry matter; PP: prestarter premix. Data on piglet rearing were collected during the experiment. These included body weight, daily gains, feed intake, and feed utilization, as well as the number of falls and the health status of the piglets.
Table 8.
Morphometric analysis of piglets pancreas.
| Specification | Nutritional group | |||
| NC | PC | D1 | D2 | |
| Surface area of pancreatic follicles (mm2) | 692 ± 201A | 788 ± 190B | 890 ± 261B | 855 ± 223B |
| Number of follicular cells per pancreatic follicle | 9.4 ± 2.2b | 8.5 ± 2.0a | 8.1 ± 2.1a | 8.7 ± 2.0ab |
| Pancreatic cell surface area (mm2) | 72 ± 19A | 84 ± 18B | 89 ± 16B | 87 ± 22B |
*Group NC: In this control group, sows did not receive pancreatic enzymes during gestation. Group PC: In this control group, the piglets received pancreatic enzymes between 14 and 21 days of age. Group D1: In this experimental group, sows received pancreatic enzymes between 80 days of gestation and farrowing. Group D2: In this experimental group, sows received pancreatic enzymes between 30 days of gestation and farrowing. * A,BMean values marked with different letters are statistically significantly different at P ≤ 0.01; a,b Mean values marked with different letters are statistically significantly different at P ≤ 0.05.
Table 9.
Morphometric analysis of the mucosa and muscle membrane of piglet stomach.
| Specification | Nutritional group | |||
| NC | PC | D1 | D2 | |
| Mucosa thickness (µm) | 589 ± 71A | 655 ± 80AB | 580 ± 68A | 669 ± 85B |
| Muscle membrane thickness (µm) | 1774 ± 227a | 1852 ± 246ab | 1800 ±204a | 1926 ±258b |
*See Table 8.
Table 10.
Histometric analysis of the mucosa and muscle membrane of the duodenum of piglets.
| Specification | Nutritional group | |||
| NC | PC | D1 | D2 | |
| Length of villi (µm) | 234 ± 38 | 238 ± 28 | 228 ± 31 | 226 ± 26 |
| Depth of crypts (µm) | 104 ± 12A | 122 ± 16B | 102 ± 14A | 116 ± 12AB |
| Mucosa membrane thickness (µm) | 483 ± 51a | 506 ± 48b | 488 ± 57a | 497 ± 75b |
| Muscle membrane thickness (µm) | 142 ± 21A | 152 ± 20B | 140 ± 22A | 149 ± 18B |
*See Table 8.
Table 11.
Histometric analysis of the mucosa and muscle membrane of different sections of the small intestine of piglets.
Table 11.
Histometric analysis of the mucosa and muscle membrane of different sections of the small intestine of piglets.
| Specification | Nutritional group | |||
| NC | PC | D1 | D2 | |
| Initial section of small intestine | ||||
| Length of villi (µm) | 272 ± 49 | 287 ± 33 | 277 ± 31 | 268 ± 32 |
| Depth of crypts (µm) | 101 ± 8 | 107 ± 8 | 108 ± 7 | 109 ± 7 |
| Mucosa membrane thickness (µm) | 540 ± 61A | 596 ± 53B | 555 ± 48A | 591 ± 55B |
| Muscle membrane thickness (µm) | 110 ± 15A | 130 ± 20BC | 117 ± 25A | 139 ± 23B |
| Middle section of small intestine | ||||
| Length of villi (µm) Depth of crypts (µm) Mucosa membrane thickness (µm) Muscle membrane thickness (µm) |
312 ± 35 | 320 ± 33 | 310 ± 34 | 321 ± 38 |
| 103 ± 4aA | 118 ± 5b | 106 ± 8a | 122 ± 5b | |
| 416 ± 37A | 434 ± 35AB | 422 ± 38A | 440 ± 39B | |
| 112 ± 18A | 124 ± 15AB | 114 ± 19A | 127 ± 20B | |
| Terminal section of small intestine | ||||
| Length of villi (µm) | 330 ± 36 | 334 ± 36 | 326 ± 33 | 333 ± 30 |
| Depth of crypts (µm) | 102 ± 5A | 116 ± 5AB | 107 ± 7A | 124 ± 6B |
| Mucosa membrane thickness (µm) | 442 ± 46A | 472 ± 46Ab | 450 ± 50A | 482 ± 49B |
| Muscle membrane thickness (µm) | 119 ± 22A | 126 ± 22AB | 122 ± 19A | 128 ± 20B |
*See Table 8.
Table 12.
Histometric analysis of the mucosa and muscle membrane of the piglet iliac colon.
| Specification | Nutritional group | |||
| NC | PC | D1 | D2 | |
| Length of villi (µm) | 483±30 | 450±34 | 440±39 | 436±38 |
| Depth of crypts (µm) | 106±7A | 118±8B | 104±7A | 116±9B |
| Mucosa membrane thickness (µm) | 487±55A | 526±54B | 490±54A | 516±56B |
| Mucosa membrane thickness (µm) | 113±11A | 134±14B | 114±13B | 126±12B |
*See Table 8.
Table 13.
Activity of piglet jejunum brush border enzymes (nM/min/mg protein).
| Enzyme | Jejunum part | Nutritional group | |||
| NC | PC | D1 | D2 | ||
| Saccharase | Prox | 0.50±0.17 | 0.50±0.13 | 0.68±0.11 | 1.36±046 |
| Mid | 0.68±0.11 | 0.68±0.11 | 0.47±0.16 | 0.55±0.08 | |
| Dist | 0.06±0.01 | 0.16±0.01 | 0.15±0.08 | 0.20±0.08 | |
| Lactase | Prox | 21.80±3.27A | 29.60±3.2B | 32.90±3.99B | 30.00±6.83B |
| Mid | 18.6±2.99 | 19.20±2.10 | 17.20±5.82 | 20.00±4.35 | |
| Dist | 10.40±3.43 | 8.15±2.88 | 6.60±1.05 | 9.62±3.87 | |
| Maltase | Prox | 6.23±1.49 | 6.23±1.51 | 6.09±3.99 | 6.76±3.63 |
| Mid | 4.05±1.44 | 5.44±1.62 | 5.10±2.69 | 5.27±1.59 | |
| Dist | 2.35±0.48 | 3.38±0.69 | 3.21±0.95 | 3.59±1.46 | |
| Dipeptidylpeptidase IV | Prox | 1.53±0.98 | 1.70±0.87 | 1.37±0.68 | 2.16±1.05 |
| Mid | 1.54±1.14 | 2.22±1.13 | 2.15±1.77 | 2.47±1.50 | |
| Dist | 3.74±2.20 | 2.80±1.06 | 2.99±1.18 | 2.87±1.04 | |
| Aminopeptidase N | Prox | 5.81±2.98 | 5.98±2.28 | 8.94±2.39 | 6.07±2.46 |
| Mid | 5.27±1.35 | 5.10±1.32 | 5.16±1.97 | 5.15±1.18 | |
| Dist | 5.69±2.99 | 6.12±2.23 | 6.23±2.30 | 6.20±2.28 | |
| Aminopeptidase A | Prox | 6.88±2.37 | 7.58±2.87 | 7.51±3.11 | 7.64±2.41 |
| Mid | 5.45±1.46 | 6.88±1.98 | 5.79±2.44 | 7.51±2.19 | |
| Dist | 3.83±0.76 | 4.21±1.01 | 4.06±1.18 | 4.40±1.30 | |
*See Table 8.
Table 14.
Content of haptoglobin and immunoglobulin IgA in the blood plasma of piglets (mg/mL).
| Indices | Nutritional group | |||
| NC | PC | D1 | D2 | |
| Immunoglobulin IgA | 0.08±0.01 | 0.09±0.02 | 0.90±0.01 | 0.90±0.02 |
| Haptoglobin | 0.42±0.20B | 0.18±0.15A | 0.38±0.20B | 0.20±0.13A |
*See Table 8.
Disclaimer/Publisher’s Note: The statements, opinions and data contained in all publications are solely those of the individual author(s) and contributor(s) and not of MDPI and/or the editor(s). MDPI and/or the editor(s) disclaim responsibility for any injury to people or property resulting from any ideas, methods, instructions or products referred to in the content. |
© 2023 by the authors. Licensee MDPI, Basel, Switzerland. This article is an open access article distributed under the terms and conditions of the Creative Commons Attribution (CC BY) license (http://creativecommons.org/licenses/by/4.0/).
Copyright: This open access article is published under a Creative Commons CC BY 4.0 license, which permit the free download, distribution, and reuse, provided that the author and preprint are cited in any reuse.


