
Submitted:
21 August 2023
Posted:
23 August 2023
You are already at the latest version
Abstract
Shallow Geothermal Energy (SGE) exchanges heat with the ground. In continuous long-term operation, the initial temperature field can be disturbed, and subsurface thermal plumes can be developed. In this paper, the thermal impact of a SGE system under Mediterranean climate is handled. Temperature recordings from 104 thermal probes placed in depth along 15 monitoring boreholes are analysed. Those boreholes were drilled 1-2m from thermos-active boreholes of the case study system installed in a university building. The analysis handles one year of SGE system operation. Temperature depth profiles, reaching up to 140 m depth, were registered with a 10-minute time-step resulting in a large amount of data. Ground thermal conductivity was estimated experimentally and semi-empirically allowing to compute the initial undisturbed ground temperature profiles and compare it with the monitored values. Climate data was recorded by the university meteorological station. Globally, the measured and computed data were coherent and a non-negligible impact of the SGE system operation in the first year was observed. The building orientation as well as the nearby departments had significant impacts on shallow ground temperature. Maximum ground temperature changes, ranging from 2 to 3º C as observed in different boreholes indicating that the system is operating efficiently.
Keywords:
Ground temperature distribution
; Geothermal energy
; Renewable sources
; In-depth temperature acquisition
; Mediterranean climate
1. Introduction
With the ever-increasing energy consumption, the resulting CO2 emissions are continuously growing. For example, carbon dioxide emissions rose by nearly 1 % in 2022 reaching a new and highest level ever of 36.8 billion tons [1]. To address this situation and promote decarbonization, the European Union (EU) has set up strategies to improve the energy performance and look for more sustainable alternatives of buildings, infrastructure and industry, heating and cooling demands, as they are responsible for half of the total EU’ energy consumption [2]. In fact, around three-quarters of this energy consumption is still generated from fossil fuels, while only 19 % results from renewable energy sources [3].
Using renewable energy sources in the building sector is aligned with the sustainable development goals set by the United Nations to achieve sustainability by reducing energy consumption and CO2 emissions. Low enthalpy geothermal energy is one of the several types of renewable energy sources which can be used in buildings thermal conditioning (e.g. [4,5,6]). Shallow Geothermal Energy systems (SGE) take advantage of the nearly constant temperature of the ground, which acts as a heat source and a heat sink in winter and summer, respectively [7,8]. The nearly constant ground temperature, known as the Undisturbed Ground Temperature (UGT), is found at a depth of a few meters, typically no more than 10 m, in contrast to the more superficial ground temperature that is affected by the large daily atmospheric temperature amplitudes.
Ground temperature up to a about a depth of 10 m is affected by the absorbed diurnal wave of radiation, heat conduction and convection, induce considerable heat exchanges between the atmosphere and the ground surface (e.g. [9,10,11]). At larger depths, climate effects decrease, and consequently, soil temperature tends to remain nearly constant. Studies such as [9,12,13], have analyzed ground temperature profiles in different contexts. Two types of oscillations were distinguished in ground temperature profiles: (i) daily basis variations (short-term signal) and (ii) annual basis variations (long-term signal). Those variations can divide the ground into the three zones; (i) the surface zone reaches 0.5 m to 1.0 m depth, where the soil temperature is highly affected by the daily weather changes, (ii) the shallow zone ranges from 1 m to 8 m in dry soils, while in wet soils it can reach up to 20 m maximum, where the soil is influenced by the seasonal wave variations at depth, and (iii) the deep zone starts after 8 m in dry soils or even after 20 m depth in wet soils, where the seasonal effects are negligible. At this zone, ground temperature is nearly constant throughout the year. However, at depths greater than 100 m thereafter, the ground temperature can rise owing to the geothermal gradient effect.
The thermal exchanges induced by SGE operation vary seasonally and affect the ground temperature. During heating mode, the ground temperature decreases, while during cooling mode, it tends to increase [14]. The thermal impact of SGE systems operation can achieve large radial distance depending on the heat exchange rate, duration, and soil type, among other factors [14]. In long-term continuous and unbalanced operation of a SGE system, the soil temperature might not recover its initial values. Consequently, a thermal plume can be formed in the soil affecting the initial design values of the system and adversely affecting its performance. Various studies have simulated the impact of GSHP systems operation on ground temperatures, such as [15,16,17,18].
Evaluating spatial soil temperature distribution during the geothermal system operation is of major importance in analyzing SGE performance as well as its sustainability (e.g., [16,19]). Tinti in his study [20] reported the thermal effect of the Borehole Heat Exchangers (BHE) on the ground temperature by monitoring a borehole located 1 m away from one BHE. This study highlighted the importance of long-term and multiyear monitoring to evaluate the effect of the system operation on the entire ground impacted by the presence of BHEs. Another study [21] has shown results of a 3-year monitoring of SGE under intensive operation by recording surrounding temperature in groundwater. A maximum difference of 1.2 ºC was obtained between unaffected upstream groundwater temperatures and impacted downstream temperatures at the site. A long-term evaluation of the system operation effects on ground temperature was presented in [22] by monitoring temperature for 10 years. In this study, the temperature measurements showed increasing rates of 0.135 ºC/year at a depth of 10 m and 0.118 ºC/year at a depth of 50 m.
Discharging heat in the cooling season and extracting heat in the heating season resulted in 0.109 ºC/year change in temperature increase over 10 years. Despite the growing use of SGE worldwide, there are scarce examples in the literature regarding the long-term effects of their operation on ground temperature based on monitoring data. Furthermore, no studies have been found that specifically investigate systems operating under southern Europe climate conditions.
This paper presents data recorded during the first year of operation from investigation boreholes up to 140 m depth placed around a BHE geothermal system located in the campus of Aveiro University (UA), in the center-north of Portugal. These boreholes were installed in different locations to investigate ground temperature changes caused by the geothermal system as well as by other possible factors or interferences. The monitoring system includes 15 boreholes with temperature sensors installed at different depths, recording data every 10 minutes. The monitored data is analyzed both individually and in an integrated manner, and the temperature envelopes measured are compared to numerically obtained temperature profiles, calibrated from a thermophysical characterization of the different soil layers and on the meteorological data from a nearby weather station.
2. Site Description
2.1. Geothermal system description
The SGE system was installed at Aveiro University (UA) campus, in the north of Portugal, approximately 1.6 km from the Aveiro Lagoon and 9 km from the Atlantic Ocean. The University campus boasts four buildings constructed based on sustainable construction principles, which serve as demonstrators for sustainable and green university buildings [23].
The building of the Centre of Communication and Image Science (CCCI), with 1600 m2 of floor area and a total of 3300 m2 of acclimatized area, is the focus of this study. The building’s thermal comfort is assured by a SGE system which includes a reversible water-water heat pump, with 219 kW power for heating and cooling. Its Coefficient of Performance (COP) is 3.5 and Energy Efficiency Ratio (EER) is 4.2.
The heat pump unit is in an underground technical room within the CCCI building (shown in Figure 1-middle). It is connected from one side to the primary circuit (Figure 1-left)) which is composed by 40 BHE and three energy piles, and on the other side, to the secondary circuit (Figure 1-right)) which consists of the heat distribution pipework system embedded in the building slabs.
The BHEs, with 160 mm diameter, are spaced 5 m apart and drilled to a depth up to 140 m, while the 600 mm diameter energy piles have a length of 10 m (Figure 2). The total length of the BHEs system is 5280 m. To characterise some of the soil properties, samples were collected from two of the 40 boreholes (F16 and F17 in Figure 2) during the drilling phase, as further detailed. Due to the poor soil strength of the superficial layers, the building was founded in structural end-bearing piles, each with 10 m depth.
The 40 boreholes are placed 5 m apart and along two sides of the building, while the three structural and energy piles are placed at the edge of the building near the south-eastern and the southwestern façades, see Figure 2. Soil samples were collected during the drilling phase from two of the 40 boreholes (F16 and F17 in Figure 2) to characterise the soils, as will be discussed later.
2.2. Site ground main characteristics
The geological formation at the site includes the Aveiro sedimentary region of the Vouga river estuary, which is connected to the Atlantic Ocean. This region is characterized by a meso-tidal system, resulting in significant daily fluctuations ranging from 0.6 m for neap tides to 3.2 m for spring tides. These tidal fluctuations correspond to a maximum and a minimum phreatic level at the soil layers of 3.5 and 0.5 m, respectively [24]. Two geotechnical survey campaigns were carried out to characterise the soil at the site:
- Four boreholes were drilled to a depth of 7 m and intact soil samples were collected. The soils in the first 6 m were classified as soft to medium sandy clay, which stiffer soils found bellow, including silty sand and sandstone.
- Disturbed soil samples were collected from 2 boreholes, F16 and F17, which were drilled to a depth of 132 m. Index properties of the different soil layers (water content, dry unit weight of particles, grain-size distribution, and consistency limits) were obtained [25].
Based on the analysis of the borehole information, a three-layer stratigraphic model was established:
- A superficial layer of fine sandy clay soil up to 6 m depth;
- A layer of silt and clay between 6 m and 78 m depth, including a 6 m-layer of coarse clayey sand between 18 m and 24 m depth;
- A layer of stiff clayey sand (sandstone) up to 140 m depth, including another 6 m-layer of thin clay and sandy clay.
To evaluate the ground thermal properties, specifically thermal conductivity, 𝜆, two different methods were used. In the first method, thermal conductivity was measured in laboratory tests on intact samples collected from the superficial layer (up to 6 m depth). These measurements were conducted under transient conditions with a needle probe (Hukseflux TPSYS02 system). This equipment measures thermal conductivity within the range of 0.1-6 W.m−1.K−1 with high accuracy ± 0.02 W.m−1.K−1 [26]. 𝜆 values were estimated based on the line source solution under the general assumption of a radial heat flow applied on a linear heat source with infinite length and infinitesimal diameter in an isotropic and homogeneous medium (e.g., [27,28]). The results obtained both on intact and reconstituted soil samples collected in the surface layers are presented in Table 1 together with reference values of 𝜆 on similar soils [29]. The intact sample was tested in its natural state condition (saturation ratio 𝑆𝑟 = 35%), while the reconstituted samples were tested in dry and in partially saturated conditions.
In the second method, soil thermal conductivity of the different layers collected from the two geothermal boreholes (F16 and F17) was obtained using semi-empirical relation (eq. 1) that considers the volumetric fraction of the different soil phases. This approach assumes of a geometric mean spatial arrangement of soil the volumetric fractions (solid, gaseous, and liquid). The parameters required to use in this relation (eq. 1) were obtained in the previous physical characterization of the samples by determining their moisture content 𝑤, particles dry unit weight 𝐺𝑠, degree of saturation 𝑆𝑟 and porosity 𝑛.
Based on the geotechnical survey, it was considered that the soil was unsaturated in the first 6 m and completely saturated below that depth. Solid particles thermal conductivity 𝜆𝑠 was assumed in range between that of clay and quartz [2.7 - 7.7] W.m−1.K−1 [30], water and air thermal conductivities are, respectively, 𝜆𝑤 =0.61 W.m−1.K−1 and 𝜆𝑎 =0.025 W.m−1.K−1 [31]. Thermal conductivity results are presented in Table 2 and Table 3.
The resulting estimated values of 𝜆 fall within 1.93 W.m−1.K−1 and 3.25 W.m−1.K−1 for soils in borehole F16 and between 1.81 W.m−1.K−1 and 2.69 W.m−1.K−1, for soils in borehole F17. It is observed that there is good agreement between the values measured by both methods in the shallow layers.
2.3. Site weather conditions
Weather conditions at the site, namely air temperature, solar radiation, relative humidity, precipitation, air velocity and direction, in addition to the building three-dimensional geometry and dimensions, as well as type use, orientation, envelope thermal conductivity and occupants’ habits, among other factors, contribute to the building heating and cooling energy needs. The SGE system must be able to sustainably meet these needs while maintaining the user’s thermal comfort. According to Köppen-Geiger climate classification, Aveiro has a Mediterranean climate characterized by warm dry summers and mild wet winters, see Figure 3 [32,33].
According to the Portuguese thermal regulation Aveiro is in the climatic Zone 2, which is estimated to have a 4-month cooling season and a 6.2-month heating season.
Data from the CESAMET weather station, located at the top of another building department in the campus of Aveiro University only 100 meters away from the CCCI SGE system was used for the climate conditions characterization. Global outdoor dry-bulb temperature, relative humidity and global radiation were collected with a 10-minute time-step, as shown in Figure 4 where the records for the study period are shown. Regarding the weather characterization, the hottest months and highest irradiance are July and August. It also shows that the lowest temperature occurs in December, January, and February.
3. Ground temperature-monitoring system
The temperature acquisition system was installed in 15 investigation drilled boreholes (hereafter referred to as B.I) located between 1 m to 2.5 m from the existent BHE which provide heating and cooling to the CCCI building. The temperature sensors installed are placed at different depths. The temperature profiles recorded overtime allow to evaluate the occurrence of eventual thermal plumes caused by the SGE system operation or by other interferences.
Monitoring started 8 months after the geothermal system had been put in operation. The investigation boreholes were assembled in 4 groups defined according to their location near the façades and the BHE, as shown in Figure 5. Table 4 summarizes the boreholes depth of each group.
Some redundancy in investigation boreholes of the same group is expected due to similar distance and approximate position to the geothermal boreholes. However, having several monitoring boreholes in the same group also allows mutual validation of readings and detecting of small trends.
The investigation boreholes B.I.1 to B.I.9 and B.I.16 were placed near the southeast façade of the CCCI building and drilled at 2.5 m to 4.5 m from the BHE, while B.I.10 to B.I.15 were localized in the southwest façade near the three energy piles.
Temperature sensors PT100 3-Wire type were used, in a total of 104, distributed along specific depths. They are individually connected to a data logger for continuous recording. The boreholes were filed with bentonite grout after the installation of the sensors. Some aspects of the temperature-depth monitoring system installation are shown in Figure 6. Temperature data are registered with a time step of 10-minutes. Only the temperatures collected over a 12-month period are analysed in this study.
4. Ground temperature data analysis
4.1. Individual annual data temperature analysis
The investigation boreholes B.I.1 and B.I.12 are located under opposite corners of the CCCI building, with different solar radiation exposures, and were selected to present some trends of the registered values. B.I.1 is placed at 0.62 m from the building and 2.5 m from BHE F17; B.I.12 is placed at 2.7 m from the CCCI building and at 1.9 m from BHE F16. B.I.12 monitors temperature up to 20 m depth (2, 5, 10, 15, 20 m), while borehole B.I.1 reaches 50 m (1, 2, 5, 10, 20, 40 and 50 m). Figure 7 presents the monthly average ground temperature evolution of B.I.1 and B.I.12 for one monitoring year. The atmospheric temperature recorded every 10 min in the meteorological station located in UA campus is also included as well as its sinusoidal fitting.
Some conclusions can be drawn from the analysis of Figure 7, namely:
- At 1 and 2 m depths, the ground temperature, during the cooling season, is higher than the atmospheric temperature (which might be a result of the heat injection into the ground by the BHEs system);
- Ground temperature monitored over time in both B.I.1 and B.I.12 at depths (1, 2, 5, and 10 m) follows the sinusoidal trend of the weather air temperature, however, with an increase in the phase shift and wavelength at depth. For instance, the minimum air temperature had occurred in January and the maximum in August. At 5 metres depth, they occurred, respectively, in April and in October. At 10 metres, the minimum temperature was registered in May and the maximum in November, with an offset of three months. This is a result of the significant thermal inertia and thermal diffusion of the near surface soil;
- It was observed a difference of 15 ºC in summer between the maximum air temperature and ground temperature at 1 m depth, and a difference of 8 ºC in winter between the minimum air temperature and the ground temperature at 1 m depth. This indicates an unbalanced thermal exchange between the building and the ground and the possibility of some trend to an increase in temperature in the long-term;
- At 15 and 20 m of depth, the ground temperature tends to have constant values between 15.3ºC and 17.4ºC in B.I.1, while in the borehole B.I.12, the ground temperature tends to have higher values between 16.35 and 18.18ºC. Thus, at a depth between 15 to 20 m, a constant temperature was observed in both boreholes;
- Ground temperature values, at 20 m of depth, is higher than the annual mean air temperature (15.46 C) by almost 1 ºC.
In general, similar trends were observed in the other boreholes. An analysis over a longer period will allow to understand if there is any alteration in these trends. The raw data were converted to monthly average temperature sets and the average ground temperatures are plotted in a two-dimensional contour graph presented in Figure 8.
This representation allows to perceive a higher impact, in terms of amplitude and duration, of the warmer months. It also shows that:
- At 2 m and 5 m, in summer, the average ground temperature obtained in B.I.12 is higher than that observed in B.I.1, while the opposite is observed in winter. This can be explained by the fact that B.I.12 is exposed to diurnal weather variations due to the absence of neighboring buildings, which is not the case in the B.I.1.
- At 10 m and 20 m, during the entire monitoring period, the average ground temperature obtained in B.I.12 is higher than that measured in B.I.1. The temperature difference between B.I.12 and B.I.1 varied from 0.2 ºC to 2.1ºC. This can be explained by the proximity of each investigation borehole to the closest BHE. In fact, B.I.12 is 1.9 m close to the BHE F16 and B.I.1 is located at 2.5 m from the BHE F17, therefore the BHEs operation is more visible in the B.I.12 rather than in the B.I.1.
4.2. Global ground temperature analysis
The profiles of the temperature envelopes registered in all the boreholes throughout the entire year and average temperatures of each group are presented in Figure 9 organized for each of the four groups (see Table 4).
The analysis of this global data shows that:
- The results are globally consistent, indicating good record quality;
- In agreement with the results previously observed in Figure 7, ground temperature in the superficial soil layers is mainly dominated by transient heat conduction, which is related to sinusoidal air temperature variations throughout the year;
- The effect of atmospheric temperature variations is observed till between 10 m and 15 m depths. It is believed that this relatively high depth of the atmospheric temperature effect is due to the relatively high conductivity resulting from the elevated position of the phreatic level (thermal conductivity superior to 2.5 W.m−1.K−1);
- At depths greater than 5 m, the monitored ground temperature shows similar results in boreholes of the same group;
- A general trend was observed in all boreholes at 1, 2 and 5 m depth: ground temperature in the heating season tends to be higher in boreholes closer to the building than in those which are farther. In the cooling season, the opposite is observed, i.e. the ground temperature is lower in boreholes closer to the building. This trend can be a result of the thermal boundary effect of the building on the surrounding ground temperature, and due to the heat flux between the building and the ground;
- The effect of the neighbouring BHE is evident throughout the depth of the monitoring boreholes, with an increase or decrease in the average temperature depending on the direction of the thermal flow;
- The difference between the extreme maximum and minimum temperature registered in the boreholes of group 1 is around 14 ºC at 2 m depth. This difference decreases to 4 ºC at 5 m depth and to 2 ºC at depth ≥ 20 m. As regard to group2, the difference is around 15 ºC at 2 m depth. This difference decreases to 6 ºC at 5 m depth and to 1 ºC at depth ≥ 20 m;
- As regards group 3 and 4, the difference between the extreme maximum and the minimum temperature registered in the borehole of group 3 and 4 is around 15 and 12 ºC at 2 m depth, respectively. This difference decreases to 4 and 7 ºC at 5 m depth and to between 1 to 2 ºC at depth ≥ 10 m. As a conclusion, the first three groups as they are located near the same façade have similar trends and values, while the fourth group has higher amplitude and difference as it is located on the opposite façade;
- The SGE system operation introduces thermal changes in the entire length of the boreholes due to the effect of circulating heat carrier fluid;
- It can be observed in group 1 that the soil layers temperature at large depths (≥ 80 m) is clearly affected by the geothermal gradient of up to 3 ºC/100m;
- It was observed that the average ground temperature of each group registered at 10 m depth shows similar values in groups 1 and 2 varying between 16 ºC and 17 ºC, and between 16 ºC and 18 ºC in groups 3 and 4. The first two groups are located in front of the same southeast façade of the case study building near to the neighbour building, while the third and fourth groups of boreholes are located near to the southwest façade which is more exposed to solar radiation due to the absence of the buildings shadings in this direction. The data suggests the existence of a boundary effect on the radiation imposed by the building.
5. Undisturbed initial ground temperature estimation
The raw data was also compared with a numerical simulation of the undisturbed temperature considering the thermal conductivity of the different layers (Table 2 and Table 3) and the atmospheric thermal action recorded at CESAMET weather station. This numerical simulation is used as a free field temperature estimate in the absence of temperature registrations before the building construction as well as the SGE system operation. Then the computed values were compared to the monitored ones. The comparison of both temperature envelopes is presented in Figure 10 for the four groups.
The comparison between calculated temperature profiles and the monitored data, can conclude the following points:
- At 1 m and 2 m depths, soil temperature tends to close to the undisturbed ground temperature in winter, while in summer, the monitored temperature tends to be higher, showing a possible effect of the shallow geothermal system operation and/or of building boundary effect;
- The effect of the shallow geothermal system operation can also be observed at depth ≥ 20 m depth, where the extreme ground temperature measured in each group compared with the extreme numerical temperature. As regards to group 1, it is observed that the minimum temperature profile measured in boreholes of this group is 2ºC lower than the minimum numerical temperature. On the other hand, the maximum temperature measured in boreholes of this group is 1ºC higher than the maximum temperature computed numerically;
- At higher depths, boreholes in this group have higher ground temperatures in winter and summer than the numerically computed undisturbed ground temperature. This can also be attributed to the effect of the geothermal gradient mentioned above;
As regards to boreholes’ group 2, 3, and 4, the maximum and the minimum ground temperature registered at depths ≥ 20 m is 2 to 3 ºC higher than the extreme temperature computed numerically in heating and cooling seasons, emphasizing the effect of the active borehole operation as well as a potential effect of the building boundary and the exposure to solar radiation. This can indicate that with a long-term operation, ground tends to accumulate more heat energy and ground temperature tends to increase;
- A difference of 1 to 2 degrees between the maximum and the minimum ground temperature profiles was observed in the four groups, which in turn can manifest the ground capacity to respond thermally to the building energy needs by exchanging energy through the boreholes.
Finally, the values measured and computed in this case study allow identifying the depth values of both daily and seasonal variations and can be compared with those found in the literature, as presented in Table 5. The depth varies from one site to another as ground and atmospheric conditions differ. Nevertheless, the depth found in the study presented is similar to those found in other studies for similar soil conductivity and air annual average temperature.
6. Conclusions and remarks
The temperature records obtained from 15 temperature monitoring boreholes around a shallow geothermal system (SGE), with 40 BHEs, installed in a building at the University of Aveiro, Portugal, were presented and analysed. This is the first time that such a large amount of data has been collected in the climatic conditions of Southern Europe and the first research case study on this subject in Portugal. Ground temperature was monitored using 104 thermal sensors installed in-depth up to 140 m depth for one year, while the geothermal system was in continuous operation.
The boreholes were installed after the conditioning system was put into operation, therefore it was not possible to obtain a direct comparison with the undisturbed ground temperature, and so the initial temperature field was estimated numerically based on a prior characterization of the various soil layers and on the climatic data from a local meteorological station. The monitoring boreholes were placed in different positions around the BHE at various distances from them and from the building façades, concentrated in some groups providing information with some redundancy. The overall temperature-data registered and analysed over the monitoring period produced reliable and consistent results.
In the first year of operation of this monitoring system, the following conclusions can be drawn:
- Temperature profiles show that the impact of the seasonal atmospheric temperature variations action reaches depths as high as 20 m, probably due to the saturation conditions of soils and sand percentage in the proximity of Aveiro Lagoon, which results in the relatively high thermal conductivity range; and eventually due to some convection effect towards the lagoon which increased the heat transport;
- There is an effect of the geothermal system operation all over the entire boreholes depths obtained in groups 1, 2, 3, and 4, with the ground temperature amplitudes of 12 to 15 ºC at 1 m depth. This ground temperature amplitudes decrease to 1 to 2 ºC at depth higher than 10 m;
- There is an effect of the presence of the building and of the radiation that is evidenced by a higher thermal amplitude in relation to the maximum temperatures at the shallowest levels and on the southeast-oriented facades;
- Some of the deeper boreholes show an increase in temperature, which may be due to the development of a geothermal gradient.
Globally, the data presented clearly showed the shallow geothermal system operation effect and the building boundary effect resulting from a heat flux between the building and the ground. The building orientation as well as the nearby department buildings have significant impacts on shallow ground temperature, because shaded zones have resulted in lower temperature in shallow layers until 1 m depth (e.g. group 1) when compared to the boreholes that are exposed to solar radiation (e.g. group 3 and 4).
Overall, there is a clear unbalanced as regards to the imposed thermal loads and a trend to a temperature increase at shallow depths, whose evolution will be monitored in the coming years.
The potential of this system has been demonstrated, as well as the importance of the collected data and of that will be collected in the future, which will enable the long-term assessment of the system sustainability and energy efficiency. It is also worth mentioning the large amount of data generated, will be analysed with appropriate big data processing and analysis tools.
Author Contributions
Conceptualization, Ana Vieira; Data curation, Kamar Aljundi and António Figueiredo; Formal analysis, Kamar Aljundi, Ana Vieira, António Figueiredo and Rafaela Cardoso; Funding acquisition, Ana Vieira; Investigation, Kamar Aljundi; Methodology, Kamar Aljundi; Project administration, Ana Vieira; Resources, José Lapa and António Figueiredo; Software, Kamar Aljundi; Supervision, Ana Vieira and José Lapa; Validation, Kamar Aljundi, Ana Vieira, José Lapa, António Figueiredo and Rafaela Cardoso; Visualization, Kamar Aljundi; Writing – original draft, Kamar Aljundi; Writing – review & editing, Ana Vieira, José Lapa, António Figueiredo and Rafaela Cardoso.
Funding
This research received no external funding.
Data Availability Statement
All data, models, and code generated or used during the study appear in the submitted article.
Acknowledgments
The authors acknowledge the support provided by the Portuguese Foundation for Science and Technology (FCT) under Project Geosustained (Sustainability assessment of shallow Geothermal systems for Lisbon. Characterization studies of the city soils thermal and thermomechanical behavior), reference PTDC/ECI-CON/1866/2021, and the first author under PhD scholarship reference SFRH/BD/140809/2018.
Conflicts of Interest
The authors declare no conflict of interest.
References
- International Energy Agency IEA (2022). https://www.iea.org/, accessed on 16 of August of 2023.
- EUROPEAN COMMISSION (2016). Mapping and Analysis of the Current and Future (2020-2030) heating/cooling fuel deployment (fossils/renewables). Retrieved from: https://energy.ec.europa.eu/publications/mapping-and-analyses-current-and-future-2020-2030-heatingcooling-fuel-deployment-fossilrenewables-1_en, accessed on 16 of August of 2023.
- Haar, Lawrence. "An empirical analysis of the fiscal incidence of renewable energy support in the European Union.". Energy Policy 2020, 143, 111483. [CrossRef]
- Brandl, Heinz. Energy foundations and other thermo-active ground structures. Géotechnique 2006, 56, 81–122. [CrossRef]
- Stylianou, I.; Florides, G.; Tassou, S.; Tsiolakis, E.; Christodoulides, P. Methodology for estimating the ground heat absorption rate of Ground Heat Exchangers. Energy 2017, 127, 258–270. [Google Scholar] [CrossRef]
- Roka, R.; Figueiredo, A.; Vieira, A.; Cardoso, J. A systematic review on shallow geothermal energy system: A light into six major barriers. Soils and Rocks 2022, 46. [Google Scholar] [CrossRef]
- Vieira, A.; Alberdi-Pagola, M.; Christodoulides, P.; Javed, S.; Loveridge, F.; Nguyen, F.; Cecinato, F.; Maranha, J.; Florides, G.; Prodan, I.; Van Lysebetten, G.; Ramalho, E.; Salciarini, D.; Georgiev, A.; Rosin-Paumier, S.; Popov, R.; Lenart, S.; Poulsen, S. E.; Radioti, G. Characterisation of ground thermal and thermo-mechanical behaviour for shallow geothermal energy applications. Energies 2017, 10. [Google Scholar] [CrossRef]
- Sarbu, I.; Sebarchievici, C. Using Ground-Source Heat Pump Systems for Heating/Cooling of Buildings. In (Ed.), Advances in Geothermal Energy. IntechOpen 2016. [Google Scholar] [CrossRef]
- Florides, G.; Kalogirou, S. Ground heat exchangers—A review of systems, models and applications, Renew. Energy 2007, 32, 2461–2478. [Google Scholar] [CrossRef]
- Larwa, B. Heat transfer model to predict temperature distribution in the ground. Energies 2019, 12. [Google Scholar] [CrossRef]
- Badache, M.; Eslami-Nejad, P.; Ouzzane, M.; Aidoun, Z.; Lamarche, L. A new modelling approach for improved ground temperature profile determination. J. Renew. Energy 2016, 85, 436–444. [Google Scholar] [CrossRef]
- Pokorska-Silva, I.; Kadela, M.; Fedorowicz, L. Variations of Ground Temperature in Shallow Depths in the Silesian Region. IOP Conf. Series: Materials Science and Engineering 2019, 603, 052024. [Google Scholar] [CrossRef]
- Popiel, C. O.; Wojtkowiak, J.; Biernacka, B. Measurements of temperature distribution in ground. Experimental Thermal and Fluid Science 2001, 25, 301–309. [Google Scholar] [CrossRef]
- Dolcek, A. O.; Tinjum, J. M.; Hart, D. J. Numerical Modeling of Ground Temperature Response in a Ground-Source Heat Pump System (GSHP). Geo-Congress 2014 Technical Papers. [CrossRef]
- Beier, R. A.; Smith, M. D.; Spitler, J. D. Reference data sets for vertical borehole ground heat exchanger models and thermal response test analysis. Geothermics 2011, 40, 79–85. [Google Scholar] [CrossRef]
- Qian, H.; Wang, Y. Modeling the interactions between the performance of ground source heat pumps and soil temperature variations. Energy for Sustainable Development 2014, 23, 115–121. [Google Scholar] [CrossRef]
- Zhao, Z.; Shen, R.; Feng, W.; Zhang, Y.; Zhang, Y. Soil thermal balance analysis for a ground source heat pump system in a hot-summer and cold-winter region. Energies 2018, 11. [Google Scholar] [CrossRef]
- Lv, S. , Zeng, Y., Wen, J., Zhao, H., Su, Z. Estimation of Penetration Depth from Soil Effective Temperature in Microwave Radiometry. Remote Sens 2018, 10, 519. [Google Scholar] [CrossRef]
- Naicker, S. S.; Rees, S. J. Performance analysis of a large geothermal heating and cooling system. Renewable Energy 2018, 122, 429–442. [Google Scholar] [CrossRef]
- Tinti, F.; Carri, A.; Kasmaee, S.; Valletta, A.; Segalini, A.; Bonduà, S.; Bortolotti, V. Ground temperature monitoring for a coaxial geothermal heat exchangers field: Practical aspects and main issues from the first year of measurements. Rudarsko-Geološko-Naftni Zbornik 2018, 33, 47–57. [Google Scholar] [CrossRef]
- Vienken, T.; Kreck, M.; Dietrich, P. Monitoring the impact of intensive shallow geothermal energy use on groundwater temperatures in a residential neighbourhood. Geotherm Energy 2019, 7, 1–14. [Google Scholar] [CrossRef]
- Kim, S.-K.; Lee, Y. Evaluation of ground temperature changes by the operation of the geothermal heat pump system and climate change in Korea. Water 2020, 12, 2931. [Google Scholar] [CrossRef]
- Figueiredo, A.; Lapa, J.; Cardoso, C.; Macedo, J.; Rodrigues, F.; Vieira, A.; Pinto, A.; Maranha, J.R. Shallow geothermal systems for Aveiro University departments: A survey through the energy efficiency and thermal comfort. 17th European Conference on Soil Mechanics and Geotechnical Engineering, ECSMGE 2019 Proceedings, Reykjavik, Iceland, 1 -. 6 September 2019. [Google Scholar]
- Dias, J.M.; Lopes, J.F.; Dekeyser, I. Tidal Propagation in Ria de Aveiro Lagoon, Portugal. Physics and Chemistry of the Earth, Part B: Hydrology, Oceans and Atmosphere 2000, 25, 369–374. [Google Scholar] [CrossRef]
- Néri, C. S. G. Study of Mechanical Behaviour of soils under the influence of Geothermal Systems. Master degree thesis, Aveiro University, Aveiro, Portugal, (in Portuguese), 2016.
- TPSYS02 Thermal Conductivity Measurement System. 2003. Hukseflux Thermal Sensors. Available at: http://www.hukseflux.com.
- Farouki, O. Evaluation of methods for calculating soil thermal conductivity. US Army Corps of Engineers, Cold Regions Research & Engineering Laboratory 1982, 82, 8. [Google Scholar]
- Aljundi, K.; Vieira, A.; Maranha, J.; Lapa, J.; Cardoso, R. Effects of Temperature, Test Duration and Heat Flux in Thermal Conductivity Measurements under Transient Conditions in Dry and Fully Saturated States. E3S Web of Conferences 2020, 195, 04007. [Google Scholar] [CrossRef]
- Luo, J.; Rohn, J.; Xiang, W.; Bertermann, D.; Blum, P. A review of ground investigations for ground source heat pump (GSHP) systems. Energy Build 2016, 117, 160–175. [Google Scholar] [CrossRef]
- Michot, A.; Smith, D. S.; Degot, S.; Gault, C. Thermal conductivity, and specific heat of kaolinite: Evolution with thermal treatment. Journal of the European Ceramic Society 2008, 28, 2639–2644. [Google Scholar] [CrossRef]
- Thomas, H. R.; Rees, S. W. Measured and simulated heat transfer to foundation soils. Géotechnique 2009, 59, 365–375. [Google Scholar] [CrossRef]
- Kottek, M.; Grieser, J.; Beck, C.; Rudolf, B.; Rubel, F. World Map of the Köppen-Geiger climate classification updated. Meteorol. Zeitschrift. 2006, 15, 259–263. [Google Scholar] [CrossRef]
- The Portuguese Institute for Sea and Atmosphere, I. P. (IPMA, IP). Retrieved from https://www.ipma.pt/pt accessed on 16 of August of 2023.
- Kusuda, T. ; R. Achenbach, P. Earth Temperature and Thermal Diffusivity at Selected Stations in the United States. In National Bureaau of Standards Report, 1965.
- Cui, W.; Liao, Q.; Chang, G.; Chen, G.; Peng, Q.; Jen, T. C. Measurement and prediction of undisturbed underground temperature distribution. ASME 2011 International Mechanical Engineering Congress and Exposition. IMECE 2011, 4, 671–676. [Google Scholar] [CrossRef]
- Alam, M. R.; Zain, M. F. M.; Kaish, A. B. M. A.; Jamil, M. Underground soil and thermal conductivity materials-based heat reduction for energy-efficient building in tropical environment. Indoor Built Environ. 2015, 24, 185–200. [Google Scholar] [CrossRef]
- Al-Hinti, I.; Al-Muhtady, A.; Al-Kouz, W. Measurement and modelling of the ground temperature profile in Zarqa, Jordan for geothermal heat pump applications. J. Appl. Therm. Eng. 2017, 123, 131–137. [Google Scholar] [CrossRef]
Figure 1.
Ilustration of GSHP system components: Primary circuit (on the left) (adapted from Socaciu, 2012), Heat pump (in the middle) and secondary circuit (on the right).
Figure 1.
Ilustration of GSHP system components: Primary circuit (on the left) (adapted from Socaciu, 2012), Heat pump (in the middle) and secondary circuit (on the right).
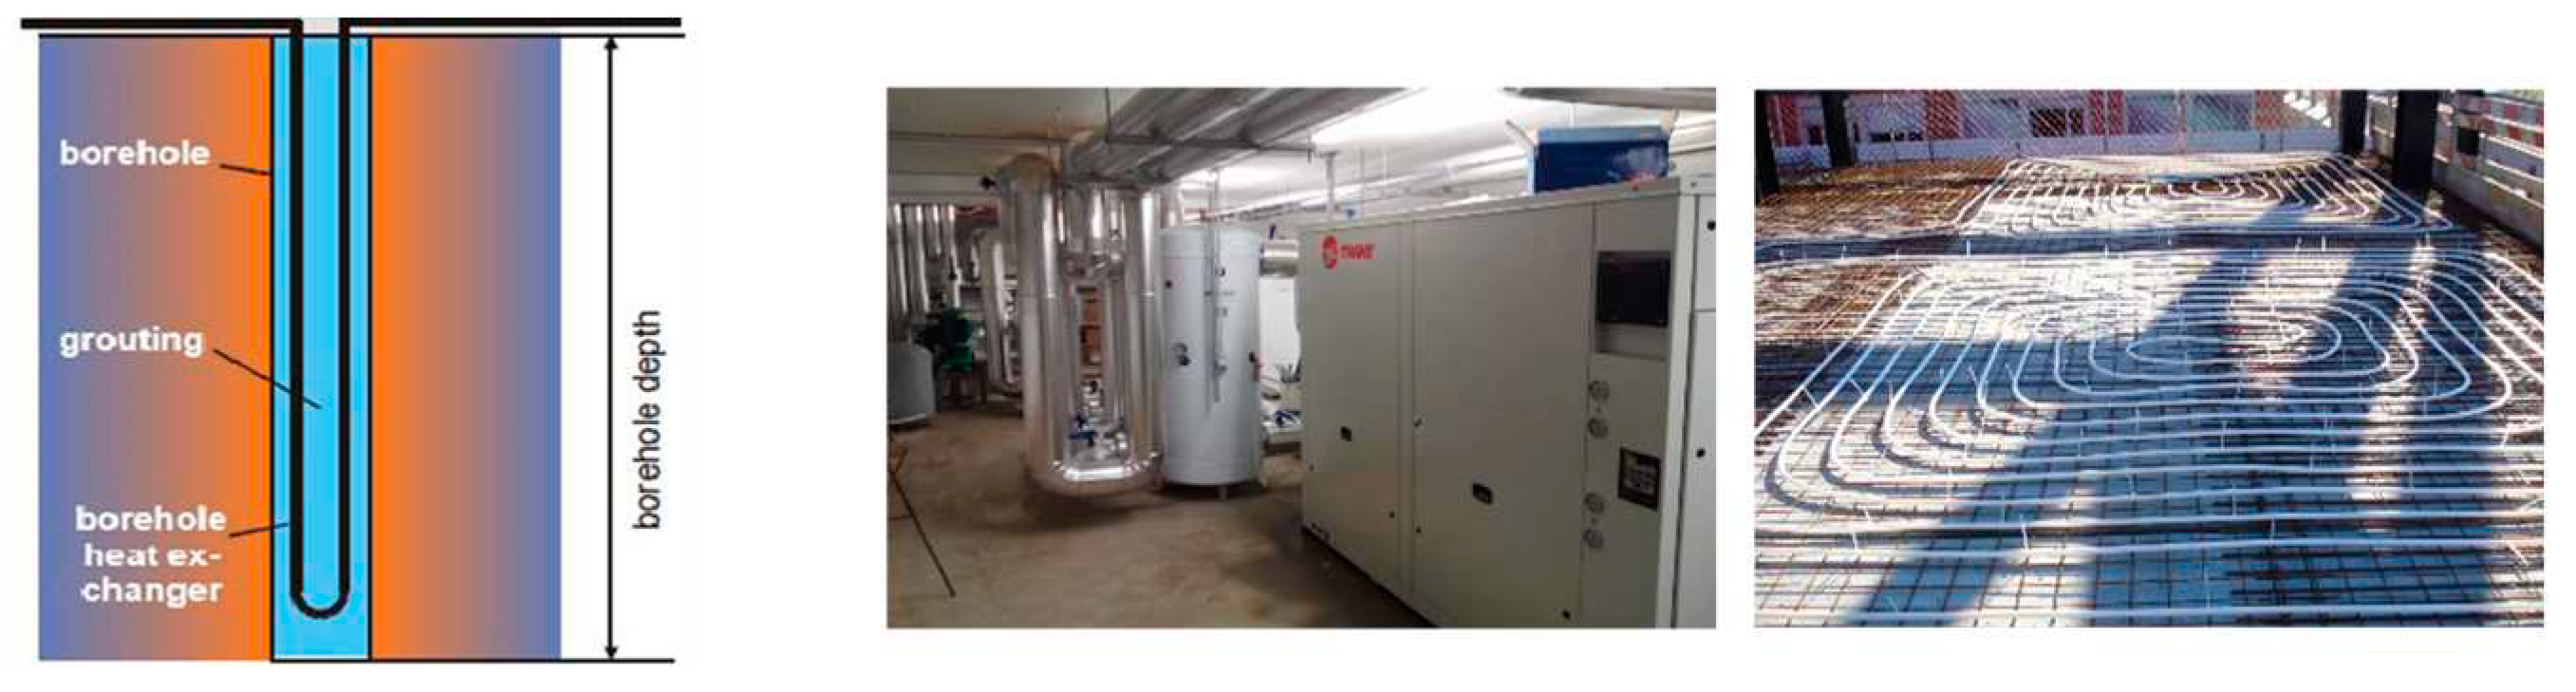
Figure 2.
A plan of the investigation and the thermos-active boreholes.
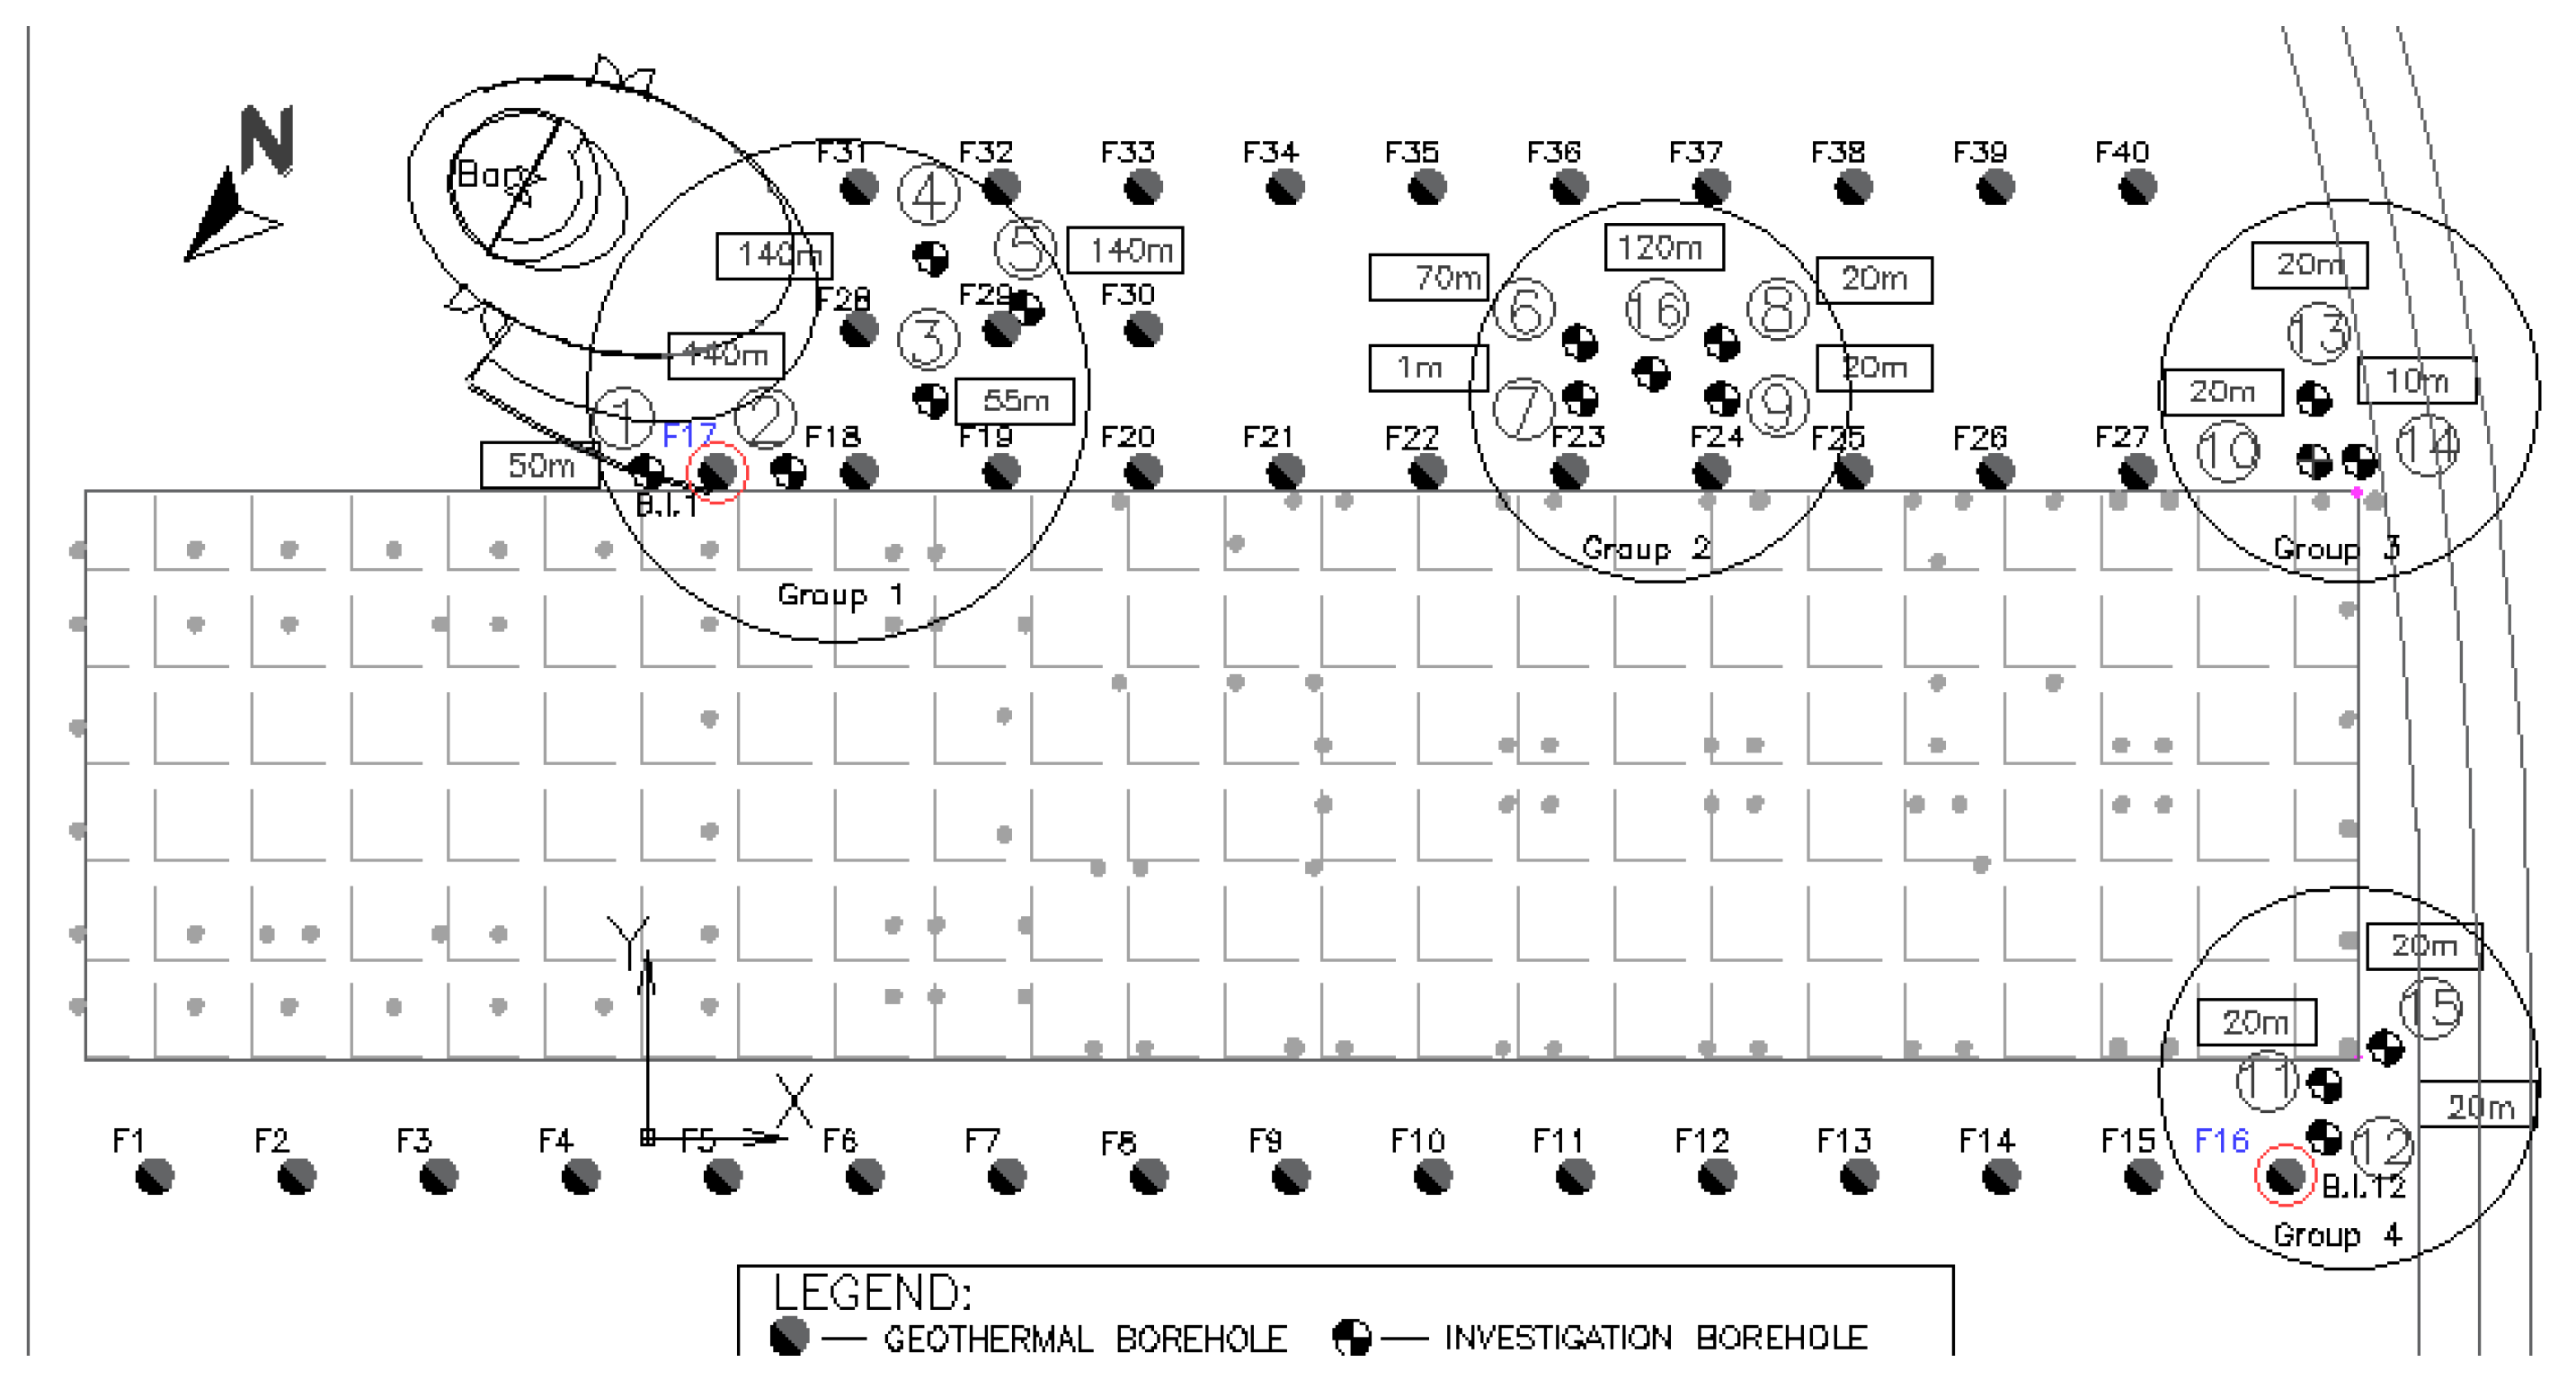
Figure 3.
Portugal mainland: Aveiro region highlighted, adapted from [33].
Figure 3.
Portugal mainland: Aveiro region highlighted, adapted from [33].
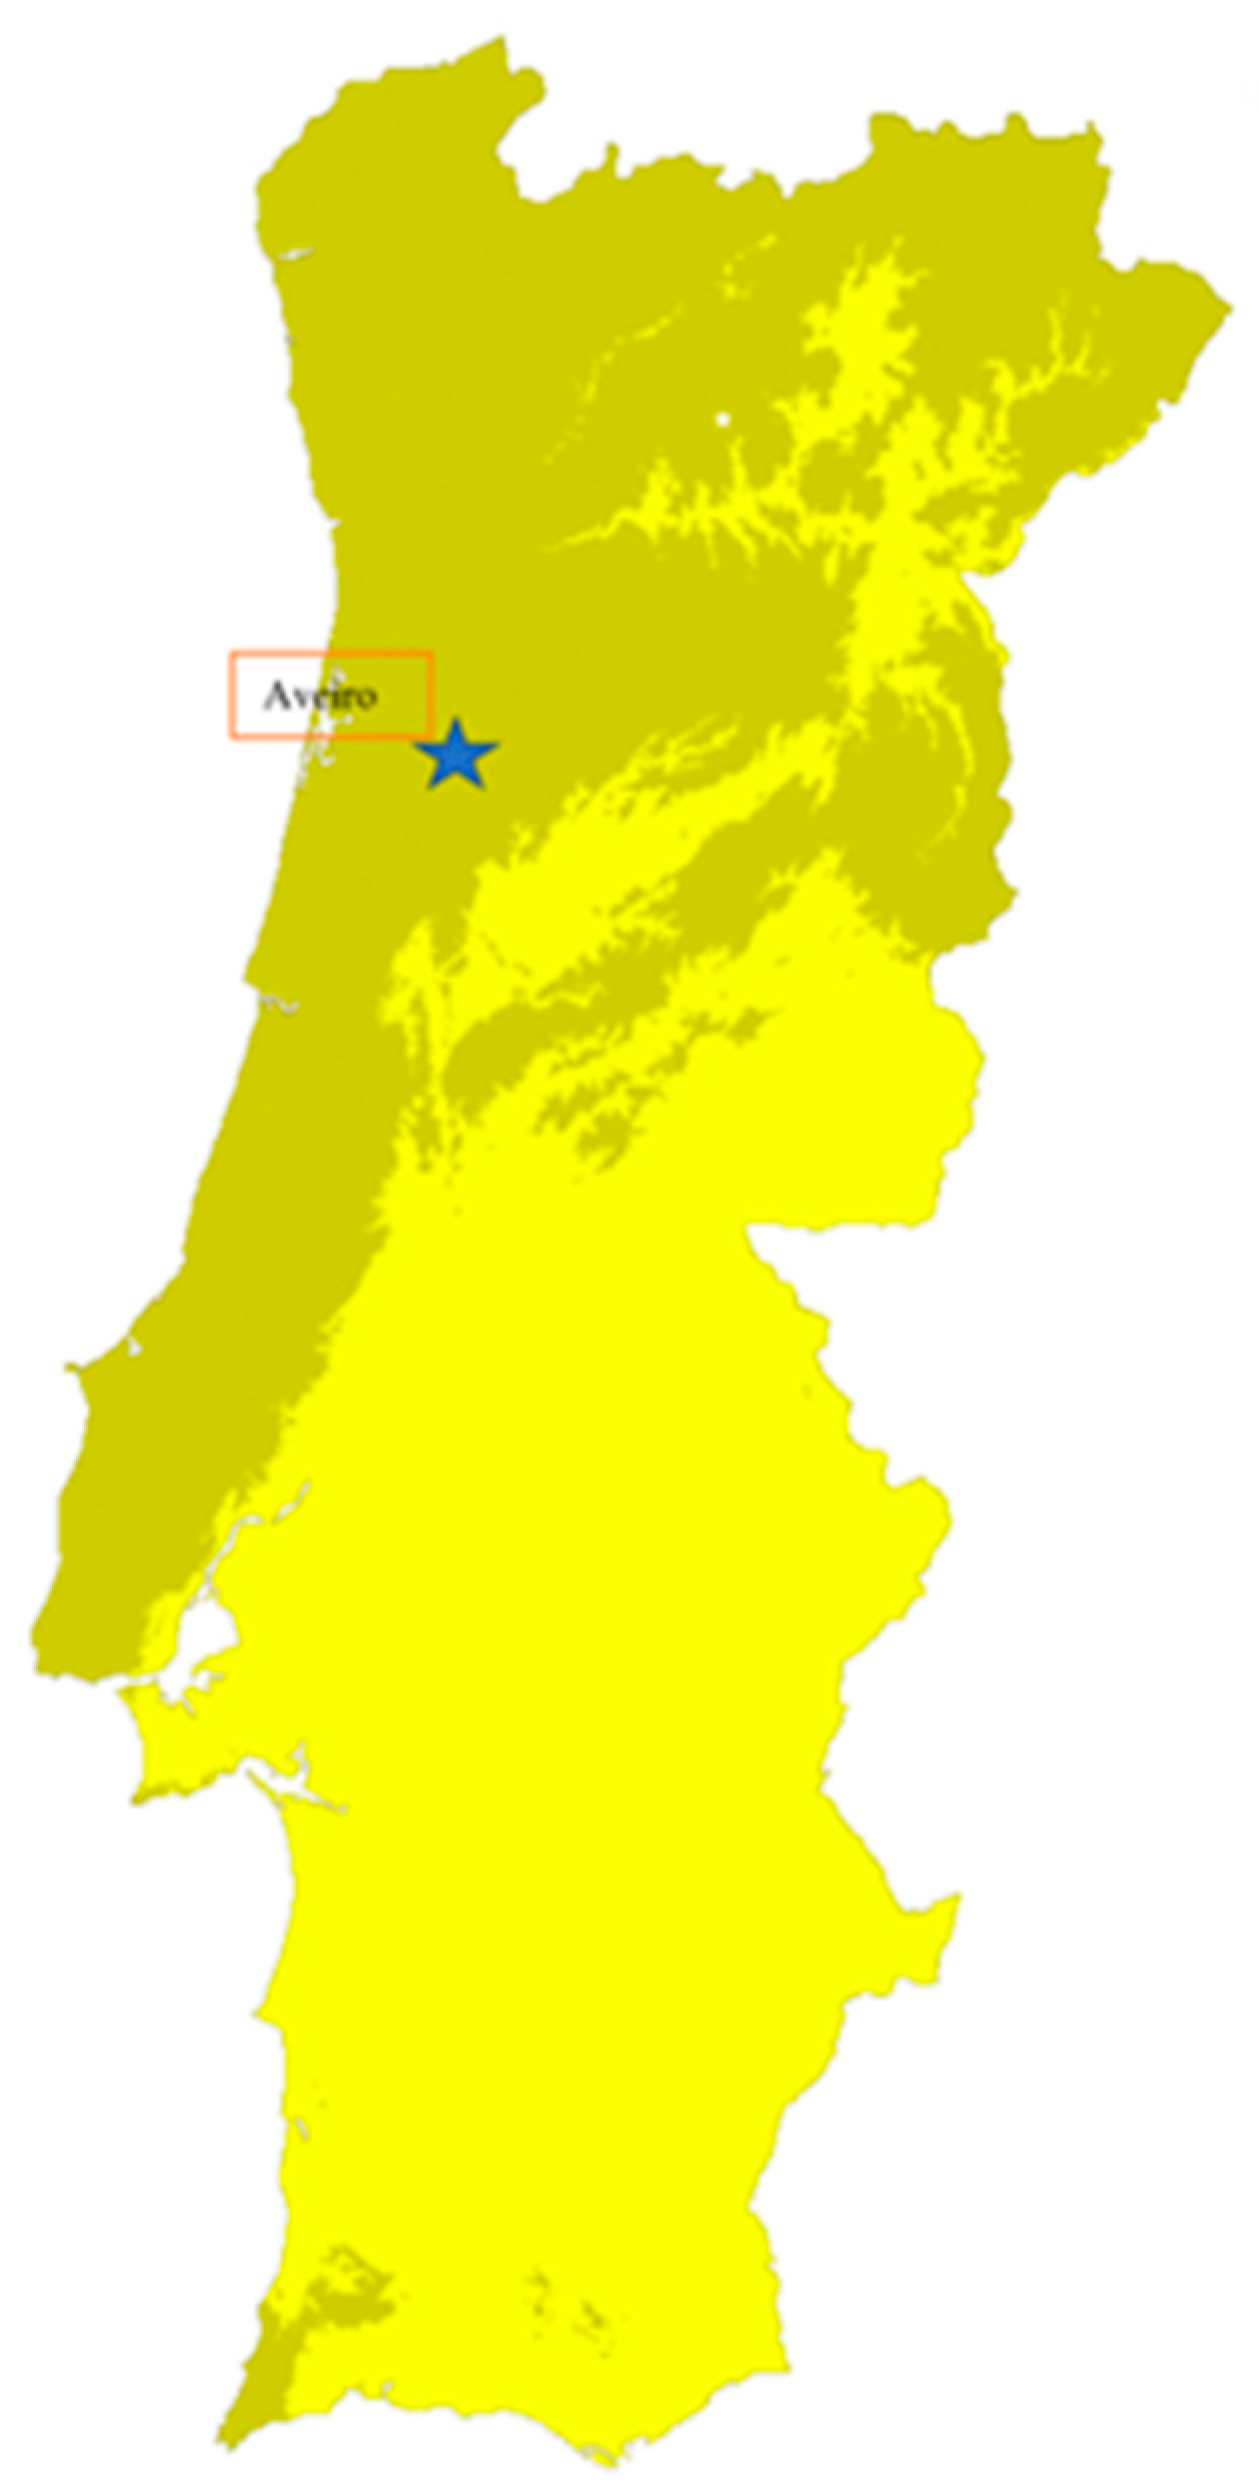
Figure 4.
Aveiro weather characterization: temperature, radiation, and relative humidity.
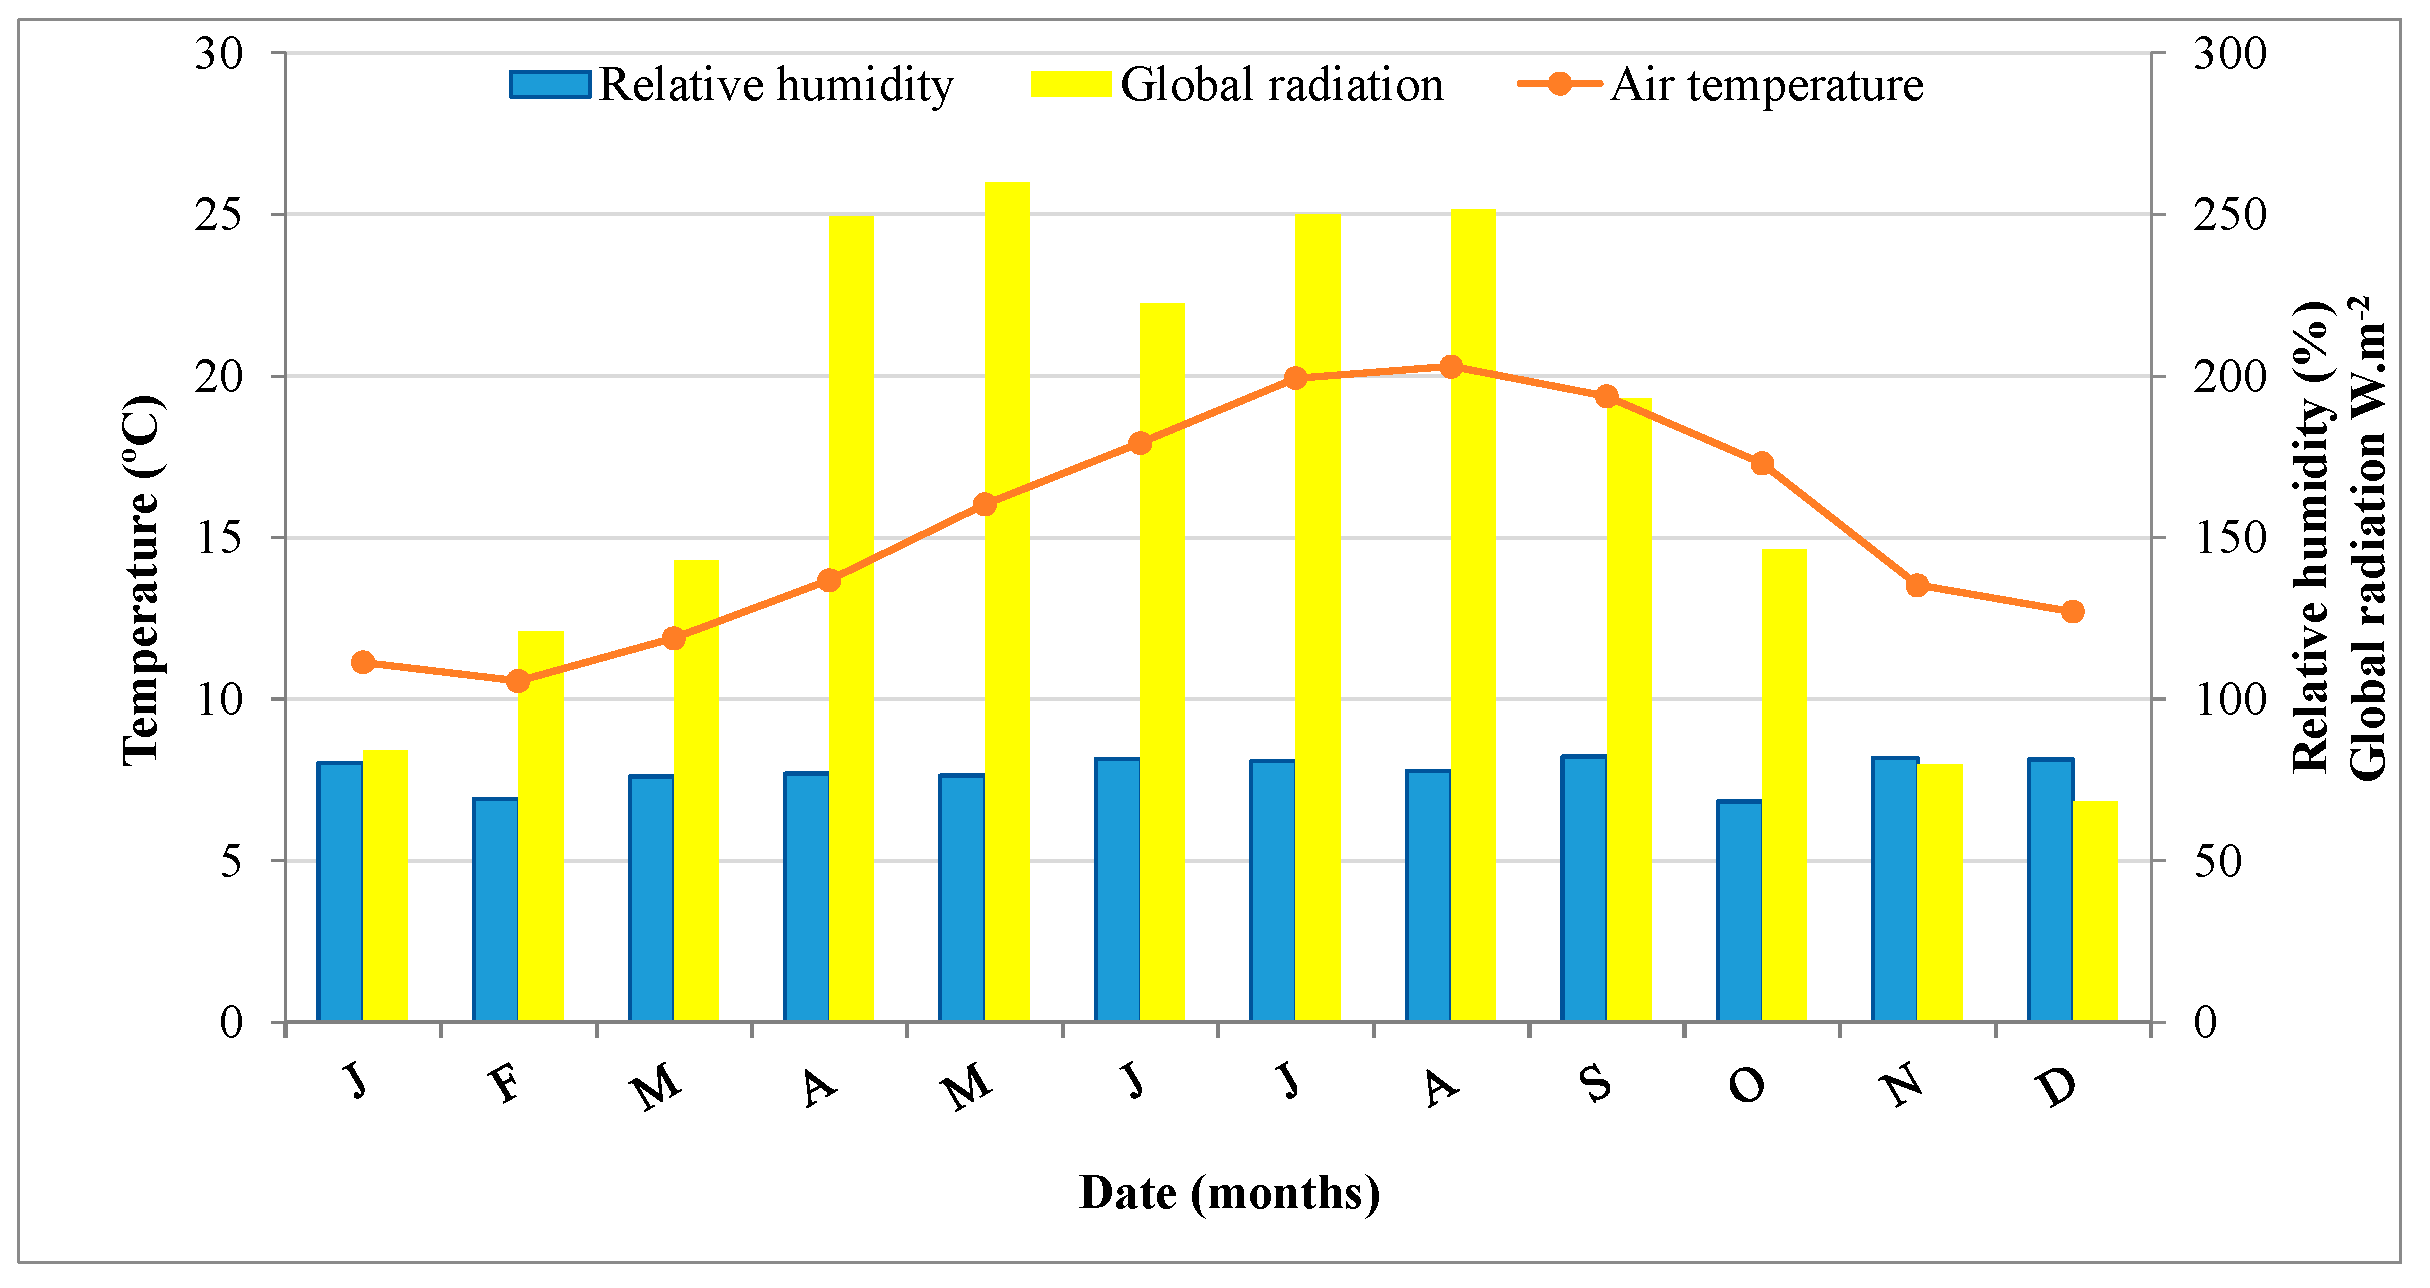
Figure 5.
Investigation boreholes assembled in four groups.
Figure 6.
Installation of the temperature probes for the monitoring system.
Figure 7.
Air and ground B.I.1 (left) and B.I.12 (right) at different depths temperature evolution during the monitoring period.
Figure 7.
Air and ground B.I.1 (left) and B.I.12 (right) at different depths temperature evolution during the monitoring period.
Figure 8.
Monthly average ground temperature in B.I.1 and B.I.12 for the monitoring period.
Figure 9.
Extreme ground temperature monitored in all boreholes with average temperature of each group.
Figure 9.
Extreme ground temperature monitored in all boreholes with average temperature of each group.
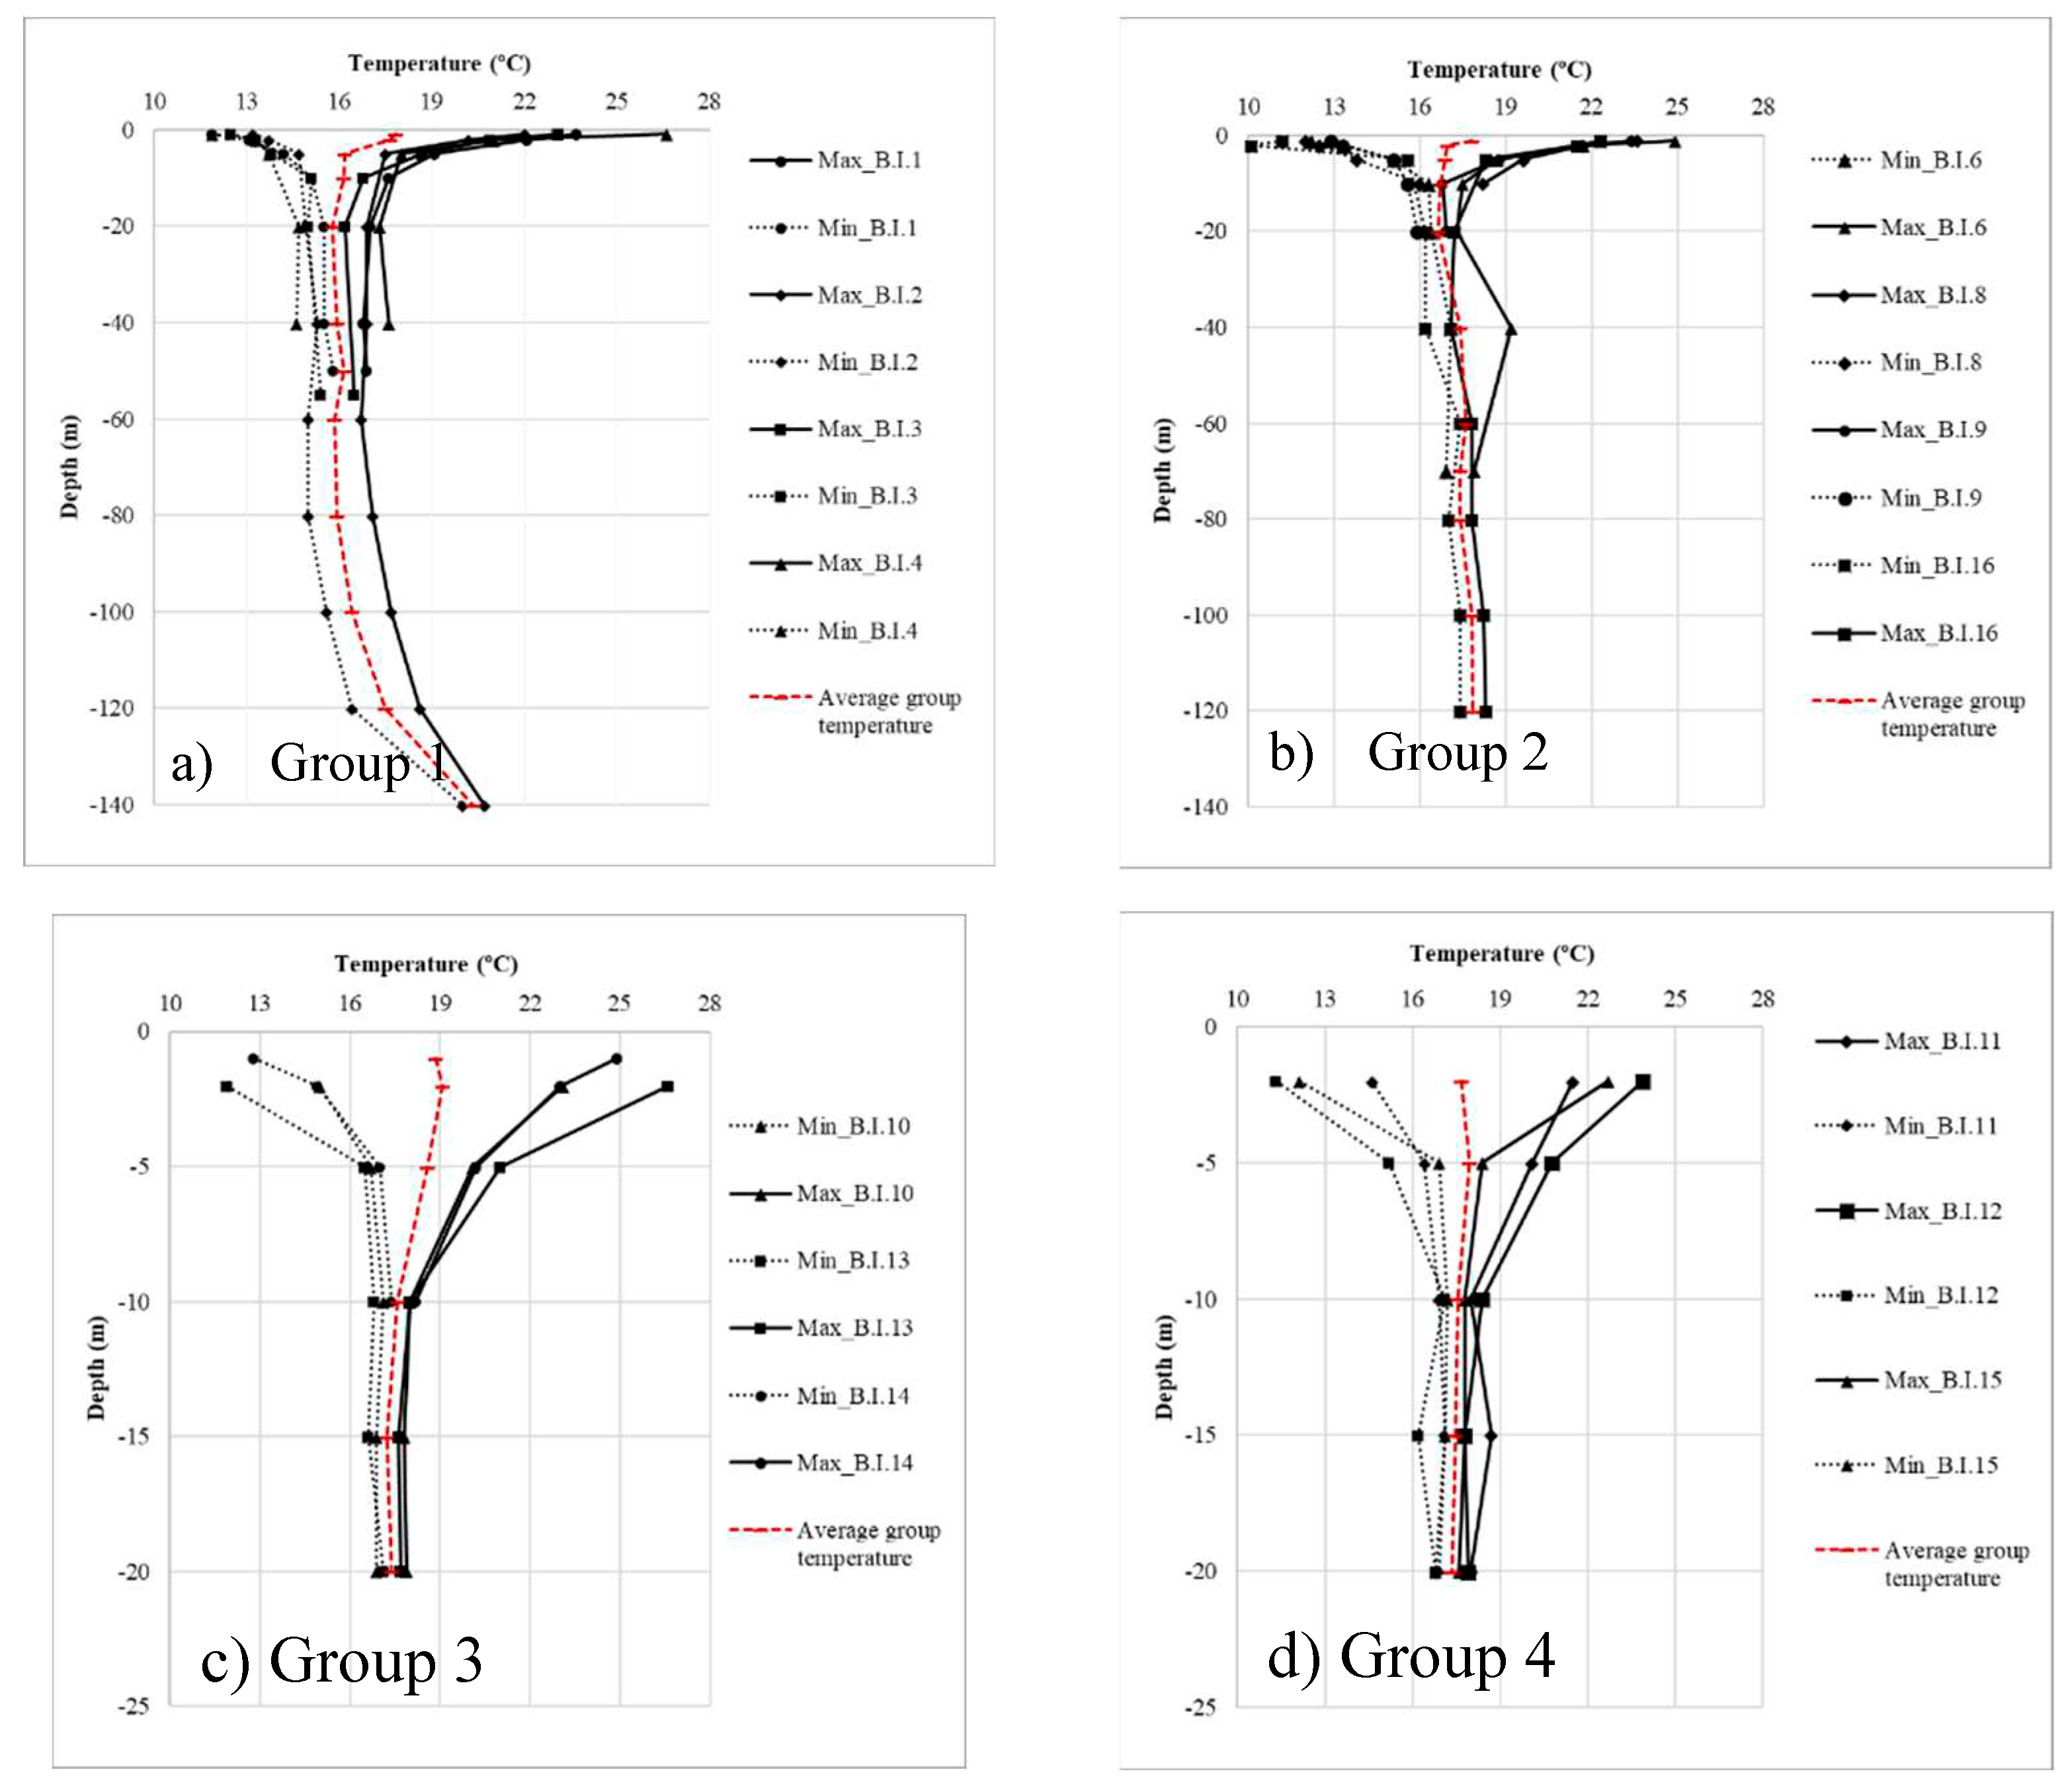
Figure 10.
Temperature profiles obtained by numerical simulation compared to extreme profiles of groups 1 and 4 of investigation boreholes.
Figure 10.
Temperature profiles obtained by numerical simulation compared to extreme profiles of groups 1 and 4 of investigation boreholes.
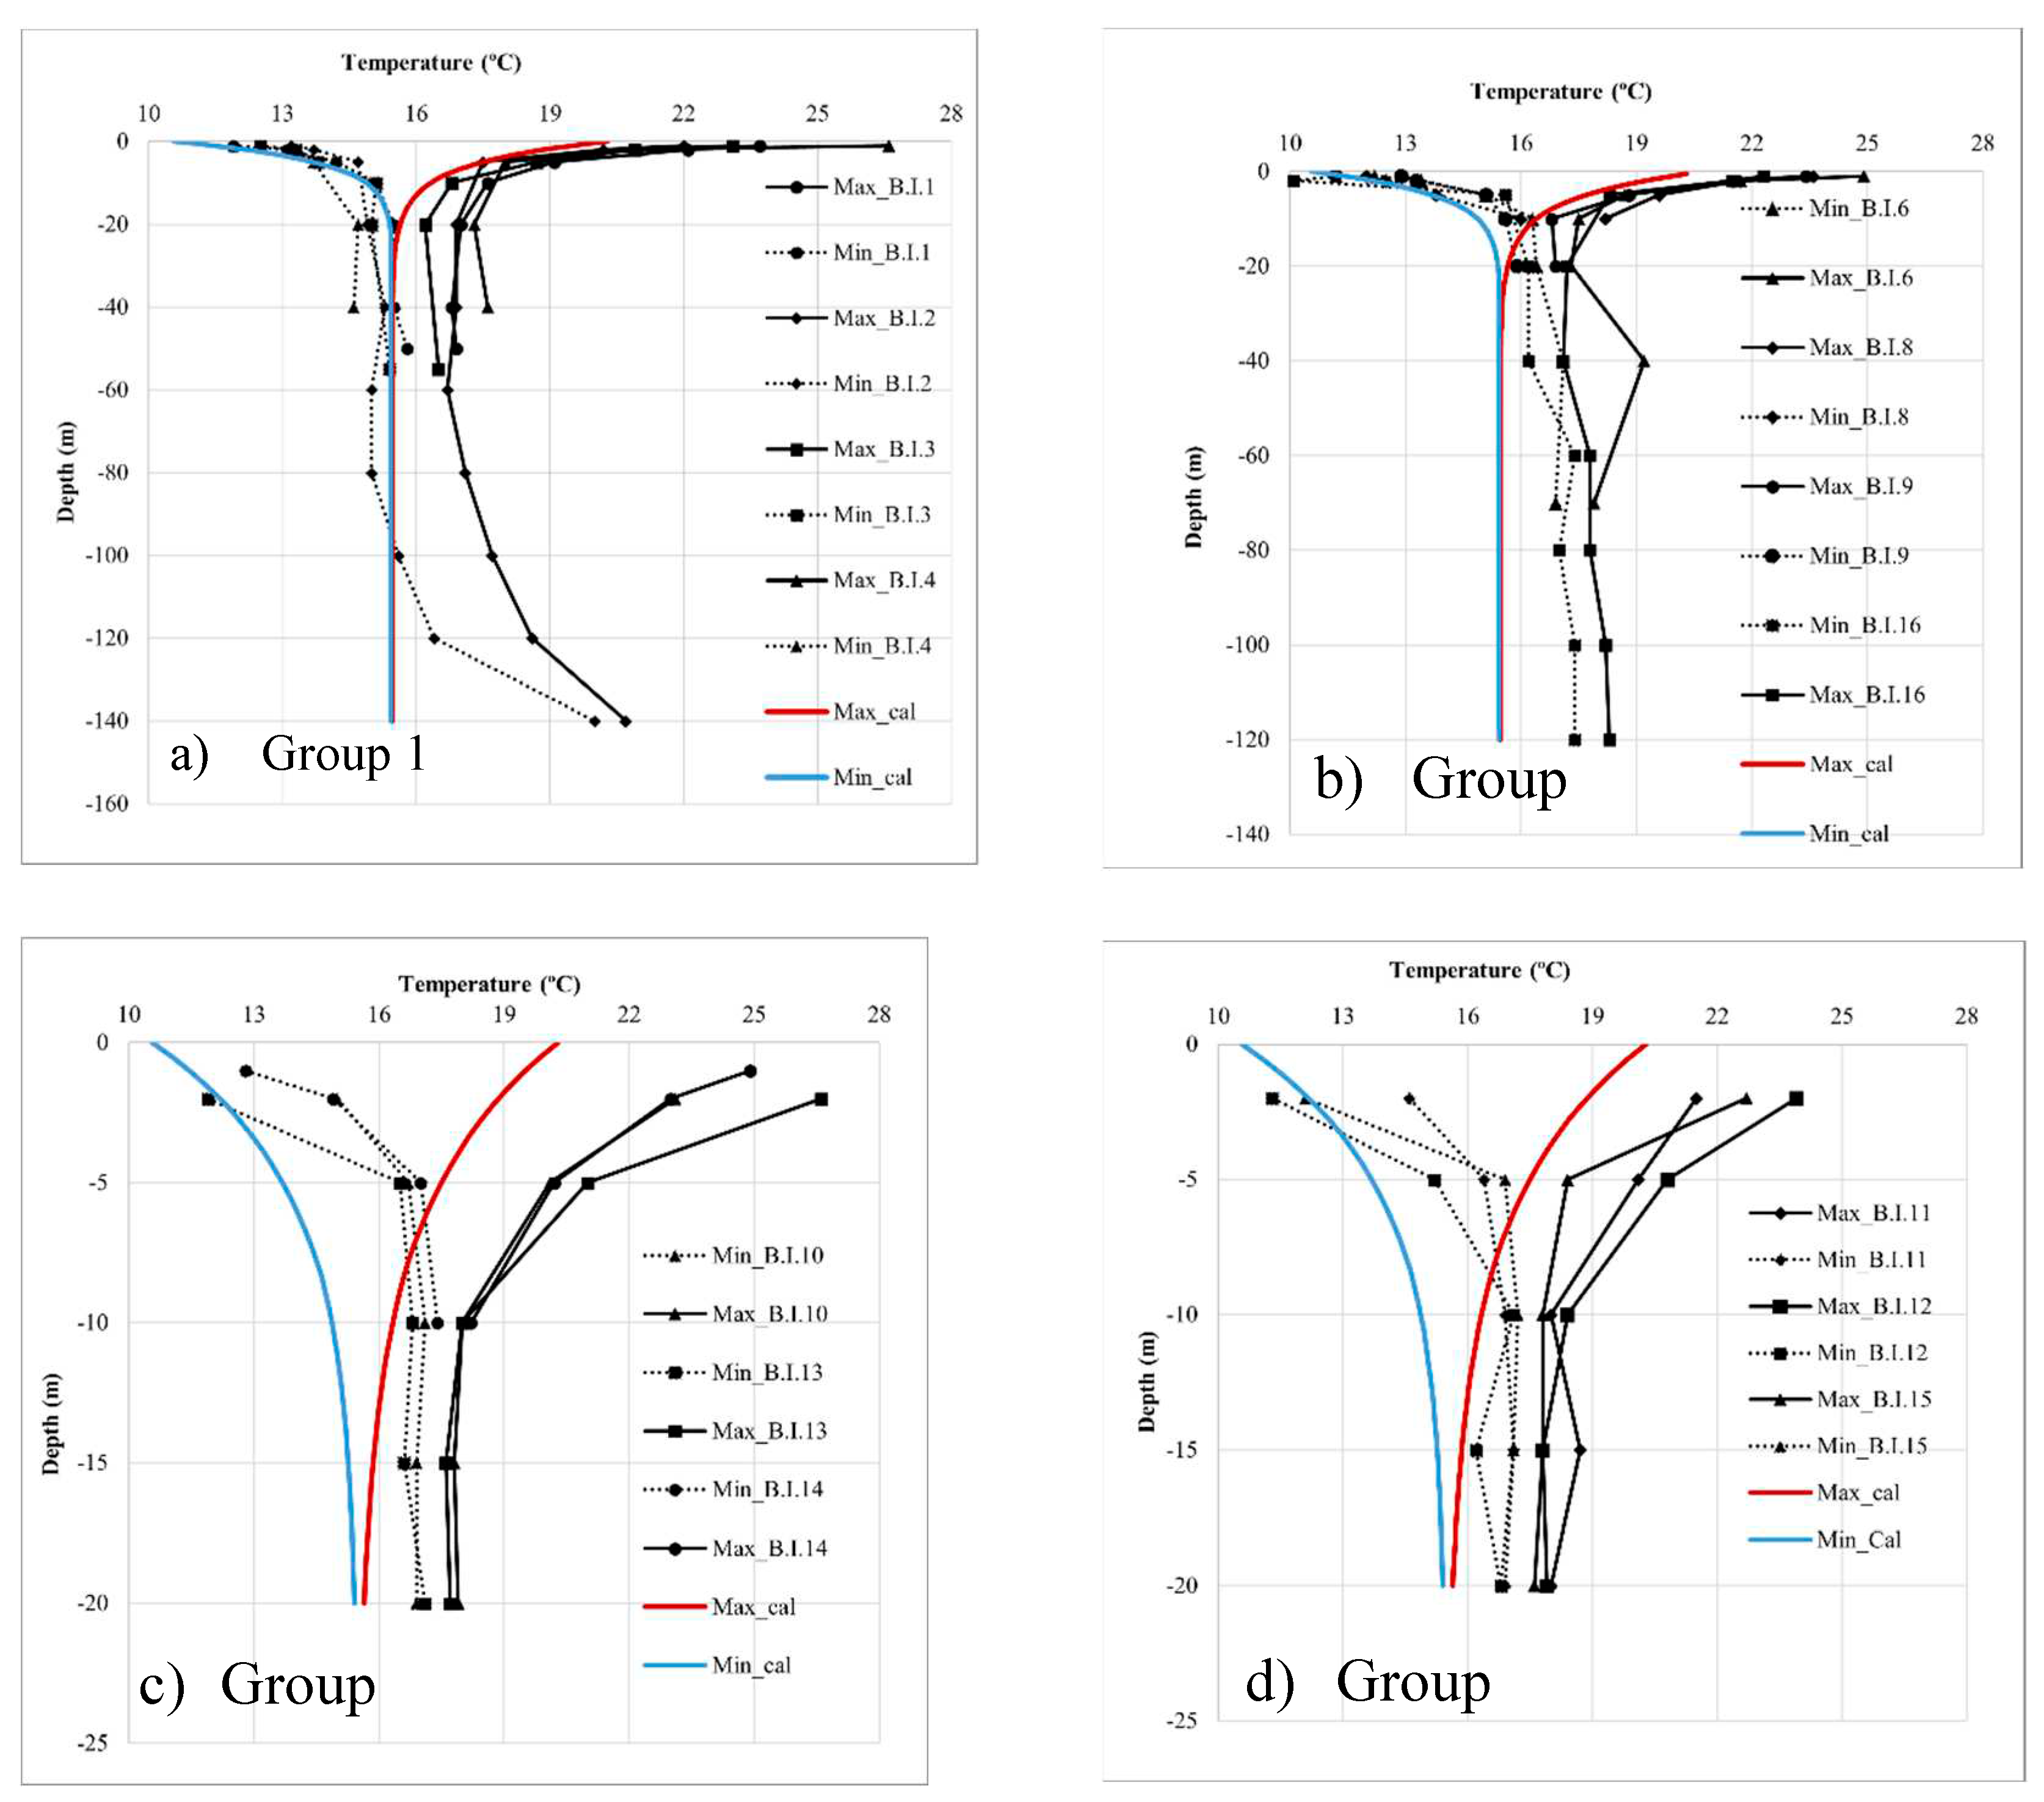

Table 1.
Experimental and reference values of thermal conductivity of superficial soil in UA campus.
Table 1.
Experimental and reference values of thermal conductivity of superficial soil in UA campus.
| λ (W.m−1.K−1) | |||||
|---|---|---|---|---|---|
| Dry soil | Saturateda and unsaturatedb | ||||
| Soil type | Depth (m) | Experimental value | Reference value | Experimental value | Reference value |
| Clay and sandy clay | 0 - 6 | [0.21, 0.39] | 0.35 | [1.13, 2.40]a Sr ≈ 35% |
[1.42, 2.70]b |
| Claystone | 6 - 10 | - | 0.15 | [1.88, 2.59]a Sr ≈ 70% |
[1.18-1.80]b |
| [up to 2.50]a | |||||
Table 2.
Thermal conductivity values estimated semi-empirically in geothermal borehole F16.
| Depth (m) | Gs | w% | n | Sr | λ (W.m-1.K-1) |
Soil type | Unified Soil Classification System |
|---|---|---|---|---|---|---|---|
| 0 – 6 | 2.62 | 13.74 | 0.42 | 0.5 | 1.93 | Fine | Clay and sandy clay (ML) |
| 6 – 18 | 2.63 | 18.38 | 0.32 | 1.0 | 2.60 | Fine | Claystone (CL) |
| 18 – 24 | 2.65 | 10.58 | 0.22 | 1.0 | 3.25 | Coarse | Clayey sand (SC) |
| 24 – 78 | 2.64 | 32.81 | 0.44 | 1.0 | 2.11 | Fine | Claystone (CL) |
| 78 – 84 | 2.64 | 24.57 | 0.39 | 1.0 | 2.24 | Coarse | Clayey sand (SC) |
| 84 – 90 | 2.62 | 31.44 | 0.45 | 1.0 | 1.98 | Fine | Clay and sandy clay (ML) |
| 90 – 132 | 2.63 | 23.84 | 0.38 | 1.0 | 2.28 | Coarse | Clayey sand (SC) |
Table 3.
Thermal conductivity values estimated semi-empirically in geothermal borehole F17.
| Depth (m) | Gs | w% | n | Sr |
λ (W.m-1.K-1) |
Soil type | Unified Soil Classification System |
|---|---|---|---|---|---|---|---|
| 0 – 6 | 2.64 | 9.30 | 0.20 | 0.5 | 2.49 | Coarse | Clay and sandy clay (ML) |
| 6 – 18 | 2.59 | 18.90 | 0.33 | 1.0 | 2.57 | Fine | Claystone (CL) |
| 18 – 24 | 2.58 | 17.20 | 0.31 | 1.0 | 2.69 | Coarse | Clayey sand (SC) |
| 24 – 78 | 2.57 | 39.57 | 0.50 | 1.0 | 1.81 | Fine | Claystone (CL) |
| 78 – 84 | 2.56 | 21.90 | 0.36 | 1.0 | 2.40 | Coarse | Clayey sand (SC) |
| 84 – 90 | 2.58 | 21.70 | 0.36 | 1.0 | 2.41 | Coarse | Clay and sandy clay (ML) |
| 90 – 132 | 2.62 | 20.56 | 0.35 | 1.0 | 2.46 | Coarse | Clayey sand (SC) |
Table 4.
Investigation boreholes with the respective depth.
| Group 1 | Group 2 | Group 3 | Group 4 | ||||||||||||
|---|---|---|---|---|---|---|---|---|---|---|---|---|---|---|---|
| Number of investigation borehole | 1 | 2 | 3 | 4 | 5 | 6 | 8 | 9 | 16 | 10 | 13 | 14 | 11 | 12 | 15 |
| Depth (m) | 50 | 140 | 55 | 40 | 120 | 70 | 10 | 20 | 120 | 20 | 20 | 10 | 20 | 20 | 20 |
Table 5.
Diurnal and seasonal waves’ penetration depth.
| Source | Location | Soil type | λ (W.m-1.K-1) |
Penetration depth (m) |
Annual average air temperature (ºC) | |
|---|---|---|---|---|---|---|
| Diurnal | Annual | |||||
| [34] | Lemont, USA | * | 0.6 to 4.0 | 0.9 | 3.0 | 10.0 |
| [13] | Poznan, Poland | Sandy soil, loam and clay until 3 m Silty soil after 3 m depth |
1.8 | 1.0 | 8.0 | 9.4 |
| [35] | Chongqing, China | Sandstone and mudstone | 2.5 | 1.0 | 11.0 | 18.2 |
| [36] | Malaysia | Sandy soil | N.A. | 0.5 | 10.0 | 27.5 |
| [37] | Zarqa, Jordan | Fine-silty, mixed, calcareous | 1.2 | 1.0 | 5.0 | 21 |
| [18] | Jamshedpur, India | Sand and clay | N.A. | 0.4 | 4.0 | 28.7 |
| a | Aveiro, Portugal | 2.2 to 4.4 | 1.0 | 10.0 | 15.5 | |
Note: N.A. refers to Not Available data. *Soil type varied between sand, sandy clay, and silty clay.
Disclaimer/Publisher’s Note: The statements, opinions and data contained in all publications are solely those of the individual author(s) and contributor(s) and not of MDPI and/or the editor(s). MDPI and/or the editor(s) disclaim responsibility for any injury to people or property resulting from any ideas, methods, instructions or products referred to in the content. |
© 2023 by the authors. Licensee MDPI, Basel, Switzerland. This article is an open access article distributed under the terms and conditions of the Creative Commons Attribution (CC BY) license (http://creativecommons.org/licenses/by/4.0/).
Copyright: This open access article is published under a Creative Commons CC BY 4.0 license, which permit the free download, distribution, and reuse, provided that the author and preprint are cited in any reuse.


