
Submitted:
31 July 2023
Posted:
02 August 2023
You are already at the latest version
Abstract
The current study describes the preparation of chitosan nanoparticles (CNPs) using hydroxychloroquine (HCQ), widely used in traditional medicine due to its diverse phar-macological and medicinal uses. This work aims to combine the HCQ drug with CS NPs to generate a novel nanocomposite with improved characteristics and bioavailability. HCQ@CS NPs is roughly shaped like roadways and has a smooth surface with an average size of 159.3±7.1 nm, a PdI of 0.224±0.101, and a zeta potential of +46.6±0.8 mV. To aid in the development of pharmaceutical systems for use in cancer therapy, the binding mech-anism and affinity of the interaction between HCQ and HCQ@CS NPs and BSA were ex-amined using stopped-flow, other spectroscopic approaches, supplemented by molecular docking analysis. HCQ and HCQ@CS NPs binding with BSA is driven by a ground-state complex formation that may be accompanied by a non-radiative energy transfer process, and binding constants indicated that HCQ@CS NPs-BSA was more stable than HCQ-BSA. The stopped-flow analysis demonstrated that, in addition to increasing BSA affinity, the nano formulation HCQ@CS NPS changes the binding process and may open up new routes for interaction. Docking experiments verified the development of the HCQ-BSA complex, with HCQ binding to the site I on the BSA structure, primarily with the amino acids Thr 578, Gln 579, Gln 525, Tyr 400, and Asn 404. Furthermore, the nano-formulation HCQ@CS NPS not only increased cytotoxicity against the A549 lung cancer cell line (IC50 = 28.57±1.72 g/ml) compared to HCQ (102.21±0.67) g/ml), but also exhibited higher anti-bacterial activity against both Gram-positive and Gram-negative bacteria when compared to HCQ and chloramphenicol which in agreement with the binding constants. The nano formulation developed in this study may offer a viable therapy option for A549 lung cancer.
Keywords:
A549 lung cancer
; nanoparticles
; cell-penetration
; drug affinity
; dissociation constants
; molecular docking
; antibacterial
; hydroxychloroquine
1. Introduction
Lung carcinoma, another name for lung cancer, is a cancerous tumor that starts in the lung. The DNA of cells in the airways is genetically damaged, which results in lung cancer. Tumors damage lung function when they spread across the lung without therapy. Lung tumors eventually develop metastases and disperse throughout the body. Lung cancer was the most prevalent and lethal cancer in the world in 2020, with 2.2 million diagnoses and 1.8 million deaths [1, 2]. Despite this, there are almost 2,250 active clinical trials filed as of 2021 for investigational lung cancer treatments [3, 4]. Current treatment techniques are heavily influenced by the kind of cancer and its stage at the time of diagnosis, although they frequently include a combination of surgery, chemotherapy, and/or radiation therapy. Internalization of the medicine is an essential stage in chemotherapy; however, carrier molecules can help with this [5].
Recently, research has concentrated on the development of nanoscale-based drug delivery systems that control the release of chemotherapeutic drugs directly to cancer cells. These nanoparticles are likely to change the way cancer is diagnosed and treated [6]. Polymeric nanoparticle research is gaining attraction due to the possibility of applications in cancer therapy [7]. Because of their small size and larger specific area, nanoparticles absorb more drugs than larger drug carriers [8]. Chitosan is one of the most prevalent polysaccharides and polymers that have been discovered to have a variety of biological functions, including bio adhesion, physicochemical properties, and permeability-enhancing capabilities, making it a unique material for the development of drug delivery systems [9]. Because of its intrinsic properties, such as biodegradability, biocompatibility, non-toxicity, non-immunogenicity, non-carcinogenicity, and antibacterial activity, chitosan is a top choice for a drug delivery vehicle [10]. A number of publications [5] have already proven the anticancer activity of chitosan nanoparticles (CS NPs) loaded with alkaloid medications against lung cancerA549 cells. Over the last ten years, combining chemotherapy and biological therapy has resulted in significant gains in cancer patient survival [11]. Unfortunately, many tumors respond to chemotherapy but eventually, acquire resistance [12]. Furthermore, the current generation of chemotherapeutic drugs frequently has negative side effects [13]. Finding novel, efficient, and non-toxic molecules from natural resources is more crucial than ever [14], as alternative cancer treatments that are safe, affordable, and accessible are urgently needed [15,16].
Hydroxychloroquine (HCQ) is an antimalarial drug that has been used to treat disorders other than malaria since 1894, when Payne reported that quinine was effective in cutaneous lupus [17]. Since then, antimalarial medicines have been found to have therapeutic effects in a variety of different disorders, and evidence for their potential value has grown [18]. It has also been used off-label as a potential therapy for COVID-19, a new coronavirus [19]. Preclinical studies suggest the use of HCQ in anti-cancer therapy, particularly in combination with traditional anti-cancer treatments since they can sensitize tumor cells to a variety of medicines, hence increasing therapeutic action. Surprisingly, HCQ has impacts on both cancer cells and the tumor microenvironment. HCQ inhibits the autophagy flux, which is the best researched anti-cancer action, as well as the Toll-like receptor 9, p53, and CXCR4-CXCL12 pathways in cancer cells. Additional clinical research suggested that HCQ merit additional clinical research in a variety of cancer types [20,21,22,23,24,25,26,27,28]. Vyas et al. have shown that HCQ has an inhibitory effect on cellular autophagy and is a lysosomal inhibitor. Its mechanism of action is to affect the degradation of auto-phagosomes in the later stages of autophagy by inhibiting the fusion of auto-phagosomes with lysosomes, resulting in the accumulation of auto-phagosomes, and therefore has potential application in synergy with chemotherapeutic drugs [29,30,31,32].
For HCQ, the choice of biomaterial affects the delivery system's biocompatibility, different physicochemical characteristics, and capacity to release precisely within the cell. As a result, we synthesized HCQ@CS NPs for this investigation, where the chemotherapeutic drug HCQ was enclosed in the smaller nanoparticle CS NPs. The combination of HCQ and CS NPs is expected to result in a new nanocomposite with improved properties and biological results. We described their chemical and physical characteristics (such as particle size, zeta potential, scanning electron microscopy, Fourier transform infrared spectroscopy) and their anticancer efficacy against the A549 lung cancer cell line was evaluated. Cancer patients are frequently given a multi-drug cocktail of antibacterial agents in addition to chemotherapeutic agents to prevent or eradicate various infections because chemotherapy actually makes cancer patients immunocompromised and susceptible to infections [33]. For this reason, the antibacterial properties of HCQ@CS NPs and HCQ were also tested in vitro against four bacteria strains (E. coli, P. aeruginosa, S. aureus, and E. faecalis), using the DTM technique. Using steady-state fluorescence and UV-Vis spectroscopy, the properties of BSA binding to HCQ and HCQ@CS NPs were explored, and the binding constants were determined to identify their binding constants, the driving force of the binding process, and to assess their medicinal activities. We used a stopped-flow technique for carrying out a kinetic investigation of the binding process because it is thought that DNA/protein-drug interaction is a fast step. This method aids in identifying the kinetic characteristics of the phases leading to intermediate species and ultimately obtaining an interaction mechanism [34,35,36,37,38,39], The geometrically optimized parameters (bond lengths, bond angles, and dihedral angles) were computed using DFT/B3LYP theory on the chitosan moiety and HCQ. Docking simulation will be used in order to confirm the spectroscopic results of the binding of HCQ to BSA structure and the formation of HCQ-BSA complex.
2. Results
2.1. Synthesis and Characterization
By taking advantage of the electrostatic interactions between the positively charged amino groups in CS and the hydroxyl group of HCQ, smaller NPs loaded with HCQ were first made using the ionic gelation method. Then, using TPP as the emulsifier, the O/W emulsion method was used to incorporate HCQ into CS. This approach allows for the formation of larger NPs that are loaded with HCQ. Scanning electron microscopy (SEM) observation of HCQ@CS NPs reveals that the HCQ-loaded CS nanoparticles is roughly shaped like roadways and has a smooth surface with a diameter of about 500 nm. The field of view of HCQ@CS NPs at 500 nm is depicted in Figure 1a.
Dynamic light scattering was used to determine the specific size distribution and potential of HCQ and HCQ@CS NPs. Mean particle size of HCQ@CS NPs (159.3 ± 7.1 nm) and HCQ (255.7 ± 18.45 nm) with polydispersity index (PDI) values of 0.224 ± 0.101 and 0.337 ± 0.083, respectively are shown in Table 1 and Figure 1b and are similar to those found under SEM, with appropriate dimensions and good dispersion. The size of the NPs was one of many factors that affected the EPR effect, with particles having a diameter of less than 200 nm being the most effective and a cut-off size of about 400 nm for tumor penetration [40]. The Zeta potential of HCQ@CS NPs was +46.6 ± 0.8 mV and that of HCQ is -16.4 mV (Table 1 and Figure 1c). Higher anticancer activity resulted from better tumor cell absorption of the negatively charged nano drugs and their potential to escape from lysosomes after cell entry [41].
FT-IR spectroscopy was used to chemically characterize HCQ@CS NPs, and Figure 1d depicts possible interactions. The characteristic peaks in the IR spectra of CS can be seen at wavelengths of 1150 cm for C-O-C stretching, 1465 cm for C-H stretching, 3514 cm for O-H stretching, and 1596 cm for N-H stretching. The HCQ data also demonstrate distinctive N-H peaks at 3381 cm and 3100 cm, as well as three additional peaks at 1615 cm, 1551 cm, and 1470 cm that point to the presence of an aromatic ring structure. Some of the absorption peaks lose strength or vanish entirely after the fabrication of HCQ@CS NPs, and the wave number changes. For instance, the stretching vibration shift of -OH and -NH2 at 3434 cm to 3381 cm and the stretching shift of the amide group at 1657 cm to 1615 cm are seen in the IR spectra of the final NPs. These alterations imply that the synthesis of HCQ@CS NPs is a chemical reaction between HCQ and CS NPs rather than a physical combination, indicating that the HCQ pharmaceuticals are successfully contained in the finished NPs.
2.2. Computational Finding
All theoretical calculations were performed with Gaussian 09 W package [42] using density function theory (DFT) [43,44]. The optimized structure of HCQ, monomer of chitosan (M) and dimer of chitosan (MM) were employed using Becke 3-Parameter, Lee, Yang and Parr (B3LYP) [45,46] with 6-31G(d) basis set. All calculations were perfectly optimized in the gas phase. Frequency calculations for each optimized geometry were done at the same theoretical level to verify that they are all minima or transition states on the system's potential energy surface. Figure 2 depicts the optimized geometries of the investigated of HCQ, M and MM. The bond lengths on HCQ; C1-N1, C14-N2, C3-N3, H26-N3, C4-C5, C6-Cl1, C17-O1 and O1-H22 are 1.354, 1.474, 1.442, 1.022, 1.458, 1.781, 1.427 and 0.97Å, respectively when the bond angles on HCQ; C2-C3-C4, C4-C5-C8, C5-C6-C7, C17-O1-H22, C1-N1-C5 and C11-N2-C16 are 118°, 121°, 123°, 107°, 117° and 113°, respectively. The bond lengths on M; C4-C3, C5-O1, C4-O1, C2-O4, O4-H8, C3-N1, N1-H12 and C4-H4 are 1.58, 1.44, 1.37, 1.38, 0.97, 1.38, 1.01Å, respectively when the bond angles on M; C2-C1-C5, C1-C2-C3, C5-O1-C4, C2-O4-H8, C3-N1-H13 and H12-N1-H13 are 113°, 107°, 116.5°, 111.35°,119° and 118°, respectively. The bond lengths on MM; C4-O1, C5-O1, C7-O4, C11-O4, C1-O8, C11-O8, C5-C6, C10-C11, C4-H2 and C10-N2 are 1.4, 1.44, 1.44, 1.42, 1.44, 1.37, 1.53, 1.57, 1.09 and 1.42 Å, respectively when the bond angles on MM; C2-C1-C5, C5-O1-C4, C1-O8-C11, C2-O9-H24 and C3-N1-H8 are 112°, 116°, 121°, 106° and 117°, respectively. These optimization structures are in agreement with the results reported by Onoka et. al [46].
2.2.1. Quantum Chemical Parameters
The distribution of the Highest Occupied Molecular Orbital (HOMO), Lowest Unoccupied Molecular Orbital (LUMO), and Frontier Molecular Orbitals (FMO) in HCQ, M and MM were done using ChemCraft program [47]. The HOMO and LUMO explain information of the electronic transition of molecules and also indicate the electrophilic and nucleophilic attraction in compounds. Additionally, the chemical reactivity, stability, and hardness of the compounds are explained by the energy gap defined as the difference energy between HOMO and LUMO. A hard molecule is one with a large HOMO-LUMO gap, whereas a soft molecule, high reactivity, is one with the shorter HOMO-LUMO gap. While softness gauges chemical reactivity, hardness gauges molecule stability. From the data of HOMO and LUMO energies, the ionization potential (IP), electron affinity (EA), the energy gap (ΔE) = , absolute electronegativity (χ), electronic chemical potentials (Pi), absolute hardness (η), absolute softness (σ), global softness (S) and global electrophilicity (ω) which have been presented in Table 2. The global reactivity can be defined using Koopman’s theorem (Supporting information SI 1)
The data, depicted in Table 2 shows the following points association the compounds: (i) the energy gaps of M in comparison with MM reflects the high softness and biological activity ; (ii) In M and MM; χ is positive (+6.67 and +5.97, respectively) whereas Pi is negative values (-6.67and -5.97, respectively) indicated that the molecule is able to capture electrons from its environment and its energy must decrease when accepting the electron charge but in HCQ; χ is negative (-2.44) whereas Pi is positive (+2.44) that indicate the molecule is able to donate electrons to its environment and its energy must increase when donating the electron charge.
2.2.2. Frontier Molecular Orbitals and Chemical Reactivity
Frontier molecular orbitals (FMO) are used to understand several types of reaction, and for predicting the most reactive position in molecular orbital and their properties. The HOMO level is the highest energy orbital containing electrons which act as electron donor, while the LUMO is the lowest energy orbital which acts as electron acceptor. The calculated HOMO of HCQ is located on C1, C2, C3, C6, C7, C8, C9, C12, N1, N3 and Cl1, whereas the LUMO of HCQ is located on C16, C17, O1 and N2. The HOMO of M is located on C5, O1, O5, H9, whereas the LUMO is located on C2, C3, O2, O3, O4, N1 and H13. The HOMO level of MM is located on C7, C9, O3, O4, O5, O6, O7 and O8 whereas LUMO is located around all nitrogen atoms, all oxygen atoms except O3 and all carbon atom except C6 or over all skeleton except all atom of hydrogen, O3 and C6 (Figure 3).
Molecular electrostatic potential (MEP) is a very suitable tool for highlighting reactive sites towards electrophilic and nucleophilic attack and determines the relative polarity of molecules. The MEPs of HCQ, M and MM are presented in Figure 4. The red and yellow sites (negative regions) of MEP are related to electrophilic reactivity, while the blue and green sites (positive regions) are related to nucleophilic reactivity. Figure 3 reveals that the negative MEP regions of HCQ are concentrated on two rings (around aromatic site), thus confirm their electron donor ability (electrophilic reactivity) but the M and MM are appeared as blue and green (positive regions) thus confirm their electron acceptor (nucleophilic reactivity).
2.3. BSA Binding Studies
2.3.1. Fluorescence Studies
The most prevalent protein in mammal blood is BSA. Its main job is to deliver ions and medications to cells and tissues [48,49]. Due to its significant function, it is necessary to investigate the potential for biologically active compounds and BSA to interact. This could result in the biological properties of the biologically active compound being lost or enhanced, or it could reveal distinct routes for potential drug delivery [50]. As is well-known, when excited at 295 nm, the solutions of free BSA exhibit a strong fluorescence emission band with em,max = 343 nm (due to the presence of two tryptophan's at positions 134 and 212). Fluorescence emission spectroscopy, more especially the quenching of the associated emission bands, can be used to observe any potential interactions between physiologically active substances and BSA [48, 49]. In the presence of HCQ and HCQ@CSNPs, the fluorescence emission spectra of BSA showed strong quenching of the corresponding BSA emission band (Figure 5); the initial BSA fluorescence emission (F/F0) was quenched by up to 75% for HCQ@CSNPs and 50% for HCQ. The quenching in the fluorescence emission spectra of the BSA brought on by the presence of the complexes may be attributed to modifications in the tryptophan environment of the BSA, most likely brought on by modifications in the secondary structure of albumin and may serve as an indirect sign of the complexes' binding to BSA [51].
Figure 5a shows the fluorescence spectra of BSA with increasing concentration of HCQ@CSNPs and the fluorescence intensity at 338 nm (tryptophan) is decreasing continuously along with a blue shift with about 30 nm when excited at 280 nm. This is an indication of binding of HCQ@CSNPs with BSA which causes a change in the microenvironment of tryptophan residue. Local polarity around the tryptophan residue must have increased causing a change in compact structure of hydrophobic sub-domain where tryptophan was placed (Trp-212). This local perturbation at the IIA binding site in BSA results in conformational change whereby the Trp 134 is more exposed to polar environment explains the red shift in BSA fluorescence. Thus HCQ@CSNPs nanocomposite induced conformational changes on BSA can lead into increased association among BSA moieties and this self-quenching may be also a probable reason for the decreased fluorescence intensity and blue shift. On the other hand, the fluorescence spectra of BSA with increasing concentration of HCQ showed a continuously decreasing in the intensity with no shift when excited at 280 nm. The determination of the BSA-quenching constants (kq) and the BSA-binding constants KSV) by the Stern-Volmer and Scatchard equations and the corresponding plots were used to further study the interaction of HCQ@CSNPs and HCQ with BSA. More specifically, the Stern-Volmer equation (Equation 1 [37]) and Scatchard equation (Equation 2[40]), were used to compute the values of the kq and K constants of HCQ@CSNPs and HCQ (Table 2), where the value τo = 10-8 s was used as the fluorescence lifespan of tryptophan in the BSA [52].
Where, F0, F denotes fluorescence intensities in the absence and presence of quencher, respectively. KSV is the Stern-Volmer quenching constant and [Q] is the concentration of the quencher. τ0 is the average fluorescence lifetime of BSA is given in Table 2. kq, which equals to KSV/τo, is the quenching rate constant of the biomolecule, τo the average lifetime of the biomolecule in the absence of quencher.

Table 2.
Quenching, binding and thermodynamic parameters of BSA–HCQ and BSA–HCQ@CS NPs complexes.
|
KSV [M−1×10⁴] |
Kq [M−1s−1×10¹²] |
n |
fa |
K [M−1×10⁴] |
Ka [M−1×10⁴] |
ΔG [kJ Mol−1] |
Kb [M−1×10⁴] |
|
|---|---|---|---|---|---|---|---|---|
| HCQ | 0.20 | 0.20 | 0.8 | 1.10 | 0.41 | 0.15 | -7.8 | 0.10 |
| HCQ@CS NPs | 0.70 | 0.70 | 1.0 | 1.21 | 0.62 | 0.80 | -9.7 | 0.55 |
The plot of F0/F versus [Q] which gives the Ksv values as slope and the values of Kq are calculated by using Equation 1, and these results are given in Figure 5 and summarized in Table 2. The plots exhibited a linear relationship which indicated only one type of quenching (static or dynamic quenching). The plot of versus gives the K values as slope as shown by Scatchard equation 2 (Figure 6). The quenching constants are relatively high (∼104 M−1) with HCQ-CSNPs exhibits the highest K values. The bimolecular quenching constants, kq value was of the order of 1012 M−1 s−1. The considerably high kq values were probably an indication of static quenching process via complex formation [48,52].
2.3.2. Determination of Binding Constant (Kbin), Number of Binding Sites (n) and ΔG
The Double logarithmic equation 3 was used to further analyze the fluorescence data, and the results allowed for the determination of the binding constant (Ka) and binding stoichiometry (n) of the drug/BSA system. The linear dependence of log(F0/F)/F on log [Q] is seen in Figure 7a. The slope was used to calculate the number of binding sites (n) for the molecule, while its intercept (logKa) provided information on the binding constant [53,54,55,56,57,58].
The values of n for the BSA drug system were close to one, implying that the drug occupies only one binding site in BSA. The binding constant Ka of magnitude 10-4 M-1 implies that BSA is strongly bound. Equation 4 uses the value of the binding constant Ka to calculate the free energy change, ΔG, of drug binding to BSA [59]. The negative free energy change (Table 2) implies that the interaction with BSA is thermodynamically favorable.
ΔG = −RT ln Ka
2.3.3. Determination of Accessible Fraction of the Fluorophore
When the quencher (HCQ@CSNPs and HCQ) is added, the BSA fluorescence intensity decreases (Figure 4), indicating that the quencher has bound to a location close to the BSA fluorophore tryptophan 213 (Trp 213). It's because the BSA was excited at 278 nm to prevent tyrosine residues from contributing. In accordance with the concept, a fluorophore can only be quenched by a quencher when both the fluorophore and the quencher are nearby. Therefore, the observed quenching by HCQ@CSNPs and HCQ shows that these molecules bind in BSA near to Trp 213. The modified Stern-Volmer equation (5) was used to calculate the extent of fluorophore accessibility by HCQ@CSNPs and HCQ [60,61].
Ksv, the Stern-Volmer quenching constant, fa, the proportion of the fluorophore that is accessible to the quencher, and ΔF(F0-F), the change in fluorescence intensity, are all included in equation (5). To fit the quenching data to equation (5), a graph between F0/ΔF and 1/[Q] was plotted (Figure 7b). The Ksv value estimated from the intercept to slope ratio is in the order of 104, which is the same order as the Ksv values determined by the Stern-Volmer plot. The intercept's measured fraction of fluorescence (fa) accessible to the quencher (Table 2) demonstrates the fluorophore's complete accessibility to the quencher. As a result, the fluorophore's complete accessibility provides additional evidence that HCQ@CSNPs and HCQ binds close to Trp 213.
2.3.4. Conformation Investigation Using UV−Vis Spectroscopy
The two most prevalent methods for quenching fluorescence are static and dynamic quenching, which differ in their disruption effect on the fluorophore's absorption spectrum. It has been found that dynamic quenching has no effect on the absorption spectrum of fluorophores; nevertheless, static quenching has an effect on the fluorophore spectrum. [62,63,64,65] The UV-vis spectra of BSA was recorded at RT (25 °C) and the effect of HCQ and HCQ@CSNPs on the absorption spectrum was analyzed to gain insight into the method involved in quenching the fluorescence of BSA by HCQ and HCQ@CSNPs. Figure 8a shows that when HCQ@CSNPs were added, the absorbance at 250 nm reduced considerably, accompanied by a blue shift of 5 nm, indicating static quenching and structural modification in the protein secondary structure. It was also found that the intensity of the 280 nm peak, which is related to the π-π* transition of Trp, Tyr, and Phe, is somewhat increased, implying that the microenvironment around these amino acids has changed [66]. The emergence of an isosbestic points at 264 and 287 nm, in addition to the alterations at 250 and 280 nm, shows the development of an equilibrium binding system of HCQ@CSNPs and BSA. The absorbance at 250 nm was found to considerably increase with no discernible shift after the addition of HCQ, which suggests static quenching with only minor changes to the protein secondary structure. Additionally, a minor rise in the strength of the 280 nm peak, which is connected to the Trp, Tyr, and Phe π-π* transition, suggests that the microenvironment surrounding these amino acids has changed. To calculate the binding constant, the change in absorption data at 224 nm was fitted to the double reciprocal equation 6 [66,67,68]. The binding constant (Kb) was 0.4 × 10⁴ M−1 and 0.82 × 10⁴ M−1 for HCQ and HCQ@CS NPs, respectively, calculated from the ratio of the intercept to the slope of the regression equation 6, obtained from the plot of 1/ΔA vs 1/[Q] (Figure 8).
Here in the equation 6, εb, εf are the extinction coefficient of bound and free ligand concentrations, LT and M are the total ligand concentration and concentration of the macromolecule respectively, ΔA is the change in the absorbance at a given wavelength, Kb is the binding constant.
2.3.5. Stopped-Flow Binding Experiments and Kinetic Measurements
Numerous parameters, including the strength of binding, the drug's affinity for DNA, as well as the kinetic stability of DNA/protein-drug adducts, may contribute to antitumor efficacy because several drugs with reduced cellular toxicity have a slow DNA/protein dissociation rate [69]. Understanding binding and reaction rates of frequently competing reactions, their dependence on cellular concentrations of participating molecules, and the regulation of these rates through posttranslational modifications or other mechanisms is necessary to comprehend cellular processes such as biochemical pathways and signaling networks. To do this, we dissect these systems into their fundamental components, which are usually always either unimolecular or bimolecular reactions that typically take place on time scales of less than a second, frequently less than a millisecond. For the study of such processes, stopped-flow mixing techniques, which often achieve mixing in less than 2 ms, are typically appropriate. Several excellent texts demonstrate how to use these methods to research enzyme processes [70,71,72]. We first concentrate on the calculation of the rate constants for processes that are common in protein-ligand interactions and are straightforward, reversible second order reactions. Such reactions are typically studied using stopped-flow kinetics in pseudo-first-order settings with the concentration of one of the reagents at least tenfold higher than the other. In this study, HCQ and HCQ@CS NPs were selected to be employed in excess to maximize the ratio of signal change to overall background signal.
BSA displays a distinctive ultraviolet (UV) absorption spectrum (Figure 8) with a maximum at about 280 nm, primarily due to the aromatic amino acids tyrosine (Tyr) and tryptophan (Trp). It is common practice to determine the protein interaction using UV absorbance at 280 nm. The kinetic traces for HCQ@CS NPs were taken in 20 s at 260 nm, covering the full contact process. After the reaction with BSA during the first two seconds, the absorbance at 280 nm gradually dropped over the course of the following 20 seconds. The interaction between HCQ and BSA, in contrast, has a distinct pattern, with a steady increase in absorption over the period of 20 s.
The investigation of kinetic traces done under pseudo-first-order conditions over the concentration range of HCQ and HCQ@CS NPs may be fitted to one and two kinetic phases, (Figure 9 and Figure 10) evaluated using Equations (7 and 8), respectively:
For HCQ@CS NPs, the stopped-flow records the two kinetic phases as a fast binding (rate constant kobs1) and a slow first-order isomerization process (rate constant kobs2). According to the equation kobs = koff + kon[HCQ@CS NPs], both kobs1 and kobs2 increased linearly with HCQ@CS NPs concentration (Figure 9), with a slope equal to the second-order association constant, kon [M-1s-1], and an intercept equal to the first-order dissociation constant, koff [s-1]. The equilibrium association constants Kaff [kon/koff M-1] and the equilibrium dissociation constants Kd [koff/kon M] were calculated using both kon and koff. According to the findings, which are shown in Table 3, BSA binds to HCQ@CS NPs reversibly with a second-order association constant of k1 = 175 ± 1 M−1s−1 and separates from the binary complex in the first phase with a first-order dissociation constant of k-1 = 7.9±0.8 s−1. This indicates that the equilibrium dissociation constants, Kd1, k-1/k1, is 4.5 × 10⁻² M and that the binding affinity of BSA to HCQ@CS NPs, Ka1, k1/k-1, of 22.2 M−1. In the second reaction step, a reversible reaction step with a coordination affinity of 10 M−1 for HCQ@CS NPs was found.
The stopped-flow records one kinetic phase for HCQ, and the observed rate constants were also found to be dependent on the HCQ concentration (Figure 10). A reversible reaction step with HCQ was reported, with k1 = 5.9 ± 0.4 M−1 s−1, k−1 = 3.5 ± 0.6 x 10 −2 s−1, and a coordination affinity of 167 M−1.The equilibrium dissociation constant, Kd1, is related to the variation in the free energy, G, of unbound BSA molecules in solution as compared to when they are bound together. The binding free energy change Gbind is provided by equation (9) [73].
While T and R stand for the universal gas constant and the absolute temperature, respectively. Equation (9) was used for calculating the Gbind values, which were 7.7 and 5.7 kJ mol -1 for the first and second binding phases of BSA to HCQ@CS NPs and 12.7 kJ mol -1 for HCQ. The negative sign for G indicates spontaneous binding to both HCQ and HCQ@CS NPs. From the individual equilibrium dissociation constants, Kd1 and Kd2, as well as the overall association constants, Ka, equation (10) demonstrates how to determine the overall equilibrium dissociation constant, Kd.
The information in Table 3 demonstrates that HCQ@CS NPs have a greater Over all BSA binding affinity (245 M−1) compared to HCQ (167 M−1). Both HCQ@CS NPs and HCQ had Gbind values of -12.7 and -13.6 kJ mol-1, respectively, showing that the reaction is spontaneous for both compounds.
2.4. In vitro Cytotoxicity Studies
Biocompatibility is an important concern when evaluating medicine delivery strategies for tumors. The anticancer activity of HCQ and HCQ@CS NPs was studied in vitro against a diseased cell line, A549 lung cancer cell line, and the cytotoxic activity was assessed for one noncancerous human cell line, Wi38, using the MTT assay in comparison to standard anticancer Doxo. The cell viability was found to decrease as the concentration of HCQ and HCQ@CS NPs was increased (Figure 11), showing that the anticancer potency of HCQ and HCQ@CS NPs was dose dependent. Figure 10 displays the outcomes of the drug cytotoxicity assay. The cytotoxic effects of HCQ and HCQ@CS NPs on A549 cells were tested at various doses and the IC50 values of free drug and drug-loaded NPs for A549 cells were determined. The results showed that drug-loaded NPs, HCQ@CS NPs, were more cytotoxic to A549 cells than free HCQ, and that both proved highly toxic to A549 cancer cells but less toxic to Wi38 normal cells (Figure 11). In addition to HCQ and HCQ@CS NPs, the activity of Doxo, a recognized clinically successful medication, was investigated in A549 and Wi38 cell lines under the same experimental conditions (Figure 11). In both cell lines evaluated, the drug-loaded NPs had much stronger anticancer activity than Doxo (Figure 11, Table 4). Figure 12 depicts the morphological alterations caused by HCQ, HCQ@CS NPs, and Doxo in A549 cancer and Wi38 normal cells. Figure 12 demonstrates that the control cells were uniformly like-shaped. The treated cells exhibited apoptosis-like shattered nuclei, brilliant staining, and condensed chromatin, and the modification in A549 malignancy was greater when the HCQ drug was incubated in CS nanoparticles. These data support the notion that HCQ@CS NPs is effective in inducing apoptosis in A549 cancer [74].
2.5. Antibacterial Activity
Because chemotherapy makes cancer patients immunocompromised and prone to infections, cancer patients are routinely given a multi-drug cocktail of antimicrobial drugs in addition to chemotherapeutic medications to prevent or eliminate different infections [75]. As a result, the antibacterial properties of HCQ@CS NPs and HCQ were also tested in vitro using four bacteria strains, two Gram-positive (E. faecalis and S. aureus) and two Gram-negative (P. aeruginosa and E. coli) using the DTM technique. The bacterial strains were grown in the presence of HCQ@CS NPs and HCQ (concentration ranging from 0 to 1000 μg/ml) to determine the inhibition zone and compared with standard antibiotic (chloramphenicol). HCQ@CS NPs and HCQ are active against both Gram-(+) and Gram-(-) bacteria compared to chloramphenicol under the same experimental condition. As can be seen in Figure 13, HCQ@CS NPs afforded higher activity against all tested bacteria than free chloramphenicol. The antibacterial function is a complicated process that varies between G− and G+ bacteria due to the differences in cell wall and cell membrane structure. HCQ@CS NPs and HCQ exhibit greater antibacterial activity against G− bacteria than G+ bacteria, probably because of the G− bacterial cell membrane. The G− bacteria cell membrane has lipopolysaccharide (LPS) that contains phosphate and pyrophosphate anionic groups. These groups provide more negative charges to the cell surface compared to G+ bacteria that contains peptidoglycan and teichoic acid instead. This may explain why the loss of intracellular contents observed with HCQ@CS NPs in G− is greater than that in G+ bacteria [76]. The reason for the improved antibacterial activity of HCQ@CS NPs compared to the free HCQ may be related to the particle size. The size range of HCQ@CS NPs was 159.3 ± 7.1 nm, which is smaller than that of HCQ (255.7 ± 18.45 nm). The smaller size of HCQ@CS NPs increases the cellular absorption because the antibacterial activity depends heavily on the particle size as stated by Zhang et al. [77]. Another reason for the high antibacterial activity of compared to the free HCQ may be the zeta potential as reported by Dey et al. [78]. The Zeta potential of HCQ@CS NPs (+46.6 ± 0.8 mV) and that of HCQ (-16.4 mV) support the higher activity of HCQ@CS NPs compared to the free HCQ and also support the higher activity of both against G− bacteria than G+ bacteria.
2.6. Molecular Docking of BSA with HCQ
Docking simulation for HCQ-BSA complex allows the estimation of energy. The best leads superimposed core cavity interaction was visualized (Figure 14). Following molecular docking, the best position of HCQ was in the protein structure with binding affinity of DG -7.0 kcal/ mol (-29.4 kJ/mol). The ligand, HCQ, is positioned in the BSA binding site, surrounded by Thr 578, Gln 579, Gln 525, Tyr 400 and Asn 404. It binds by greasy forces (backbone donor) with residues Leu574, Leu531, Leu528, Val575, Val546, Val551, Phe501, Phe506, Phe550, Ale527 and Met547. The termination of HCQ (CH2OH) is considering the ligand exposure. HCQ also has two interacting groups with OG1 and Thr578 by Hydrogen donor with a bond distance of 2.8 Ǻ.
3. Conclusions
In conclusion, a tailored HCQ@CS NPs nanocomposite was synthesized with the goal of producing a novel nanocomposite with better properties and bioavailability. FTIR, SEM, DLS, and zeta potential methods were used to characterize the HCQ@CS NPs nanocomposite. HCQ@CS NPs have a smooth surface and are roughly shaped like roadways, with an average size of 159.3±7.1 nm, a PdI of 0.224±0.101, and a zeta potential of +46.6±0.8 mV. The binding mechanism and affinity of the interaction between HCQ and HCQ@CS NPs and BSA were investigated using stopped-flow, various spectroscopic approaches, and molecular docking studies to aid in the creation of pharmacological systems for application in cancer therapy. HCQ and HCQ@CS NPs binding with BSA is driven by a ground-state complex formation that may be accompanied by a non-radiative energy transfer process, and binding constants at a single site indicated that HCQ@CS NPs-HCQ was more stable than HCQ-BSA. This was demonstrated by UV-Vis and fluorescence measurements. Stopped-flow investigations showed that HCQ@CS NPs bind through two reversible steps: a fast second-order binding, followed by a slow first-order isomerization reaction via a static quenching mechanism. For the first and second steps of HCQ@CS NPs, the detailed binding parameters were established. The total binding constants for HCQ@CS NPs (Ka = 244.5 M−1, Kd = 0.4 × 10⁻² M−1, ΔG0 = −13.6 kJ mol−1). In the case of HCQ, however, just one reversible reaction step was detected with a Ka = 176.0 M−1, Kd = 0.6 × 10⁻² M−1, and ΔG0 = −12.6 kJ mol−1. These findings showed that, in addition to increasing BSA affinity, the nano formulation HCQ@CS NPS changes the binding process and may open new routes for interaction. Docking experiments verified the development of the HCQ-BSA complex, with HCQ binding to the site I on the BSA structure, primarily with the amino acids Thr 578, Gln 579, Gln 525, Tyr 400, and Asn 404. Furthermore, the nano formulation HCQ@CS NPS not only demonstrated increased cytotoxicity against the A549 lung cancer cell line (IC50 = 28.57 ± 1.72 μg/ml) compared to HCQ (102.21 ± 0.67 μg/ml), but also demonstrated higher antibacterial activity against G bacteria than G+ bacteria when compared to HCQ and chloramphenicol. The nano formulation developed in this study may offer a viable therapy option for A549 lung cancer.
4. Materials and Methods
4.1. Materials
Low molecular weight chitosan (80–85% deacetylation), sodium tripolyphosphate (TPP), acetic acid and BSA (Bovine serum albumin) were obtained from Sigma-Aldrich Chemicals, HCQ was purchased from Pharmaceutical.
4.2. Preparation of HCQ@CS NPs
Low molecular weight chitosan (0.2%) was dissolved at 25°C by adding acetic acid (2 M) progressively and stirring at 298K to create chitosan nanoparticles. The pH of the solution was brought down to 5.5 by adding 2 M NaOH solution. The solution was filtered using a 0.45 m cellulose acetate filter to get rid of any remaining chitosan. Over the course of an hour, HCQ (0.0011mol) was dropped into the CS solution while being stirred. By dissolving 0.2 weight percent of TPP in double-distilled water and filtering it through 0.25-micron cellulose acetate, TPP solution was formed. The HCQ-chitosan solution was then given 2 ml of TPP, which was added dropwise by burette at a rate of 0.2 ml/min while being agitated at room temperature. While centrifuging the remaining samples for 20 minutes, some of the processed samples were utilized to measure the nanoparticle size. The samples were then centrifuged once more to get rid of the unreacted gradients after being rinsed with water. The nanoparticles were then analyzed after being dried by air at room temperature. Each of the presented findings is an average of three test iterations.
4.3. Characterization
To evaluate the linking of functional groups in chitosan, chitosan nanoparticles, and drug to the nanoparticles, a Fourier Transform Infrared Spectrometer (Perkin Elmer, Germany) were used. To examine the effects of the mode of production procedure and other process parameters, the mean droplet size and size distribution in form of PDI of the diluted (1:100) NE were determined by the dynamic light scattering technique utilizing Zetasizer (Malvern Instruments, 1000 HS, Malvern, UK). Dynamic light scattering with noninvasive back scattering (DLS-NIBS) was used to determine the hydrodynamic diameter of the samples, assuming spherical shape, with a laser wavelength of 632 nm and a fixed scattering angle of 173°. The zeta potential (ζ) was determined using a combination of mixed laser Doppler electrophoresis and phase analysis light scattering (M3-PALS). Malvern Zeta sizer Nano, Model ZS 3600 (Malvern Instruments, Worcestershire, UK) was used for both measurements. The measurements were taken three times. The particle size and zeta potential of the dispersion were measured without the isolation of nanoparticles. The morphology investigation of the prepared sample was performed using scanning electron microscope (SEM) (Seron Technology, South Korea). A UV–vis spectrophotometer was used to assess optical characteristics (Model Perkin Elmer Lambda). The FTIR spectra were collected over a range of 400–4000 cm−1 using Perkin-Elmer (Spectrum-RX1, USA) FT-IR spectroscopy. An X-ray diffractometer (Shimadzu Corporation, Kyoto, Japan) was used to conduct the XRD studies in 10–80◦ range using CuKα as the radiation source (k = 1.5418) produced at 30 kV and 30 mA.
4.4. BSA Binding Study Procedures
The appropriate solid BSA was dissolved in distilled water to produce a BSA (10-4 M) solution. In methanol, 10-3 M stock solutions of HCQ and HCQ-CSNPs were prepared. UV-Vis measurements were carried out between 240 and 600 nm using a UV-1800 Shimadzu spectrophotometer. When measuring the absorbance values of BSA in the absence and presence of samples, the concentrations of HCQ and HCQ-CSNPs were changed while the concentration of BSA (0.1 mM) remained constant. Equation 6 was used to calculate the binding constant (Kb). Fluorescence measurements were taken in a quartz cell with a 1 cm path length using a Shimadzu spectrofluorometer model RF-5301 connected to a PC. The fluorescence spectra were obtained between 287 and 500 nm at kem and at kexc = 280 nm. According to earlier literature findings, the binding constant (K) was calculated using the intensity at 338 nm (tryptophan) (Equations 1-5).
4.5. Stopped-Flow Fluorescence Kinetic Studies
The kinetic measurements were carried out with the Applied KinetAsyst SF-61DX2 stopped-flow device (HI-Tech Scientific) and a Peltier thermostat. The BSA concentration was 10-4M, and various concentrations of the HCQ and HCQ@CS NPs solutions were utilized. First, the two different syringes of the kinetic accessory were filled with BSA and HCQ or HCQ@CS NPs solutions. Then, equal amounts of both solutions were simultaneously injected into the sample chamber, and this process was repeated for each run. The BSA's absorption spectra were continuously monitored before (t = 0 second) and after the injection of HCQ or HCQ@CS NPs. When the instrument's dead time was measured for a 1:1 mixture, it was discovered to be 2 ms. In control studies, BSA solution was mixed with buffer solutions containing either no HCQ or HCQ@CS NPs. Decomposition of the BSA was excluded because the absorption signal did not change over the course of the control experiment. Due to the complexity of the kinetic trace, which revealed that there was only one step present in the case of HCQ whereas two steps were recorded for HCQ@CS NPs, we assumed a superposition of exponential terms to characterize the process.
4.6. Cell Cytotoxicity Assay
To test the cytotoxicity of HCQ and HCQ@CS NPs, A549 cells were seeded onto 96-well plates at a density of 1 10-5/mL (100 L per well), and then HCQ and HCQ@CS NPs were added at final concentrations of 50, 125, 250, 500, and 1000 g/l (all in triplicate). Untreated cells served as a positive control for viability, while 2% saponin (Sigma-Aldrich, St. Louis, MO, USA) served as a positive control for cell lysis. Plates were incubated for 24 hours under normal conditions. The ability of live cells to decrease MTT (Cell Proliferation and Cytotoxicity Assay, R&D Systems, Minneapolis, MN, USA) to formazan crystals was used to assess cell viability using the MTT colorimetric approach. Following the 24-hour incubation period, 50 L of MTT solution was applied to each well. After four hours of incubation (37 °C, 5% CO2), the plate was centrifuged (400 g/10 min), supernatants were removed, and the intracellularly stored formazan was solubilized for four hours at room temperature with 200 L of the dissolving solution. The optical density was then measured using a plate reading spectrophotometer Victor 2 (Wallac, Turku, Finland) at a reference wavelength of 620 nm. The values of the half-maximal inhibitory concentration (IC50) were then computed.
4.7. Antibacterial Activity
The in vitro antibacterial activity of HCQ and HCQ@CS NPs against Gram-positive (S. aureus and E. faecalis) and Gram-negative (E. coli and P. aeruginosa) bacteria was examined using the dilution tube method (DTM) [79]. The examined HCQ and HCQ@CS NPs were diluted into a range of concentrations of 5, 6, 7, 7.5, 9.0, 9.5, 9.8, 10, and 15 g/ml in test tubes filled with sterile nutritional broth. In test tubes containing 1 ml of the various concentrations of the free drug and its CS nanoparticles in nutritive broth, Eucast (2003) inoculated coli culture, 0.5 McFarland standards. After 18 to 24 hours at 37°C, the tubes were examined for growth or turbidity. Each test tube that did not exhibit growth had a loopful of broth put into a plate of nutritional agar. The test tube cultures were then fed equal volumes of sterile nutrient broth and cultured at 37°C for another 24 hours. The tubes and agar plates were then examined visually for growth and turbidity (CLSI, 2012). Instead of doubling the nutritional broth dilution, the DTM was repeated with a greater dilution (1:10 dilution, or 9 vol. of nutrient broth to 1 vol. of broth culture). The same experiments were carried out three times. Chloramphenicol was utilized as a control drug.
4.8. Computational Studies
All theoretical calculations were carried out using Gaussian 09 W [42] and density function theory (DFT) [43, 44]. The Becke 3-Parameter, Lee, Yang, and Parr (B3LYP) [45,46] with 6-31G(d) basis set was used to optimize the structure of HCQ, monomer of chitosan (M), and dimer of chitosan (MM). In the gas phase, all computations were fully optimized. Frequency calculations were performed at the same theoretical level for each optimized shape to ensure that they are all minima or transition states on the system's potential energy surface. The ChemCraft programmer was used to calculate the distribution of the Highest Occupied Molecular Orbital (HOMO), Lowest Unoccupied Molecular Orbital (LUMO), and Frontier Molecular Orbitals (FMO) in HCQ, M, and MM [47]. The Gaussian view package [80] was used to generate the molecular electrostatic potential (MEP).
4.9. Molecular Docking
MOE software [81] has been utilized for molecular docking studies between drugs or ligands and a variety of biological targets such as BSA. MOE is also a drug discovery software platform that combines modelling, simulation, and visualization, as well as methodological development [82]. When the chemical structure of HCQ was downloaded from PubChem (http://pubchem.ncbi.nlm.nih.gov/) and optimized by minimizing energies using parameters, the best model was chosen for docking study. The MOE docking programmer with default parameters was used to attach the specified ligand to the receptor protein and provide the correct substrate shape.
Supplementary Materials
The following supporting information can be downloaded at the website of this paper posted on Preprints.org. Equation S1 1: Koopman’s theorem.
Author Contributions
Conceptualization, F.I.E., S.Y.S.; methodology, F.I.E., H.A.S.; software, F.I.E., H.A.S., S.Y.S.; validation, F.I.E., H.A.S., S.Y.S.; formal analysis, F.I.E., H.A.S., S.Y.S.; investigation, F.I.E., H.A.S.; resources, F.I.E., I.M.E, S.Y.S.; data curation, F.I.E., H.A.S., S.Y.S.; writing—original draft preparation, F.I.E., H.A.S., S.Y.S.; writing—review and editing, F.I.E., H.A.S., S.Y.S., R.v.E.; visualization, I.M.E, S.Y.S..; supervision, I.M.E, S.Y.S.; project administration, S.Y.S., R.v.E. All authors have read and agreed to the published version of the manuscript.
Institutional Review Board Statement
Not applicable.
Informed Consent Statement
Not applicable.
Data Availability Statement
Not Applicable.
Conflicts of Interest
The authors declare no conflict of interest.
References
- Sung, H.; Ferlay, J.; Siegel, R.L.; Laversanne, M.; Soerjomataram, I.; Jemal, A.; Bray, F. Global Cancer Statistics 2020: GLOBOCAN Estimates of Incidence and Mortality Worldwide for 36 Cancers in 185 Countries. CA A Cancer J. Clin. 2021, 71, 209–249. [Google Scholar] [CrossRef] [PubMed]
- Bade, C.B.; Dela Cruz, S.C. ; Lung Cancer 2020: Epidemiology, Etiology, and Prevention. Clin Chest Med. 2020, 41, 1–24. [Google Scholar] [CrossRef]
- Key Statistics for Lung Cancer. American Cancer Society. 2021. Available online: https://www.cancer.org/cancer/lung-cancer/about/key-statistics.html.
- Batra, H.; Pawar, S.; Bahl, D. Current clinical trials and patent update on lung cancer: A retrospective review. Lung Cancer Manag. 2021, 10, 1–10. [Google Scholar] [CrossRef]
- Swarnalatha, Y.; Gunna, G.K.; Jacob, C.M. Synthesis of alkaloid loaded chitosan nanoparticles for enhancing the anticancer activity in A549 lung cancer cell line. Der. Pharm. Lett. 2015, 7, 378–390. [Google Scholar]
- Mirkin, C.A.; Nel, A.; Thaxton, C.S. Applications: Nano biosystems, medicine and health. Sci. Policy Rep. 2011, 1, 305–374. [Google Scholar] [CrossRef]
- Kim, J.H.; Kim, Y.S.; Park, K.; Lee, S.; Nam, H.Y.; Min, K.H.; Jo, H.G.; Park, J.H.; Choi, K.S.Y.; Jeong, R.W.; et al. Antitumor efficacy of cisplatin-loaded glycol chitosan nanoparticles in tumor-bearing mice. J. Control. Release 2008, 127, 41–49. [Google Scholar] [CrossRef]
- Jiang, L.; Li, X.; Liu, L.; Zhang, Q. Thiolated chitosan-modified PLA-PCL-TPGS nanoparticles for oral chemotherapy of lung cancer. Nanoscale Res. Lett. 2013, 8, 66–71. [Google Scholar] [CrossRef]
- Lonso, M.J.; Sanchez, A. The potential of chitosan in ocular drug delivery. J. Pharm. Pharmacol. 2003, 55, 451–1463. [Google Scholar] [CrossRef]
- Sun, Y.; Wan, A.J. Preparation of nanoparticles composed of chitosan and its derivatives as delivery systems for macromolecules. J. Appl. Polym. Sci. 2007, 105, 552–561. [Google Scholar] [CrossRef]
- Zhou, S.H.; Hong, Y.; Fang, G.J. Preparation, characterization and anticancer effect of chitosan nanoparticles. CRTER 2007, 11, 9688–9691. [Google Scholar]
- Kumar, S.; Kurkjian, C. Advances in the treatment of metastatic colorectal cancer. Am. J. Ther. 2009, 16, 412–420. [Google Scholar] [CrossRef]
- Johnston, S.R.D. Acquired tamoxifen resistance in human breast cancer-potential mechanisms and clinical implications. Anticancer Drugs 1997, 8, 911–930. [Google Scholar] [CrossRef]
- Brown, K. Breast cancer chemoprevention: Risk-benefit effects of the antioestrogen tamoxifen. Expert Opin. Drug Saf. 2002, 1, 253–267. [Google Scholar] [CrossRef]
- Balunas, M.J.; Su, B.; Brueggemeier, R.W.; Kinghorn, A.D. Natural products as aromatase inhibitors. Anticancer Agents Med. Chem. 2008, 8, 646–682. [Google Scholar] [CrossRef]
- Anbu, S.A.; Velmuruganb, P.; Leec, J.H.; Ohb, B.T.; Venkatachalama. P. Biomolecule-loaded chitosan nanoparticles induce apoptosis and molecular changes in cancer cell line (SiHa). Int J Biol Macromol. 2016, 88, 18–26. [Google Scholar] [CrossRef]
- Smith, C.D.; Cyr, M. The history of lupus erythematosus. From Hippocrates to Osler. Rheum Dis Clin North Am. 1988, 14, 1–14. [Google Scholar] [CrossRef]
- Ben-Zvi, I.; Kivity, S.; Langevitz, P.; Shoenfeld, Y. Hydroxychloroquine: From malaria to autoimmunity. Clin Rev Allergy Immunol. 2012, 42, 145–153. [Google Scholar] [CrossRef]
- Safer, A.-M.; Leporatti, S. Chitosan Nanoparticles for Antiviral Drug Delivery: A Novel Route for COVID-19 Treatment. Int. J. Nanomed. 2021, 16, 8141–8158. [Google Scholar] [CrossRef]
- Verbaanderd, C.; Maes, H.; Schaaf, M.B.; Sukhatme, V.P.; Pantziarka,P. ; Sukhatme,V.; Patrizia Agostinis, P.; Bouche, G. Repurposing Drugs in Oncology (ReDO)—Chloroquine and hydroxychloroquine as anti-cancer agents. Ecancer. 2017, 11, 781. [Google Scholar] [CrossRef] [PubMed]
- Rangwala, R.; Chang, Y.C.; Hu, J.; Algazy, K.M.; Evans, T.L.; Fecher, L.A.; et al. Combined MTOR and autophagy inhibition: Phase I trial of hydroxychloroquine and temsirolimus in patients with advanced solid tumors and melanoma. Autophagy 2014, 10, 1391–1402. [Google Scholar] [CrossRef] [PubMed]
- Mahalingam, D.; Mita, M.; Sarantopoulos, J.; Wood, L.; Amaravadi, R.V.; et al. Combined autophagy and HDAC inhibition: A phase I safety, tolerability, pharmacokinetic, and pharmacodynamic analysis of hydroxychloroquine in combination with the HDAC inhibitor vorinostat in patients with advanced solid tumors. Autophagy 2014, 10, 1403–1414. [Google Scholar] [CrossRef] [PubMed]
- Chi, K.-H.; Ko, H.-L.; Yang, K.-L.; Lee, C.-Y.; Chi, M.-S.; Kao, S-J. Addition of rapamycin and hydroxychloroquine to metronomic chemotherapy as a second line treatment results in high salvage rates for refractory metastatic solid tumors: A pilot safety and effectiveness analysis in a small patient cohort. Oncotarget. 2015, 6, 16735–16745. [Google Scholar] [CrossRef]
- Rosenfeld, M.R.; Ye, X.; Supko, J.G.; Desideri, S.; Grossman, S.A.; et al. A phase I/II trial of hydroxychloroquine in conjunction with radiation therapy and concurrent and adjuvant temozolomide in patients with newly diagnosed glioblastoma multiforme. Autophagy 2014, 10, 1359–1368. [Google Scholar] [CrossRef]
- Goldberg, S.B.; Supko, J.G.; Neal, J.W.; Muzikansky, A.; Digumarthy, S.; et al. A phase I study of erlotinib and hydroxychloroquine in advanced non-small-cell lung cancer. J Thorac Oncol. 2012, 7, 1602–1608. [Google Scholar] [CrossRef] [PubMed]
- Leung, L.-SB.; Neal, J.W.; Wakelee, H.A.; Sequist, L.V.; Marmor, M.F. Rapid onset of retinal toxicity from high-dose hydroxychloroquine given for cancer therapy American. Am. J. Ophthalmol. 2015, 160, 799–805. [Google Scholar] [CrossRef]
- Vogl, D.T.; Stadtmauer, E.A.; Tan, K.S.; Heitjan, D.F.; Davis, L.E.; Pontiggia, L.; et al. Combined autophagy and proteasome inhibition: A phase 1 trial of hydroxychloroquine and bortezomib in patients with relapsed/refractory myeloma. Autophagy. 2014, 10, 1380–1390. [Google Scholar] [CrossRef]
- Wolpin, B.M.; Rubinson, D.A.; Wang, X.; Chan, J.A.; Cleary, J.M.; et al. Phase II and pharmacodynamic study of autophagy inhibition using hydroxychloroquine in patients with metastatic pancreatic adenocarcinoma. The Oncologist 2014, 19, 637–638. [Google Scholar] [CrossRef] [PubMed]
- Zhang, H.; Xue, Q.; Zhou, Z.; He, N.; Li, S.; Zhao, C. Co-delivery of doxorubicin and hydroxychloroquine via chitosan/alginate nanoparticles for blocking autophagy and enhancing chemotherapy in breast cancer therapy. Front. Pharmacol. 2023, 14, 1176232. [Google Scholar] [CrossRef]
- Piao, S.; Ojha, R. .; Rebecca, V.W.; Samanta, A.; Ma, X.H.; Mcafee, Q. ALDH1A1 and HLTF modulate the activity of lysosomal autophagy inhibitors in cancer cells. Autophagy. 2017, 13, 2056–2071. [Google Scholar] [CrossRef]
- Onorati, A.V.; Dyczynski, M.; Ojha, R.; Amaravadi, R.K. Targeting autophagy in cancer. Cancer 2018, 124, 3307–3318. [Google Scholar] [CrossRef]
- Amaravadi, R.K.; Kimmelman, A.C.; Debnath, J. Targeting autophagy in cancer: Recent advances and future directions. Cancer Discov. 2019, 9, 1167–1181. [Google Scholar] [CrossRef]
- Pfab, C.; Schnobrich, L.; Eldnasoury, S.; Gessner, A.; El-Najjar, N. Repurposing of Antimicrobial Agents for Cancer Therapy: What Do We Know? Cancers 2021, 13, 3193. [Google Scholar] [CrossRef] [PubMed]
- Shereef, H.A.; Moemen, Y.S.; Elshami, F.I.; El-Nahas, A.M.; Shaban, S.Y.; van Eldik, R. DNA Binding and Cleavage, Stopped-Flow Kinetic, Mechanistic, and Molecular Docking Studies of Cationic Ruthenium (II) Nitrosyl Complexes Containing “NS4” Core. Molecules 2023, 28, 3028. [Google Scholar] [CrossRef]
- Shereef, H.A.; Shaban, S.Y.; Moemen, Y.S.; El-Khouly, M.E.; El-Nahas, A.M. Biophysicochemical studies of a ruthenium(II) nitrosyl thioether-thiolate complex binding to BSA: Mechanistic information, molecular docking, and relationship to antibacterial and cytotoxic activities. Appl. Organomet. Chem. 2022, 34, 6583. [Google Scholar] [CrossRef]
- Shaban, N.Z.; Aboelsaad, A.M.; Shoueir, K.R.; Abdulmalek, S.A.; Awad, D.; Shaban, S.Y.; Mansour, H. Chitosan-based dithi-ophenolato nanoparticles: Preparation, mechanistic information of DNA binding, antibacterial and cytotoxic activities. J. Mol. Liq. 2020, 318, 114252. [Google Scholar] [CrossRef]
- Elshami, F.I.; Ramadan, A. El-M, M.; Ibrahim, M.M.; El-Mehasseb, I.M.; Al-Juaid, S.; Shaban, S.Y. Metformin Containing Nickel (II) Complexes: Synthesis, Structural Characterization, Binding and Kinetic Interactions with BSA, Antibacterial and in-vitro Cytotoxicity Studies. In Appl. Organomet. Chem.; 2020; Volume 34, p. 5437. [Google Scholar] [CrossRef]
- Shaban, N.Z.; Yehia, S.A.; Shoueir, K.R.; Saleh, S.R.; Awad, D.; Shaban, S.Y. ; Design, DNA binding and kinetic studies, anti-bacterial and cytotoxic activities of stable dithiophenolato titanium (IV)-chitosan Nanocomposite. J. Mol. Liq. 2019, 287, 111002. [Google Scholar] [CrossRef]
- Ramzy, E.; Ibrahim, M.M.; El-Mehasseb, I.M.; Ramadan, A.; El-M, M.; Elshami, F.I.; Shaban, Y.S.; van Eldik, R. Synthesis, Bio-physical Interaction of DNA/BSA, Equilibrium and Stopped-Flow Kinetic Studies, and Biological Evaluation of bis(2-Picolyl)amine-Based Nickel(II) Complex. Biomimetics 2022, 7, 172. [Google Scholar] [CrossRef] [PubMed]
- Sun, L.; Legood, R.; Sadique, Z.; Dos-Santos-Silva, I.; Yang, L. Cost effectiveness of risk-based breast cancer screening programme, China. Bull. World Health Organ 2019, 96, 568–577. [Google Scholar] [CrossRef]
- Du, J.Z.; Du, X.J.; Mao, C.Q.; Wang, J. Tailor-made dual pH-sensitive polymer-doxorubicin nanoparticles for efficient anticancer drug delivery. J. Am. Chem. Soc. 2011, 133, 17560–17563. [Google Scholar] [CrossRef]
- Frisch, M.J.; Trucks, G.W.; Schlegel, H.B.; Scuseria, G.E.; Robb, M.A.; Cheeseman, J.R.; Scalmani, G.; Barone, V.; Mennucci, B.; Petersson, G.A.; et al. Gaussian 09, Revision A.02. Gaussian, Inc.: Wallingford, CT, USA, 2009. [Google Scholar]
- Parr, R.G.; Yang, W. Density-functional theory of atoms and molecules. Int. J. Quantum Chem. 1993, 47, 101. [Google Scholar]
- Ziegler, T. Approximate density functional theory as a practical tool in molecular energetics and dynamics. Chem. Rev. 1991, 91, 651–667. [Google Scholar] [CrossRef]
- Becke, A.D. Density-functional thermochemistry. III. The role of exact exchange. J. Chem. Phys. 1993, 98, 5648–5652. [Google Scholar] [CrossRef]
- Onoka, I.; Pogrebnoi, A.; Pogrebnaya, T. Geometrical structure, vibrational spectra and thermodynamic properties of chitosan constituents by DFT method. Int. j. mater. sci. Appl. 2014, 311, 121–128. [Google Scholar] [CrossRef]
- Zhurko, G.A.; Zhurko, D.A. ChemCraft version 1.7 (build132). Available online: http://www.chemcraftprog.com.
- Barmpa, A.; Frousiou, O.; Kalogiannis, S.; Perdih, F.; Turel, I., Psomas. Manganese (II) complexes of the quinolone family member flumequine: Structure, antimicrobial activity and affinity for albumins and calf-thymus DNA. Polyhedron 2018, 145, 166–175. [Google Scholar] [CrossRef]
- Lakowicz, J.R. Principles of Fluorescence Spectroscopy, 3rd ed.; Plenum Press: New York, NY, USA, 2006. [Google Scholar]
- Tan, C.; Liu, J.; Li, H.; Zheng, W.; Shi, S.; Chen, L.; Ji, L. Synthesis, structural characteristics, DNA binding properties and cytotoxicity studies of a series of Ru (III) complexes. J. Inorg. Biochem. 2008, 102, 1644–1653. [Google Scholar] [CrossRef]
- Rajendiran, V.; Karthik, R.; Palaniandavar, M.; Stoeckli-Evans, H.; Periasamy, V.S.; Akbarsha, M.A.; Srinag, B.S.; Krishnamurthy, H. Mixed-ligand copper(II)-phenolate complexes: Effect of coligand on enhanced DNA and protein binding, DNA cleavage, and anticancer activity. Inorg. Chem 2007, 46, 8208–8221. [Google Scholar] [CrossRef] [PubMed]
- Wang, Y.; Zhang, H.; Zhang, G.; Tao, W.; Tang, S.; Tang, S. Interaction of the flavonoid hesperidin with bovine serum albumin: A fluorescence quenching study. J. Luminescence 2007, 126, 211–218Y. [Google Scholar] [CrossRef]
- Sahoo, B.K.; Ghosh, K.S.; Dasgupta, S. Molecular interactions of isoxazolcurcumin with human serum albumin: Spectroscopic and molecular modeling studies. Biopolymers 2009, 91, 108–119. [Google Scholar] [CrossRef]
- Wani, T.A.; Alsaif, N.A.; Alanazi, M.M.; Bakheit, A.H.; Khan, A.A.; Zargar, S. Binding of colchicine and ascorbic acid (vitamin C) to bovine serum albumin: An invitro interaction study using multispectroscopic, molecular docking and molecular dynamics simulation study. J. Mol. Liq. 2021, 342, 117542. [Google Scholar] [CrossRef]
- Hashemnia, S.; Fard, F.K.; Mokhtari, Z. A study of the interactions between ephedrine and human serum albumin based on spectroscopic, electrochemical and docking assessments. J. Mol. Liq. 2022, 348, 118058. [Google Scholar] [CrossRef]
- Yang, F.; Zhang, Y.; Liang, H. Interactive association of drugs binding to human serum albumin. Int. J. Mol. Sci. 2014, 15, 3580–3595. [Google Scholar] [CrossRef]
- Abd Halim, A.A.; Ridzwan, F.W.; Bin Mohamad, S.; Tayyab, S. Targeting the Nalidixic Acid Binding Site on Human Serum Albumin Through Computational Approach: A Re-Investigation. Biointerface Res. Appl. Chem. 2022, 12, 1520–1525. [Google Scholar] [CrossRef]
- Abdollahpour, N.; Soheili, V.; Saberi, M.R.; Chamani, J. Investigation of the interaction between human serum albumin and two drugs as binary and ternary systems. Eur. J. Drug Metab. Pharmacokinet. 2016, 41, 705–721. [Google Scholar] [CrossRef]
- Basak, P.; Debnath, T.; Banerjee, R.; Bhattacharyya, M. Selective binding of divalent cations toward heme proteins. Front. Biol. 2016, 11, 32–42. [Google Scholar] [CrossRef]
- Sahoo, B.K.; Ghosh, K.S.; Dasgupta, S. Molecular interactions of isoxazolcurcumin with human serum albumin: Spectroscopic and molecular modeling studies. Biopolymers 2009, 91, 108–119. [Google Scholar] [CrossRef]
- Linciano, S.; Moro, G.; Zorzi, A.; Angelini, A. Molecular analysis and therapeutic applications of human serum albumin-fatty acid interactions. J Control Release. 2022, 348, 15–26. [Google Scholar] [CrossRef]
- Bodapati, A.T.; Reddy, R.S.; Lavanya, K.; Madku, S.R.; Sahoo, B.K. A comprehensive biophysical and theoretical study on the binding of dexlansoprazole with human serum albumin. J. Mol. Liq. 2023, 380, 121777. [Google Scholar] [CrossRef]
- Parsekar, S.U.; Paliwal, K.; Haldar, P.; Antharjanam, P.K.S.; Kumar, M. Synthesis, Characterization, Crystal Structure, DNA and HSA Interactions, and Anticancer Activity of a Mononuclear Cu(II) Complex with a Schiff Base Ligand Containing a Thiadiazoline Moiety. ACS Omega 2022, 7, 2881–2896. [Google Scholar] [CrossRef]
- Shen, F.; Liu, Y.X.; Li, S.M.; Jiang, C.K.; Wang, B.F.; Xiong, Y.H.; Mao, Z.W.; Le, X.Y. Synthesis, crystal structures, molecular docking and in vitro cytotoxicity studies of two new copper(II) complexes: Special emphasis on their binding to HSA. New J. Chem. 2017, 41, 12429–12441. [Google Scholar] [CrossRef]
- Aseman, M.D.; Aryamanesh, S.; Shojaeifard, Z.; Hemmateenejad, B.; Nabavizadeh, S.M. Cycloplatinated(II) derivatives of mercaptopurine capable of binding interactions with HSA/DNA. Inorg. Chem. 2019, 58, 16154–16170. [Google Scholar] [CrossRef] [PubMed]
- Hussain, A.; AlAjmi, M.F.; Rehman, M.T.; Amir, S.; Husain, F.M.; Alsalme, A.; Siddiqui, M.A.; AlKhedhairy, A.A.; Khan, R.A. Copper (II) complexes as potential anticancer and Nonsteroidal anti-inflammatory agents: In vitro and in vivo studies. Sci. Rep. 2019, 9, 5237. [Google Scholar] [CrossRef]
- Bodapati, A.T.S.; Sahoo, B.K.; Ragaiahgari, S.R.; Kandikonda, L.; Madku, S.R. Deciphering the nature of binding of dexlansoprazole with DNA: Biophysical and docking approaches. Int. J. Biol. Macromol. 2022, 217, 1027–1036. [Google Scholar] [CrossRef] [PubMed]
- Ovung, A.; Bhattacharyya, J. Binding effects of antibiotic drug sulfamethazine on the serum albumins: Multi-spectroscopic and computation approach. Chem. Phys. 2022, 5, 100087. [Google Scholar] [CrossRef]
- Huang, Z.Y.; Li, X.Y.; Hu, L.Y.; Bai, A.M.; Hu, Y.J. Comparative study of two antipsychotic drugs binding to human serum albumin: By multispectroscopic and molecular docking methods. J. Mol. Liq. 2022, 365, 120084. [Google Scholar] [CrossRef]
- Denny, W.A.; Wakelin, L.P. Kinetic and equilibrium studies of the interaction of amsacrine and anilino ring-substituted analogues with DNA. Cancer Res. 1986, 46, 1717–1721. [Google Scholar]
- Daviter, T.; Johnson, C.M.; McLaughlin, S.H.; Williams, M.A. Protein-Ligand Interactions Methods and Applications; 3ird ed.; Springer Science Business Media, LLC, Part of Springer Nature: Berlin/Heidelberg, Germany, 2021. [Google Scholar]
- Cornish-Bowden, A. Fundamentals of Enzyme Kinetics; Portland Press: London, UK, 1995; 343p, ISBN 1-85578-072-0. [Google Scholar]
- Gutfreund, H. Kinetics for the Life Sciences: Receptors, Transmitters and Catalysts; Cambridge University Press: Cambridge, UK, 1995; 360p. [Google Scholar]
- Williams, M.A.; Daviter, T. Protein-Ligand Interactions. Methods Mol. Biol. 2013, 13, 85. [Google Scholar]
- Paliwal, K.; Haldar, P.; Sudhadevi Antharjanam, P.K.; Kumar, M. Synthesis, Characterization, Crystal Structure, DNA and HSA Interactions, and Anticancer Activity of a Mononuclear Cu(II) Complex with a Schiff Base Ligand Containing a Thiadiazoline Moiety. ACS Omega 2022, 7, 2881–2896. [Google Scholar] [CrossRef]
- Yan, D.; Li, Y.; Liu, Y.; Li, N.; Xue Zhang, X.; Yan, C. Antimicrobial Properties of Chitosan and Chitosan Derivatives in the Treatment of Enteric Infections. Molecules 2021, 26, 7136. [Google Scholar] [CrossRef]
- Zhang, L.; Jiang, Y.; Ding, Y.; Povey, M.; York, D. Investigation into the antibacterial behavior of suspensions of ZnO nanoparticles (ZnO nanofluids). J. Nanoparticle Res. 2007, 9, 479–489. [Google Scholar] [CrossRef]
- Dey, D.; Maiti, C.; Maiti, S.; Dhara, D. Interaction between Calf Thymus DNA and Cationic Bottle-Brush Copolymers: Equilibrium and Stopped-Flow Kinetic Studies. Phys. Chem. Chem. Phys. 2015, 17, 2366–2377. [Google Scholar] [CrossRef]
- Owuama, C. Afr. J. Microbiol. Res. 2017, 11, 977.
- Hay, P.J.; Wadt, W.R. Ab initio effective core potentials for molecular calculations. Potentials for the transition metal atoms Sc to Hg. J. Chem. Phys. 1985, 82, 270. [Google Scholar] [CrossRef]
- MOE (The Molecular Operating Environment), software available from Chemical Computing Group Inc., 1010 Sherbrooke Street West, Suite 910, Montreal, Canda H3A 2R7. Available online: http://www.chemcomp.com.
- Roy, U.; Luck, L.A. Molecular modeling of estrogen receptor using molecular operating environment. Biochem. Mol. Biol. Educ. 2007, 35, 238–243. [Google Scholar] [CrossRef] [PubMed]
Figure 1.
a) SEM images of HCQ@CS NPs under 500 nm field of view; b) the particle size distribution of HCQ and HCQ@CS NPs detected by Zetasizer Nano ZS; c) zeta potential of HCQ, and HCQ@CS NPs; d) The chemical structure of HCQ, and HCQ@CS NPs are analyzed by FT-IR.
Figure 1.
a) SEM images of HCQ@CS NPs under 500 nm field of view; b) the particle size distribution of HCQ and HCQ@CS NPs detected by Zetasizer Nano ZS; c) zeta potential of HCQ, and HCQ@CS NPs; d) The chemical structure of HCQ, and HCQ@CS NPs are analyzed by FT-IR.
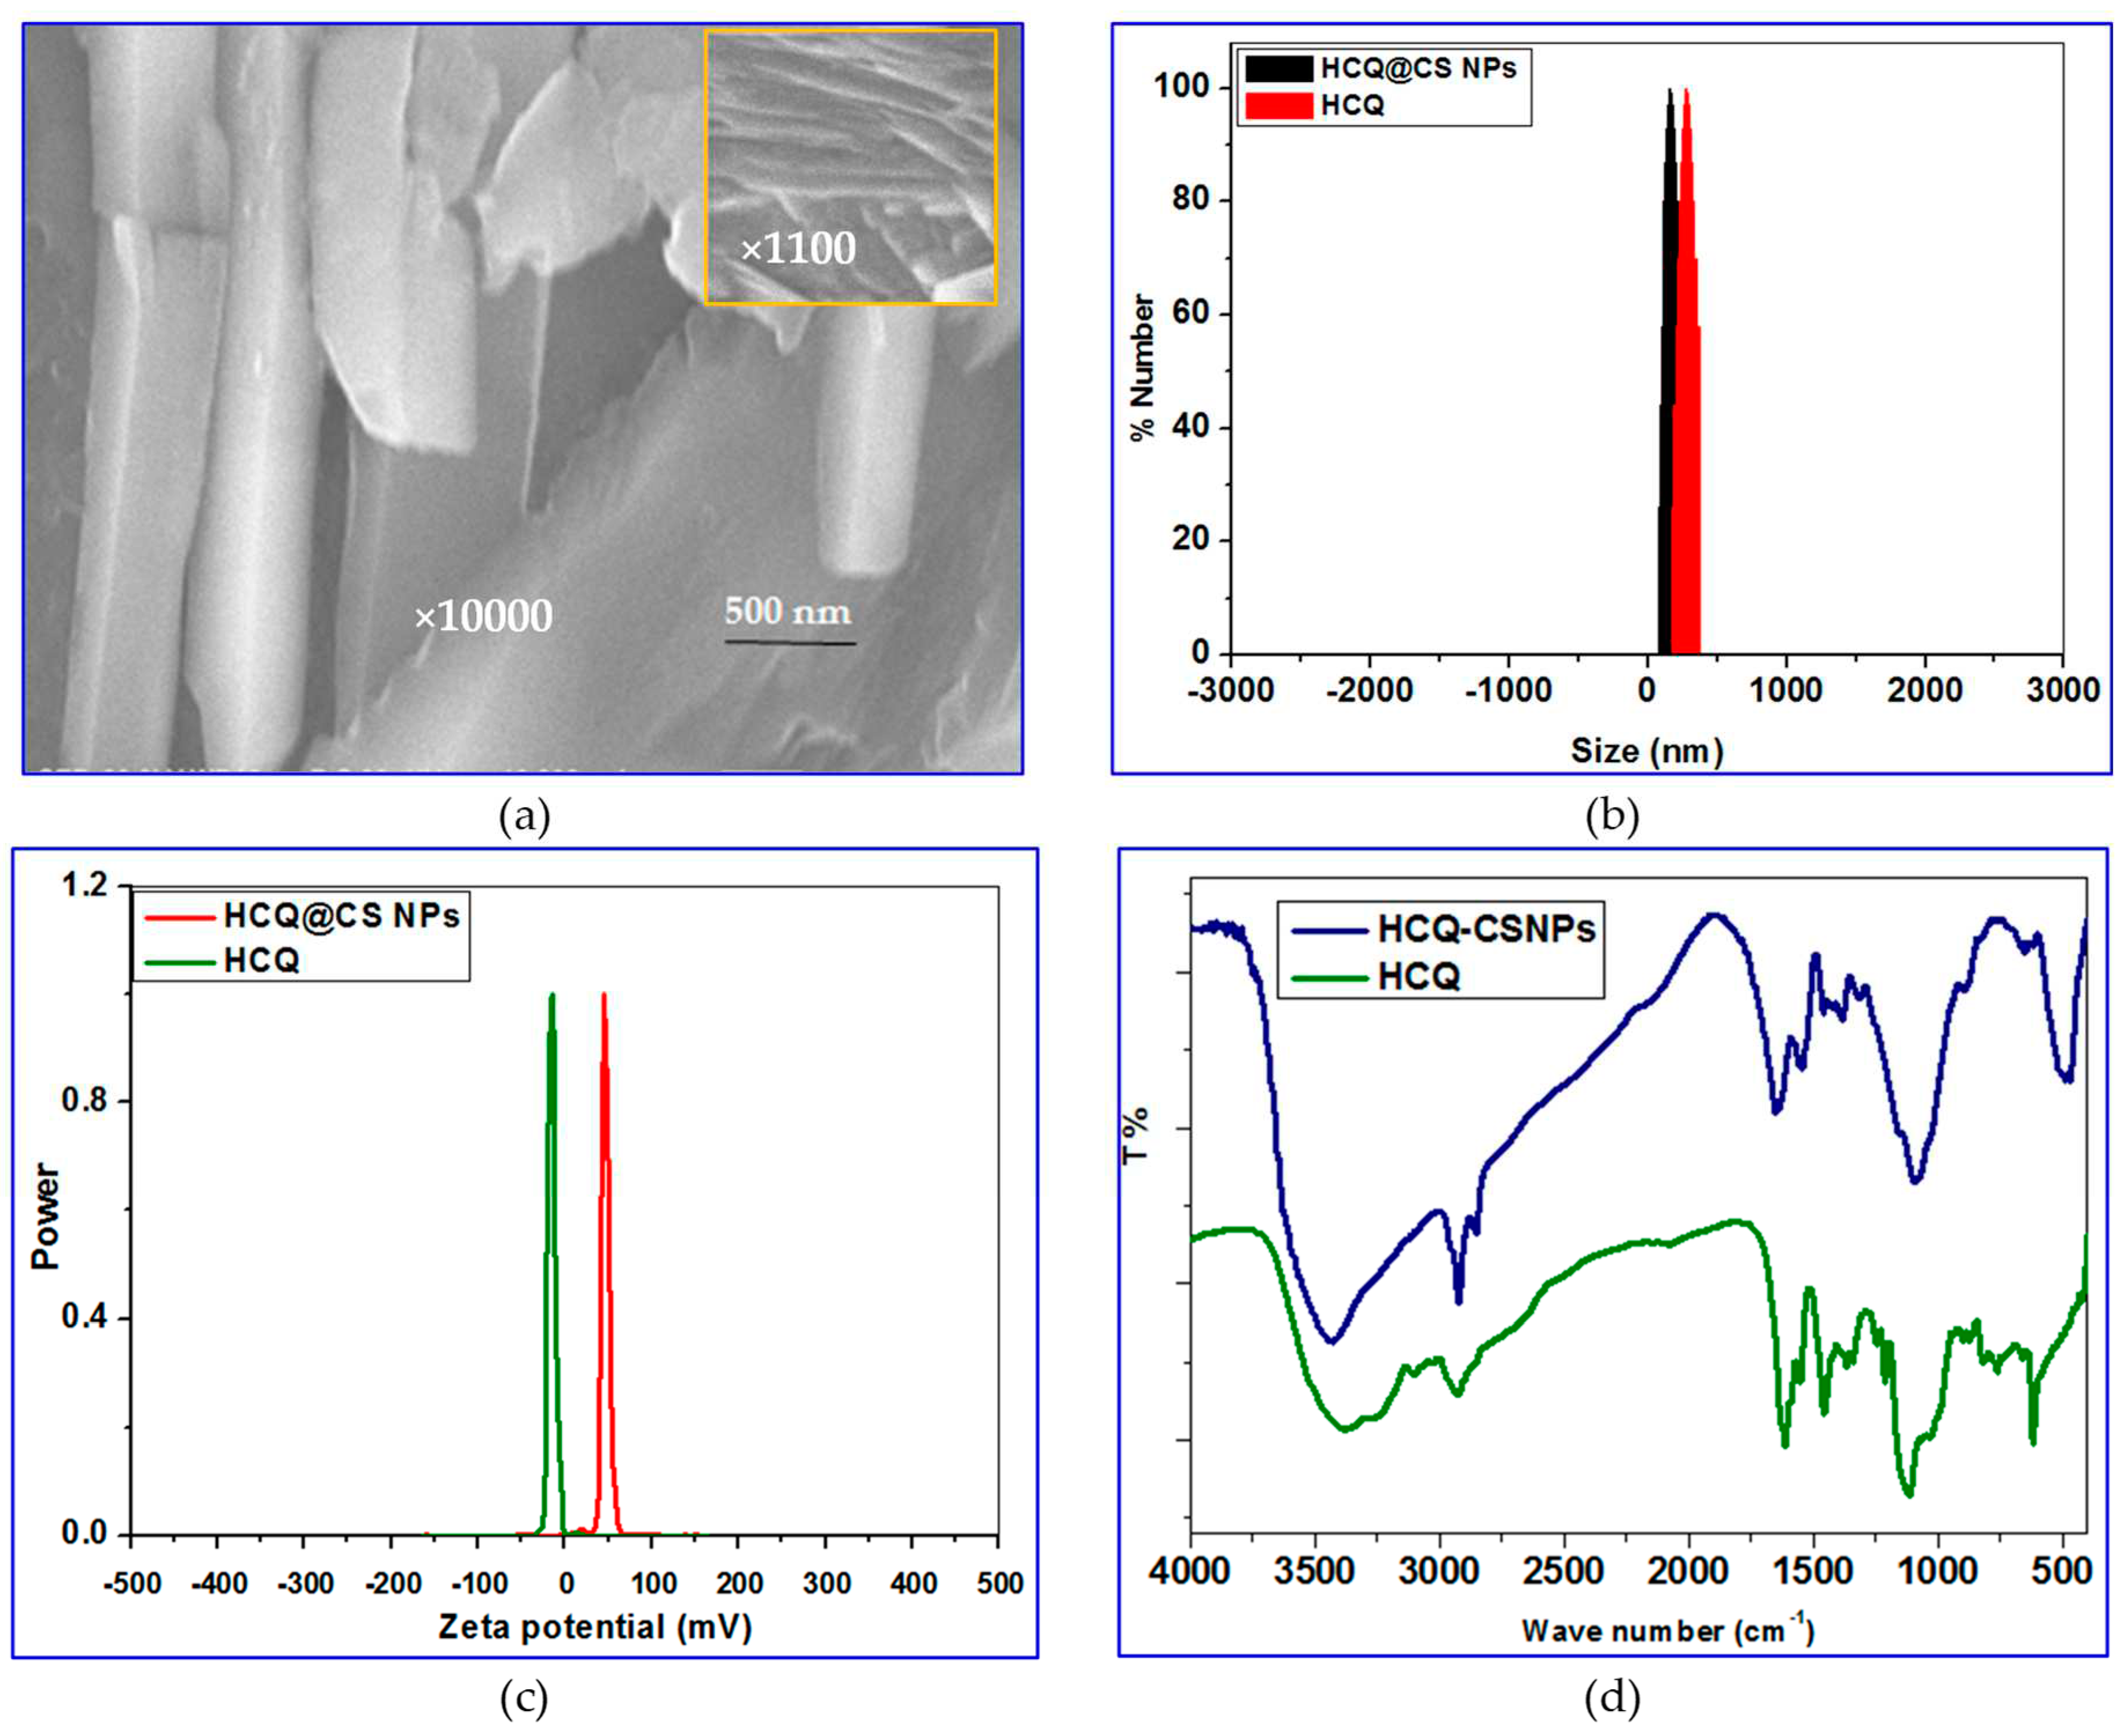
Figure 2.
The optimized geometries of a) HCQ, b) M and c) MM.

Figure 3.
HOMO of a) HCQ; b) M and c) MM and LUMO of d) HCQ; e) M and f) MM.

Figure 4.
MEP of a) HCQ, b) M and c) MM.
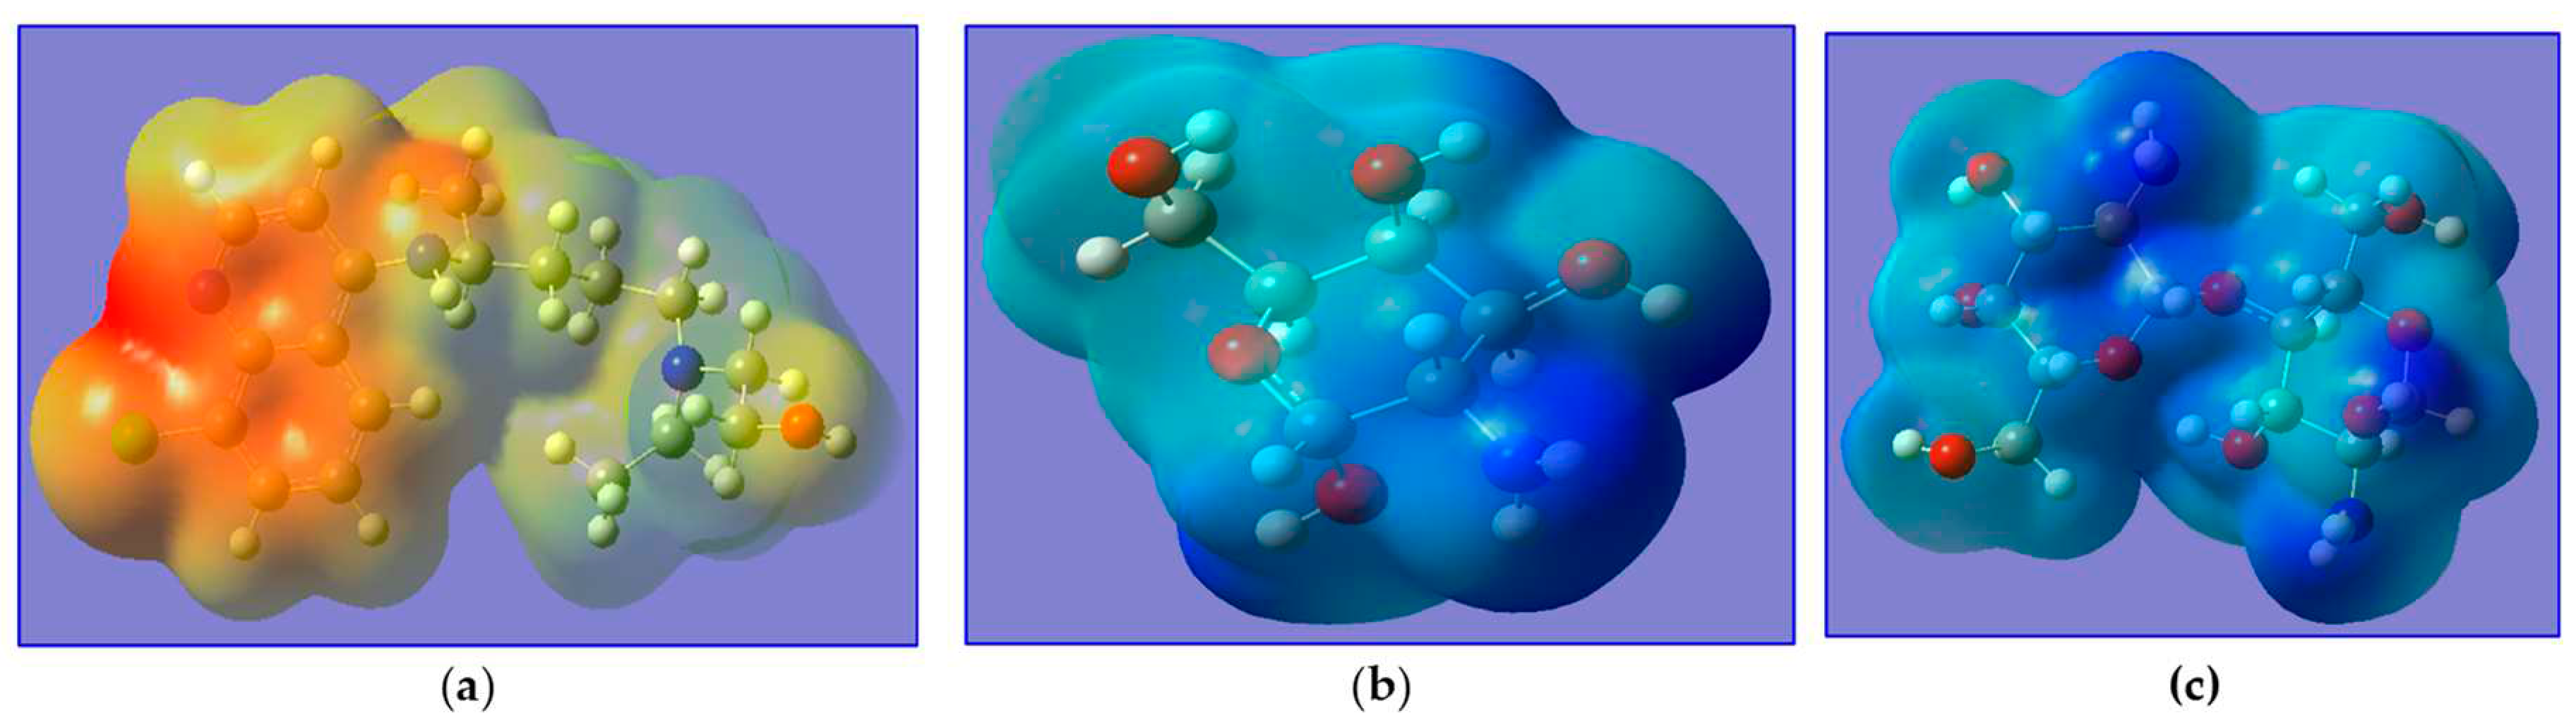
Figure 5.
Fluorescence quenching spectra of BSA in the absence and presence of various concentration of a) HCQ@CSNPs and b) HCQ at T = 298 K, λexc = 278 nm, λem = 343 nm, pH = 7.2 and [BSA] = 4 x 10⁻⁴ M; Insets show Stern–Volmer plots; c) Plot of relative BSA fluorescence intensity at em = 343 nm (F/F0, %) vs. r (r = [compound]/[BSA]) for HCQ@CSNPs and HCQ at T = 298 K, λexc = 278 nm, λem = 343 nm, pH = 7.2 and [BSA] = 4 x 10⁻⁴ M.
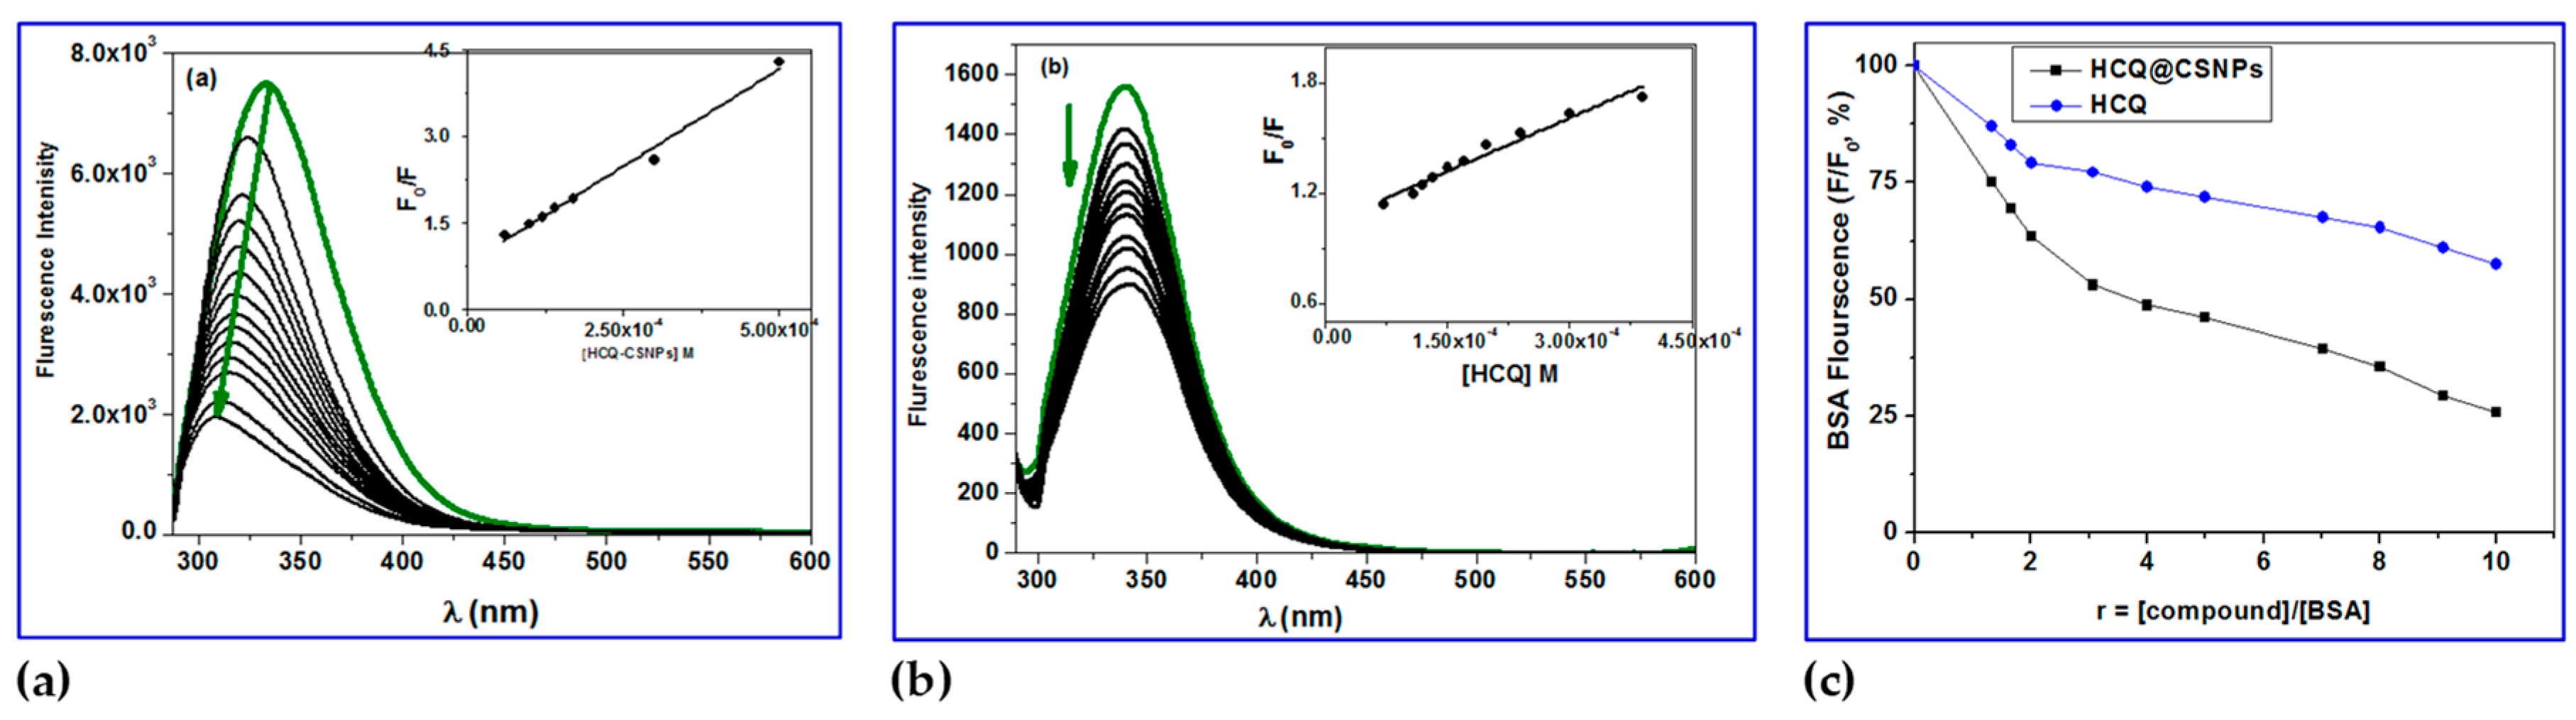
Figure 6.
Scatchard plots of BSA for HCQ@CSNPs and HCQ.
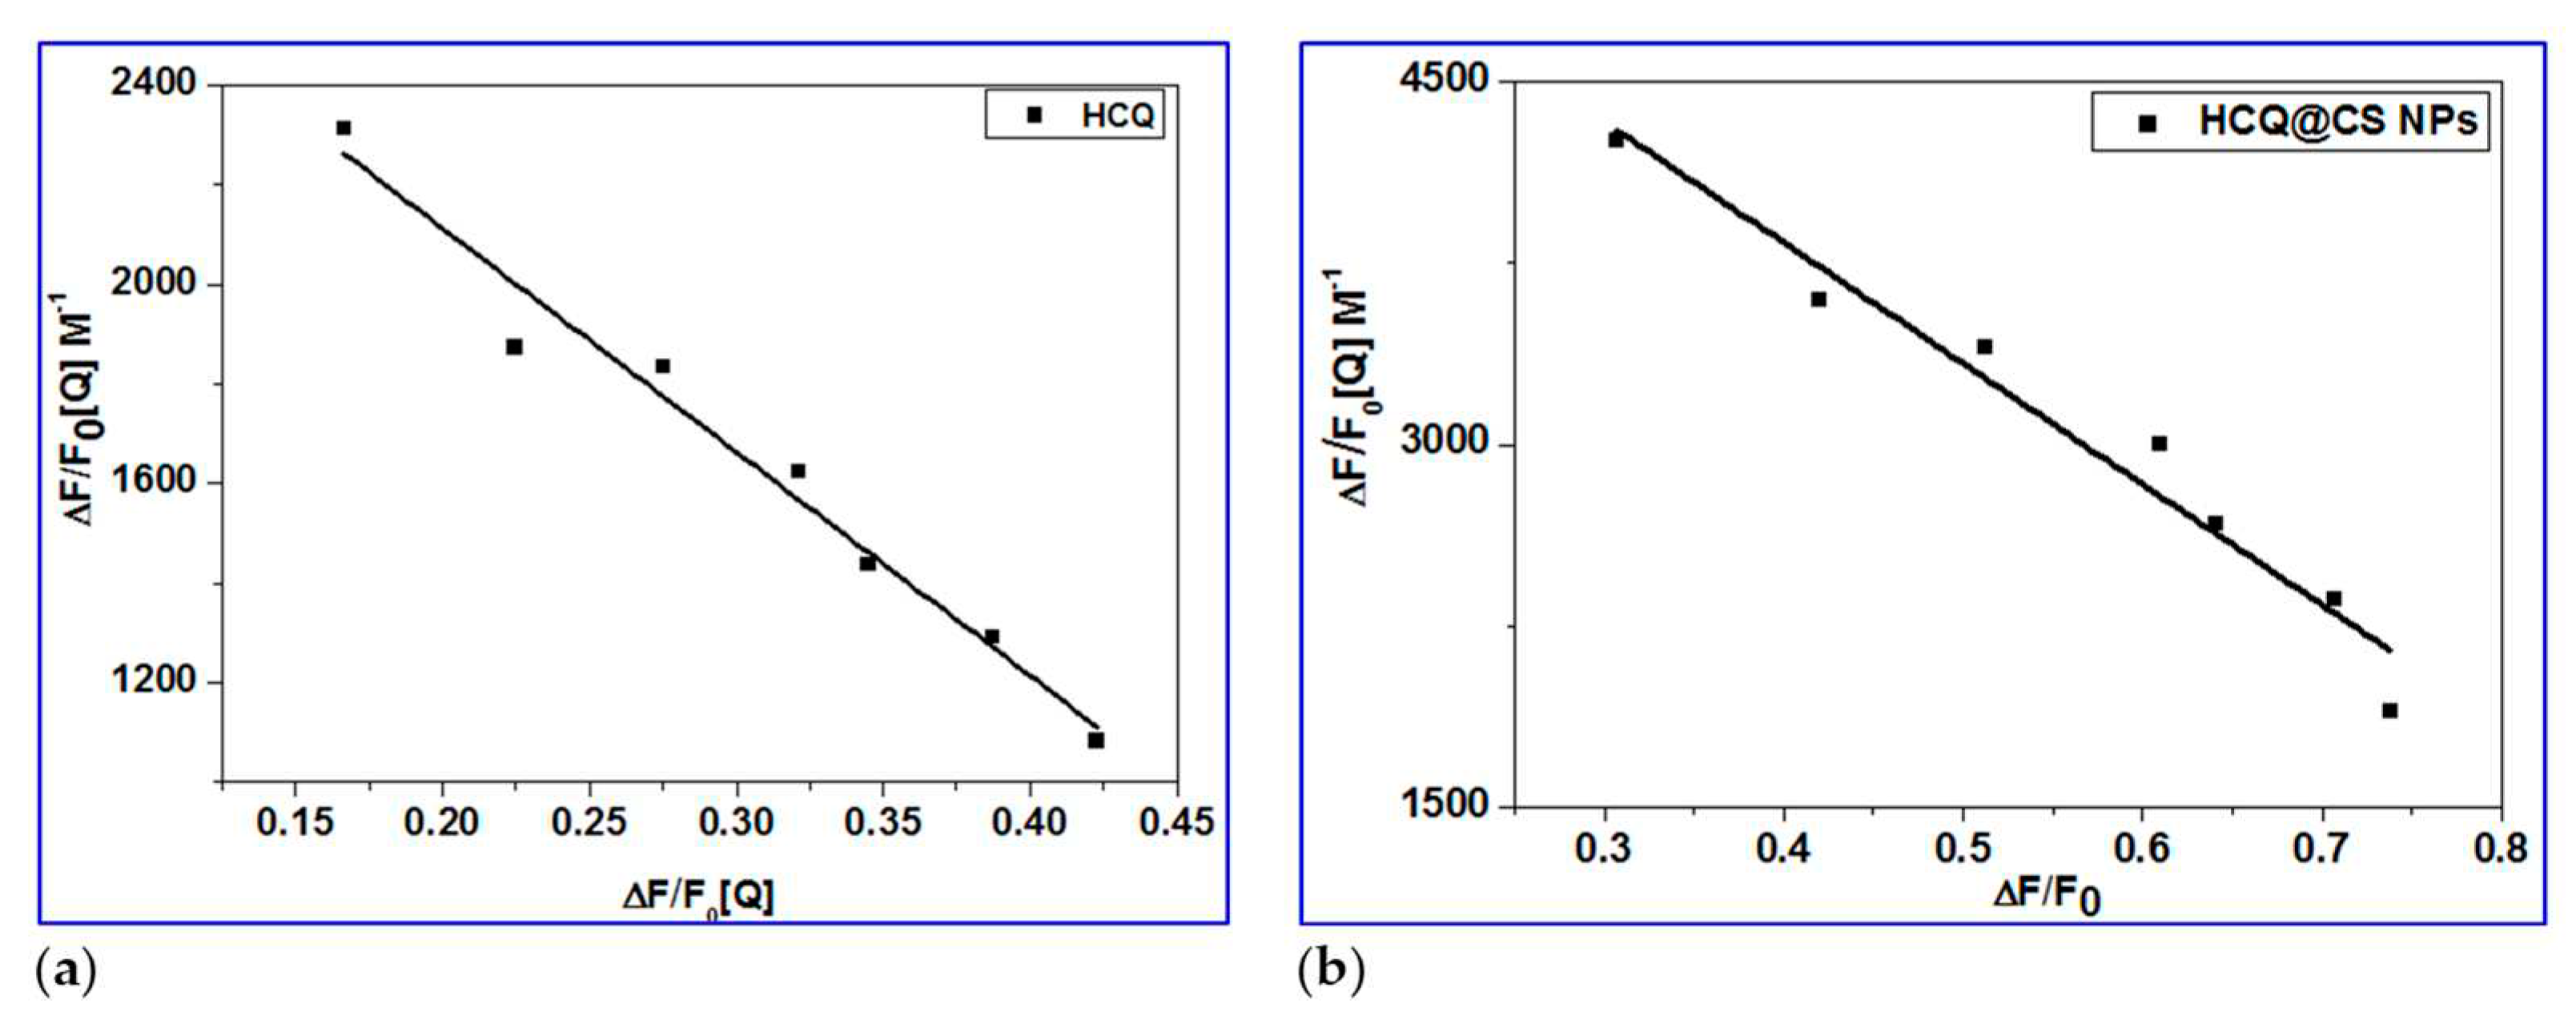
Figure 7.
a) Double logarithmic plot of BSA (0.4 mM) fluorescence quenching in presence HCQ@CSNPs and HCQ at different concentrations; b) Modified Stern-Volmer plot; The accessibility of BSA to HCQ@CSNPs and HCQ.
Figure 7.
a) Double logarithmic plot of BSA (0.4 mM) fluorescence quenching in presence HCQ@CSNPs and HCQ at different concentrations; b) Modified Stern-Volmer plot; The accessibility of BSA to HCQ@CSNPs and HCQ.
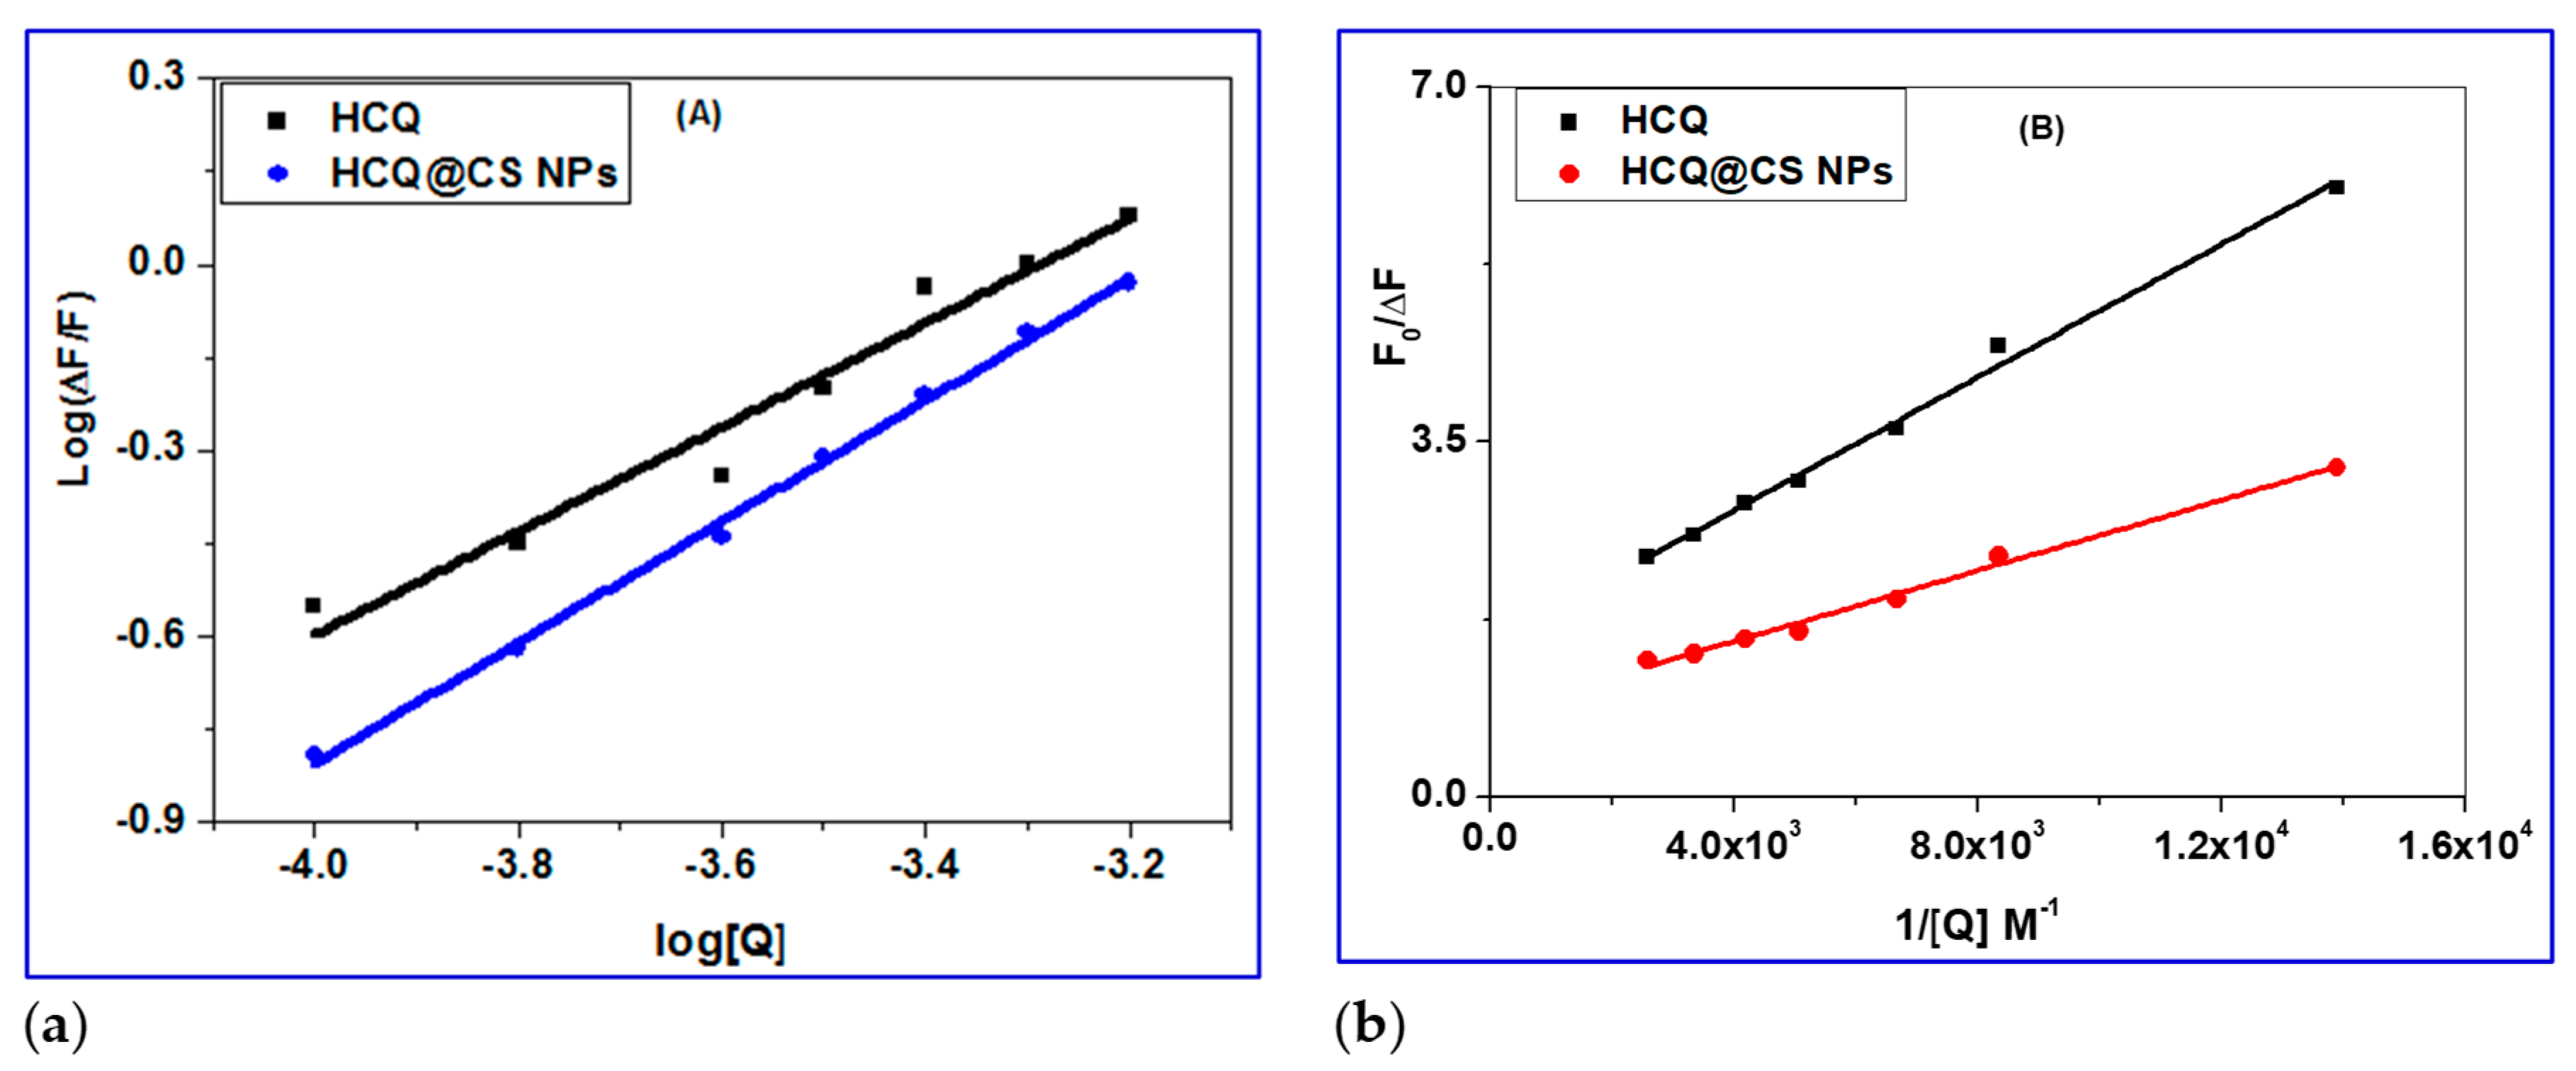
Figure 8.
UV–Vis spectral changes of the reaction of BSA with a) HCQ@CS NPs and b) HCQ in methanol at 296 K.
Figure 8.
UV–Vis spectral changes of the reaction of BSA with a) HCQ@CS NPs and b) HCQ in methanol at 296 K.
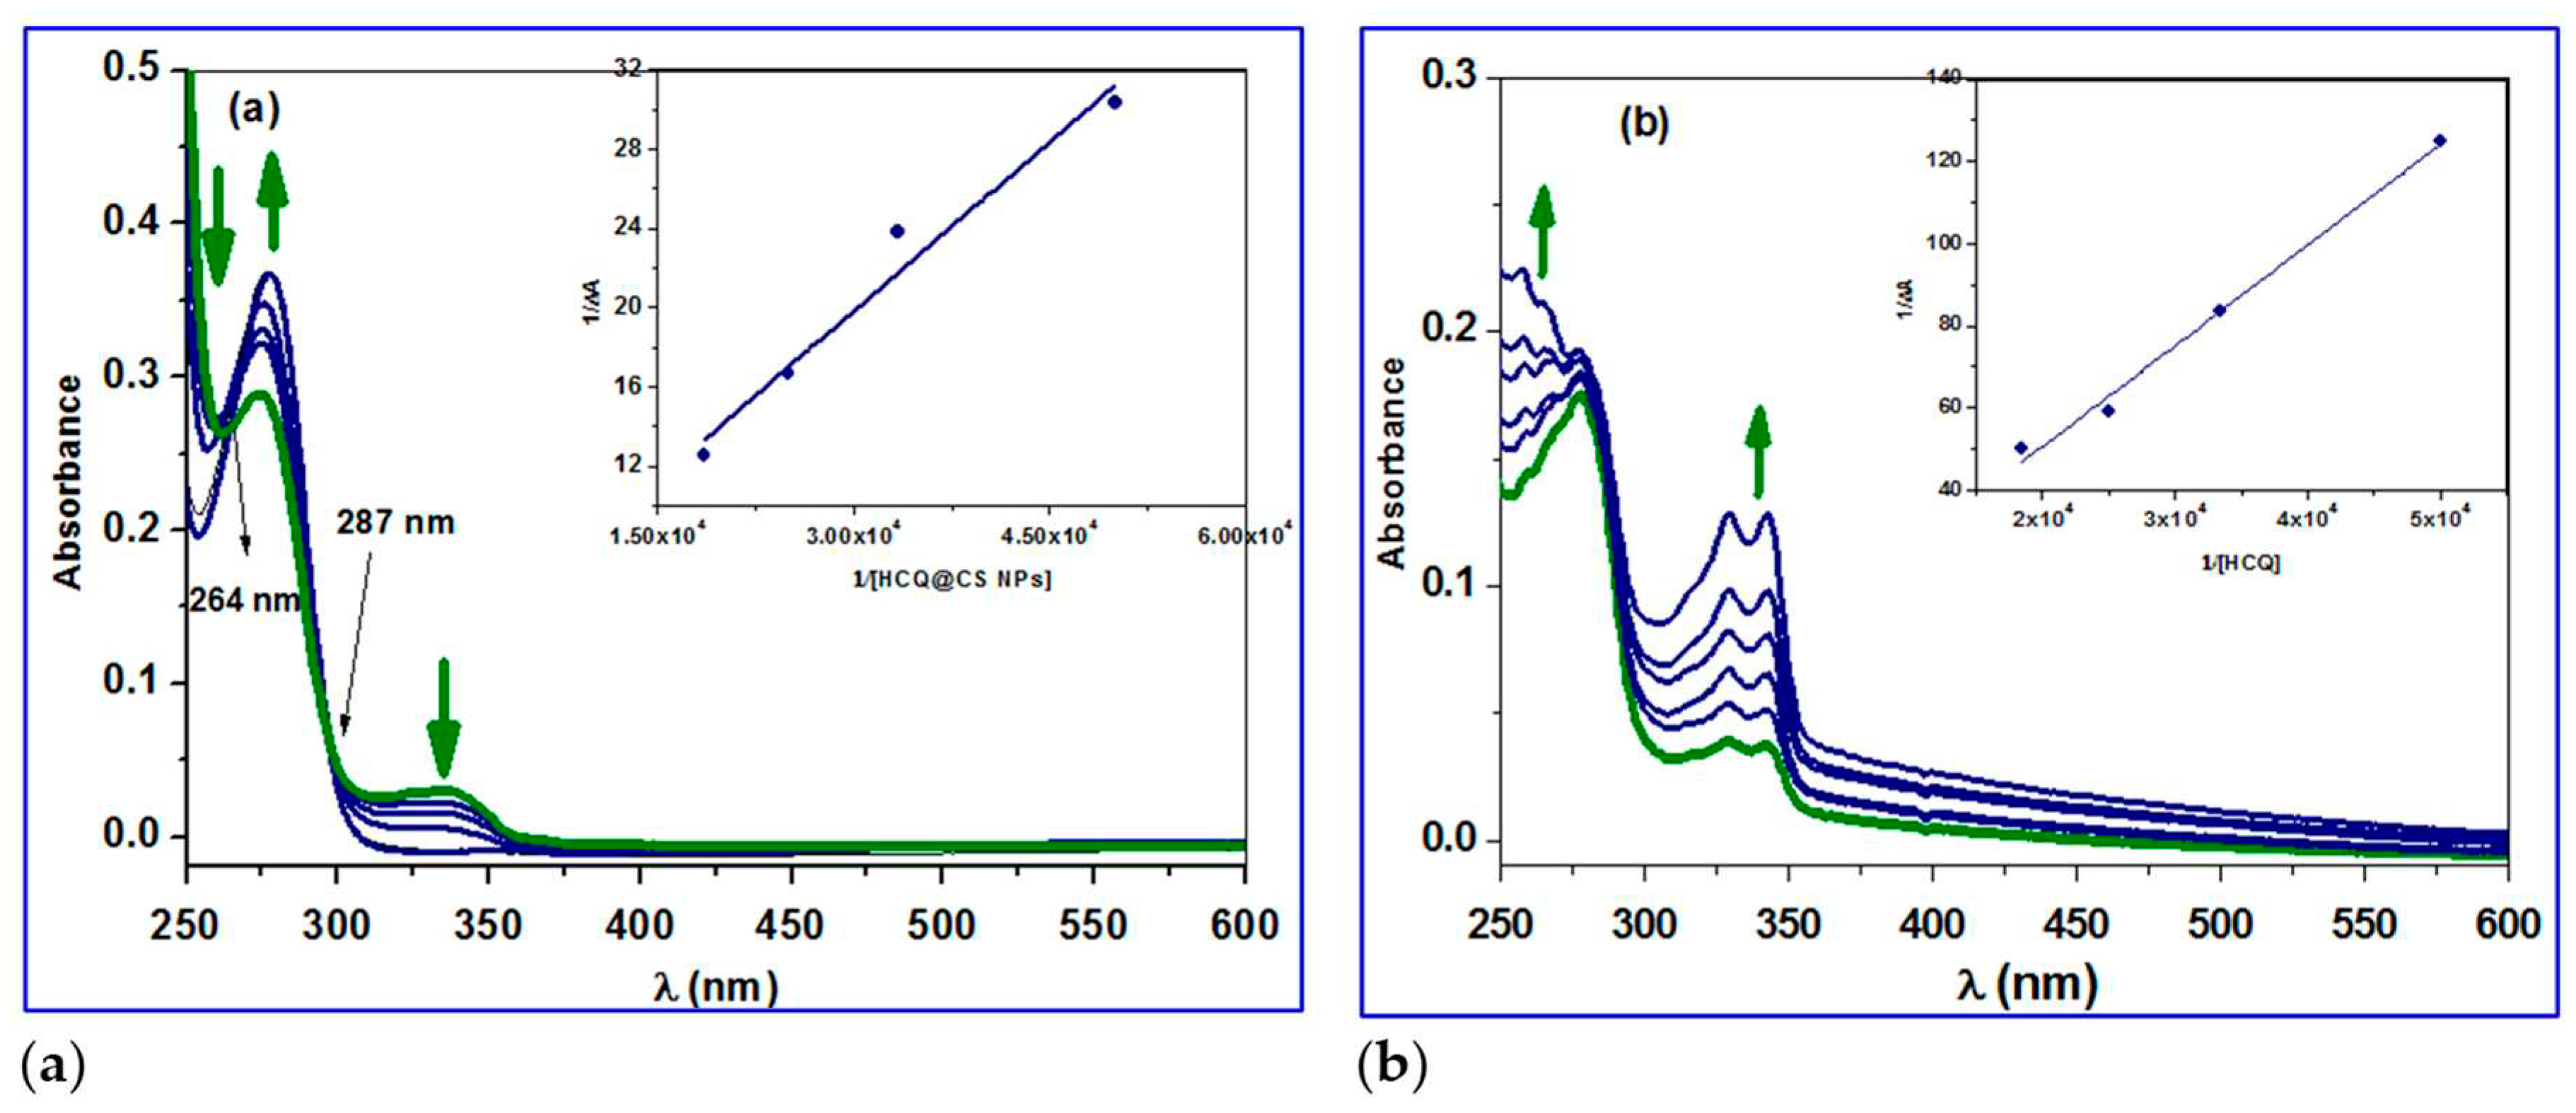
Figure 9.
a) UV–Vis spectral changes of binding of BSA with HCQ@CS NPs; inset showing the kinetic trace at 280 nm containing two reaction steps; b) Kinetic traces of different concentrations of HCQ@CS NPs with BSA; c) Fast step of the reaction of different concentrations of HCQ@CS NPs with BSA; d) Plots of kobs versus concentration of the first and second reaction steps of BSA with HCQ@CSNPs in methanol at 296 K.

Figure 10.
a) UV–Vis spectral changes of binding of BSA with HCQ; inset showing the kinetic trace at 280 nm containing two reaction steps; b) Kinetic traces of different concentrations of HCQ with BSA; c) Plots of kobs versus concentration of the first and second reaction steps of BSA with HCQ in methanol at 296 K.
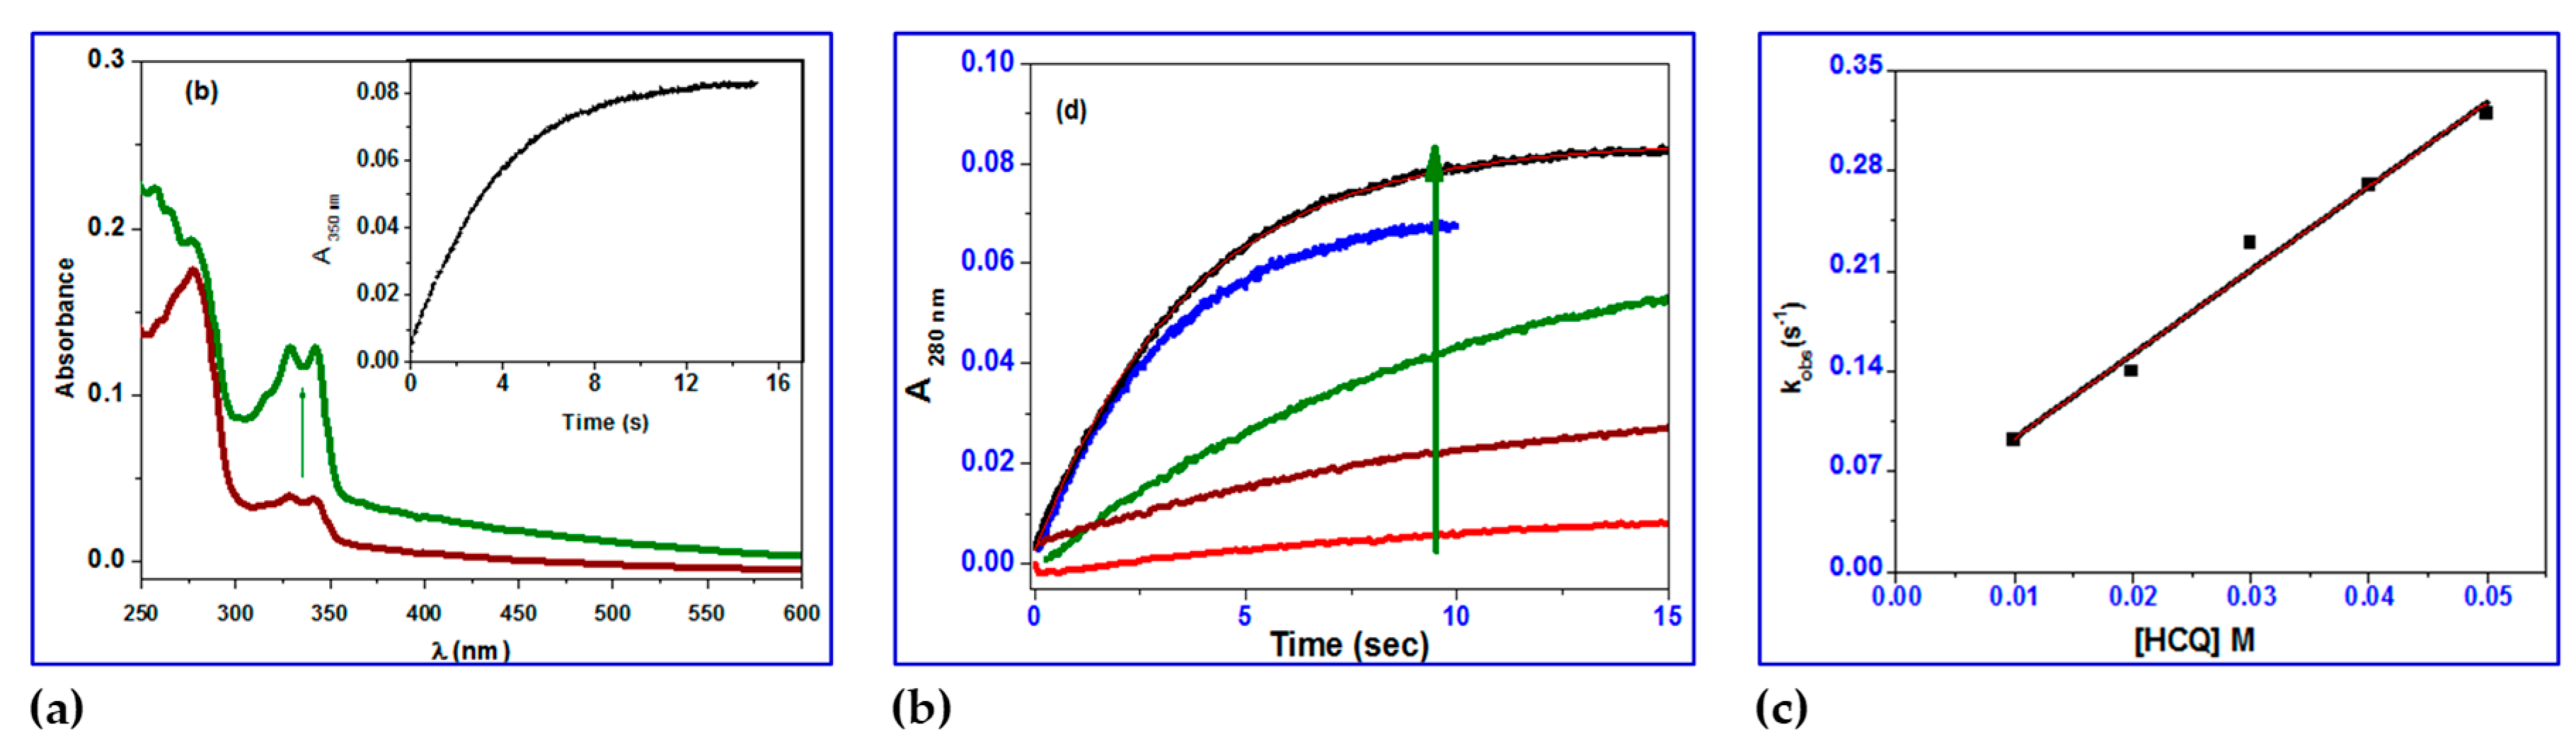
Figure 11.
Cell viability results from the MTT assay for A549 cancer cells and Wi38 normal cells with HCQ, HCQ@CS NPs and Doxo for 24 h.
Figure 11.
Cell viability results from the MTT assay for A549 cancer cells and Wi38 normal cells with HCQ, HCQ@CS NPs and Doxo for 24 h.
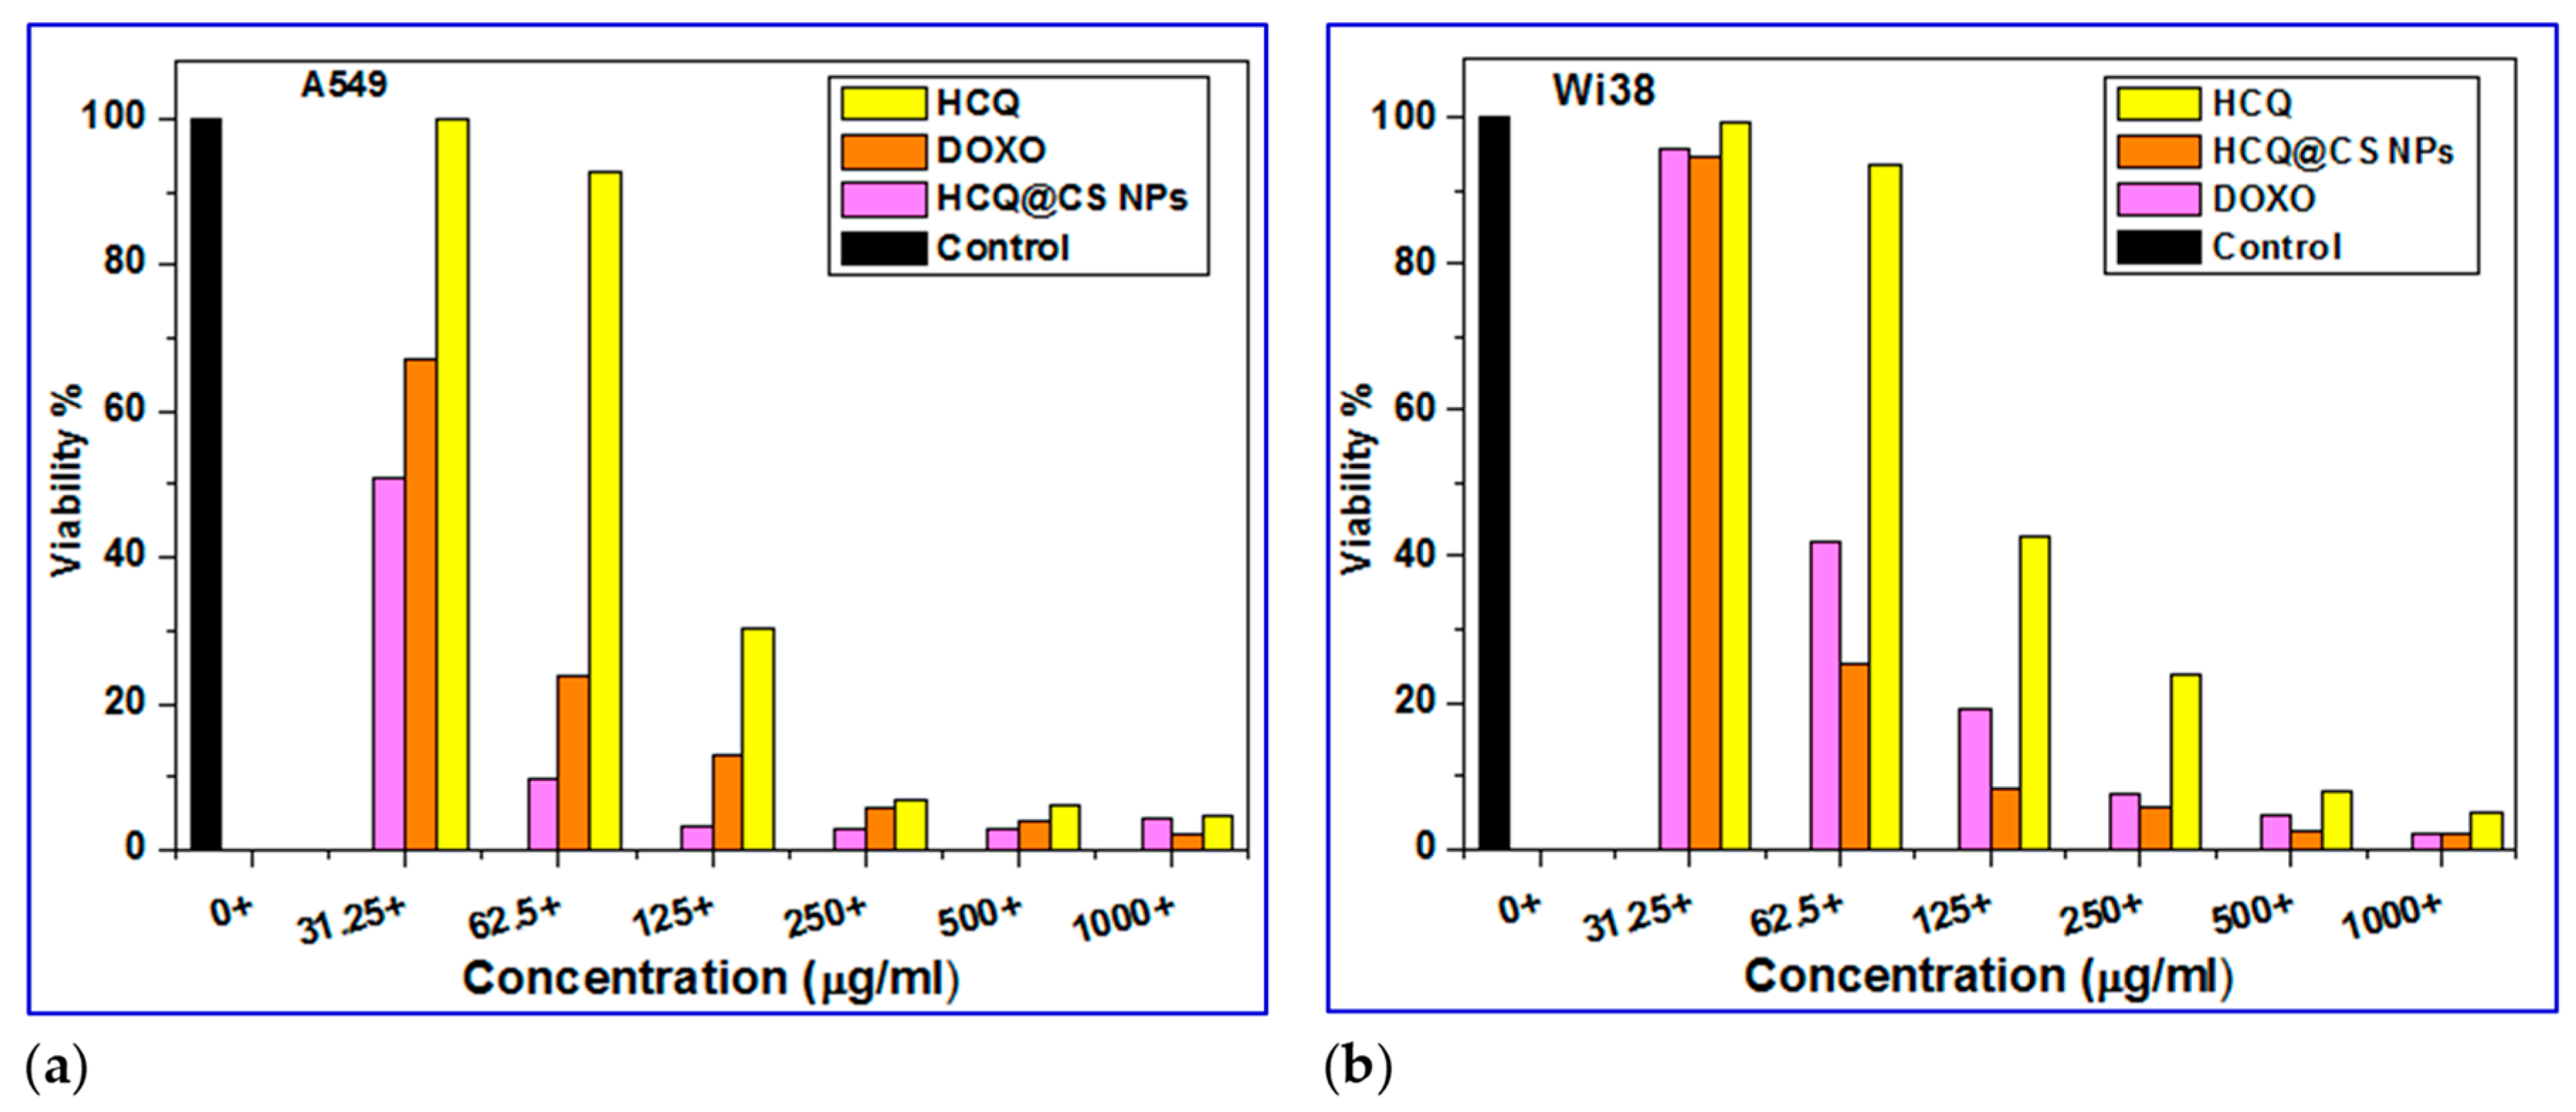
Figure 12.
Morphological changes in a) Wi38 normal cells and b) A549 cancer cells following 24 hours of treatment with control, HCQ, HCQ@CS NPs, and Doxo at 1000 μg/ml concentrations.
Figure 12.
Morphological changes in a) Wi38 normal cells and b) A549 cancer cells following 24 hours of treatment with control, HCQ, HCQ@CS NPs, and Doxo at 1000 μg/ml concentrations.
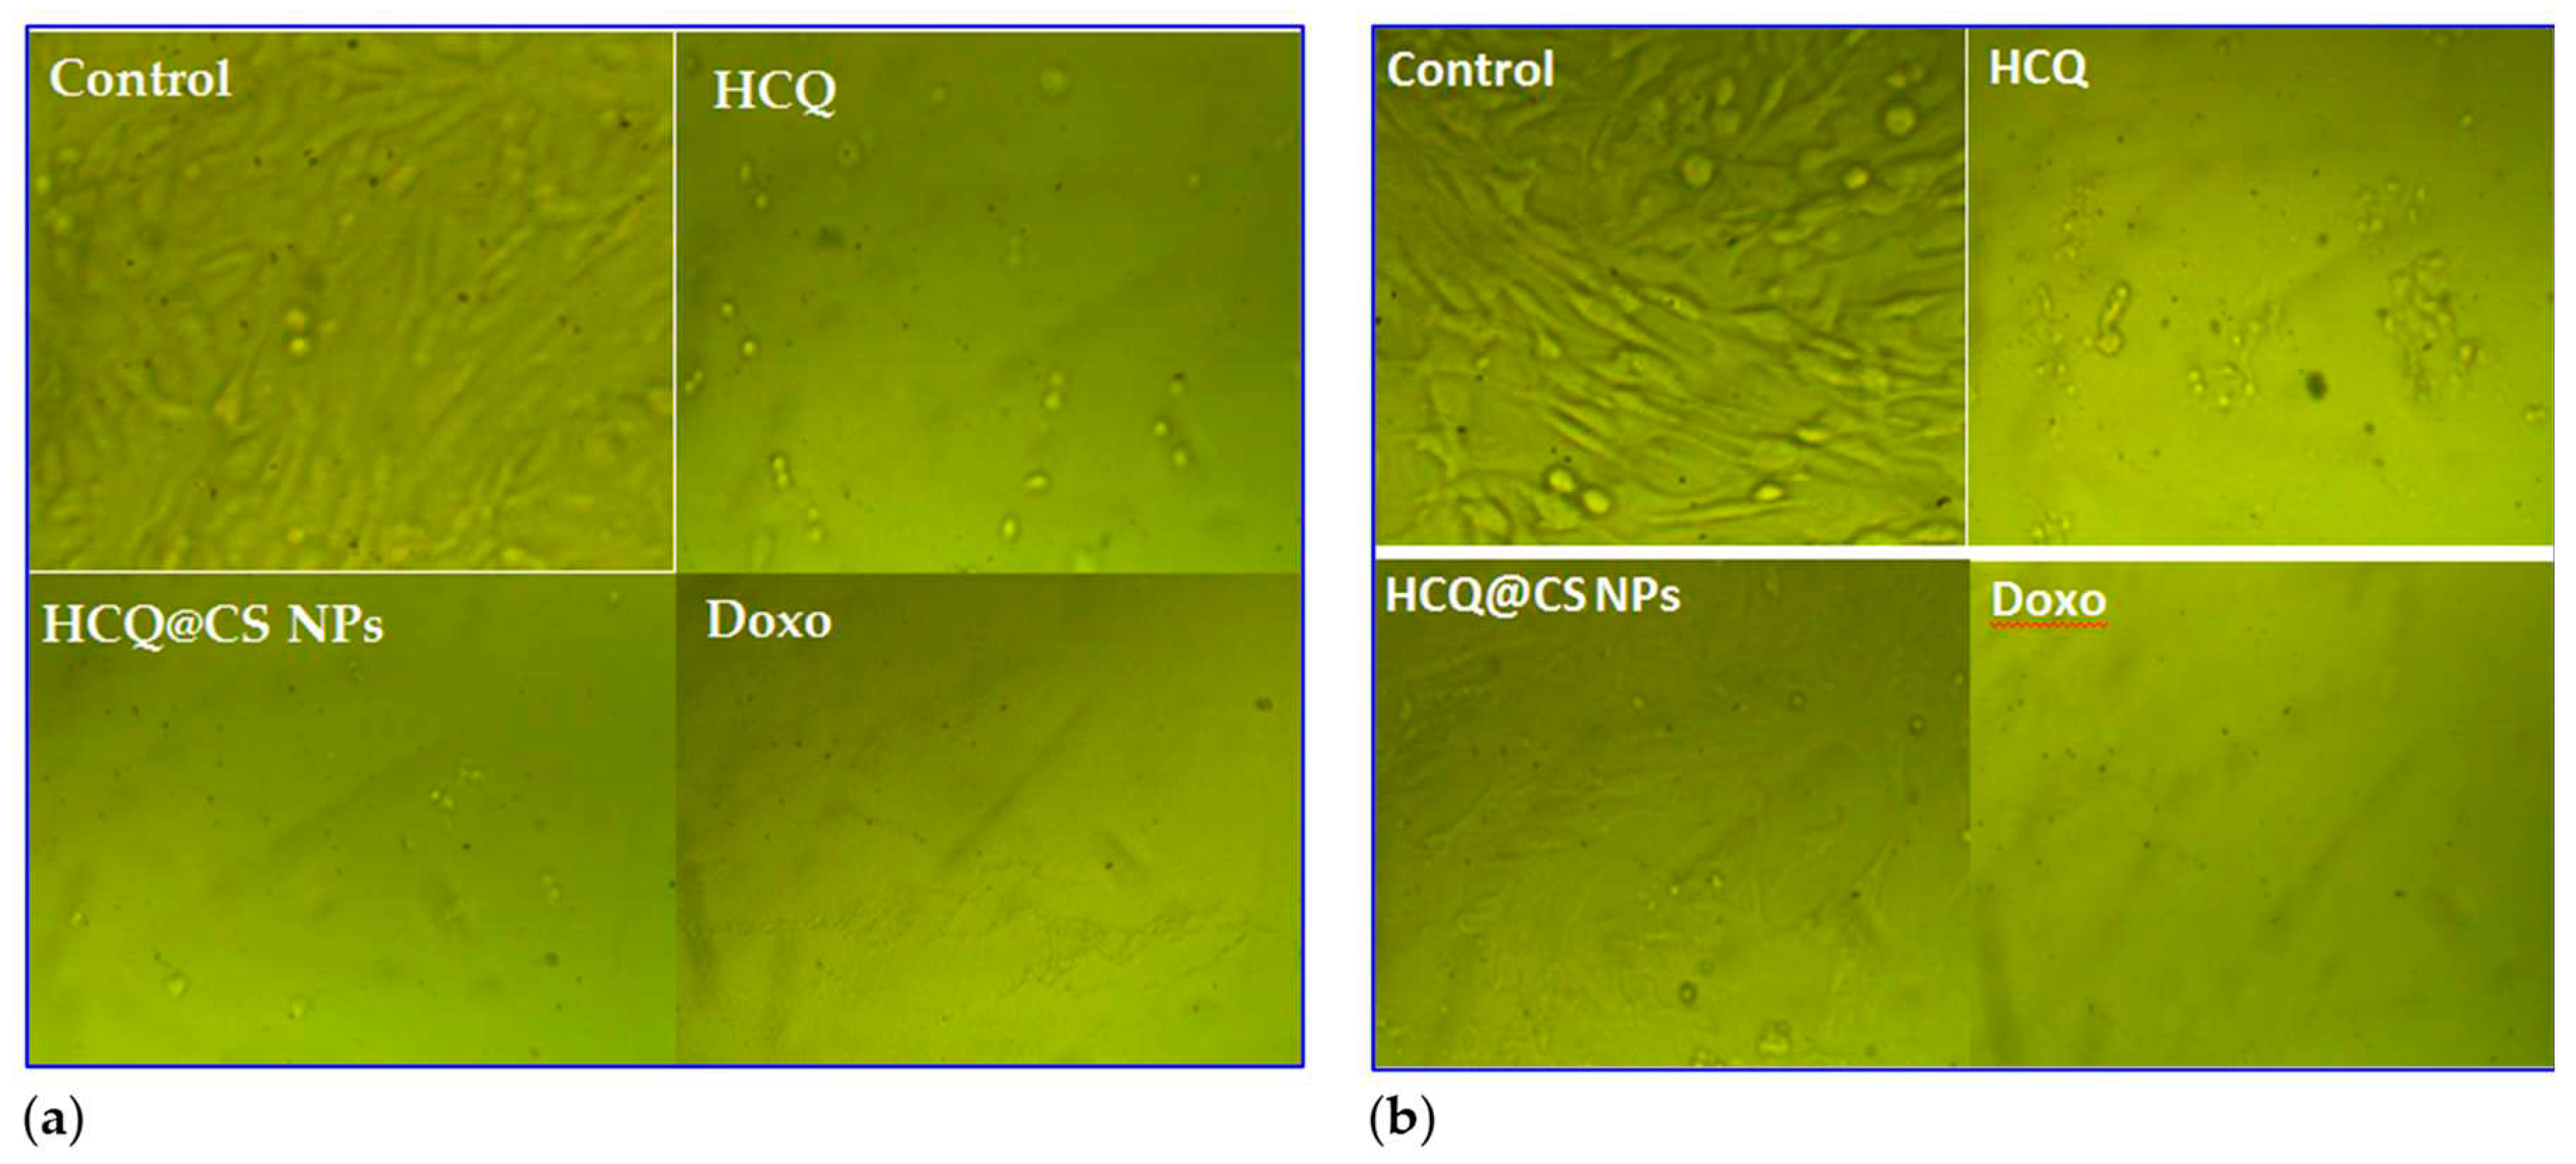
Figure 13.
Mean inhibition zone of the HCQ free drug and its loaded nanoparticles against Gram negative (E. coli and P. aeruginosa) and Gram positive (S. aureus and E. faecalis) bacteria.
Figure 13.
Mean inhibition zone of the HCQ free drug and its loaded nanoparticles against Gram negative (E. coli and P. aeruginosa) and Gram positive (S. aureus and E. faecalis) bacteria.
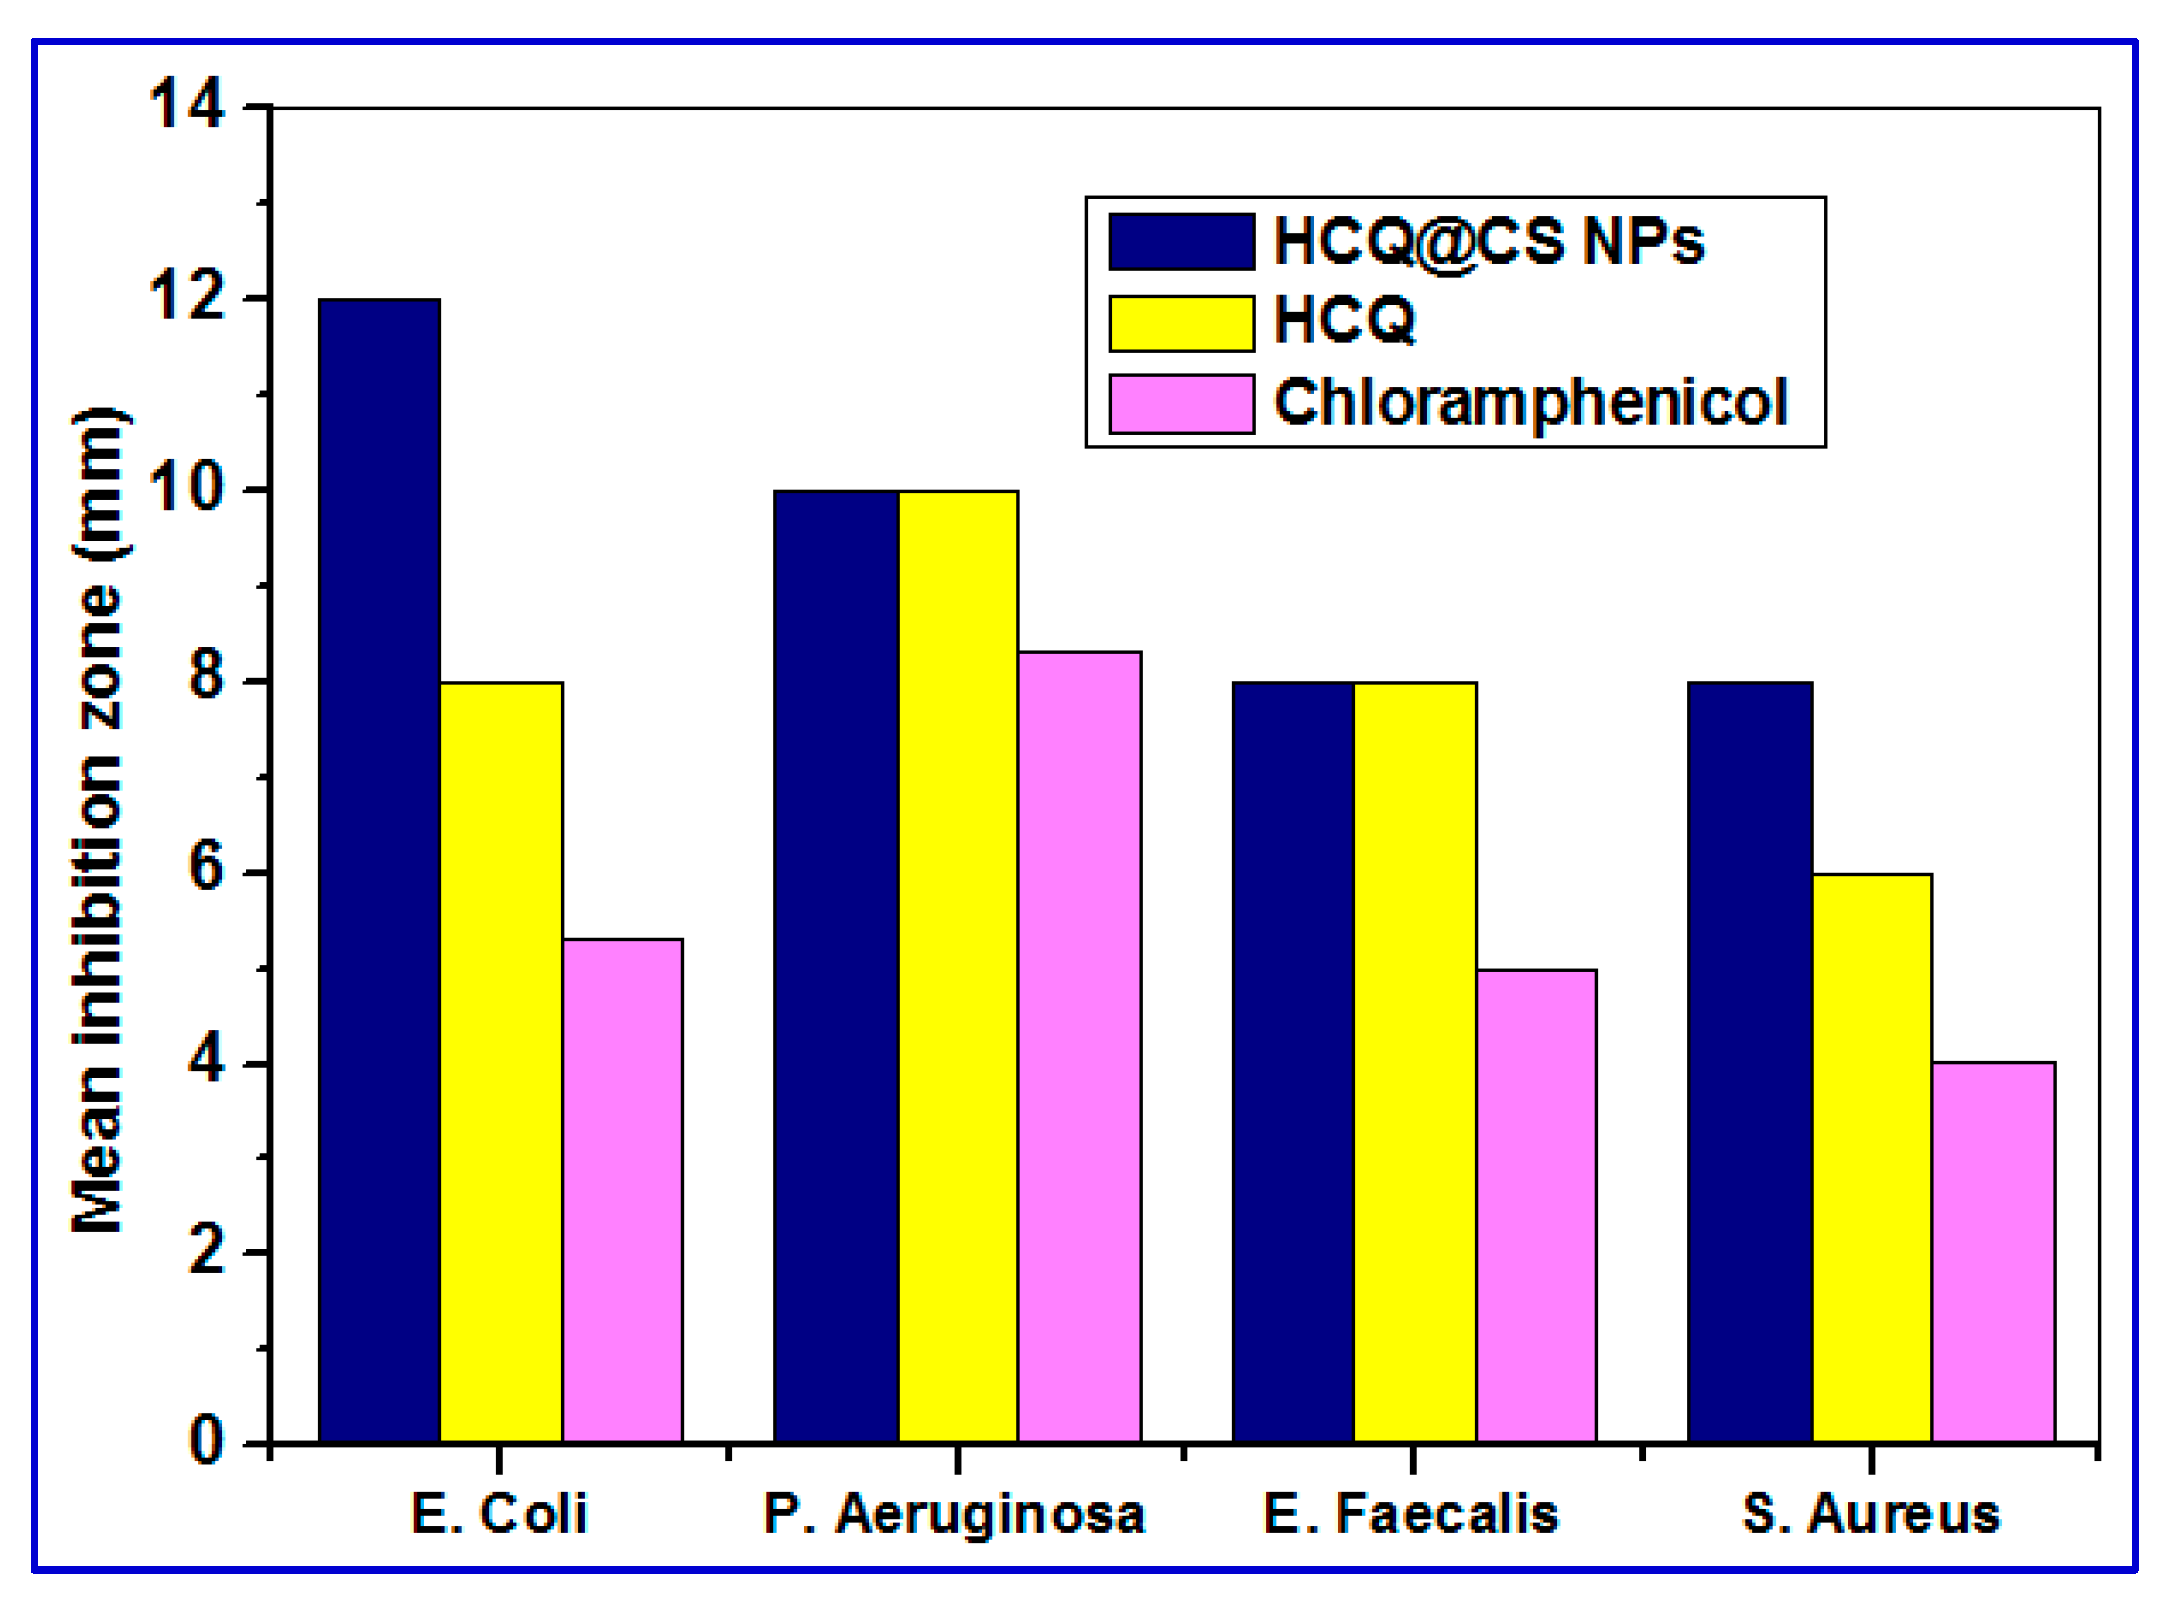
Figure 14.
2D and 3D diagrams of ligand showing its interaction with crystal structure of BSA (4F5S) binding site.
Figure 14.
2D and 3D diagrams of ligand showing its interaction with crystal structure of BSA (4F5S) binding site.
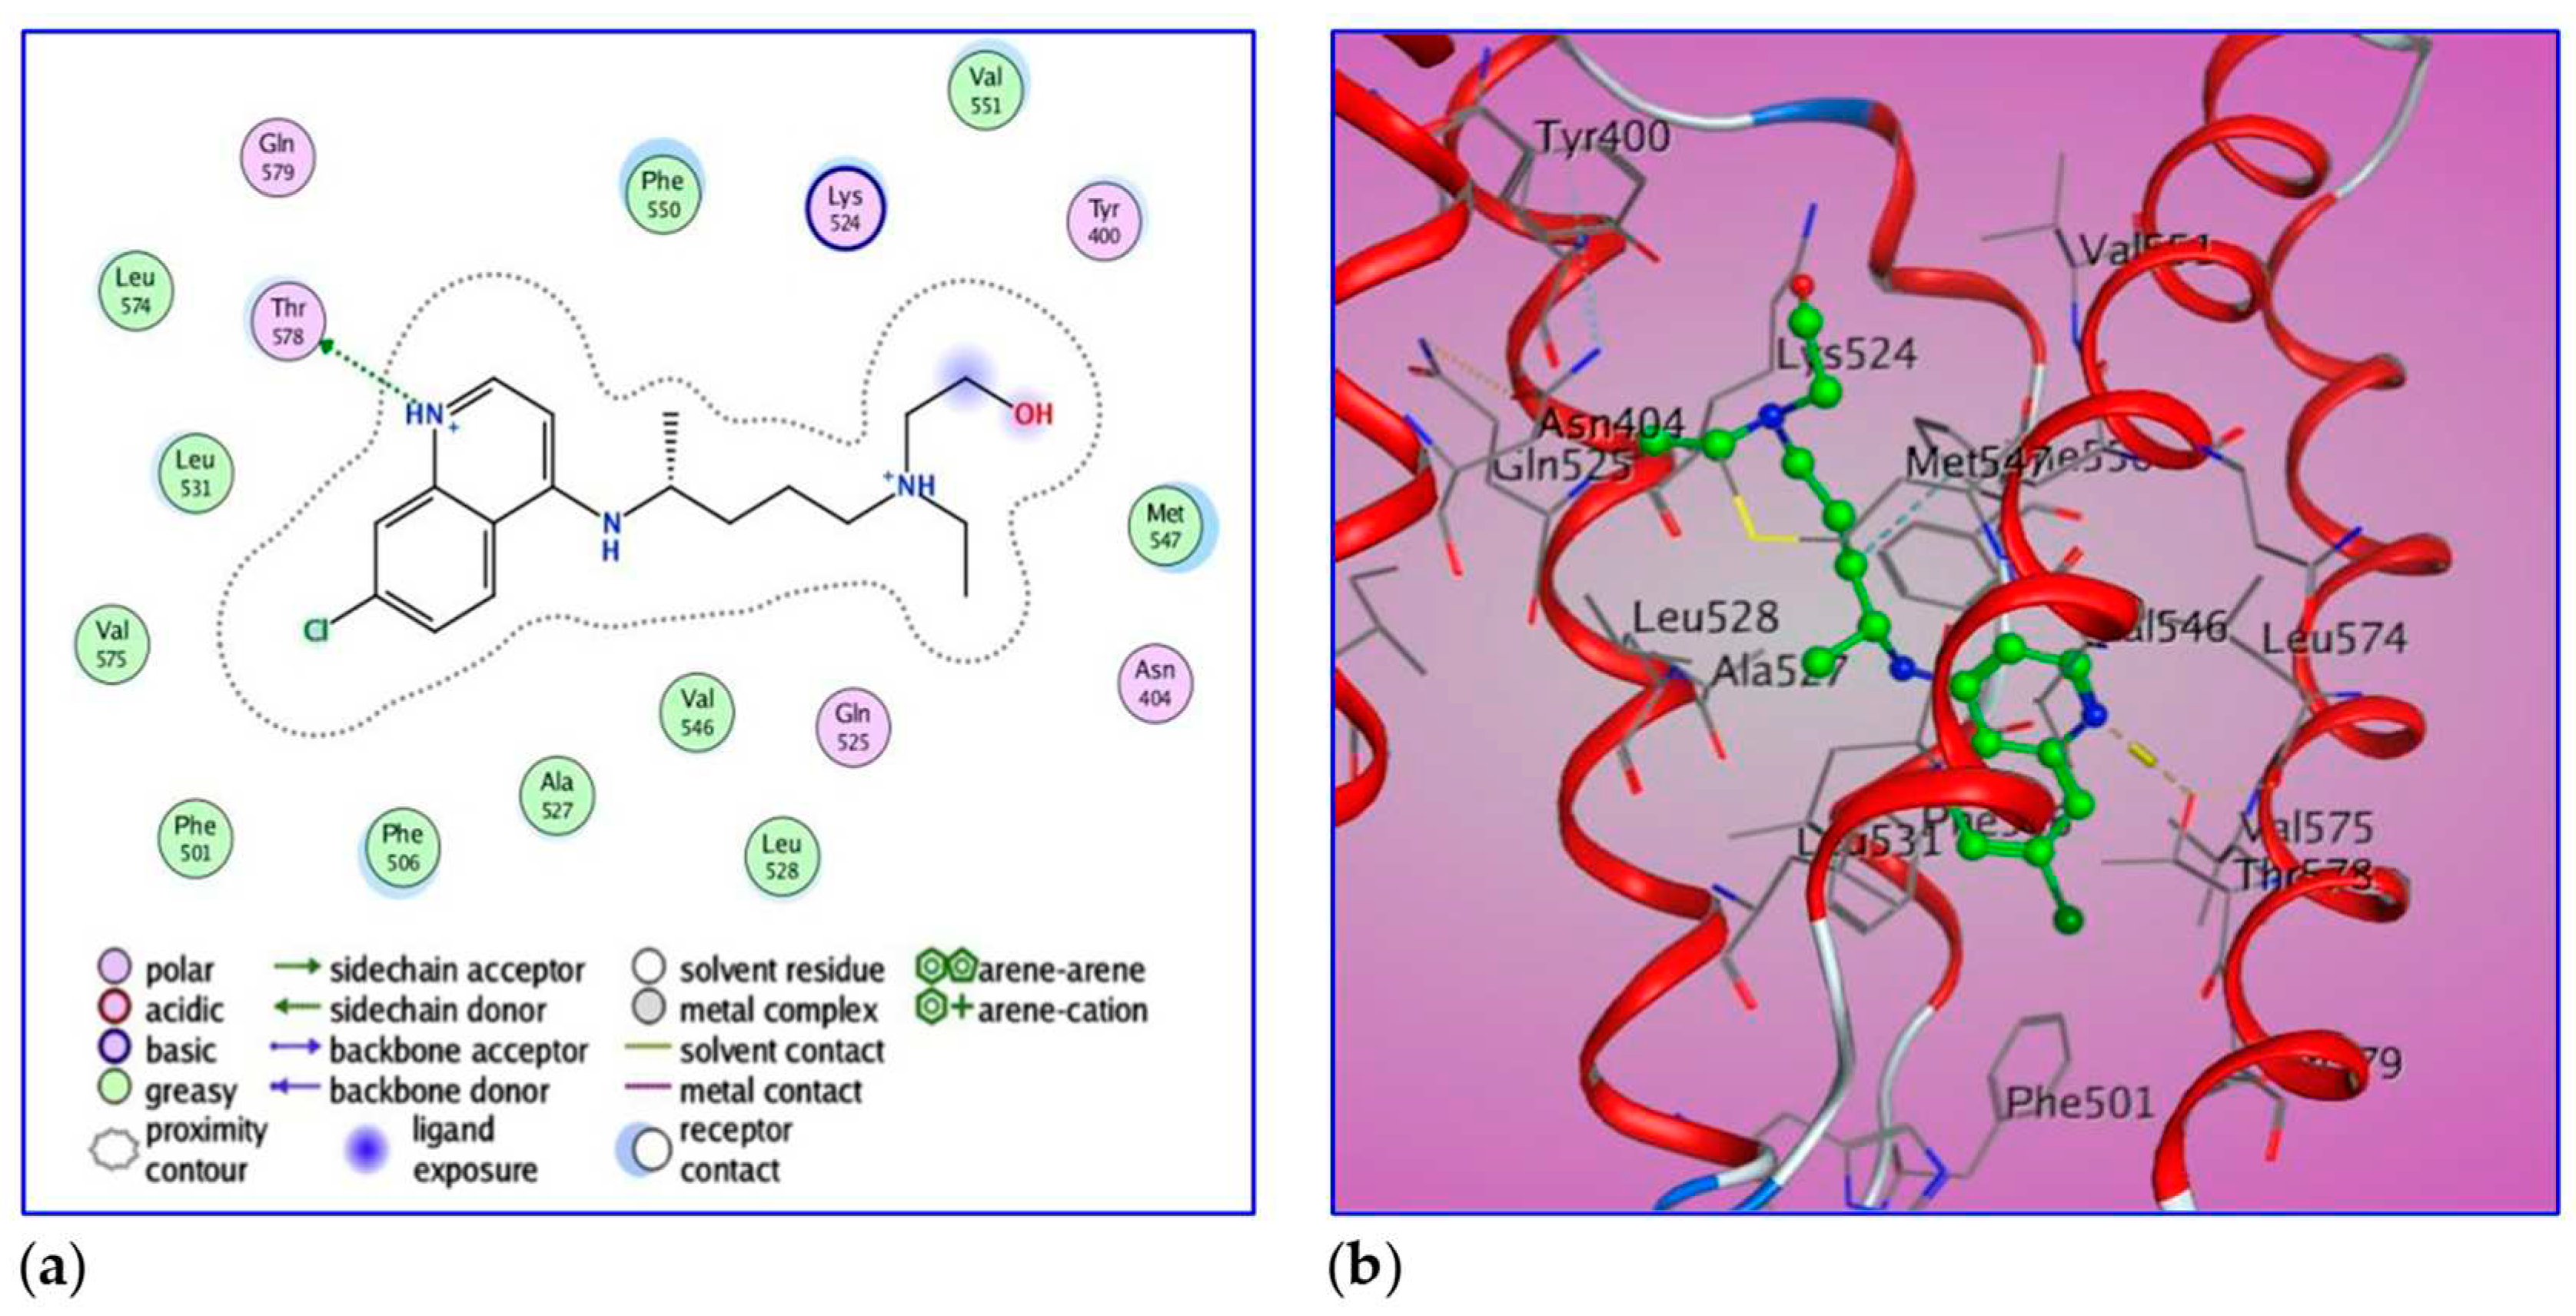
Table 1.
Mean diameter and zeta potential of HCQ and HCQ@CS NPs.
| Size (nm) | PDI | Zeta potential (mV) | |
|---|---|---|---|
| HCQ | 255.7 ± 18.5 | 0.224 ± 0.083 | -16.4 ± 0.4 |
| HCQ@CS NPs | 159.3 ± 7.1 | 0.337 ± 0.101 | +46.6 ± 0.8 |
Table 2.
Quantum parameters for HCQ; M and MM.
| Parameter. |
EHOMO (eV) |
ELUMO (eV) |
IP |
EA |
ELUMO- EHOMO (eV) | Χ (eV) |
Pi (eV) |
η (eV) |
σ (eV-1) |
S (eV-1) |
ω (eV) |
|---|---|---|---|---|---|---|---|---|---|---|---|
| HCQ | +1.46 | +3.42 | -1.46 | -3.42 | 1.96 | -2.44 | 2.44 | 0.982 | 1.018 | 0.509 | 3.037 |
| M | -10.27 | -3.07 | +10.27 | +3.07 | 7.2 | 6.67 | -6.67 | 3.601 | 0.277 | 0.138 | 6.177 |
| MM | -10.15 | -1.78 | +10.15 | +1.78 | 8.36 | 5.97 | -5.97 | 4.183 | 0.239 | 0.119 | 4.261 |
Table 3.
Rate constants, affinities and dissociation constants recorded during the reaction of BSA Q and its nanoparticles, HCQ@CSNPs at 298 K.
Table 3.
Rate constants, affinities and dissociation constants recorded during the reaction of BSA Q and its nanoparticles, HCQ@CSNPs at 298 K.
| First step | Second Step | Over all reaction | |||||||||||
|---|---|---|---|---|---|---|---|---|---|---|---|---|---|
|
k1 [M-1s-1] |
k-1 [s-1] |
Ka1 [M−1] |
Kd1 [10-2M] |
ΔG1 [kJ mol−1] |
K2 [M-1s-1] |
k-2 [s-1] |
Ka2 [M−1] |
Kd2 [M] |
ΔG2 [kJ mol−1] |
Kd [10-2M] |
Ka [M−1] |
ΔG [kJmol−1] |
|
| HCQ@CS NPs | 175±10 | 7.9±0.8 | 22.2 | 4.5 | -7.7 | 4.1±0.2 | 0.4±0.0 | 10 | 0.1 | -5.7 | 0.4 | 244.5 | -13.6 |
| HCQ | 5.9± 0.4 | 3.5±0.6 | 167 | 0.6 | -12.7 | Only one step has been detected | |||||||
Table 4.
IC50 Values obtained for HCQ, HCQ@CS NPs and Doxo from Their MTT Assay Using A549 and Wi38 cells.
Table 4.
IC50 Values obtained for HCQ, HCQ@CS NPs and Doxo from Their MTT Assay Using A549 and Wi38 cells.
| IC50 values1 (μg/ml) | ||
|---|---|---|
| Wi38 | A549 | |
| HCQ | 115±1.4 | 102.21±0.67 |
| HCQ@CS NPs | 66.37±0.51 | 28.57 ±1.72 |
| Doxo | 57.81±0.79 | 50.68±3.52 |
1IC50 values are the mean concentrations of drugs to inhibit 50% of cancer cells (in μM). An average of three replicates is taken and presented as mean ± SD.
Disclaimer/Publisher’s Note: The statements, opinions and data contained in all publications are solely those of the individual author(s) and contributor(s) and not of MDPI and/or the editor(s). MDPI and/or the editor(s) disclaim responsibility for any injury to people or property resulting from any ideas, methods, instructions or products referred to in the content. |
© 2023 by the authors. Licensee MDPI, Basel, Switzerland. This article is an open access article distributed under the terms and conditions of the Creative Commons Attribution (CC BY) license (http://creativecommons.org/licenses/by/4.0/).
Copyright: This open access article is published under a Creative Commons CC BY 4.0 license, which permit the free download, distribution, and reuse, provided that the author and preprint are cited in any reuse.


