
Submitted:
13 May 2025
Posted:
15 May 2025
You are already at the latest version
Abstract
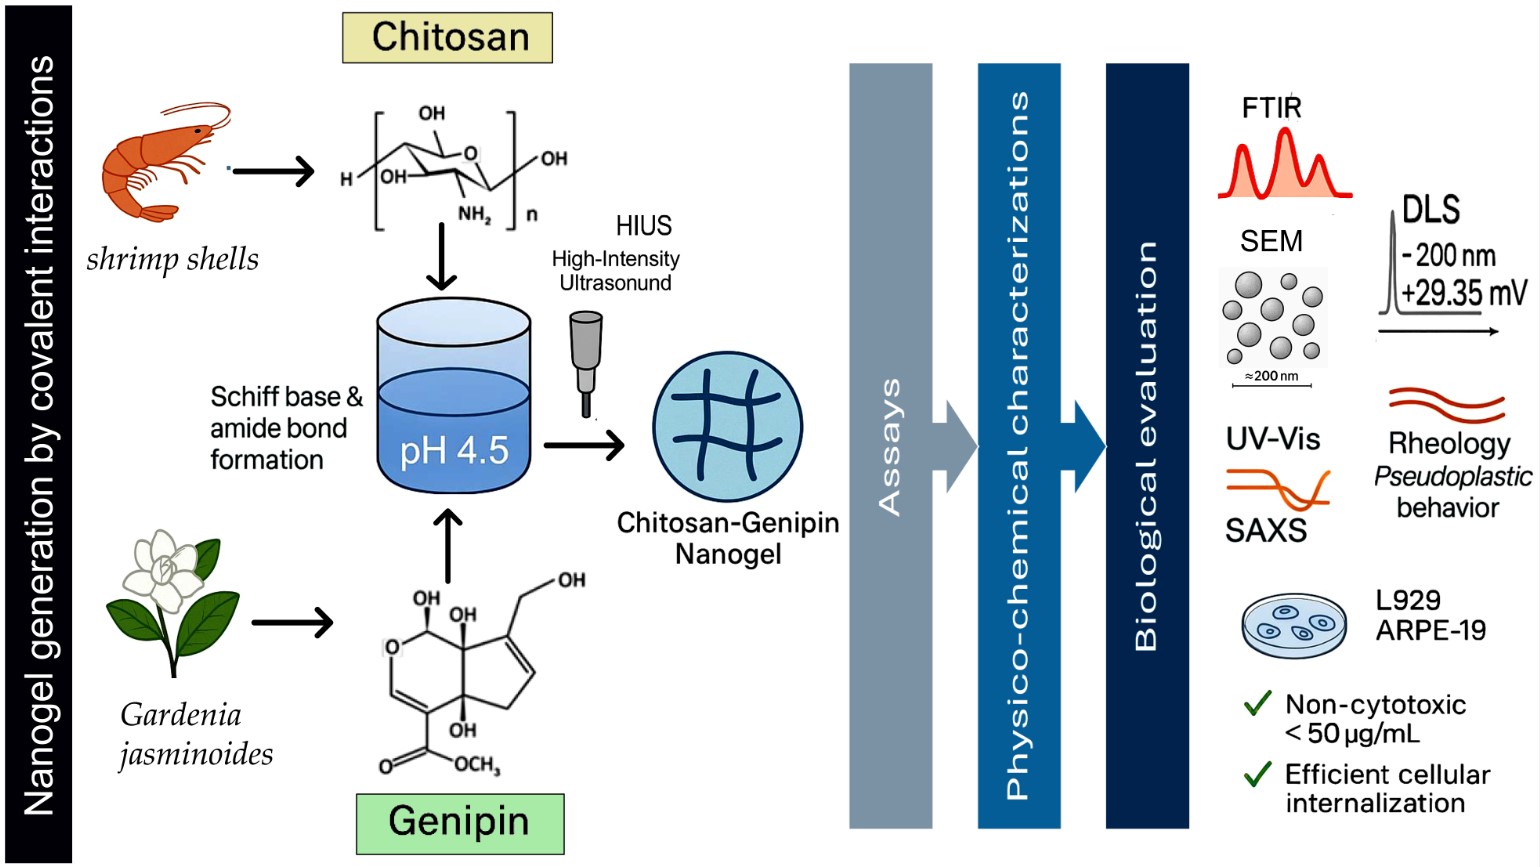
Background: the crosslinking of chitosan (CS) with genipin (GNP) offers a mild, non-toxic strategy to improve the structural integrity and stability of nanogels (NGs). However, generating homogeneous, colloidally stable systems still requires optimisation of parameters such as CS and GNP concentrations to ensure functional performance for cellular uptake. Objectives: To develop and characterise CS-based NGs crosslinked with GNP as a novel platform for targeted delivery at the cellular level. The aim was to optimise NG synthesis and evaluate their physicochemical properties and biocompatibility. Methods: NGs were synthesised under optimised conditions by adjusting the pH of the CS solution, followed by high-intensity ultrasound (HIUS) to achieve disaggregation. Physicochemical characterisation was carried out using UV-Vis spectroscopy, FTIR, dynamic light scattering (DLS), and scanning electron microscopy (SEM). Rheological studies and SAXS analysis assessed structural properties. Biocompatibility was evaluated via MTT assay, and internalisation was monitored by fluorescence microscopy on mammalian cell lines. Results: NG formation was highly pH-dependent, with optimal configuration at pH 4.5, yielding stable, uniformly sized particles (~200 nm, ζ-potential +29 mV). Kinetic modelling showed a sigmoidal formation pattern, suggesting nucleation, exponential growth, and stabilisation. FTIR confirmed covalent bonding between CS and GNP via primary amide bonds and Schiff bases. Rheology indicated pseudo-plastic behaviour, and SAXS revealed a compact network. Biocompatibility assays confirmed non-cytotoxicity below 50 µg/mL and efficient cellular uptake. Conclusions: This study presents a rapid, reproducible protocol for generating colloidally stable, biocompatible NGs suitable for drug delivery and biomedical applications requiring cellular internalisation.
Keywords:
chitosan
; genipin
; nanogels
; biocompatibility
; drug delivery
1. Introduction
Nanogels (NGs) are three-dimensional nanometric-sized entities formed by cross-linked polymeric networks that emerged as an innovative technology in the field of controlled drug release. NG have the ability to encapsulate and release therapeutic compounds in a sustained manner in response to specific stimuli, such as pH or temperature changes. These properties make NG interesting tools for biomedical applications, particularly in the design of targeted therapies. Furthermore, their high colloidal stability, biocompatibility, and biodegradability reduce the risks of adverse side effects [1,2,3].
In this context, chitosan (CS) stands out as a versatile biopolymer thanks to its antimicrobial properties, mucoadhesive capacity and biodegradable nature. Derived from the partial deacetylation of chitin, CS is composed of glucosamine and N-acetylglucosamine units linked by β(1–4) bonds. Its limited solubility in neutral media and its low stability restrict its direct application under physiological conditions [4,5]. Although, these polysaccharides can be adequate for forming new structures via chemical cross-linking, forming more stable three-dimensional networks. Particularly, genipin (GNP), a natural cross-linking agent derived from the evergreen shrub Gardenia jasminoides, has attracted attention as a promising alternative to other toxic compounds such as glutaraldehyde [6].GNP forms stable covalent bonds with the amino groups of CS, whose consequences is the generation of a particular blue colour, as well as a red fluorescence that facilitates experimental monitoring during NGs formation process [7,8].
The CS-GNP cross-linking mechanism is highly dependent on CS’s pH [9]. At pH < 6, the primary amino groups (–NH2) in the glucosamine units CS´s chain react nucleophilically with GNP to form amide bonds, generating dense polymeric networks of high stability. The cross-linking reaction has two steps. Firstly, the opening of the GNP ring by nucleophilic attack carried out by the nitrogen of a primary amino group of CS. This attack typically occurs on the C-3 carbon of GNP, breaking the GNP ring and originating an intermediate that retains a transient aldehyde (–CHO). This first step generates a bond (via the C–N bond) and forms a heterocyclic compound. In addition, the ring opening initiates the possibility of subsequent polymerization or oligomerization reactions of GNP. The second step is the nucleophilic substitution of the remaining ester group in GNP molecule, after the ring has been opened and the formation of a bridge between two different points of the same chain or different chains of CS. Because of these two steps, covalent crosslinks are formed between the polymeric chains, generating a three-dimensional network. At pH > 7.5, GNP self-polymerizes before reacting, creating less dense but more flexible networks [10,11]. Such differences allow the design of NG tailored to the needs of each application [12,13].
In this context, the main objective of this contribution was to obtain CS-GNP based NG with the required physicochemical and structural properties considering pH variations under mild and controllable conditions. To this end particle size distribution, colloidal stability, ultrastructure and intramolecular organization were pertinently determined. As these NGs will be used as delivery target system, this work culminates with a cell assay to visualize the destiny of these entities once in contact with the biological material.
2. Materials and Methods
2.1. Reagents
CS (192 kDa) was from Parafarm® (Saporiti S.A.C.I.F.I.A., Buenos Aires, Argentina; Ref. # 11017A). GNP >98% purity, (CAS 6902-77-8) (sc-203057A) and Trypan Blue powder (CAS 72-57-1) (sc-216028), were purchased from Santa Cruz Biotechnology, Inc. Dallas, Tx, USA). Glacial acetic acid (≥ 99 % purity) and crystal violet were sourced from Merck (Darmstadt, Germany). Foetal Bovine Serum (FBS) was purchased from Internegocios S.A. (Buenos Aires, Argentina). 3-(4,5-dimethyl-thiazol-2-yl)-2,5-diphenyl-tetrazolium bromide (MTT) was from Sigma-Aldrich Co. (St. Louis, MO, USA). Dulbecco’s Modified Eagle’s Medium (DMEM), DMEM/F-12, Trypsin-EDTA 0.5% (10×), Antibiotic-Antimycotic (penicillin, streptomycin, amphotericin B, 100×) and GlutaMAX™-I (L-alanine-L-glutamine, 100 ×) were all obtained from Gibco, Thermo Fisher Scientific (Waltham, MA, USA). Any other chemicals were analytical grade. All aqueous solutions used were prepared from deionized Milli-Q water (Millipore, USA). Cell lines used included murine fibroblasts L929 (ATCC®CRL-2648 TM) and human retinal pigment epithelial cells ARPE-19 (ATCC®CRL-2302 TM).
2.2. Generation of CS-GNP NG
CS was dissolved in 1% (v/v) acetic acid under constant stirring at room temperature for 24 h [14]. Then, the CS solution was adjusted to 3.6, 4.5 or 5.5 by adding 0.1 M NaOH dropwise, with continuous pH monitoring. In parallel, a GNP solution diluted in absolute ethanol was prepared and kept protected from light at -20°C until use [15,16]. CS and GNP solutions were mixed in a 1.5 mL Eppendorf® by first placing the CS solution (already adjusted to the desired pH) at 37 °C and adding the GNP solution dropwise while maintaining constant stirring (300 rpm). The total volume was defined according to the ratio CS:GNP (Table 1) to compare both different pH values for CS solutions (3.6, 4.5, 5.5). In all cases, the mixture was left to react in the dark, at 37°C 24 h and with constant stirring (350 rpm). Then after samples were subjected to high intensity ultrasound (HIUS) (Polystat, Cole-Parmer, Vernon Hills, IL, USA) for 5 min with a maximum net power output of 750 W at a frequency of 20 kHz and 20% of amplitude. This process was carried out to homogenize the particle size and disaggregate possible aggregates mediated by polysaccharide chains as informed previously [12]. Remarkably, the development of the characteristic blue colour was taken as an indicator of the formation of covalent bonds between CS and GNP, but not as an indicator of NG the formation. All samples used were stored for up to 72 h at 4°C.
2.3. NG Formation Monitoring
2.3.1. Spectral Analysis
NG generation and its temporal evolution were assessed with a PolarStar® plate reader (Omega, BMG Labtech, Ortenberg, Germany) equipped with temperature control (37°C) and orbital agitation. Aliquots of each sample (200 µL) were dispensed into clear-bottom, 96-well microplates (Greiner Bio-One). A reagent blank1 % (v/v) acetic acid: absolute ethanol, matching the solvent ratio used for polymer and cross-linker dissolution was included on every plate. Full absorbance spectra (220–800 nm) were acquired at 0 h and 24 h for all samples as well as for single-component controls (CS or GNP) to exclude potential spectral interferences. The spectral scan was repeated at 48, 96, and 120 h. Plates were stored at 4°C to inhibit further reaction between readings.
Formulations exhibiting the characteristic chromophore centred at ≈ 600 nm, indicating covalent CS–GNP cross-link formation [17,18]. Time-resolved kinetic was assessed, absorbance at 600 nm was recorded every 10 min for 24 h at 37 °C under orbital shaking and in the absence of ambient light. Independent single CS and single GNP solutions wells were run in parallel as negative controls. The resulting time courses were subsequently fitted to pseudo-first-order and sigmoidal kinetic models to quantify the cross-linking dynamics.
2.3.2. Kinetics Approach
To analyse the evolution of absorbance as a function of time (A vs. t), two approaches were evaluated:
Four-Parameter Sigmoidal Kinetics with the application of Eq. (1):
where A(t) is the absorbance at 600 nm at time t, A min and A max represent the lower and upper limits of the absorbance, k is the rate constant associated with the exponential phase of the curve and t0 is the time at which the slope was maximum (inflection). This model captures processes with an induction phase and exponential growth before reaching a plateau.
First Order Exponential Kinetics, which is described by the Eq. (2):
where A∞ is the absorbance assumed as the asymptotic maximum value and k is the first-order rate constant. It describes exponential growth processes with saturation.
The goodness of fit (R²) and the consistency with the possible reaction mechanisms were evaluated to select the most representative model. If the experimental data fit better with the first-order exponential equation, the process started speedily and then slowed down as it approaches the maximum value, A∞. If the experimental data fit better with the 4-parameter sigmoid equation, there was a lag phase, indicating that the formation of the NG required a nucleation time before the process accelerates (growth step) [19,20].
2.3.3. Fourier Transform Infrared (FTIR)
To verify the formation of covalent bonds between CS and GNP, FTIR spectroscopy with ATR module (FTIR-ATR Nicolet IS20, Madison, WI, EE. UU.) was used with a resolution of 4 cm⁻¹, recording 32 scans per spectrum in the range of 4000–500 cm⁻¹. The NG samples were previously freeze-dried, then placed directly on the ATR crystal. A 10-well plate was used to measure the cross-linking of CS and GNP. Control measurements were performed using CS and GNP individually under the same experimental conditions [21].
2.4. NG Characterization
2.4.1. Particle Size Distribution and ζ-Potential
The average hydrodynamic diameter (Ho) and polydispersity index (PDI) of NGs were determined by Dynamic Light Scattering (DLS), using a Litesizer 500 (Anton Paar, Austria). NG samples were diluted in Milli-Q water (1:100) to avoid multiple scattering effects and measured in UVette Low Volume cuvettes at 25 °C. At least, three runs for each sample were recorded, with at least 50 accepted readings [22,23]. The intensity distribution is determined using a multi exponential function (CONTIN) to fit the correlation data. In this type of analysis, the presence of more than one family of particle sizes is considered. The ζ potential was obtained by means of the same equipment, in an Omega cuvette (Mat. No. 225288) by applying a voltage of 200 V and measuring the electrophoretic mobility of the particles at 25 °C. The conversion of the measured electrophoretic mobility was performed using the Henry equation [24].
2.4.2. SEM
The morphology of the NG was characterized by SEM. Aliquots of the samples were taken and dried with a controlled flow of inert gas (nitrogen) on slides. Subsequently, the samples were covered with a thin layer of gold. The analysis was performed on a Carl Zeiss NTS SUPRA 40 SEM microscope (Oberkochen, Baden-WürtteS2erg, Alemania) operating at 3 kV. The ultrastructural features of the particles were analysed using magnifications between 10× and 200×.
2.4.3. Rheological Analysis
The viscoelastic properties of NG suspensions were evaluated using an S3R301 rotational rheometer Anton Paar (Graz, Steiermark, Austria) (equipped with a 50 mm diameter cone-plate geometry (CP50-1/TG). The distance between the cone and the plate (gap) was set at 0.099 mm, which determined the sample volume analysed. The temperature was kept constant at 25 °C by a thermostatic control system.
The mechanical characteristics, by the viscoelastic storage (G′) and loss (G′′) moduli as a function of angular frequency (ω) were measured. The damping factor (tan δ = G”/G’) was calculated as a function of frequency, with the aim of quantifying the relationship between the NG elastic and viscous behaviour. This parameter allowed to characterize the internal resistance of the system to deformations applied at different time scales.
On other set of experiments, the variation of the apparent viscosity as a function of the shear rate (γ̇) was determined. The rheological behaviour under flow was analysed by applying a shear stress gradient in the range of 0 to 300 s⁻¹. This analysis allowed us to identify the shear-thinning phenomenon characteristic of these NG suspensions. The data obtained were fitted to the Power Law according to Eq. (3):
where τ is the applied shear stress (Pa), K is the consistency coefficient, γ̇ is the shear rate (s⁻¹) and n is the flow index, which indicates the degree of shear thinning.
2.4.4. Fluorescence Spectra
To study the characteristic fluorescence emission of CS-GNP NGs, a spectrophotometer Thermo Spectronic AMINCO-Bowman, Series 2(Madison, WI, USA) was used. NG samples were placed in quartz cuvettes with a 1 cm optical path length. An excitation scan was performed in the range of 300–550 nm, recording the emission between 350–700 nm. Special attention was paid to the signal in the red emission region (580–630 nm), described in the literature for the CS-GNP covalent complex formation [25].
All measurements were performed at 25 °C and single CS or single GNP solutions were used as controls, which were measured separately under the same instrumental conditions.
2.4.5. Small Angle X-ray Scattering (SAXS)
Analyses were performed using a SAXS Lab Ganesha system (Xenocs) equipped with a Cu Kα X-ray source (λ = 0.154 nm), a PILATUS 300K 2D detector, and a sample-to-detector distance of 1125 mm. The I(q) vs q curves were obtained from the two-dimensional images through azimuthal integration. All data processing and analysis were carried out using Python 3.11 with the NumPy, Pandas, Matplotlib, and SciPy libraries. The data were analysed on a double logarithmic (log-log) scale, covering different regions of the scattering vector (q) (Figure S1).
Complementary theoretical models were applied to describe the NG structure across different spatial scales.
In the low-q region (q < 0.02 nm⁻¹), the Guinier model was applied [26,27] with the aim of estimating the radius of gyration (Rg) using the Eq. (4):
The fitting was performed over the interval q² = 0.00008 to 0.00024 nm⁻² (corresponding to q between 0.0089 and 0.0155 nm⁻¹). The validity of the model was assessed using the classical condition q*Rg < 1.3, as a criterion to ensure that the analysed region corresponds to the Guinier region [28].
The Debye–Bueche model was also applied, which follows the equation Eq. (5) [29]:
where the correlation length (ξ) represents the spatial scale over which density fluctuations are preserved within the NG.
For the intermediate-q region (0.02 ≤ q < 0.1 nm⁻¹), two complementary approaches were applied. First, a power-law model was used Eq. (6) [30,31]:
where the exponent m characterizes the degree of network compactness: values close to 1 indicate dense and interconnected structures, while values below 0.5 reflect open and heterogeneous networks [30,32].
2.5. NG in Biological Systems
2.5.1. Cell Culture Conditions
Murine fibroblasts L929 and human retinal pigment epithelial ARPE-19 were maintained in a 37°C incubator with 5% CO₂ and high relative humidity (95–98%).
Culture conditions: ARPE-19 and L929 cell lines were maintained in DMEM medium with 10% FBS and penicillin/streptomycin (100 U/ml and 100 ug/ml, respectively). Cells were subculture upon reaching 70–80% confluence. For assays in 96-well plates, the seeding density was 1 × 10⁴ cells/well for L929, and 2 × 10⁴ cells/well for ARPE-19.
2.5.2. Cell Metabolic Activity Determination
To evaluate the cytotoxicity of the NG, the MTT (3-(4,5-dimethylthiazol-2-yl)-2,5-diphenyltetrazolium) assay was performed. Cells were seeded in 96-well plates and allowed to adhere for 24 h. Subsequently, the culture medium was replaced with fresh medium containing varying concentrations of NGs (5–150 µg/mL). The assay was conducted in accordance with the ISO 10993-5 standard for biocompatibility testing [33].
2.5.3. Cellular Internalization
The uptake of NG by ARPE-19 cells was studied by an Olympus IX71 microscope (Olympus Inc., Japan). Intracellular FITC-NG and nuclei were observed using an objective 60×/1.43 oil (FITC: λex: 543/20 nm, λem: 593/40 nm; DAPI: λex: 350/50 nm; λem: 460/50 nm), taking advantage of the intrinsic fluorescence of the CS-GNP complex (λex: ~596 nm and λem: ~620 nm) [34]. ARPE-19 cells were cultured in 24-well plates with sterile coverslips. After reaching 60–70 % confluence, the NG S2 suspension (30 µg/mL) was added at different times until completing 24 h of incubation (5 min, 30 min, 4 h, 6 h and 24 h). After the incubation time, they were rinsed three times with PBS to remove excess non-internalized NG. Cells were fixed with 4% paraformaldehyde/4% sucrose (PFA-S) in PBS for 20 m. Then, nuclei were counterstained with the DAPI fluorescent probe. Finally, the coverslips were washed with PBS and mounted with 2.4% mounting medium (mowiol). For image analysis, Fiji (ImageJ-based software, NIH, version v1.54f) was used to quantify the mean fluorescence intensity per cell by manually delineating cell boundaries. To account for differences in cell size, the fluorescence values were normalized using an area correction factor. Final intensity values were reported as the average per cell for each treatment. Image contrast and brightness were uniformly adjusted across all images using Adobe Photoshop 8.0.1. (San José, CA, USA: Adobe Systems Incorporated).
2.6. Statistical Analysis
For all tests, triplicates (n = 3) were used, unless otherwise stated. Statistical analysis was performed using GraphPad Prism 8.3.0 (San Diego, CA, USA). Data was subjected to analysis of variance (ANOVA) and Kruskal-Wallis’ test. Means comparisons were subjected to post-hoc Mann-Whitney test (p ≤ 0.05) or Tukey (p ≤ 0.05).
3. Results and Discussion
3.1. NG Construction and Kinetics of Formation
Firstly, visible spectra were obtained to identify a specific absorbance peak at λmax = 600 nm. [7] for each one of CS-GNP NG considered in these assays, which were showed in Table 1. This phenomenon was linked to the formation of Schiff bases, responsible for the final stability of the polymer network after GNP reacted with –NH2 groups of CS. Among the samples examined, S1, S2 and S3 showed the characteristic maximum at λ = 600 nm (Figure 1, Figure S2), indicating that NG formulation was adequate as linked GNP absorbs at this wavelength [35].
In other set of experiments, the variation of O.D. at λ = 600 nm was registered during 24 h. As an example for the reader, the O.D. vs. time curves for samples S1, S2, S3 are shown (Figure 2) since they present different kinetics behaviours, which was evident with simple observation.
Kinetics models were applied to the experimental data to determine parameters describing NG formation: Sigmoidal Kinetics (SK) (Figure 2A) and First Order Exponential (FOE), (Figure 2B) [9,20]. All kinetic parameters obtained by applying the specified models are summarized in the Table 2. First of all, it is worth to mention that both, SK and FOE showed high R² values. However, the SK presented a better correlation for the exponential phase, capturing the transition more accurately. The FOE model does not appear to fit correctly to the initial phase, which is particularly notorious for S2 and S3. The first order fitting underestimates the initial rate, which coincides with the results obtained in the rate comparison. In the plateau phase, both models converge and predict similar values at maximum absorbance. Therefore, we consider that the formation kinetics of CS-GNP NGs has sigmoidal behaviour with 3 well-defined phases. A lag-phase followed by accelerated growth and then stabilization, the four-parameter sigmoidal equation is the most suitable one.
As summarized in Table 2, sample S1 exhibited the lowest NG formation rate determined as the slope (O.D./min, with units of t-1), whereas S3 displayed the highest. These findings support the role of the CS’s pH as a key determinant in the kinetics of NG formation, in alignment with recent reports on the progression of CS-GNP cross-linking [9].
3.2. Chemical Groups Interaction
The chemical groups involved in the chemical interactions contributing to NG formation were investigated through the analysis of their FTIR spectra. Figure 3A shows the comparative FTIR-ATR spectra of GNP, CS and NG formulations for S1. For single CS and GNP, the characteristic bands previously reported were identified [21]. When compared with S1, notable changes were observed in the regions associated with amino (-NH₂), hydroxyl (-OH), and amide (-CONH₂) type bonds, indicating the formation of covalent bonds between CS and GNP [36,37,38]. In the region of 3500–3200 cm⁻¹ (Figure 3C, see box I), mainly attributed to N–H and O–H stretching, a decrease in intensity was recorded for S1 with respect to CS. This change is related to the consumption of –NH₂ and –OH groups of CS due to its reaction with GNP, which reduces the proportion of free groups available [36]. Additionally, it may involve the formation of internal hydrogen bonds in the new covalent network [37]. In the region of 1800–1200 cm⁻¹ (Figure 3B), three zones (boxes I, II and III) relevant for the confirmation of CS–GNP cross-linking are distinguished. In zone I (~1650–1600 cm⁻¹). The band associated with the C=O stretching (Amide I) exhibited a shift towards ~1640 cm⁻¹ and a higher intensity in S1 compared to CS, evidencing the formation of new amide bonds [38]. In box II (~1560 cm⁻¹), a more defined band was for observed in the NG, which was absent or very faint in CS, attributed to Amide II and/or Schiff bases (C=N) generated by the reaction of GNP with primary amino groups [37]. Finally, in box III (~1420–1370 cm⁻¹), variations in the CH₂/CH₃ deformation bands and vibrations of the polymer ring were detected, suggesting changes in the conformation of the chain and its degree of cross-linking [40]. Together, these shifts and new signals in corroborate that GNP reacts covalently with CS, forming amide bonds and Schiff base-type structures [36,37,38]. Furthermore, the lower intensity in the N–H/O–H region (3500–3200 cm⁻¹) reinforces the hypothesis that a significant fraction of the functional groups is transformed into cross-linking sites. These results agree with those reported in the bibliography for CS-GNP hydrogels [21,36,37,38]. Finally, the vibrational shifts detected in the FTIR spectra provided evidence of covalent bond formation associated with crosslinking, thus supporting the successful formation of NG.
3.3. Particle Size Distribution, PDI and ζ-Potential
The obtained size distribution profiles, represented by both intensity and volume-weighted measurements, revealed distinct behaviours among the different samples (Figure 4). Sample S1 displayed a bimodal distribution, with a minor population peaked at ~50 nm and a major peak near 800 nm. The volume-weighted graph shows that the smaller population accounts for a significant percentage, suggesting the coexistence of a majority of nanometric particles with a lower amount of larger NG or aggregates. S2 showed two dominant peaks in particle size distribution expressed in intensity, one peak detected at 10 nm and a dominant population centred at ~200 nm. Particle size distribution expressed in volume showed the same pattern. S2 NG fell within the nanometric range and could be considered acceptable depending on the specific application. Lastly, S3 presented a clear wide distribution with one population centred at 200 and limits determined between 50 and 900 nm. The analysis of volume expressed particle size, confirmed the wide particle size distribution with two defined peaks at 90 and 700 nm and limits stablished between 50 and 900 nm. This suggests the presence of larger aggregates, making this formulation less suitable for the purposes sought in this work.
The polydispersity index (PDI) represents a key parameter in the design and synthesis of particles. This dimensionless value ranges from 0, reflecting a highly homogeneous size distribution, to 1, indicating significant size variability within the formulation [39]. Regarding suspension stability, formulations are generally considered stable when the absolute value of the ζ-potential exceeds ±25 mV [40]. Table 3 shows the PDI and ζ-Potential of NGs generated from the different CS and GNP combinations studied. Formulation S2 presented a more favourable profile, with an acceptable PDI (0.252 ± 0.024) and a ζ-potential of 29.35 ± 1.17 mV, a significantly smaller hydrodynamic size as show before, suggesting adequate dispersion and stability. Samples S3 exhibited behaviours with specific limitations in terms of size that determined their exclusion for further uses. S3 had a hydrodynamic diameter of 304.90 ± 27.44 nm and a moderate PDI of 0.274 ± 0.033. Its ζ-potential was 20.42 ± 0.75 mV, which falls below the ±25 mV threshold generally considered necessary to ensure adequate colloidal stability, which could increase the risk of aggregation over time [41]. Although sample S1 exhibited a ζ-potential above the stability threshold (31.64 ± 1.43 mV), it also showed a minor population of larger particles approaching the upper nanoscale limit, along with a PDI of 0.229 ± 0.035. While its PDI was acceptable, the broad size distribution and the proximity to the microscale range reduced its overall suitability for NG applications where size uniformity and compact dimensions are critical [42,43].
3.4. Ultrastructural Analysis of NG
The micrographs obtained by SEM (Figure 5) show that all NG samples generated at different pH values (S1, S2, and S3) exhibited dimensions mainly within the nanoscale range, although notable morphological differences can be observed. The non-crosslinked CS, single polysaccharide, samples exhibited elongated and fibrous structures arranged in an apparently random manner (Figure 5A). The surface appeared rough and irregular, likely due to the disorganized arrangement of CS chains in the absence of GNP-mediated cross-linking coinciding with the observations reported by [20]. These observations support the notion that single CS, without the addition of GNP, did not form structured NG, but instead retained a more fibrillar or entangled morphology prone to aggregation. In S1, a denser aggregation of fibrous structures and irregular shapes was observed, suggesting enhanced interactions between polymer chains, no spheroid structures were not evident. In S2 (Figure 5C), well-defined nanometric particles were obtained through the image analysis of 111.02 ± 11.26 determining a globular to slightly oval morphology. These structures appeared as individual and compact units, with smooth contours and slight surface irregularities, suggesting the cross-linking process between CS and GNP. No evidence of faceted shapes was detected, reinforcing the idea of a controlled molecular packing favoured by the optimized pH conditions. In contrast, S3 (Figure 5D) exhibited a markedly different morphology, characterized by smaller, elongated, and sparsely distributed nanostructures. The reduced size (estimated in 104.67 ± 20.31 nm from the image) and lower density of particles suggest a less efficient cross-linking process, resulting in a more fragmented and less cohesive network. These observations highlight the critical influence of pH on the efficiency of NG formation process and the resulting morphology. These morphological variations emphasize the role of pH in modulating the structure and stability of NGs, influencing both the degree of cross-linking and the final particle organization. The SEM analysis indicates that S2 would be the pH generating the most homogeneous formulation in terms of size; whereas that pH of S3 shows a more fragmented and dispersed architecture, which could compromise its colloidal stability.
SEM analysis jointly with its ζ-potential and size obtained by DLS supports the criterion of selecting the S2 as the most appropriate formulation [9]. An important consideration is that the drying process required for SEM sample preparation leads to "gel dehydration," causing the NGs to shrink and display reduced sizes compared to their hydrated state [44]. In contrast, DLS measures the Ho of NGs in an aqueous environment, where they maintain their fully hydrated structure. This difference in sample state explains the size discrepancies observed between SEM and DLS measurements [45].
3.5. NG Rheological and SAXS Insights
Rheological assays are fundamental to evaluate the mechanical stability and viscoelastic behaviour of NG suspensions under dynamic conditions. In this context, the storage modulus (G') represents the elastic response, the loss modulus (G'') reflects the viscous behaviour, and the damping factor (tan δ = G''/G') indicates the balance between solidity and fluidity of the system [46]. The frequency sweeps (Figure 6A) evidenced remarkable differences in the mechanical response of the NG analysed S1, S2, and S3. S2 presented the highest G' values over the entire frequency range, with a lower frequency dependence in comparison with the remaining formulations, reflecting the establishment of a dense and stable polymeric network suspended in the liquid bosom, with G' greater than G'' over the entire frequency interval studied. This behaviour suggests that S2 would be the most resistant system to mechanical deformations, maintaining its structure without significant transitions towards a more fluid state. In S3, a lower solid character was observed compared to S2, but with G' still predominant over G'' over most of the frequency interval. However, at higher frequencies, G' and G'' come closer, indicating a partial loss of the cross-linked structure under dynamic mechanical stress. This suggests that S3 would be more susceptible to fluidity under high deformation conditions. In turn, S1 showed lower G' than S2 and S3, with a higher frequency dependence and a significant reduction of this parameter in the high frequency domain. S1 showed a tendency to lose its elastic character as the frequency increases, indicating that its polymeric network is more susceptible to mechanical deformation. Although G' still predominates over G'' in most of the range, at high frequencies G'' approaches to G', which could favour a more fluid behaviour under high mechanical stress stimuli. To complete the comparison, G’ value was evaluated at a fixed frequency value of 10Hz (Table 1). It can be seen that the solid character of S1 suspension resulted to be a ten percent of the value detected for S2. Meanwhile, S3 manifested an intermediate value.
The damping factor (tan δ) or relative viscoelasticity, defined as the ratio between the viscous modulus (G'') and the elastic modulus (G'), provides key information about the viscoelastic nature of the samples (Figure 6B). S1 showed a progressive increase in tan δ as the frequency increases, indicating a gradual transition towards a more fluid behaviour under this condition of deformation, i.e. at high frequencies its structural network weakens and allows for greater fluidity. S2 presented the lowest tan δ values across the frequency range, confirming its predominantly solid-elastic behaviour and higher resistance to mechanical deformation. This result agrees with the high G' values observed in Figure 6. S3 showed intermediate tan δ values at low frequencies, but with fluctuations and a progressive increase at high frequencies, indicating a less stable polymeric network upon frequency deformation with a greater propensity to lose stiffness under conditions of prolonged mechanical stress. Taken together, these rheological analyses indicate that S2, generated at pH 4.5, would be the system with the highest mechanical stability and lowest frequency dependence, making it more suitable for applications requiring a structure resistant to prolonged mechanical stress. However, S1, with its high viscosity and tendency to fluidity under certain conditions, might be preferable in applications requiring higher initial flow resistance. Finally, S3, with its lower structural stability and greater tendency to flow, would be more suitable for applications where deformability and low viscosity are key factors [43,47,48].
The flow curves (Figure 6C) provided additional information on the dependence of viscosity on shear rate. All samples exhibit pseudoplastic behaviour, characterized by the decrease in viscosity with increasing shear rate, which was pointed out as typical for polymeric systems and NG [49,50,51]. S1 presented the highest viscosity, indicating a higher initial resistance to flow and a dense structure. However, this result does not imply greater mechanical resistance to deformation, as frequency sweeps showed that S1 has a network more dependent on mechanical stress, which could make it more susceptible to deformation under certain conditions. On the other hand, S2 presented an intermediate viscosity, lower than that of S1 but higher than that of S3. Its lower viscosity compared to S1 suggests that its polymeric network has a better structural organization, allowing it to maintain a stable structure without requiring extreme viscosity as a result of the deformation applied. Finally, S3 showed the lowest viscosity, confirming that it is the most fluid system with the lowest degree of cross-linking between the NG entities. Taken at a the final the asymptotic portion of the curve, the highest ap was registered for S1, while S2 and S3 resulted very similar (Table 1).
The SAXS analysis revealed distinct structural characteristics among the three nanogel formulations (S1, S2, and S3), including variations in correlation length and network compactness.
The Guinier model was tested for fitting the SAXS data; however, the condition q×Rg<1.3 was not met for any of the samples (S1, S2, and S3). In contrast, the Debye–Bueche model (Figure 7A, Table 4A) showed excellent fitting performance for samples S2 and S3 (R² > 0.97), with greater dispersion in S1. The correlation length ξ was higher in S2 (119 ± 4 nm) and S3 (94 ± 8 nm) compared to S1 (79.6 ± 15 nm), indicating more continuous structural networks in the more crosslinked samples [29,52].
The power-law fitting in the intermediate-q range (Figure 7B, Table 4B) revealed exponent values in the order S2 < S1 < S3, with m = 0.70 ± 0.042, 0.78 ± 0.12, and 0.96 ± 0.034, respectively. These values reflect a progressive increase in structural compactness from S2 to S3 [30,31,32].
A one-way ANOVA test revealed statistically significant differences among the samples (p < 0.001). The post-hoc Tukey test revealed that all samples differed significantly from each other (p < 0.05).
3.7. Biocompatibility Assays
3.7.1. Impact of CS-GNP NG on Cell Viability
To determine the biocompatibility of the developed NG for potential uses in food and/or pharmaceutical applications, cytotoxicity assays were conducted in accordance with ISO 10993 guidelines, which provide a standardized framework for the in vitro evaluation of medical device materials and substances. Specifically, the ISO 10993-5:2009 standard recommends the use of the murine fibroblast cell line L929 as a reference model for assessing cytotoxic potential. In compliance with these recommendations, L929 cells were exposed to a range of NP concentrations under standardized culture conditions to evaluate cell viability, proliferation, and morphological integrity. The concentration-dependent effects were quantified using established viability assays, such as MTT or Alamar Blue, and cytotoxicity thresholds were defined based on the reduction in cell viability relative to untreated controls. A material is considered non-cytotoxic according to ISO criteria when cell viability remains above 70% following exposure [33].
L929 cells are characterized by a rapidly grow producing confluent monolayers. The adherent cells displayed a spindle shape and epithelial-like morphology. Common morphological changes associated with cellular stress and/or toxicity include an initial rounding followed by a cell detachment, and decreased confluence [53]. Fortunately, none of these alterations were observed following CS-GNP NG treatment in concentration ≤ 50 µg/mL (data not shown).
In the present study, an MTT assay was conducted on L929 cells exposed to NG (Figure 8A) for 24 h. It was determined that concentrations ranging from 10 to 75 µg/mL did not induce statistically significant reductions in cell viability compared to the untreated control (set at 100%). However, starting at 100 µg/mL, a notable decline in viability was observed, with values falling below 75% at concentrations of 125 and 150 µg/mL, indicating a cytotoxic response according to ISO 10993-5 standards.
In nanomedicine, the safe and efficient cellular internalization of NPs is a critical step toward achieving high therapeutic efficacy when used as drug delivery systems [54]. In this study, the uptake capacity of NG S2 (30 μg/mL) was evaluated over time (0, 5 min, 30 min, 4 h, 6 h, and 24 h) in ARPE-19 cells. To this end, representative images were acquired at each time point using epifluorescence microscopy under constant imaging parameters (brightness, contrast, and exposure time). As shown in Figure 8B, NGs were gradually internalized by the cells over time, with widespread uptake evident after 24 h of incubation. Fluorescence intensity was used as a measure of NG uptake, revealing a progressive increase that peaked at the final time point.
These findings are in line with previous results obtained by our research group using the same cell line (ARPE-19) in studies involving a different encapsulation platform, namely CS-based NG crosslinked with tripolyphosphate (TPP) [12]. In that report, the internalisation of the nanosystems was also confirmed, suggesting a consistent cellular uptake behaviour across structurally distinct yet functionally related nanocarrier systems. The agreement between the two independent approaches not only reinforces the reliability of the experimental methodology employed but also highlights the reproducibility and robustness of the internalisation process in this retinal epithelial cell model. Taken together, these results suggest that the cellular uptake observed is largely governed by the intrinsic properties of the CS-based NG and their physicochemical compatibility with the target cell type, rather than being exclusively dependent on the specific crosslinker used.
4. Conclusions
This study enabled the comprehensive design, development, and characterization of CS-based NG cross-linked of GNP. The key physicochemical parameters for NG design (particle size, PDI, surface charge, colloidal stability,) revealed the exceptional potential of these biopolymeric-based matrices. While the crosslinking between CS and GNP has been extensively reported in the literature, the true innovation of the present study lies in the substantial advancement achieved in the optimization process. Notably, we established a streamlined and efficient protocol capable of producing NGs within merely 24 h, a marked improvement over conventional methodologies, which typically rely on elevated temperatures (≥ 50°C) and/or prolonged reaction times exceeding 48 h.
The novel approach presented herein was carried out under physiologically relevant and strictly controlled conditions (37°C), effectively circumventing the undesirable acceleration of reaction kinetics often observed at higher temperatures. Such acceleration not only compromises reproducibility but also promotes aggregate formation and excessive network compaction, which may compromise the functional integrity of the NGs. Among the most compelling findings, the pH of the reaction medium emerged as a master regulator of cross-linking kinetics and the final architecture of the polymeric network. At pH 4.5, an optimal balance between free and protonated -NH2 groups was achieved, fostering the formation of a compact, stable, and homogeneous three-dimensional structure.
This formulation stood out not only for its reduced particle size and low PDI but also for its elevated ζ-potential, ensuring robust colloidal dispersion. Also, rheological assessments confirmed a pseudoplastic behaviour, tuneable according to formulation, thereby highlighting the feasibility of tailoring mechanical properties to suit different administration routes. Characterisation by SEM, FTIR, and SAXS validated the formation of covalent bonds between CS and GNP and revealed a progressive network compaction with fractal features. Ultrastructural analysis unveiled well-defined spherical morphologies in optimally cross-linked samples, while FTIR spectra confirmed the emergence of characteristic Schiff base and amide bond bands, consolidating the structural integrity of the system.
Cytotoxicity assays demonstrated that NG are biocompatible at concentrations up to 50 µg/mL. In parallel, cellular uptake cellular uptake studies demonstrated a time-dependent internalisation, supporting their potential for intracellular delivery. Altogether, these findings position CS-GNP NG as highly promising platforms for the controlled delivery of bioactive agents, high encapsulation efficiency and biocompatibility.
In sum, the results of the present report underscore the value of CS-GNP NG as appropriate carriers for the controlled release of bioactive compounds. Their favourable physicochemical properties, tuneable rheological behaviour, and demonstrated biocompatibility position them as promising candidates for future biomedical and pharmaceutical applications.
Supplementary Materials
The following supporting information can be downloaded at the website of this paper posted on Preprints.org, Figure S1: Visible spectra for single CS and single GNP in the range of 400 nm – 750 nm; Figure S2: Full Small-Angle X-ray Scattering profiles for the three CS-GNP NG formulations.
Author Contributions
J.D.G.: Methodology, Investigation & Analysis. A.A.: Conceptualization, Formal analysis, Funding acquisition, Review & Editing, Visualization and Writing original draft. C.SL: Methodology, Investigation & Analysis. M.E.F: Methodology, Investigation & Analysis; R.C.: Methodology, Investigation & Analysis. D.L.: Methodology, Investigation & Analysis. O.E.P.: Conceptualization, Project administration, Funding acquisition, Review & Editing, Resources, Visualization and Writing original draft. All authors have read and agreed to the published version of the manuscript.
Funding
PICT-2021-I-00347, PIP 00072CO and UBACyT 20020190100297BA
Institutional Review Board Statement
Not applicable.
Informed Consent Statement
Not applicable.
Data Availability Statement
Data will be made available on request.
Acknowledgments
The authors would like to acknowledge the support provided by the CONICET, the Universidad de Buenos Aires, the Universidad Nacional de Lujan and Universidad Nacional de San Martin for granting the necessary resources and facilities for this research.
Conflicts of Interest
The authors declare no conflicts of interest.
Abbreviations
The following abbreviations were used in this manuscript:
| ξ | correlation length |
| η | viscosity |
| δ | fase angle |
| γ̇ | shear rate |
| ARPE-19 | human retinal pigment epithelial cells |
| CS | chitosan |
| CS-GNP NG | chitosan–genipin nanogel |
| DAPI | 4',6-diamidino-2-fenilindol fluorescent probe |
| DMEM | Dulbecco's modified Eagle's medium |
| DLS | dynamic light scattering |
| EE | encapsulation efficiency |
| FBS | fetal bovine serum |
| FTIR | Fourier-transform infrared spectroscopy |
| G′ | viscoelastic storage |
| G′′ | loss module |
| GNP | genipin |
| HIUS | high intensity ultrasound |
| Ho | Hydrodynamic diameter |
| m | power-law exponent |
| MTT | cytotoxicity assay |
| NG | nanogels |
| NP | nanoparticles |
| L929 | mouse fibroblast cell line |
| p | exponent of the Debye–Bueche–Zimm model |
| PDI | polydispersity index |
| SAXS | small-angle X-ray scattering |
| SEM | scanning electron microscopy |
References
- Cao, Y.; Tan, Y.F.; Wong, Y.S.; Liew, M.W.J.; Venkatraman, S. Recent advances in chitosan-based carriers for gene delivery. Mar. Drugs 2019, 17, 381. [CrossRef]
- Biernat, M.; Woźniak, A.; Chraniuk, M.; Panasiuk, M.; Tymowicz-Grzyb, P.; Pagacz, J.; Jaegermann, Z. Effect of selected crosslinking and stabilization methods on the properties of porous chitosan composites dedicated for medical applications. Polymers 2023, 15, 2507. [CrossRef]
- Pérez-Álvarez, L.; Ruiz-Rubio, L.; Vilas-Vilela, J.L. Chitosan-based nanogels for biomedical applications. Handb. Mater. Nanomed. 2020, Taylor & Francis. [CrossRef]
- Wang, H.; Qian, J.; Ding, F. Recent advances in engineered chitosan-based nanogels for biomedical applications. J. Mater. Chem. B 2017, 5, —. [CrossRef]
- Rinaudo, M. Chitin and chitosan: Properties and applications. Prog. Polym. Sci. 2006, 31, 603–632. [CrossRef]
- Lai, J.Y. Biocompatibility of genipin and glutaraldehyde cross-linked chitosan materials in the anterior chamber of the eye. Int. J. Mol. Sci. 2012, 13, 10970–10985. [CrossRef]
- Butler, M.F.; Ng, Y.-F.; Pudney, P.D.A. Mechanism and kinetics of the crosslinking reaction between biopolymers containing primary amine groups and genipin. J. Polym. Sci. A Polym. Chem. 2003, 41, 3941–3953. [CrossRef]
- Muzzarelli, R.A.A.; El Mehtedi, M.; Bottegoni, C.; Aquili, A. Genipin-crosslinked chitosan gels and scaffolds for tissue engineering and regeneration of cartilage and bone. Mar. Drugs 2015, 13, 7310–7338. [CrossRef]
- Delmar, K.; Bianco-Peled, H. The dramatic effect of small pH changes on the properties of chitosan hydrogels crosslinked with genipin. Carbohydr. Polym. 2015, 127, 28–37. [CrossRef]
- Mi, F.L.; Tan, Y.C.; Liang, H.C.; Sung, H.W. In vivo biocompatibility and degradability of a novel injectable-chitosan-based implant. Biomaterials 2005, 26, 7563–7571. [CrossRef]
- Zhao, X.; Tang, J.; Liu, Y.; Hu, B.; Chen, Q.; Liu, Y. Reaction kinetics of chitosan nanogels crosslinked by genipin. J. Chromatogr. A 2023, 1710, 464427. [CrossRef]
- Yu, Y.; Xu, S.; Li, S.; Pan, H. Genipin-cross-linked hydrogels based on biomaterials for drug delivery: A review. Biomater. Sci. 2021, 9, 1583. [CrossRef]
- Buosi, F.S.; Alaimo, A.; Di Santo, S.; Elías, F.; García Liñares, G.; Acebedo, S.L.; Castañeda Cataña, M.A.; Spagnuolo, C.C.; Lizarraga, L.; Martínez, K.D.; Pérez, O.E. Resveratrol encapsulation in high molecular weight chitosan-based nanogels for applications in ocular treatments: Impact on human ARPE-19 culture cells. Int. J. Biol. Macromol. 2020, 165, 804–821. [CrossRef]
- De Matteo, R.; Rey, J.M.; Corfield, R.; et al. Chitosan-inspired matrices for folic acid. Revealing structural characterization and guaranteed bioaccessibility. Food Biophys. 2024, 19, 412–424. [CrossRef]
- Miras, J.; Liu, C.; Blomberg, E.; Thormann, E.; Vílchez, S.; Esquena, J. pH-responsive chitosan nanofilms crosslinked with genipin. Colloids Surf. A Physicochem. Eng. Asp. 2021, 616, 126229. [CrossRef]
- Esparza Flores, E.E.; Cardoso, F.D.; Siqueira, L.B.; Ricardi, N.C.; Costa, T.H.; Rodrigues, R.C.; Klein, M.P.; Hertz, P.F. Influence of reaction parameters in the polymerization between genipin and chitosan for enzyme immobilization. Process Biochem. 2019, 84, 73–80. [CrossRef]
- Kildeeva, N.R.; Perminov, P.A.; Vladimirov, L.V.; Novikov, V.V.; Mikhailov, S.N.; Kasatkin, I.A. Structure and properties of chitosan films modified with genipin and polyethylene glycol. Polymers 2020, 12, 1086. [CrossRef]
- Arteche Pujana, M.; Pérez-Álvarez, L.; Cesteros Iturbe, L.C.; Katime, I. Biodegradable chitosan nanogels crosslinked with genipin. Carbohydr. Polym. 2013, 94, 836–842. [CrossRef]
- Moura, M.J.; Martins, S.P.; Duarte, B.P.M. Production of chitosan microparticles cross-linked with genipin – Identification of factors influencing size and shape properties. Biochem. Eng. J. 2015, 104, 82–90. [CrossRef]
- Silva, C.P.; Martínez, J.H.; Martínez, K.D.; Farías, M.E.; Coluccio Leskow, F.; Pérez, O.E. Proposed molecular model for electrostatic interactions between insulin and chitosan. Nanocomplexation and activity in cultured cells. Colloids Surf. A Physicochem. Eng. Asp. 2018, 537, 425–434. [CrossRef]
- Mi, F.-L.; Sung, H.-W.; Shyu, S.-S. Synthesis and characterization of a novel chitosan-based network prepared using naturally occurring crosslinker. J. Polym. Sci. A Polym. Chem. 2000, 38, 2804–2814. [CrossRef]
- Pérez, O.E.; David-Birman, T.; Kesselman, E.; Levi-Tal, S.; Lesmes, U. Milk protein–vitamin interactions: Formation of beta-lactoglobulin/folic acid nano-complexes and their impact on in vitro gastro-duodenal proteolysis. Food Hydrocoll. 2014, 38, 40–47. [CrossRef]
- Moore, J.; Cerasoli, E. Particle light scattering methods and applications. Encycl. Spectrosc. Spectrom. 2017, 54, 543–553.
- Hunter, R. Foundations of Colloid Science; Oxford University Press: Oxford, UK, 2001.
- Vo, N.T.N.; Huang, L.; Lemos, H.; Mellor, A.L.; Novakovic, K. Genipin-crosslinked chitosan hydrogels: Preliminary evaluation of biocompatibility and in vitro biodegradation. J. Appl. Polym. Sci. 2021, n/a, —. [CrossRef]
- Guinier, A. Small-Angle Scattering of X-Rays; John Wiley & Sons: New York, USA, 1955.
- Feigin, L.A.; Svergun, D.I. Structure Analysis by Small-Angle X-ray and Neutron Scattering; Plenum Press: New York, USA, 1987.
- Glatter, O.; Kratky, O. Small Angle X-ray Scattering; Academic Press: London, UK, 1982.
- Debye, P.; Bueche, A.M. Scattering by an inhomogeneous solid. J. Appl. Phys. 1949, 20, 518–525. [CrossRef]
- Teixeira, J. Small-Angle Scattering by Fractal Systems. J. Appl. Crystallogr. 1988, 21, 781–785. [CrossRef]
- Hammouda, B. A new Guinier–Porod model. J. Appl. Crystallogr. 2010, 43, 1474–1478. [CrossRef]
- Esparza-Flores, E.E.; Siquiere, L.B.; Cardoso, F.D.; Haas Costa, T.; Benvenutti, E.V.; Medina-Ramírez, I.E.; Hertz, P.F. Chitosan with modified porosity and crosslinked with genipin: A dynamic system structurally characterized. Food Hydrocoll. 2023, 144, 109034. [CrossRef]
- Gruber, S.; Nickel, A. Toxic or not toxic? The specifications of the standard ISO 10993-5 are not explicit enough to yield comparable results in the cytotoxicity assessment of an identical medical device. Front. Med. Technol. 2023, 5, 1195529. [CrossRef]
- Chen, H.; Ouyang, W.; Lawuyi, B.; Prakash, S. Reaction of chitosan with genipin and its fluorogenic attributes for potential microcapsule membrane characterization. J. Biomed. Mater. Res. A 2005, 75, 917–927. [CrossRef]
- Touyama, R.; Takeda, Y.; Inoue, K.; Kawamura, I.; Yatsuzuka, M.; Ikumoto, T.; Shingu, T.; Yokoi, T.; Inouye, H. Studies on blue pigments produced from genipin and methylamine. I. Structures of reddish-brown pigments, intermediates leading to blue pigments. Chem. Pharm. Bull. 1994, 42, 668–673. [CrossRef]
- Dadashi, H.; et al. A rapid protocol for synthesis of chitosan nanoparticles with ideal physicochemical features. Heliyon 2024, 10, e32228. [CrossRef]
- Lárez Velásquez, C.; Rivas, A.; Santos Ocanto, I. Obtaining Genipin from caruto fruits (Genipa americana L.) from the Venezuelan plain. Adv. Chem. 2014, 9, 75–86. https://www.redalyc.org/articulo.oa?id=93332257002.
- Reay, S.L.; Jackson, E.L.; Ferreira, A.M.; Hilkens, C.M.U.; Novakovic, K. In vitro evaluation of the biodegradability of chitosan–genipin hydrogels. Mater. Adv. 2022, 3, 7946–7959. [CrossRef]
- Williams, P.M. Zeta Potential; Springer: Berlin, Heidelberg, 2016. [CrossRef]
- Murugan, K.; Choonara, Y.E.; Kumar, P.; Bijukumar, D.; du Toit, L.C.; Pillay, V. Parameters and characteristics governing cellular internalization and trans-barrier trafficking of nanostructures. Int. J. Nanomedicine 2015, 10, 2191–2206. [CrossRef]
- Rasmussen, M.K.; Pedersen, J.N.; Marie, R. Size and surface charge characterization of nanoparticles with a salt gradient. Nat. Commun. 2020, 11, 2337. [CrossRef]
- Chunhachaichana, C.; Sawatdee, S.; Rugmai, S.; Srichana, T. Development and characterization of nanodispersion-based sildenafil pressurized metered-dose inhaler using combined small-angle X-ray scattering, dynamic light scattering, and impactors. J. Drug Deliv. Sci. Technol. 2022, 76, 103749. [CrossRef]
- Dimida, S.; Demitri, C.; De Benedictis, V.M.; Scalera, F.; Gervaso, F.; Sannino, A. Genipin-cross-linked chitosan-based hydrogels: reaction kinetics and structure-related characteristics. J. Appl. Polym. Sci. 2015, 132, 42256. [CrossRef]
- Xu, D.; Meng, X.; Liu, S.; et al. Dehydration regulates the structural reorganization of dynamic hydrogels. Nat. Commun. 2024, 15, 6886. [CrossRef]
- Wang, W.; Sande, S. Dynamic light scattering study on hydrogels with surfactant addition: analysis of mesh size and correlation length. Polym. J. 2015, 47, 302–310. [CrossRef]
- Ferry, J.D. Viscoelastic Properties of Polymers, 3rd ed.; John Wiley & Sons: New York, USA, 1980.
- Parés, L.; Naasri, S.; Delattre, L.; Therriault, H.; Liberelle, B.; De Crescenzo, G.; Lauzon, M.A.; Faucheux, N.; Paquette, B.; Virgilio, N. Macroporous chitosan/alginate hydrogels crosslinked with genipin accumulate and retain glioblastoma cancer cells. RSC Adv. 2024, Issue 48, —. [CrossRef]
- Rhim, J.W.; Park, H.M.; Ha, C.S. Bio-nanocomposites for food packaging applications. Prog. Polym. Sci. 2013, 38, —. [CrossRef]
- Santoni, N.; Matos Ruiz, M.; Muller-Karger, C.; Nicola, H.; Sabino, M.; Müller, A. Characterization of chitosan hydrogels covalently cross-linked with genipin. Iberoam. J. Polym. 2008, 9, 326–330.
- Erramreddy, V.V. Development of nanogels from nanoemulsions and investigation of their rheology and stability. Master’s Thesis, University of Saskatchewan, Saskatoon, Canada, 2015. https://harvest.usask.ca/handle/10388/12634.
- Ahmed, E.M. Hydrogel: Preparation, characterization, and applications. J. Adv. Res. 2015, 6, 105–121. [CrossRef]
- Mi, F.-L.; Sung, H.-W.; Shyu, S.-S.; Su, C.-C.; Peng, C.-K. Synthesis and characterization of biodegradable TPP/genipin co-crosslinked chitosan gel beads. Polymer 2005, 46, 11978–11988. [CrossRef]
- Orabi, S.; Soleimani, S.; Mahravani, H.; Ebrahimi, M.M.; Shahsavandi, S. Mouse Fibroblast L929 Cell Line as a Useful Tool for Replication and Adaptation of Infectious Bursal Disease Virus. Arch. Razi Inst. 2023, 78, 863–871. [CrossRef]
- Foroozandeh, P.; Aziz, A.A. Insight into Cellular Uptake and Intracellular Trafficking of Nanoparticles. Nanoscale Res. Lett. 2018, 13, 339. [CrossRef]
Figure 1.
Visible zone zoom of spectra for CS-GNP, range 550 nm – 650 nm showing the pick between 600 and 605 nm.
Figure 1.
Visible zone zoom of spectra for CS-GNP, range 550 nm – 650 nm showing the pick between 600 and 605 nm.
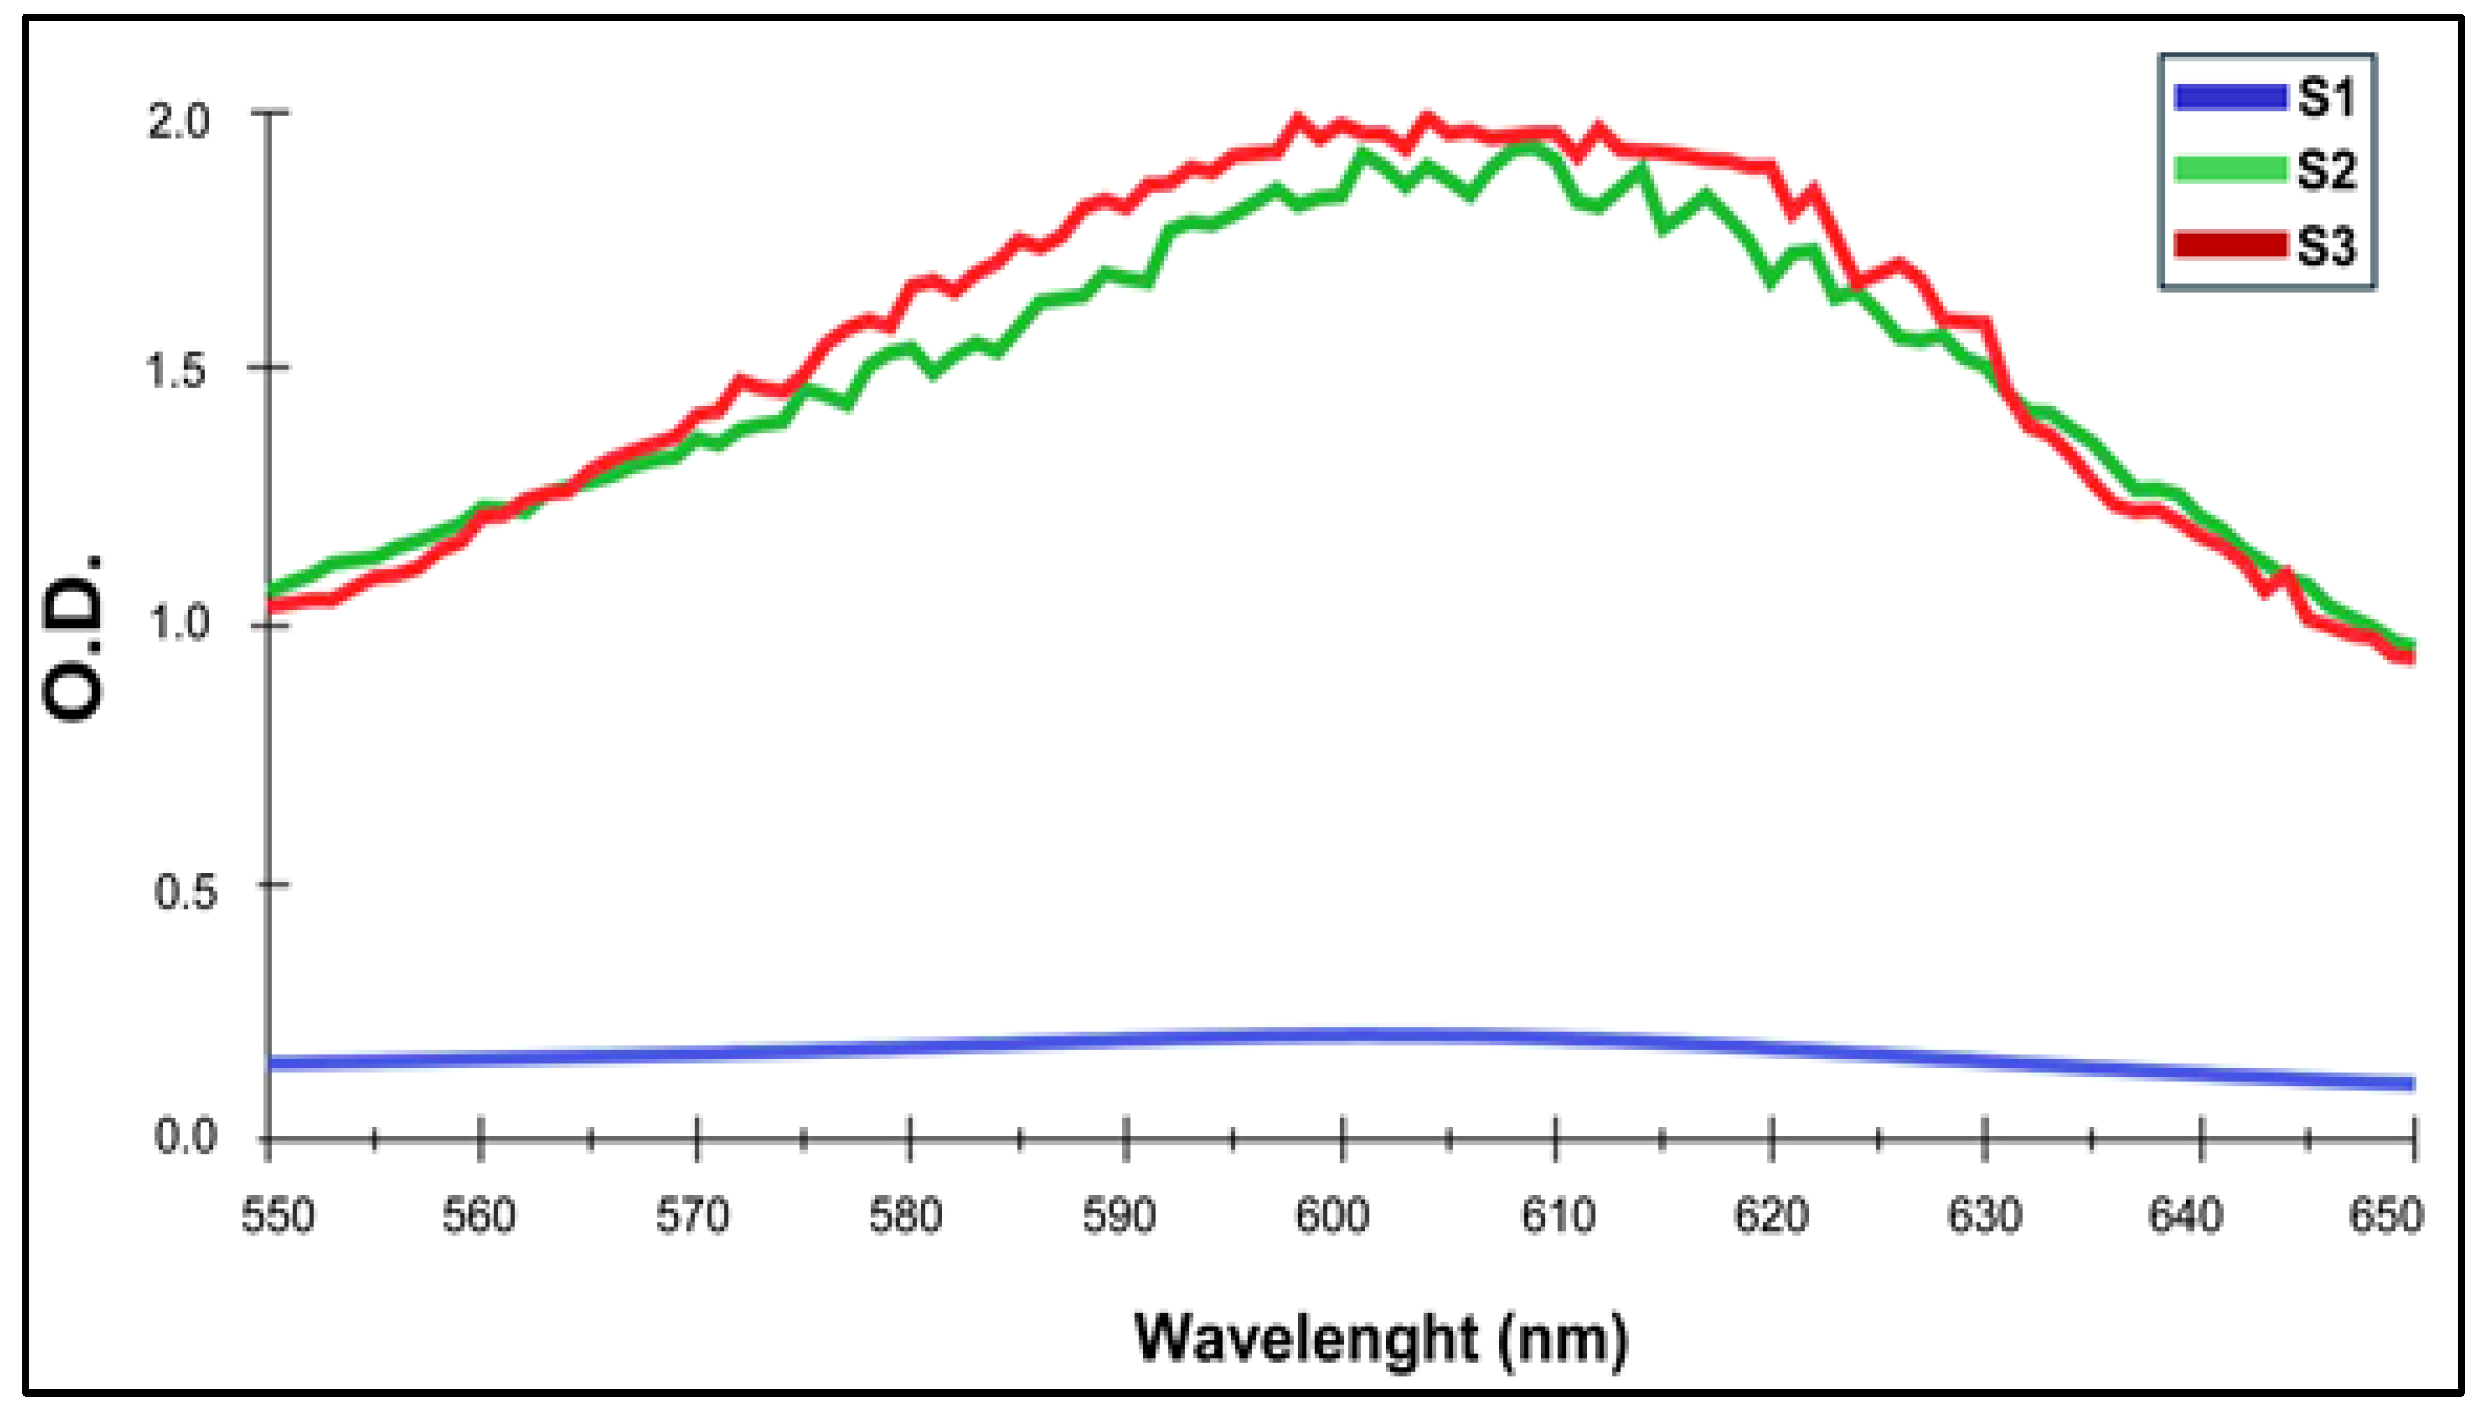
Figure 2.
Optical density (O.D.) versus time curves for selected formulations, chosen chosen based on kinetic behaviours observed visually A) Sigmoidal fitting application. B) First order fitting application. Shaded areas represent experimental data, while solid-coloured lines correspond to the fitted curves.
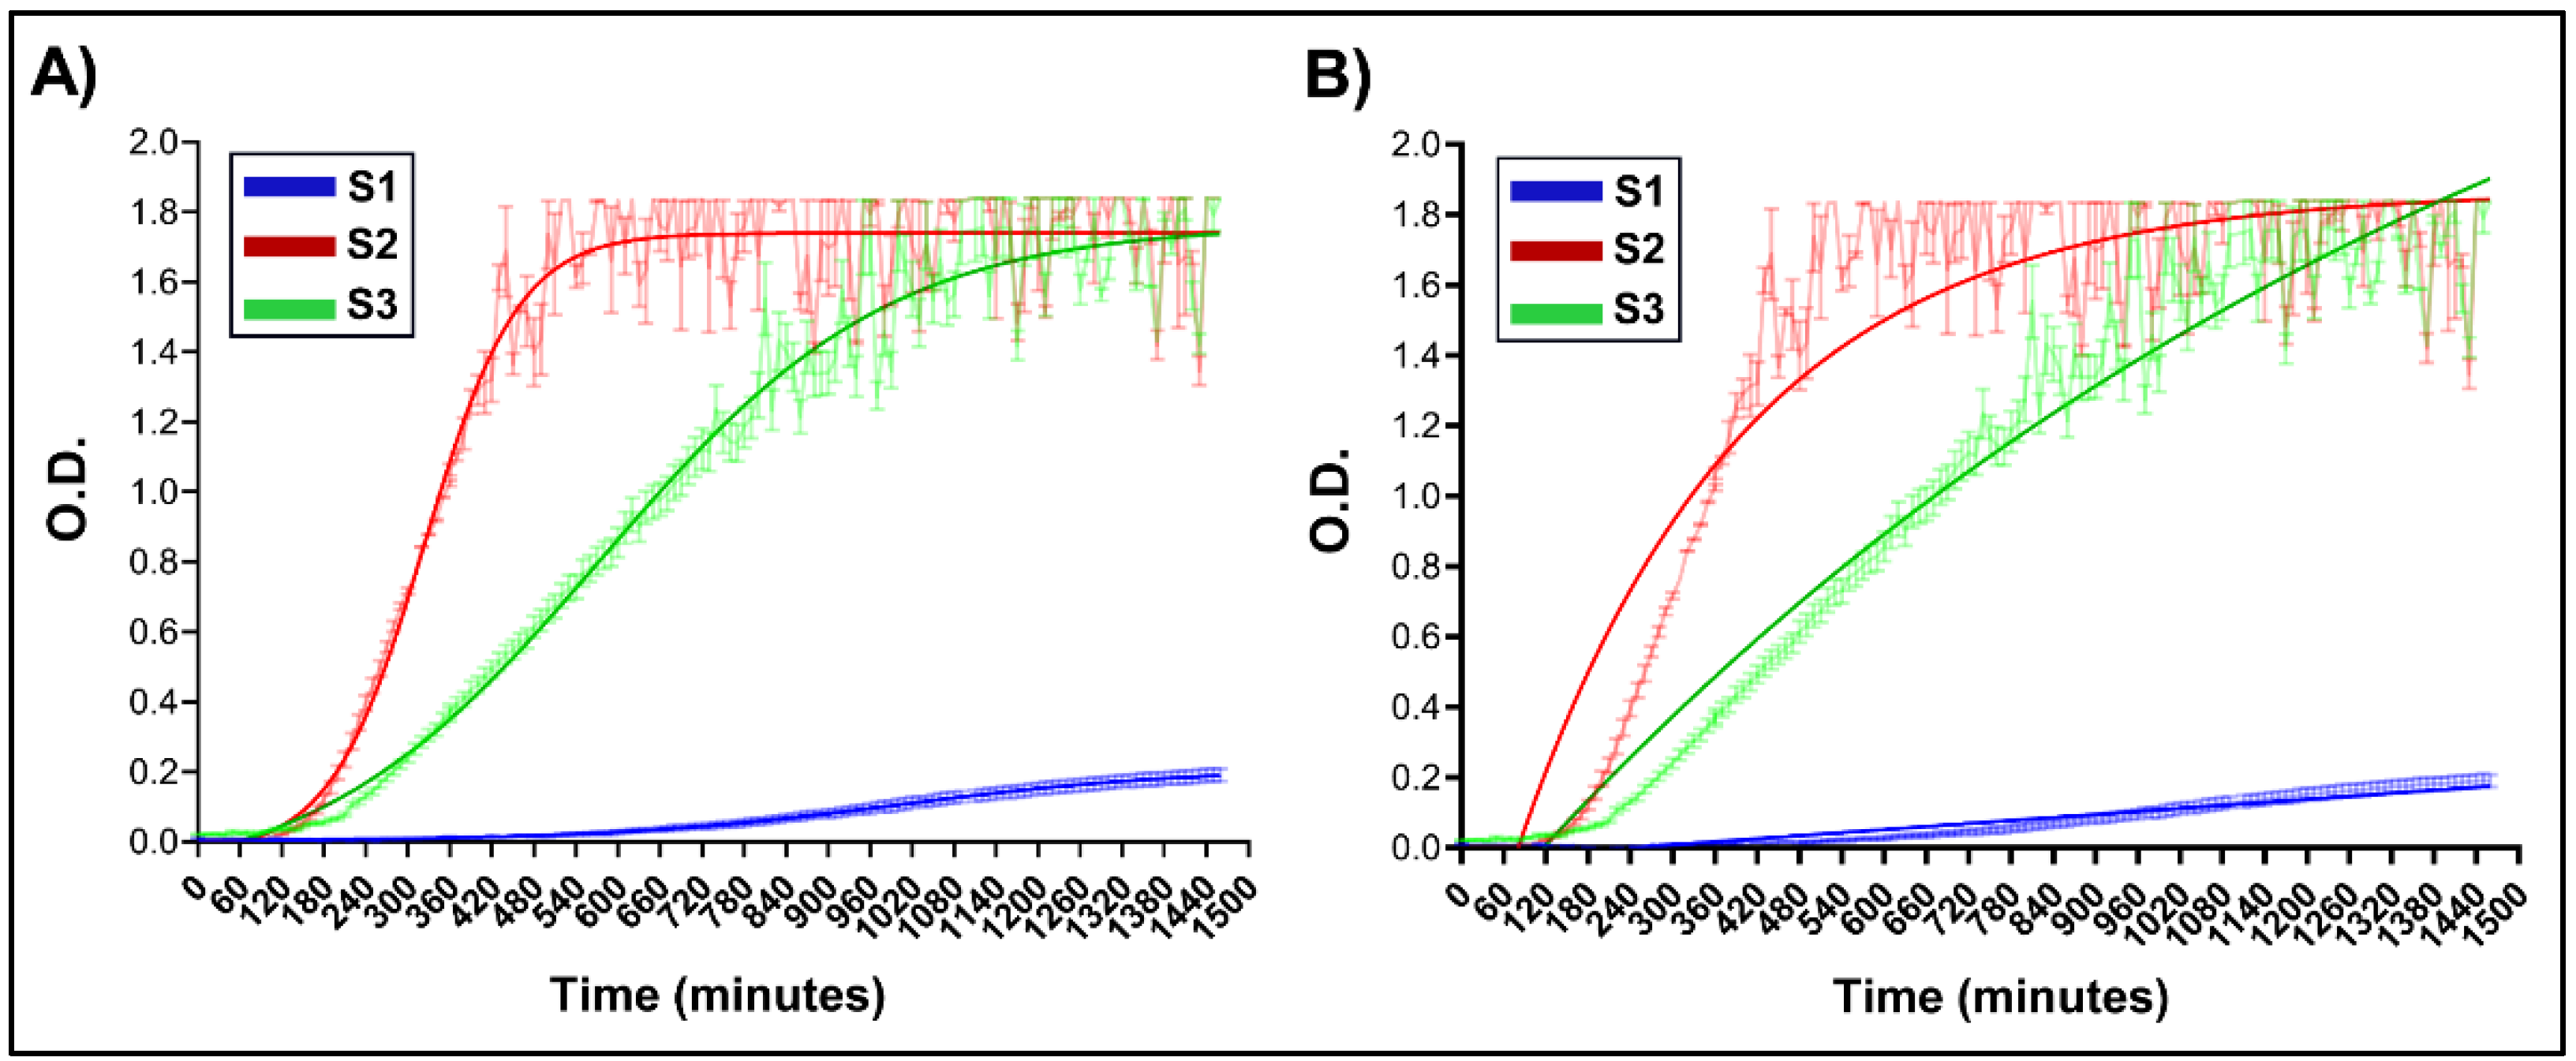
Figure 3.
A) FTIR spectra obtained for S1 and their controls, single CS and GNP. B) FTIR zoomed in the 1800 - 1200 cm–1 region. C) FTIR zoomed in the 4000 - 2500 cm–1 region.
Figure 3.
A) FTIR spectra obtained for S1 and their controls, single CS and GNP. B) FTIR zoomed in the 1800 - 1200 cm–1 region. C) FTIR zoomed in the 4000 - 2500 cm–1 region.
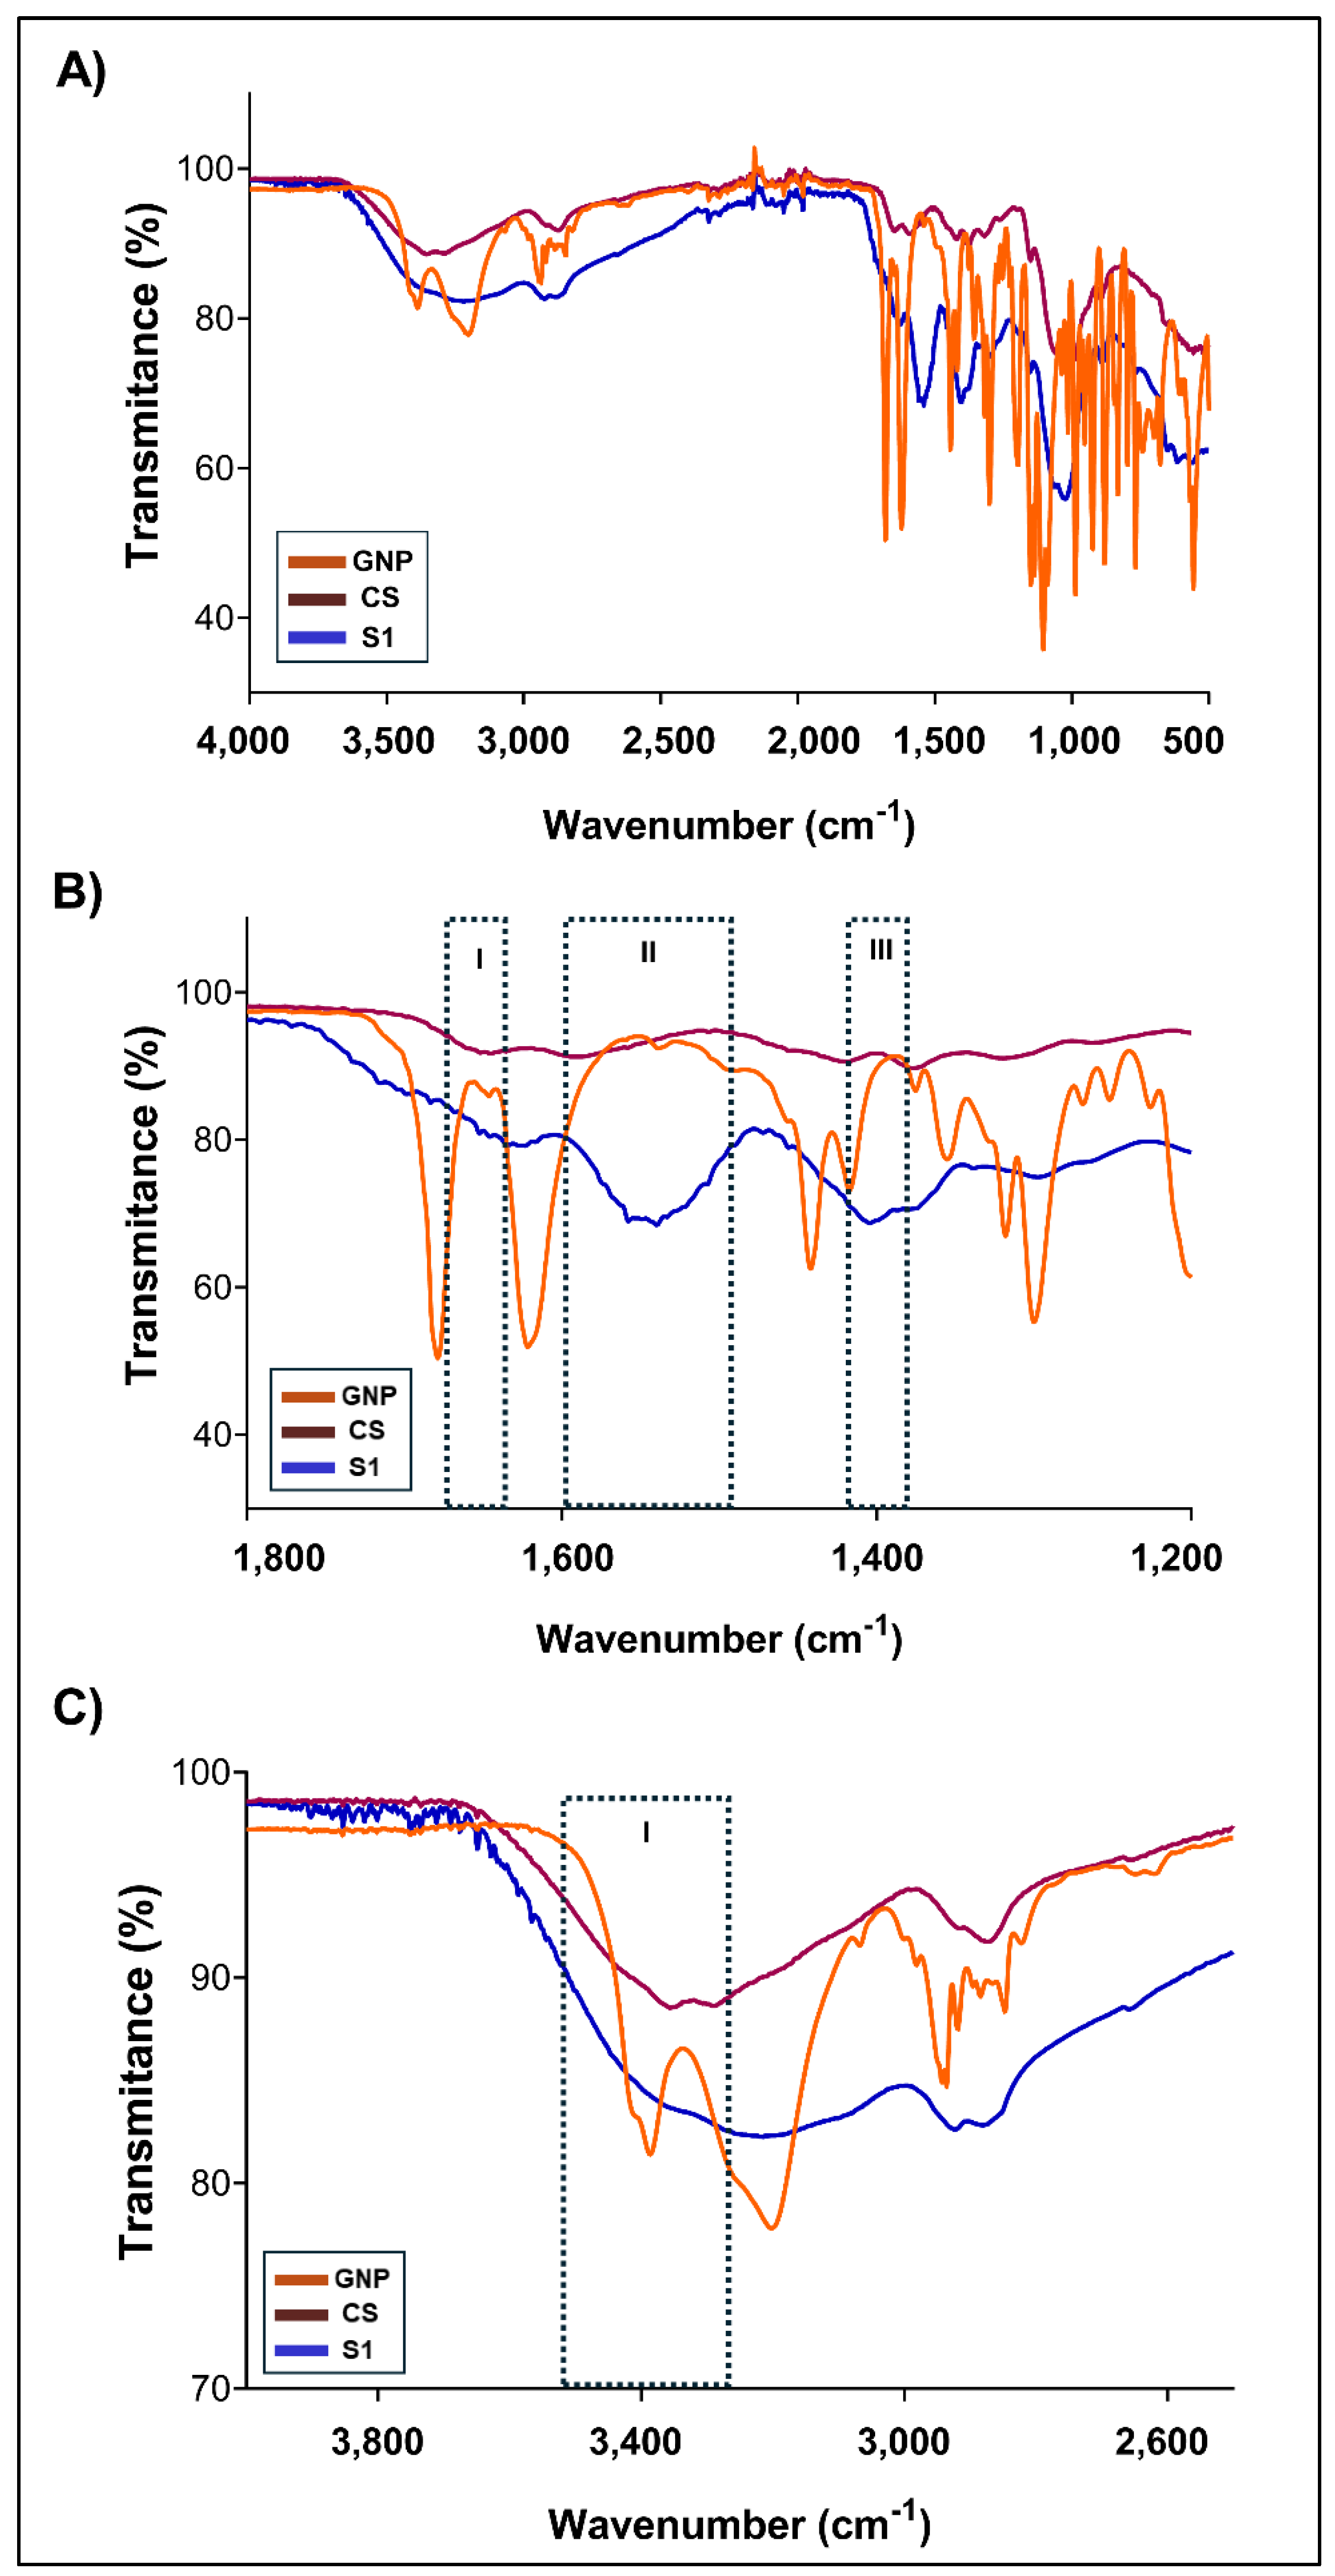
Figure 4.
Particle size distribution profiles of each CS-GNP samples (S1-S3) represented by intensity or volume.
Figure 4.
Particle size distribution profiles of each CS-GNP samples (S1-S3) represented by intensity or volume.
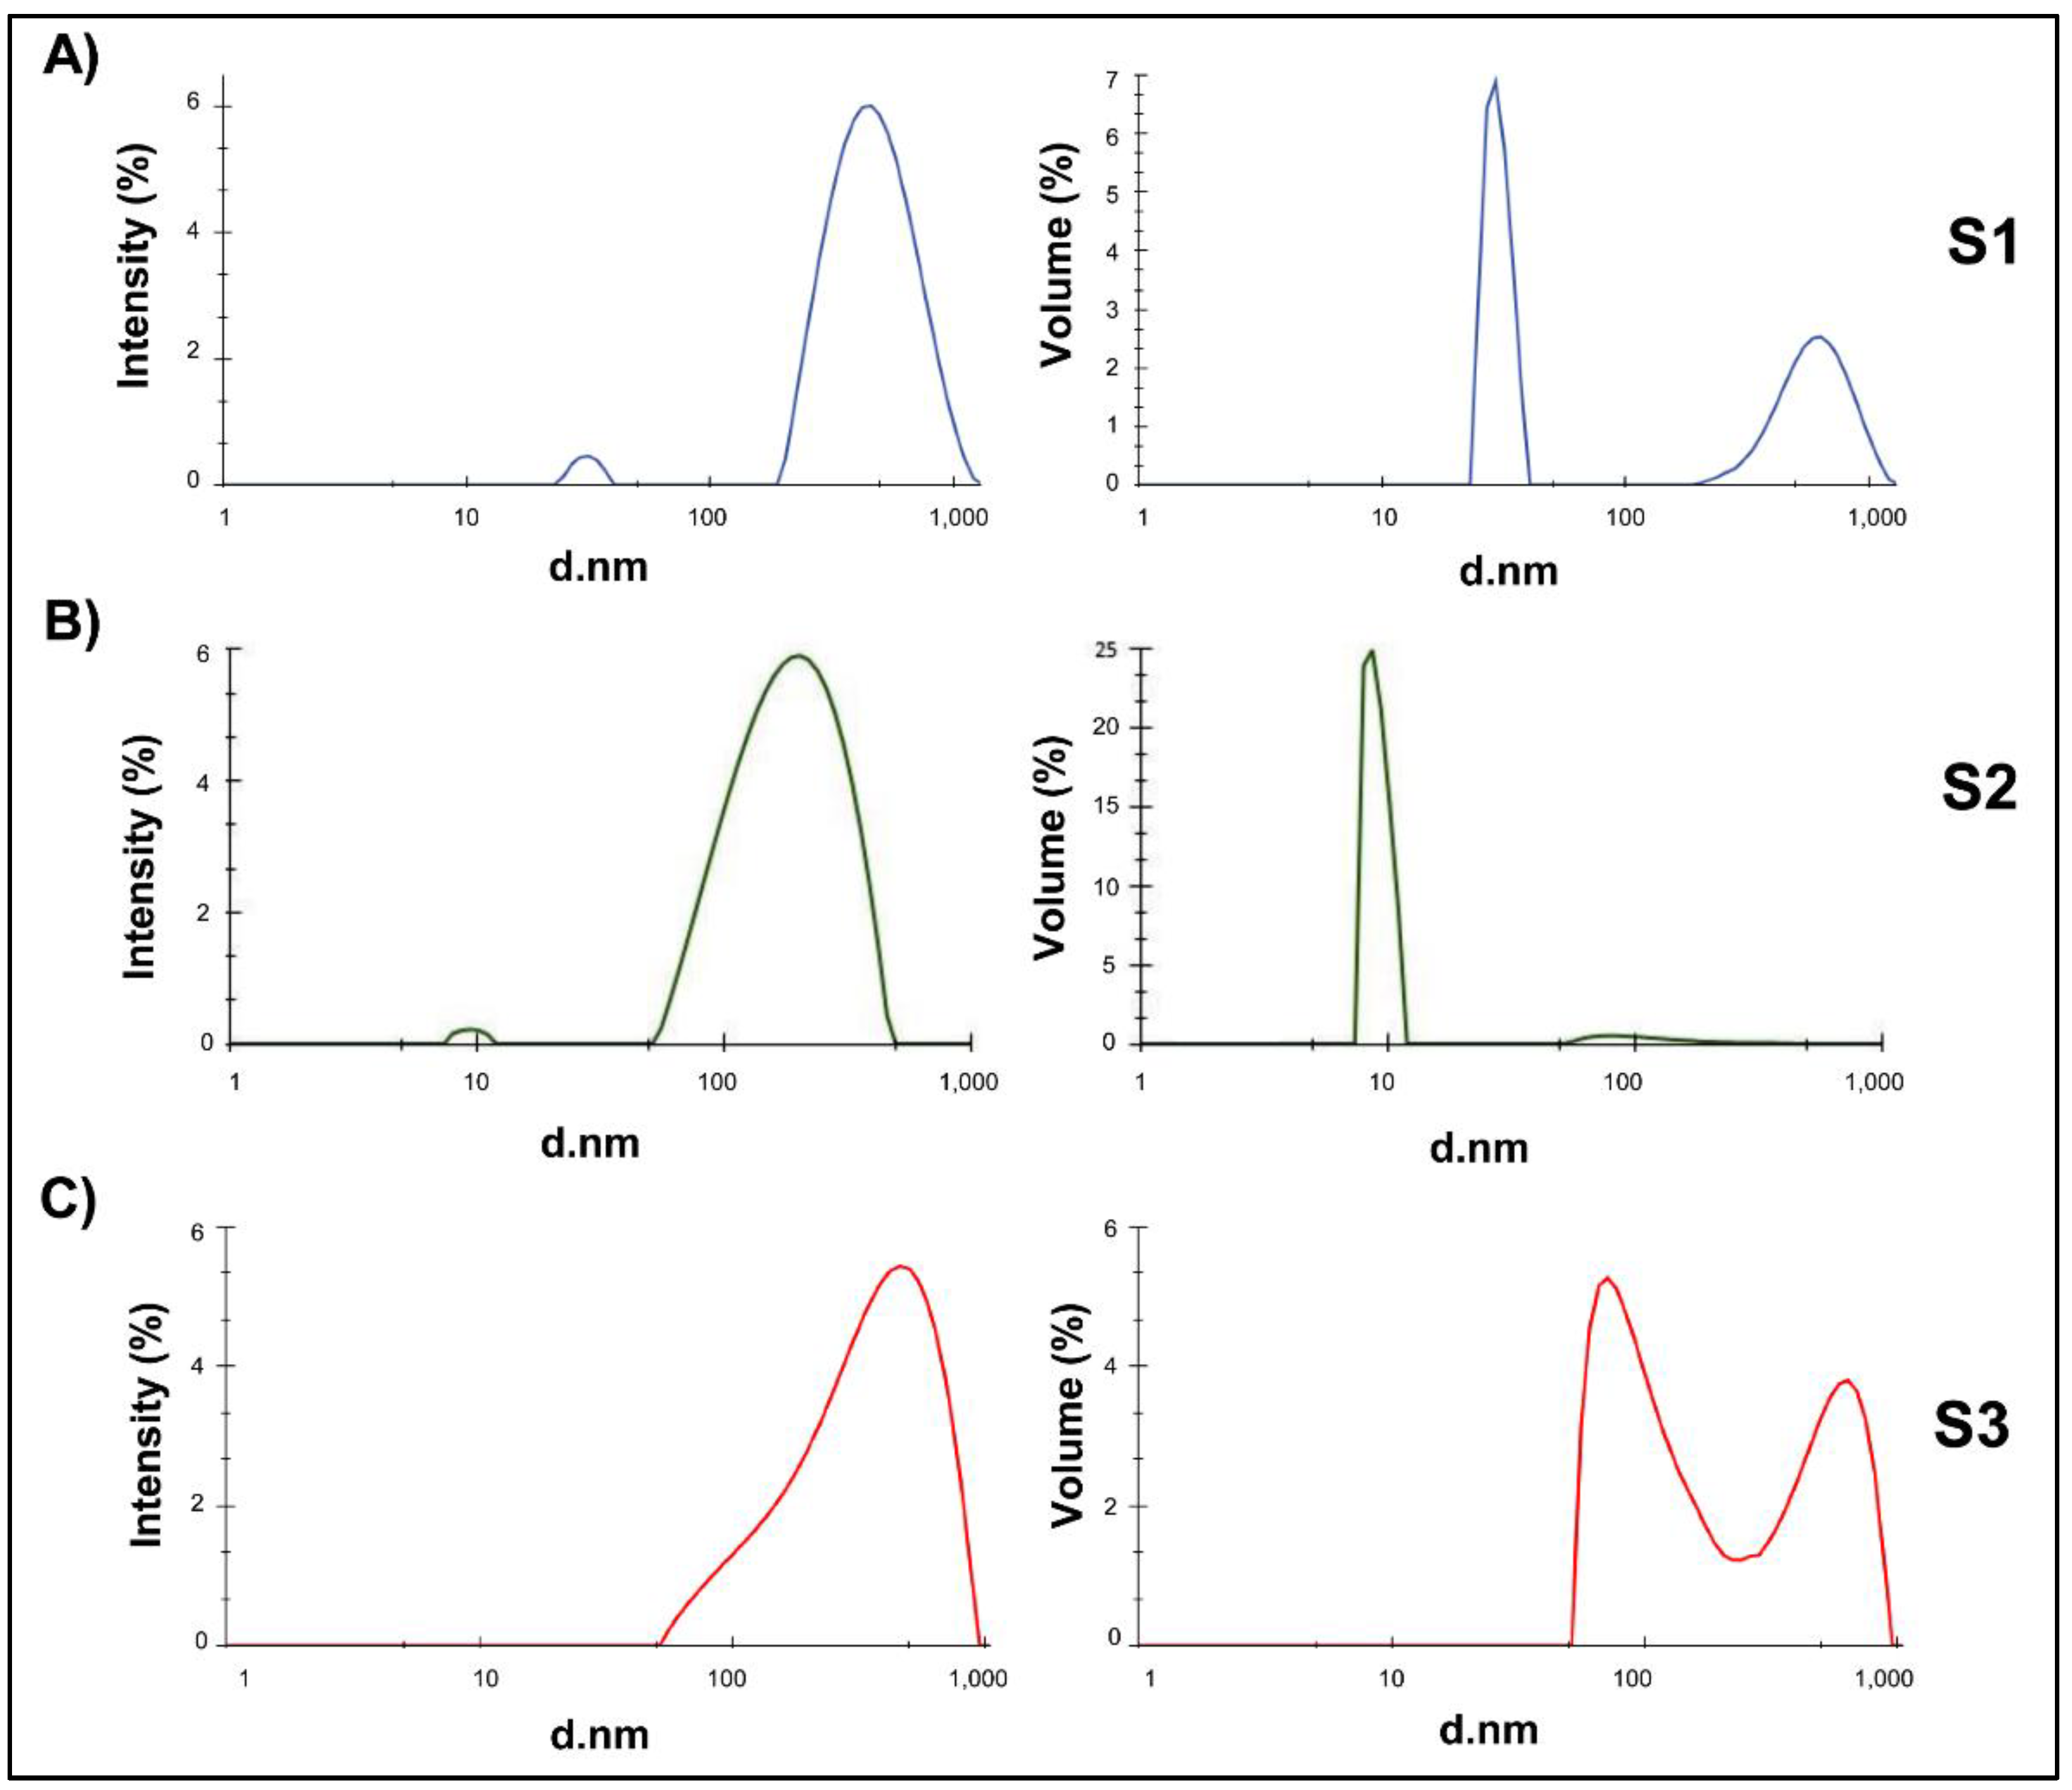
Figure 5.
A) SEM images, showing the NG ultrastructure of different formulation. a) Single CS. b) NG S1. c) NG S2. d) NG S3. B) Histograms representing particle size distributions for the three-pH considered (indicated as S1, S2 y S3), each overlaid with a fitted Gaussian curve. Since the histograms were normalized, Y-axis was labelled as density, and the bars were scaled so that the total area under each histogram equals 1. Dashed red lines indicate the mean particle size for each distribution.
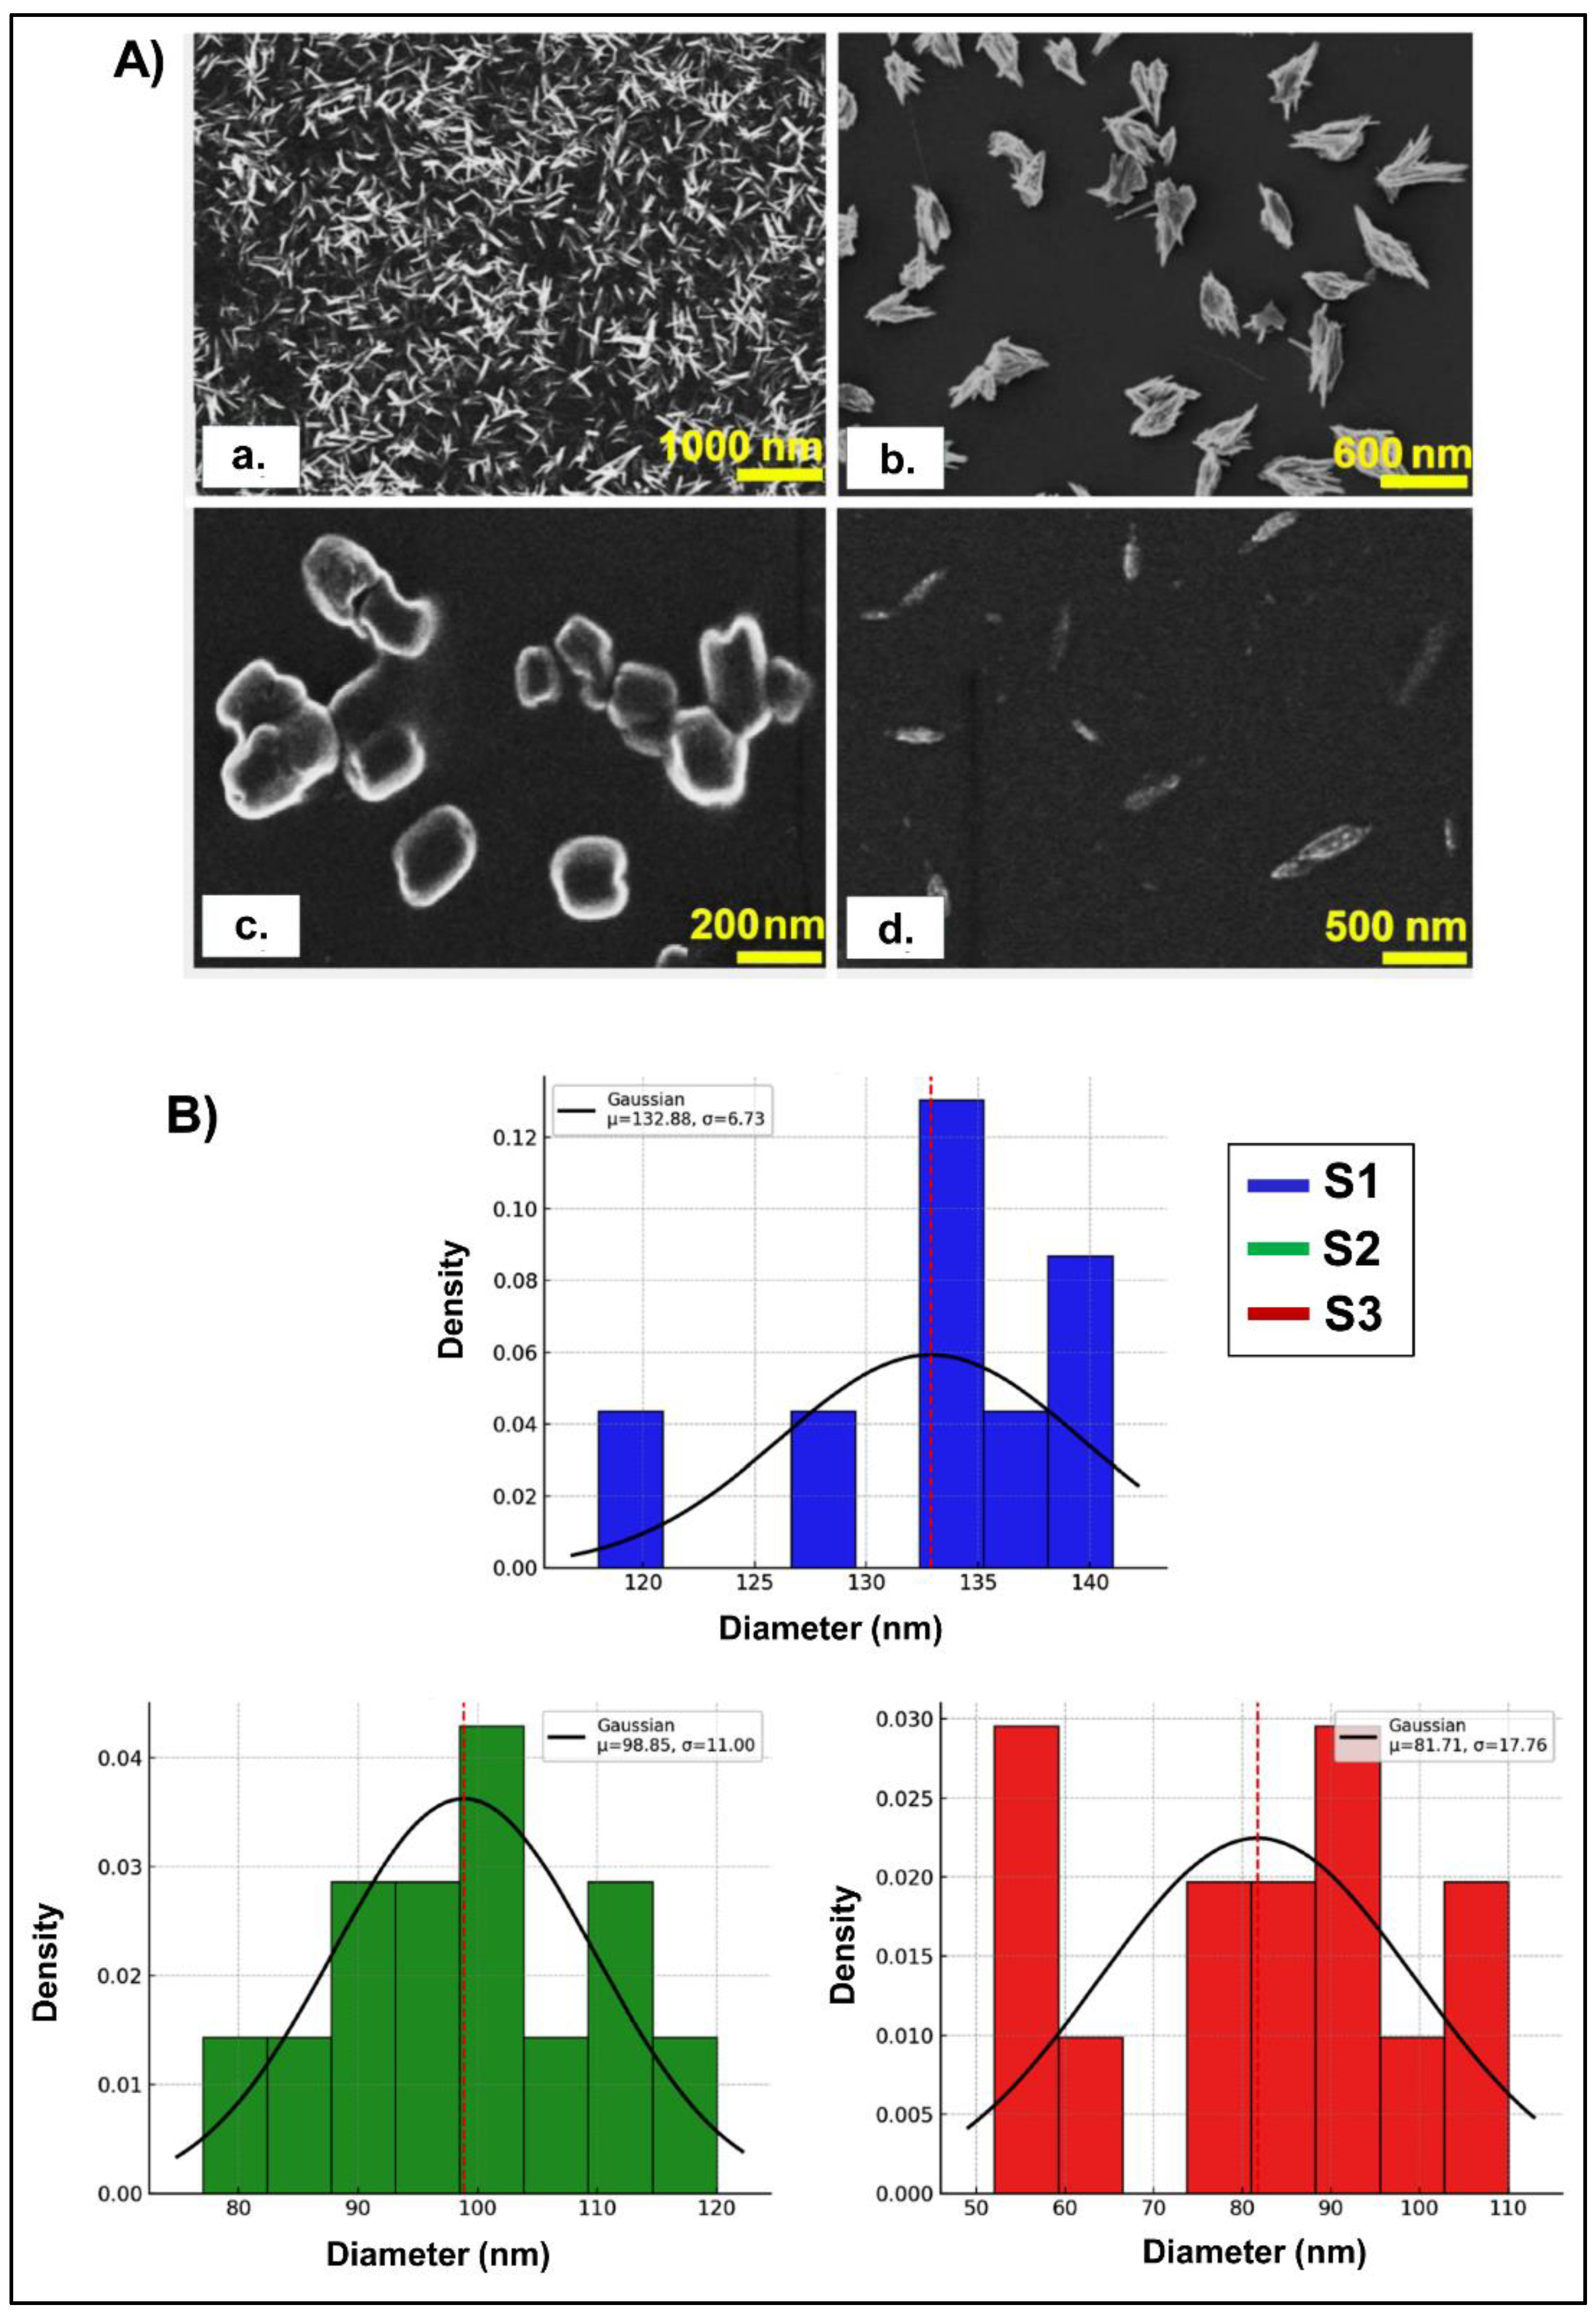
Figure 6.
A) Frequency sweeps of the NG (S1, S2, S3) suspensions. Showing the evolution of G' (elastic modulus) and G'' (viscous modulus) as a function of angular frequency. B) Plot of tan δ (G”/G’) vs. angular frequency. C) Flow curves of the NG suspensions, showing the apparent viscosity (η) as a function of shear rate (0–300 s⁻¹).
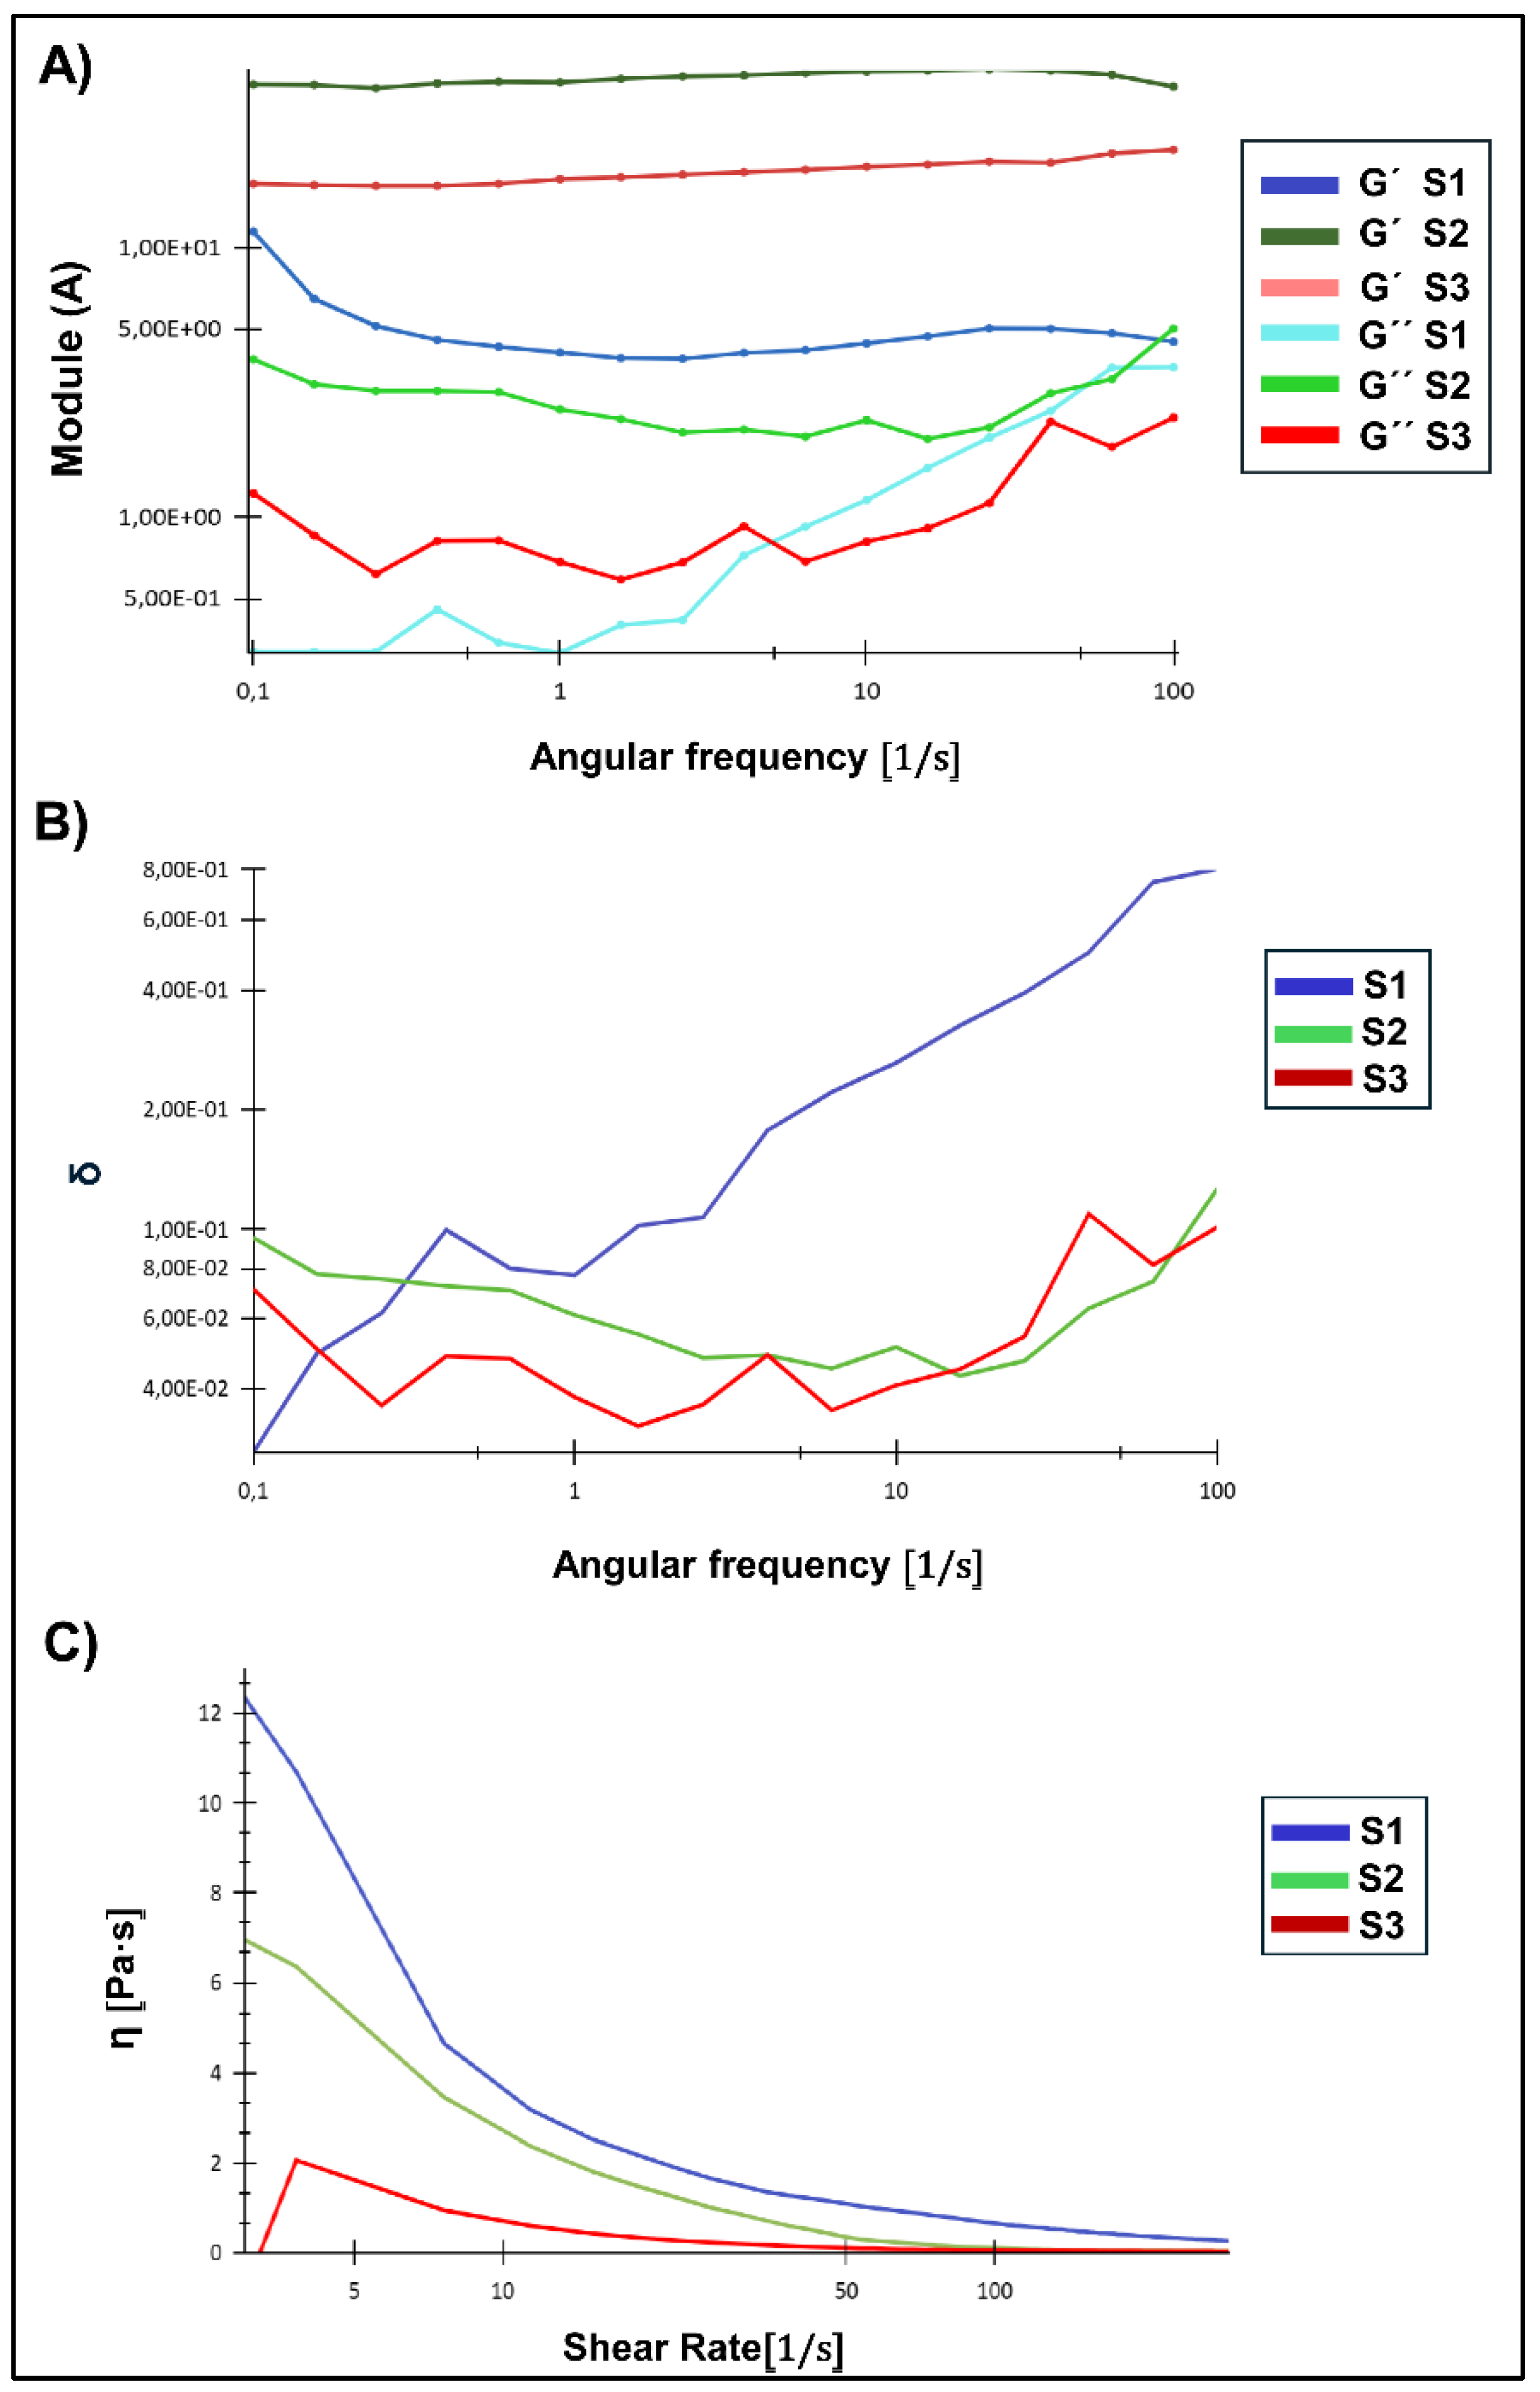
Figure 7.
A) Fits using the Debye–Bueche model in the low-q region (q < 0.02 nm⁻¹). B) Power-lawfits in the intermediate-q region (0.02 < q < 0.1 nm⁻¹).
Figure 7.
A) Fits using the Debye–Bueche model in the low-q region (q < 0.02 nm⁻¹). B) Power-lawfits in the intermediate-q region (0.02 < q < 0.1 nm⁻¹).
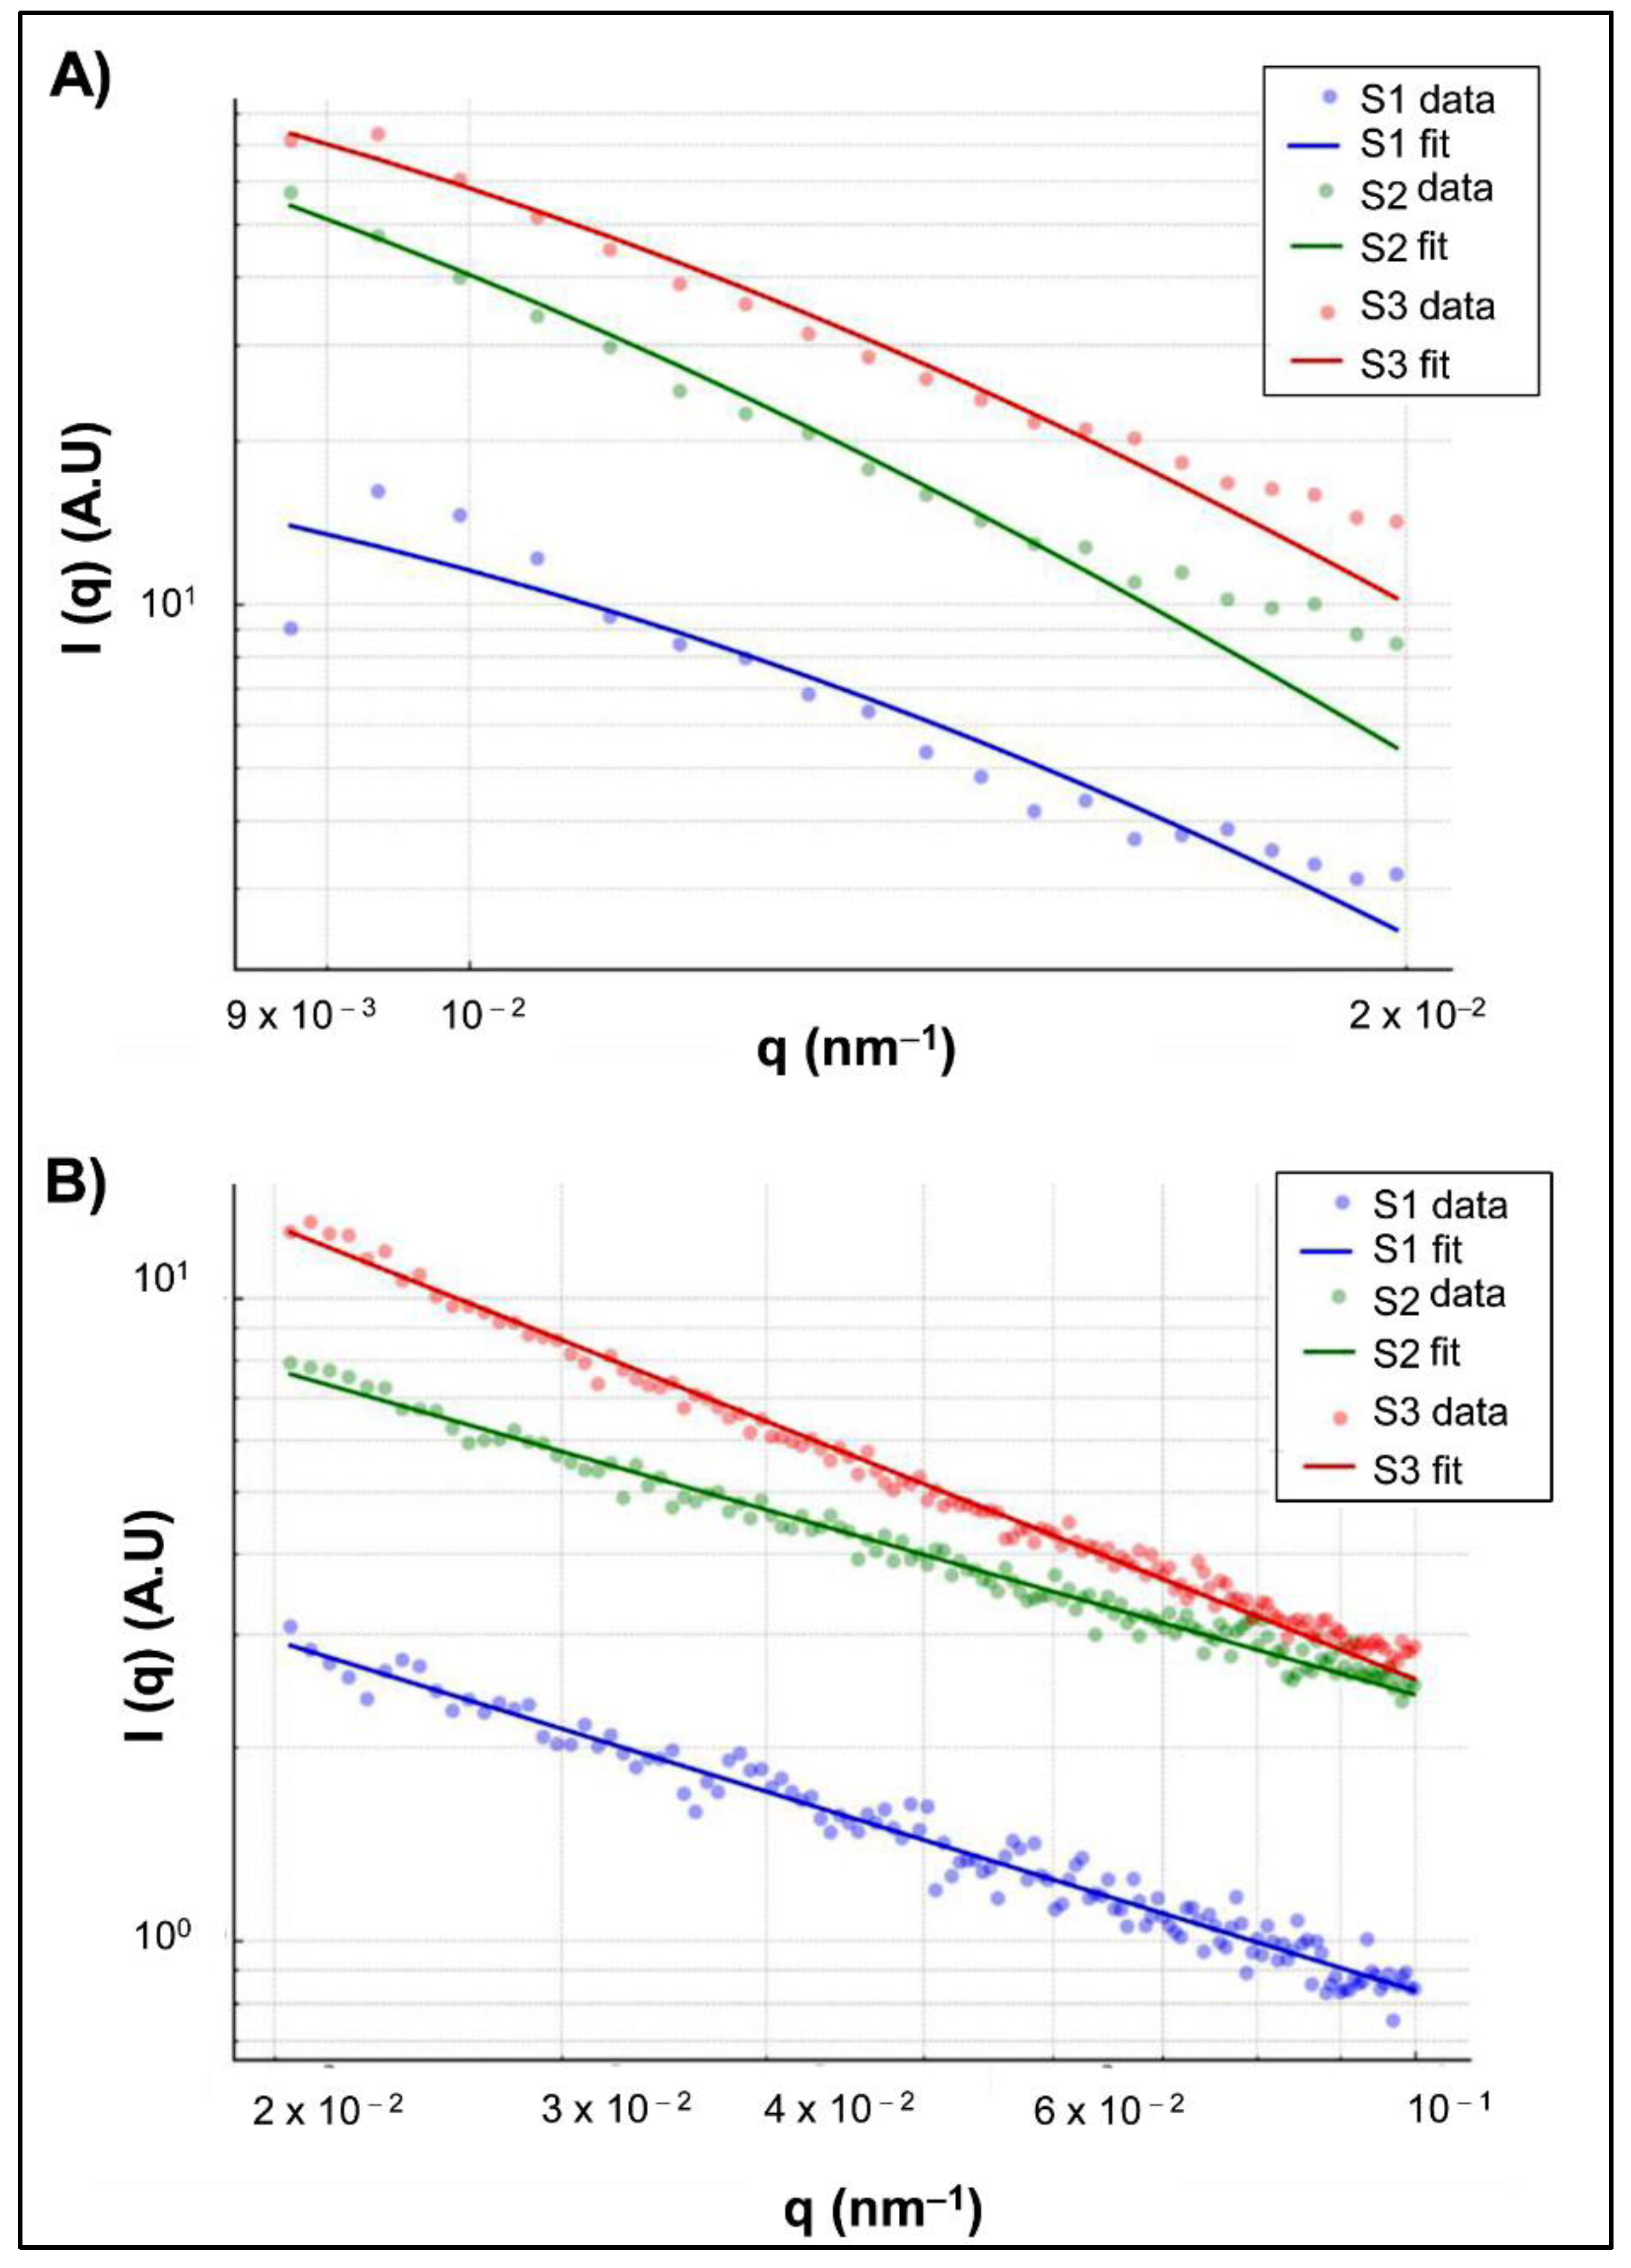
Figure 8.
Biological evaluation of CS-GNP NGs. A) Cell viability of L929 fibroblasts after exposure to increasing concentrations of NG, assessed by MTT assay. B) Internalization study in ARPE-19 cells incubated with 30 µg/mL CS-GNP NG (S2) at 37 °C for different times intervals, visualized by fluorescence microscopy. Scale bar: 10µm. C) Quantification of cellular uptake represented as mean fluorescence intensity over time.
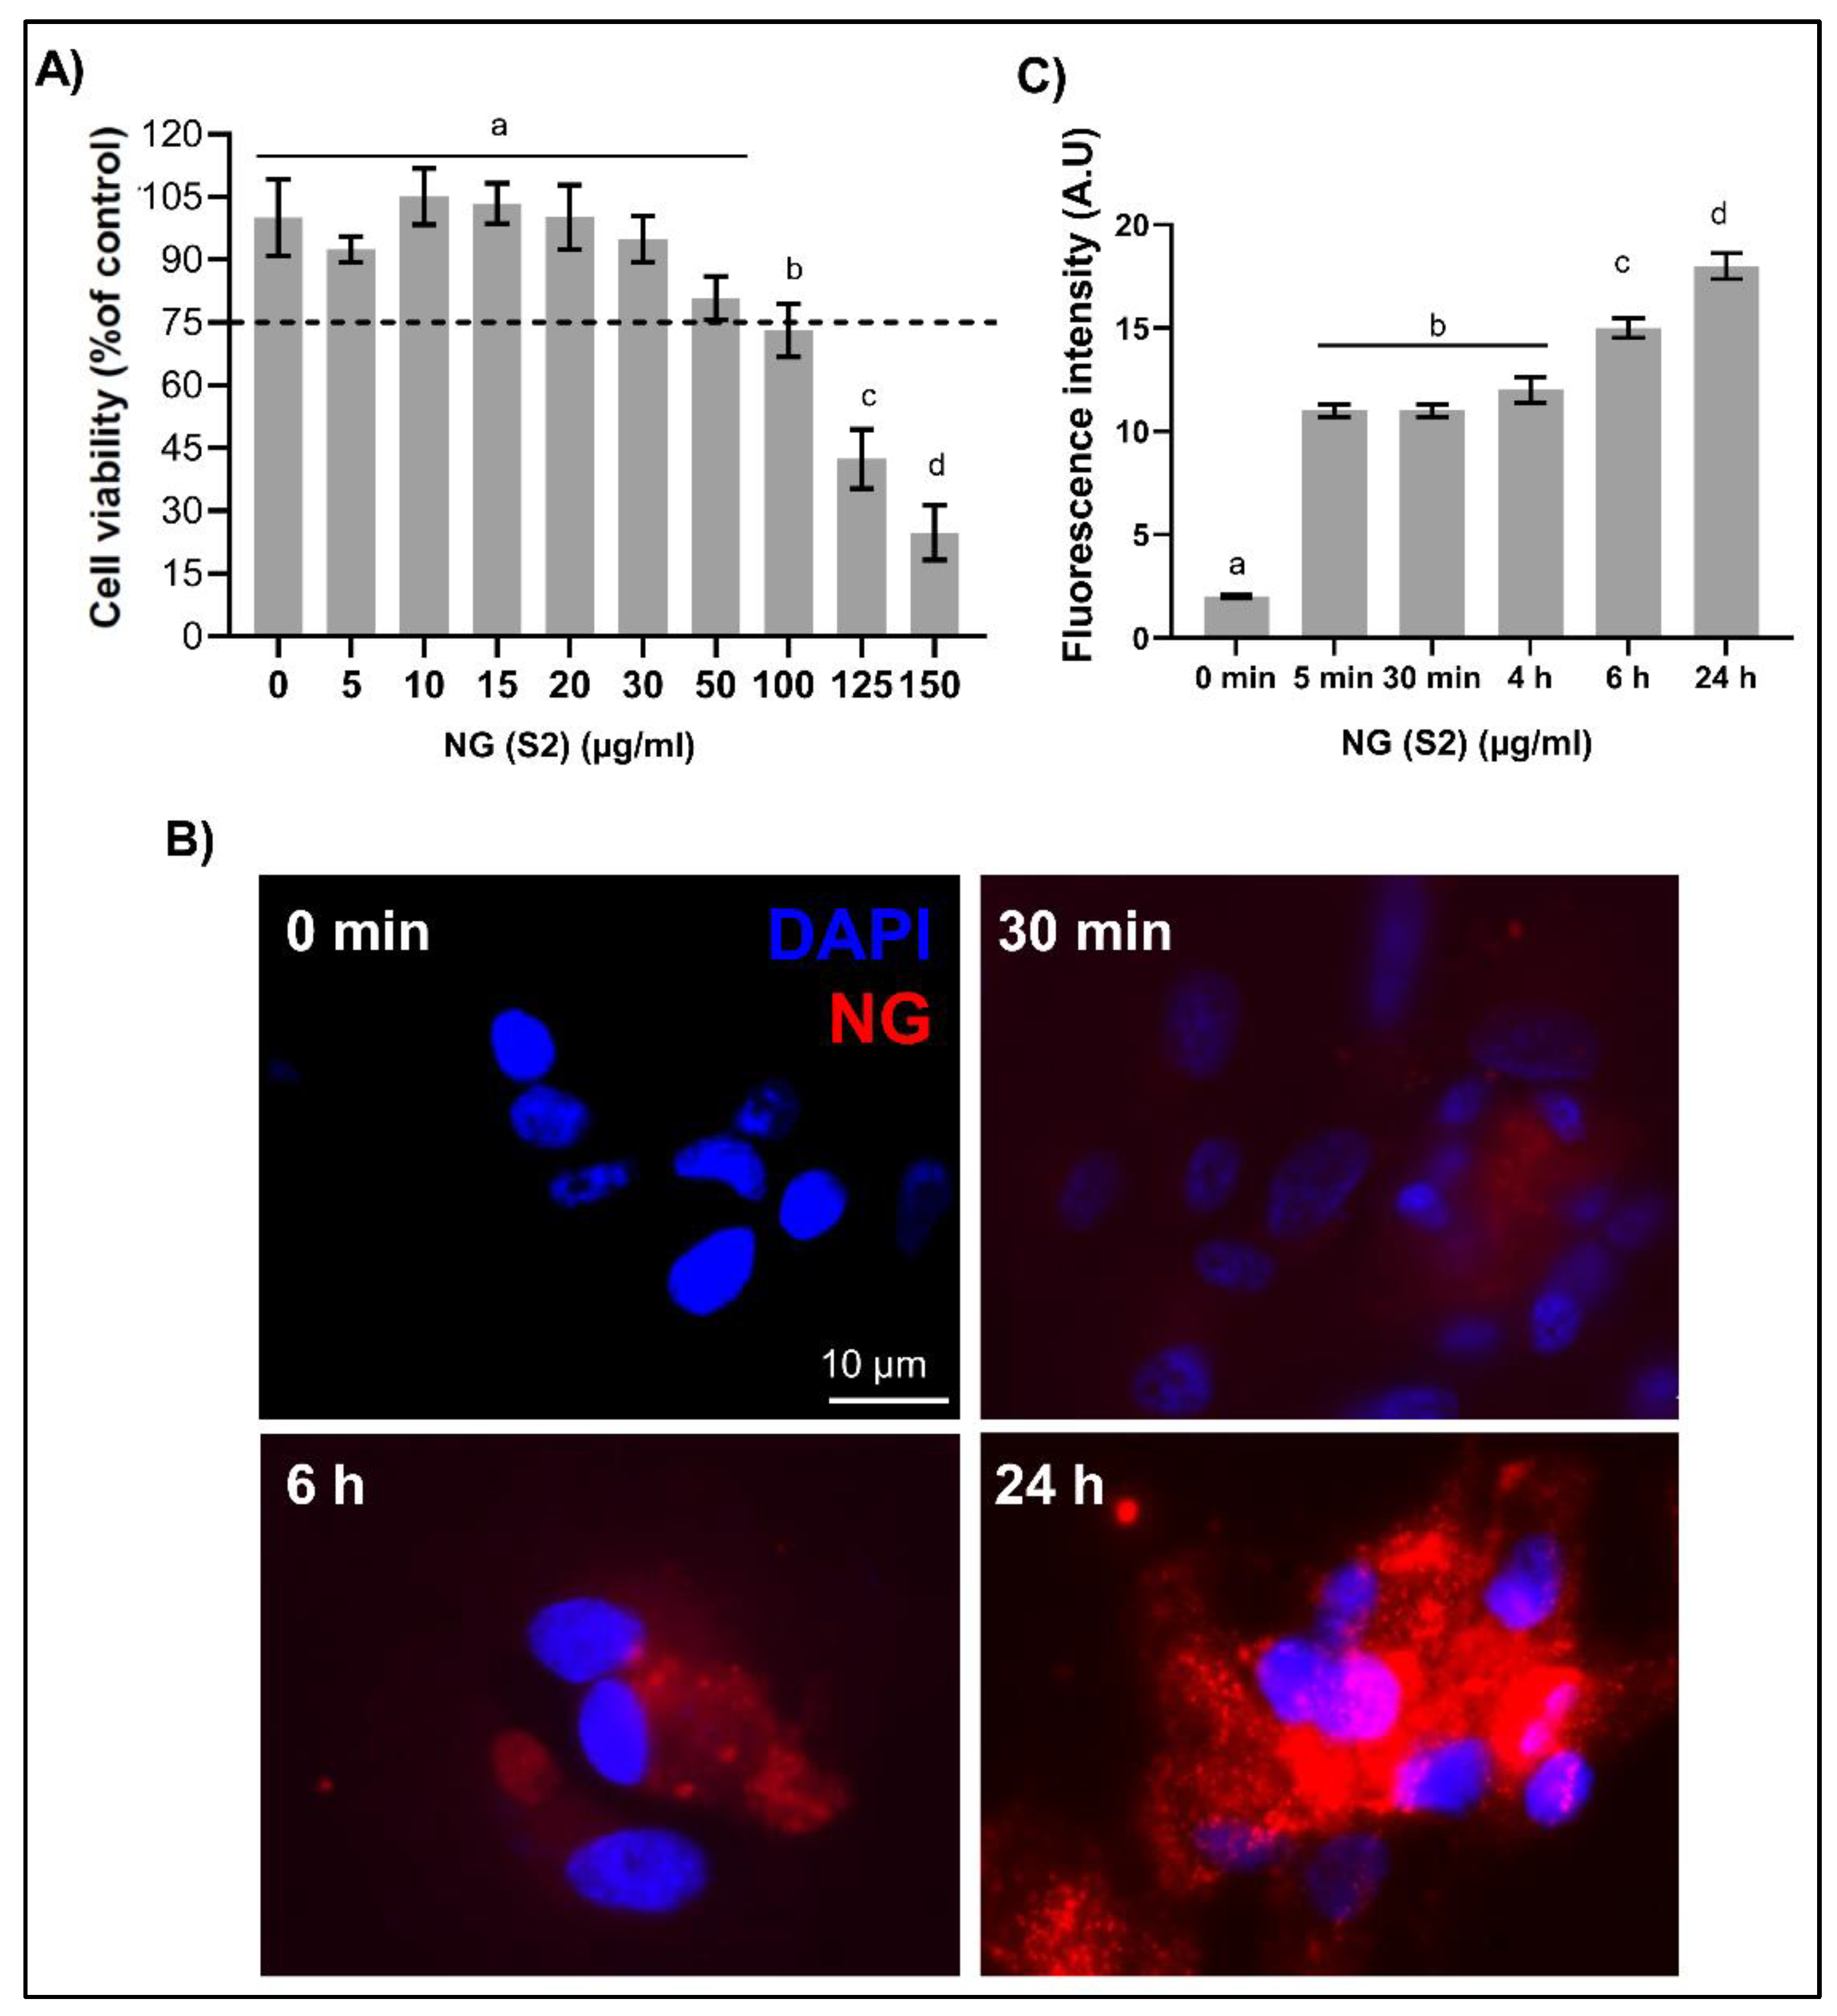

Table 1.
Relative volumes (% w/v) of CS and GNP mixtures used to obtain NG (S1-S3) samples under different pH conditions.
Table 1.
Relative volumes (% w/v) of CS and GNP mixtures used to obtain NG (S1-S3) samples under different pH conditions.
| Sample | %CS | %GNP | pH CS |
| S1 | 0.3 | 0.1 | 3.6 |
| S2 | 0.3 | 0.1 | 4.5 |
| S3 | 0.3 | 0.1 | 5.5 |
Table 2.
Formation rates calculated from the 4P sigmoid fit.
| Sample | Phase | (1/t) | R2 |
| S1 | Initial Nucleation | 1.01e-06 ± 4.76E-8 | 0.9784 |
| S2 | Initial Nucleation | 9.25E-06 ± 3.45E-7 | 0.9775 |
| S3 | Initial Nucleation | 2.65E-05 ± 1.34E-6 | 0.9682 |
| S1 | Exponential phase | 0.00025 ± 1.56E-6 | 0.9784 |
| S2 | Exponential Phase | 0.0023 ± 9.96E-5 | 0.9775 |
| S3 | Exponential Phase | 0.0066 ± 1.21E-5 | 0.9682 |
Table 3.
Parameters derived from the suspension’s characterization for each CS-GNP combination consideration.
Table 3.
Parameters derived from the suspension’s characterization for each CS-GNP combination consideration.
| Sample | PDI | ζ-Potential (mV) | G´ (1 Hz) | μap |
| S1 | 0.229 ± 0.035 a* | 31.64 ± 1.43 a | 4.09a | 0,331 ± 0,045a |
| S2 | 0.252 ± 0.024 a | 29.35 ± 1.17 a | 41.2 b | 0,0418 ± 0,0052b |
| S3 | 0.274 ± 0.033 a | 20.42 ± 0.75 c | 18.0 c | 0,0336 ± 0,0336 c |
*Average values derived from NG PDI, ζ-Potential, G’ evaluated at a fixed frequency (1 Hz) and the apparent viscosity, µ, at the asymptotic portion of the curve. Different letters represent significantly different groups, p< 0.05 (Tukey post hoc).
Table 4.
A) Debye–Bueche fitting parameters in the low-q range. B) Power-law fitting parameters in the intermediate-q range.
Table 4.
A) Debye–Bueche fitting parameters in the low-q range. B) Power-law fitting parameters in the intermediate-q range.
| A | B | |||
| Sample | ξ (nm) | R2 | m | R2 |
| S1 | 79.6 ±- 15a | 0.826 | 0.78 ± 0.12a | 0.954 |
| S2 | 119.0 ± 4b | 0.98 | 0.7 ± 0.042b | 0.97 |
| S3 | 94.0 ± 8a | 0.976 | 0.96 ± 0.034c | 0.978 |
*Different superscript letters represent significantly different groups, p< 0.05 (Tukey post hoc).
Disclaimer/Publisher’s Note: The statements, opinions and data contained in all publications are solely those of the individual author(s) and contributor(s) and not of MDPI and/or the editor(s). MDPI and/or the editor(s) disclaim responsibility for any injury to people or property resulting from any ideas, methods, instructions or products referred to in the content. |
© 2025 by the authors. Licensee MDPI, Basel, Switzerland. This article is an open access article distributed under the terms and conditions of the Creative Commons Attribution (CC BY) license (http://creativecommons.org/licenses/by/4.0/).
Copyright: This open access article is published under a Creative Commons CC BY 4.0 license, which permit the free download, distribution, and reuse, provided that the author and preprint are cited in any reuse.


