
Submitted:
01 August 2023
Posted:
02 August 2023
Read the latest preprint version here
Abstract
Silver nanoparticles from Origanum vulgare (Oregano) have been synthesized in the past. However, no investigation has been performed on the combined effects of independent factors that affect the synthesis. Silver nitrate and Oregano concentrations, incubation temperature and time, as well as pH can play crucial roles in synthesis. In this regard Full Factorial Design was applied. A Voigt function was fitted on the measured UV – Vis spectra. The fitting parameters of the Voigt function (peak wavelength, area, and Full Width at Half Maximum) were used as the responses. A quadratic model was fitted for the peak wavelength and area, and the pH proved the dominant factor on nanoparticle synthesis.
Keywords:
Silver nanoparticles
; Green synthesis
; full factorial design synthesis
1. Introduction
Silver Nanoparticles (AgNPs) have demonstrated excellent antimicrobial activities against a variety of microorganisms, which makes them suitable for materials used in medical products [1]. Nano silver also has been used in textiles, coated water filters, in treatment of mental illness and other areas [2].
Among various synthesis methods, green synthesis of AgNPs has received attention because it involves microorganisms and biomolecules, is eco-friendly and cheap[3,4]. Silver, gold and other metallic nanoparticles can be synthesized using plant extracts obtained from dry or fresh leaves, fruits, and seeds[4]. In a typical reaction, a metal salt solution is mixed with the extract, and a reduction of the metal ion occurs[4], with simultaneous capping of the formed nanoparticle [5]. A range of factors control the reaction such as metal salt and extract concentration, pH, incubation time and temperature[5,6].
Oregano (Origanum vulgare L.), is an aromatic herb rich in antioxidant compounds including phenolic acids, flavonoids and essential oils such as thymol, having as a result health benefits on human body[7]. Origanum mediated synthesized Ag NPs have been proposed as alternative antibacterial agents[8,9]. Silver nitrate (AgNO3) aqueous solution with concentrations ranging from 0.5 mM up to 100 mM have been reported[1,9,10,11,12], used as the precursor for silver ions. The effects of reaction time and temperature were investigated[12].
In this work the combined effects of metal salt and extract concentrations, pH, incubation time and temperature were investigated using a full factorial design and response surface methodology. The UV – Vis absorption peak wavelength λ0, the area under the absorption curve (A) and the Full Width at Half Maximum (FWHM) were used as the responses. To our knowledge this is the first time such a work is reported for AgNPs synthesized using Oregano.
2. Materials and Methods
2.1. Chemicals – Oregano Extract
AgNO3 aqueous solution (0.1M) and sodium hydroxide (NaOH) pellets were purchased from Sigma Aldrich (Steinheim, Germany). Dried oregano (grown in the island of Lemnos) leaves were purchased from a local herb store in Lemnos Greece.
The Oregano Extract (OE) was prepared as follows: 3.76 gr of dried oregano leaves were boiled in 100 mL distilled water for 10 min. The final extract was obtained with filtering using cheesecloth. The extract was stored at 4 °C for future experiments.
2.2. Silver Nanoparticle Synthesis
A final volume of 2.5 mL aqueous solution was used in all synthesis unless otherwise stated. AgNO3 at a concentration () range 0.25 – 2 mM was used as the precursor of silver ions [13]. The reaction started by adding OE at a concentration ( in the range (0.8 – 20 % v/v). NaOH at a concentration () range (0 – 7.9 mM) was also added. In a typical synthesis procedure, a mixture of AgNO3, OE and NaOH at specific concentrations was heated in a water bath at a temperature (incubation Temperature) of 60 °C, for 1 h (incubation Time). All synthesis was performed in the dark without stirring.
2.3. Characterization Techniques
UV – Vis spectroscopy measurements were performed using the Perkin Elmer – Lambda 25, UV – Vis spectrophotometer, in the spectral range 340 – 700 nm, using 1 mL cuvettes with 1 cm pathlength.
X- Ray Diffraction Patterns (XRD) and Fourier Transform Infrared (FTIR) experiments were carried out as described in a previous work [13]. The AgNPs investigated with these techniques (XRD and FTIR), were prepared with the following conditions: AgNO3 concentration 1 mM, OE concentration 2 % v/v, and NaOH concentration 2 mM. The obtained nanoparticles were centrifuged at 20000 G, for 30 min at 4 °C, prior to these measurements.
2.4. Statistical Analysis and Experimental Design
As in a previous work [13], nanoparticle formation was observed by visual inspection for a colour change of the reaction solution and measuring the UV – Vis absorbance of an aliquot. The UV – Vis spectra were fitted using a Voigt profile [14] with fitting parameters [13]: the peak wavelength (λ0) at maximum absorption, the Full Width at Half Maximum (FWHM), and the peak area under the UV – Vis curve (A). The best fit of the UV – Vis absorption spectra was found using the routine Peak Analyzer of the software Origin Pro (version 2020). The quality of fit was determined using the R square regression coefficient (), and the fit significance was examined using ANalysis Of Variance (ANOVA) (p-value smaller than 0.05)[13].
The combined effects of the three independent factors: OE concentration (X1), AgNO3 concentration (X2), and NaOH concentration (X3), on the measured UV- Vis spectra using as responses the above fitting parameters were investigated using Full Factorial Design (FFD) under Response Surface Methodology (RSM). Three levels were used for each factor: (-1, 0, and 1). Each of the factors was coded using the following equation[15]:
where Xi and xi the coded and the actual value of independent factor i, xoi the central value (level 0) of factor I, and Δxi the step change of xi corresponding to a unit change of the coded value[16].
The central values for the experimental design were: AgNO3 concentration 1 mM, OE concentration 2 % v/v, and NaOH concentration 1 mM, with corresponding steps 0.5 mM, 1.2 % v/v, 1 mM respectively. The experimental design consisted of 27 runs (Table 1), and each of the runs was repeated three times. These factors and their values were selected after preliminary experiments.
A second order polynomial was obtained for each response as function of the coded values (Xi) of the independent factors[13,17]:
where β’s are the regression coefficients[13,18].
Standard procedures were applied to assess the quality of the regression polynomials [19]. ANOVA was applied to assess the significance and adequacy of the model., as well as the significance of the regression coefficients appearing in the derived polynomial[20].
The magnitude and sign of the regression coefficients, and Pareto analysis[21], were used as a measure of the importance of the various independent factors and their interactions at significance level 5% (p-value < 0.05), unless otherwise stated. Not statistically significant terms were excluded from the polynomial models except of those required for a hierarchical mode [13].
3. Results and Discussion
3.1. UV – Vis Spectra Analysis
An absorption peak within the range of 400 – 450 nm, is indicative of AgNPs formation, which is attributed to a surface plasmon resonance[22,23,24]. Colour change of the reaction mixture also allows visual monitoring of AgNP formation[25].
In Figure 1, the combined effects of OE and NaOH concentrations on the UV – Vis spectra are plotted. A better absorption curve can be observed at the lowest extract concentration (OE 2 % v/v Figure 1a), with the presence of NaOH. A Voigt profile has been shown to fit adequate with UV – Vis spectra of AgNPs solution in a previous study, providing a method of correlation between nanoparticle formation and synthesis parameters [13]. A single Voigt profile was suitable and in this work for the lowest extract concentration. Agglomerated or ill – formed nanoparticles[26], their crystallinity[27,28], and charge transfer between nanoparticles can influence the observed UV- Vis spectrum[29].
The addition of NaOH changes the pH of the solution. The pH of the reaction changes the chemical nature of the extract, which has an effect to change its performance and rate of reduction and therefore nanoparticle synthesis[30]. The size and shape of silver nanoparticles are affected from the pH of the reaction solution[31,32,33,34]. This was investigated further with the addition of hydrochloric acid (HCl), which did not produce any nanoparticles as shown in Figure 2.
The fitting parameters used in the Voigt profile are related to nanoparticle size, shape, yield and size distribution[13]. The aim was to determine the appropriate conditions that produce smallest peak wavelength with maximum peak area and narrowest FWHM. The investigation showed (see Supporting Information: Figures S1 – S3, and Tables S1, S2), that this is possible at incubation temperature of 60 °C, incubation time 1h, and NaOH concentration in the range (0 – 2 mM).
The corresponding ranges of OE and AgNO3 concentrations were investigated in a similar manner as shown in Figure 3. The investigation (see Supporting Information: Table S3) determined a range (0.5 – 1.5 mM) for AgNO3 and (0.8 – 3.2 % v/v) for OE concentrations.
3.2. Statistical Modelling of AgNPs Synthesis
In order to elucidate on, the effect of all independent factors as well as their interactions, on the AgNPs synthesis, a quadratic regression model was applied (Equation 2), for each response. The ANOVA for each response is given in Table 2, Table 3 and Table 4.
A p-value smaller than 0.001, can be observed for the quadratic model for both the peak wavelength at maximum λ0 (Table 2), and the peak area A (Table 3) indicating that the quadratic model was suitable for both responses. This is further supported by the large value of the F statistic. In contrast, a pure model can be observed for the FWHM (Table 4) (p-value = 0.1435) and F = 1.56. The coefficient of determination (R2) of the models for the peak wavelength was 93.92%, whereas for the peak area was 89.41%, which indicates a good correlation between observed and predicted values[15,17,35]. The model adequacy was tested by applying standard diagnostic tools (See Supplementary Material)[19,20]
The regression coefficients for the wavelength at peak maximum λ0 are given in Table 5. The wavelength is affected mainly from the NaOH concentration (X3), followed by equal contribution from OE (X1), and AgNO3 (X2) concentrations. A large contribution appears from the quadratic term of NaOH concentration. A small contribution also appears from the interaction term X2X3 of AgNO3 and NaOH concentrations. Terms were NaOH concentration appears, contribute negatively to the peak wavelength.
The response surface (peak wavelength) for AgNPs synthesis therefore is provided by the following second order polynomial:
The regression coefficients for the peak area A are given in Table 6. The area is affected almost equally from NaOH (X3) and AgNO3 (X2) concentrations, followed by the OE (X1) concentration. A large contribution appears from the interaction term X2X3 of AgNO3 and NaOH concentrations, followed by a smaller contribution from the interaction terms X1X2 of OE and AgNO3 concentrations, and the interaction X1X3 with negative sign of OE and NaOH concentrations. A large negative contribution appears for the quadratic terms of both AgNO3 and NaOH concentrations.
The response surface (peak area) for AgNPs synthesis therefore is provided by the following second order polynomial:
Pareto analysis percentages are shown in Table 7, for the wavelength at peak maximum λ0, and the peak area A quadratic model terms. In both cases the largest contribution comes from the NaOH concentration (X3) with values 59.53% (wavelength) and 52.53% (area). A total of 97.8% for the peak wavelength is influence by the linear and quadratic term of NaOH concentration, in contrast to 57.61% for the peak area. The peak area is correlated to the quantity of formed nanoparticles which should depend on both AgNO3 (20.74%) and OE concentrations (3.85%). This is not sufficient however, for the synthesis of nanoparticles as the presence of NaOH plays a crucial role, in both the number of formed nanoparticles (area) and their size (wavelength). This agrees, with previous work reporting the effect of pH on nanoparticle size[30,32,34].
Examination of the data (Table 1) revealed that the best UV- Vis spectra in terms of minimum wavelength λ0 at peak maximum, minimum FWHM and maximum area A, can be obtained for the factor combination corresponding to experimental run 23. This run corresponds to an actual OE concentration of 0.8 %v/v, AgNO3 concentration 1 mM, and NaOH concentration 1 mM. The measured peak wavelength 409 nm is smaller than the reported values by other groups[1,9,10,11,12], who have not investigated pH effects.
3.3. XRD
XRD pattern of dry powder obtained from the formed AgNPs was achieved. The analysis exhibited poor crystallinity of the sample with a broad peak formed ~25° possibly caused by the Oregano, although Ag contributions superimposed on the board pattern are visible (Figure 4). This is rational since the characteristic peaks of AgNPs are not easily recognizable when synthesized using natural products[36,37,38,39].
3.4. FTIR
FTIR was used to identify the ligands that surround the nanoparticle surface. Seven absorption bands appear in the spectrum (Figure 5). The weak band at 3749 cm−1, indicates the presence of polyphenols due to the binding of silver ions with hydroxyl group[13,40]. The band at 3438 cm−1 originates either from O-H or NH stretching vibration[41,42]. The band at 2961 cm−1 indicates C-H stretching for an alkane[43]. The small shoulder formed at 2850 cm−1 and 2918 cm−1 arises from the C-H stretching vibrations either from -C-H- or -C-H2 – aliphatic compounds[41,42]. The band at 1636 cm−1 is attributed to the C-N and C-C stretching[13,40]. The sharp band at 1384 cm−1 corresponds to the N=O symmetry stretching typical of the nitro compounds[13,40]. The bands at 1056 cm−1 and 1112 cm−1 are assigned to stretching vibration C-O[44]. The band around 836 cm−1 could be attributed to out-of-plane C-H wagging vibrations, the most significant signal used in distinguishing between different types of aromatic ring substitution [45].
4. Conclusions
The NaOH concentration or equivalent the pH of the solution, is the main factor that influences the nanoparticle synthesis both in terms of size and quantity. The proposed model opens the possibility for size tunning of silver nanoparticles synthesized by Oregano extract. A Voigt function could be fitted on the UV-Vis spectra, with parameters the wavelength at peak maximum λ0, the peak area A under the curve, and the Full Width at Half Maximum. A quadratic model can be fitted on both the wavelength λ0, and the area A.
Supplementary Materials
The following supporting information can be downloaded at the website of this paper posted on Preprints.org. Figure S1: Effect of incubation temperature on UV- Vis spectra: a) 40 °C, b) 60 °C. AgNO3 concentration 1mM, OE concentration 2 % v/v, NaOH concentration 2 mM, and incubation time 10 min; Figure S2: Effect of incubation time on UV – Vis spectra. AgNO3 concentration 1 mM, OE concentration 2 % v/v, NaOH concentration 2 mM, and incubation temperature 60 °C; Figure S3: Effect of NaOH or HCl concentration on UV – Vis spectra. a) Coarse investigation, b) Fine tuning. AgNO3 concentration 1 mM, OE concentration 2 % v/v, incubation temperature 60 °C, and incubation time 1h; Figure S4: Normal probability plot of residuals: a) wavelength at peak maximum λ0, and b) peak area A; Table S1: Fitting parameters of a Voigt function (λ0, A and FWHM) discussed in text, for UV- Vis spectra at different incubation temperatures and times. AgNO3 concentration 1 mM, OE concentration 2 % v/v, and NaOH concentration 2 mM; Table S2: Fitting parameters of a Voigt function (λ0, A and FWHM) discussed in text, for UV – Vis spectra at different NaOH concentrations. AgNO3 concentration 1 mM, OE concentration 2 % v/v, incubation temperature 60 °C, and incubation time; Table S3: Fitting parameters of a Voigt function (λ0, A and FWHM) discussed in text, for UV – Vis spectra at different OE and AgNO3 concentrations. NaOH concentration 1 mM, incubation temperature 60 °C, and incubation time 1h.
Author Contributions
Conceptualization, Nickolas Rigopoulos; Data curation, Nickolas Rigopoulos, Christina Megetho Gkaliouri and Victoria Sakavitsi; Formal analysis, Nickolas ournis; Investigation, Nickolas Rigopoulos, Christina Megetho Gkaliouri, Victoria Sakavitsi and Dimitrios Gournis; Methodology, Nickolas Rigopoulos and Dimitrios Gournis; Project Rigopoulos, Victoria Sakavitsi and Dimitrios Gournis; Funding acquisition, Dimitrios G administration, Nickolas Rigopoulos; Resources, Dimitrios Gournis; Software, Nickolas Rigopoulos, Christina Megetho Gkaliouri and Victoria Sakavitsi; Supervision, Nickolas Rigopoulos and Dimitrios Gournis; Validation, Nickolas Rigopoulos, Victoria Sakavitsi and Dimitrios Gournis; Visualization, Nickolas Rigopoulos; Writing – original draft, Nickolas Rigopoulos, Christina Megetho Gkaliouri and Victoria Sakavitsi; Writing – review & editing, Nickolas Rigopoulos, Christina Megetho Gkaliouri, Victoria Sakavitsi and Dimitrios Gournis.
Funding
This research received no external funding.
Acknowledgments
Nickolas Rigopoulos and Chrisitna Megetho Gkaliouri would like to acknowledge the valuable technical support of Dr. Andreas Petsas from the Department of Food Science and Nutrition, University of the Aegean.
Conflicts of Interest
The authors declare no conflict of interest. The authors have no competing interests to declare that are relevant to the content of this article. All authors certify that they have no affiliations with or involvement in any organization or entity with any financial interest or non – financial interest in the subject matter or materials discussed in this manuscript. The authors have no financial or proprietary interests in any material discussed in this article. The datasets generated during and/or analyzed during the current study are available from the corresponding author on reasonable request. The funders had no role in the design of the study; in collection, analyses, or interpretation of data; in the writing of the manuscript; or in the decision to publish the results.
References
- Shaik, M.R.; Khan, M.; Kuniyil, M.; Al-Warthan, A.; Alkhathlan, H.Z.; Siddiqui, M.R.H.; Shaik, J.P.; Ahamed, A.; Mahmood, A.; Khan, M.; et al. Plant-Extract-Assisted Green Synthesis of Silver Nanoparticles Using Origanum vulgare L. Extract and Their Microbicidal Activities. Sustainability 2018, 10, 913. [Google Scholar] [CrossRef]
- Galatage, S.T.; Hebalkar, A.S.; Dhobale, S.V.; Mali, O.R.; Kumbhar, P.S.; Nikade, S.V.; Killedar, S.G. Silver Nanoparticles: Properties, Synthesis, Characterization, Applications and Future Trends. In Silver Micro-Nanoparticles - Properties, Synthesis, Characterization, and Applications; IntechOpen, 2021. [CrossRef]
- Roy, S.; Rhim, J.-W. Starch/agar-based functional films integrated with enoki mushroom-mediated silver nanoparticles for active packaging applications. Food Biosci. 2022, 49. [Google Scholar] [CrossRef]
- Saravanan, A.; Kumar, P.S.; Hemavathy, R.; Jeevanantham, S.; Jawahar, M.J.; Neshaanthini, J.; Saravanan, R. A review on synthesis methods and recent applications of nanomaterial in wastewater treatment: Challenges and future perspectives. Chemosphere 2022, 307, 135713. [Google Scholar] [CrossRef] [PubMed]
- Sharma, K.; Guleria, S.; Salaria, K.H.; Majeed, A.; Sharma, N.; Pawar, K.D.; Thakur, V.K.; Gupta, V.K. Photocatalytic and biological properties of silver nanoparticles synthesized using Callistemon lanceolatus leaf extract. Ind. Crop. Prod. 2023, 202. [Google Scholar] [CrossRef]
- Barabadi, H.; Honary, S.; Ebrahimi, P.; Alizadeh, A.; Naghibi, F.; Saravanan, M. Optimization of myco-synthesized silver nanoparticles by response surface methodology employing Box-Behnken design. Inorg. Nano-Metal Chem. 2019, 49, 33–43. [Google Scholar] [CrossRef]
- Mikołajczak, A.; Ligaj, M.; Kobus-Cisowska, J. Temperature Optimization by Electrochemical Method for Improving Antioxidant Compound Extraction Efficiency from Origanum vulgare L. and Its Application in a Bread Production. Sustainability 2022, 14, 2801. [Google Scholar] [CrossRef]
- Hambardzumyan, S.; Sahakyan, N.; Petrosyan, M.; Nasim, M.J.; Jacob, C.; Trchounian, A. Origanum vulgare L. extract-mediated synthesis of silver nanoparticles, their characterization and antibacterial activities. AMB Express 2020, 10, 1–11. [Google Scholar] [CrossRef]
- Sankar, R.; Karthik, A.; Prabu, A.; Karthik, S.; Shivashangari, K.S.; Ravikumar, V. Origanum vulgare mediated biosynthesis of silver nanoparticles for its antibacterial and anticancer activity. Colloids Surfaces B: Biointerfaces 2013, 108, 80–84. [Google Scholar] [CrossRef]
- Baláž, M.; Balážová, Ľ.; Daneu, N.; Dutková, E.; Balážová, M.; Bujňáková, Z.; Shpotyuk, Y. Plant-Mediated Synthesis of Silver Nanoparticles and Their Stabilization by Wet Stirred Media Milling. Nanoscale Res. Lett. 2017, 12, 83. [Google Scholar] [CrossRef]
- Baláž, M.; Balážová, L.; Kováčová, M.; Daneu, N.; Salayová, A.; Bedlovičová, Z.; Tkáčiková, L. The Relationship between Precursor Concentration and Antibacterial Activity of Biosynthesized Ag Nanoparticles. Adv Nano Res 2019, 7, 125–134. [Google Scholar] [CrossRef]
- Salayová, A.; Bedlovičová, Z.; Daneu, N.; Baláž, M.; Bujňáková, Z.L.; Balážová. ; Tkáčiková,. Green Synthesis of Silver Nanoparticles with Antibacterial Activity Using Various Medicinal Plant Extracts: Morphology and Antibacterial Efficacy. Nanomaterials 2021, 11, 1005. [Google Scholar] [CrossRef] [PubMed]
- Rigopoulos, N.; Thomou, E.; Kouloumpis. ; Lamprou, E.R.; Petropoulea, V.; Gournis, D.; Poulios, E.; Karantonis, H.C.; Giaouris, E. Optimization of Silver Nanoparticle Synthesis by Banana Peel Extract Using Statistical Experimental Design, and Testing of their Antibacterial and Antioxidant Properties. Curr. Pharm. Biotechnol. 2019, 20, 858–873. [Google Scholar] [CrossRef] [PubMed]
- Belafhal, A. The shape of spectral lines: widths and equivalent widths of the Voigt profile. Opt. Commun. 2000, 177, 111–118. [Google Scholar] [CrossRef]
- El-Naggar, N.E.-A.; Abdelwahed, N.A.M. Application of statistical experimental design for optimization of silver nanoparticles biosynthesis by a nanofactory Streptomyces viridochromogenes. J. Microbiol. 2014, 52, 53–63. [Google Scholar] [CrossRef] [PubMed]
- Karvela, E.; Makris, D.P.; Kalogeropoulos, N.; Karathanos, V.T. Deployment of response surface methodology to optimise recovery of grape (Vitis vinifera) stem polyphenols. Talanta 2009, 79, 1311–1321. [Google Scholar] [CrossRef]
- Barabadi, H.; Honary, S.; Ebrahimi, P.; Alizadeh, A.; Naghibi, F.; Saravanan, M. Optimization of myco-synthesized silver nanoparticles by response surface methodology employing Box-Behnken design. Inorg. Nano-Metal Chem. 2019, 49, 33–43. [Google Scholar] [CrossRef]
- Biswas, S.; Mulaba-Bafubiandi, A.F. Optimization of process variables for the biosynthesis of silver nanoparticles by Aspergillus wentii using statistical experimental design. Adv. Nat. Sci. Nanosci. Nanotechnol. 2016, 7, 045005. [Google Scholar] [CrossRef]
- El-Naggar, N.E.-A.; Abdelwahed, N.A.M. Application of statistical experimental design for optimization of silver nanoparticles biosynthesis by a nanofactory Streptomyces viridochromogenes. J. Microbiol. 2014, 52, 53–63. [Google Scholar] [CrossRef]
- Montgomery, D. C. Design and Analysis of Experiments Eighth Edition; 1984.
- Asadzadeh, F.; Maleki-Kaklar, M.; Soiltanalinejad, N.; Shabani, F. Central Composite Design Optimization of Zinc Removal from Contaminated Soil, Using Citric Acid as Biodegradable Chelant. Sci. Rep. 2018, 8, 1–8. [Google Scholar] [CrossRef]
- Amendola, V.; Bakr, O.M.; Stellacci, F. A Study of the Surface Plasmon Resonance of Silver Nanoparticles by the Discrete Dipole Approximation Method: Effect of Shape, Size, Structure, and Assembly. Plasmonics 2010, 5, 85–97. [Google Scholar] [CrossRef]
- Bindhu, M.; Umadevi, M. Synthesis of monodispersed silver nanoparticles using Hibiscus cannabinus leaf extract and its antimicrobial activity. Spectrochim. Acta Part A: Mol. Biomol. Spectrosc. 2013, 101, 184–190. [Google Scholar] [CrossRef] [PubMed]
- Basiuk, V. A.; Basiuk, E. V. Green Processes for Nanotechnology: From Inorganic to Bioinspired Nanomaterials. Green Processes for Nanotechnology: From Inorganic to Bioinspired Nanomaterials, 2015, 1–446. [CrossRef]
- Ibrahim, H.M. Green synthesis and characterization of silver nanoparticles using banana peel extract and their antimicrobial activity against representative microorganisms. J. Radiat. Res. Appl. Sci. 2015, 8, 265–275. [Google Scholar] [CrossRef]
- Valenti, L.E.; Giacomelli, C.E. Stability of silver nanoparticles: agglomeration and oxidation in biological relevant conditions. J. Nanoparticle Res. 2017, 19, 1–9. [Google Scholar] [CrossRef]
- Molleman, B.; Hiemstra, T. Surface Structure of Silver Nanoparticles as a Model for Understanding the Oxidative Dissolution of Silver Ions. Langmuir 2015, 31, 13361–13372. [Google Scholar] [CrossRef] [PubMed]
- Khan, M.A.M.; Kumar, S.; Ahamed, M.; A Alrokayan, S.; AlSalhi, M.S. Structural and thermal studies of silver nanoparticles and electrical transport study of their thin films. Nanoscale Res. Lett. 2011, 6, 434–434. [Google Scholar] [CrossRef]
- Quinten, M. Optical Properties of Nanoparticle Systems; Wiley–VCH: Weinheim, Germany, 2011. [Google Scholar]
- Dada, A.O.; Adekola, F.A.; Adeyemi, O.S.; Bello, O.M.; Oluwaseun, A.C.; Awakan, O.J.; Grace, F.-A.A. Exploring the Effect of Operational Factors and Characterization Imperative to the Synthesis of Silver Nanoparticles. 2018. [CrossRef]
- Rousta, M.H.; Ghasemi, N. Green synthesis of silver nanoparticles using a mountain plant extract. Rev. Roum. de Chim. 2019, 64, 143–152. [Google Scholar] [CrossRef]
- Marciniak, L.; Nowak, M.; Trojanowska, A.; Tylkowski, B.; Jastrzab, R. The Effect of pH on the Size of Silver Nanoparticles Obtained in the Reduction Reaction with Citric and Malic Acids. Materials 2020, 13, 5444. [Google Scholar] [CrossRef]
- Handayani, W.; Ningrum, A.S.; Imawan, C. The Role of pH in Synthesis Silver Nanoparticles Using Pometia pinnata (Matoa) Leaves Extract as Bioreductor. J. Physics: Conf. Ser. 2020, 1428, 012021. [Google Scholar] [CrossRef]
- Alqadi, M.K.; Noqtah, O.A.A.; Alzoubi, F.Y.; Alzouby, J.; Aljarrah, K. pH effect on the aggregation of silver nanoparticles synthesized by chemical reduction. Mater. Sci. 2014, 32, 107–111. [Google Scholar] [CrossRef]
- Kaushik, R.; Saran, S.; Isar, J.; Saxena, R. Statistical optimization of medium components and growth conditions by response surface methodology to enhance lipase production by Aspergillus carneus. J. Mol. Catal. B: Enzym. 2006, 40, 121–126. [Google Scholar] [CrossRef]
- Supraja, N.; Prasad, T.; Soundariya, M.; Babujanarthanam, R. Synthesis, characterization and dose dependent antimicrobial and anti-cancerous activity of phycogenic silver nanoparticles against human hepatic carcinoma (HepG2) cell line. AIMS Bioeng. 2016, 3, 425–440. [Google Scholar] [CrossRef]
- Umadevi, M.; Shalini, S.; Bindhu, M.R. Synthesis of silver nanoparticle using D. carota extract. Adv. Nat. Sci. Nanosci. Nanotechnol. 2012, 3. [Google Scholar] [CrossRef]
- W. , R.; R., L.; S., K.; D., M.; B., K. Phytosynthesis of Silver Nanoparticle Using Gliricidia sepium (Jacq.). Curr. Nanosci. 2009, 5, 117–122. [Google Scholar] [CrossRef]
- Pavani, K. V.; K, G.; Banerjee, A.; Suresh, S. Phyto-Synthesis of Silver Nanoparticles Using Extracts of Ipomoea iNdica Flowers. American Journal of Nanomaterials 2013, 1, 5–8. [Google Scholar]
- Mohanta, Y.K.; Panda, S.K.; Jayabalan, R.; Sharma, N.; Bastia, A.K.; Mohanta, T.K. Antimicrobial, Antioxidant and Cytotoxic Activity of Silver Nanoparticles Synthesized by Leaf Extract of Erythrina suberosa (Roxb.). Front. Mol. Biosci. 2017, 4. [Google Scholar] [CrossRef] [PubMed]
- Kora, A.J.; Arunachalam, J. Green Fabrication of Silver Nanoparticles by Gum Tragacanth (Astragalus gummifer): A Dual Functional Reductant and Stabilizer. J. Nanomater. 2012, 2012, 1–8. [Google Scholar] [CrossRef]
- Gharibshahi, L.; Saion, E.; Gharibshahi, E.; Shaari, A.H.; Matori, K.A. Structural and Optical Properties of Ag Nanoparticles Synthesized by Thermal Treatment Method. Materials 2017, 10, 402. [Google Scholar] [CrossRef]
- Xiang, F.; Zhao, Q.; Zhao, K.; Pei, H.; Tao, F. The Efficacy of Composite Essential Oils against Aflatoxigenic Fungus Aspergillus flavus in Maize. Toxins 2020, 12, 562. [Google Scholar] [CrossRef]
- Bunghez, F.; Morar, M.A.; Pop, R.M.; Romanciuc, F.; Csernatoni, F.; Fetea, F.; Diaconeasa, Z.; Socaciu, C. Comparative Phenolic Fingerprint and LC-ESI+QTOF-MS Composition of Oregano and Rosemary Hydrophilic Extracts in Relation to their Antibacterial Effect. Bull. Univ. Agric. Sci. Veter- Med. Cluj-Napoca. Food Sci. Technol. 2015, 72, 33–40. [Google Scholar] [CrossRef]
- Yoncheva, K.; Benbassat, N.; Zaharieva, M.M.; Dimitrova, L.; Kroumov, A.; Spassova, I.; Kovacheva, D.; Najdenski, H.M. Improvement of the Antimicrobial Activity of Oregano Oil by Encapsulation in Chitosan—Alginate Nanoparticles. Molecules 2021, 26, 7017. [Google Scholar] [CrossRef]
Figure 1.
Effects of NaOH and OE concentrations on UV – Vis spectra. OE concentration a) 2% v/v, and b) 20% v/v. NaOH concentration 0, 0.2 and 2 mM. AgNO3 concentration 1 mM, incubation temperature 40 °C, and incubation time 10 min.
Figure 1.
Effects of NaOH and OE concentrations on UV – Vis spectra. OE concentration a) 2% v/v, and b) 20% v/v. NaOH concentration 0, 0.2 and 2 mM. AgNO3 concentration 1 mM, incubation temperature 40 °C, and incubation time 10 min.
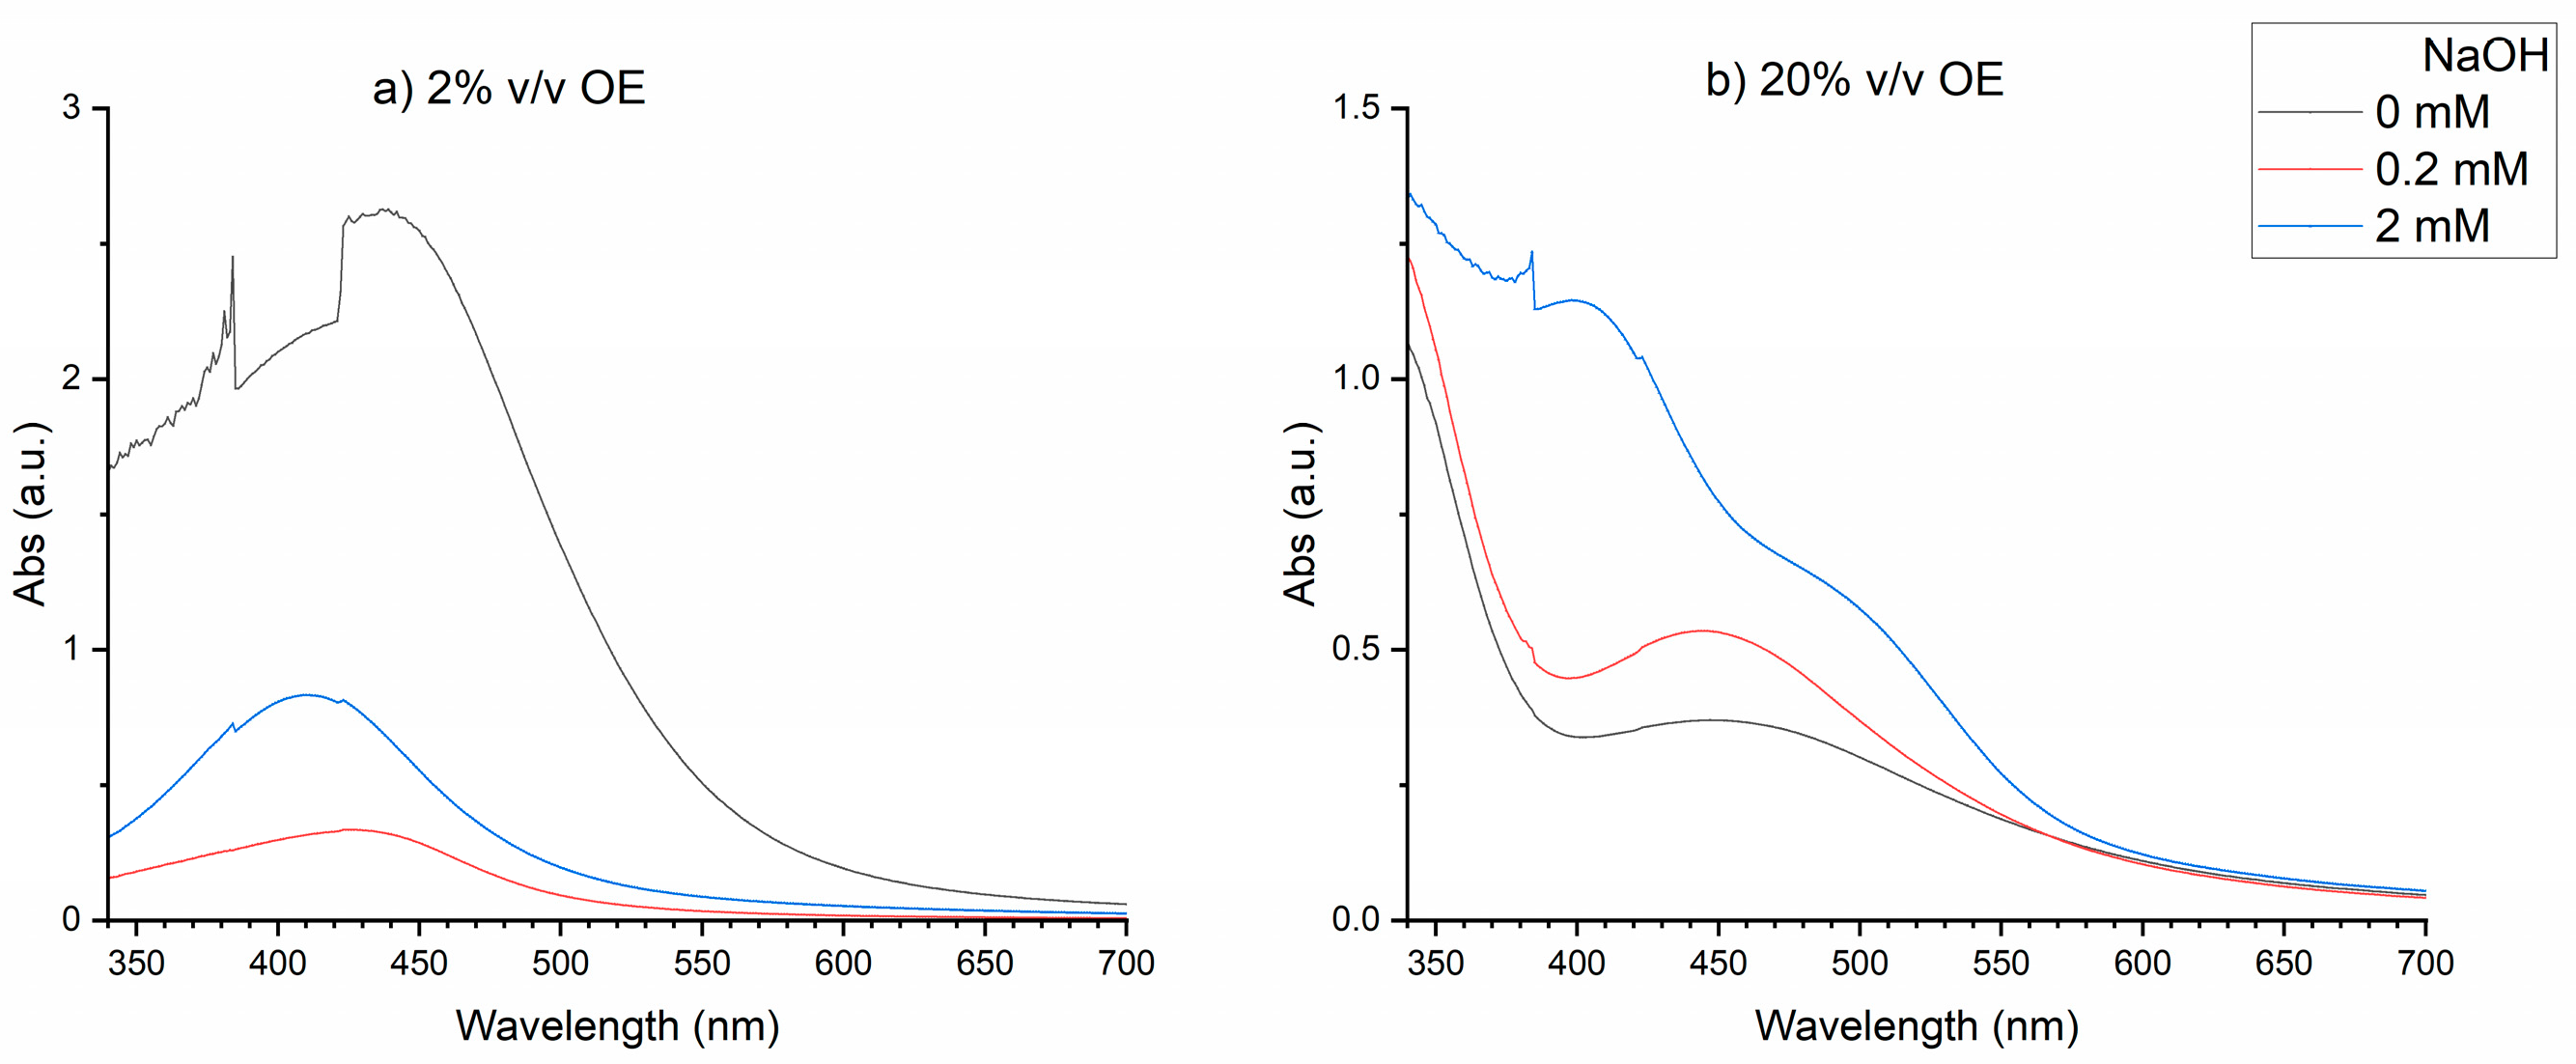
Figure 2.
Effect of pH on UV – Vis spectra, with the addition of NaOH or HCl at different concentrations. AgNO3 concentration 1 mM, OE concentration 2 % v/v, incubation temperature 60 °C and incubation time 1h.
Figure 2.
Effect of pH on UV – Vis spectra, with the addition of NaOH or HCl at different concentrations. AgNO3 concentration 1 mM, OE concentration 2 % v/v, incubation temperature 60 °C and incubation time 1h.
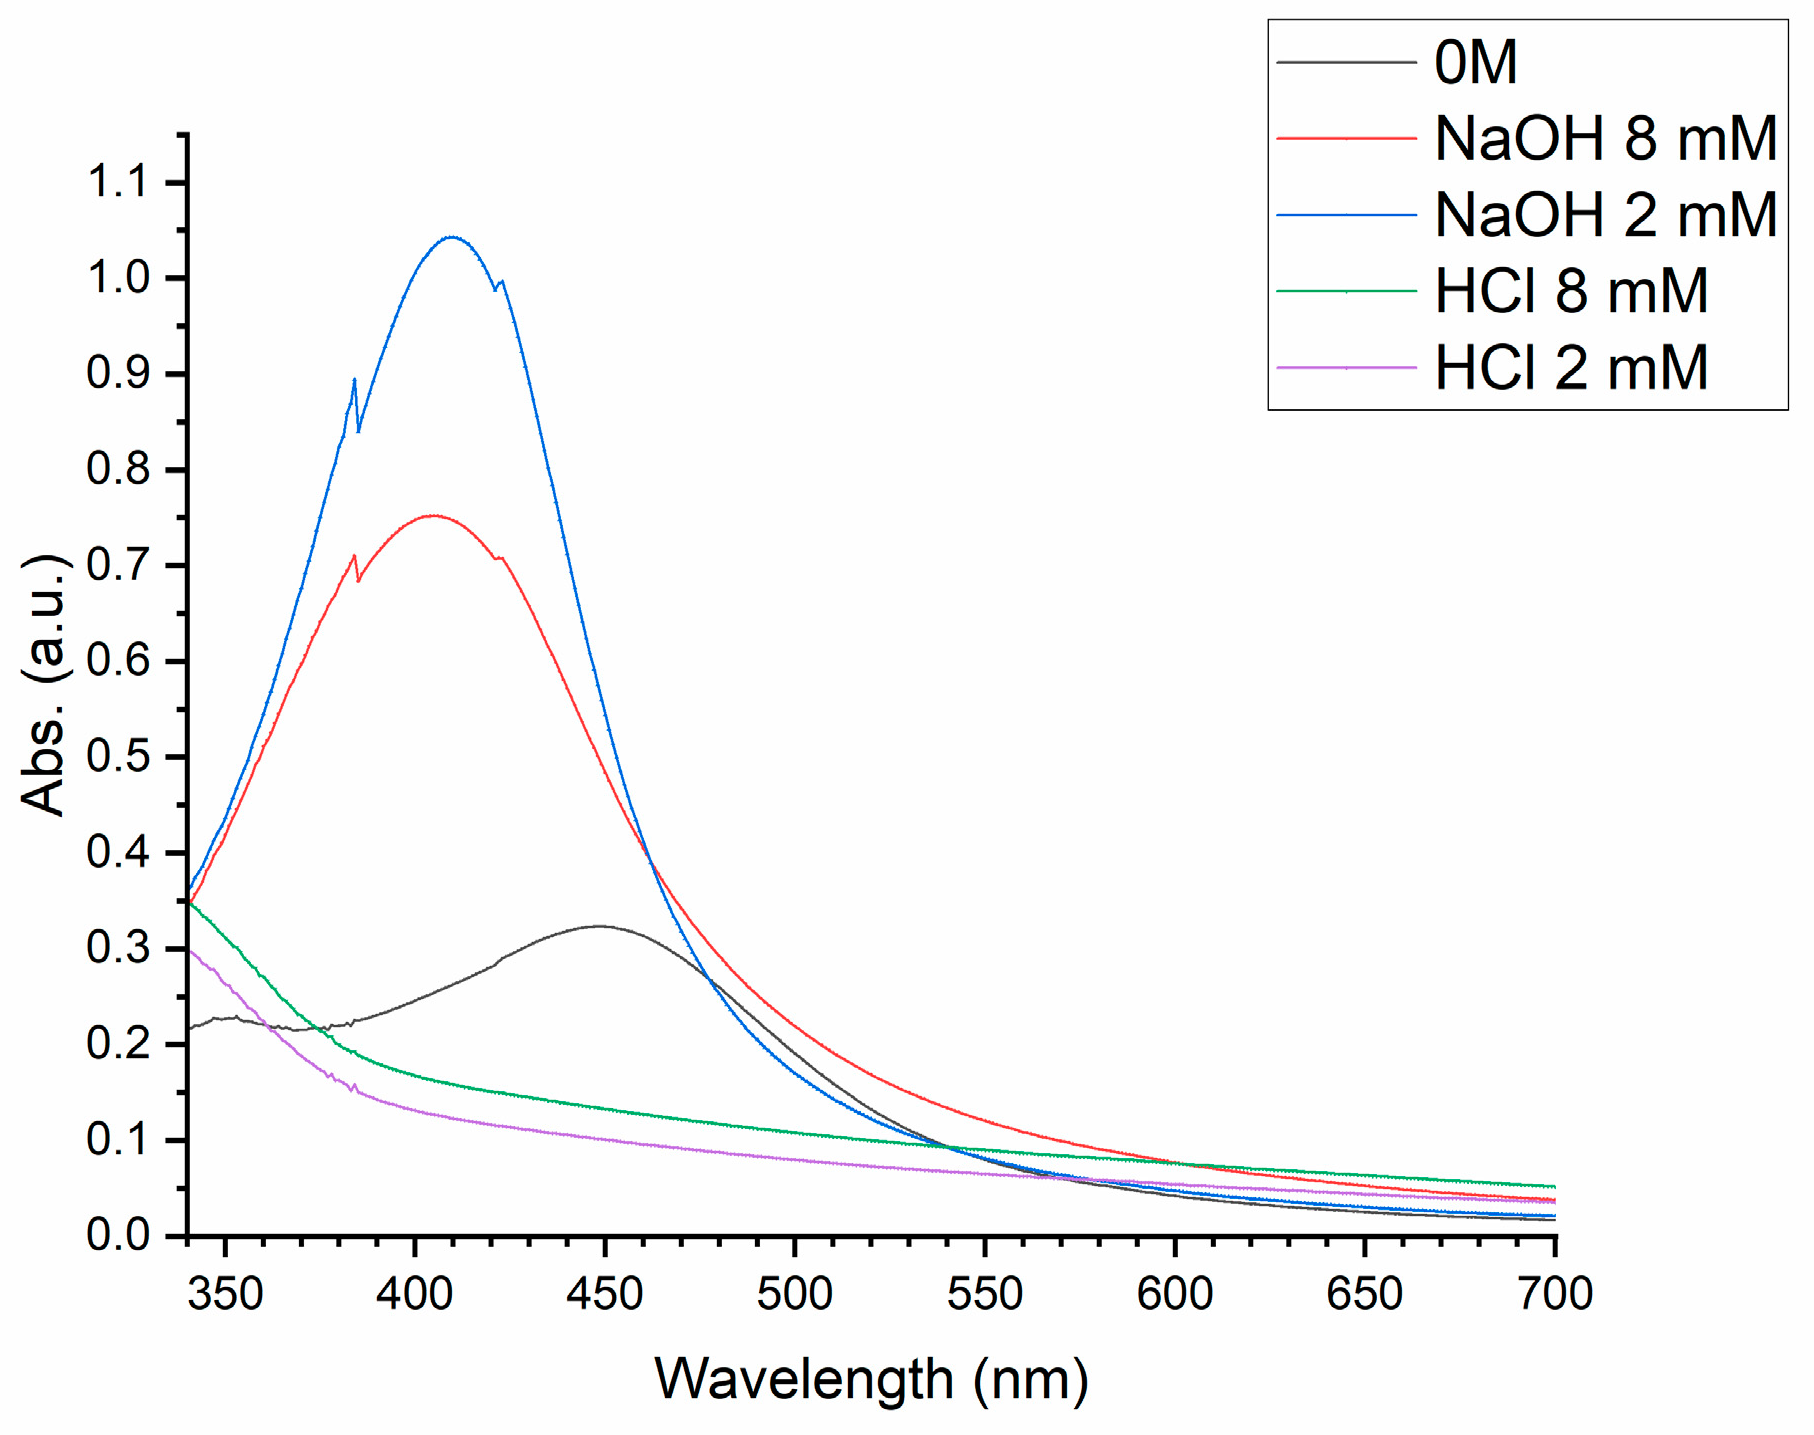
Figure 3.
Effect of a) OE extract concentration, and b) AgNO3 concentration on UV – Vis spectra. NaOH concentration 1 mM, incubation temperature 60 °C, incubation time 1h. a) AgNO3 concentration 1 mM, and b) OE concentration 2 % v/v.
Figure 3.
Effect of a) OE extract concentration, and b) AgNO3 concentration on UV – Vis spectra. NaOH concentration 1 mM, incubation temperature 60 °C, incubation time 1h. a) AgNO3 concentration 1 mM, and b) OE concentration 2 % v/v.
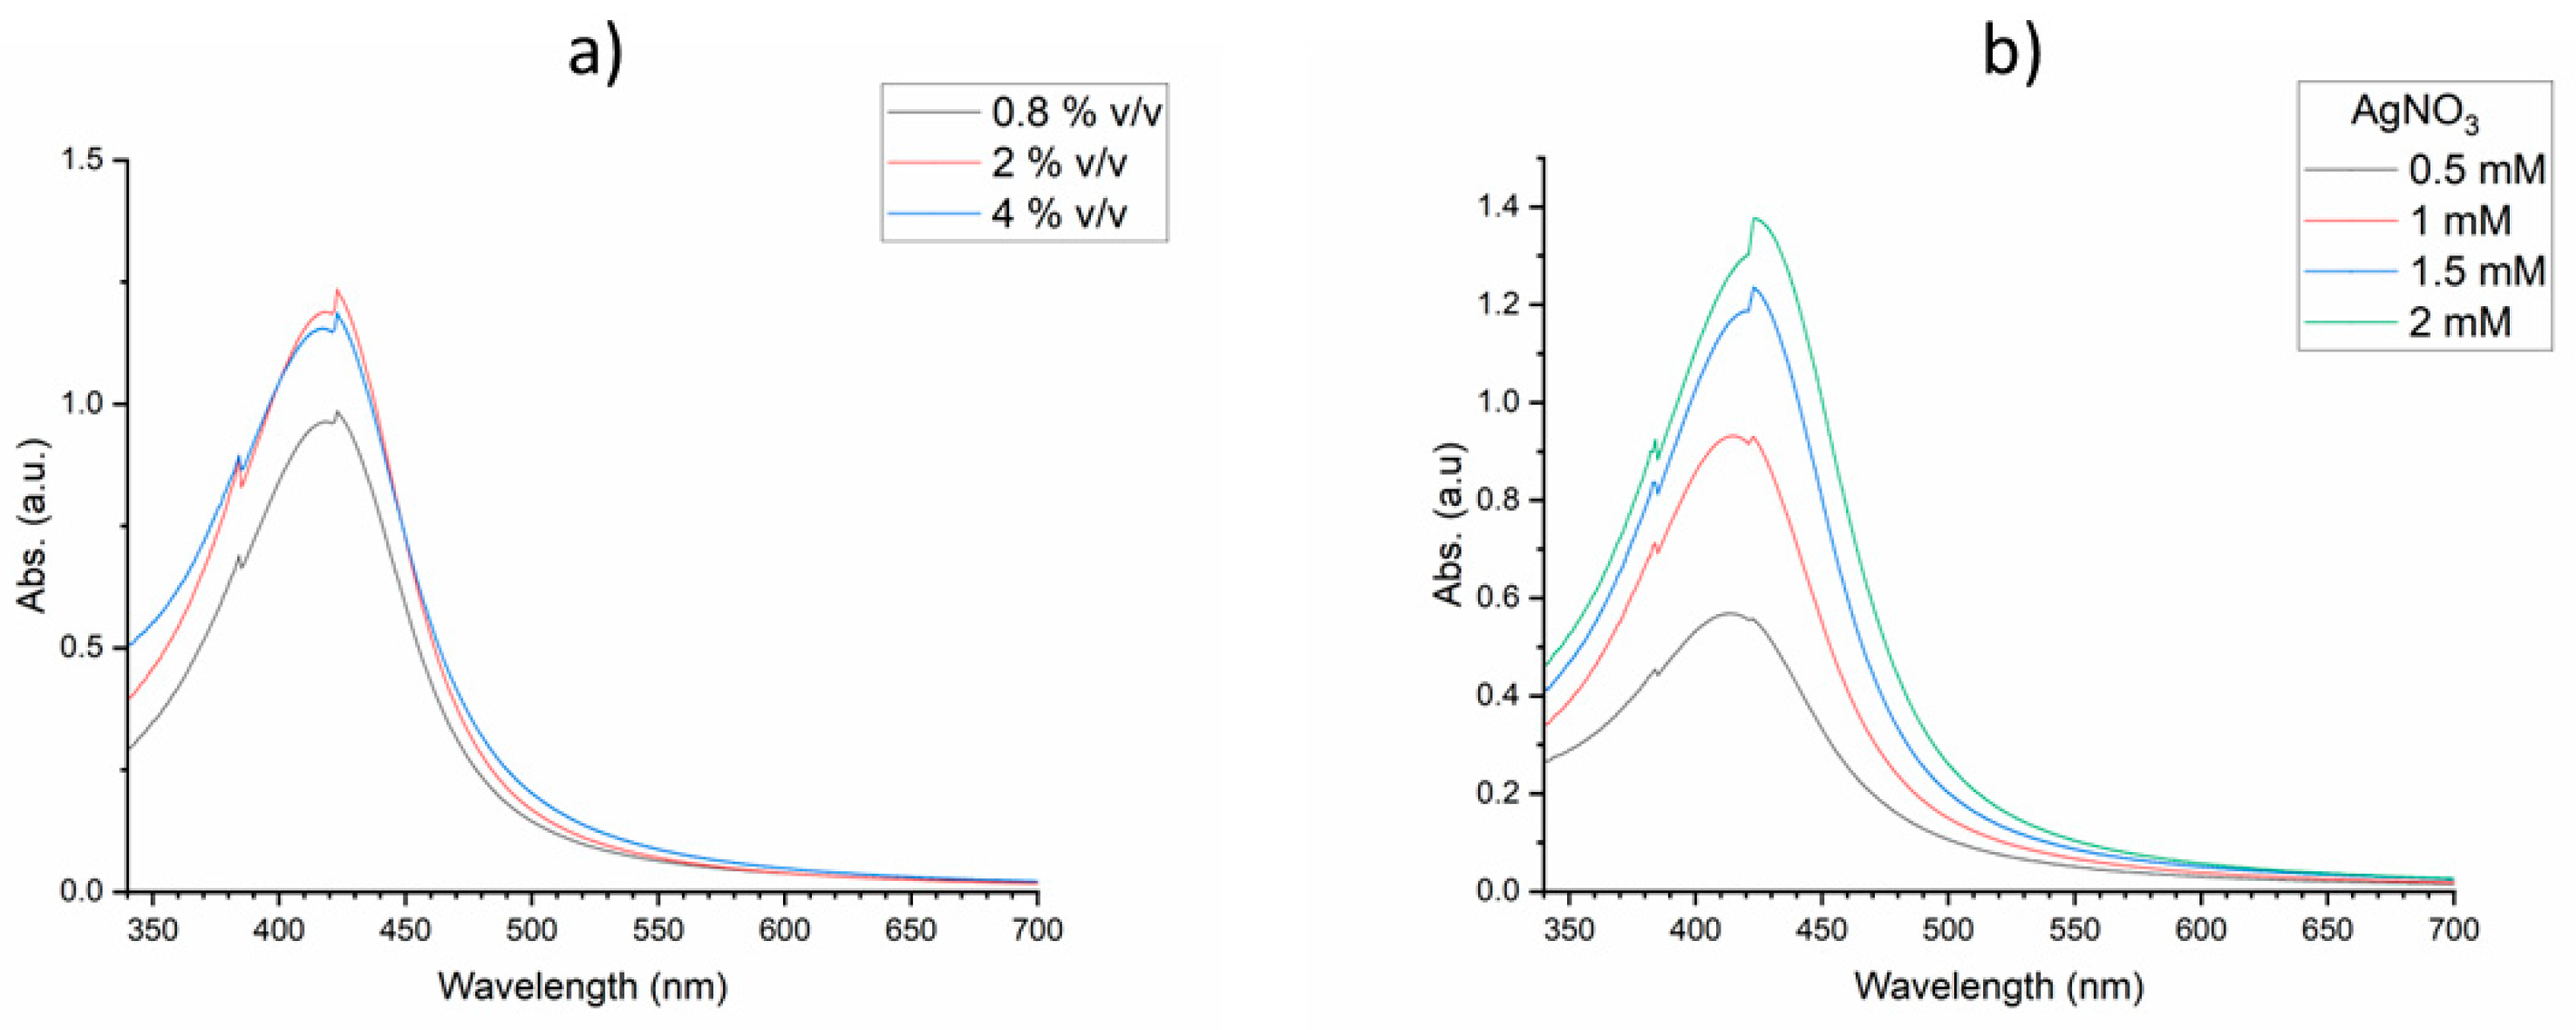
Figure 4.
X-ray diffraction pattern of AgNPs.
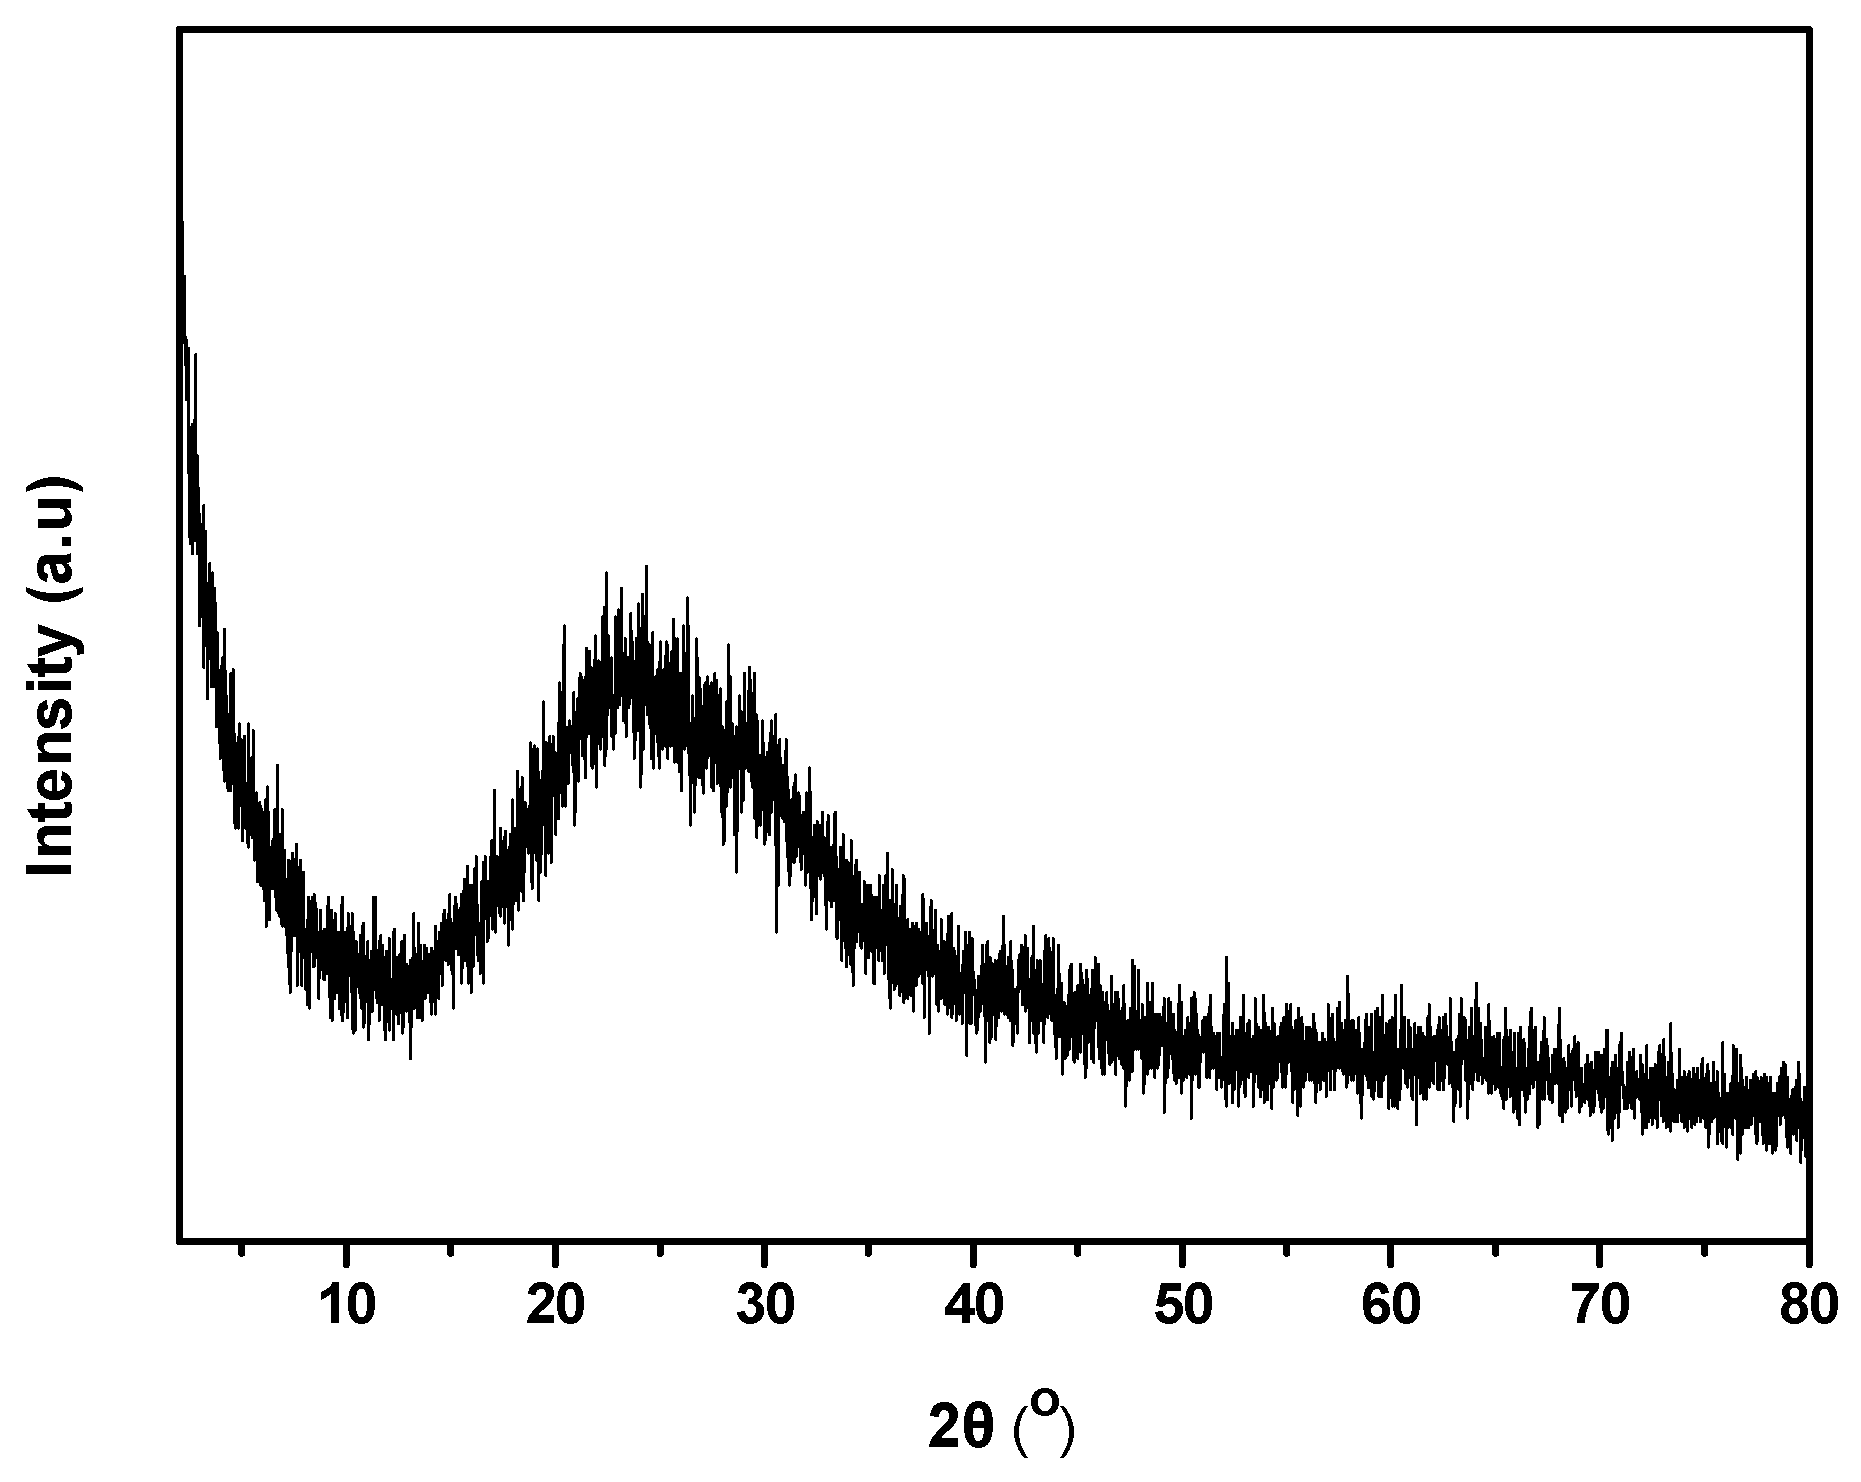
Figure 5.
FTIR spectrum of AgNPs synthesized by oregano extract.
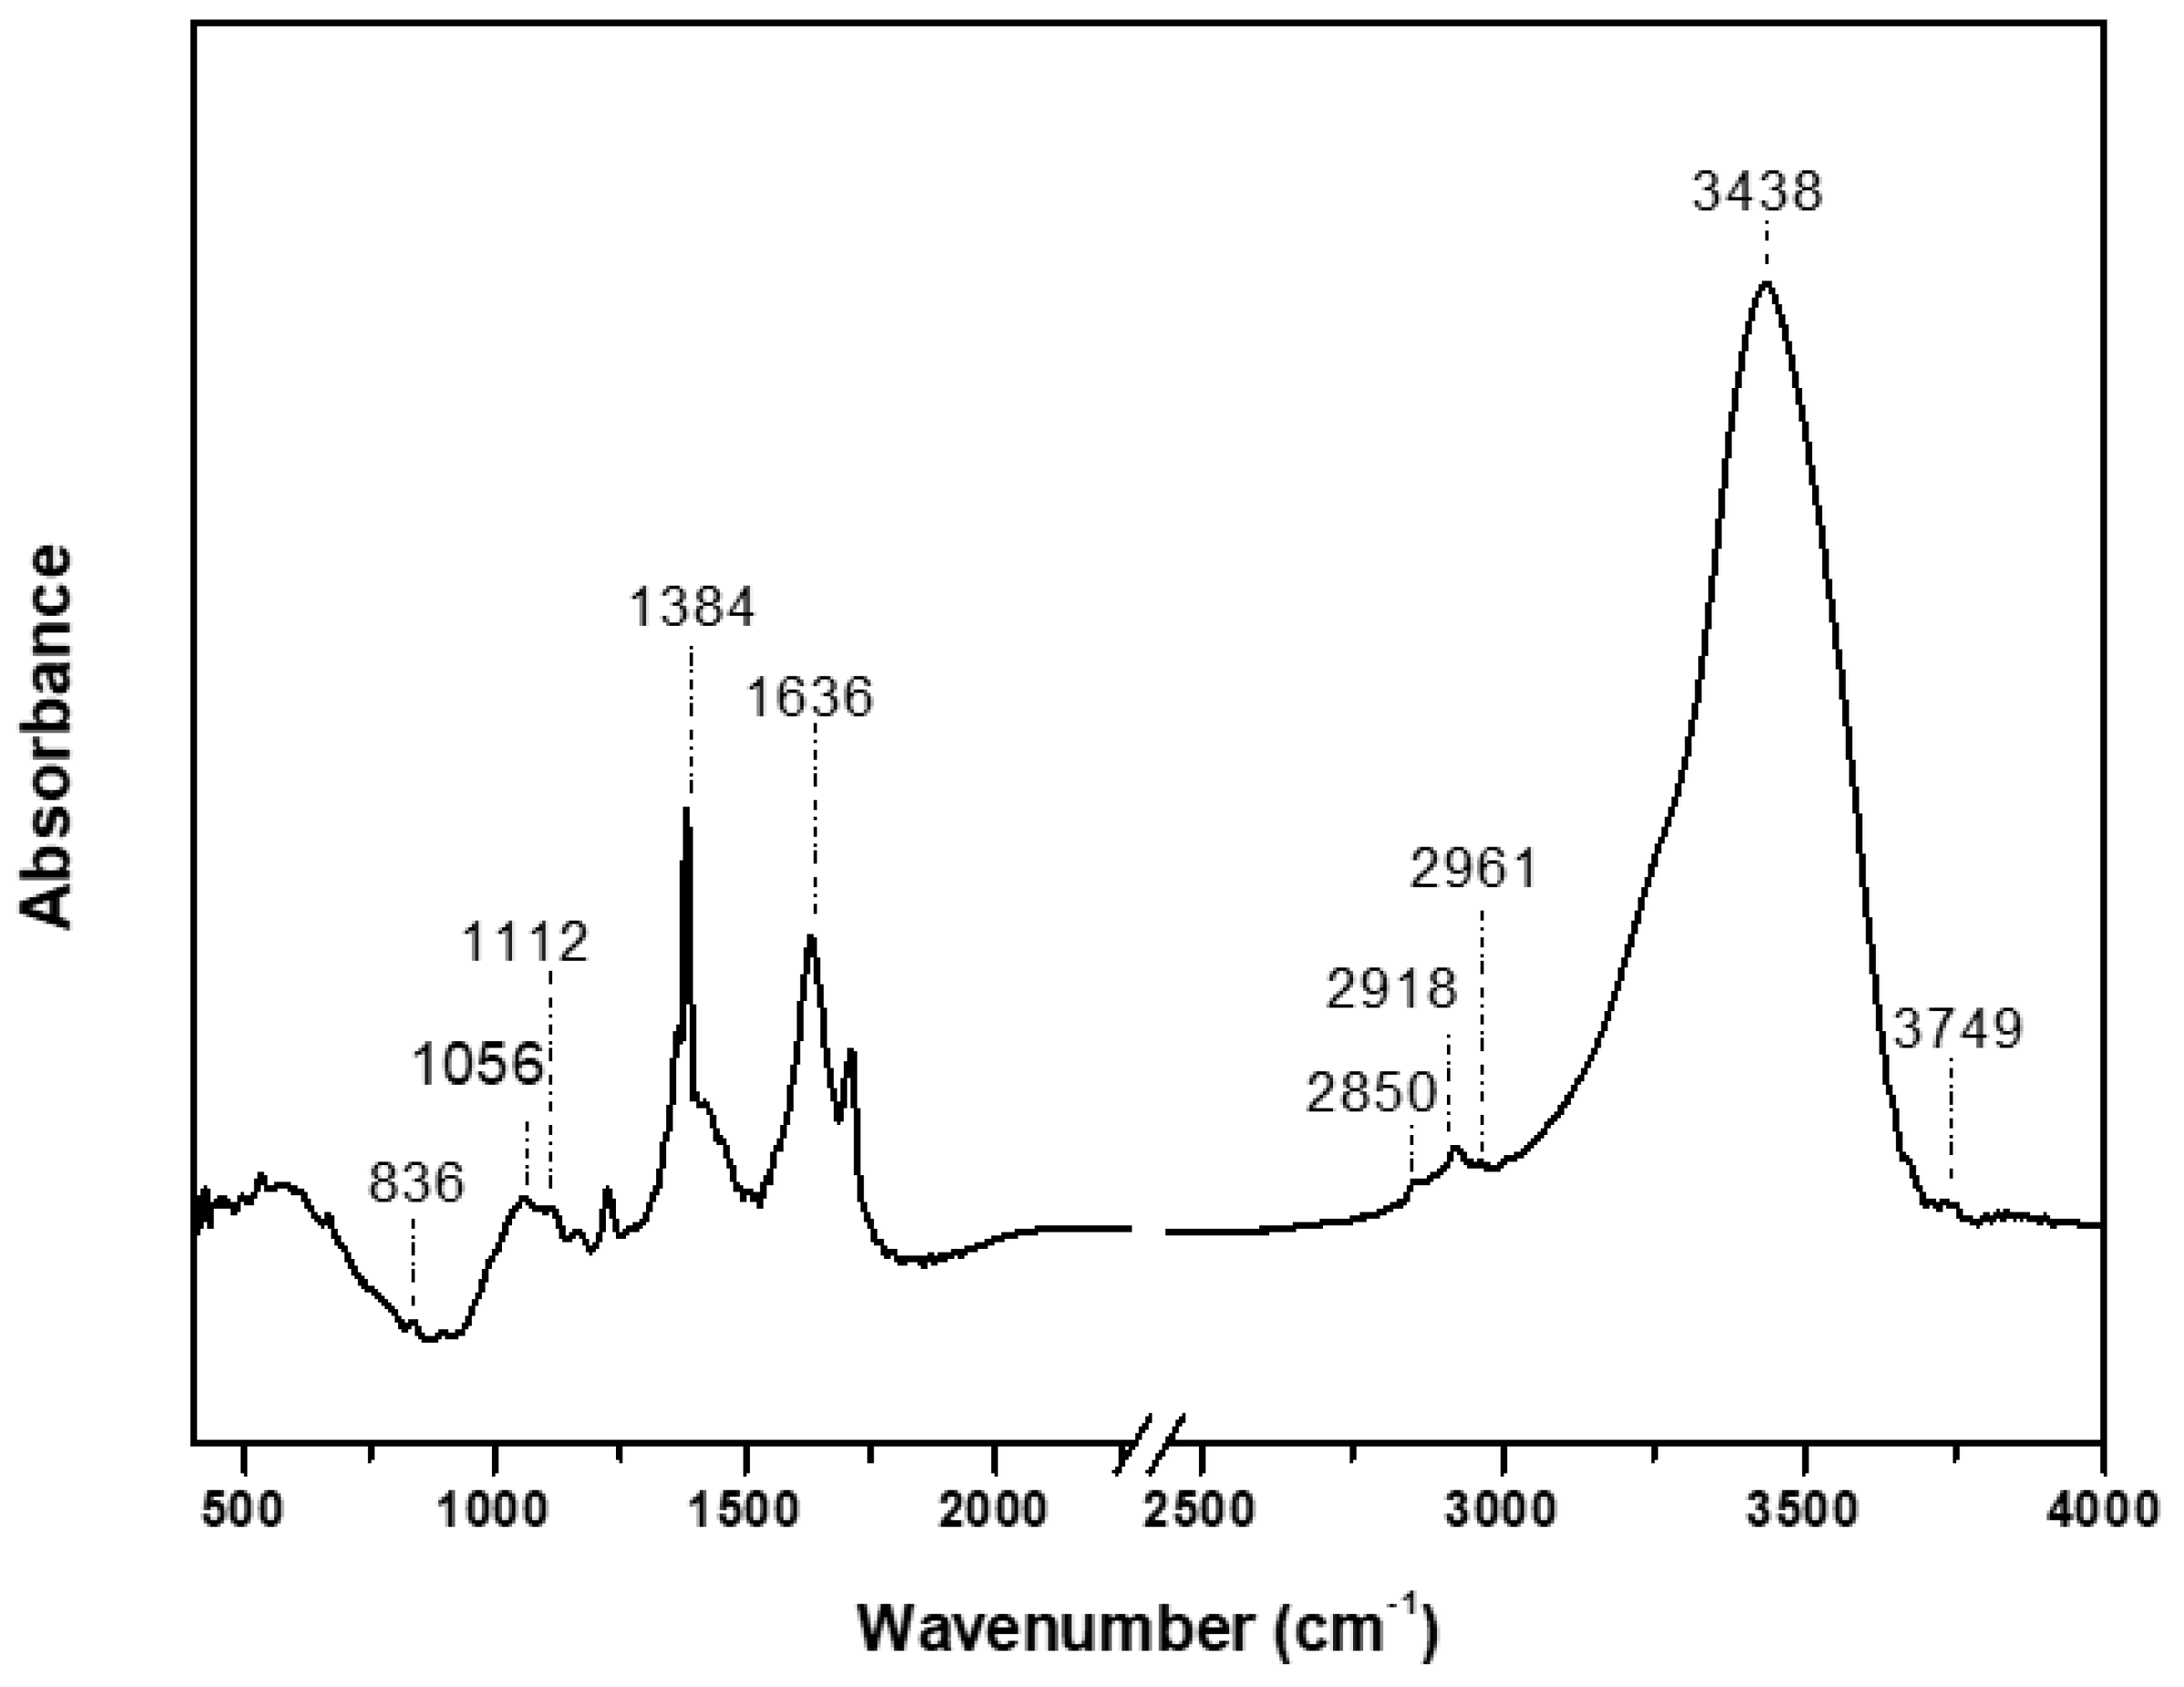

Table 1.
FFD with three synthesis parameters (independent factors), with coded factor levels and actual values into parentheses and measured three mean responses (wavelength at peak maximum λ0, peak area A, and FWHM) for AgNPs synthesis by OE.
Table 1.
FFD with three synthesis parameters (independent factors), with coded factor levels and actual values into parentheses and measured three mean responses (wavelength at peak maximum λ0, peak area A, and FWHM) for AgNPs synthesis by OE.
| Run | X1 (Cext %v/v) |
X2 mM) |
X3 (CNaOH mM) |
Responses | ||
|---|---|---|---|---|---|---|
| λ0 (nm) | A (a.u.*) | FWHM (nm) | ||||
| 1 | 0(2) | 0(1) | 0(1) | 412.9 | 129.4 | 93.7 |
| 2 | -1(0.8) | 1(1.5) | 1(2) | 405.8 | 190.5 | 94.2 |
| 3 | -1(0.8) | 0(1) | -1(0) | 439.4 | 34.7 | 130.7 |
| 4 | -1(0.8) | 1(1.5) | -1(0) | 442.7 | 31 | 97.4 |
| 5 | -1(0.8) | -1(0.5) | -1(0) | 438.1 | 33.5 | 140.2 |
| 6 | 0(2) | -1(0.5) | -1(0) | 441.5 | 38.5 | 101.8 |
| 7 | 0(2) | -1(0.5) | 0(1) | 411.3 | 63.5 | 86.4 |
| 8 | 1(3.2) | 1(1.5) | 1(2) | 412.2 | 214.2 | 98.6 |
| 9 | 1(3.2) | 1(1.5) | 0(1) | 415.2 | 170.4 | 102.4 |
| 10 | 0(2) | 0(1) | 1(2) | 407.5 | 141.9 | 93.5 |
| 11 | -1(0.8) | -1(0.5) | 0(1) | 407.1 | 71.9 | 85.9 |
| 12 | 1(3.2) | 0(1) | -1(0) | 449.4 | 97.5 | 128.9 |
| 13 | 0(2) | -1(0.5) | 1(2) | 405.2 | 96.1 | 112.8 |
| 14 | 0(2) | 1(1.5) | 0(1) | 414.4 | 147.9 | 98.5 |
| 15 | 1(3.2) | 0(1) | 1(2) | 409.2 | 154.1 | 103.4 |
| 16 | 1(3.2) | 1(1.5) | -1(0) | 451.1 | 76.4 | 106.3 |
| 17 | 0(2) | 0(1) | -1(0) | 446.1 | 26.9 | 84.3 |
| 18 | 1(3.2) | -1(0.5) | 1(2) | 408.2 | 92.8 | 115.9 |
| 19 | 1(3.2) | -1(0.5) | 0(1) | 411.1 | 71.6 | 97.8 |
| 20 | -1(0.8) | -1(0.5) | 1(2) | 408.2 | 97.8 | 133.7 |
| 21 | -1(0.8) | 1(1.5) | 0(1) | 412.1 | 119 | 95.3 |
| 22 | 1(3.2) | 0(1) | 0(1) | 412.3 | 145.4 | 98.9 |
| 23 | -1(0.8) | 0(1) | 0(1) | 409 | 106.5 | 88.4 |
| 24 | -1(0.8) | 0(1) | 1(2) | 407.6 | 152.2 | 102.8 |
| 25 | 0(2) | 1(1.5) | 1(2) | 409.1 | 194.9 | 94.2 |
| 26 | 1(3.2) | -1(0.5) | -1(0) | 441.1 | 57.4 | 97.9 |
| 27 | 0(2) | 1(1.5) | -1(0) | 450.1 | 42.1 | 98.8 |
Table 2.
ANOVA for quadratic model for wavelength at peak maximum λ0.
| Source | df | SS | MS | F | p-value |
|---|---|---|---|---|---|
| Model | 9 | 22322.92 | 2480.32 | 138.19 | <0.0001 |
| Linear | |||||
| X1 | 1 | 264.48 | 264.48 | 14.74 | |
| X2 | 1 | 278.24 | 278.24 | 15.50 | |
| X3 | 1 | 17798.83 | 17798.83 | 991.68 | |
| Square | |||||
| 1 | 3813.3 | 3813.3 | 212.46 | ||
| Interaction | |||||
| X2X3 | 1 | 77.74 | 77.74 | 4.33 | |
| Error | 71 | 1274.32 | 17.95 | ||
| Lack of fit | 17 | 117.17 | 6.89 | 0.3217 | |
| Pure error | 54 | 1157.15 | 21.43 | ||
| Total | 80 | 23597.24 |
df =degrees of freedom, SS = Sum of Squares, MS = Mean Square, F statistic.
Table 3.
ANOVA for quadratic model for peak area A.
| Source | df | SS | MS | F | p-value |
|---|---|---|---|---|---|
| Model | 9 | 231000 | 25662.02 | 76.05 | <0.0001 |
| Linear | |||||
| X1 | 1 | 9827.11 | 9827.11 | 29.12 | |
| X2 | 1 | 52886.07 | 52886.07 | 156.73 | |
| X3 | 1 | 133900 | 133900 | 396.83 | |
| Square | |||||
| 1 | 1556.99 | 1556.99 | 4.61 | ||
| 1 | 4321.69 | 4321.69 | 12.81 | ||
| Interaction | |||||
| X1X2 | 1 | 2595.25 | 2595.25 | 7.69 | |
| X1X3 | 1 | 3111.7 | 3111.7 | 9.22 | |
| X2X3 | 1 | 21421.51 | 21421.51 | 63.48 | |
| Error | 71 | 23958.08 | 337.44 | ||
| Lack of fit | 17 | 6523.82 | 383.75 | 1.19 | |
| Pure error | 54 | 17434.25 | 322.86 | ||
| Total | 80 | 254900 |
df =degrees of freedom, SS = Sum of Squares, MS = Mean Square, F statistic.
Table 4.
ANOVA for quadratic model for FWHM.
| Source | df | SS | MS | F-value | p-value |
|---|---|---|---|---|---|
| Model | 9 | 8440.95 | 937.88 | 1.56 | 0.1435 |
| Linear | |||||
| X3 | 1 | 230.88 | 230.88 | 0.3847 | |
| Square | |||||
| 1 | 3220.51 | 3220.51 | 5.37 | ||
| Error | 71 | 42616.33 | 600.23 | ||
| Lack of fit | 17 | 8700.41 | 511.79 | 0.8149 | |
| Pure error | 54 | 33915.92 | 628.07 | ||
| Total | 80 | 51057.28 |
df =degrees of freedom, SS = Sum of Squares, MS = Mean Square, F statistic.
Table 5.
Regression coefficients for wavelength at peak maximum λ0.
| Model term | CE | Std. Error |
|---|---|---|
| Intercept | 412.4 | 1.25 |
| X1 | 2.21 | 0.5765 |
| X2 | 2.27 | 0.5765 |
| X3 | -18.16 | 0.5765 |
| X2X3 | -1.47 | 0.7061 |
| 14.56 | 0.9986 |
CE = Coefficient Estimate, Std. Error = Standard Error, R2 = 93.92%.
Table 6.
Regression coefficients for peak area A.
| Model term | CE | Std. Error |
|---|---|---|
| Intercept | 114.44 | 5.40 |
| X1 | 13.49 | 2.5 |
| X2 | 31.29 | 2.5 |
| X3 | 49.80 | 2.5 |
| X1X2 | 8.49 | 2.39 |
| X1X3 | -9.30 | -15.40 |
| X2X3 | 24.39 | 18.29 |
| -9.30 | -17.93 | |
| -15.49 | -24.13 |
CE = Coefficient Estimate, Std. Error = Standard Error, R2 = 89.41%.
Table 7.
Pareto analysis[21] for significant terms in quadratic model for both the peak wavelength λ0 and peak area A.
Table 7.
Pareto analysis[21] for significant terms in quadratic model for both the peak wavelength λ0 and peak area A.
| Peak wavelength λ0 | Peak area A | ||
|---|---|---|---|
| Term | Per. Ef (%) | Term | Per. Ef (%) |
| X1 | 0.88 | X1 | 3.85 |
| X2 | 0.93 | X2 | 20.74 |
| X3 | 59.53 | X3 | 52.53 |
| X2X3 | 0.39 | X1X2 | 1.53 |
| 38.27 | X1X3 | 1.83 | |
| - | - | X2X3 | 12.6 |
| - | - | 1.83 | |
| - | - | 5.08 | |
Per. Ef = Percentage effect.
Disclaimer/Publisher’s Note: The statements, opinions and data contained in all publications are solely those of the individual author(s) and contributor(s) and not of MDPI and/or the editor(s). MDPI and/or the editor(s) disclaim responsibility for any injury to people or property resulting from any ideas, methods, instructions or products referred to in the content. |
© 2023 by the authors. Licensee MDPI, Basel, Switzerland. This article is an open access article distributed under the terms and conditions of the Creative Commons Attribution (CC BY) license (http://creativecommons.org/licenses/by/4.0/).
Copyright: This open access article is published under a Creative Commons CC BY 4.0 license, which permit the free download, distribution, and reuse, provided that the author and preprint are cited in any reuse.


