
Submitted:
27 July 2023
Posted:
28 July 2023
You are already at the latest version
Abstract
This study proposes an image recognition method to assist swine farm managers in collecting health data related to pig feeding and excretion. Analyzing the correlation between sow health data and indoor air quality in the pigsties revealed significant influences of air quality indicators on sow health. Increased levels of TVOC, CO2, and temperature were found to negatively affect feeding health, while increased temperature, humidity, and PM10 were found to negatively impact excretion health. These findings provide a basis for evaluating variables when constructing future sow disease prediction models. Analyzing the correlation between pig health status and air quality can help swine farm managers improve sow production environments, reduce disease risks, enhance production efficiency, and provide valuable insights for future research on disease prediction models.
Keywords:
precision livestock farming (PLF)
; image recognition model
; feeding and fecal health
1. Introduction
In the past three years, the agriculture sector has been significantly affected by the COVID-19 pandemic and the challenges posed by global warming and climate change. These issues have brought global food security, livestock product quality, animal welfare, and smart livestock farming to the forefront [1]. Taiwan, with its high temperature and humidity, coupled with a diverse and complex disease environment, faces challenges in pig farming. The annual production of market-ready pigs per sow in Taiwan stands at 15.7, lower than the 22-30 achieved by advanced pig farming nations in temperate regions. Additionally, the reliance on imported feed increases costs, and the traditional semi-open pig farming facilities in Taiwan contribute to poor growth conditions for pigs, difficulty in disease control, aging workforce, outdated facilities and equipment, low production efficiency, and growing environmental consciousness. These factors have prompted the need for transformation and change in traditional pig farming practices. In traditional livestock farming, the assessment of animal health is largely based on farmers' subjective observations and experiences, leading to limitations in real-time monitoring due to subjectivity and insufficient manpower [2]. Disease detection plays a crucial role in reducing and preventing animal diseases. Early disease detection should be adjusted based on individual animal conditions to maximize animal welfare, reproductive efficiency, and production efficiency, making it one of the most important concerns in the livestock industry [1,3].
In recent years, new technologies such as intelligent sensors, the Internet of Things (IoT), and Artificial Intelligence (AI) have been gradually applied in poultry farming to improve disease detection accuracy and efficiency, leading to enhanced production and management in the livestock industry. The Precision Livestock Farming (PLF) aims to increase operational efficiency and reduce the inappropriate use of antibiotics by introducing intelligent, energy-saving, and power-efficient technological infrastructure [4]. This system utilizes various sensors, such as microphones and cameras, to monitor the physical characteristics of animals. Combined with precise feeding strategies and user-friendly management systems, it provides farmers with livestock management solutions. By automating the monitoring of animal conditions, this system improves animal welfare, productivity, and environmental outcomes [1]. It also enhances livestock production efficiency and quality, reduces waste generation, mitigates the risk of disease outbreaks, and promotes sustainable farming practices. Nowadays, image recognition technology has become highly mature and widely applicable. In the field of livestock farming, image recognition models are often used in farm management as auxiliary tools to assist farmers in animal monitoring and management. These models can automatically identify information such as the number of livestock, their activity status, and health conditions, providing real-time feedback and alerts to farmers. Shao, Pu et al. [5] utilized YOLOv5 image recognition technology to develop a model for recognizing pig postures (standing, lying down, sideways, exploring), which serves as a crucial foundation for future automated feeding systems. Zhang, Li et al. [6] employed the TSN model (ResNet101) to establish a database for recognizing pig behaviors, including eating, lying down, walking, scratching, and mating. Their work makes important contributions to the automated analysis of pig behaviors. Chen, Zhu et al. [7] and Viazzi, Ismayilova et al. [8] both developed behavior recognition models for detecting abnormal aggressive behavior in pigs, aiming to alert farm managers and reduce the occurrence of pig injuries. Yang, Xiao et al. [9] created an image recognition model based on Faster R-CNN to analyze the time pigs spend in the feeding area, enabling the assessment of individual feed intake and condition, thereby providing farm managers with an assistant management tool. Zhu, Guo et al. [10] trained an image recognition model to identify pigs in the drinking area, allowing for the measurement of individual water consumption. Through the aforementioned studies, it is evident that the application of artificial intelligence image recognition technology can not only improve animal farming efficiency and management level but also help farmers save costs while ensuring animal welfare.
With the increase in intensive and large-scale pig farms, more pigs are being raised in limited spaces. As a result, pig excrement and feed residues accumulate in the pig columns, which not only affect the health of the pigs but also may generate harmful gases or bacteria that are detrimental to human health. Dust and microorganisms can be suspended in the air of the pig columns, and when microorganisms adhere to dust particles smaller than 5 μm, they can be inhaled into the human body through respiration, depositing in the respiratory tract or lungs of both humans and pigs, thus triggering respiratory system diseases [11]. Previous literature has shown that ammonia (NH3) and hydrogen sulfide (H2S) can have toxic effects on farmers and pigs [12]. Elevated levels of ammonia in pig columns can lead to reduced appetite, convulsions, breathing difficulties, and other adverse reactions in pigs, thereby causing significant negative impacts on the productivity of pig farming. Hydrogen sulfide can be detected by humans at concentrations of 0.01-0.7 ppm, while exposure to concentrations of 150 ppm poses a lethal risk within 8 to 48 hours [11]. According to the literature, the temperature in pig columns can affect the locomotor behavior of pigs, thus having negative effects on their health. Studies have indicated that the temperature in pig columns should be controlled within the range of 20 to 22°C [13,14]. High temperatures can affect the excretion behavior of pigs and reduce their lying time [15,16]. Additionally, the incidence of respiratory system diseases in pigs peaks during the summer months each year, with the opposite pattern observed in the winter months [17]. Compared to temperature, pigs are more sensitive to humidity, and if the relative humidity falls below 40%, it may lead to excessive dust generation, resulting in an increase in pig mortality rate [18].
The main objectives of this study are as follows: (1) To measure the indoor air quality in sow farrowing rooms. (2) To use an artificial intelligence-based image recognition model as a practical on-site management tool for monitoring the fecal health status of pigs. (3) To conduct a correlation analysis and discussion between environmental data collected by an air quality sampler and the fecal health status of pigs. This analysis serves a dual purpose: firstly, it offers essential parameter information for pig farm managers to impact pig health positively. Secondly, it serves as a valuable reference for the future advancement of pig disease prediction models. By leveraging the findings of this research, the primary objective is to enhance pig farming efficiency and minimize labor expenses effectively.
2. Materials and Methods
This study chose the pig's feed intake and excrement health status as indicators of pig health. Feed intake and excrement reflect the pig's physiological functions, and their overall health status also influences their health.
2.1. Research flow chart
In this study, air sampling instruments were installed to measure the environmental parameters inside the sow farrowing rooms, including temperature, humidity, PM2.5, PM10, carbon dioxide (CO2), total volatile organic compounds (TVOC), etc. Additionally, an artificial intelligence image recognition model was developed to assist in collecting the excrement status of the sows on a daily basis. Finally, statistical methods were used to evaluate the correlation between the air quality parameters inside the farrowing rooms and the health of the sows. The research workflow diagram is shown in Figure 1.
2.2. On-site measurement
In this study, the sow farrowing rooms located in Changhua County were measured. The dimensions of the rooms were 19.5 meters long, 15 meters wide, and 3 meters high. There were four rows inside, each containing ten pig cages. The on-site instrument setup positions are illustrated in Figure 2. Each column had dimensions of 2.4 meters in length and 1.8 meters in width. Fifteen surveillance cameras and one air sampling instrument were installed, approximately 2.2 meters from the standing sows.
The research site of this study is the sow farrowing rooms, where the air quality is crucial not only for the health status of the sows but also for the well-being and productivity of the barn workers. To investigate the differences between the indoor air quality and the environmental standards in the farrowing rooms, an integrated air quality monitor was installed above the ceiling of the 6th column sow cage (Figure 2). Data were collected from March 26, 2023, to April 12, 2023, including measurements of temperature, humidity, PM2.5, PM10, CO2, and TVOC levels.
In this study, the researchers chose feed intake as an indicator of the sows' health status. This is because feed intake is an important parameter that reflects the health of pigs. Both insufficient and excessive feed intake can have a negative impact on their health. Additionally, feed intake can be easily obtained through daily observations and recordings by barn workers. This makes data collection relatively convenient and allows for real-time health monitoring and management.
Compared to other health indicators such as body weight and body temperature, feed intake is more responsive to changes in the pigs' health status. This means that feed intake can be used to detect health abnormalities earlier. Therefore, feed intake was chosen as one of the health indicators in this study.
As a crucial basis for assessing the health status of the sows, barn workers are required to feed the sows and record the feed intake and leftover feed for each sow at 7:30 am and 4:00 pm. If the feed is completely consumed during feeding, an additional 0.3-0.4 kg is added per feeding, and a minimum of 1.1 kg is fed per meal. Any leftover feed exceeding 0.5 kg is considered abnormal, and if there are two consecutive meals with leftover feed exceeding 0.5 kg, a vaccine is administered. The researchers collected feed intake data of sows in the farrowing rooms as one of the indicators of their health status. The sows usually stay in the farrowing rooms for about 3 to 4 weeks after giving birth, and they are moved out of the farrowing rooms after the piglets are weaned.
For the experiment, feed intake data were collected from columns 5, 6, 14, 15, 16, 17, 18, 25, 26, and 27, located around the air sampling device (Figure 2). Among these columns, abnormal records were observed in columns 5, 14, 15, and 17 for many abnormal days: 7, 2, 2, and 5, from March 26, 2023, to April 12, 2023. No abnormal conditions occurred in the other columns during this period, as shown in Table 1.
Therefore, this study ultimately selected the feed intake data from columns 5, 14, 15, and 17 for subsequent analysis. These columns were chosen as data sources because they exhibited abnormal feed intake records from March 26, 2023, to April 12, 2023, ensuring the reliability of the analysis results. Through analyzing these abnormal data, the researchers can delve into the causes of abnormal feed intake in sows and further explore potential solutions.
Maintaining animal health is crucial for the operation of a pig farm, and the condition of feces is one of the visual indicators used to assess the health status of sows. Therefore, this study chose the fecal condition as a health indicator to enable quick and accurate evaluation of sow health and early detection and management of potential health issues. Real-time collection of sow fecal conditions was conducted to provide the necessary image data for training an image recognition model. Fifteen cameras were installed in the farrowing rooms using two cameras per two rows or one camera per row, as shown in Figure 2. Among these cameras, the fecal data collected from the camera installed in column 16, which also had an air quality monitor, was used for subsequent analysis in this study.
Fecal conditions were categorized into five levels based on different health statuses: severe diarrhea (Score 1), moderate diarrhea (Score 2), soft feces (Score 3), normal (Score 4), and constipation (Score 5) [19]. In this study, the fecal status of sows in column 16 was classified into two categories: healthy (Score 3, Score 4) and unhealthy (Score 1, Score 2, Score 5). A veterinarian was consulted to assist with the classification of fecal conditions in column 16 from March 26, 2023, to April 12, 2023, which served as the data for subsequent analysis and training of the image recognition model. The questionnaire results included 223 samples classified as usual and 87 samples classified as abnormal.
The reason for selecting column 16 in this study is that it is the location of the air sampler. By monitoring the air quality with sow health, collecting data from column 16 allows for a more accurate analysis of the relationship between air quality and sow health.
2.3. Experimental Instruments and Equipment
In this study, wall-mounted air quality monitors (SAQ100, Guan Bo Energy Conservation Technology CO., LTD., Taichung, Taiwan) were used to measure the environmental conditions on-site. The measured parameters include temperature, humidity, PM2.5, PM10, CO2, and TVOC. Detailed specifications can be found in Table 2.
In this study, surveillance cameras (Guan Bo Energy Conservation Technology CO., LTD., Taiwan) were installed for real-time monitoring of pig excrement. The cameras are equipped with high-resolution image sensors of 3 million pixels, providing high-quality images. They also feature high-power infrared night vision lights with an effective range of approximately 30 meters, a 3.6 mm wide-angle lens (100-120 degrees), and waterproof and dustproof capabilities. The collected image data not only allows real-time monitoring of the pig's condition but also provides essential data for training image recognition models.
2.4. Image Recognition Model
The performance of the feces model was compared after training it for 300, 400, and 500 epochs, with a fixed image size of 640x640 and a batch size of 16. The feces model, when trained for 500 epochs with a fixed image size and batch size, achieved a precision of 0.998, a recall of 1. This means that the model correctly identified feces in 99.8% of the images, and it did not miss any images that contained feces. The model also had a very low box loss of 0.014 and a class loss of 0.001. These results suggest that the feces model was very accurate at detecting feces in images.
In this study, YOLOv5 was chosen as the image recognition model in this study to provide the necessary data for subsequent analysis. You Only Look Once (YOLO) was originally introduced by Redmon et al. [20] in 2016 as an improvement in object detection. It treats object detection as a regression problem and utilizes neural networks for an end-to-end optimization process. By performing a single neural network computation, YOLO can directly predict bounding boxes and class probabilities, distinguishing objects within the spatial boundaries. This approach integrates feature learning and algorithms and is suitable for end-to-end processing, eliminating the need for separate processing steps.
Due to a shortage of manpower and an excessive number of sows, it is not feasible to observe the fecal conditions of each individual pig in real-time. Failure to monitor them promptly may lead to inaccurate assessments as the feces could be trampled by the sows. To accurately determine the health status of sow feces, this study installed surveillance cameras in the pig columns and employed image recognition technology to assess the health condition of the feces, aiming to obtain real-time and precise information regarding sow fecal health. In order to train the model, labeled data is required to guide the computer in its learning process. To ensure accurate labeling, a veterinarian was consulted to determine and label the fecal conditions as the gold standard for model training. Using YOLOv5 as the foundation, this study developed a sow fecal health recognition model. To achieve a higher level of accuracy in the trained model, multiple versions were trained by adjusting parameters such as image size, epoch, and batch size. Drawing from experience in building a handwritten text recognition model, the fecal health recognition model fixed the image size at 640x640 pixels and the batch size at 16, while increasing the image size to the hardware's acceptable limit. The epoch count was adjusted to observe for potential overfitting or underfitting phenomena. Three models were trained with epoch counts set at 300, 400, and 500, respectively.
2.5. Correlation Statistical Analysis
The data collected in this study include air quality data inside pig barns, excretion conditions of pigs, and feed intake data. The air quality data inside pig barns serve as independent variables, while pigs' excretion conditions and feed intake data serve as dependent variables representing their health status.
Logistic regression analysis using IBM SPSS Statistics software (International Business Machines Corp., Armonk, New York, United States) is conducted to analyze the relationship between air quality and pig health. The Chi-Squared Test is employed to analyze the correlation among indicators of pig health status. The p-value is used to determine whether there is a significant association between two categorical variables.
The environmental air quality data was collected by air samplers, and data was collected every 30 seconds from March 26, 2023 to April 12, 2023. The feeding data was judged by the amount of remaining feed recorded in the pig house twice a day. The feeding is done at 7:30 AM and 4:00 PM every day. If the remaining feed is greater than 0.5 kg, it is considered abnormal. If the abnormality occurs in the morning, the data from 4:00 PM the previous day to 7:30 AM today will be classified as abnormal. The feces are also recorded in the same way as the feeding data. The time and state of each pig's bowel movement from March 26, 2023 to April 12, 2023 were analyzed. If the veterinarian judges it to be abnormal, the time period from this time to the previous bowel movement will be classified as abnormal.
3. Results
3.1. Air quality data inside the sow farrowing room
The study collected data on the environmental conditions in a sow farrowing room over a period of 17 days, from March 26th to April 12th, 2023. The measurements included temperature, humidity, particulate matter (PM2.5 and PM10), carbon dioxide (CO2), and total volatile organic compounds (TVOC). The results of the measurements are presented in Table 3.
In Table 3, the average temperature measured in this study was 22.73 oC, average humidity was 73.16%, average CO2 concentration was 476.36 µg/m3, average PM2.5 concentration was 36.91 µg/m3, average PM10 concentration was 38.68 µg/m3, and average TVOC concentration was 0.16 ppm. During the period, the EPA Erlin Air Quality Monitoring Station recorded an average temperature of 21.8 oC, average humidity of 82.2%, average PM2.5 concentration of 22.1 µg/m3, and average PM10 concentration of 49.2 µg/m3.
3.2. Correlation between air quality and sow feed intake
In Table 4, the study was conducted to investigate air quality's impact on sows' feed intake in four different columns. The study found that all air quality indicators except NH3 significantly affected feed intake in all four columns.
In column 5, an increase in humidity, CO2, PM2.5, and TVOC was associated with a decrease in feed intake, while an increase in temperature and PM10 was associated with an increase in feed intake. TVOC had the most significant effect on feed intake, with each unit increase in TVOC concentration being associated with 4.99 times increase in the probability of abnormal feed intake. In column 14, an increase in PM10 and TVOC had a negative effect on feed intake, while an increase in humidity and PM2.5 had a positive effect. TVOC had the most pronounced influence, with a 1 unit increase in TVOC concentration increasing the probability of abnormal feed intake by 7.56 times. In column 15, an increase in temperature, humidity, CO2, and PM2.5 had a negative effect on feed intake, while an increase in PM10 and TVOC had a positive effect. PM2.5 had the most significant impact, with a 1 unit increase in PM2.5 concentration increasing the probability of abnormal feed intake by 1.26 times. n column 17, all indicators affected feed intake significantly. Increased temperature, CO2, PM10, and TVOC adversely affected feed intake. TVOC had the most pronounced effect on feed intake, with a unit increase in TVOC concentration associated with 1.68 times increase in the probability of abnormal feed intake.
Overall, the study found that air quality can significantly impact the feed intake of sow. The most crucial air quality indicator for sow feed intake was TVOC, followed by PM2.5, humidity, CO2, PM10, and temperature.
3.3. The correlation between air quality and fecal health status
In Table 5, the air quality and the fecal health status of sow column 16 were analyzed using logistic regression from March 26, 2023, to April 12, 2023. A questionnaire was used to assess fecal health status with the help of veterinary experts. The questionnaire responses were used for statistical analysis. The statistical analysis results show that TVOC had no significant impact on fecal health status after controlling for other air indicators. However, temperature, humidity, PM10, CO2, and PM2.5 have significant effects. The results suggest that an increase in temperature, humidity, and PM10 has a negative effect on fecal health status, while an increase in CO2 and PM2.5 has a positive effect. Among them, PM10 has the most major impact. This means that each increase in PM10 concentration increases the probability of abnormal fecal health status by 1.09 times. In conclusion, air quality indicators significantly affect the fecal health of sows. Temperature, humidity, and PM10 increases can potentially lead to adverse effects on fecal status. Among these, the impact of PM10 is particularly noteworthy.
3.4. Correlation between food intake and fecal health status
In Table 6, the analysis showed a significant correlation between fecal health status and feed intake in sows in columns 5, 14, and 17. The logistic regression analysis revealed that the odds of having poor fecal health status increased by 3.02 times for sows in column 14 with a high feed intake and by 2.0171 times for sows in column 17 with a high feed intake. However, the odds of having poor fecal health status decreased by 0.67 times for sows in column 5 with a high feed intake. Overall, this study's results suggest a potential correlation between the feed intake status of sows and their fecal health status. However, the specific nature of this relationship may vary depending on the individual sow.
3.5. Assessment of Time Delay Situation
Table 7 shows the logistic regression analysis of adjusted odds ratios of predictors on the feeding status of sows in each field. To better understand the reliability of feeding and fecal indicators as measures of pig health status, this study investigated the possibility of a time delay between air quality and pig health. The study analyzed feeding data from pigs in two ways. First, the data was aligned with the previous recorded time after detecting abnormalities. Second, a fixed 8-hour time delay was applied to the feeding data, assuming that air quality 8 hours prior would affect the feeding status. The results showed that the feeding amount in column 5 was more negatively affected by temperature and PM2.5 when a 8-hour time delay was applied. Similarly, the feeding amount in column 14 was more negatively affected by temperature, humidity, PM2.5, and TVOC. The feeding amount in column 15 was more negatively affected by temperature, and the feeding amount in column 17 was more negatively affected by temperature, PM10, and TVOC. The fecal output in column 16 was also more negatively affected by temperature and PM10. Based on these findings, the study concluded that there may be a time delay between air quality and pig health, with a larger impact observed 8 hours prior.
4. Discussion
The purpose of this section is to study the relationship between environmental data gathered by an air quality sampler and the health of pigs, using feed intake and fecal health as indicators of pig health.
4.1. Air Quality in Sow Farrowing Rooms
It is important to monitor the environmental conditions in sow farrowing rooms to ensure that they are within the optimal range for the health and welfare of the sows and piglets. If the environmental conditions are not optimal, it may be necessary to take steps to improve them, such as increasing ventilation or adding cooling systems. The higher temperature and humidity in the farrowing room could potentially lead to heat stress for the sows and piglets. The higher CO2 concentration could also be a concern, as it can lead to respiratory problems. The higher PM2.5 and PM10 concentrations could also be a concern, as they can cause respiratory problems and other health problems. The quality of the air in a sow farrowing house can be affected by a number of factors, including total volatile organic compounds (TVOC), temperature, and humidity. These factors can have a significant impact on the health of sows, leading to decreased productivity and increased risk of disease. Therefore, it is important to understand the correlation between indoor air quality and sow health in order to improve sow productivity and reduce pig farming costs. Based on the collected data on indoor air quality in the sow farrowing house, it is important to pay attention to the temperature aspect. The average temperature was 22.73°C, with a maximum of 27.8°C and a minimum of 17.8°C. It is important to keep the temperature in the farrowing house within a comfortable range for sows. This will help to ensure that they are healthy and productive. If the temperature is too low, sows may experience hypothermia, which can lead to health problems. If the temperature is too high, sows may experience heat stress, which can also lead to health problems.
Apart from the harmful effects of high and low temperatures on pigs, it is recommended to take appropriate cooling measures when the internal temperature of the pig house exceeds 25°C, according to the Animal Welfare (Pigs) Code of Welfare 2010 published by the New Zealand Ministry of Agriculture [21]. Sejian, Bhatta [16] suggested that an increase in temperature and relative humidity would cause heat stress to all livestock, adversely affecting their production and reproductive potential. Additionally, Metz and Finn [21] indicated that temperature and humidity can influence respiratory infectious diseases, and during the 2009 swine flu outbreak, it was found that the flu incidence increased with a decrease in air humidity.
The average concentration of PM2.5 was 36.91 µg/m3, with a maximum measurement of 590 µg/m3. It is important to note that according to the "Indoor Air Quality Standards" [22] issued by the Environmental Protection Administration, the arithmetic mean of continuous 24-hour measurements or the cumulative 24-hour sampling should not exceed 35 µg/m3 in Taiwan. During the monitoring period, not only did the average value exceed the standard, but there were also extreme values above 500 µg/m3 for a short period of time. Prolonged exposure to such an environment may affect the health of employees. Suspended particulate matter consists of coarse particulate matter (PM10) and fine particulate matter (PM2.5). Biota can inhale very small PM into the trachea and lungs, where it can easily deposit in the pulmonary alveoli, causing inflammation. Epidemiological studies have also shown a correlation between PM and respiratory diseases and inflammation. Mishra, Krishnamoorthy [23] found that PM10 enhances RNA virus infection through the regulation of innate immune responses. The PRRSV virus, which affects pig reproduction and respiratory disorders, is an RNA virus that can infect pigs through the respiratory tract [24]. Neumann, Kliebenstein [25] reported that PRRSV infection reduces pig reproductive capacity and increases mortality.
The average TVOC concentration was 0.16 ppm, with a maximum measurement of 0.4 ppm. According to the "Indoor Air Quality Standards" [22] issued by the Environmental Protection Administration, the arithmetic mean of one-hour measurements or the cumulative one-hour sampling should not exceed 0.56 ppm. Although the measured value of 0.4 ppm was maintained for a short time, continuous monitoring of the TVOC concentration in the sow farrowing house should be given attention in the future. TVOC, as one of the sources of air pollution, comes from commonly used insecticides, leather or metal cleaning agents in daily life or industry. They are mostly volatile organic compounds such as chloroform and trichloromethane. The main sources of TVOC generated or emitted by pig houses include the air inside the pig house, the top space of the manure storage area, the open air above the wastewater, and the surrounding pig farms [26]. These volatile compounds diffuse quickly and can be easily inhaled through the respiratory tract, leading to respiratory diseases such as allergic asthma and cough [27]. Therefore, the air quality in pig farms is crucial for preventing respiratory diseases in pigs.
4.2. Assessing Correlation of Air Quality, Feed Intake, and Fecal Health Status
The correlation between air quality and sow feed intake is important in pig house management and production efficiency. Therefore, maintaining good air quality has a crucial impact on sows' health and production performance. Farmers should regularly monitor air quality indicators and take appropriate measures to ensure air quality in pig houses, thus safeguarding sows' health and production efficiency. However, the data quantity is relatively small due to the limited number of abnormal feed intake instances between instrument installation and weaning of the piglets, as well as the compressed data collection days. Future analysis should include a more extended period and incorporate sow health conditions from different litters to obtain more comprehensive data analysis results. Overall, this study provides important insights into the correlation between air quality parameters and sow feeding and fecal health status, which can guide the development of comprehensive pig disease prediction models and aid farm managers in formulating more effective feeding strategies and health management measures. The study also analyzes the correlation between feeding status and fecal health, both critical factors in sow production and closely related to farm environment and production management. Through this research, we can better understand the impact of farm environment and management measures on sow health and feeding behavior, thereby improving farm management strategies, reducing production costs, and minimizing disease incidence.
Results of analyzing the correlation between sow feed intake and air quality data in the farrowing room indicate the following: (1) Results for CO2 consistently show a negative impact on sow feed intake (OR ≥ 1), indicating that increased CO2 levels are likely to cause abnormal feed intake in pigs. (2) TVOC exhibits significantly higher odds ratios in sow columns 5, 14, and 17, suggesting that increased TVOC levels may lead to abnormal feed intake in pigs. Higher TVOC values may reduce pig feed intake and consequently increase the risk of disease. The average TVOC concentration within the collected days is 0.16 ppm ± 0.049, with a minimum value of 0 ppm and a maximum value of 0.4 ppm. This finding aligns with the study by Ni, Robarge [26], which identifies TVOC as an air pollutant in pig houses with potential negative impacts on pig health. (3) Temperature shows odds ratios greater than 1 in sow columns 14, 15, and 17, indicating that increasing temperatures are likely to cause abnormal feed intake in pigs. This finding aligns with the study by Sejian, Bhatta [16], which states that rising temperature and relative humidity impose heat stress on livestock, negatively affecting their production and reproductive potential.
Through the analysis of the correlation between sow fecal status and air quality data in the sow house, the following results were obtained: (1) TEMP, RH, and PM10 had odds ratios greater than 1, indicating that the increased concentrations of TEMP, RH, and PM10 during the observed period would increase the likelihood of abnormal fecal health in sows. This finding is consistent with the study by Sejian, Bhatta[16]. (2) CO2, PM2.5, and TVOC had odds ratios less than 1, indicating that the increased concentrations of CO2, PM2.5, and TVOC during the observed period would decrease the likelihood of abnormal fecal health in sows. Although this differs from other research results, the limited amount of fecal data warrants future analysis with a larger sample size for a more rigorous examination.
5. Conclusions
The study concludes that there is a correlation between air quality and sow health. The study found that increased CO2, TVOC, and temperature levels were associated with abnormal feed intake in sows. In contrast, increased TEMP, RH, and PM10 levels were associated with abnormal fecal health in sows. The study also found that increased TVOC levels may reduce pig feed intake and increase disease risk. The study's findings suggest that it is essential to monitor air quality in sow farrowing houses and take steps to improve air quality if necessary. This will help to ensure the health and productivity of sows. The small sample size and the short data collection period limit the study's findings. Future studies with a larger sample size and a more extended data collection period are needed to confirm the findings. Overall, the study provides important insights into the correlation between air quality parameters, sow feeding, and fecal health status. These insights can be used to develop comprehensive pig disease prediction models and to help farm managers formulate more effective feeding strategies and health management measures.
Author Contributions
J.-K.C. wrote the manuscript and supervised the project; A.-L.T. participated in AI and data analysis and field measurement; T.-I.T. and Y.-C.L. were the consultants for the numerical simulation and field measurement. All authors have read and agreed to the published version of the manuscript.
Funding
This work was supported by the National Science and Technology Council, Taiwan, R.O.C. [grant no. 110-2321-B-001-015].
Institutional Review Board Statement
Not applicable in this study.
Informed Consent Statement
Not applicable in this study.
Data Availability Statement
Data sharing not applicable.
Acknowledgments
We thank National Center for High-performance Computing (NCHC) for providing the DAS (Data Analysis Service), computational, and storage resources. They also thanks animal core facilities of ABRC and Tun-Ju swine farm for their excellent technical assistance.
Conflicts of Interest
The authors declare no conflict of interest.
Nomenclature
| AI | Artificial Intelligence | |
| COVID-19 | Coronavirus disease 2019 | |
| EPA | Environmental Protection Administration | |
| H2S | hydrogen sulfide | |
| IoT | Internet of thing | |
| PLF | Precision Livestock Farming | |
| R-CNN | Region Convolution Neural Network | |
| TSN | temporal segment networks | |
| YOLO | You Only Look Once, an object detection | |
| CO2 | carbon dioxide | ppm |
| NH3 | Ammonia | ppm |
| PM10 | particulate matter 10 | μg/m3 |
| PM2.5 | particulate matter 2.5 | μg/m3 |
| RH | relative humidity | % |
| TEMP | temperature | oC |
| TVOC | Total Volatile Organic Compound | ppm |
References
- Wang, S.; Jiang, H.; Qiao, Y.; Jiang, S.; Lin, H.; Sun, Q. The Research Progress of Vision-Based Artificial Intelligence in Smart Pig Farming. Sensors 2022, 22, 6541. [Google Scholar] [CrossRef] [PubMed]
- García, R.; Aguilar, J.; Toro, M.; Pinto, A.; Rodríguez, P. A systematic literature review on the use of machine learning in precision livestock farming. Comput Electron Agr 2020, 179, 105826. [Google Scholar] [CrossRef]
- Rosa, G.J.M. Grand Challenge in Precision Livestock Farming. Frontiers in Animal Science 2021, 2. [Google Scholar] [CrossRef]
- Thomas, M. Banhazi, H.L., J L Black, H Crabtree, P Schofield, M Tscharke, D Berckmans. Precision Livestock Farming: An international review of scientific and commercial aspects. Int J Agric & Biol Eng 2012, 5, 1. [Google Scholar] [CrossRef]
- Shao, H.; Pu, J.; Mu, J. Pig-Posture Recognition Based on Computer Vision: Dataset and Exploration. Animals 2021, 11, 1295. [Google Scholar] [CrossRef]
- Zhang, K.; Li, D.; Huang, J.; Chen, Y. Automated Video Behavior Recognition of Pigs Using Two-Stream Convolutional Networks. Sensors 2020, 20, 1085. [Google Scholar] [CrossRef]
- Chen, C.; Zhu, W.; Ma, C.; Guo, Y.; Huang, W.; Ruan, C. Image motion feature extraction for recognition of aggressive behaviors among group-housed pigs. Comput Electron Agr 2017, 142, 380–387. [Google Scholar] [CrossRef]
- Viazzi, S.; Ismayilova, G.; Oczak, M.; Sonoda, L.T.; Fels, M.; Guarino, M.; Vranken, E.; Hartung, J.; Bahr, C.; Berckmans, D. Image feature extraction for classification of aggressive interactions among pigs. Comput Electron Agr 2014, 104, 57–62. [Google Scholar] [CrossRef]
- Yang, Q.; Xiao, D.; Lin, S. Feeding behavior recognition for group-housed pigs with the Faster R-CNN. Comput Electron Agr 2018, 155, 453–460. [Google Scholar] [CrossRef]
- Zhu, W.-x.; Guo, Y.-z.; Jiao, P.-p.; Ma, C.-h.; Chen, C. Recognition and drinking behaviour analysis of individual pigs based on machine vision. Livestock Science 2017, 205, 129–136. [Google Scholar] [CrossRef]
- Kim, K.Y.; Ko, H.J.; Lee, K.J.; Park, J.B.; Kim, C.N. Temporal and spatial distributions of aerial contaminants in an enclosed pig building in winter. Environmental Research 2005, 99, 150–157. [Google Scholar] [CrossRef] [PubMed]
- Verstegen, M.W.A.; Hel, W.; Jongebreur, A.A.; Enneman, G. The Influence of Ammonia and Humidity on Activity and Energy Balance Data in Groups of Pigs. Zeitschrift für Tierphysiologie Tierernährung und Futtermittelkunde 2009, 37, 255–263. [Google Scholar] [CrossRef] [PubMed]
- Geers, R.; Dellaert, B.; Goedseels, V.; Hoogerbrugge, A.; Vranken, E.; Maes, F.; Berckmans, D. An assessment of optimal air temperatures in pig houses by the quantification of behavioural and health-related problems. Animal Production 1989, 48, 571–578. [Google Scholar] [CrossRef]
- Huynh, T.T.T.; Aarnink, A.J.A.; Verstegen, M.W.A.; Gerrits, W.J.J.; Heetkamp, M.J.W.; Kemp, B.; Canh, T.T. Effects of increasing temperatures on physiological changes in pigs at different relative humidities1. Journal of Animal Science 2005, 83, 1385–1396. [Google Scholar] [CrossRef]
- Huynh, T.T.T.; Aarnink, A.J.A.; Gerrits, W.J.J.; Heetkamp, M.J.H.; Canh, T.T.; Spoolder, H.A.M.; Kemp, B.; Verstegen, M.W.A. Thermal behaviour of growing pigs in response to high temperature and humidity. Applied Animal Behaviour Science 2005, 91, 1–16. [Google Scholar] [CrossRef]
- Sejian, V.; Bhatta, R.; Gaughan, J.B.; Dunshea, F.R.; Lacetera, N. Review: Adaptation of animals to heat stress. animal 2018, 12, s431–s444. [Google Scholar] [CrossRef]
- Lee, H.; Perkins, C.; Gray, H.; Hajat, S.; Friel, M.; Smith, R.P.; Williamson, S.; Edwards, P.; Collins, L.M. Influence of temperature on prevalence of health and welfare conditions in pigs: time-series analysis of pig abattoir inspection data in England and Wales. Epidemiol Infect 2020, 148, e30. [Google Scholar] [CrossRef]
- Arulmozhi, E.; Basak, J.K.; Sihalath, T.; Park, J.; Kim, H.T.; Moon, B.E. Machine Learning-Based Microclimate Model for Indoor Air Temperature and Relative Humidity Prediction in a Swine Building. Animals 2021, 11, 222. [Google Scholar] [CrossRef]
- Liu, P.; Piao, X.; Thacker, P.; Zeng, Z.k.; Li, P.; Wang, D.; Kim, S. Chito-oligosaccharide reduces diarrhea incidence and attenuates the immune response of weaned pigs challenged with E. coli K88. Journal of animal science 2010, 88, 3871–3879. [Google Scholar] [CrossRef]
- Redmon, J.; Divvala, S.; Girshick, R.; Farhadi, A. You Only Look Once: Unified, Real-Time Object Detection. arXiv pre-print server, 2016; arxiv:1506.02640. [Google Scholar]
- Metz, J.A.; Finn, A. Influenza and humidity--Why a bit more damp may be good for you! J Infect 2015, 71 Suppl 1, S54–58. [Google Scholar] [CrossRef]
- Environmental Protection Administration Executive Yuan, R. O.C. Indoor Air Quality Standards. 2012.
- Mishra, R.; Krishnamoorthy, P.; Gangamma, S.; Raut, A.A.; Kumar, H. Particulate matter (PM(10)) enhances RNA virus infection through modulation of innate immune responses. Environ Pollut 2020, 266, 115148. [Google Scholar] [CrossRef] [PubMed]
- Arruda, A.G.; Tousignant, S.; Sanhueza, J.; Vilalta, C.; Poljak, Z.; Torremorell, M.; Alonso, C.; Corzo, C.A. Aerosol Detection and Transmission of Porcine Reproductive and Respiratory Syndrome Virus (PRRSV): What Is the Evidence, and What Are the Knowledge Gaps? Viruses 2019, 11, 712. [Google Scholar] [CrossRef] [PubMed]
- Neumann, E.J.; Kliebenstein, J.B.; Johnson, C.D.; Mabry, J.W.; Bush, E.J.; Seitzinger, A.H.; Green, A.L.; Zimmerman, J.J. Assessment of the economic impact of porcine reproductive and respiratory syndrome on swine production in the United States. Journal of the American Veterinary Medical Association 2005, 227, 385–392. [Google Scholar] [CrossRef]
- Ni, J.-Q.; Robarge, W.P.; Xiao, C.; Heber, A.J. Volatile organic compounds at swine facilities: A critical review. Chemosphere 2012, 89, 769–788. [Google Scholar] [CrossRef] [PubMed]
- Anundi, H.; Lind, M.-L.; Friis, L.; Itkes, N.; Langworth, S.; Edling, C. High exposures to organic solvents among graffiti removers. Int Arch Occ Env Hea 1993, 65, 247–251. [Google Scholar] [CrossRef] [PubMed]
Figure 1.
The flow chart of the study.

Figure 2.
Pig house floor plan.
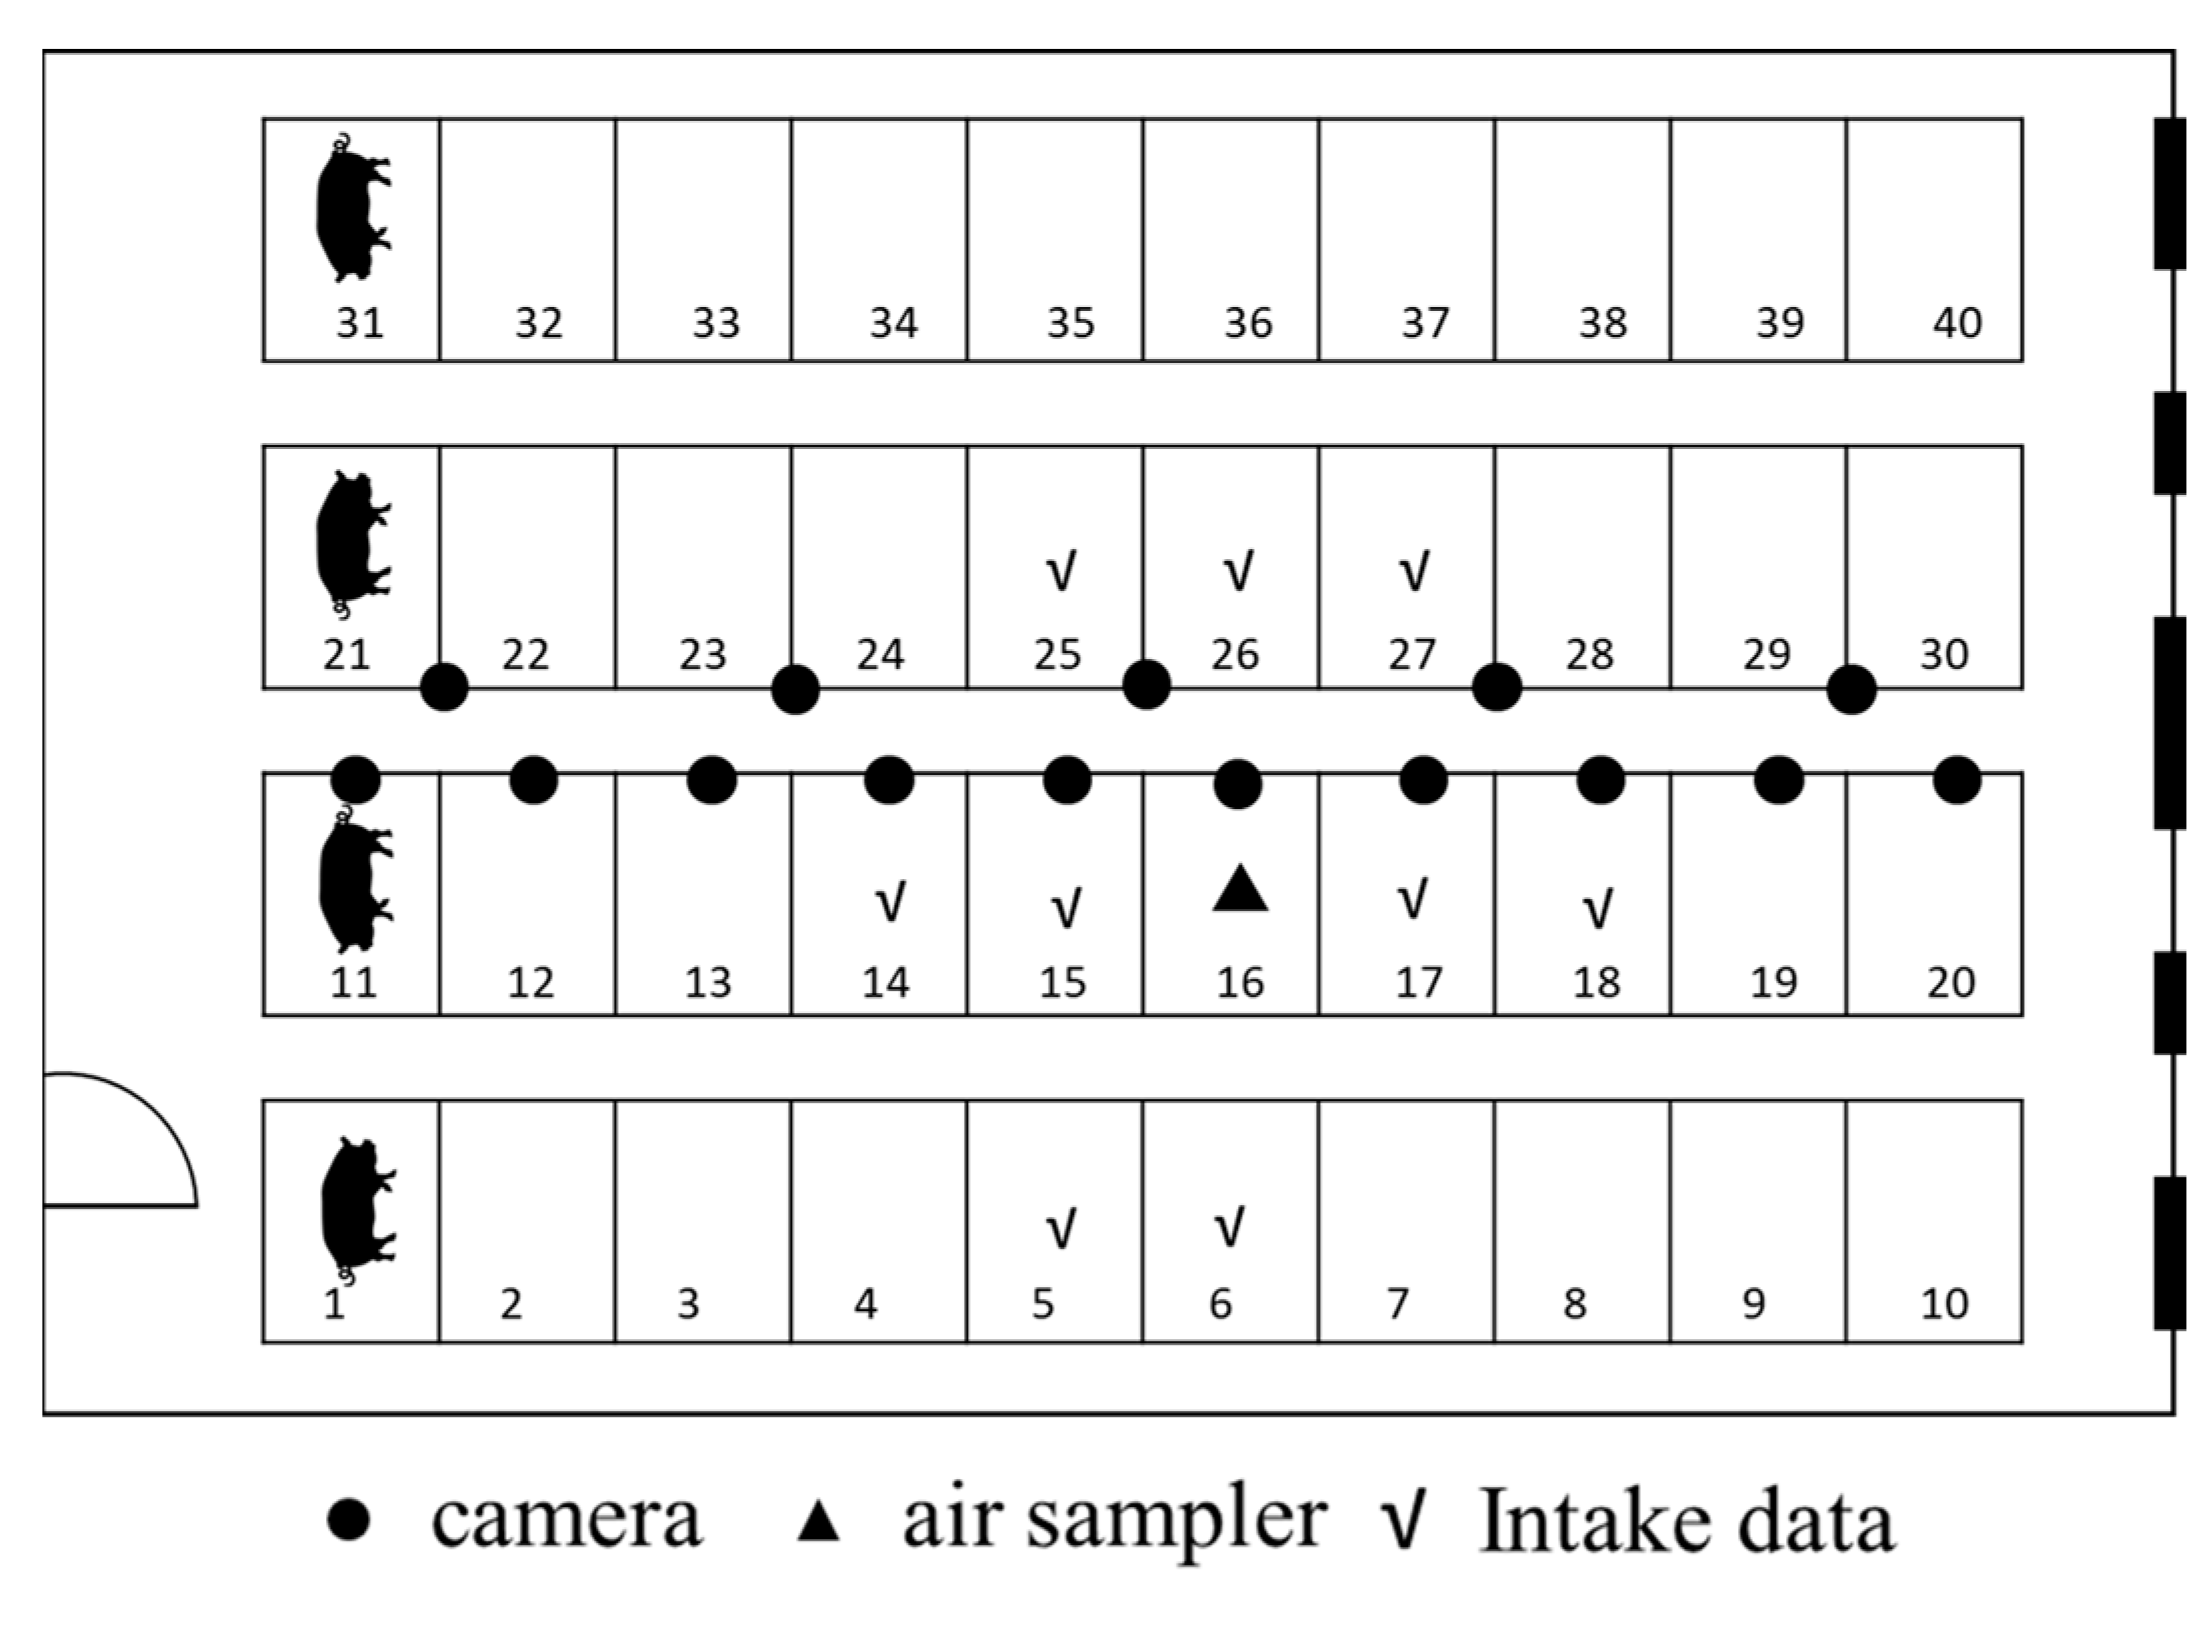

Table 1.
Abnormal Days of Feed Intake for Sows in Different Columns.
| Column | Abnormal days from 2023/3/16 to 2023/4/12 | Abnormal days from 2023/3/26 to 2023/4/12 |
|---|---|---|
| 5 | 10 | 7 |
| 6 | 6 | 0 |
| 14 | 5 | 2 |
| 15 | 7 | 2 |
| 16 | 6 | 0 |
| 17 | 10 | 5 |
| 18 | 5 | 0 |
| 25 | 2 | 0 |
| 26 | 3 | 0 |
| 27 | 0 | 0 |
Table 2.
Air Quality Monitor Specifications.
| SAQ100 Wall-mounted Air Quality Monitor | |
|---|---|
| Monitoring Parameters | Temperature, Humidity, PM2.5, PM10, CO2, TVOC |
| Measurement Range | Temperature: -30~100OC Humidity: 0~100%RH PM2.5、PM10: 0~999 µg/m3 CO2: 0~5000 ppm TVOC: 0.125~0.6 ppm |
| Sensors | Temperature, Humidity: Digital sensors PM2.5、PM10: Optical sensors CO2: NDIR infrared sensor TVOC: Semiconductor-based |
| Accuracy | Temperature: ±5 OC Humidity: ±3%RH PM2.5、PM10:< 50µg/m±10%;> 50 µg/m3±5 µg/m3 |
| Response Time | Temperature, Humidity: 1 second PM2.5、PM10:<10 second CO2:<20 second TVOC:<60 second |
| Operating Environment | 0~50 OC |
Table 3.
Descriptive Data of Air Quality in Sow Barn from March 26, 2023 to April 12, 2023.
| Mean | Standard Error | Median | Minimum | Maximum | |
|---|---|---|---|---|---|
| TEMP (oC) | 22.73 | 0.01 | 22 | 17.3 | 27.8 |
| RH (%) | 73.16 | 0.03 | 74.5 | 48.5 | 87.2 |
| CO2 (µg/m3) | 476.36 | 0.24 | 464.2 | 379.2 | 661 |
| PM2.5 (µg/m3) | 36.91 | 0.08 | 33 | 3 | 590 |
| PM10 (µg/m3) | 38.68 | 0.09 | 35 | 4 | 598 |
| TVOC (ppm) | 0.16 | 0.00 | 0.2 | 0.1 | 0.4 |
Table 4.
Odds Ratios of Predictors on the Feeding Status of Sows in Each Column using Logistic Regression Analysis.
Table 4.
Odds Ratios of Predictors on the Feeding Status of Sows in Each Column using Logistic Regression Analysis.
| Column 5 | Column 14 | Column 15 | Column 17 | |||||
|---|---|---|---|---|---|---|---|---|
| Predictor | OR (95% CI) |
p-value | OR (95% CI) |
p-value | OR (95% CI) |
p-value | OR (95% CI) |
p-value |
| TEMP | 0.18 (0.17-0.19) |
<0.001* | 1.01 (0.99-1.02) |
0.24 | 1.82 (1.76-1.88) |
<0.001* | 1.16 (1.12-1.63) |
<0.001* |
| RH | 1.03 (1.03-1.04) |
<0.001* | 0.99 (0.99-1.00) |
<0.001* | 1.03 (1.03-1.04) |
<0.001* | 0.98 (0.97-0.98) |
<0.001* |
| CO2 | 1.01 (1.01-1.01) |
<0.001* | 1.00 (1.00-1.00) |
0.48 | 1.03 (1.02-1.03) |
<0.001* | 1.00 (1.00-1.00) |
<0.001* |
| PM2.5 | 1.17 (1.07-1.29) |
<0.001* | 0.71 (0.67-0.76) |
<0.001* | 1.26 (1.11-1.41) |
<0.001* | 0.65 (0.61-0.69) |
<0.001* |
| PM10 | 0.83 (0.76-0.91) |
<0.001* | 1.37 (1.29-1.46) |
<0.001* | 0.76 (1.67-0.85) |
<0.001* | 1.53 (1.43-1.63) |
<0.001* |
| TVOC | 4.99 (2.88-8.67) |
<0.001* | 7.56 (5.03-11.36) |
<0.001* | 0.11 (0.15-0.23) |
<0.001* | 1.68 (1.09-2.61) |
0.02 |
OR: Odds ratios; CI: Confidence intervals; *p<0.05: Significance level indicating statistical significance at p<0.05.
Table 5.
Odds Ratios of Predictors on the Fecal Status of Sows in Column 16 using Logistic Regression Analysis.
Table 5.
Odds Ratios of Predictors on the Fecal Status of Sows in Column 16 using Logistic Regression Analysis.
| B | S.E. | Wald | DF | p-value | Exp(B) | Exp(B) 95% Confidence Interval |
||
|---|---|---|---|---|---|---|---|---|
| Lower | Upper | |||||||
| TEMP | 0.047 | 0.008 | 36.929 | 1 | <.001* | 1.048 | 1.032 | 1.064 |
| RH | 0.05 | 0.002 | 1005.601 | 1 | <.001* | 1.052 | 1.048 | 1.055 |
| CO2 | -0.011 | 0 | 1309.702 | 1 | <.001* | 0.989 | 0.989 | 0.99 |
| PM2.5 | -0.089 | 0.035 | 6.588 | 1 | 0.01* | 0.915 | 0.855 | 0.979 |
| PM10 | 0.088 | 0.034 | 6.706 | 1 | 0.01* | 1.092 | 1.022 | 1.168 |
| TVOC | -0.413 | 0.222 | 3.458 | 1 | 0.063 | 0.662 | 0.428 | 1.023 |
| Constant | -0.99 | 0.319 | 9.623 | 1 | 0.002 | 0.372 | ||
B: Estimated coefficient ; S.E.: Standard error; Wald: Z2 statistic; Exp(B): Odds ratio; *p<0.05: Significance level indicating statistical significance at p<0.05
Table 6.
Odds Ratios of Feeding Quantity on Fecal Status in Sows using Logistic Regression Analysis.
Table 6.
Odds Ratios of Feeding Quantity on Fecal Status in Sows using Logistic Regression Analysis.
| B | S.E. | Wald | DF | p-value | Exp(B) | Exp(B) 95%Confidence Interval | |||
|---|---|---|---|---|---|---|---|---|---|
| Lower | Upper | ||||||||
| Correlation between Fecal Status and Feeding Quantity in column 5 | |||||||||
| intake_5 | -0.408 | 0.029 | 194.22 | 1 | <.001* | 0.665 | 0.628 | 0.704 | |
| Constant | -1.112 | 0.011 | 9605.18 | 1 | <.001* | 0.329 | |||
| Correlation between Fecal Status and Feeding Quantity in column 14 | |||||||||
| intake_14 | 1.105 | 0.023 | 2399.61 | 1 | <.001* | 3.018 | 2.887 | 3.154 | |
| Constant | -1.507 | 0.013 | 12990.6 | 1 | <.001* | 0.222 | |||
| Correlation between Fecal Status and Feeding Quantity in column 15 | |||||||||
| intake_15 | -0.013 | 0.04 | 0.112 | 1 | 0.737 | 0.987 | 0.913 | 1.067 | |
| Constant | -1.179 | 0.011 | 11793.7 | 1 | <.001* | 0.308 | |||
| Correlation between Fecal Status and Feeding Quantity in column 17 | |||||||||
| intake_17 | 0.699 | 0.025 | 806.313 | 1 | <.001* | 2.011 | 1.917 | 2.111 | |
| Constant | -1.331 | 0.012 | 12120.72 | 1 | <.001* | 0.264 | |||
B: Estimated coefficient ; S.E.: Standard error; Wald: Z2 statistic; Exp(B): Odds ratio; *p<0.05: Significance level indicating statistical significance at p<0.05
Table 7.
Adjusted Odds Ratios of Predictors on the Feeding Status of Sows in Each Field using Logistic Regression Analysis.
Table 7.
Adjusted Odds Ratios of Predictors on the Feeding Status of Sows in Each Field using Logistic Regression Analysis.
| Column 5 | Column 14 | Column 15 | Column 17 | |||||
|---|---|---|---|---|---|---|---|---|
| Predictor | OR (95% CI) |
P-value | OR (95% CI) |
P-value | OR (95% CI) |
P-value | OR (95% CI) |
P-value |
| TEMP | 3.29 (2.91-3.72) |
<0.001* | 16.20 (6.9-37.9) |
<.001* | 29.5 (22.7-38.3) |
<.001* | 1.43 (1.39-1.47) |
<.001* |
| RH | 1.18 (1.16-1.20) |
<0.001* | 16.79 (11.1-25.5) |
<.001* | 0.99 (0.99-1) |
0.023* | 0.93 (0.92-0.93) |
<.001* |
| CO2 | 0.98 (0.98-0.99) |
<0.001* | 0.99 (0.98-1) |
0.005* | 0.98 (0.98-0.99) |
<.001* | 1.01 (1-1.01) |
<.001* |
| PM2.5 | 7.64 (6.54-8.93) |
<0.001* | 14.69 (4.19-51.5) |
<.001* | 0.72 (0.55-0.94) |
0.015* | 0.31 (0.28-0.36) |
<.001* |
| PM10 | 0.13 (0.12-0.16) |
<0.001* | 0.06 (0.02-0.2) |
<.001* | 1.38 (1.06-1.8) |
0.017* | 3.01 (2.67-3.39) |
<.001* |
| TVOC | 0.37 (0.09-1.57) |
0.177 | 7E+11 (7E+8-7E+14) |
<.001* | 0.74 (0.16-3.32) |
0.690 | 197 (99.4-390.2) |
<.001* |
1Original Definition: Feeding status is defined based on the previous recorded time. For example, if an abnormality is recorded at 7:00 AM on April 1st, it is defined as abnormal from 4:00 PM on March 31st to 7:00 AM on April 1st. 2Adjusted Definition: Assuming that the feeding status is influenced by the air quality parameters in the previous 8 hours. For example, if an abnormality is recorded at 7:00 AM on April 1st, it is defined as abnormal from 11:00 PM on March 31st to 7:00 AM on April 1st. OR: Odds ratios; CI: Confidence intervals; *p<0.05: Significance level indicating statistical significance at p<0.05.
Disclaimer/Publisher’s Note: The statements, opinions and data contained in all publications are solely those of the individual author(s) and contributor(s) and not of MDPI and/or the editor(s). MDPI and/or the editor(s) disclaim responsibility for any injury to people or property resulting from any ideas, methods, instructions or products referred to in the content. |
© 2023 by the authors. Licensee MDPI, Basel, Switzerland. This article is an open access article distributed under the terms and conditions of the Creative Commons Attribution (CC BY) license (http://creativecommons.org/licenses/by/4.0/).
Copyright: This open access article is published under a Creative Commons CC BY 4.0 license, which permit the free download, distribution, and reuse, provided that the author and preprint are cited in any reuse.


