
Submitted:
19 July 2023
Posted:
21 July 2023
You are already at the latest version
Abstract
The objective of this study is to investigate the use of excavation behavior prediction and analysis software in the field of civil en-gineering. PLAXIS and SoilWorks, widely used in the engineering and academic communities, were employed as research tools for analyzing gravel layers and deriving appropriate ranges of soil elastic modulus for different software programs. By collecting excavation cases in the Xindian area of New Taipei City, Taiwan, and conducting deep excavation analysis using the displacement of retaining walls, this study provides recommended ranges for localized selection of soil elastic modulus. The suggested range for PLAXIS is 7,840 N/m² to 9,800 N/m², while Soil-Works suggests a range of 2,450 N/m² to 3,430 N/m². These ranges allow for reasonable estimation of maximum deformations during the final excavation stage. Based on the research findings, it is recommended that engineers refer to the provided ranges when selecting soil elastic modulus for excavation analysis in gravel layers using different soft-ware programs in the Xindian area of Taiwan to improve the accuracy of deformation predictions during the final excavation stage. These results serve as important references for engineers and contribute to the effective prediction and management of excavation behavior in civil engineering projects.
Keywords:
Numerical Simulation of Deep Excavation
; Gravel Layers
; Localized Soil Elastic Modulus
; PLAXIS
; SoilWorks
1. Introduction
The issue of land spatial utilization is a common problem faced by urban areas in Taiwan's development. To effectively compete for space, there is a growing trend of existing buildings undergoing renovations or new buildings being constructed with increased above-ground floors, as well as a shift towards underground development. As a result, building foundations are being dug deeper, and the scale of deep excavation projects is increasing. In recent years, with the continuous updates and changes in analysis software, there has been a development of software that combines and utilizes drawing software to quickly establish analysis models, set parameters, and perform excavation simulation analyses at various stages, such as GTS and SoilWorks.
This study utilizes the 2D PLAXIS and SoilWorks programs as research tools to collect case studies of gravel layer excava-tions in the Xindian area of New Taipei City. The displacement of retaining structures is used to conduct feedback analysis of the parameters for deep excavation analysis. The aim is to pro-vide recommendations for the selection range of soil elastic modulus in numerical simulation analysis parameters for the analyzed case area or similar geological conditions. The ex-pected outcomes of this study can serve as a reference for the engineering community in future deep excavation analysis and design.
1.1. Engineering Properties and Zoning of Taipei Basin Soils
In regard to the engineering properties and zoning of soils in the Taipei Basin, Hung et al., in 1994, divided the area west of the Tamsui River into four zones based on administrative districts and in-situ standard penetration test results [1]. Liu et al. further divided the region west of the Tamsui River, south of the Xindian River, and the Da Han River basin into seven zones based on geological formations [2].
Li et al., in 1996, established a geotechnical database system using approximately 1,600 borehole data [3]. They subdivided the engineering geology zoning of Taipei City into 13 zones and extended the zoning to New Taipei City by incorporating approximately 400 borehole data within the New Taipei City area, resulting in a total of 7 zones. The proposed engineering geology zoning map for the Taipei Basin was based on this database.
1.2. Literature Review on Finite Element Method
The PLAXIS software, developed by PLAXIS BV in the Netherlands in 1999, is capable of handling various types of geotechnical analysis problems involving plane strain and axisymmetric conditions in two-dimensional space. Analyzing deep excavation projects using the finite element method involves dividing the retaining wall and surrounding soil within the influence range of the excavation depth into multiple meshes. Each mesh is assigned appropriate element types (such as beam elements or bi-linear elements) and stress-strain models (such as elastic models, hyperbolic models, or yield surface models) based on their material characteristics and differences. The stress changes and deformations of each element induced by the excavation are then solved using the finite element method [4].
By accurately controlling the construction sequence during deep excavation analysis using the finite element method, it is possible to calculate the displacements of each mesh point within and outside the excavation area. Many domestic researchers have applied the finite element method to successfully obtain lateral displacements of retaining structures [5,6,7,8,9,10].
1.3. Introduction to Soil Elastic Modulus
In numerical analysis, the engineering characteristics of soil parameters, such as soil cohesion, internal friction angle, and unit weight, can be directly obtained through testing and are commonly used without dispute. However, the elastic modulus of soil cannot be directly determined from tests due to the disturbance caused by soil sampling. Therefore, empirical formulas are often used to estimate the elastic modulus in practical applications.
For clay soils, Bjerrum [15] studied normally consolidated Norwegian clays and proposed the following equation to estimate the elastic modulus of clay:
where Es is the elastic modulus, Su is the undrained shear strength.
1.4. Literature Review on Sensitivity Analysis of Parameters
In numerical analysis of foundation excavations, different analysis programs have different theoretical foundations and vary in terms of input parameters. Although different programs may use different input parameters due to their specific characteristics, the analysis results should exhibit similar trends in retaining wall deformation.
Hsieh et al. conducted a sensitivity analysis of deep excavation parameters using the RIDO program for representative cases involving sandy and clayey layers [20]. The results showed that the Φ (friction angle) value had a less significant impact on the analysis results, while the Su (undrained shear strength) value was more sensitive. The variation of the horizontal ground reaction coefficient had a lower sensitivity to the maximum bending moment of the retaining wall. When the horizontal ground reaction coefficient was reduced to 1/4 of the reference value, the deformation increased by 60% to 100%, indicating that the Kh value was more sensitive to wall displacement.
Zhang et al. conducted a sensitivity analysis using the RIDO program for a construction site in Taipei [21]. They found that varying the soil friction angle within 0.8 to 1.2 times the original analysis value resulted in an approximately ±4% effect on the retaining wall displacement. Varying the horizontal ground reaction coefficient within 0.5 to 2.0 times the original analysis value resulted in a variation of -25% to 13% in wall displacement, which was consistent with the findings of Hsieh et al.
Chiu performed sensitivity analysis using the PLAXIS program, specifically focusing on the effective friction angle and soil elastic modulus [22]. The results showed that a smaller Φ value had a greater impact on continuous wall bending moment, displacement, and average axial force. Undrained cohesive soil exhibited relatively lower sensitivity to the friction angle. The sensitivity of average axial force was lower compared to continuous wall bending moment and displacement. Regarding the sensitivity of soil elastic modulus, a smaller Es value had a greater impact on continuous wall displacement.
2. Materials and Methods
2.1. Research Method and Procedure
The behavior of retaining structure deformation and its impact on the surrounding ground resulting from foundation excavation has been extensively studied both domestically and internationally. The most commonly used 1D retaining wall analysis programs in the engineering industry are the RIDO program developed by Robert Fages Logiciels and the TORSA program developed by the Foundation of Geotechnical Engineering and Technology Research. Additionally, 2D or even 3D numerical analysis software is used for simulation and review, with PLAXIS and FLAC being the most common numerical analysis programs domestically and internationally. In this study, the 2D PLAXIS and SoilWorks programs are selected as research tools. Firstly, sensitivity analysis is conducted using the basic case model and variations of soil parameters adopted in previous studies with SoilWorks, and the results are compared with those from PLAXIS analysis. Furthermore, using the case of gravel layer excavation in the Xindian area, suitable ranges of soil elastic modulus for analysis using PLAXIS and SoilWorks programs are derived.
Based on the above explanations, the proposed workflow for this study is illustrated in Figure 1.
2.2. Research Materials
- PLAXIS Numerical Simulation
The background and characteristics of the PLAXIS program, along with an explanation of the numerical analysis model used. Case studies of gravel layer excavations in the Xindian area of New Taipei City are collected, and feedback analysis is performed using the existing monitoring data to derive suitable soil parameters for analysis using the PLAXIS program in gravel layers.
- SoilWorks Numerical Simulation
The background and characteristics of the SoilWorks program. Sensitivity analysis is conducted using the basic case model and variations of soil parameters adopted in previous studies, comparing the results with the previous PLAXIS outcomes. The case study of gravel layer excava-tion in the Xindian area mentioned in the previous section is utilized to derive suitable soil parameters for analysis using the SoilWorks program. An additional case study, Case 3, is included for parameter verification.
3. PLAXIS Numerical Simulation
Most of the research literature on deep excavation focuses on soft soil and sandy soil, and there are relatively fewer results available regarding engineering characteristics of gravel layers. Deep excavation engineering involves complex soil-structure interactions and can benefit from the application of relevant knowledge and experience from both the geotechnical and structural domains for design analysis. This study aims to investigate the behavior of deep excavation in gravel layers in the Xindian area and provide reference parameters for deep excavation analysis and design in similar geological conditions by using collected monitoring data for feedback analysis.
The geological characteristics of gravel layers are mainly related to the size, shape, density, content, and properties of the gravel particles and the fine-grained material filling the voids. According to the findings of Hong et al., when the coarse material content (larger than sieve No. 4) in a gravel layer exceeds 75%, the engineering properties of the gravel layer are often determined by the characteristics of the coarse particles [23]. Conversely, if the content is less than 70%, the engineering properties are dominated by the fine-grained material. Das also pointed out that if coarse-grained soil contains more than 35% fine-grained material, it behaves more like a fine-grained material due to the sufficient filling of fine particles between the coarse particles, causing separation [24].
In this study, the case site is the upper part of the Jingmei gravel layer in the Xindian area. Due to its location in an urban area and limited investigation funds, it is difficult to find suitable sites for field testing. As a result, relevant test data are scarce. When conducting geotechnical engineering assessments, parameter values are usually estimated through empirical formulas based on field tests or assumed based on engineering experience. In this study, the parameters of the gravel layer will be determined through actual monitoring data from case studies and referenced literature information. The feedback analysis will help determine reasonable parameters for the gravel layer in practical cases, aiming to provide recommendations for the applicable range of soil elastic modulus (Es) parameters in numerical analysis of deep excavation in the region.
3.1. Analysis Methods and Models
The PLAXIS 2D software is used to address soil-structure interaction problems encountered in various geotechnical engineering applications. It can analyze behaviors such as deep excavation, slope stability, reinforced retaining walls, soil nails, ground anchors, internal bracing, raft foundations, pile foundations, seepage, tunnels, and other related issues, making it a powerful tool for geotechnical engineering analysis. PLAXIS provides multiple constitutive models for users to choose from to simulate the stress-strain behavior of soils.
In this study, the Mohr-Coulomb model, which is a built-in model within the PLAXIS software, was selected to simulate soil behavior. The Mohr-Coulomb model is an elastic-perfectly plastic failure model based on elastoplastic theory. It considers factors such as the satisfaction of Hook's Law during the elastic stage, yielding criteria, and the flow rule. The soil parameters required for this model are explained as follows:
- Elastic modulus (Es): In general, the soil can be assigned an elastic modulus of 50% of the ultimate strength, known as the secant modulus (E50).
- Poisson's ratio (ν): In most cases, the value of ν for soils ranges between 0.3 and 0.4.
- Cohesion (c): According to the PLAXIS user manual, a value of c greater than 0.2 kPa can be input for computational convenience [25].
- Internal friction angle (Φ): The internal friction angle of the soil can be determined based on the soil type and shear strength tests conducted in the field or laboratory.
- Dilation angle (ψ): For cohesive soils, the dilation angle can be assumed to be 0. In the case of sandy soils, the angle is very small and sometimes even close to zero or negative (ψ ≒ 0° or ψ < 0°), so it can be assumed as ψ = 0° during the analysis.
By utilizing the Mohr-Coulomb model with the specified soil parameters, the PLAXIS software facilitates the simulation of soil behavior in this study.
3.2. Case Analysis
3.2.1. Case Study 1
- Site Description
The site is located on the south side of Minquan Road, Xindian District, New Taipei City, with an area of approximately 8,522 m2. The site has an irregular shape, and the terrain varies within 1 meter (Geotechnical Engineering Co., Ltd. [26]).
- Subsurface Strata
The subsurface strata at the site can be simplified into five layers from top to bottom, as described by Lin [27] and Geotechnical Engineering Co., Ltd. [28]. The simplified engineering parameters of the strata are shown in Table A1. The groundwater level at the site is approximately 10.7 to 11.3 meters below the ground surface, and the groundwater pressure in the fifth layer of gravel is around 11.4 to 11.6 meters below the ground surface, which is close to the free water level. For analysis purposes, the initial groundwater level is set at 11 meters below the ground surface.
-
Foundation Excavation Planning
- (1)
- Geotechnical Facilities: The foundation excavation has a depth of 17.30 meters and utilizes a raft foundation. The retaining structure consists of a continuous wall with a thickness of 70 centimeters, and the wall depth is 27 meters.
- (2)
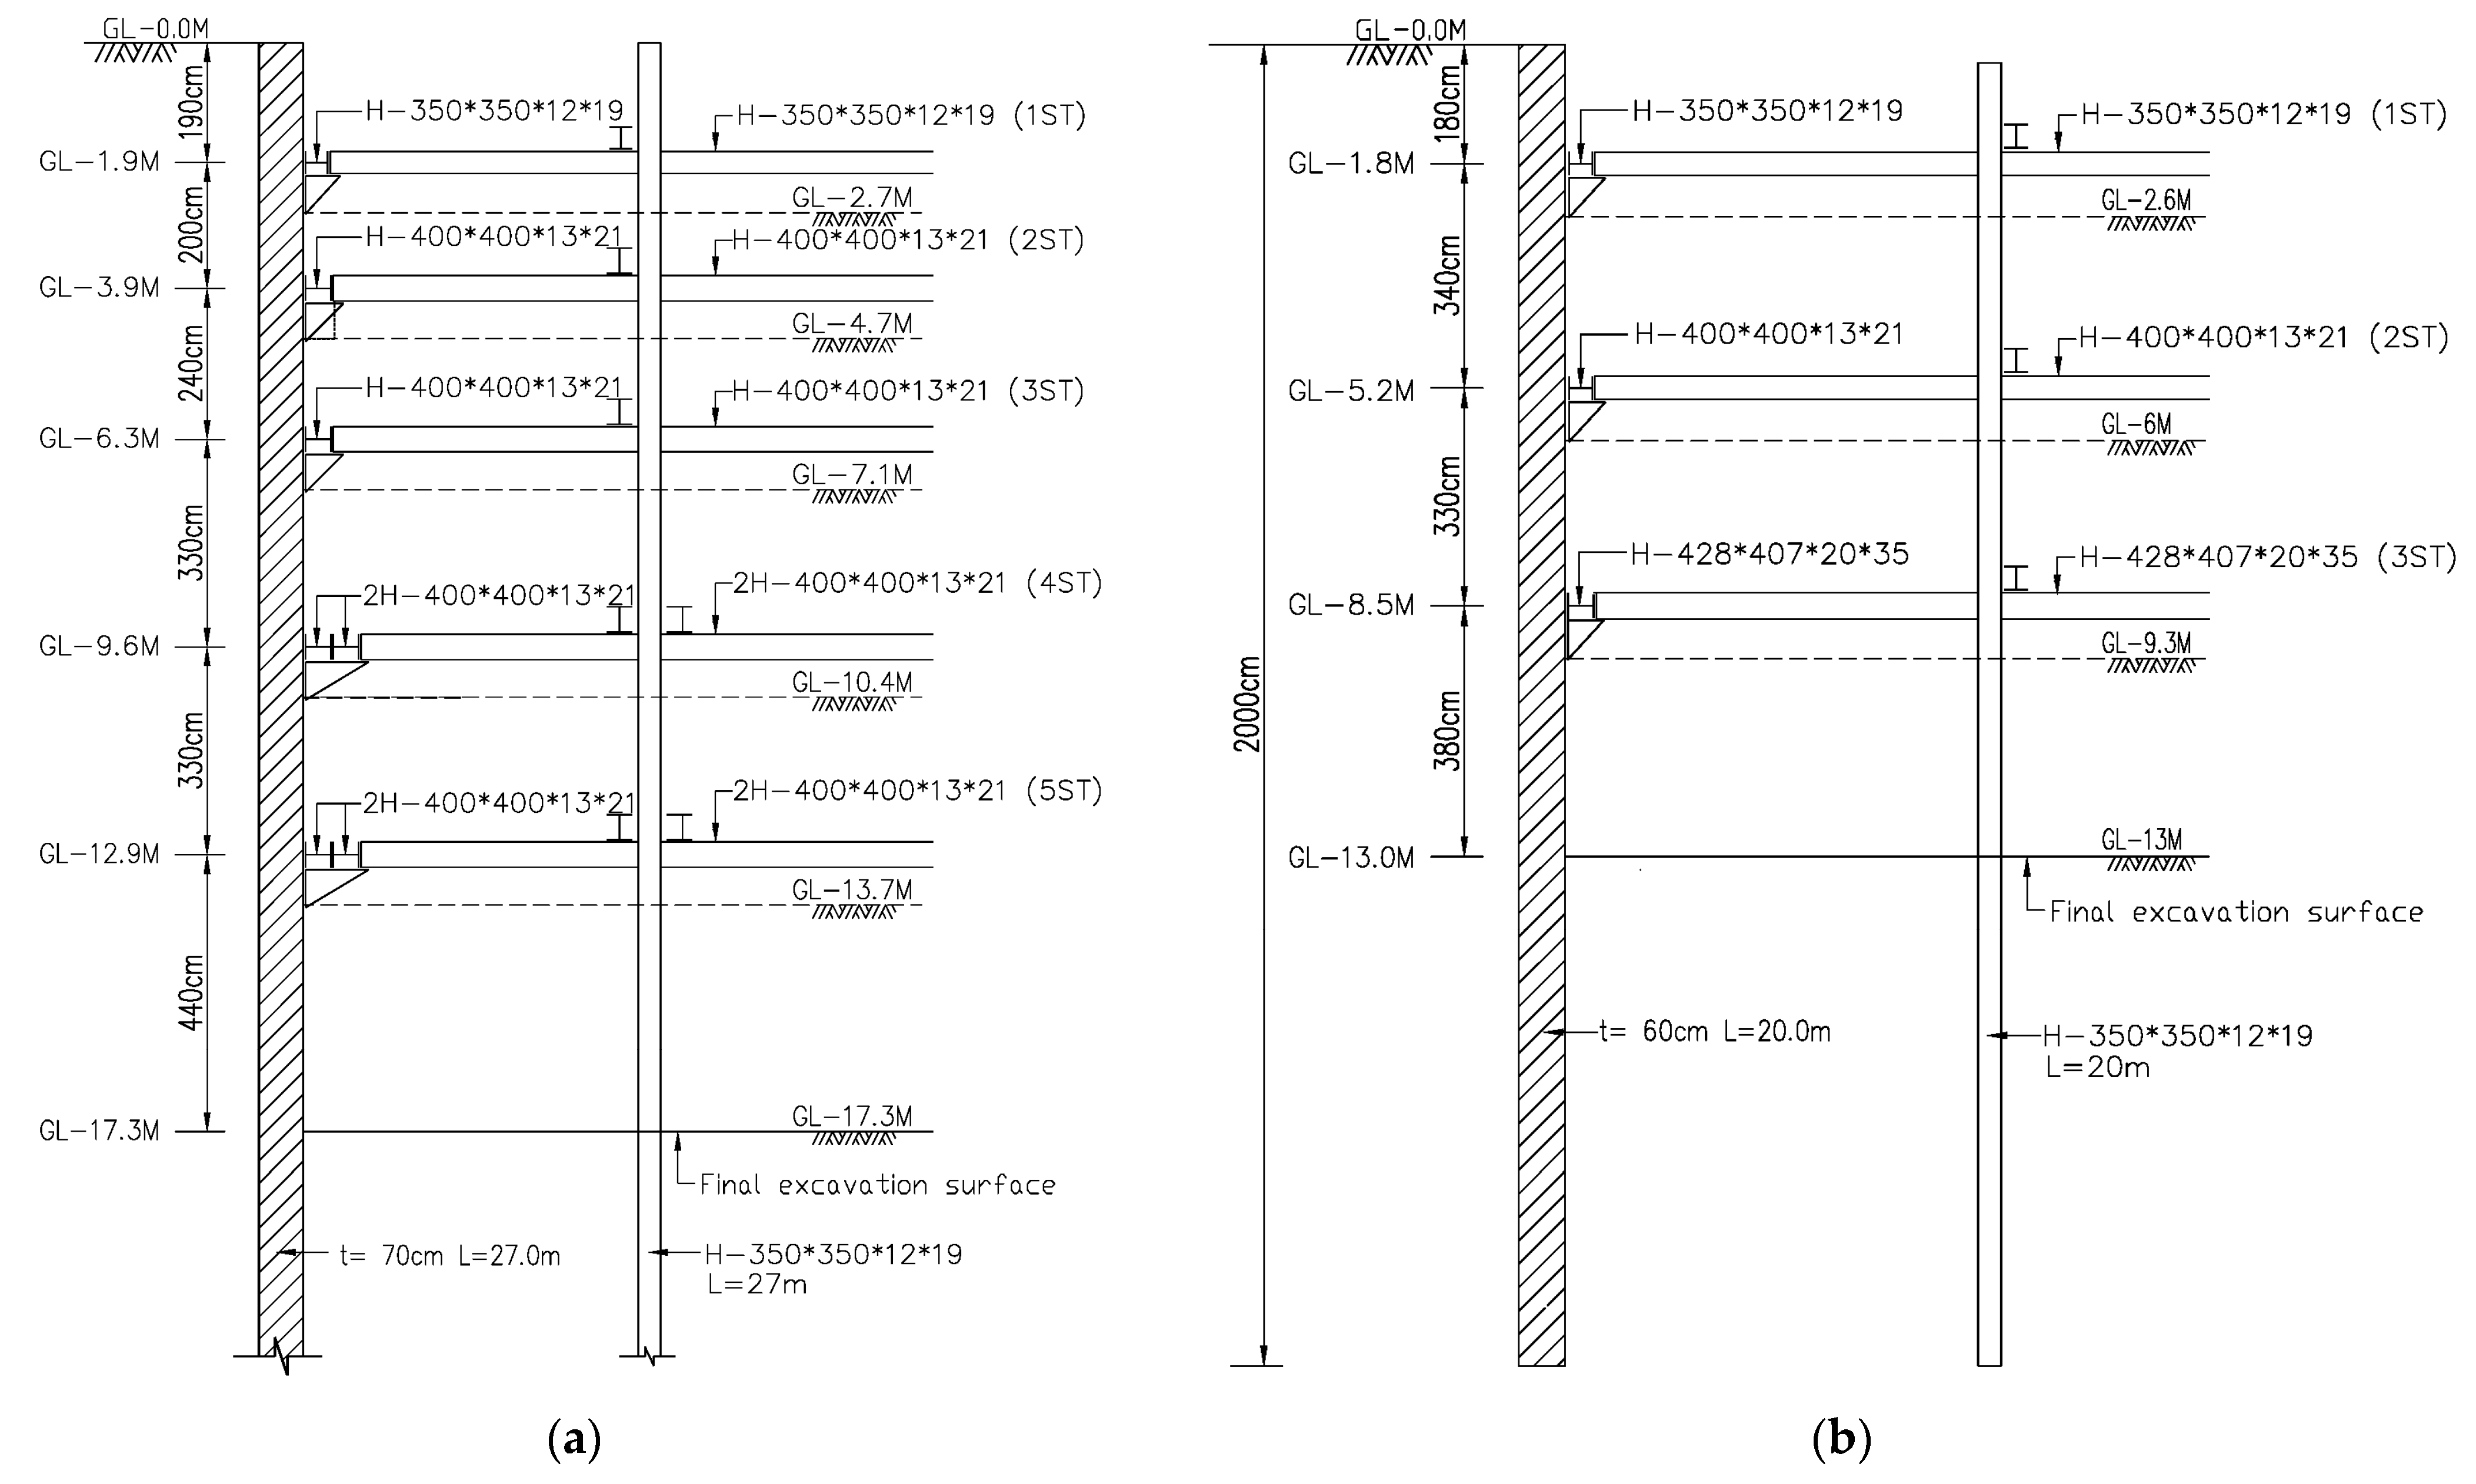
- Internal Bracing System: The excavation follows a top-down sequence with staged excavation and horizontal bracing. The bracing system consists of five levels, using H-beams as support structures. The excavation profile is shown in Figure A1(a).
- (3)
- Excavation Steps: The first stage involves excavation to GL.-2.7 meters, followed by the installation of the first-level bracing. The second stage involves excavation to GL.-4.7 meters and the installation of the second-level bracing. The third stage involves excavation to GL.-7.1 meters and the installation of the third-level bracing. The fourth stage involves excavation to GL.-10.4 meters and the installation of the fourth-level bracing. The fifth stage involves excavation to GL.-13.7 meters and the installation of the fifth-level bracing. Finally, the sixth stage involves excavation to the final excavation bottom at GL.-17.3 meters.
3.2.2. Case Study 2
- Description of the Current Situation
The site is located on the east side of Zhongzheng Road, Xindian District, New Taipei City, adjacent to Minquan Road, with an area of approximately 4,560 m2. It has an irregular shape, and the terrain varies within a range of 1 meter (Geotechnical Engineering Co., Ltd. [29]).
- Subsurface Strata
The subsurface strata at the site can be divided into five layers from top to bottom, as described by Lin [30] and Geotechnical Engineering Co., Ltd. [31]. The simplified engineering parameters of the strata are shown in Table A2. The groundwater investigation data at the site indicates that the groundwater level is typically around GL-11 meters. For analysis purposes, the initial groundwater level is set at 11 meters below the ground surface.
Foundation Excavation Planning
Geotechnical Facilities: The foundation excavation has a depth of 13 meters and utilizes a raft foundation. The retaining structure consists of a continuous wall with a thickness of 60 centimeters, and the wall depth is 20 meters.
Internal Bracing System: The excavation follows a top-down sequence with staged excavation and horizontal bracing. The bracing system consists of three levels, using H-beams as support structures. The excavation profile is shown in Figure A1(b).
Excavation Steps: The first stage involves excavation to GL.-2.6 meters and the installation of the first-level bracing. The second stage involves excavation to GL.-6.0 meters and the installation of the second-level bracing. The third stage involves excavation to GL.-9.3 meters and the installation of the third-level bracing. The fourth stage involves excavation to the final excavation bottom at GL.-13.0 meters. Due to the lower groundwater level in the research case area, the excavation depth mainly consists of the gravel layer, resulting in lower lateral pressures on the retaining wall compared to typical cases.
3.2.3. Assumptions for Analysis
- The excavation process is assumed to exhibit plane strain behavior.
- Referring to the analysis model proposed by Fan, the influence range of the backside of the retaining wall is considered [31]. For the analysis, the range (B) extends at least four times the excavation depth beyond the retaining wall. The vertical range (D) is determined by adding twice the penetration depth (3H1+H2) to the length of the continuous wall, assuming a uniform distributed load of 1.5 t/m2 acting on the ground surface.
- Based on the site conditions, considering the excavation depth, plan shape, support system configuration, and soil layer boundaries, an analysis mesh is established. The boundary elements of the mesh are assumed to have no horizontal or lateral displacements outside the influence range.
- The stiffness of the retaining wall is reduced by 70% based on general empirical values.
- The continuous wall and support elements are simulated using beam elements.
- Analysis is performed using 15-node triangular elements.
- At the bottom of the wall, if there is penetration into rock or gravel layers beyond a certain depth (more than 1.5 meters), based on reference monitoring data from relevant cases, no significant horizontal displacements are observed. Therefore, in the analysis, horizontal displacements are constrained at the bottom of the wall.
3.2.4. Determination of Strata and Structural Parameters
In this study, the elastic modulus (Es) of the gravel layer is considered as a variable, ranging from 7,840 N/m2 to 9,800 N/m2. The remaining soil parameters and set values are presented in Table A1 and Table 1 for Case Study 1, and Table A2 and Table 2 for Case Study 2. The structural elements such as the continuous wall and supports are simulated using beam elements, and the main input data include cross-sectional area (A), Young's modulus (E), moment of inertia (I), etc. The stiffness of the retaining wall is generally reduced by 70%. The basic parameters of the structural elements for Case Study 1 can be found in Table 3 and Table 4, while for Case Study 2, they are presented in Table 5 and Table 6.
3.2.5. Analysis Procedure
Due to the complexity of the actual excavation process on-site, numerical simulations often simplify the actual excavation steps by considering influencing factors such as monitoring data and construction conditions. Prior to excavation simulation, it is commonly assumed that the continuous wall has been constructed, and the effects of the wall construction on the strata are not considered. The groundwater level within the site is lowered to 1.0 meter below the excavation surface during excavation operations. The construction processes for each case study are described as follows:
-
Case Study 1
- (1)
- First-stage excavation to GL.-2.7 meters.
- (2)
- Installation of ST1 at GL.-1.9 meters.
- (3)
- Second-stage excavation to GL.-4.7 meters.
- (4)
- Installation of ST2 at GL.-3.9 meters.
- (5)
- Third-stage excavation to GL.-7.1 meters.
- (6)
- Installation of ST3 at GL.-6.3 meters.
- (7)
- Fourth-stage excavation to GL.-10.4 meters.
- (8)
- Installation of ST4 at GL.-9.6 meters.
- (9)
- Fifth-stage excavation to GL.-13.7 meters.
- (10)
- Installation of ST5 at GL.-12.9 meters.
- (11)
- Sixth-stage excavation to the final excavation bottom at GL.-17.3 meters (analysis mode ends at this point).
-
Case Study 2
- (1)
- First-stage excavation to GL.-2.6 meters.
- (2)
- Installation of ST1 at GL.-1.8 meters.
- (3)
- Second-stage excavation to GL.-6.0 meters.
- (4)
- Installation of ST2 at GL.-5.2 meters.
- (5)
- Third-stage excavation to GL.-9.3 meters.
- (6)
- Installation of ST3 at GL.-8.5 meters.
- (7)
- Fourth-stage excavation to the final excavation bottom at GL.-13.0 meters (analysis and simulation end at this point).
3.2.6. Feedback Analysis
Feedback analysis can generally be categorized into two approaches: inverse approach and direct approach. The inverse approach involves assuming a reasonable soil material composition model and using mathematical methods to express displacements as functions of in-situ stresses and deformations. It then calculates the in-situ stresses and modulus of deformation based on the displacement values. The direct approach involves continuously adjusting input parameters for analysis and comparing the analysis results with measured values until an acceptable range of error is achieved. While the inverse approach is faster in execution, it often requires simplification of materials into homogeneous and elastic conditions, resulting in poor performance for nonlinear materials. On the other hand, the direct approach allows for nonlinear analysis and considers material nonlinearity and elasto-plastic behavior. Therefore, this study adopts the direct approach and utilizes PLAXIS software as the analysis tool to simulate the stress-strain behavior of foundation excavation.
The analysis focuses only on the final excavation stage for simulation and comparison. In both case studies, the second layer of the gravel layer has an N-value greater than 50, so an N-value of 100 is assumed. The analysis is conducted by gradually increasing or decreasing the elastic modulus (Es) of the soil. The analysis results for the final excavation stage using PLAXIS are shown in Figure 2(a) and 2(b) for Case Study 1, and Figure 3(a) and 3(b) for Case Study 2.
3.2.7. Results and Discussion of the Case Studies
Based on the PLAXIS analysis results for the final excavation stage, the actual deformation curve data of the wall is compared to determine if the wall deformation is within a reasonable range of estimation. In this study, a maximum deformation tolerance of ±10% based on actual monitoring data is considered reasonable. The obtained results are shown in Figure 4(a) and 4(b). The following discussion is based on the analysis results:
- Referring to the case studies in this research and numerous monitoring data, it is observed that when the bottom of the wall penetrates into a rock layer or gravel layer at a certain depth (greater than 1.5 meters), there is no horizontal displacement at the bottom of the wall. Therefore, in the analysis, the horizontal displacement at the bottom of the wall is restrained. The analysis results show consistency with the actual monitoring data in terms of the maximum deformation location and the trend of the wall displacement curve, indicating that this basic assumption of the analysis is reasonable.
- The feedback results from both case studies indicate that assuming an N-value of 100 for the second layer of the gravel layer, within a range of soil elastic modulus between 7,840 kN/m2 and 9,800 kN/m2, it is possible to reasonably estimate the maximum deformation and its occurrence location during the final excavation stage, with a tolerance of ±10% based on actual monitoring data.
3.3. Discussion of the Findings
In this study, the PLAXIS 2D analysis program was used for deep excavation parameter feedback analysis, and the results were compared with the actual monitoring data of wall displacement. The analysis results showed a good agreement in terms of the trend of wall displacement and the location of maximum wall displacement, indicating the reasonability of this simulation approach. Based on the research findings, the following conclusions can be drawn:
- According to the feedback analysis results from actual case studies, it is reasonable to estimate the maximum deformation during the final excavation stage by assuming an elastic modulus for the gravel layer in the range of 7,840 kN/m2 to 9,800 kN/m2 in the Xindian area. These findings are generally consistent with the empirical formulas derived from the research results of Kuo et al. and Hou et al. on the gravel layer in Baguashan, where the elastic modulus ranges from 88200 kN/m2 to 833,000 kN/m2 [32,33].
- This study conducted parameter feedback analysis based on actual case studies in the Xindian area. In the future, this research approach can be applied to different regions with gravel layers, providing a broader range of research results for reference in engineering design.
4. SoilWorks Numerical Simulation
The SoilWorks program is a two-dimensional geotechnical engineering analysis and design software developed by MIDAS Corporation in collaboration with scholars and industry professionals in the field of soil and rock. It incorporates MIDAS IT's unique graphical processing, meshing, and numerical analysis techniques, along with the latest analysis and design technologies in areas such as tunnels, slopes, weak ground treatment, foundations, seepage, and dynamic analysis. It has become an essential tool for the academic and professional engineering community. The program consists of seven major analysis modules, including finite element stress-strain, excavation deformation, slope stability, seepage, consolidation, pile, and dynamic modules.
4.1. Analysis Methods and Models
The selection of material constitutive models has a significant impact on the analysis results, such as material behavior, stress, and strain. SoilWorks provides various geotechnical constitutive models for users to choose from in order to simulate the stress-strain behavior of soils.
The Mohr-Coulomb model is commonly used to simulate geotechnical materials. Figure 5(a) shows the idealized elastic-plastic characteristics. Under this assumption, reliable results can be obtained in general geotechnical nonlinear analyses. Therefore, this study also uses the Mohr-Coulomb model for relevant numerical analysis work.
The Mohr-Coulomb yield criterion has two limitations in simulating soil material behavior. The first limitation is the assumption that the second principal stress has no effect on yield, which does not match experimental results. The second limitation is that the meridians of the Mohr circle and the yield envelope are straight lines, and the strength parameters do not vary with confining pressure or pore water pressure (see Figure 5(b)). Therefore, this constitutive model is more accurate when there is minimal variation in confining pressure but loses accuracy when there is significant variation. Additionally, the yield surface has corners, leading to errors in numerical analysis. However, this criterion provides good accuracy under commonly encountered confining pressures and has become the most commonly adopted failure criterion, effectively solving most numerical analysis problems in geotechnical engineering.
The soil material parameters required for the Mohr-Coulomb model include elastic modulus, Poisson's ratio, cohesion, friction angle, dilation angle, bulk modulus, and elastic shear modulus, totaling seven parameters.
4.2. Sensitivity Analysis
4.2.1. Analysis Description
From relevant academic and engineering research literature or analysis reports, it is known that certain key parameters must be appropriately adjusted to obtain reasonable results. The values of the geotechnical parameters and data such as groundwater level and pore pressure used in the analysis can mostly be obtained through field drilling and general physical and mechanical experiments, with relatively small variations. Among the required input values, the effective friction angle and soil elastic modulus are the most crucial parameters in the finite element program. The effective friction angle needs to consider the influence of field sampling operations and excavation disturbance, while the soil elastic modulus has numerous empirical formulas developed over the years, resulting in a larger range of variation.
In this study, sensitivity analyses will be conducted on the effective friction angle of soil strength parameters and the soil elastic modulus of ground reaction parameters. The aim is to qualitatively discuss the results quantitatively and compare them with the analysis results from the PLAXIS program in the previous chapter.
4.2.2. Assumed Cases
To understand the sensitivity of the geological parameters on the displacement, stress, or axial force of the retaining wall in the SoilWorks program, reference will be made to the cases studied by Hsieh et al. [20] and Qiu et al. [22] using the RIDO and PLAXIS programs, respectively. Hypothetical cases representing sand and clay soils will be established for subsequent sensitivity analysis.
-
Basic Case Description for Sandy Soil Layer
- (1)
-
Analysis Assumptions
- The length and width of the excavation area are both 40 meters, with a depth of excavation of 12 meters (H1) and a depth of wall penetration of 10 meters (H2). The total length of the continuous wall is 22 meters.
- The analysis model adopts a symmetric single-side mode, with a horizontal analysis length (B) of half the original excavation length, which is 20 meters. Considering the influence range of the backside of the retaining wall, a distance of at least 4 times the excavation depth (R = 12 × 4 = 48 meters) is considered. The vertical range (D) is taken as the length of the continuous wall (H1 + H2) plus twice the penetration depth (H2), assuming a uniformly distributed load of 10 kN/m2 acting on the ground surface. The detailed model diagram for the simulated case analysis is shown in Figure 6.
- Considering the excavation depth, support system configuration, and soil layer boundaries, a complete analysis mesh is established. The boundary elements of the mesh are assumed to have no horizontal or lateral displacements outside the influence range.
- The retaining wall is simulated using beam elements, with a stiffness reduced by 70% based on general empirical values. The input parameters used in the analysis are detailed in Table A3.
- The support system is simulated using truss elements, with a stiffness reduced by 50% based on general empirical values. The input parameters used in the analysis are detailed in Table A4.
- Analysis is conducted using 15-node triangular elements.
- (2)
- Geology and Groundwater
The sandy soil layer is divided into layers with a thickness of 10 meters each. There are a total of 5 layers, and the soil parameters for each layer are detailed in Table A5. The initial groundwater level is assumed to be 1 meter below the ground surface.
-
Basic Case Description for Clay Soil Layer
- (1)
-
Analysis Assumptions
- The length and width of the excavation area are both 40 meters, with a depth of excavation of 12 meters (H1) and a depth of wall penetration of 12 meters (H2). The total length of the continuous wall is 24 meters.
- The analysis model adopts a symmetric single-side mode, with a horizontal analysis length (B) of half the original excavation length, which is 20 meters. Considering the influence range of the backside of the retaining wall, a distance of at least 4 times the excavation depth (R = 12 × 4 = 48 meters) is considered. The vertical range (D) is taken as the length of the continuous wall (H1 + H2) plus twice the penetration depth (H2), assuming a uniformly distributed load of 10 kN/m2 acting on the ground surface. The detailed model diagram for the simulated case analysis is shown in Figure 7.
- Considering the excavation depth, support system configuration, and soil layer boundaries, a complete analysis mesh is established. The boundary elements of the mesh are assumed to have no horizontal or lateral displacements outside the influence range.
- The retaining wall is simulated using beam elements, and the input parameters used in the analysis are detailed in Table A3.
- The support system is simulated using truss elements, and the input parameters used in the analysis are detailed in Table A4.
- Analysis is conducted using 15-node triangular elements.
- (2)
- Geology and Groundwater
The clay soil layer is divided into layers with a thickness of 10 meters each. There are a total of 5 layers, and the soil parameters for each layer are detailed in Table A6. The initial groundwater level is assumed to be 1 meter below the ground surface. For the analysis of the clay soil layer, drainage and undrained conditions will be considered based on the cases presented by Qiu et al. [22].
4.2.3. Parameter Range
Based on previous studies, the ranges of the effective friction angle and soil elastic modulus are as follows:
- Friction Angle (Φ)
For the analysis of sandy soils, the effective stress analysis (C = 0) is commonly used. In this study, the simulated analysis will consider the variation of the friction angle by 80%, 90%, 100%, 110%, and 120% of the original assumed friction angle. These values are based on the research methods of Zhang et al. [21] and Qiu et al. [22].
- Soil Elastic Modulus (Es)
From the literature in the previous section, it is known that there are numerous empirical formulas for soil elastic modulus, and the difference between the maximum and minimum values can be several times. In this simulation, the analysis will consider the variation of the soil elastic modulus by 50%, 75%, 100%, 150%, and 200% of the original assumed soil elastic modulus. These values are based on the research methods of Zhang et al. [21] and Qiu et al. [22].
4.2.4. Analysis Results
- Sensitivity Analysis of Friction Angle
Integrate the results for different assumed geological conditions, including sandy soil and clay (drained and undrained) soil, and conduct an integrated analysis. The maximum bending moment (Mmax), maximum displacement (Dmax), and average axial force (Favg) corresponding to the assumed friction angles of 80%, 90%, 100%, 110%, and 120% will be compared with the maximum bending moment, maximum displacement, and average axial force at the original friction angle (100%). The percentage change in the maximum bending moment, maximum displacement, and average axial force due to the variation in friction angle will be calculated. The sensitivity of the friction angle (Φ) on these three parameters (Mmax, Dmax, Favg) will be discussed. The analysis results from Qiu et al.'s [22] PLAXIS program will also be considered.
- (1)
- Sandy Soil Layer
From the summarized analysis results in Table 7, it can be observed that when the friction angle varies from 80% to 120% of the baseline value (100%), the range of variation in the maximum wall moment (Mmax) is 282.78 to 392.24 kN-m, with a percentage change of 88% to 121%. The range of variation in the maximum displacement (Dmax) is 29.664 to 40.840 mm, with a percentage change of 90% to 124%. The range of variation in the average axial force (Favg) is 223.3 to 278.8 kN/m, with a percentage change of 91% to 114%.
Line graphs depicting the percentage change in the three parameters (Mmax, Dmax, Favg) with respect to different friction angles (Φ) will be plotted. From Figure 8(a), it can be observed that the friction angle has a significant sensitivity to Dmax, with an increase of 24% when Φ is decreased by 20%. When Φ is increased by 20%, Mmax, Dmax, and Favg decrease by approximately 10%. The results indicate that a smaller friction angle has a more significant effect on Dmax, while higher friction angles have similar influences on Mmax, Dmax, and Favg.
Additionally, the sensitivity analysis results for the friction angle in sandy soils from Qiu et al.'s [22] PLAXIS program will be compared and discussed with the SoilWorks program. From Table 8 and Figure 8(b) to Figure 9(a) and 9(b), it can be observed that when the friction angle is smaller, the variation in PLAXIS results is more significant compared to the SoilWorks program. This indicates that PLAXIS is more sensitive to the friction angle than the SoilWorks program.
- (2)
- Clay Layer (Undrained Condition)
From the summarized analysis results in Table 9, it can be observed that when the friction angle varies from 80% to 120% of the baseline value (100%) in the undrained condition, the range of variation in the maximum wall moment (Mmax) is 243.96 to 267.27 kN-m, with a percentage change of 97% to 106%. The range of variation in the maximum displacement (Dmax) is 46.110 to 48.232 mm, with a percentage change of 98% to 103%. The range of variation in the average axial force (Favg) is 232.5 to 252.5 kN/m, with a percentage change of 96% to 105%.
Line graphs depicting the percentage change in the three parameters (Mmax, Dmax, Favg) with respect to different friction angles (Φ) will be plotted. From Figure 10(a), it can be observed that the sensitivity of the friction angle (Φ) on the clay layer (undrained condition) is relatively small, with changes of approximately 6% in Mmax, Dmax, and Favg when Φ is decreased or increased. The results indicate that the clay layer (undrained condition) is not particularly sensitive to the variation in friction angle.
Additionally, the sensitivity analysis results for the friction angle in the clay layer (undrained condition) from Qiu et al.'s [22] PLAXIS program will be compared and discussed with the SoilWorks program. From Table 10 and Figure 10(b) to Figure 11(a) and (b), it can be observed that when the friction angle is increased, both programs show only a slight variation. When the friction angle is smaller, especially in terms of Mmax or Dmax, the variation in the PLAXIS program is more significant compared to the SoilWorks program, indicating that PLAXIS is more sensitive to the friction angle in the clay layer (undrained condition) when the friction angle is smaller.
- Sensitivity Analysis of Soil Elastic Modulus
Integrate the results for different assumed geological conditions, including sandy soil and clay (drained and undrained) soil, and conduct an integrated analysis. The maximum bending moment (Mmax), maximum displacement (Dmax), and average axial force (Favg) corresponding to the assumed soil elastic moduli of 50%, 75%, 100%, 150%, and 200% will be compared with the maximum bending moment, maximum displacement, and average axial force at the original soil elastic modulus (100%). The percentage change in the maximum bending moment, maximum displacement, and average axial force due to the variation in soil elastic modulus will be calculated. The sensitivity of the soil elastic modulus (E) on these three parameters (Mmax, Dmax, Favg) will be discussed. The analysis results from Qiu et al.'s [22] PLAXIS program will also be considered.
- (1)
- Sandy Soil
From the summarized analysis results in Table A7, it can be observed that when the soil elastic modulus varies from 50% to 200% of the baseline value (100%) in sandy soil, the range of variation in the maximum bending moment (Mmax) is 280.69 to 371.32 kN-m, with a percentage change of 87% to 115%. The range of variation in the maximum displacement (Dmax) is 23.941 to 48.483 mm, with a percentage change of 73% to 147%. The range of variation in the average axial force (Favg) is 246.1 to 251.7 kN/m, with a percentage change of 100% to 103%.
Line graphs depicting the percentage change in the three parameters (Mmax, Dmax, Favg) with respect to different soil elastic moduli will be plotted. From Figure 12(a), it can be observed that the sensitivity of the soil elastic modulus (Es) in sandy soil is more significant for Mmax and Dmax, with Dmax showing the maximum increase of 47% when E is decreased by 50% and the maximum decrease of approximately 27% when E is increased by 200%. The results indicate that the variation in Mmax and Dmax is more pronounced when the soil elastic modulus is higher or lower, while the effect on Favg is relatively small.
Additionally, the sensitivity analysis results for the soil elastic modulus in sandy soil from Qiu et al.'s [22] PLAXIS program will be compared and discussed with the SoilWorks program. From Table A8 and Figure 12(b) to Figure 13(a) and 13(b), it can be observed that PLAXIS is more sensitive to variations in Dmax than the SoilWorks program when the soil elastic modulus in sandy soil is smaller.
- (2)
- Clay Layer (Undrained Condition)
From the summarized analysis results in Table A9, it can be observed that when the soil elastic modulus varies from 50% to 200% of the baseline value (100%) in the undrained condition of the clay layer, the range of variation in the maximum bending moment (Mmax) is 205.65 to 327.72 kN-m, with a percentage change of 82% to 130%. The range of variation in the maximum displacement (Dmax) is 28.341 to 81.231 mm, with a percentage change of 60% to 173%. The range of variation in the average axial force (Favg) is 231.2 to 257.0 kN/m, with a percentage change of 96% to 106%.
Line graphs depicting the percentage change in the three parameters (Mmax, Dmax, Favg) with respect to different soil elastic moduli will be plotted. From Figure 14(a), it can be observed that the sensitivity of the soil elastic modulus (Es) in the undrained condition of the clay layer is more significant for Dmax, with Dmax showing the maximum increase of 73% when Es is decreased by 50% and the maximum decrease of approximately 40% when Es is increased by 200%. The results indicate that the variation in Dmax is more pronounced when the soil elastic modulus is higher or lower, while the effect on Favg is relatively small.
Additionally, the sensitivity analysis results for the soil elastic modulus in the undrained condition of the clay layer from Qiu et al.'s [22] PLAXIS program will be compared and discussed with the SoilWorks program. From Table A10 and Figure 14(b) to Figure 15(a) and (b), it can be observed that both programs show similar sensitivity to variations in Mmax, Dmax, and Favg when the soil elastic modulus in the undrained condition of the clay layer is considered, with Dmax exhibiting the most significant sensitivity.
- (3)
- Clay Layer (Drained Condition)
From the summarized analysis results in Table A11, it can be observed that when the soil elastic modulus varies from 50% to 200% of the baseline value (100%) in the drained condition of the clay layer, the range of variation in the maximum bending moment (Mmax) is 327.66 to 439.21 kN-m, with a percentage change of 87% to 116%. The range of variation in the maximum displacement (Dmax) is 32.639 to 71.259 mm, with a percentage change of 70% to 152%. The range of variation in the average axial force (Favg) is 253.6 to 260.5 kN/m, with a percentage change of 99% to 102%.
Line graphs depicting the percentage change in the three parameters (Mmax, Dmax, Favg) with respect to different soil elastic moduli will be plotted. From Figure 16(a), it can be observed that the sensitivity of the soil elastic modulus (Es) in the drained condition of the clay layer is more significant for Dmax, with Dmax showing the maximum increase of 52% when Es is decreased by 50% and the maximum decrease of approximately 30% when Es is increased by 200%. The results indicate that the variation in Dmax is more pronounced when the soil elastic modulus is higher or lower, while the effect on Favg is relatively small.
Additionally, the sensitivity analysis results for the soil elastic modulus in the drained condition of the clay layer from Qiu et al.'s [22] PLAXIS program will be compared and discussed with the SoilWorks program. From Table A12 and Figure 16(b) to Figure 17(a) and (b), it can be observed that both programs show similar sensitivity to variations in Mmax, Dmax, and Favg when the soil elastic modulus in the drained condition of the clay layer is considered, with Dmax exhibiting the most significant sensitivity.
4.3. Case Study
In this study, a feedback analysis will be conducted using one case, which follows the excavation and support method of six excavations with five-layer supports. The case is based on the PLAXIS analysis case one presented in Chapter 4. The geological input parameters used in the SoilWorks program for this case are shown in Table 11. The input parameters for the retaining wall and support system can be found in Table 3 and Table 4, respectively. The analysis process is described in section 4.3.1. The analysis model is illustrated in Figure 18.
To verify the suitability of the range of elastic modulus values used for the gravel layer in the program based on the feedback from case one, an additional case (case three) is introduced for validation.
4.3.1. Description and Input Parameter Selection for Case Three
- Site Description
The site is located at the intersection of Beixin Road Section 3 and Fuxing Road in Xindian District, New Taipei City. It has an irregular shape with an area of approximately 9,533 m2 and a height difference of less than 1 m (Chung-Lien Engineering Consultant Corporation [34]).
- Subsurface Strata
The subsurface conditions at the site can be divided into four layers from top to bottom (Chung-Lien Engineering Consultant Corporation [34]). A brief description of the general characteristics of each layer is provided, and the simplified engineering parameters for the subsurface layers are shown in Table A13. The groundwater investigation data for the site indicates that the groundwater level is generally around GL-11 m. For the analysis, the initial groundwater level is set at 11 m below the ground surface.
- (1)
- Fill Layer: Consists of yellow-brown sandy clay, silty clay, and silty clay with mud. The thickness is approximately 4.3 m, and the N-values range from 1 to 19.
- (2)
- Gravel Layer: Contains egg-sized gravel interbedded with yellow-brown silty clay. The thickness is approximately 11 m, and the N-values range from 15 to above 50.
- (3)
- Gray Sandy Clay Layer: Consists of gray sandy clay, silty clay, and sandy clay. The thickness is 9.6 m, and the N-values range from 7 to 50 (increasing to 50 when encountering gravel).
- (4)
- Gravel Layer: Contains egg-sized gravel interbedded with yellow-brown silty sand. The thickness is greater than 8.8 m, and the N-values are all above 50.
- •
- Foundation Excavation Plan
- (1)
- Geotechnical Facilities: The excavation depth is 14.6 m, and the foundation type is raft foundation. The retaining structure consists of 80 cm thick continuous walls, with a depth of 23.5 m.
- (2)
- Support System: The inverted construction method is adopted for the site, which involves staged excavation and construction of underground floor slabs. The 1F, B2FL, and B3FL are used as support structures during the excavation process.
- (3)
- Excavation Steps: The excavation is carried out in four stages. In the first stage, the excavation is lowered to GL.-2.5 m to construct the 1F floor slab. In the second stage, the excavation is lowered to GL.-8.0 m to construct the B2F floor slab (GL.-7.025 m). In the third stage, the excavation is lowered to GL.-11.2 m to construct the B3F floor slab (GL.-10.225 m). Finally, in the fourth stage, the excavation is lowered to the final excavation bottom at GL.-14.6 m.
- •
- Determination of Soil and Structural Parameters
Based on the recommended engineering parameters listed in Table A13, the soil input parameters used in the program are shown in Table 12. The retaining walls and floor slabs are simulated using beam elements. The main input data include cross-sectional area (A), Young's modulus (E), and moment of inertia (I). The stiffness of the retaining wall is generally reduced by 70% based on empirical experience, while the stiffness of the floor slab is reduced by 25%. The input parameters for the structural elements are shown in Table 13 and Table 14.
- Basic Assumptions
- (1)
- The excavation process is assumed to exhibit plane strain behavior.
- (2)
- Considering the influence range behind the retaining wall, the analysis range (B) extends at least 4 times the excavation depth beyond the retaining wall. The vertical range (D) is obtained by adding twice the penetration depth (3H1+H2) to the length of the retaining wall. A uniform distributed load of 15 kN/m2 is assumed to act on the ground surface.
- (3)
- Based on the site conditions, including the excavation depth, shape, support system configuration, and soil layer boundaries, a mesh is created for the analysis. The boundary elements of the mesh are assumed to have no horizontal or lateral displacements outside the influence range.
- (4)
- The stiffness of the retaining wall is reduced by 70% based on empirical experience, while the stiffness of the floor slab is reduced by 25%.
- (5)
- The retaining walls and floor slabs are simulated using beam elements.
- (6)
- The analysis is conducted using 15-Node triangular elements.
- (7)
- Based on the observation of previous cases, when the bottom of the retaining wall penetrates the gravel layer to a certain depth (more than 1.5 m below the bottom), no significant horizontal displacements are observed. Therefore, in the analysis, horizontal displacements at the bottom of the retaining wall are restricted.
- Analysis Procedure
Considering the monitoring data and construction conditions at the site, the actual excavation steps are simplified for the analysis. Since the B1F floor slab is constructed during the third excavation, its influence on the retaining wall is not considered in the analysis. The groundwater level inside the site is maintained at a depth of 1.0 m below the excavation surface during the excavation process. The construction process for case three is described as follows. The analysis model is shown in Figure 19.
- (1)
- Perform the first-stage excavation to GL.-2.5 m.
- (2)
- Construct the 1FL at GL.-0.0 m.
- (3)
- Perform the second-stage excavation to GL.-8.0 m.
- (4)
- Construct the B2FL at GL.-7.025 m.
- (5)
- Perform the third-stage excavation to GL.-11.2 m.
- (6)
- Construct the B3FL at GL.-10.225 m.
- (7)
- Perform the fourth-stage excavation to GL.-14.6 m (reaching the bottom of the excavation, analysis simulation ends at this point).
4.3.2. Feedback Analysis
In this study, a direct method using the SoilWorks software is employed to simulate the stress-strain behavior of the foundation excavation. The analysis is conducted only for the final excavation stage and compared with the results of case one. Since the N-values for the second layer (gravel layer) in both cases exceed 50, an N-value of 100 is assumed for the analysis. The analysis is performed by varying the soil elastic modulus values incrementally. The analysis results for the final excavation stage in case one and case three using SoilWorks are shown in Figure 20 and Figure 21, respectively.
4.4. Discussion of Results
The analysis of the final excavation stage in SoilWorks, combined with the actual deformation curve data of the wall, was compared to determine if the wall deformation curve falls within a reasonable estimated range. In this study, the maximum deformation range of ±10% based on actual monitoring data was considered reasonable for both case studies. The results obtained are shown in Figure 22(a) and 22(b) The following discussion is based on the analysis results:
- Sensitivity analysis of effective friction angle in SoilWorks was conducted. The results indicate that Mmax and Dmax are more sensitive to a smaller friction angle in the sandy and clayey (drained) layers. However, in the clayey (undrained) layer, the sensitivity to the friction angle is lower. Furthermore, comparing the sensitivity analysis results with PLAXIS, it was found that SoilWorks generally exhibits lower sensitivity.
- Sensitivity analysis of soil elastic modulus in SoilWorks was conducted. The results show that both in the sandy and clayey (drained and undrained) layers, the elastic modulus values of the soil have a greater influence on Mmax and Dmax. Comparing the sensitivity analysis results with PLAXIS, it was found that SoilWorks exhibits lower sensitivity than PLAXIS for Dmax, while the sensitivities of Mmax and Favg are comparable between the two.
- From the sensitivity analysis, it can be concluded that the friction angle and soil elastic modulus are two parameters that have a relatively high sensitivity on the displacement of the retaining wall.
- Consistent with the previous PLAXIS analysis, when the bottom of the wall reaches a certain depth into rock or gravel layers (more than 1.5m), there is no horizontal displacement observed at the bottom of the wall. Therefore, in the analysis, horizontal displacement at the bottom of the wall was restrained. The analysis results demonstrate consistency with the actual monitoring data in terms of the maximum deformation location and the trend of the wall displacement curve, indicating that this basic assumption in the analysis is reasonable.
- Feedback analysis was conducted using Case 1, followed by validation using Case 3. The results indicate that under the assumption of N=100 for the second layer of gravel, within the soil elastic modulus range of 2450N~3430N (kN/m2), reasonable estimation of the maximum deformation and its occurrence location during the final excavation stage can be achieved under the conditions of gravel layers in the Xindian area.
5. Conclusions
Based on the research process and findings presented above, the conclusions can be summarized as follows:
- Sensitivity Analysis of Effective Friction Angle in SoilWorks: The results indicate that the maximum bending moment and maximum displacement are more sensitive to a decrease in the effective friction angle in both the sand layer and the clay layer (drained conditions) when the friction angle is relatively small. However, in the clay layer under undrained conditions, the sensitivity to the effective friction angle is lower. Furthermore, comparing the sensitivity analysis results with PLAXIS, it is observed that SoilWorks exhibits lower sensitivity overall.
- Sensitivity Analysis of Soil Elastic Modulus in SoilWorks: The results show that the maximum bending moment and maximum displacement are more sensitive to changes in soil elastic modulus values, regardless of whether it is in the sand layer or the clay layer (drained and undrained conditions). Comparing the sensitivity analysis results with PLAXIS, it is observed that SoilWorks has lower sensitivity to maximum displacement but similar sensitivity to maximum bending moment and average axial force.
- This study conducted parameter feedback analysis for deep excavation using two-dimensional PLAXIS and SoilWorks analysis programs. Based on the feedback analysis results from various practical cases, it is found that for the gravel layer in Xindian area, the soil elastic modulus values of 7,840 N/m² to 9,800 N/m² in PLAXIS and 2,450 N/m² to 3,430 N/m² in SoilWorks can reasonably estimate the maximum deformation in the final excavation stage.
In conclusion, it is recommended that engineers refer to the provided ranges when selecting soil elastic modulus for excavation analysis in gravel layers in the Xindian area of Taiwan. This will help improve the accuracy of deformation predictions during the final excavation stage. These findings serve as crucial references for engineers and contribute to the effective prediction and management of excavation behavior in civil engineering projects.
Supplementary Materials
The following supporting information can be downloaded at the website of this paper posted on Preprints.org.
Author Contributions
methodology, C-Y.W. and C-F.H.; formal analysis, C-Y.W.; investigation, C-Y.W.; writing-original draft preparation, C-Y.W. and C-F.H.; writing-review and editing, C-F.H. All authors have read and agreed to the published version of the manuscript.
Funding
Not applicable.
Institutional Review Board Statement
Not applicable.
Informed Consent Statement
Not applicable.
Data Availability Statement
The data used in this article is not public.
Conflicts of Interest
The authors declare no conflict of interest
Appendix A

Table A1.
Suggested table of simplified formation engineering parameters in Case 1.
| Strata Description | N | γt | Total Stress Effective Stress |
Total Stress Effective Stress |
||
|---|---|---|---|---|---|---|
| Φ | Φ′ | |||||
| The Average Thickness of Each Layer | Value | kN/m3 | kN/m2 | ˚ | kN/m2 | ˚ |
|
1.5~19 (5) |
19.3 | * 9.8 |
* 21 |
0 | 30 |
| Average thickness 4.0 m | ||||||
|
15~>50 (40) |
21.6 | - | - | * 4.9 |
* 38 |
| Average thickness 11.7 m | ||||||
|
20~58 (35) |
21.1 | - | - | * 0 |
* 38 |
| Average thickness 4.6 m | ||||||
|
12~26 (16) |
19.4 | 9.8 | 24 | 0 | 32 |
| Average thickness 0.5 m | ||||||
|
>50 (100) |
* 22.1 |
- | - | * 9.8 |
* 40 |
| Average thickness 10.0 m (hole bottom) | ||||||
Note: 1. “*” indicates estimated values, and “( )” indicates suggested N values. 2. Extracted from the “Geological Survey and Analysis Report of Land Parcels 34 and 110, Dafeng Section, Xindian City, Taipei County” by Chunlian Engineering [28].
Table A2.
Suggested table of simplified formation engineering parameters in Case 2.
| Strata Description | N | γt | Total Stress Effective Stress | Total stress Effective Stress | ||
|---|---|---|---|---|---|---|
| Φ | Φ’ | |||||
| The Average Thickness of Each Layer |
Value | kN/m3 | kN/m2 | ˚ | kN/m2 | ˚ |
|
5~17 (7) |
19.4 | 9.8 | 22 | * 0 |
* 30 |
| Average thickness 3.7 m | ||||||
|
22~>50 (40) |
21.9 | - | - | * 4.9 |
* 38 |
| Average thickness 12.4 m | ||||||
|
16~31 (23) |
21.1 | - | - | * 0 |
* 34 |
| Average thickness 3.4 m | ||||||
|
11~20 (13) |
19.5 | 9.8 | 24 | 0 | 31 |
| Average thickness 4.9 m | ||||||
|
>50 (100) |
* 22.1 |
- | - | * 9.8 |
* 40 |
| Average thickness 11.1 m (hole bottom) | ||||||
Note: 1. “*” indicates estimated values, and “( )” indicates suggested N values. 2. Extracted from the “Geological Survey and Analysis Report of Land Parcels 62-1 and Other Seven Parcels, Dafeng Section, Xindian City, Taipei County” by Kenkul Engineering [30].
Table A3.
Input parameters for diaphragm wall strength.
| Thickness(m) | E (kN/m2) | I (m4/m) | Reduction Factor | 0.7EA (kN/m) | 0.7EI (kNm2/m) |
|---|---|---|---|---|---|
| 0.6 | 2.17 × 10⁷ | 0.018 | 0.7 | 9.13 × 10⁶ | 2.739 × 10⁵ |
Note: , .
Table A4.
Input parameters for bracing.
| Number of Supporting Layers | Supporting Position | Model | A (cm2) | 0.5EA (kN) | Preload (kN/m) |
|---|---|---|---|---|---|
| 1ST | GL.−1.5 m | 1 × H 350 | 173.9 | 1.826 × 10⁶ | 125 |
| 2ST | GL.−4.5 m | 2 × H 350 | 347.7 | 3.651 × 10⁶ | 200 |
| 3ST | GL.−8.0 m | 2 × H 400 | 437.4 | 4.592 × 10⁶ | 300 |
Table A5.
Input parameters for soil parameters of sandy layers.
| Depth (m) | Soil Classification | (kN/m2) | Φ’(o) | γunsat(kN/m3) | γsat(kN/m3) | Es (kN/m2) | υ |
|---|---|---|---|---|---|---|---|
| 10 | SM | 1 | 30 | 20 | 21 | 12,500 | 0.32 |
| 20 | SM | 1 | 30 | 20 | 21 | 37,500 | 0.32 |
| 30 | SM | 1 | 30 | 20 | 21 | 62,500 | 0.32 |
| 40 | SM | 1 | 30 | 20 | 21 | 87,500 | 0.32 |
| 42 | SM | 1 | 30 | 20 | 21 | 812,500 | 0.32 |
Table A6.
Input parameters for soil parameters of clay layers.
| Depth (m) | Soil Classification | (kN/m2) | Φ’(o) | γunsat(kN/m3) | γsat(kN/m3) | Es(kN/m2) | υ |
|---|---|---|---|---|---|---|---|
| 10 | CL | 5 | 20 | 19 | 18 | 10,000 | 0.35 |
| 20 | CL | 5 | 23 | 19 | 18 | 18,750 | 0.35 |
| 30 | CL | 5 | 25 | 19 | 18 | 31,250 | 0.35 |
| 40 | CL | 5 | 28 | 19 | 18 | 43,750 | 0.35 |
| 42 | CL | 5 | 30 | 19 | 18 | 56,250 | 0.35 |
Table A7.
Sensitivity analysis results of elastic modulus for sandy layers.
| SM | Mmax | Percentage Change | Dmax | Percentage Change | Favg | Percentage Change |
|---|---|---|---|---|---|---|
| (kN-m) | (%) | (mm) | (%) | (kN/m) | (%) | |
| 0.5E | 371.32 | 115% | 48.483 | 147% | 246.1 | 100% |
| 0.75E | 342.43 | 106% | 38.368 | 117% | 244.9 | 100% |
| 1.0E | 323.07 | 100% | 32.872 | 100% | 245.4 | 100% |
| 1.5E | 297.63 | 92% | 27.075 | 82% | 248.2 | 101% |
| 2.0E | 280.69 | 87% | 23.941 | 73% | 251.7 | 103% |
Table A8.
Sensitivity of elastic modulus for sandy layers in PLAXIS and SoilWorks.
| SM |
Mmax Percentage Change |
Dmax Percentage Change |
Favg Percentage Change |
|||
|---|---|---|---|---|---|---|
| Siolworks | PLAXIS | Siolworks | PLAXIS | Siolworks | PLAXIS | |
| 0.5E | 115% | 123% | 147% | 176% | 100% | 103% |
| 0.75E | 106% | 108% | 117% | 125% | 100% | 101% |
| 1.0E | 100% | 100% | 100% | 100% | 100% | 100% |
| 1.5E | 92% | 90% | 82% | 73% | 101% | 99% |
| 2.0E | 87% | 83% | 73% | 59% | 103% | 98% |
Table A9.
Sensitivity analysis results of elastic modulus for clay layers (undrained).
| CL (Undrained) | Mmax | Percentage Change | Dmax | Percentage Change | Favg | Percentage Change |
|---|---|---|---|---|---|---|
| (kN-m) | (%) | (mm) | (%) | (kN/m) | (%) | |
| 0.5E | 327.72 | 130% | 81.231 | 173% | 257.0 | 106% |
| 0.75E | 279.50 | 111% | 58.627 | 125% | 247.5 | 103% |
| 1.0E | 251.72 | 100% | 46.867 | 100% | 241.4 | 100% |
| 1.5E | 221.83 | 88% | 34.688 | 74% | 234.4 | 97% |
| 2.0E | 205.65 | 82% | 28.341 | 60% | 231.2 | 96% |
Table A10.
Sensitivity of elastic modulus for clay layers (undrained) in PLAXIS and SoilWorks.
| CL (Undrained) |
Mmax Percentage Change |
Dmax Percentage Change |
Favg Percentage Change |
|||
|---|---|---|---|---|---|---|
| Siolworks | PLAXIS | Siolworks | PLAXIS | Siolworks | PLAXIS | |
| 0.5E | 130% | 135% | 173% | 185% | 106% | 106% |
| 0.75E | 111% | 113% | 125% | 129% | 103% | 102% |
| 1.0E | 100% | 100% | 100% | 100% | 100% | 100% |
| 1.5E | 88% | 85% | 74% | 70% | 97% | 98% |
| 2.0E | 82% | 76% | 60% | 55% | 96% | 96% |
Table A11.
Sensitivity analysis results of elastic modulus for clay layers (drained).
| CL (Drained) | Mmax | Percentage Change | Dmax | Percentage Change | Favg | Percentage Change |
|---|---|---|---|---|---|---|
| (kN-m) | (%) | (mm) | (%) | (kN/m) | (%) | |
| 0.5E | 439.21 | 116% | 71.259 | 152% | 260.5 | 102% |
| 0.75E | 403.60 | 107% | 55.556 | 119% | 256.3 | 100% |
| 1.0E | 377.30 | 100% | 46.818 | 100% | 255.4 | 100% |
| 1.5E | 348.20 | 92% | 37.725 | 81% | 253.6 | 99% |
| 2.0E | 327.66 | 87% | 32.639 | 70% | 254.3 | 100% |
Table A12.
Sensitivity of elastic modulus for clay layers (drained) in PLAXIS and SoilWorks.
| CL (Drained) |
Mmax Percentage Change |
Dmax Percentage Change |
Favg Percentage Change |
|||
|---|---|---|---|---|---|---|
| Siolworks | PLAXIS | Siolworks | PLAXIS | Siolworks | PLAXIS | |
| 0.5E | 116% | 124% | 152% | 173% | 102% | 104% |
| 0.75E | 107% | 108% | 119% | 125% | 100% | 101% |
| 1.0E | 100% | 100% | 100% | 100% | 100% | 100% |
| 1.5E | 92% | 89% | 81% | 74% | 99% | 99% |
| 2.0E | 87% | 82% | 70% | 61% | 100% | 98% |
Table A13.
Recommended simplified geotechnical parameters for Case Study 3.
| Strata Description | N | Total Stress Effective Stress | Total Stress Effective Stress | |||
|---|---|---|---|---|---|---|
| Φ | Φ’ | |||||
| Bottom Depth of Each Layer | Value | kN/m3 | kN/m2 | ˚ | kN/m2 | ˚ |
|
1~19 | 20.1 | 9.8 | 24 | 0 | 28 |
| Average thicknes 4.3 m | ||||||
|
15~>50 | 22.1 | - | - | * 4.9 |
* 38 |
| Average thicknes 13.0 m | ||||||
|
7~50 | 20.0 | 4.9 | 26 | 0 | 31 |
| Average thicknes 9.8 m | ||||||
|
>50 | * 22.1 |
- | - | * 9.8 |
* 40 |
| Average thicknes 11.1 m (hole bottom) | ||||||
Note: 1. “*” indicates estimated values. 2. Extracted from the “Geological Survey and Analysis Report of Land Parcels 21, 22, 22-1, 24, 24-1, 26, 26-1, 69, and 79, Fuxing Section, Xindian City, Taipei County” by Chunlian Engineering [34].
Appendix B
Figure A1.
Sectional view of excavation support in (a) Case 1 and (b) Case 2.
References
- Hong, R.J. Comprehensive Investigation and Study of Underground Geology and Engineering Environment in Taipei Basin: Research on Stratigraphic Distribution; Central Geological Survey Report; Report No. 83-009; Central Geological Survey, MOEA: New Taipei, Taiwan, 1994. [Google Scholar]
- Liu, Z.L. Seismic Microzonation Map of Taipei Basin. Master’s Thesis, National Central University, Taoyuan, Taiwan, 1994. [Google Scholar]
- Li, X.H. Engineering Geological Zoning of Taipei City. Geotech. Technol. 1996, 25–34. [Google Scholar] [CrossRef]
- Huang, C.Y. Application of Neural Networks in Predicting Deformation of Deep Excavation Walls. Master’s Thesis, National Taiwan Ocean University, Keelung, Taiwan, 2002. [Google Scholar]
- Chen, J.Q.; Ji, S.Y. Study on Characteristics and Deep Excavation Behavior of Soft Soil Layers (I): Research on Analysis Program for Interaction between Deep Excavation Soil and Support; Chunghsing Engineering Consulting Corporation: Taipei, Taiwan, 1996. [Google Scholar]
- Ji, S.Y.; Chen, J.Q. Numerical Simulation of Time-Dependent Deep Excavation Construction. In Proceedings of the 7th Geotechnical Engineering Conference, Hsinchu, Taiwan, 11–15 June 1997; pp. 609–615. [Google Scholar]
- Tang, Y.G. Study on Soil Parameter Identification for Deep Excavation Analysis. Ph.D. Dissertation, National Taiwan University of Science and Technology, Taipei, Taiwan, 1998. [Google Scholar]
- Xie, B.G.; Ou, Z.Y. Deep Excavation Analysis under Undrained Conditions Using a Pseudo-Plastic Model. J. China Civ. Eng. 2000, 12, 703–713. [Google Scholar]
- He, Z.D. Deep Excavation Analysis in Soft Soil Layers. Master’s Thesis, National Taipei University of Technology, Taipei, Taiwan, 2004. [Google Scholar]
- Chen, C.G. Preliminary Study on Simulating the Behavior of Excavation and Support using RIDO and PLAXIS Programs. Master’s Thesis, National Ilan University, Yilan, Taiwan, 2011. [Google Scholar]
- Wang, K.; Li, W.; Sun, H.; Pan, X.; Diao, H.; Hu, B. Lateral Deformation Characteristics and Control Methods of Foundation Pits Subjected to Asymmetric Loads. Symmetry 2021, 13, 476. [Google Scholar] [CrossRef]
- Yazici, M.F.; Keskin, S.N. Optimum Design of Multi-anchored Larssen Type Sheet Pile Wall for Temporary Construction Works. Geomech. Eng. 2021, 27, 1–11. [Google Scholar] [CrossRef]
- Hong, L.; Chen, L.; Wang, X. Reliability Analysis of Serviceability Limit State for Braced Excavation Considering Multiple Failure Modes in Spatially Variable Soil. Buildings 2022, 12, 722. [Google Scholar] [CrossRef]
- Nguyen, B.P.; Ngo, C.P.; Tran, T.D.; Bui, X.C.; Doan, N.-P. Finite Element Analysis of Deformation Behavior of Deep Excavation Retained by Diagram Wall in Ho Chi Minh City. Indian Geotech. J. 2022, 52, 989–999. [Google Scholar] [CrossRef]
- Bjerrum, L. Observed Versus Computed Settlement of Structures on Clay and Sand; Massachusetts Institute of Technology: Cambridge, MA, USA, 1964. [Google Scholar]
- D’Appolonia, D.J. Settlement of Spread Footing and Design. J. Soil Mech. Found. Div. 1970, 94, SM3. [Google Scholar]
- Shimons, N.E.; Menzies, B.K. A Short Course in Foundation Engineering; Butterworth &, Co. Ltd.: London, UK, 1977.
- Bowles, J.E. Foundation Analysis and Design, 3rd ed.; Mc Graw-Hill: New York, NY, USA, 1982; pp. 1159–1177. [Google Scholar]
- Li, W.F.; Lai, Y.R.; Liao, N.H. Two-Dimensional Numerical Analysis Method for Soil Nailing Reinforced Slopes. Geotech. Technol. 2003, 98, 39–54. [Google Scholar]
- Hsieh, H.S.; Cheng, J.S.; Tsai, Z.H.; Yang, M.C. Practical Considerations for Continuous Wall Design Analysis. Geotech. Technol. 1996, 53, 35–44. [Google Scholar] [CrossRef]
- Zhang, J.Z.; Chen, K.Q. Assessment of Sensitivity of Design Parameters on Deep Excavation and Retaining Wall. Geotech. Technol. 1999, 76, 17–24. [Google Scholar] [CrossRef]
- Qiu, Z.R. Study on Parameters of Deep Excavation in Sanchong-Luzhou Area. Master’s Thesis, National Taipei University of Technology, Taipei, Taiwan, 2007. [Google Scholar] [CrossRef]
- Hong, R.J. Preliminary Study on Composite Soil Engineering Properties. J. Eng. Natl. Taiwan Univ. 1978, 23, 1–12. [Google Scholar]
- Das, B. Fundamentals of Geotechnical Engineering, 3rd ed.; PWS: Boston, MA, USA, 1994; pp. 81–82. [Google Scholar]
- PLAXIS BV. Plaxis Version 8, Manual; Delft University of Technology & PLAXIS, b.v. : Amsterdam, The Netherlands, 2006.
- Kenkul Engineering Co., Ltd. Completion Report of Foundation Construction Safety Observation for Jianglinchun Phase 1 Building Project 2005a; Kenkul Engineering Co., Ltd. : New Taipei City, Taiwan, 2005.
- Lin, C.M. Numerical Simulation of Excavation in Gravel Layers. Master’s Thesis, National Taiwan Ocean University, Keelung, Taiwan, 2011. [Google Scholar]
- Chunglian Engineering Consultants Co., Ltd. Geological Investigation and Analysis Report for Land Parcels 34 and 110, Dafeng Section; Chunglian Engineering Consultants Co., Ltd. : New Taipei City, Taiwan, 2003. Dafeng Section.
- Kenkul Engineering Co., Ltd. Completion Report of Foundation Construction Safety Observation for Jianglinchun Phase 2 Building Project; Kenkul Engineering Co., Ltd. : New Taipei City, Taiwan, 2006.
- Kenkul Engineering Co., Ltd. Geological Investigation and Analysis Report for Land Parcels 62-1 and Seven Others, Dafeng Section, Xindian City, Taipei County, 2005b; Kenkul Engineering Co., Ltd.: New Taipei City, Taiwan, 2005. [Google Scholar]
- Fan, C.Y. Finite Element Analysis of Mutual Effects of Adjacent Excavation Sites. Master’s Thesis, Feng Chia University, Taichung, Taiwan, 2005. [Google Scholar]
- Guo, T.Y. Numerical Analysis Study of Deformation Behavior in Gravel Layer Tunnels. Master’s Thesis, National Cheng Kung University, Tainan, Taiwan, 1999. [Google Scholar]
- Hou, Z.A. Feedback Analysis of Excavation Procedure and Optimal Support Types in Cobble Gravel Layers. Master’s Thesis, National Chung Hsing University, Taichung, Taiwan, 2001. [Google Scholar]
- Chunglian Engineering Consultants Co., Ltd. Geological Investigation and Analysis Report for Land Lots with Nine Parcel Numbers, Section 21, 22, 22–1, 24, 24-1, 26, 26–1, 69, and 79, Xindian District, Taipei County, 2006, Chunglian Engineering Consultants Co., Ltd.: New Taipei City, Taiwan, 2006.
Figure 1.
Flowchart of the Research Process.
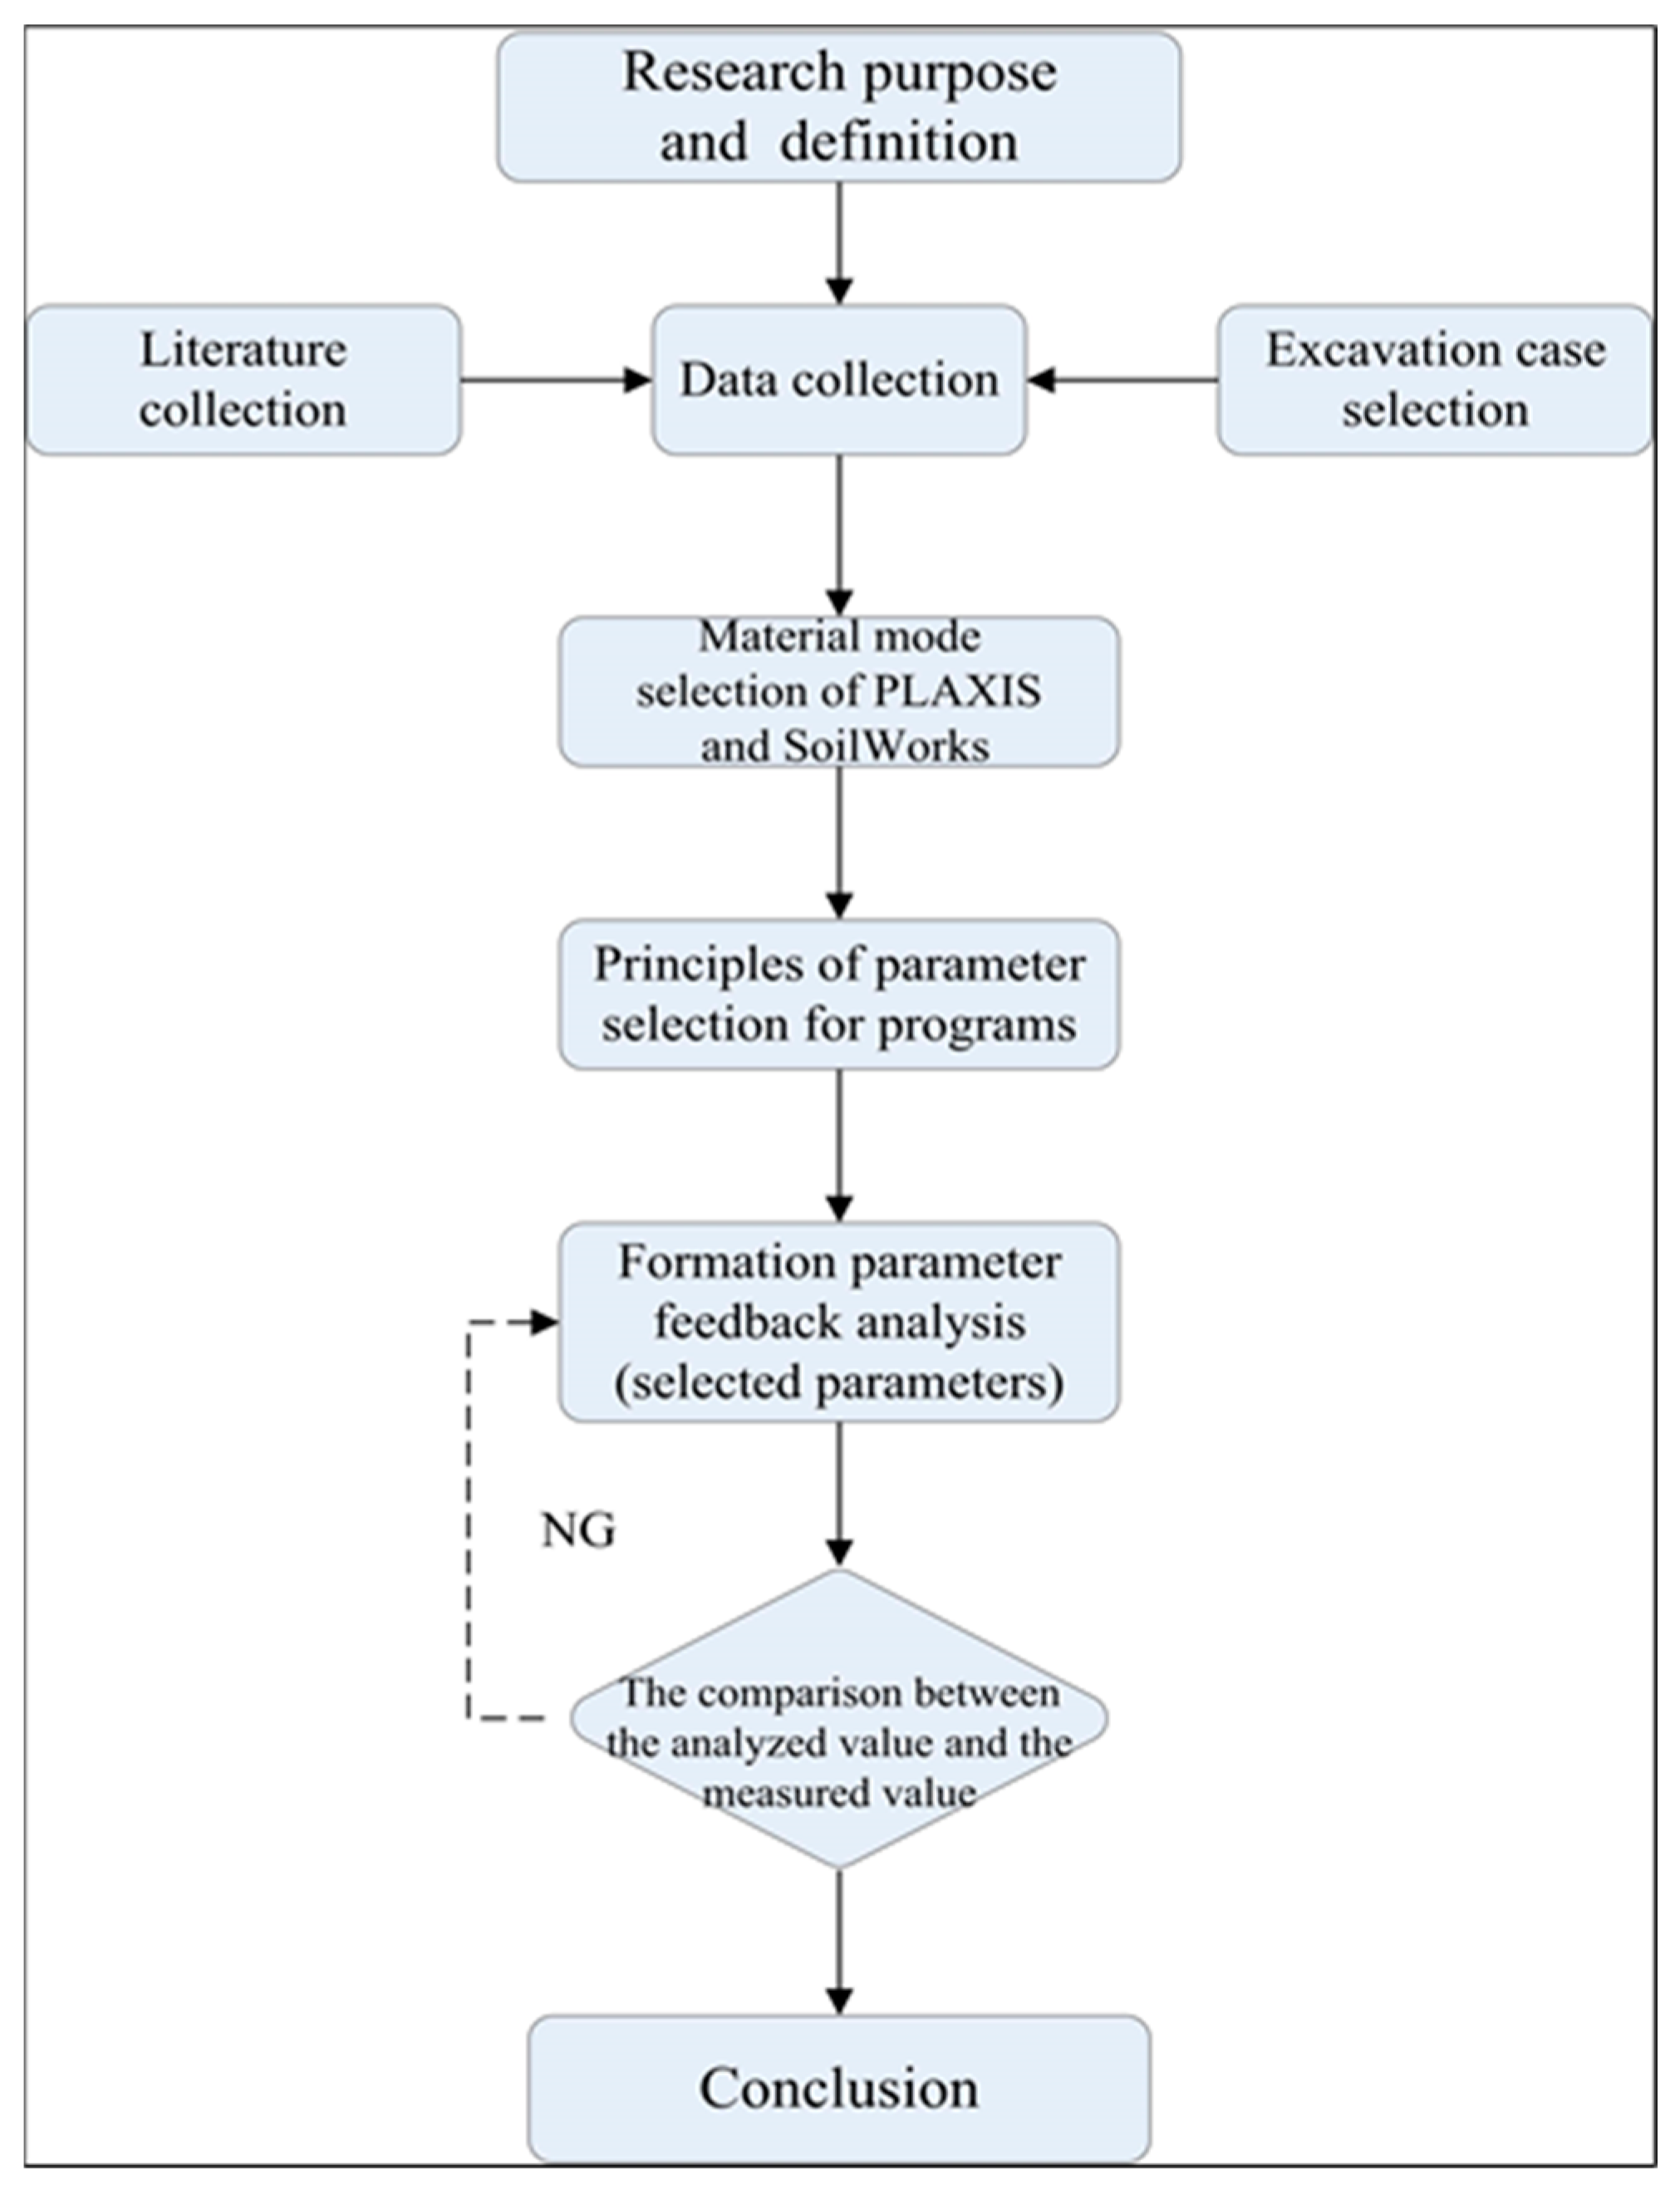
Figure 2.
During the final excavation stage of Case 1- (a) Numerical mesh deformation during the final excavation stage, (b) Overall displacement vector.
Figure 2.
During the final excavation stage of Case 1- (a) Numerical mesh deformation during the final excavation stage, (b) Overall displacement vector.
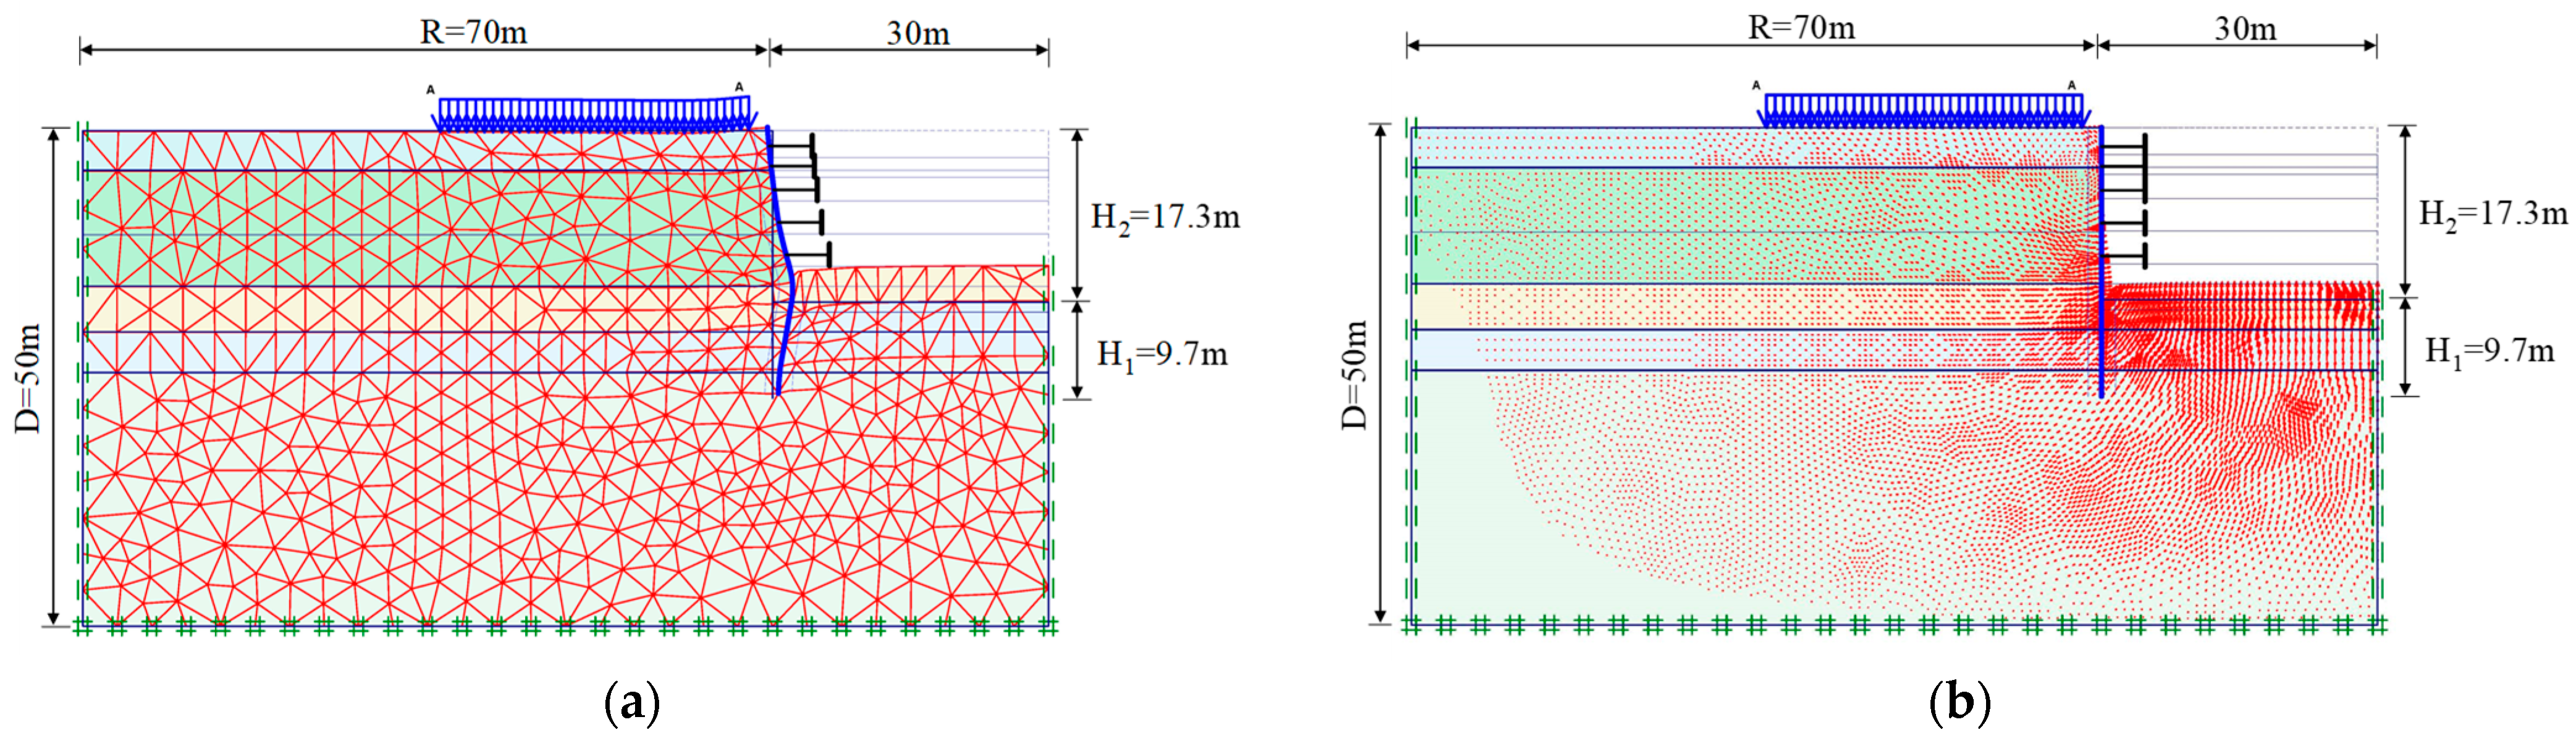
Figure 3.
During the final excavation stage of Case 2- (a) Numerical mesh deformation during the final excavation stage, (b) Overall displacement vector.
Figure 3.
During the final excavation stage of Case 2- (a) Numerical mesh deformation during the final excavation stage, (b) Overall displacement vector.
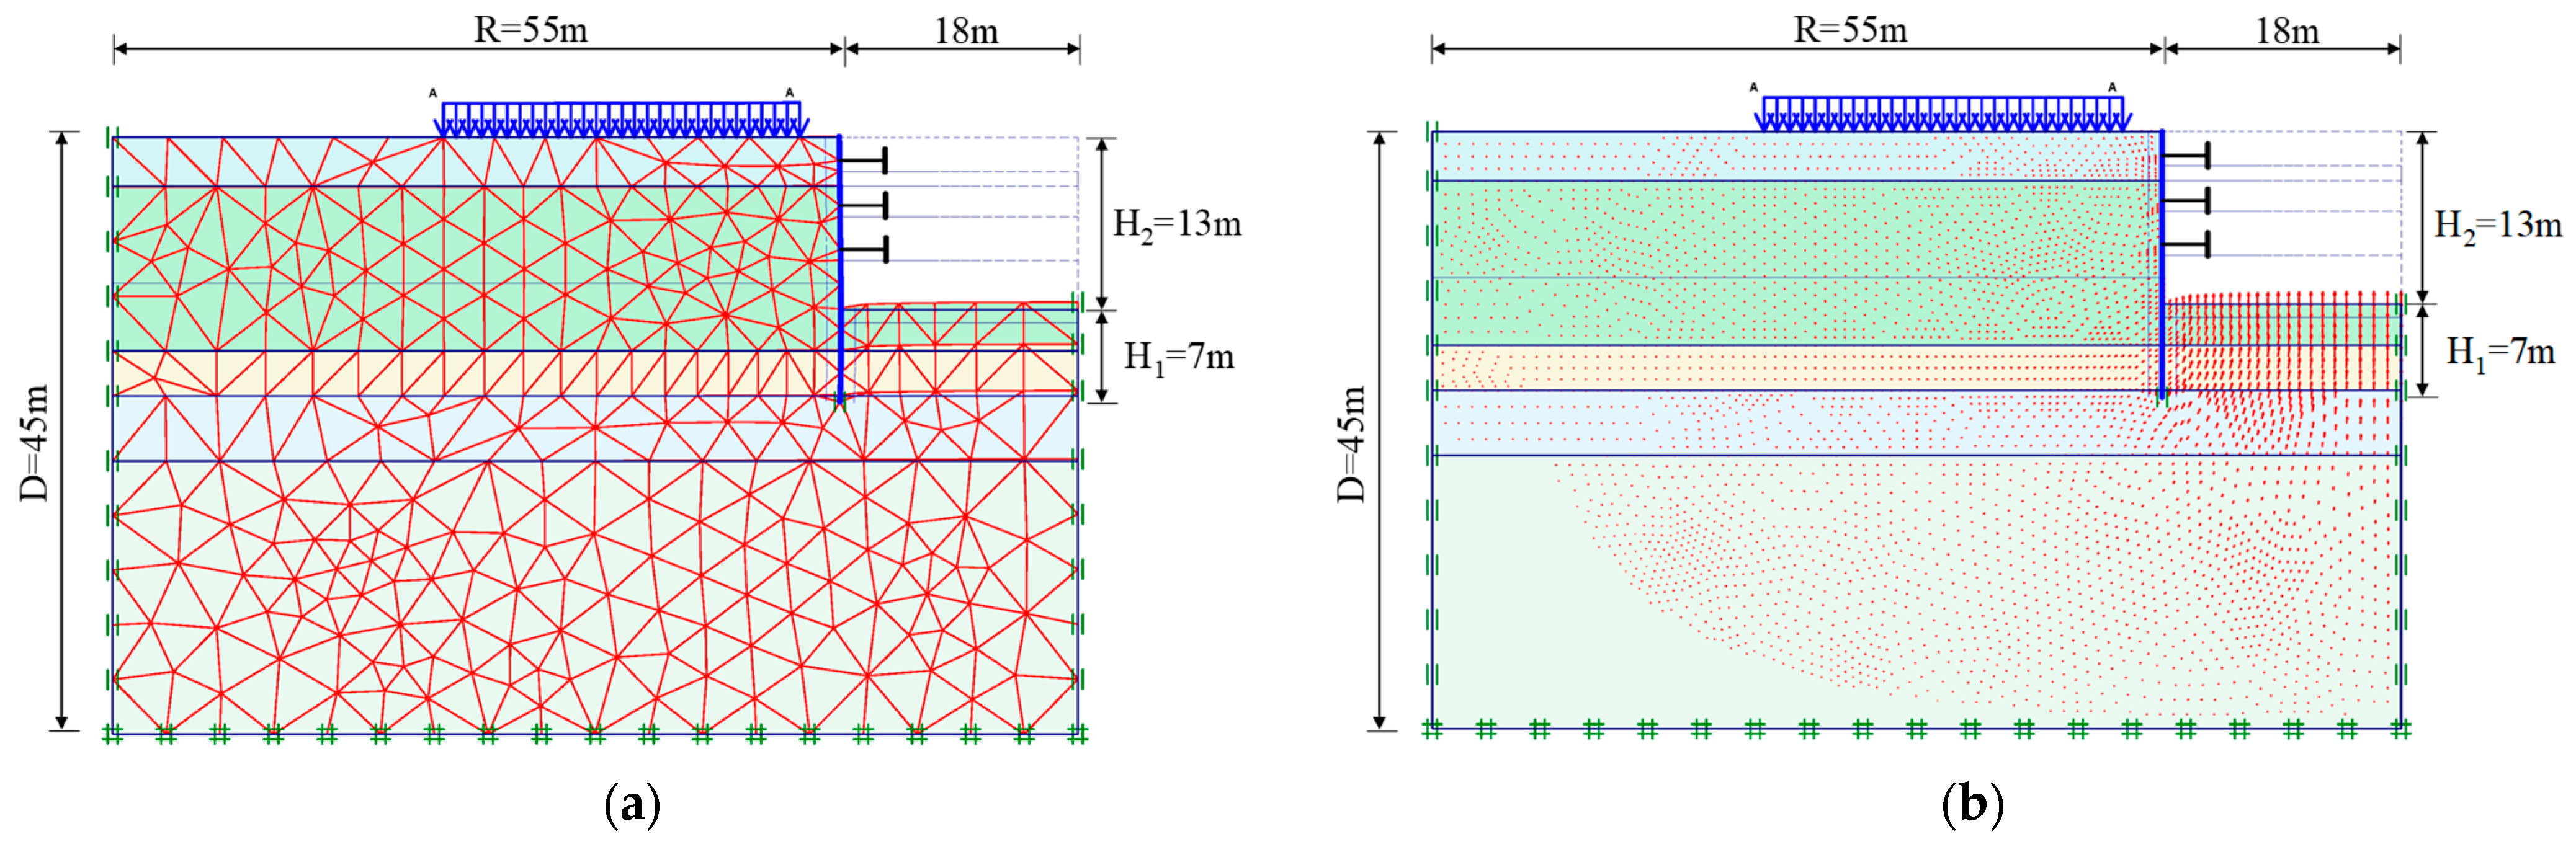
Figure 4.
Comparison diagram of lateral displacement in the final excavation stage of (a) Case 1; (b) Case 2.
Figure 4.
Comparison diagram of lateral displacement in the final excavation stage of (a) Case 1; (b) Case 2.
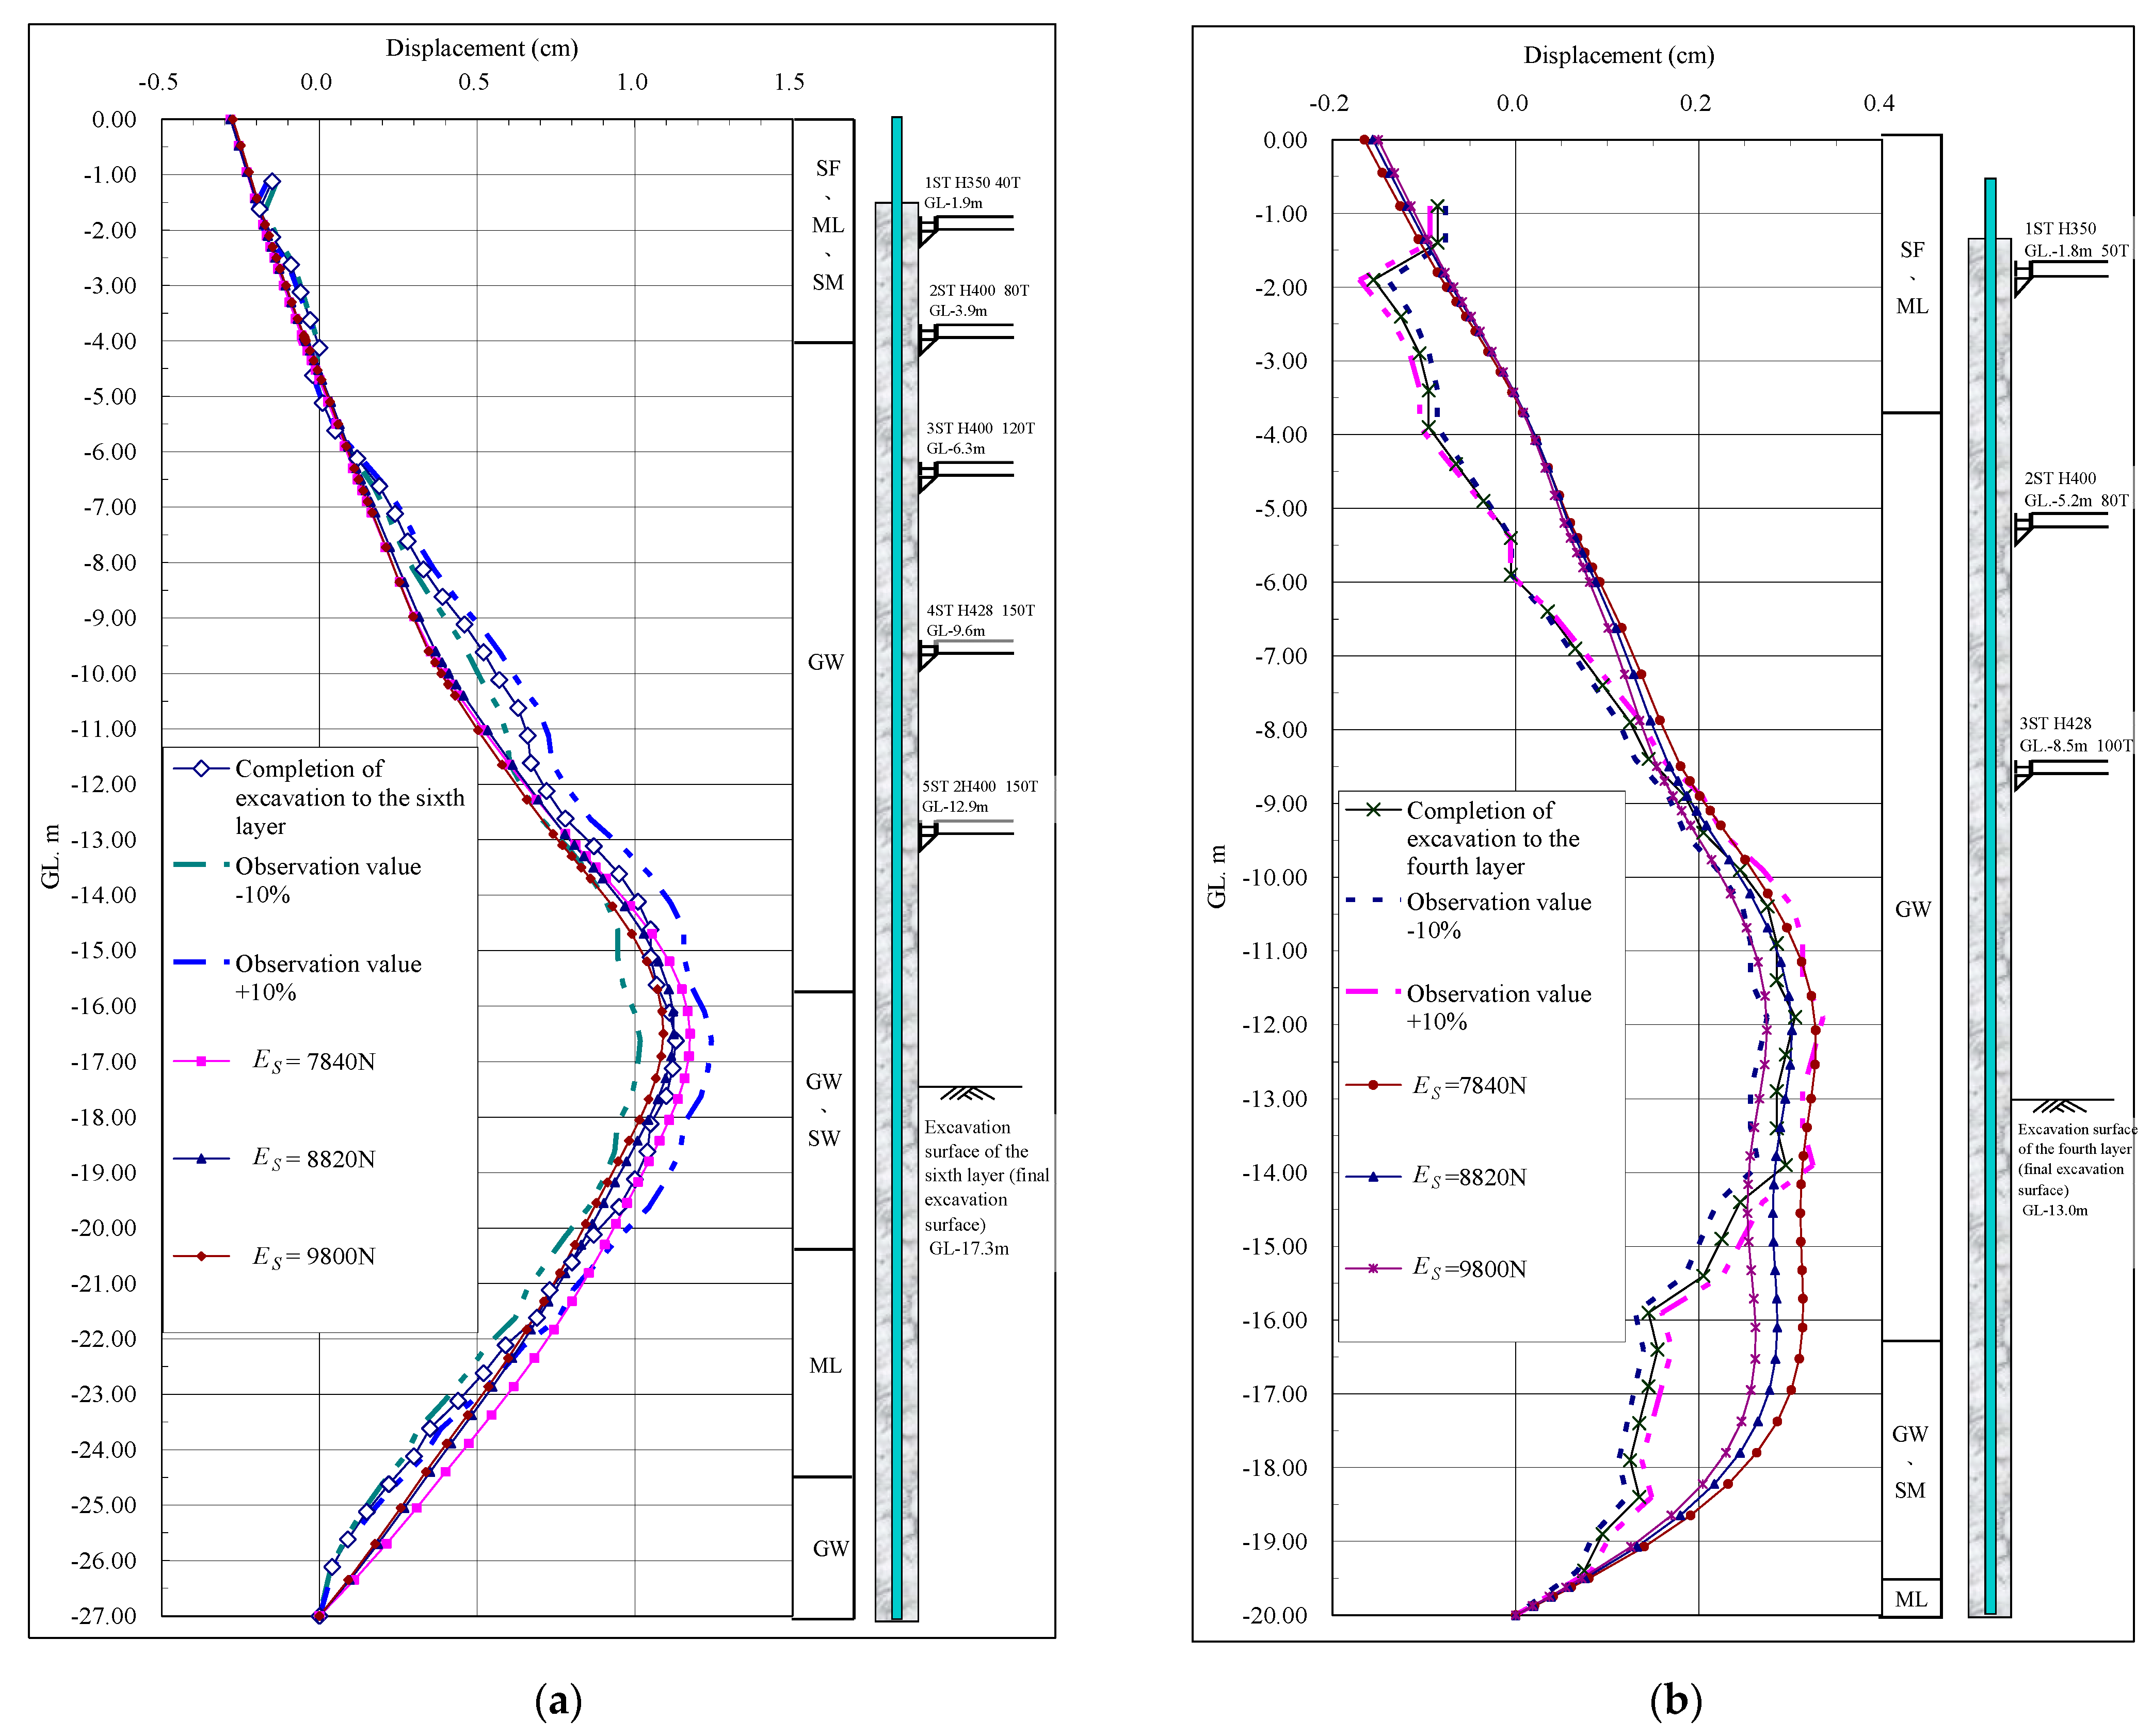
Figure 5.
(a) Material Properties ; (b) Yield Function of the Mohr-Coulomb Model.
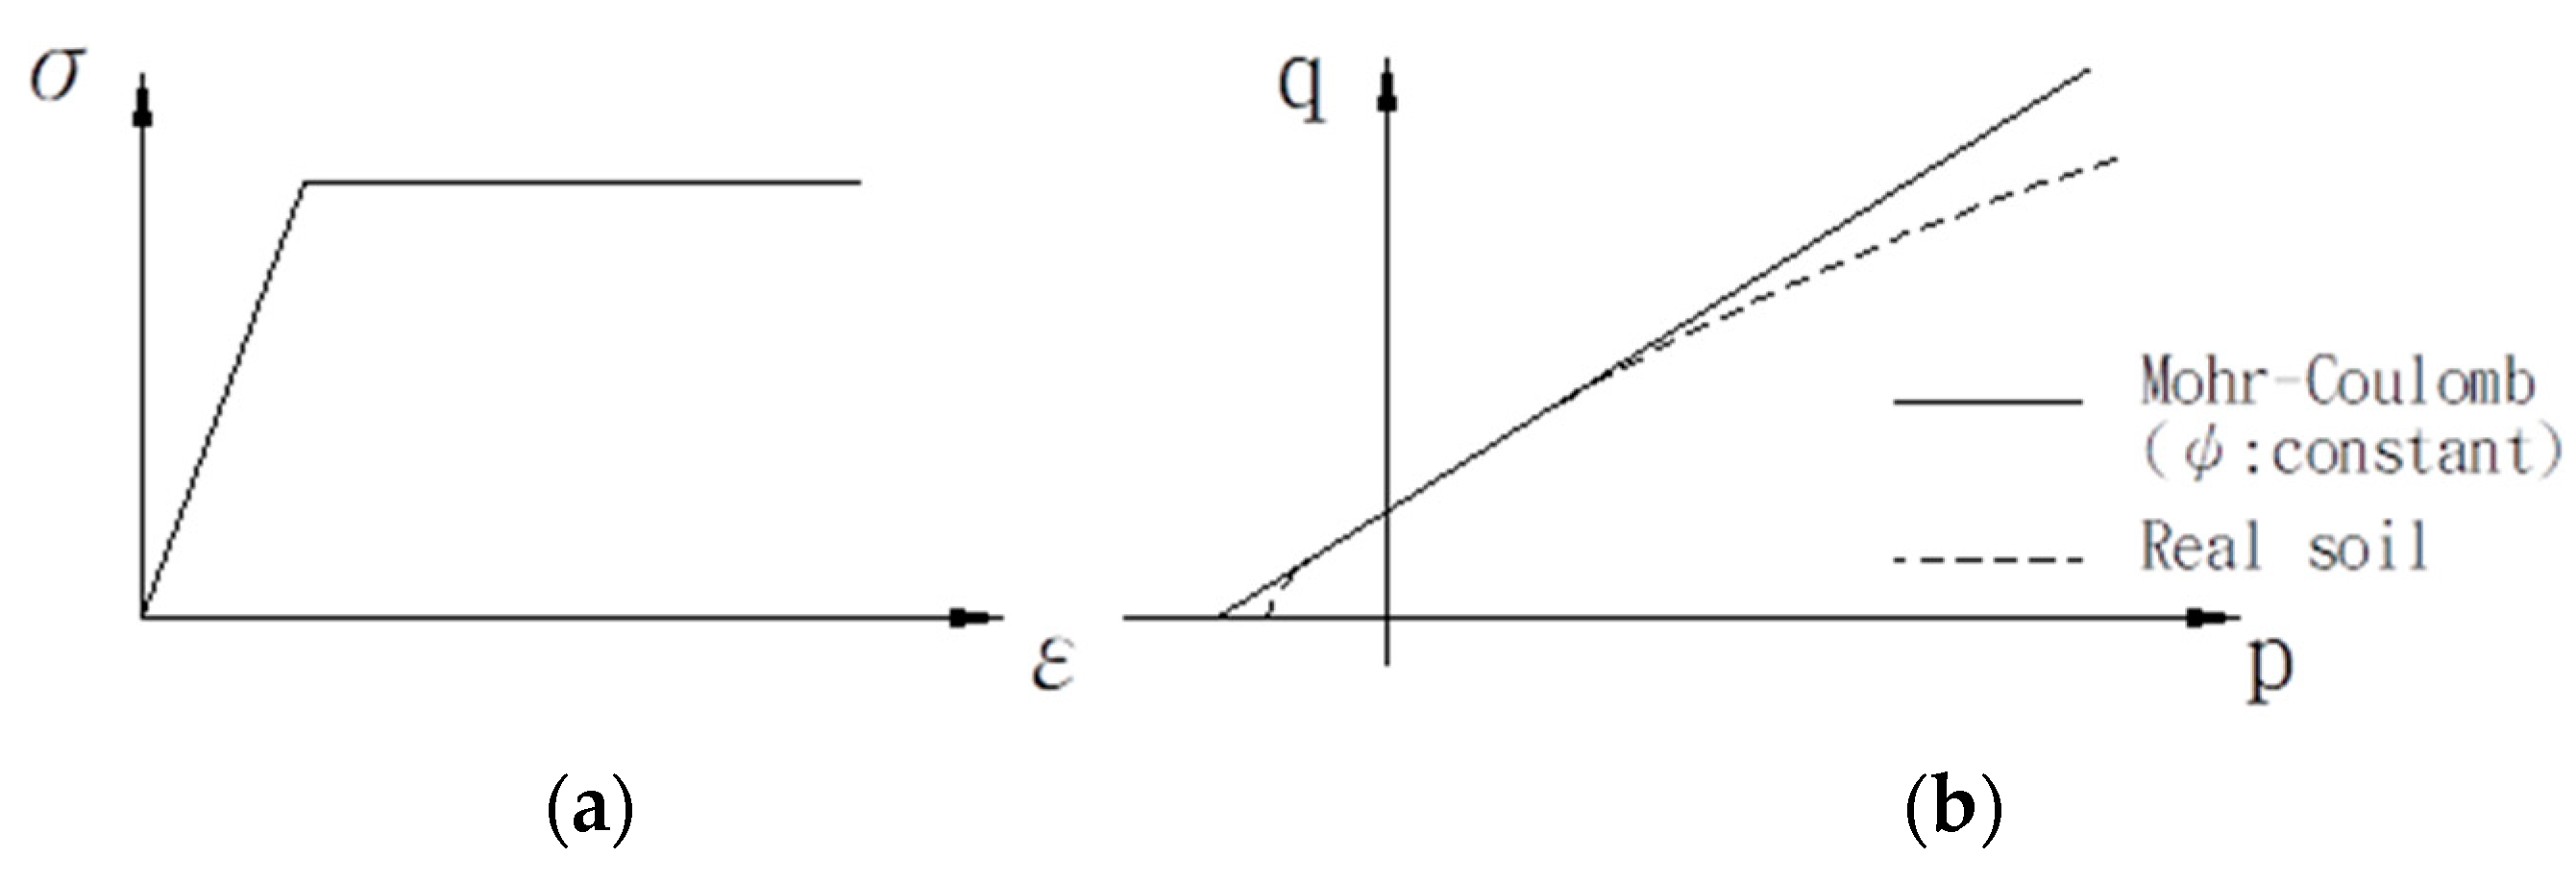
Figure 6.
Case analysis model for Sandy soil layer simulation.
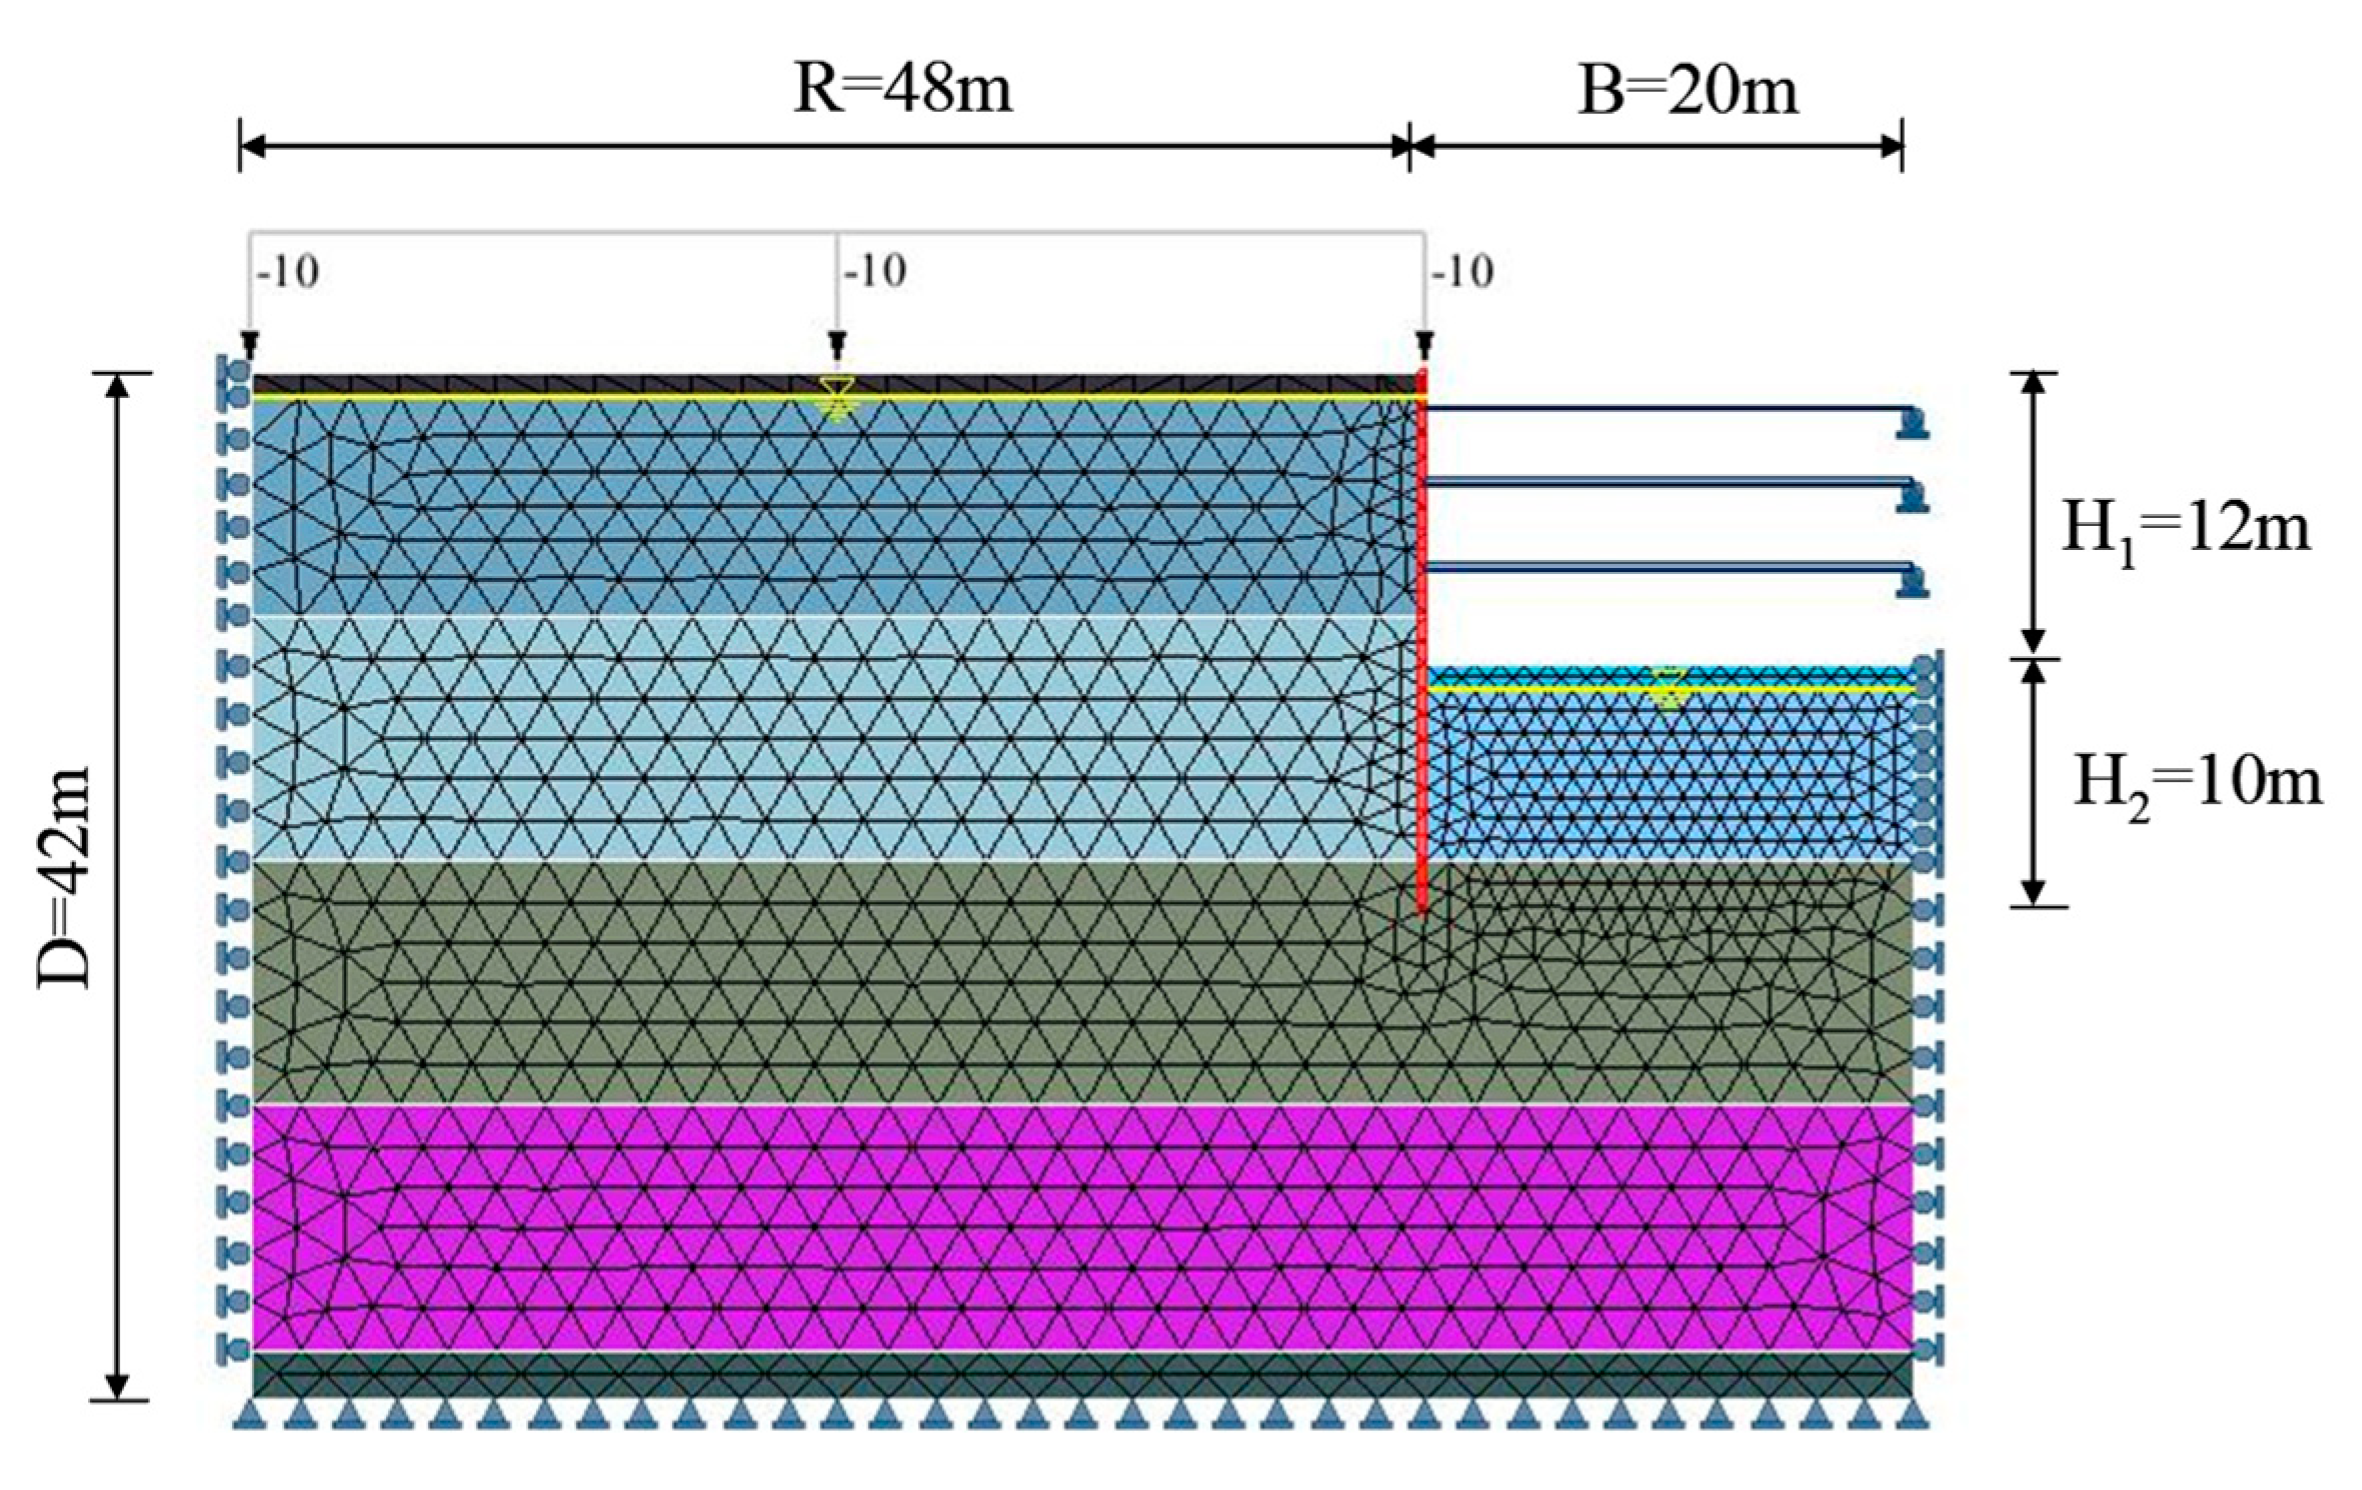
Figure 7.
Case analysis model for clay layer simulation.
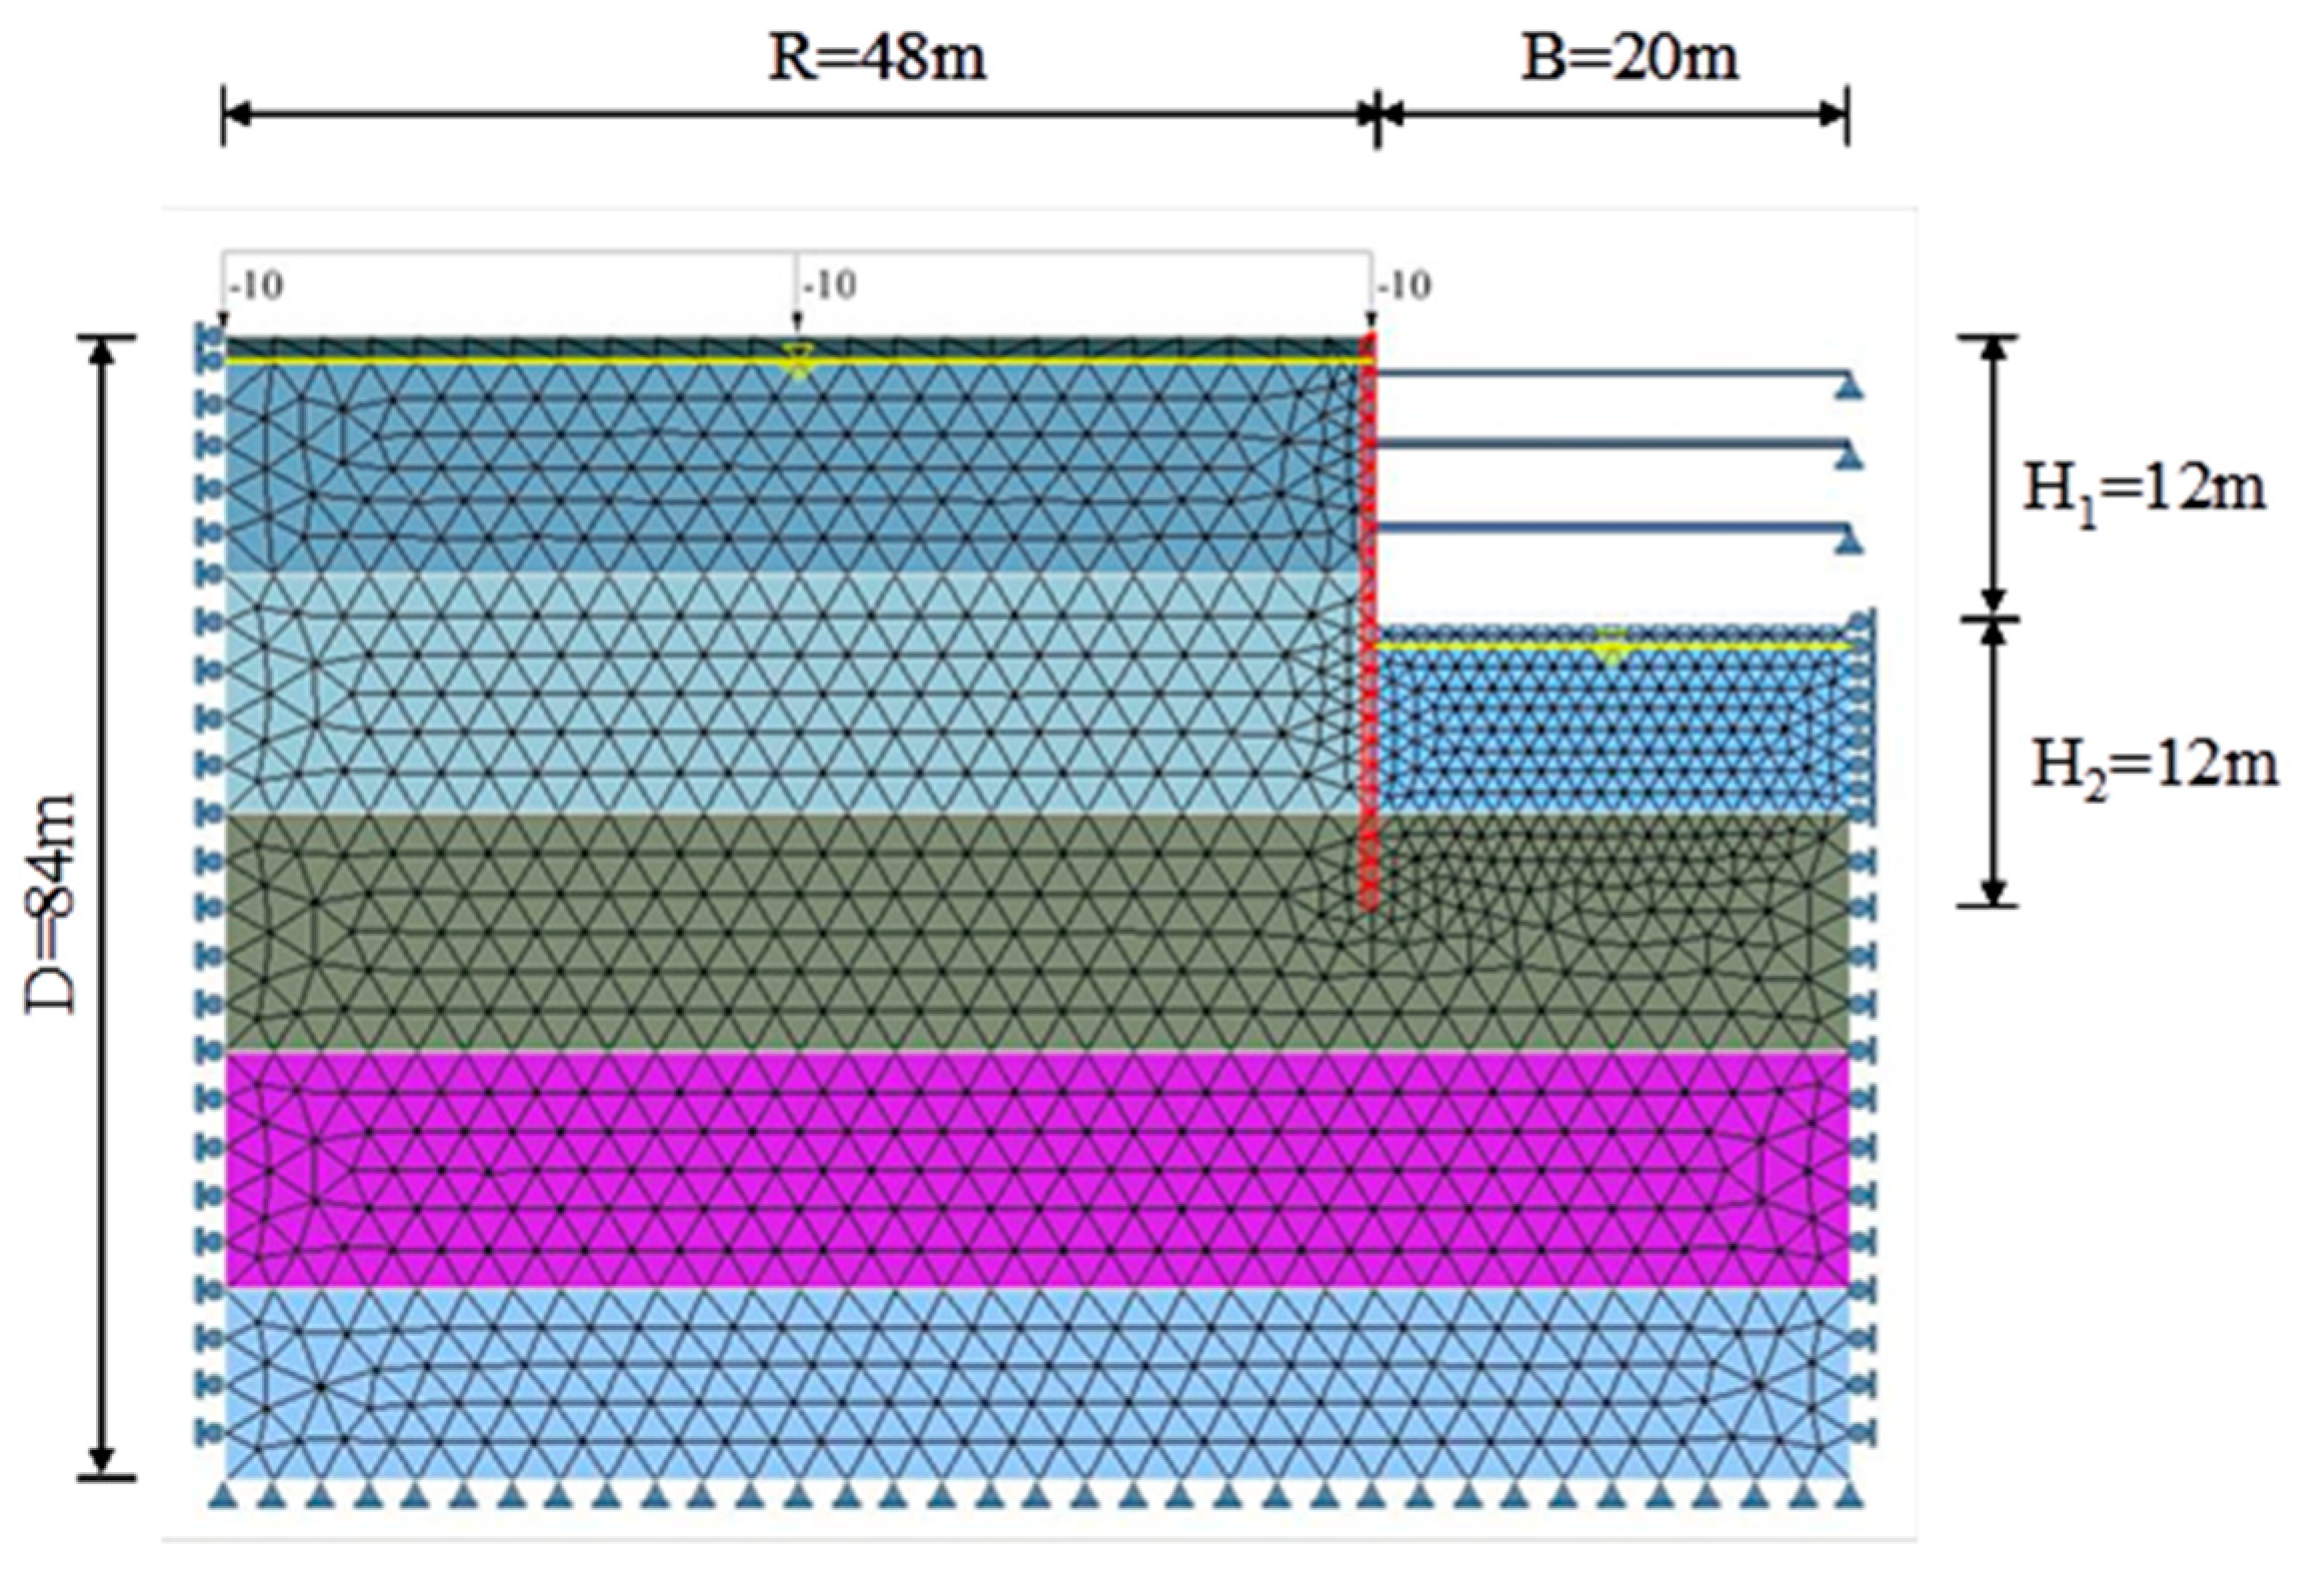
Figure 8.
Comparison of the sensitivity diagram to sandy Soil-drained (a) SoilWorks programs to friction angle (Mmax, Dmax and Favg) ;(b) PLAXIS and SoilWorks programs to friction angle (Mmax).
Figure 8.
Comparison of the sensitivity diagram to sandy Soil-drained (a) SoilWorks programs to friction angle (Mmax, Dmax and Favg) ;(b) PLAXIS and SoilWorks programs to friction angle (Mmax).
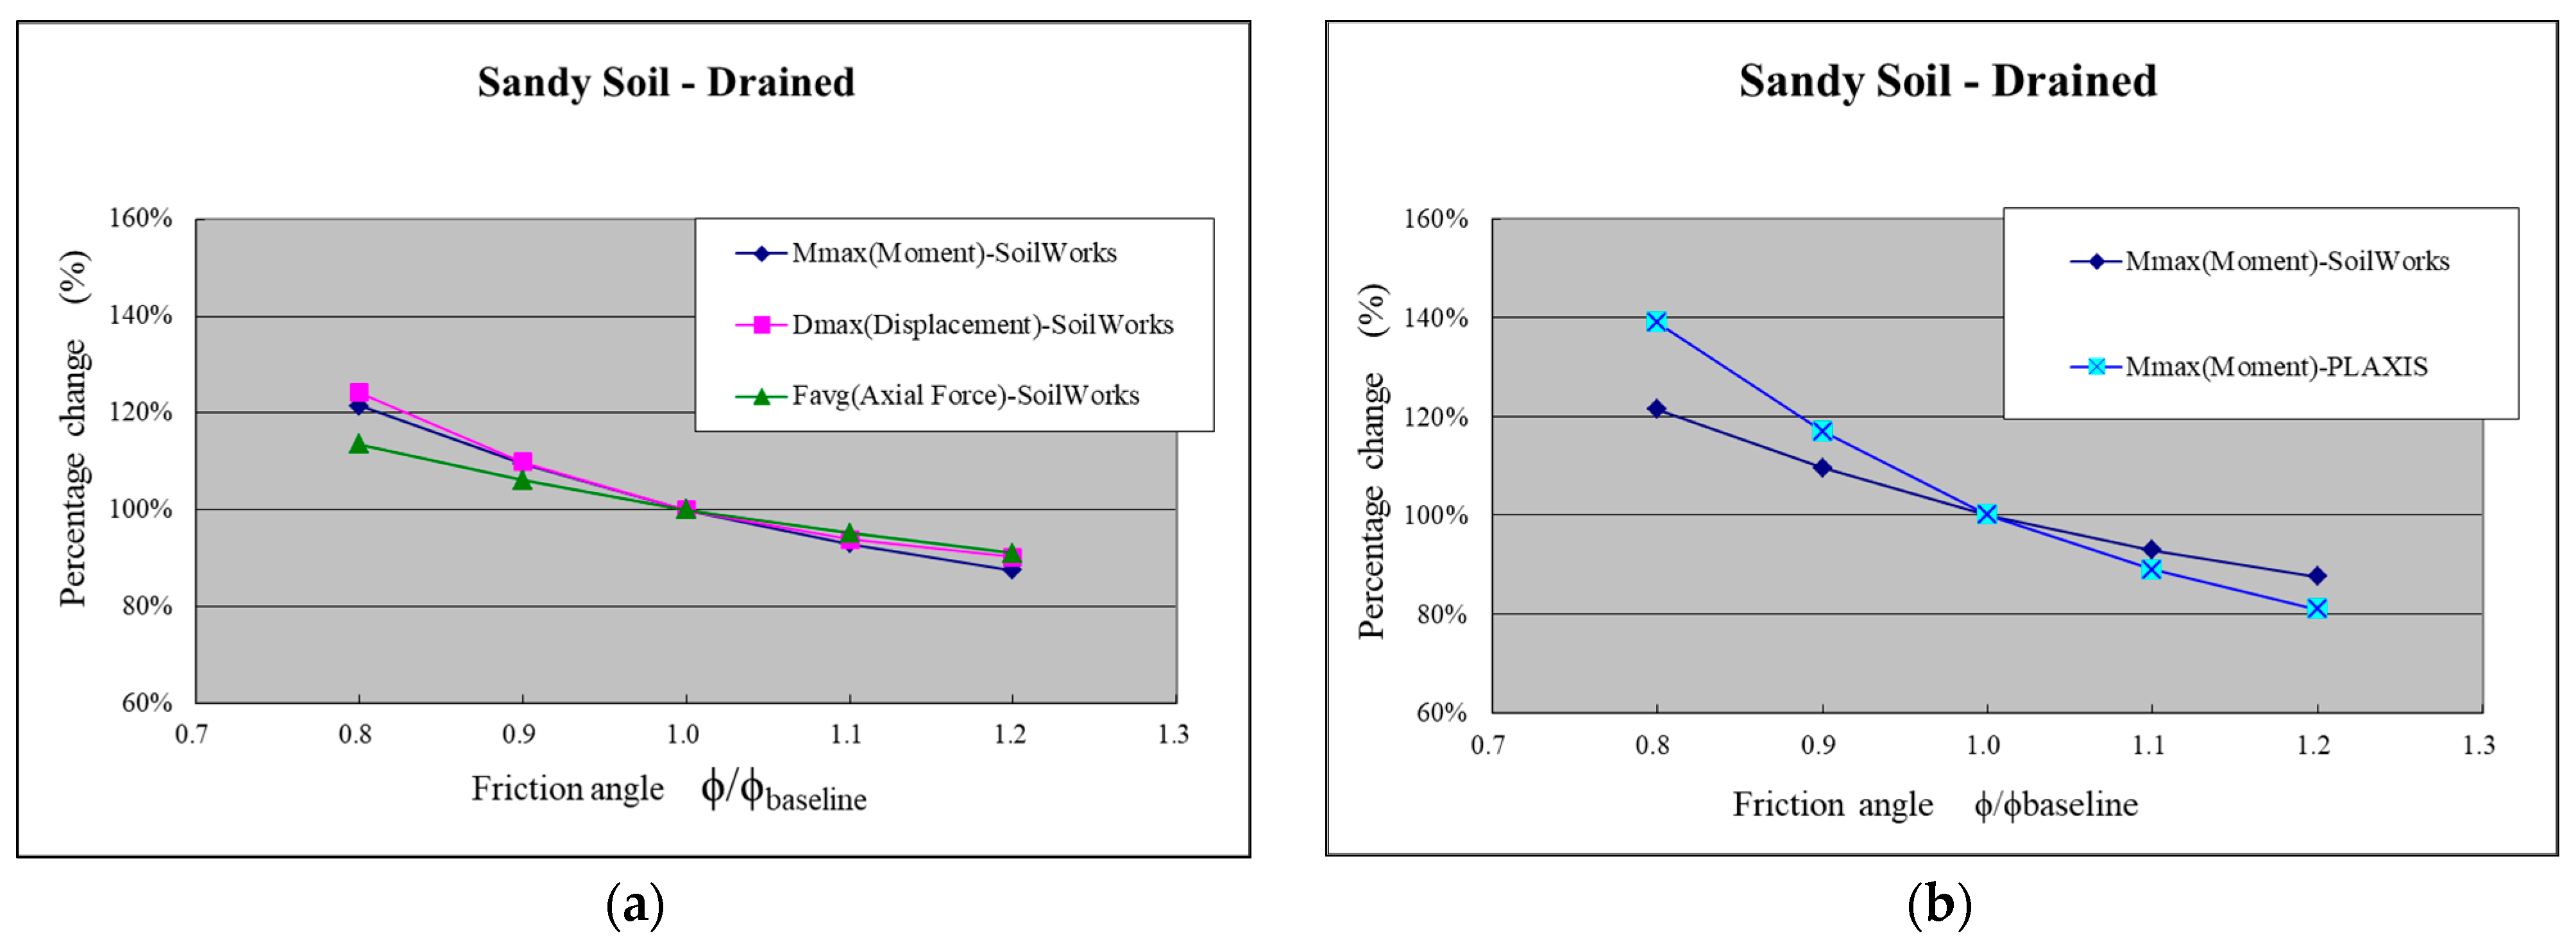
Figure 9.
Comparison of the sensitivity of PLAXIS and SoilWorks programs to sandy Soil-drained (a) friction angle (Dmax); (b) friction angle (Favg).
Figure 9.
Comparison of the sensitivity of PLAXIS and SoilWorks programs to sandy Soil-drained (a) friction angle (Dmax); (b) friction angle (Favg).
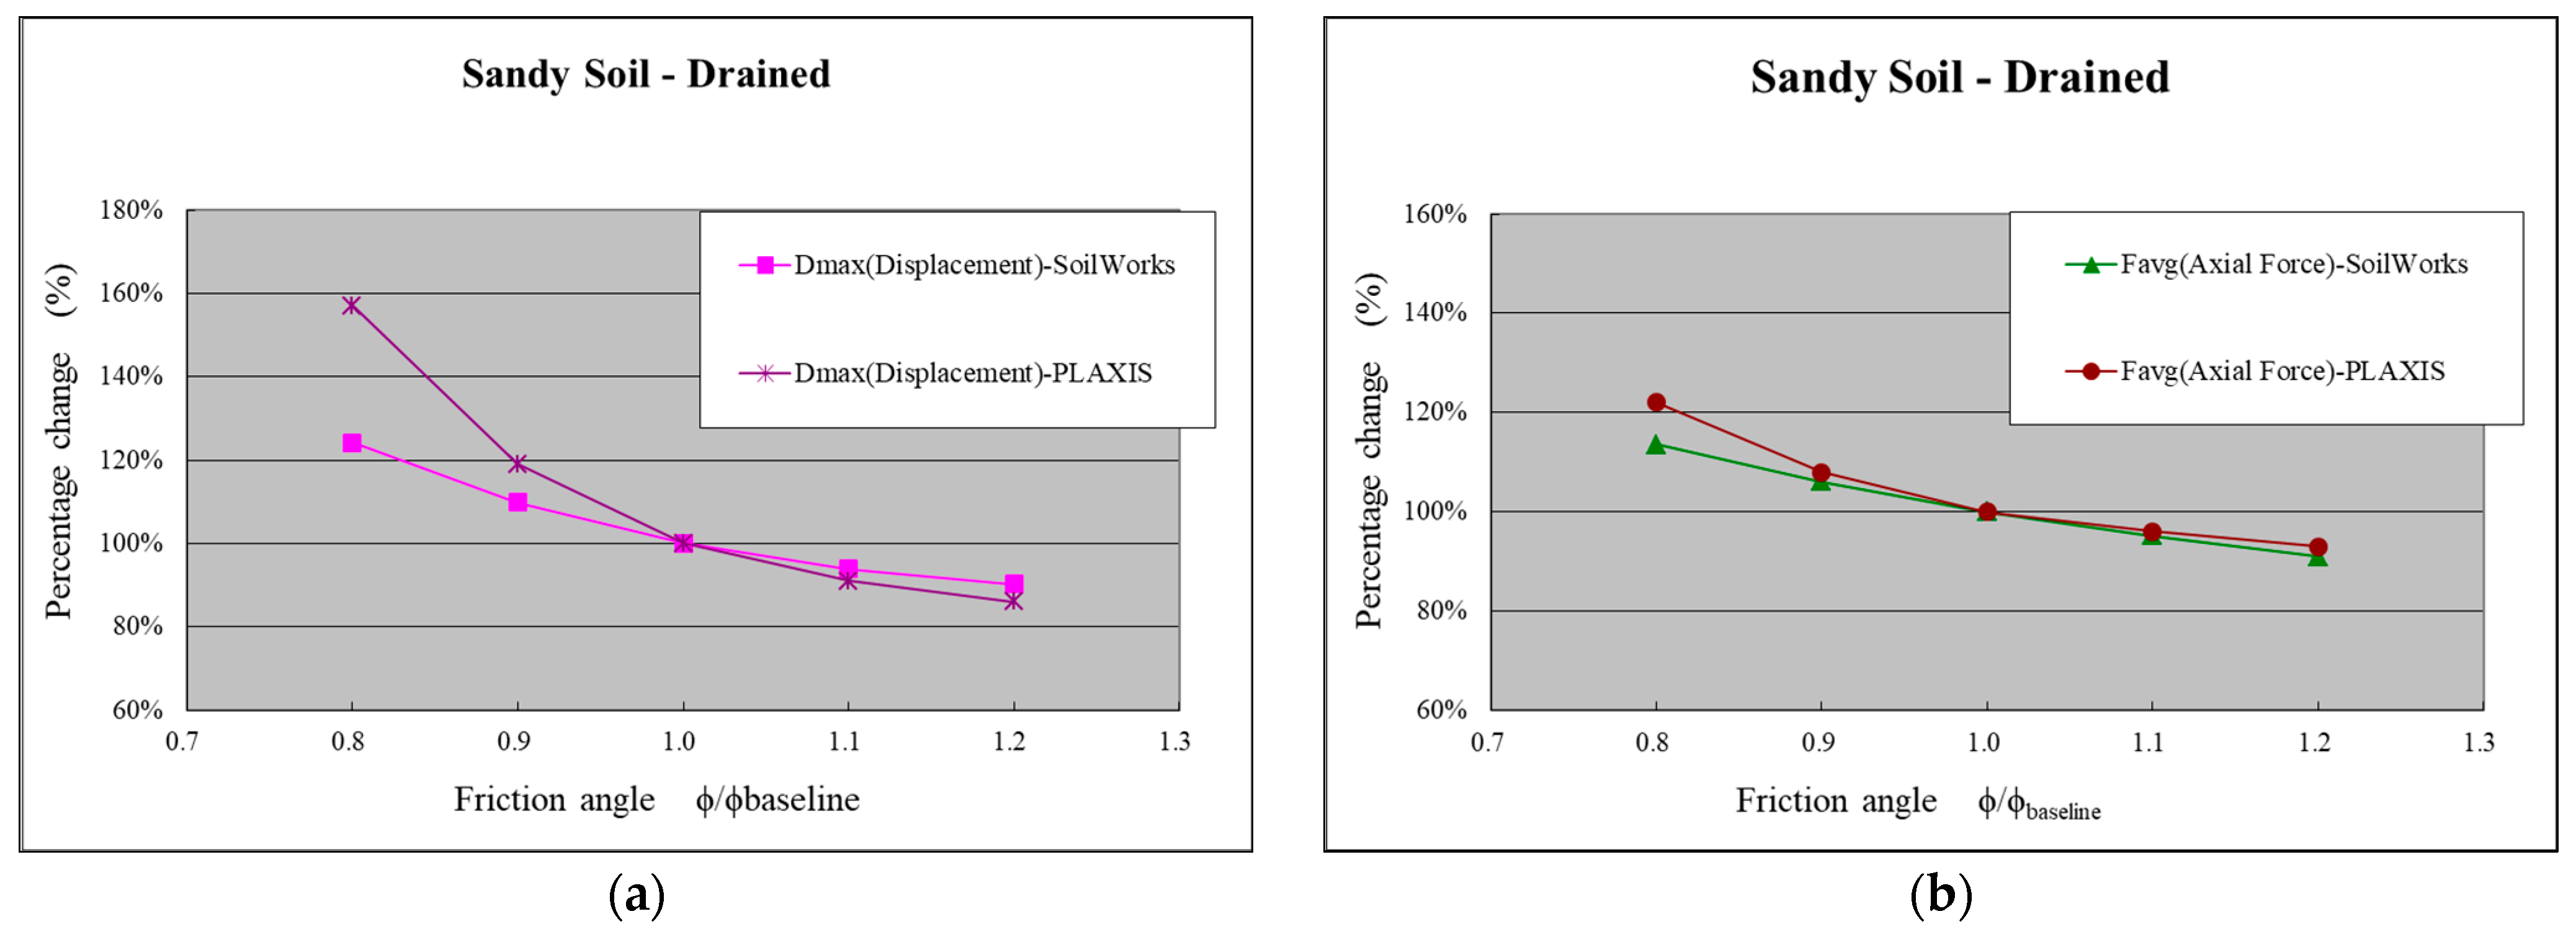
Figure 10.
Comparison of the sensitivity diagram to clay-undrained (a) SoilWorks programs to friction angle (Mmax, Dmax and Favg) ;(b) PLAXIS and SoilWorks programs to friction angle (Mmax).
Figure 10.
Comparison of the sensitivity diagram to clay-undrained (a) SoilWorks programs to friction angle (Mmax, Dmax and Favg) ;(b) PLAXIS and SoilWorks programs to friction angle (Mmax).
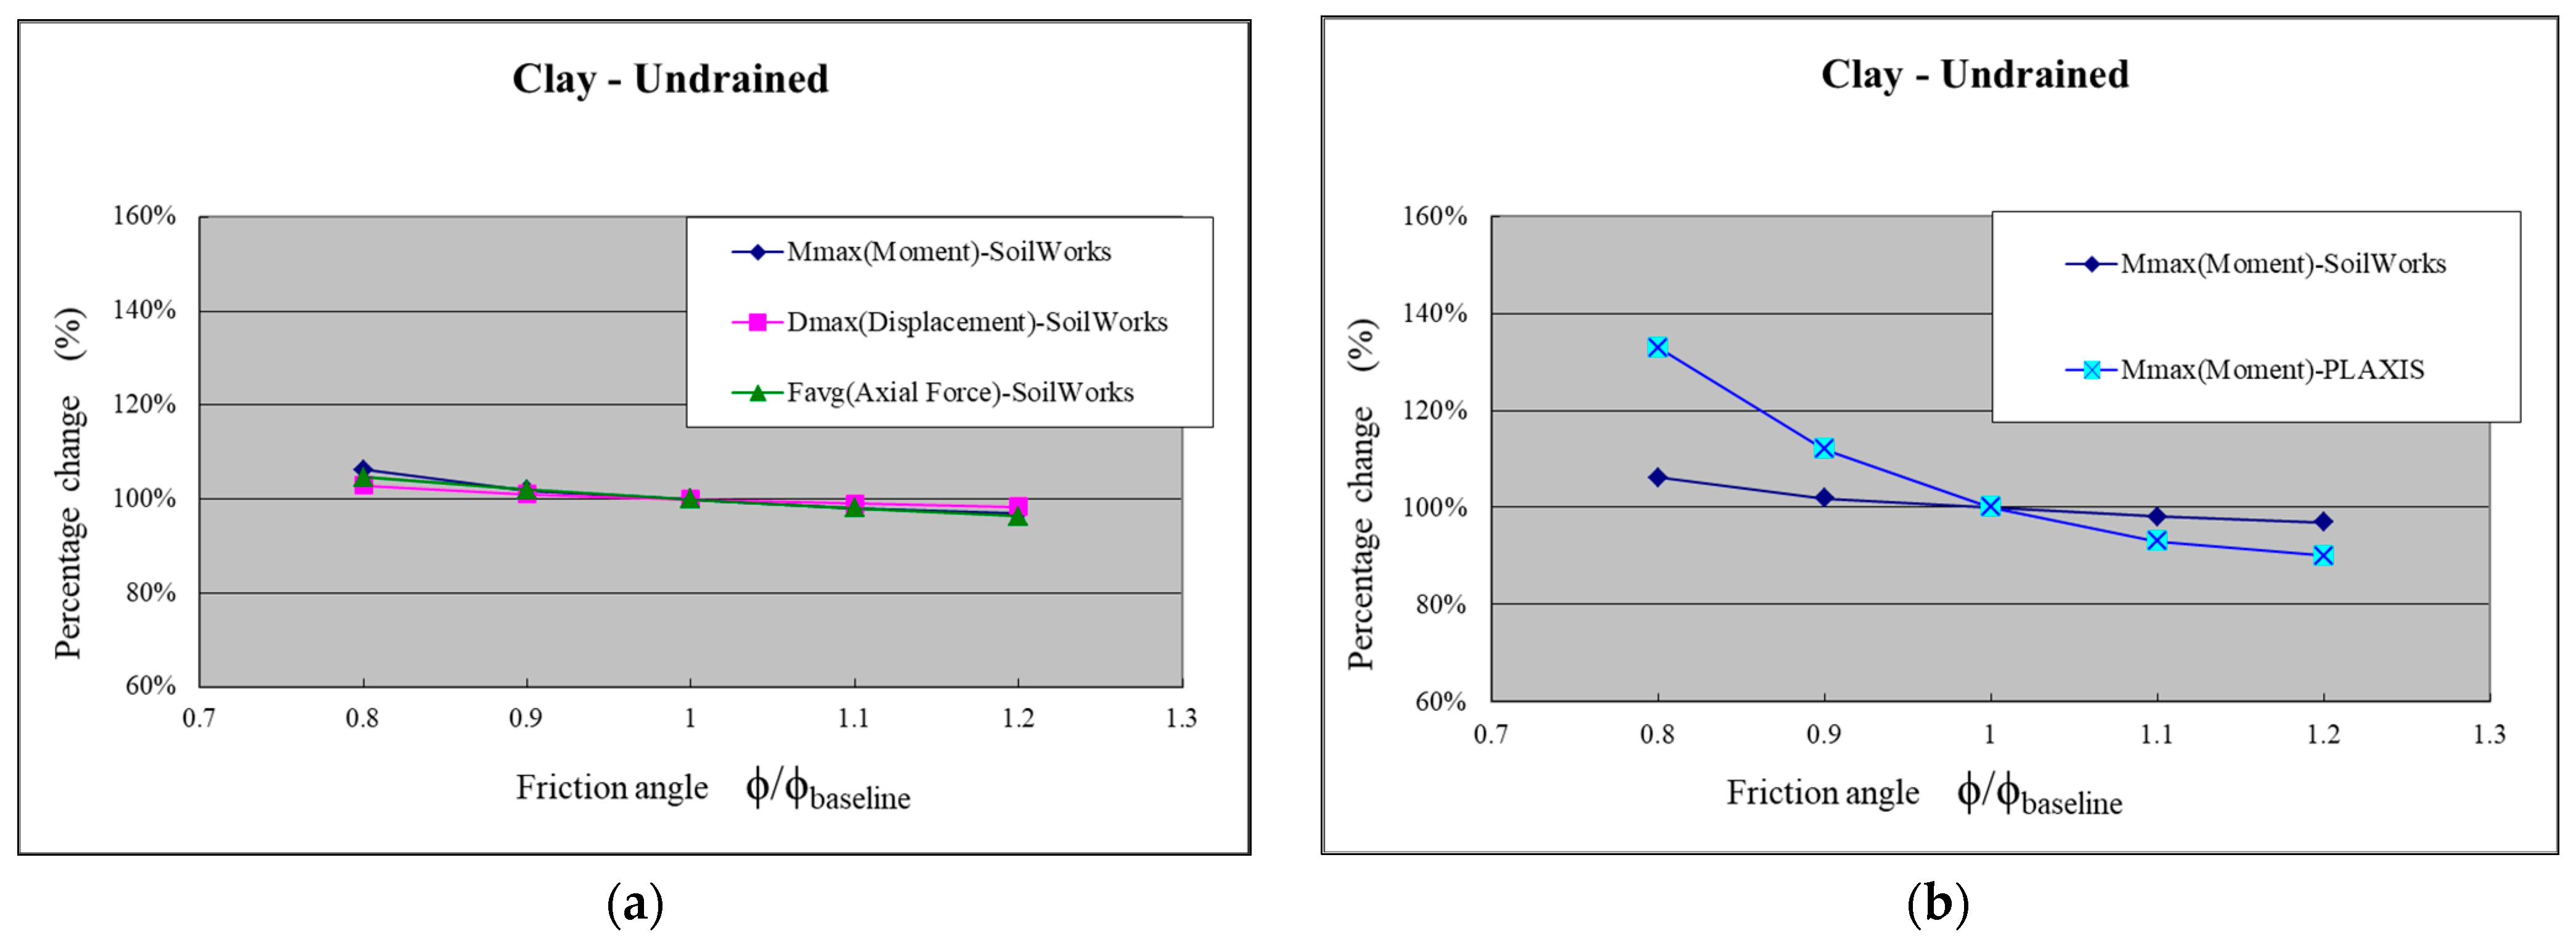
Figure 11.
Comparison of the sensitivity of PLAXIS and SoilWorks programs to clay-undrained (a) friction angle (Dmax); (b) friction angle (Favg).
Figure 11.
Comparison of the sensitivity of PLAXIS and SoilWorks programs to clay-undrained (a) friction angle (Dmax); (b) friction angle (Favg).

Figure 12.
Comparison of the sensitivity diagram to sandy soil-drained (a) SoilWorks programs to elastic modulus (Mmax, Dmax and Favg) ;(b) PLAXIS and SoilWorks programs to elastic modulus (Mmax).
Figure 12.
Comparison of the sensitivity diagram to sandy soil-drained (a) SoilWorks programs to elastic modulus (Mmax, Dmax and Favg) ;(b) PLAXIS and SoilWorks programs to elastic modulus (Mmax).
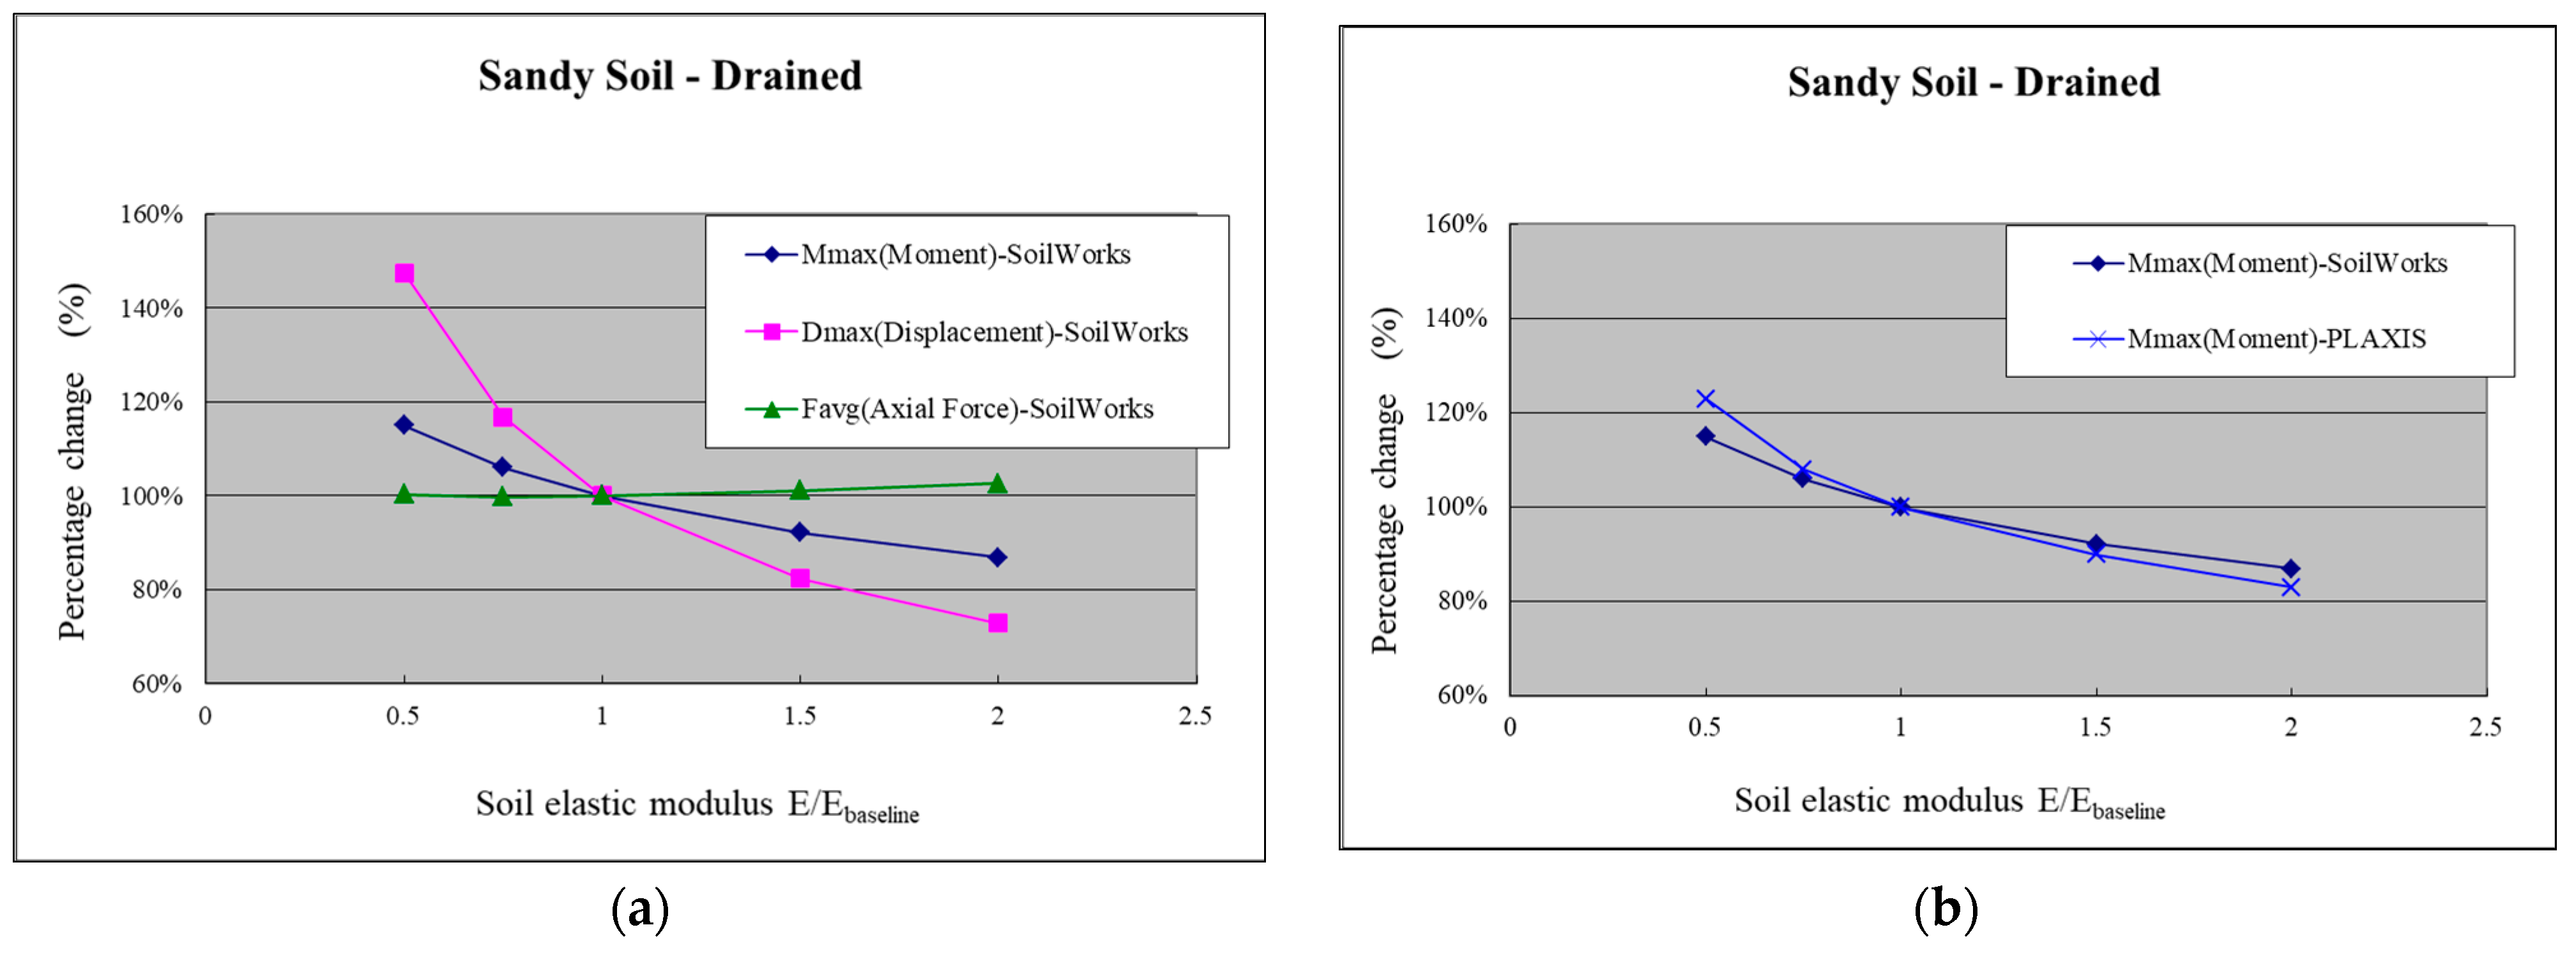
Figure 13.
Comparison of the sensitivity of PLAXIS and SoilWorks programs to sandy soil-drained (a) elastic modulus (Dmax); (b) elastic modulus (Favg).
Figure 13.
Comparison of the sensitivity of PLAXIS and SoilWorks programs to sandy soil-drained (a) elastic modulus (Dmax); (b) elastic modulus (Favg).
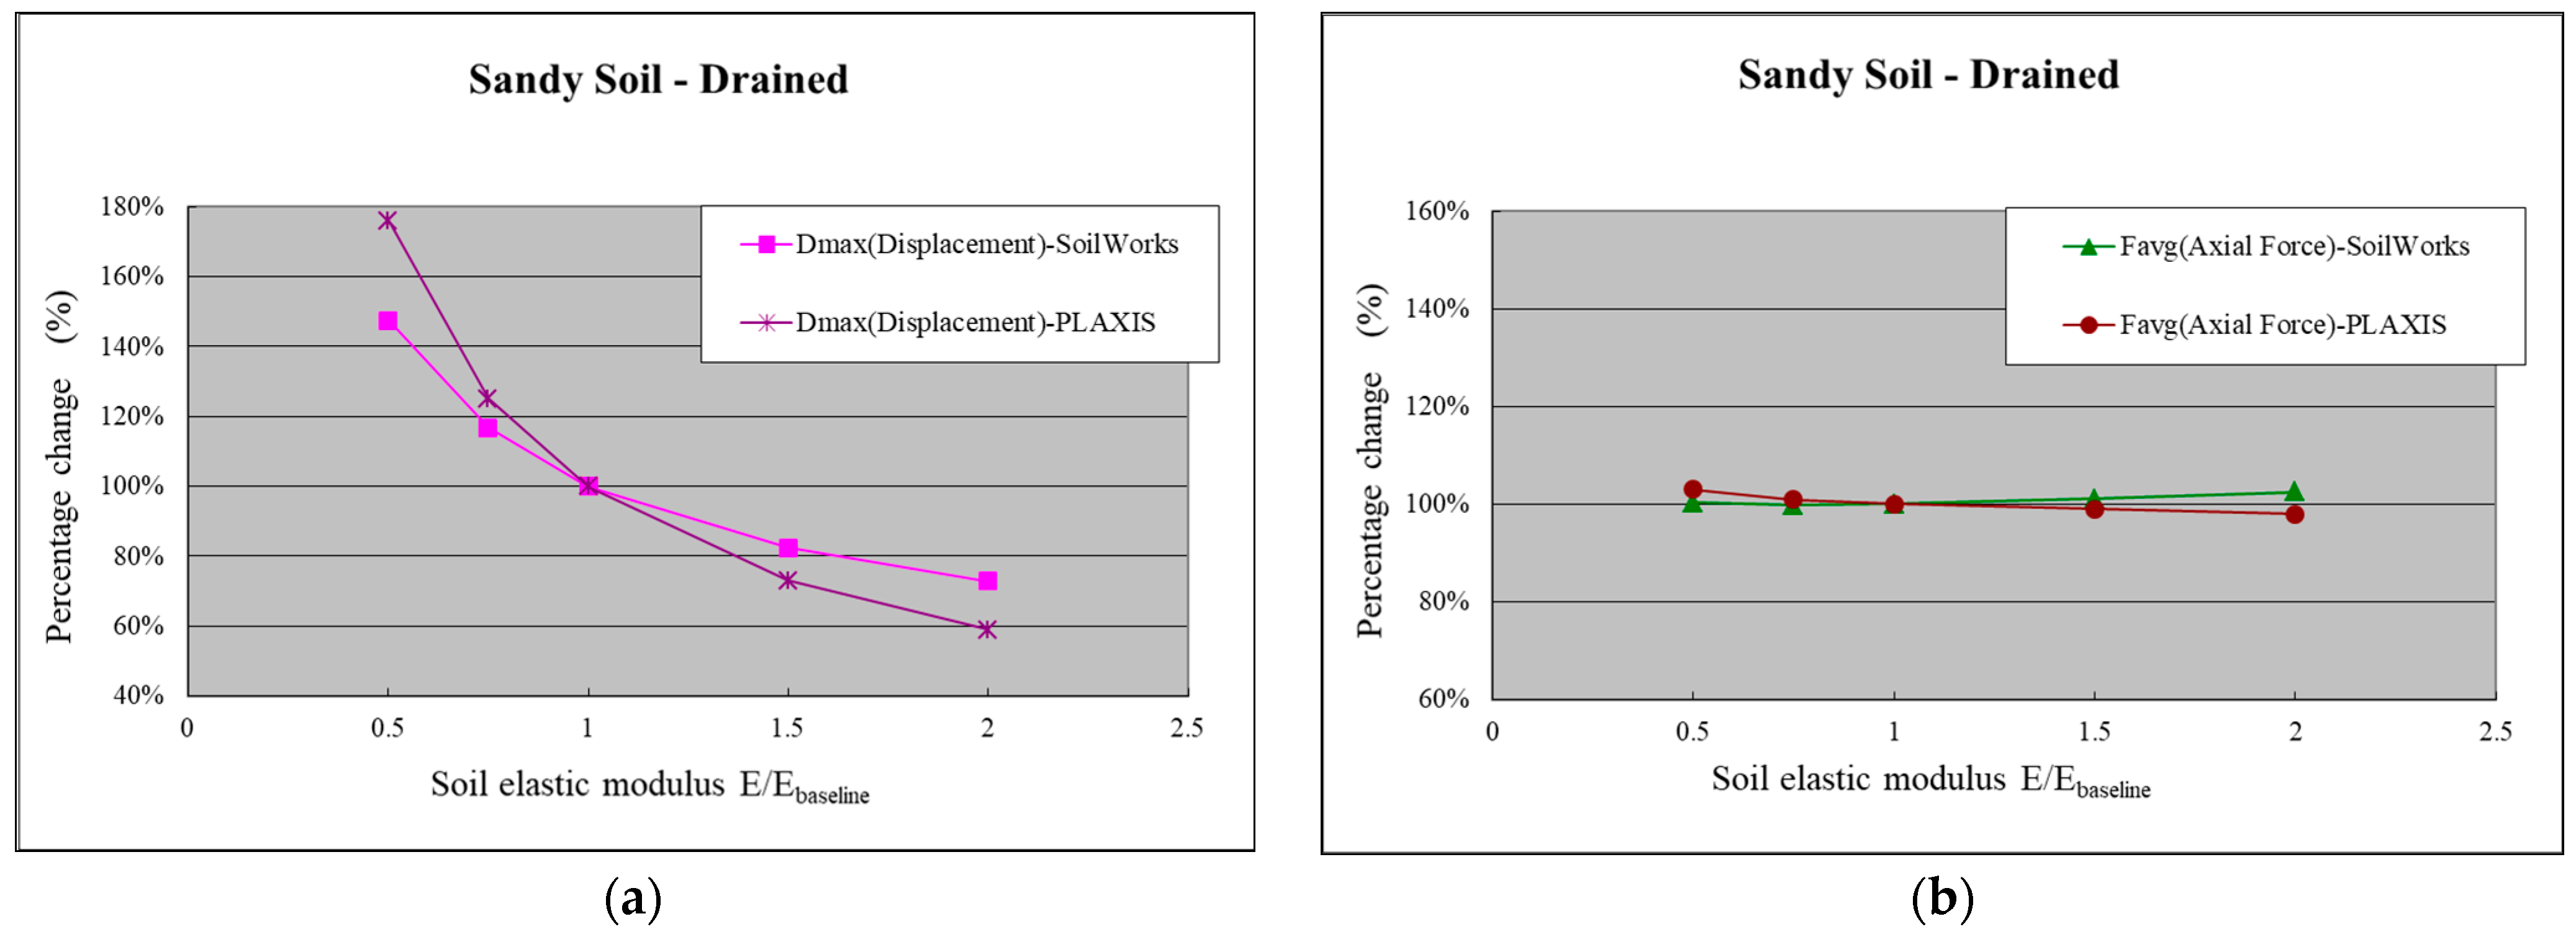
Figure 14.
Comparison of the sensitivity diagram to clay-undrained (a) SoilWorks programs to elastic modulus (Mmax, Dmax and Favg) ;(b) PLAXIS and SoilWorks programs to elastic modulus (Mmax).
Figure 14.
Comparison of the sensitivity diagram to clay-undrained (a) SoilWorks programs to elastic modulus (Mmax, Dmax and Favg) ;(b) PLAXIS and SoilWorks programs to elastic modulus (Mmax).
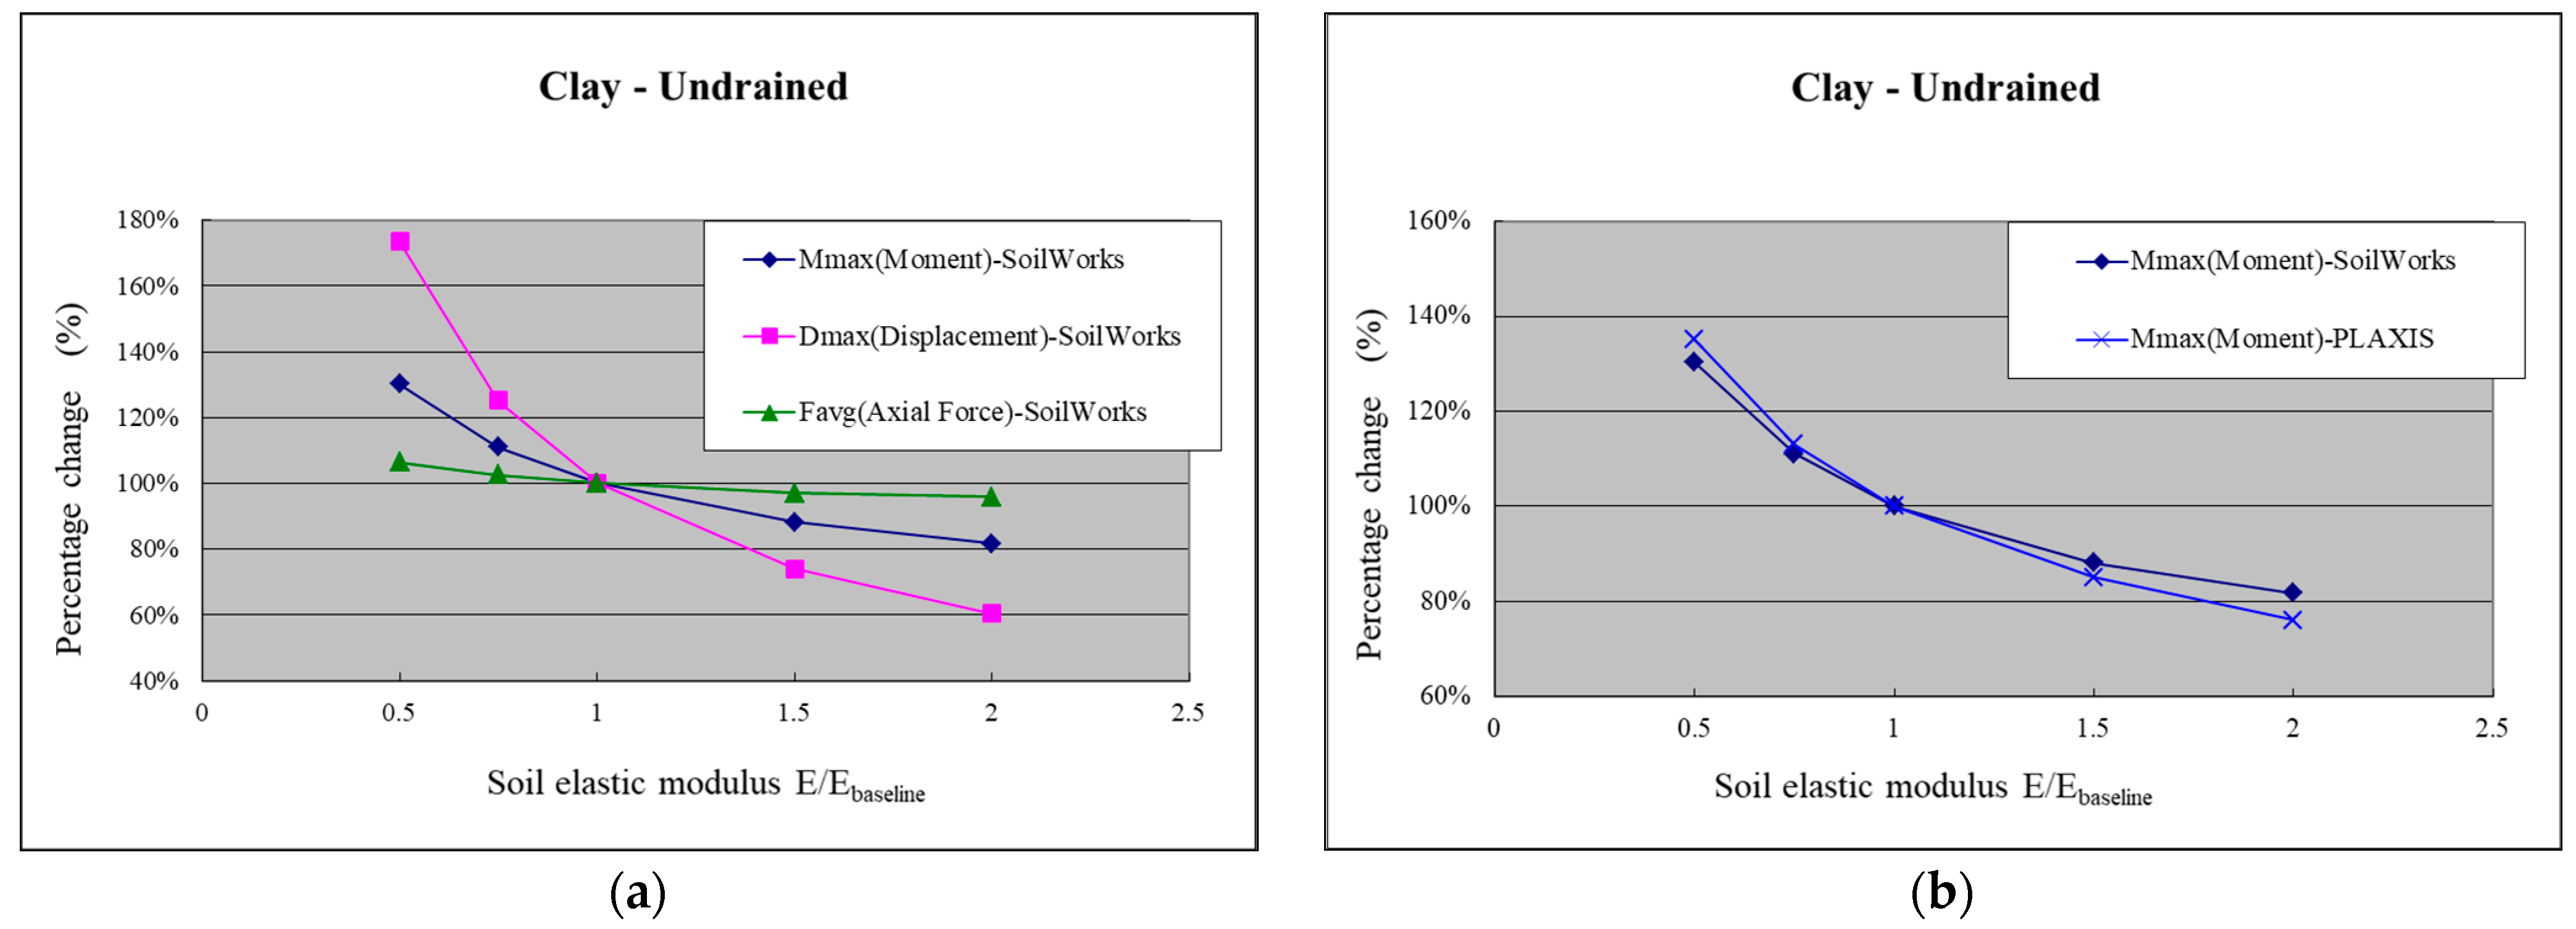
Figure 15.
Comparison of the sensitivity of PLAXIS and SoilWorks programs to clay-undrained (a) elastic modulus (Dmax); (b) elastic modulus (Favg).
Figure 15.
Comparison of the sensitivity of PLAXIS and SoilWorks programs to clay-undrained (a) elastic modulus (Dmax); (b) elastic modulus (Favg).
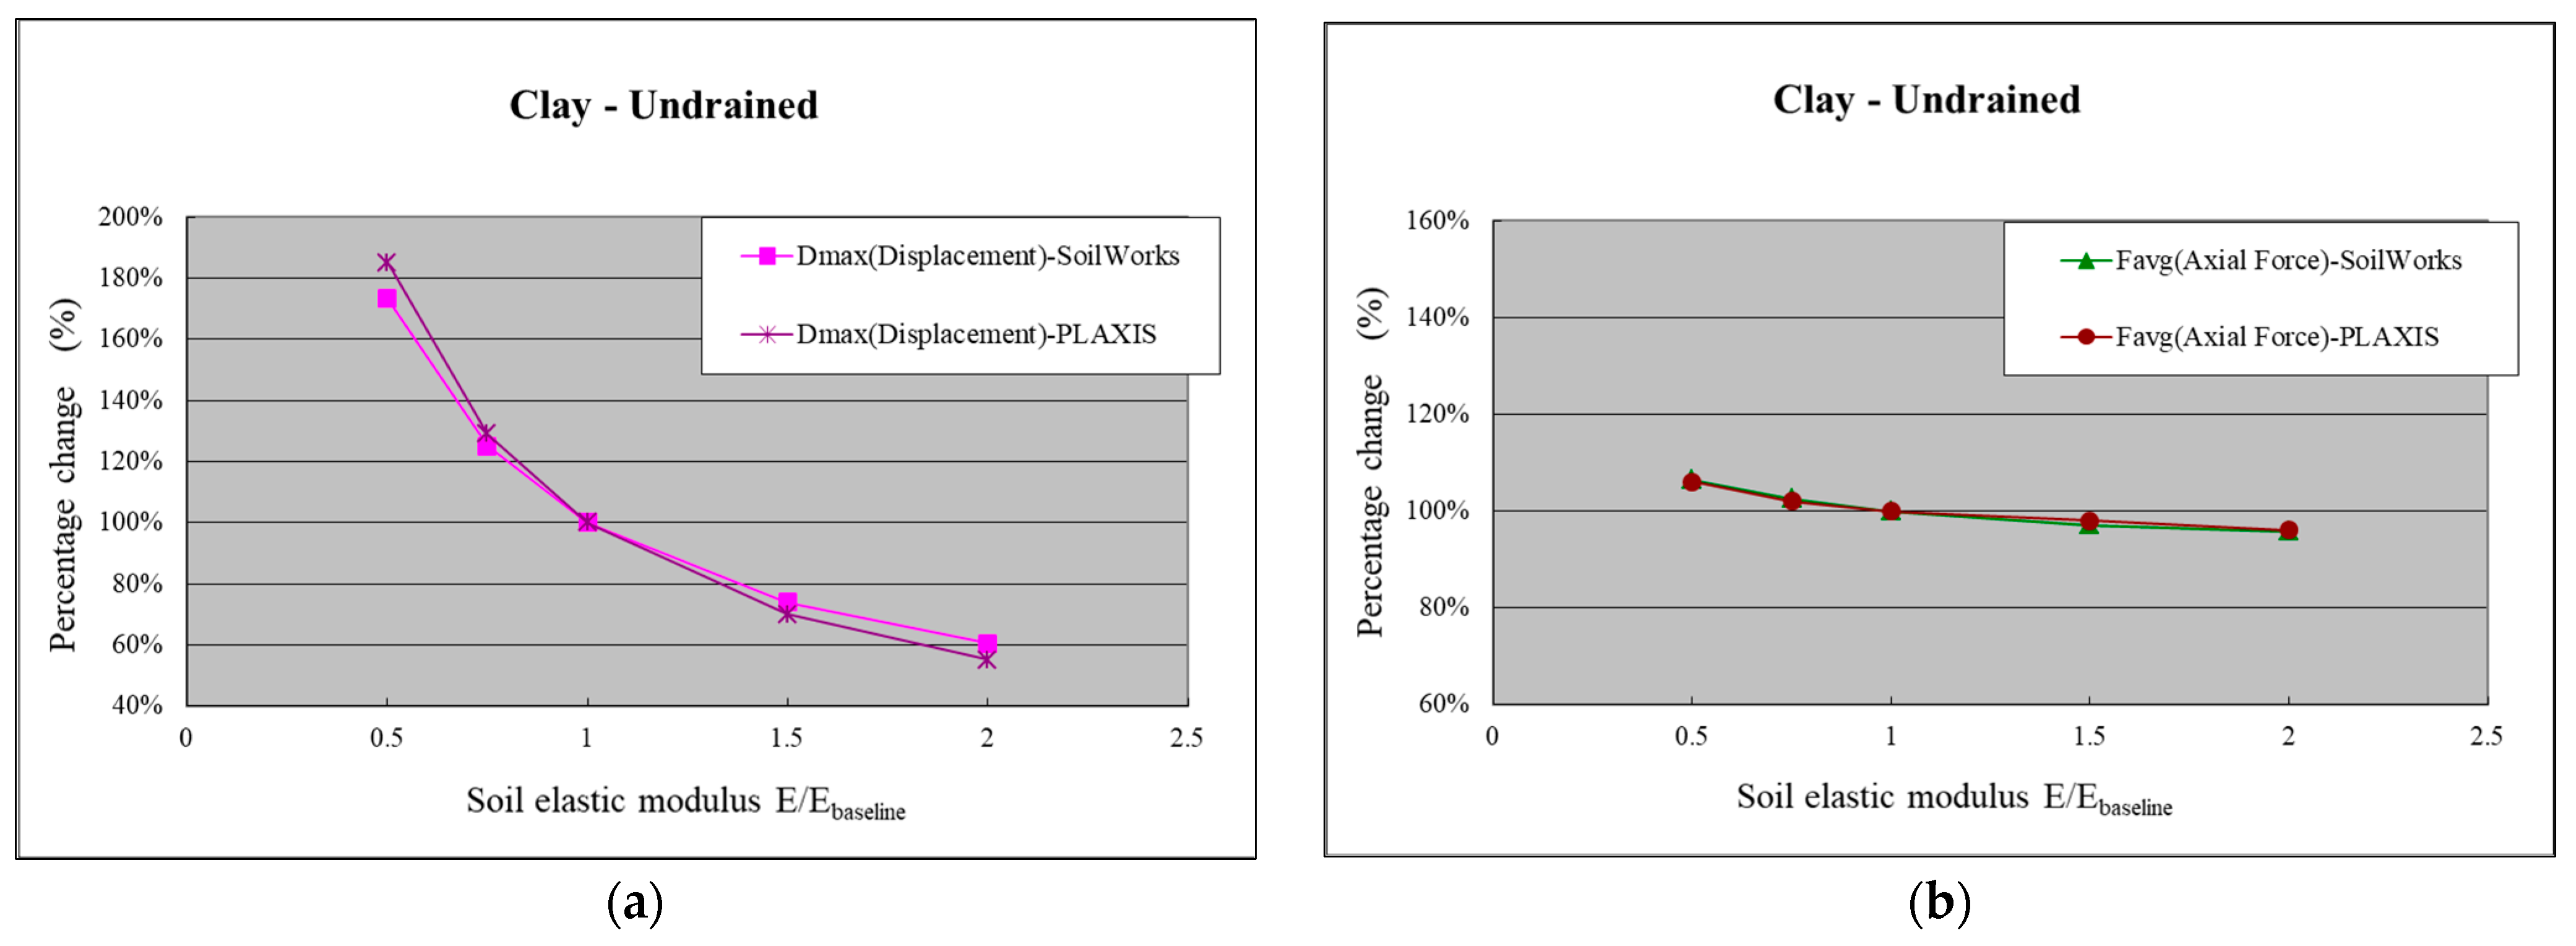
Figure 16.
Comparison of the sensitivity diagram to clay-drained (a) SoilWorks programs to elastic modulus (Mmax, Dmax and Favg) ;(b) PLAXIS and SoilWorks programs to elastic modulus (Mmax).
Figure 16.
Comparison of the sensitivity diagram to clay-drained (a) SoilWorks programs to elastic modulus (Mmax, Dmax and Favg) ;(b) PLAXIS and SoilWorks programs to elastic modulus (Mmax).
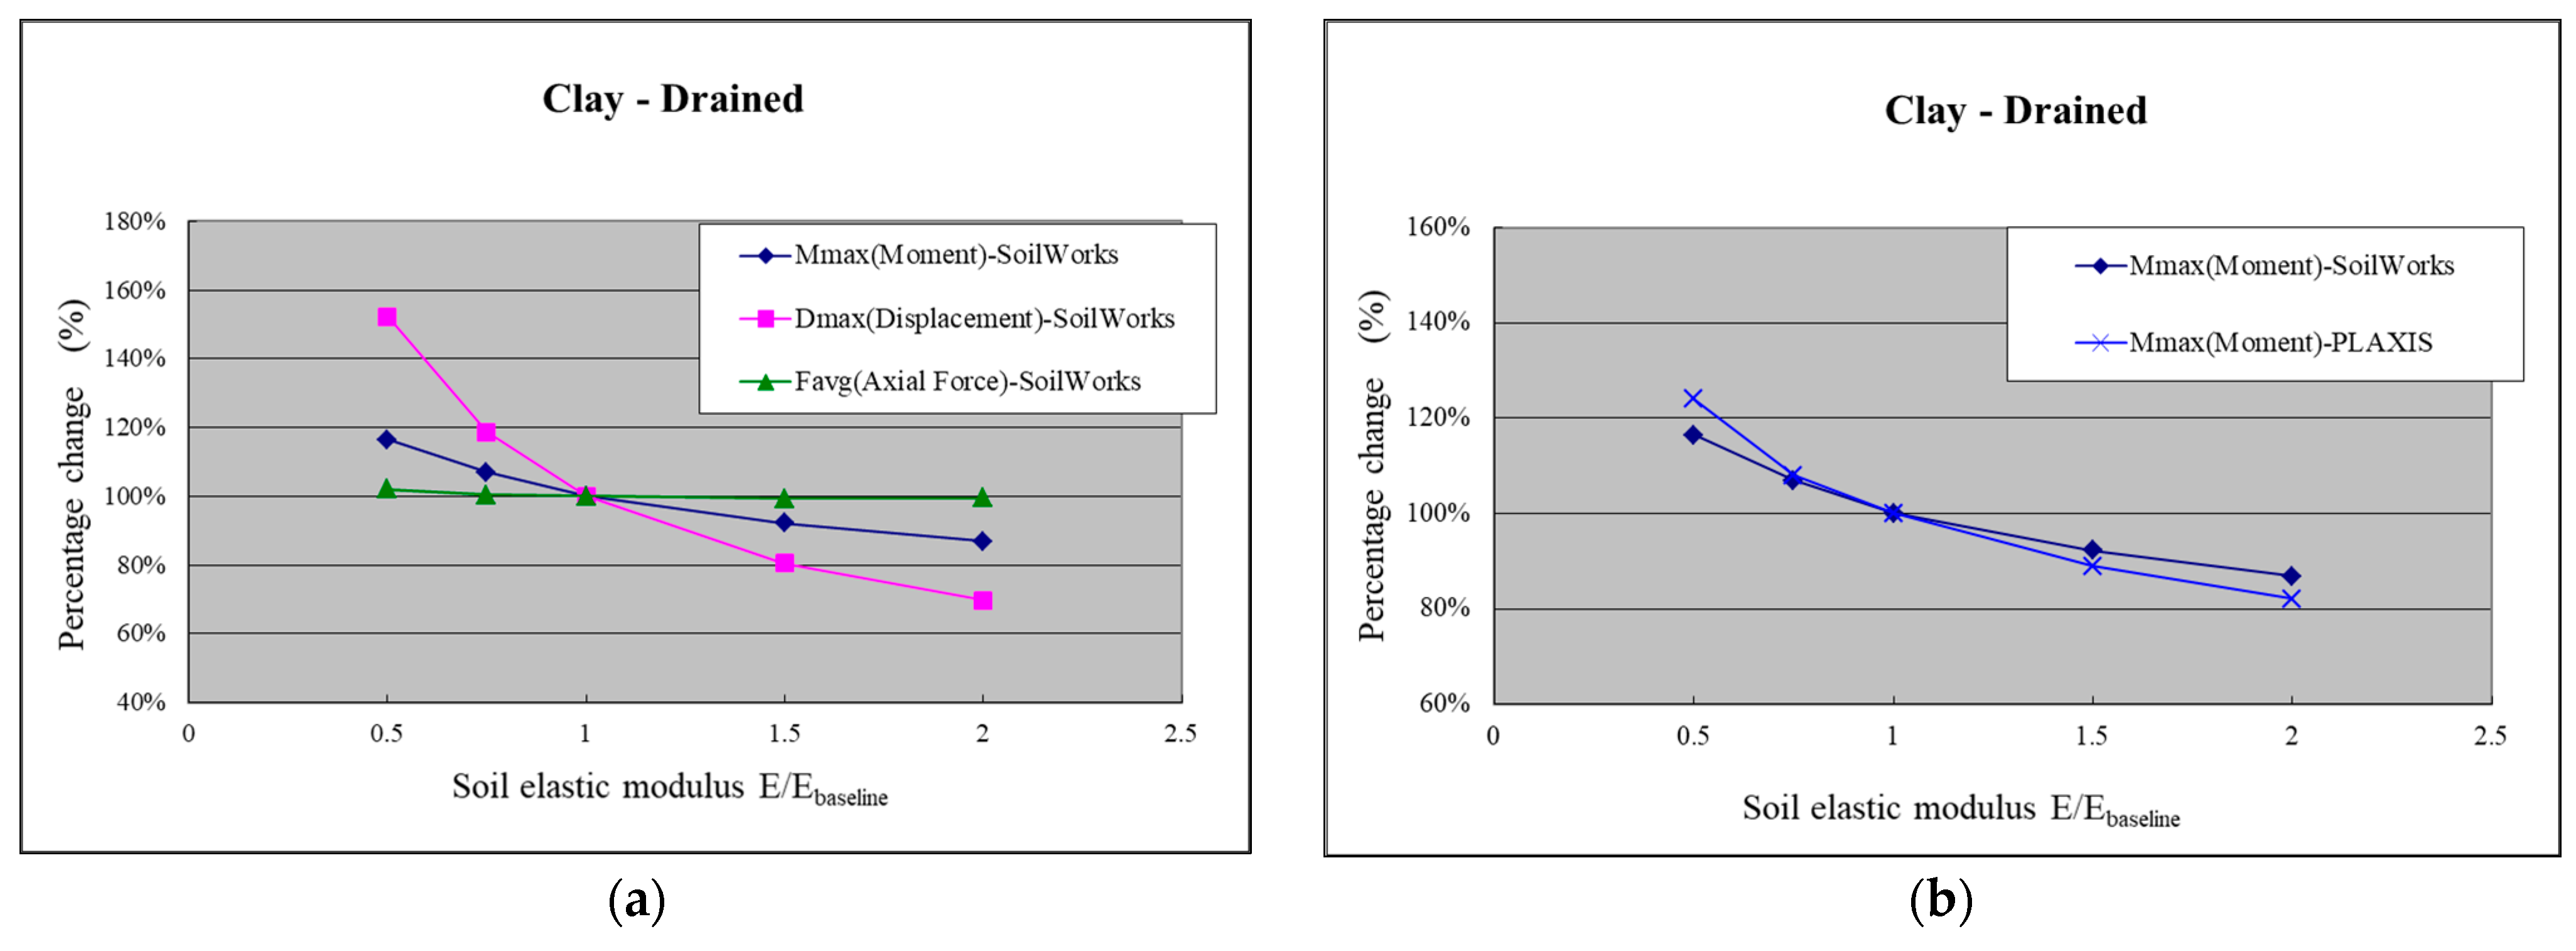
Figure 17.
Comparison of the sensitivity of PLAXIS and SoilWorks programs to clay-drained (a) elastic modulus (Dmax); (b) elastic modulus (Favg).
Figure 17.
Comparison of the sensitivity of PLAXIS and SoilWorks programs to clay-drained (a) elastic modulus (Dmax); (b) elastic modulus (Favg).
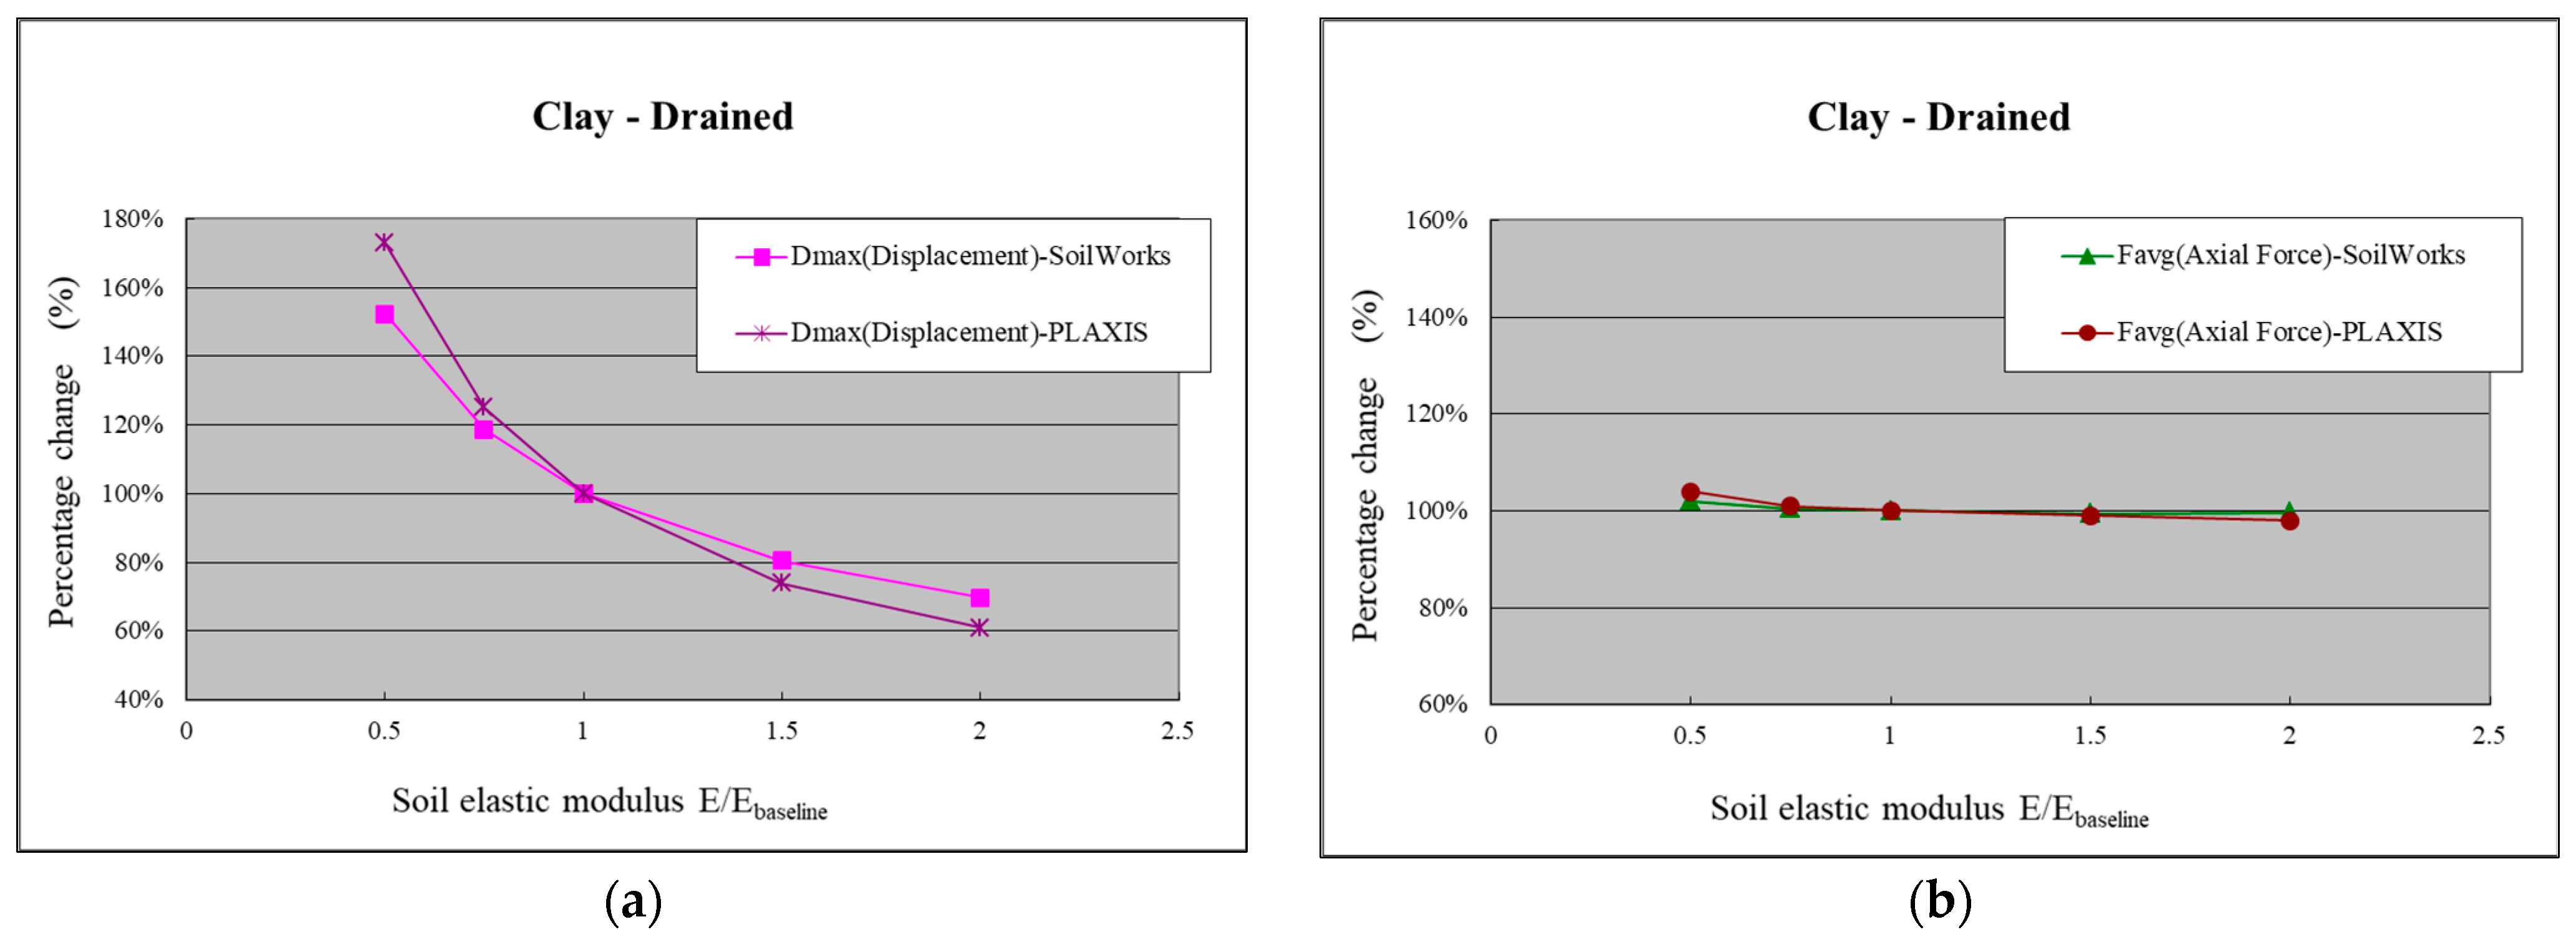
Figure 18.
SoilWorks simulation analysis model of Case 1.
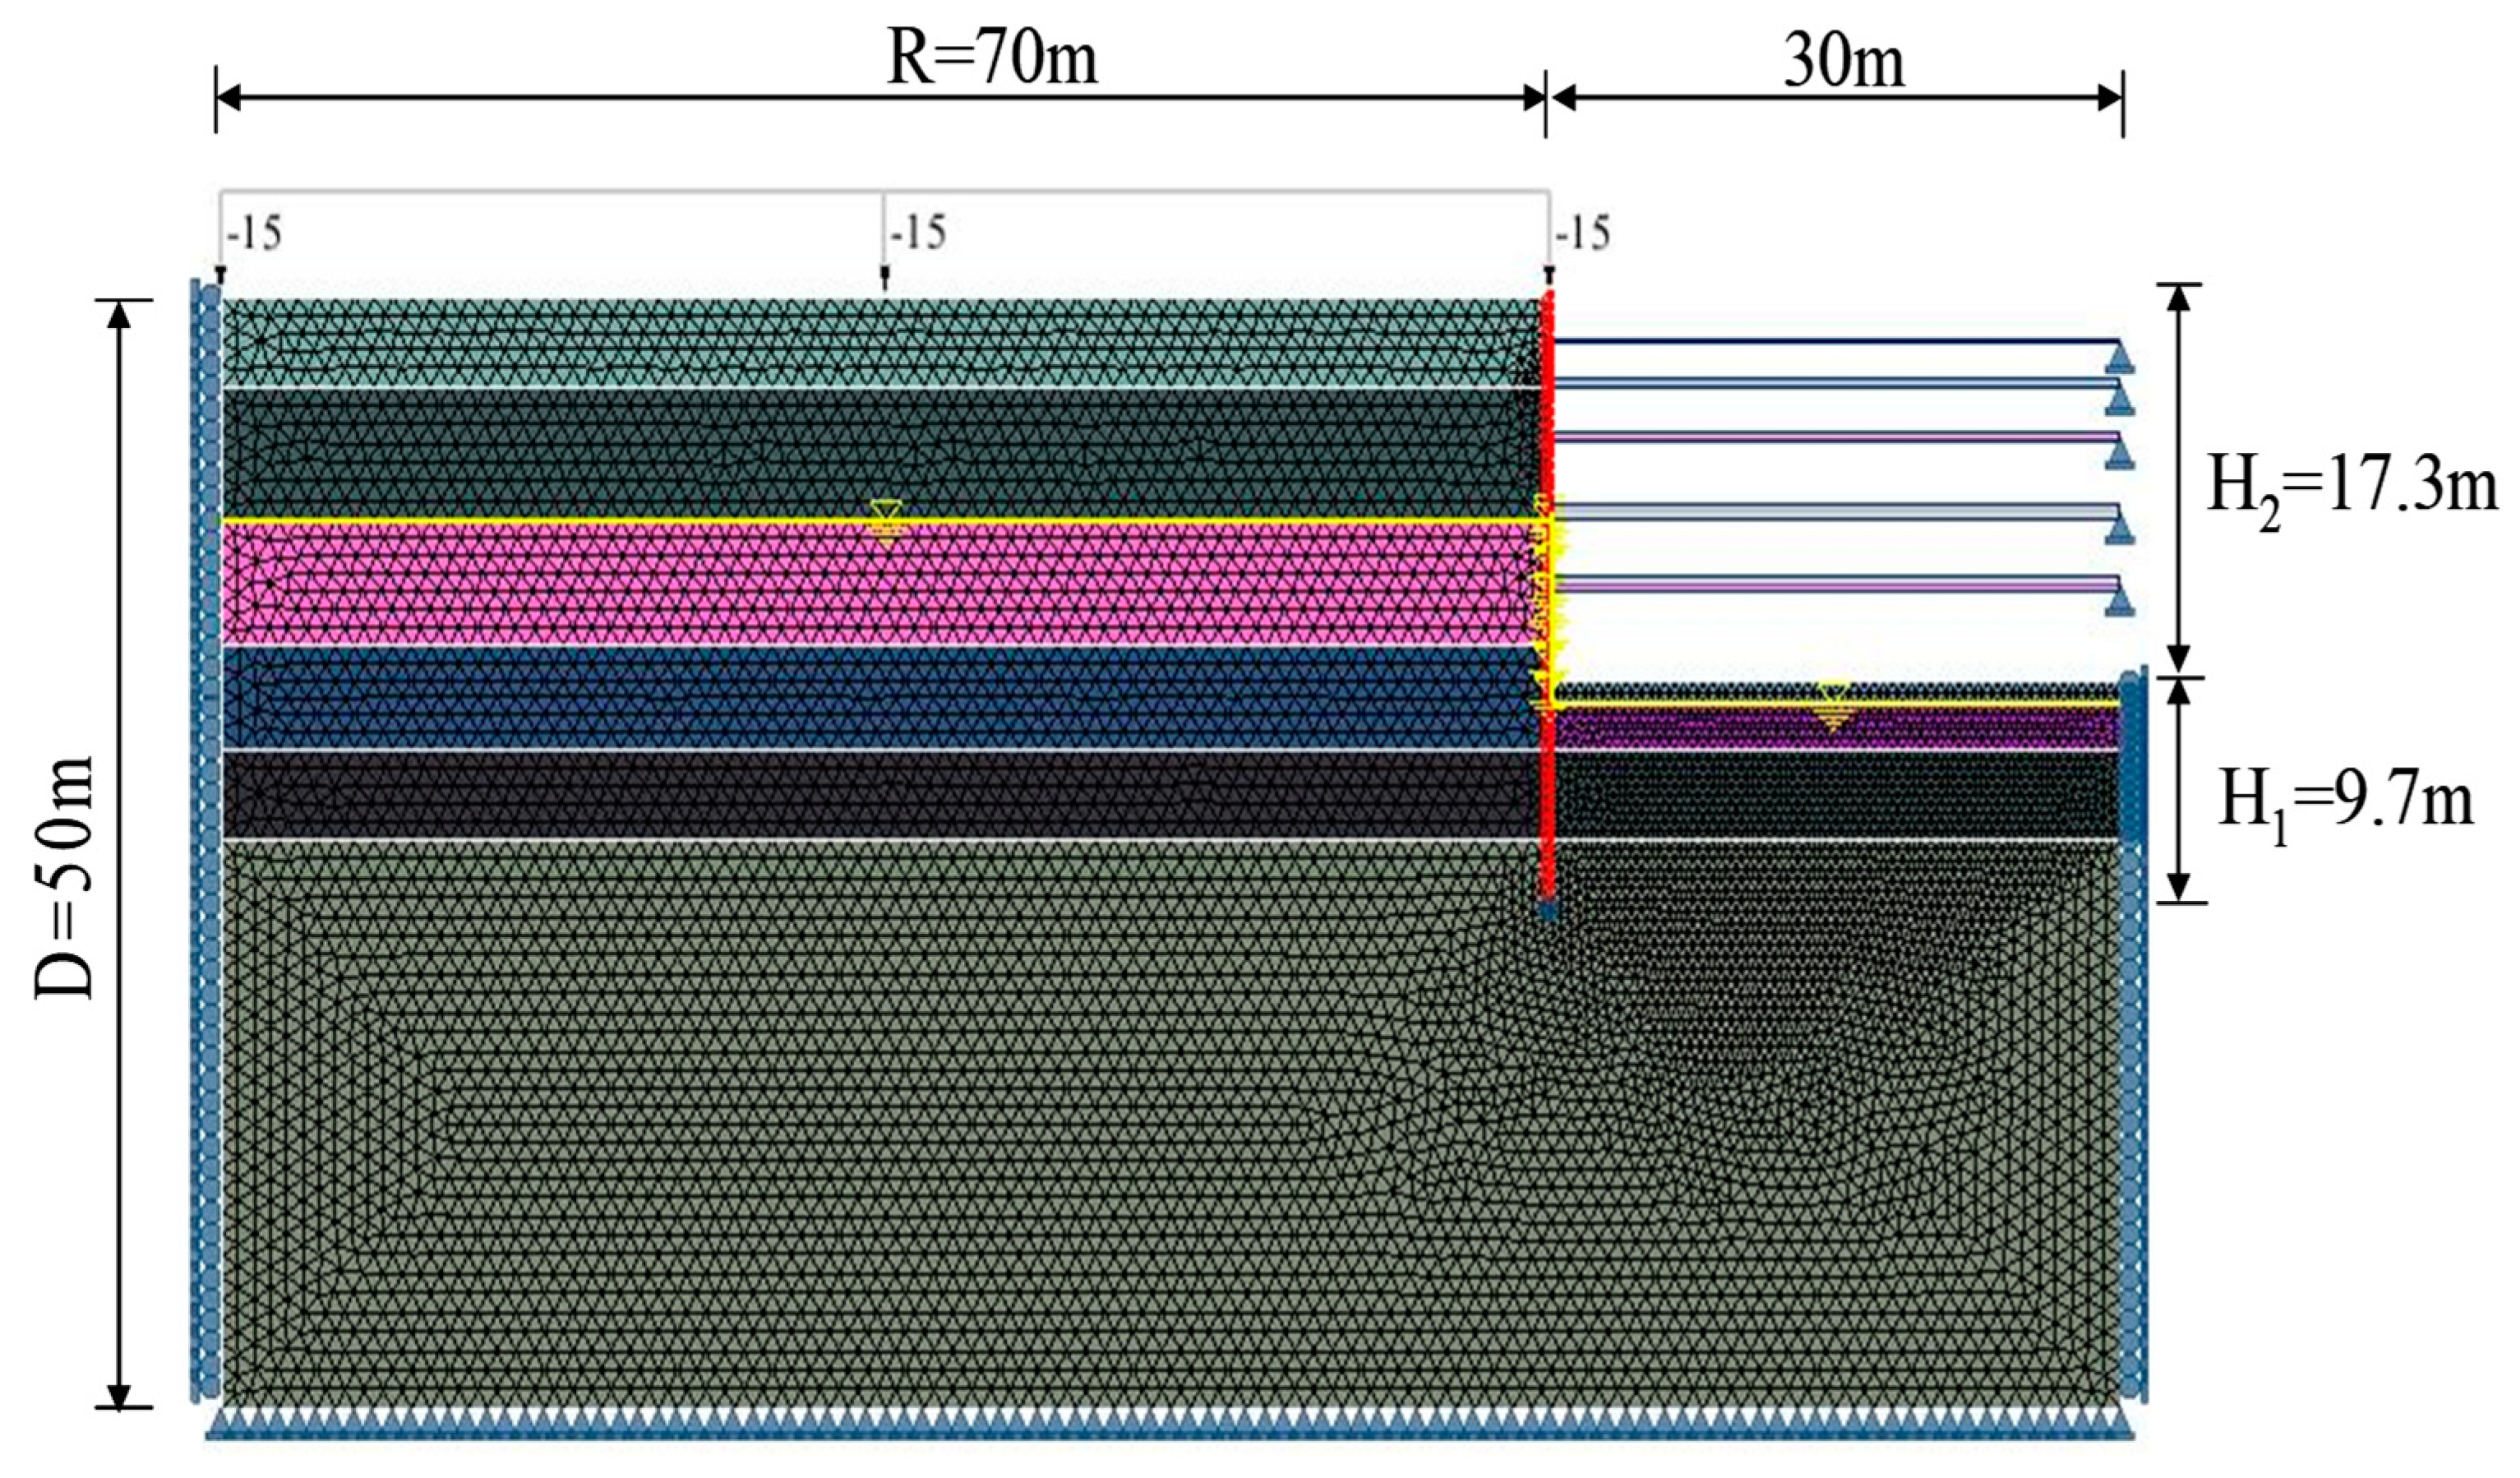
Figure 19.
SoilWorks Simulation Analysis Model of Case 3.
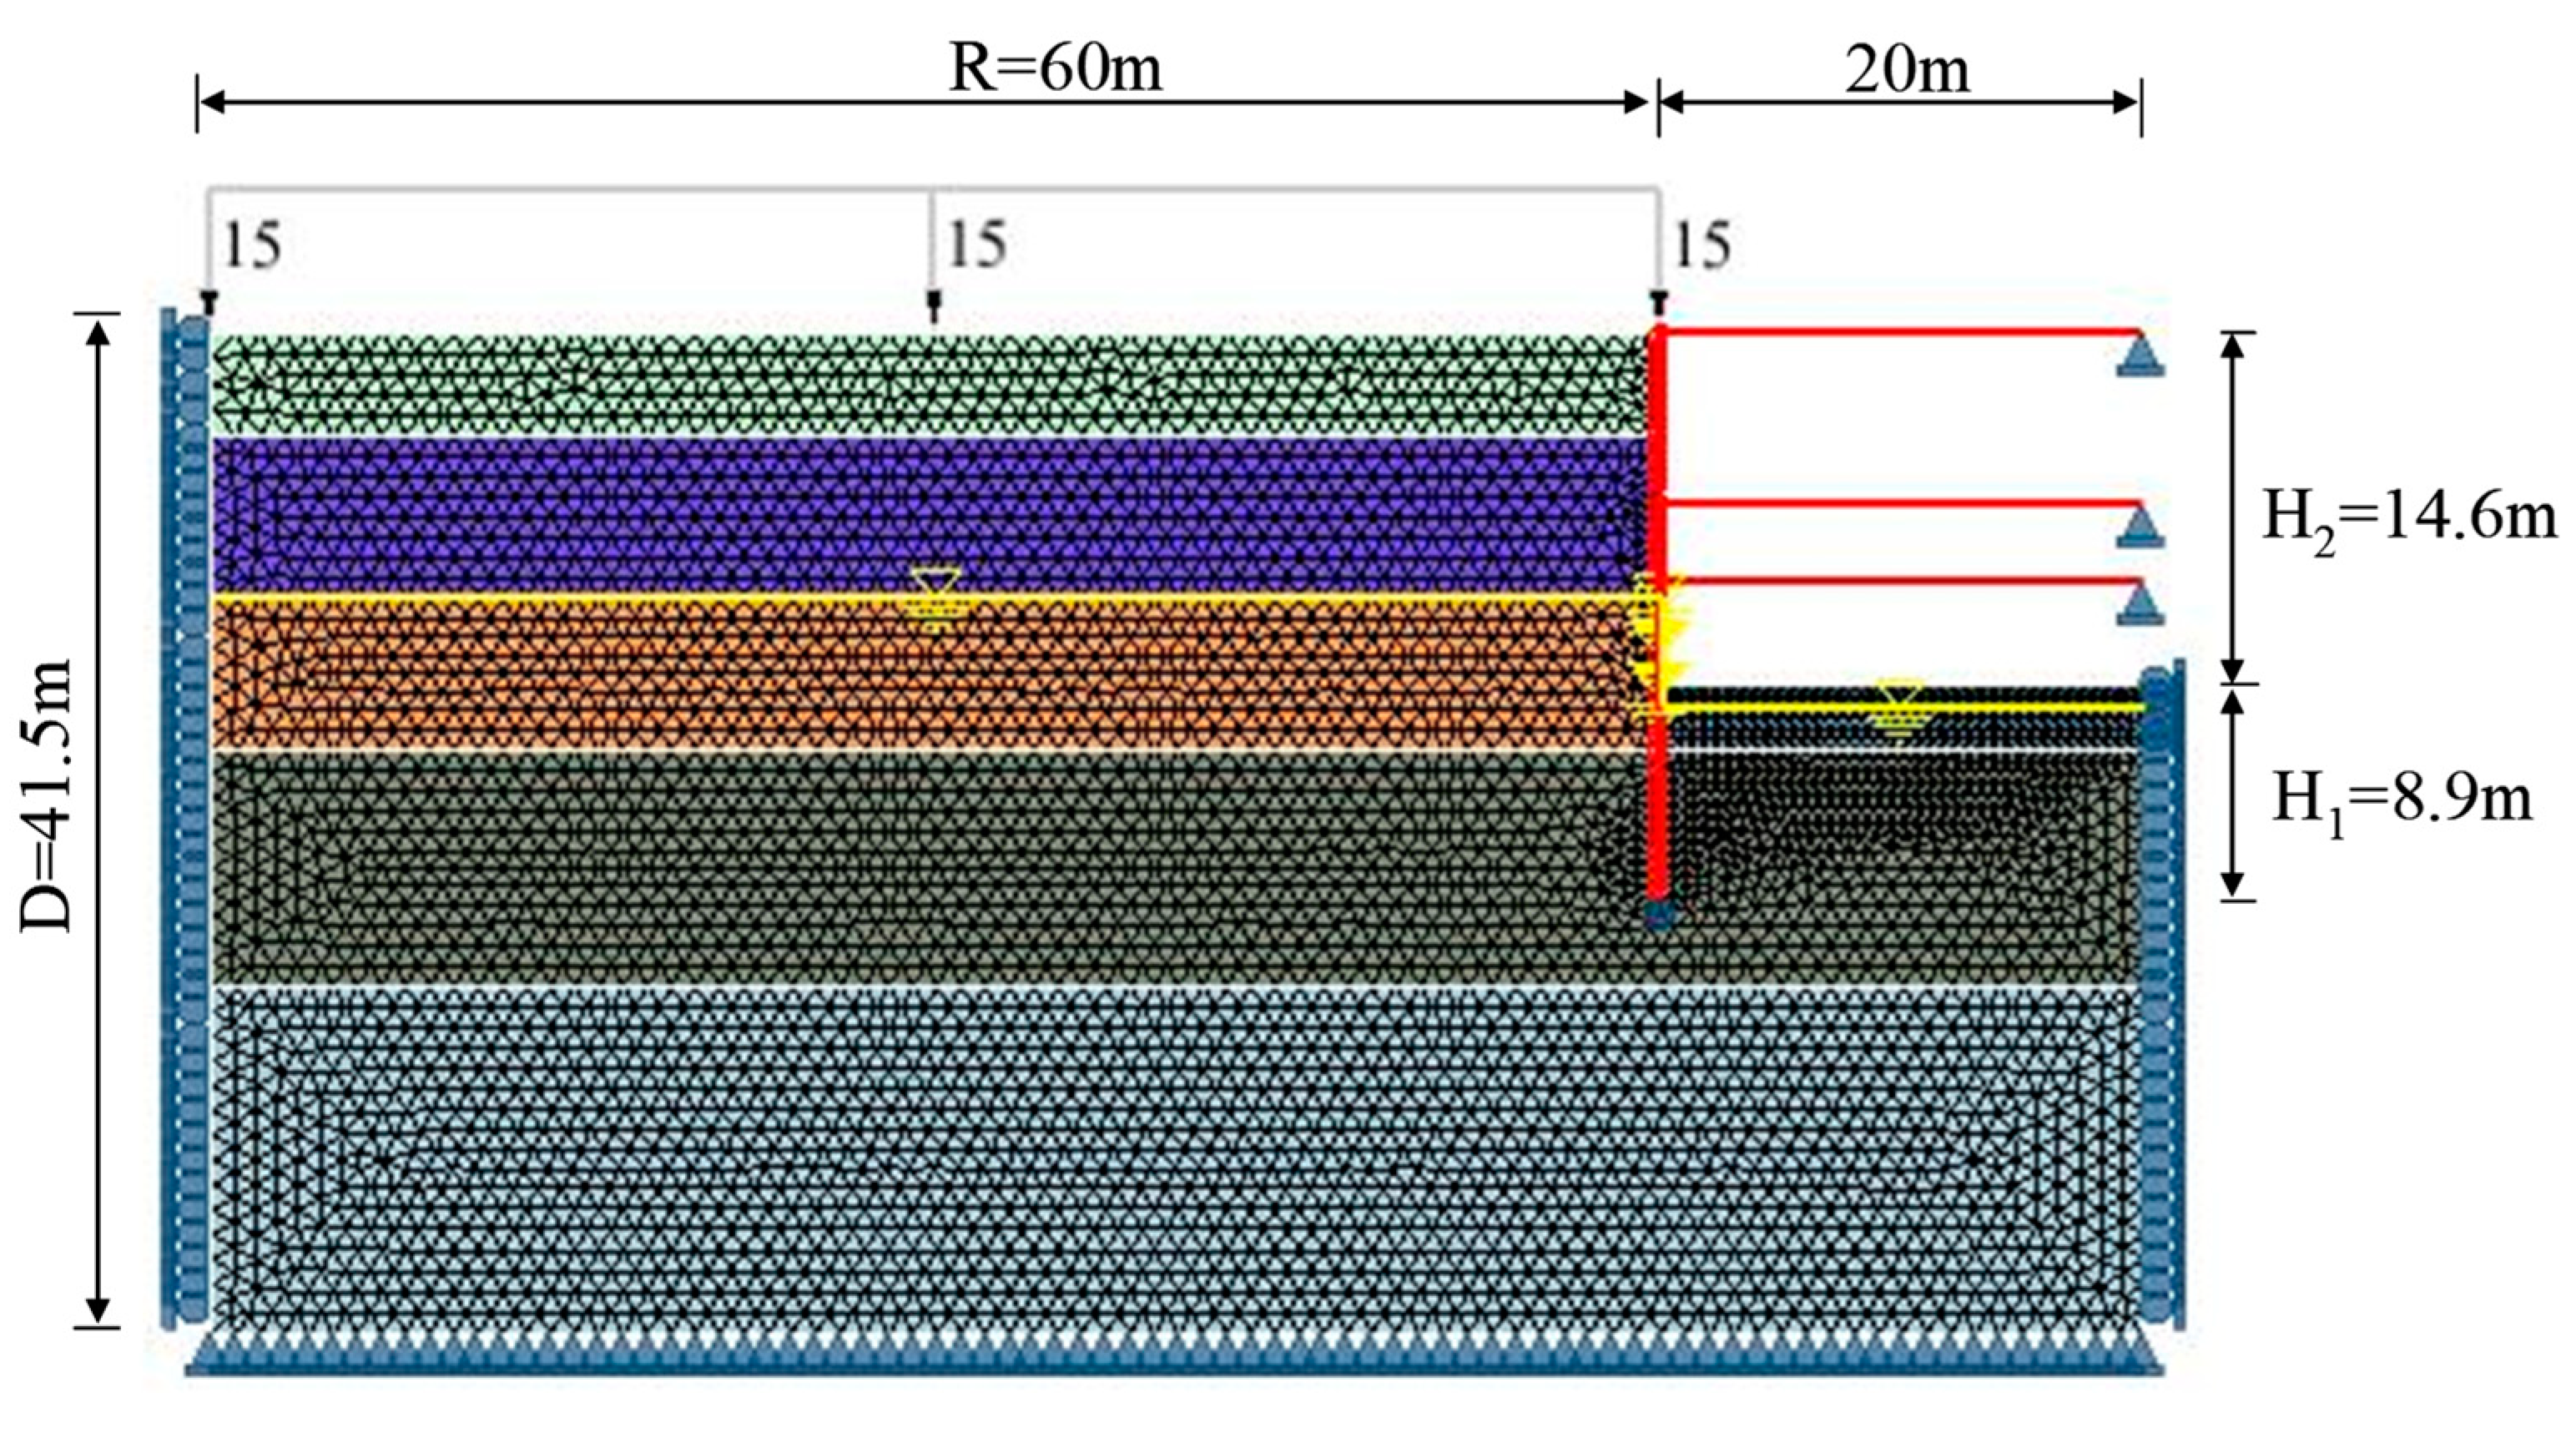
Figure 20.
Displacement Vector Diagram of Final Excavation Stage of Case 1 (SoilWorks).
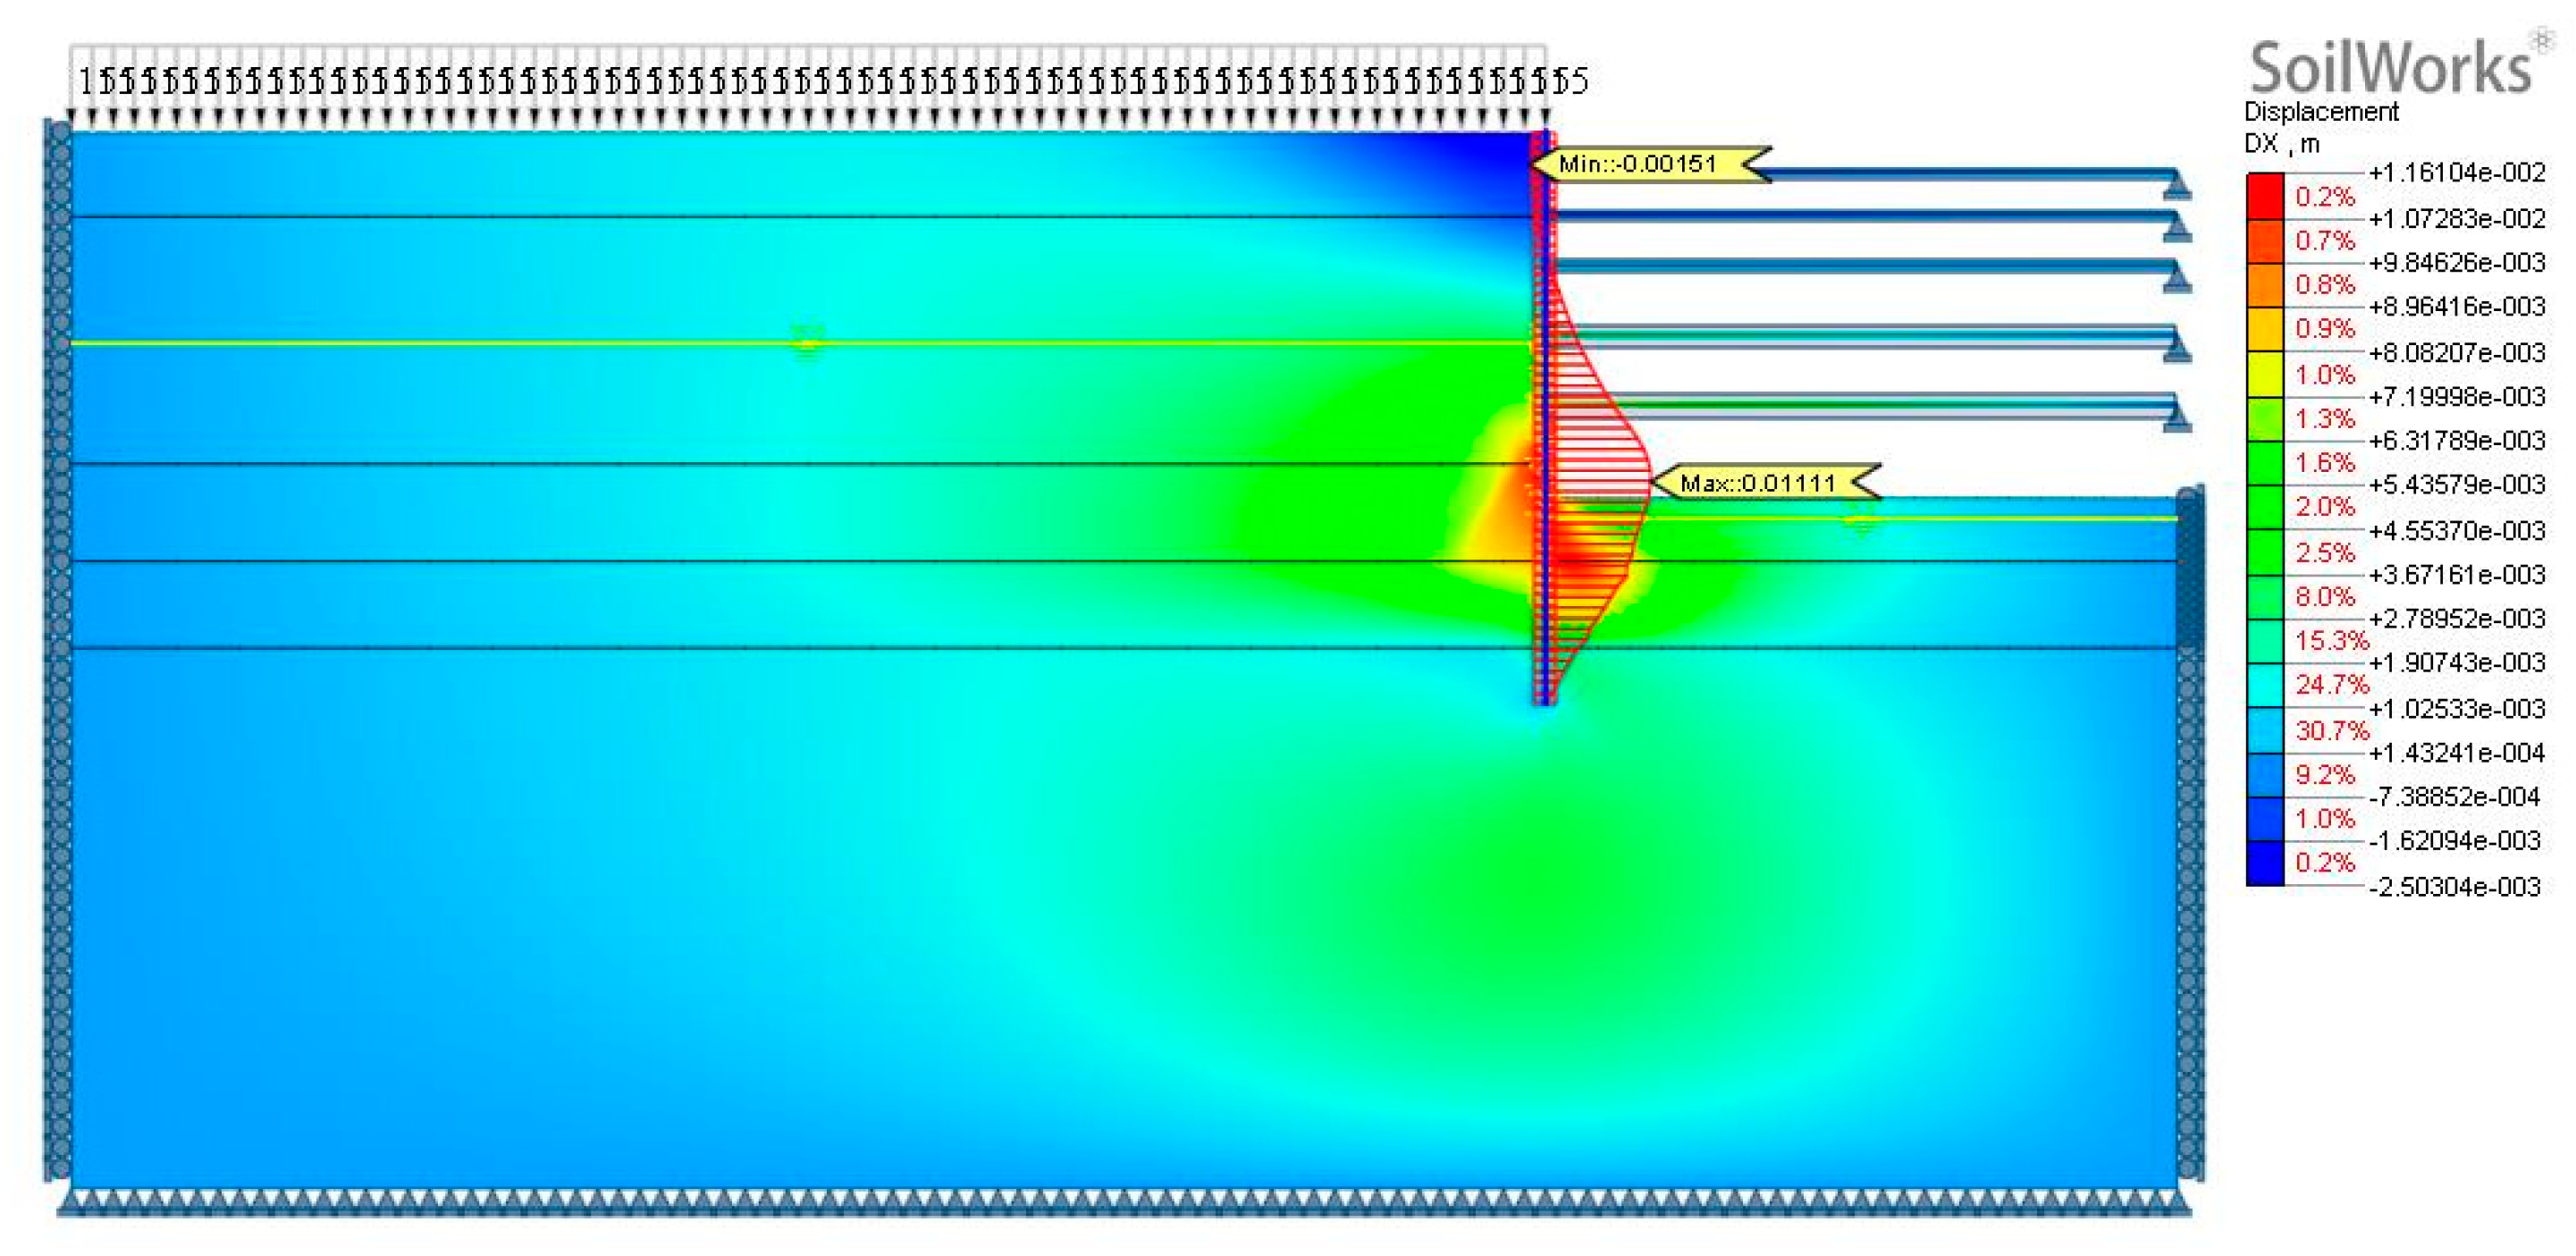
Figure 21.
Displacement Vector Diagram of Final Excavation Stage of Case 3 (SoilWorks).
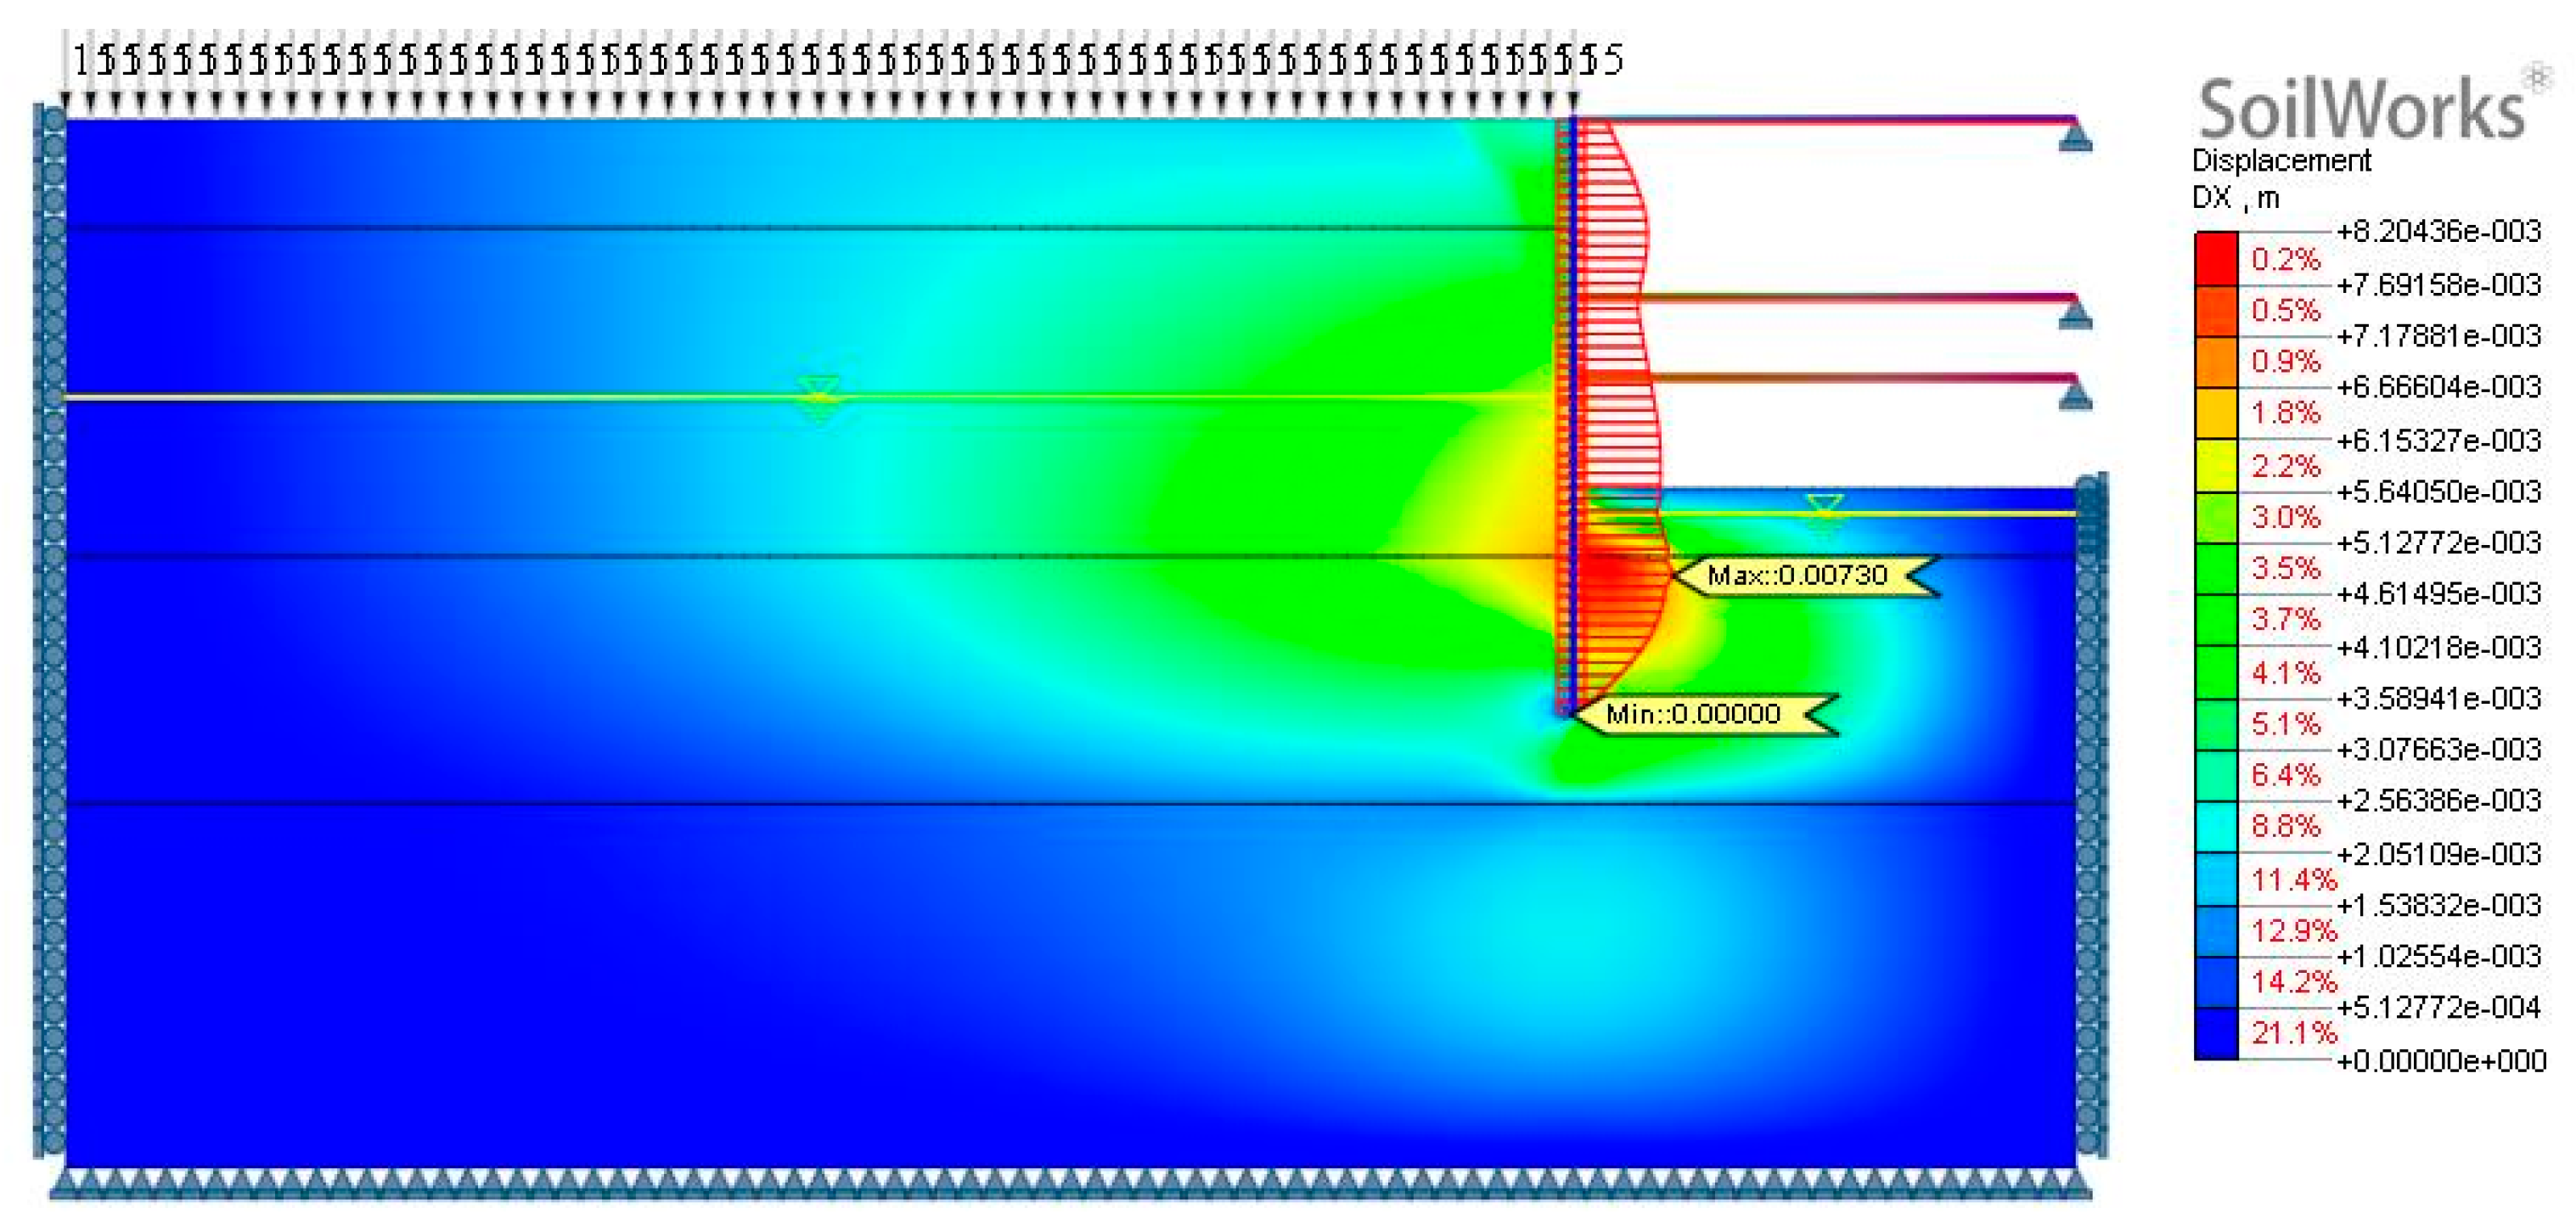
Figure 22.
Comparison diagram of lateral displacement in the final excavation stage of (a) Case 1; (b) Case 3 by SoilWorks.
Figure 22.
Comparison diagram of lateral displacement in the final excavation stage of (a) Case 1; (b) Case 3 by SoilWorks.
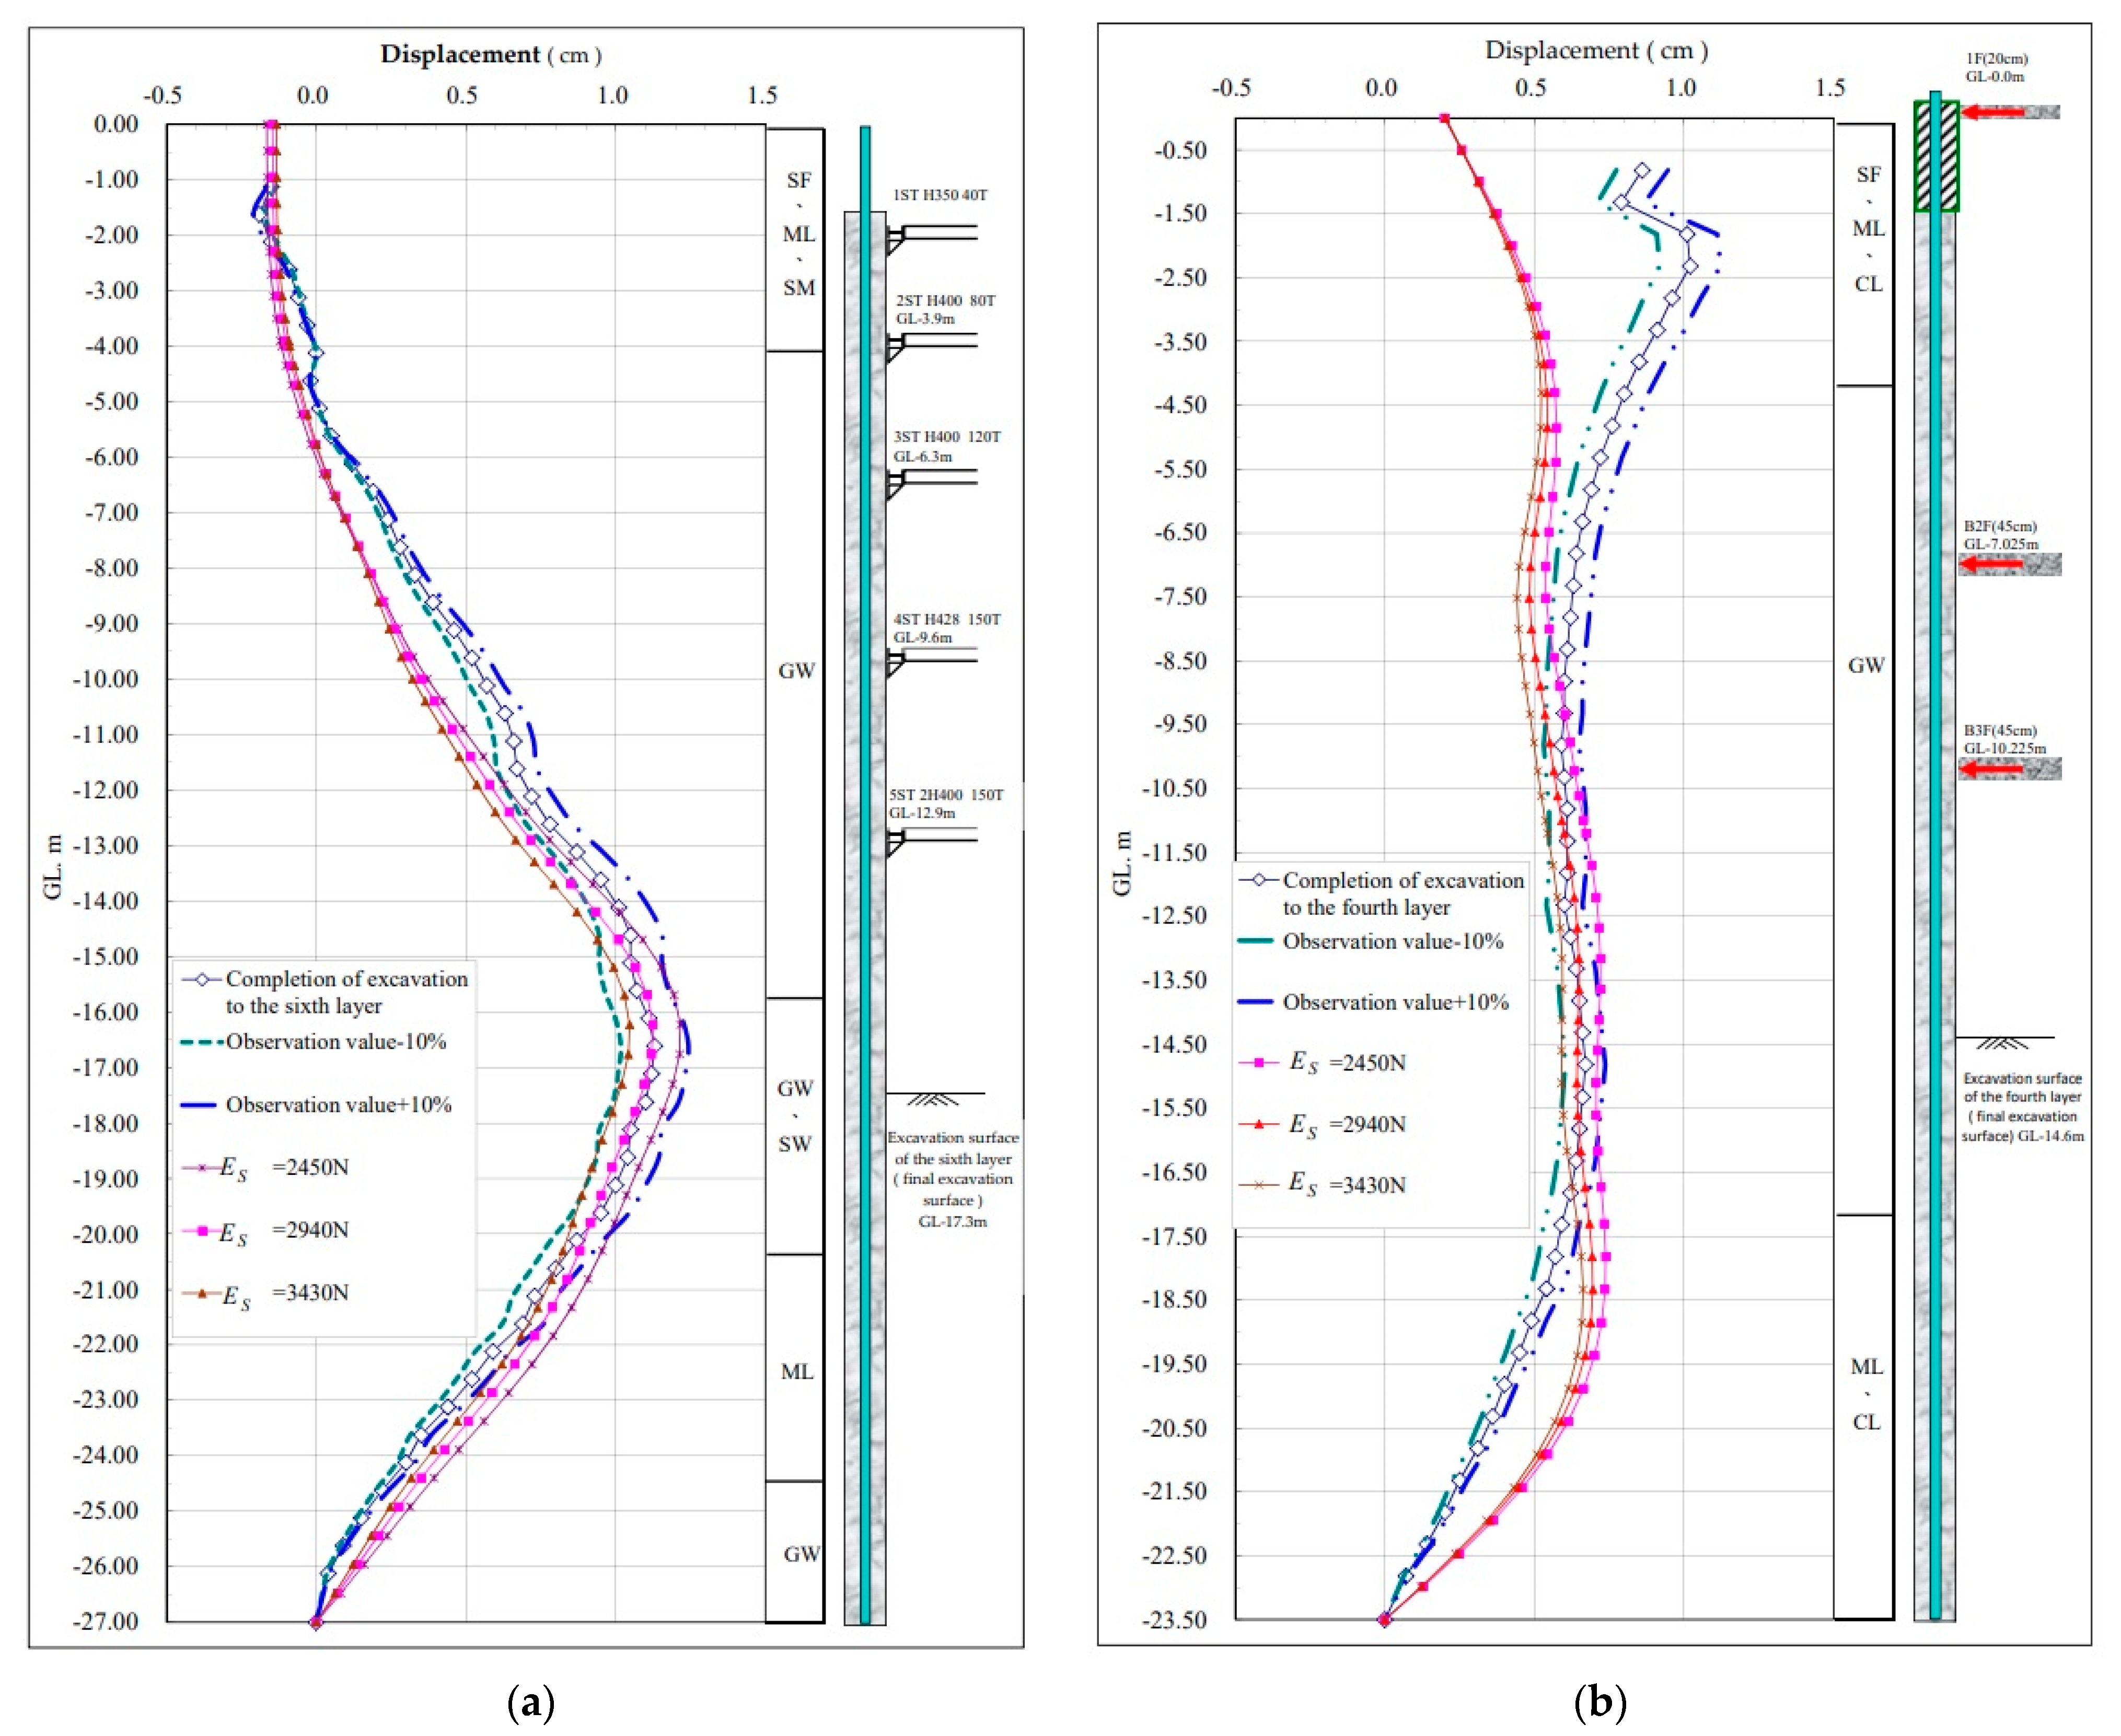
Table 1.
Input form of soil layer strength parameters in Case 1.
| Depth (m) | Soil Classification |
Use N Value | (kN/m2) |
Φ’ (o) |
γunsat (kN/m3) |
γsat (kN/m3) |
Es (kN/m2) |
υ |
|---|---|---|---|---|---|---|---|---|
| 0.0~4.0 | SF, ML, SM | 5 | 0 | 30 | 19.3 | 19.5 | 15,000 N | 0.33 |
| 4.0~15.7 | GW | 40 | 4.9 | 38 | 21.6 | 22.0 | 7840 N–9800 N | 0.28 |
| 15.7~20.3 | GW, SW | 35 | 0 | 38 | 21.1 | 21.4 | 7840 N–9800 N | 0.28 |
| 20.3~24.4 | ML | 16 | 0 | 32 | 19.4 | 19.7 | 100,000 N | 0.32 |
| 24.4~33.0 | GW | 100 | 9.8 | 40 | 22.1 | 22.3 | 7840 N–9800 N | 0.26 |
Table 2.
Input form of soil layer strength parameters in Case 2.
| Depth (m) | Soil Classification |
Use N Value |
(kN/m2) |
Φ’ (o) |
γunsat (kN/m3) |
γsat (kN/m3) |
Es (kN/m2) |
υ |
|---|---|---|---|---|---|---|---|---|
| 0.0~3.7 | SF, ML | 7 | 0 | 30 | 19.4 | 19.5 | 24,000 N | 0.33 |
| 3.7~16.1 | GW | 40 | 4.9 | 38 | 21.9 | 22.0 | 7840 N–9800 N | 0.28 |
| 16.1~19.5 | GM, SM | 23 | 0 | 34 | 21.1 | 21.4 | 7840 N–9800 N | 0.31 |
| 19.5~24.4 | ML | 13 | 0 | 31 | 19.5 | 19.7 | 100,000 N | 0.33 |
| 24.4~35.5 | GP, GM | 100 | 9.8 | 40 | 22.1 | 22.3 | 7840 N–9800 N | 0.26 |
Table 3.
Diaphragm wall strength parameter input form of Case 1.
| Thickness (m) | E (kN/m2) | I (m4/m) | Reduction Factor | 0.7EA (kN/m) | 0.7EI (kNm2/m) |
|---|---|---|---|---|---|
| 0.7 | 2.35 × 10⁷ | 0.028583 | 0.7 | 1.13 × 10⁷ | 4.60 × 10⁵ |
Table 4.
Support parameter input form of Case 1.
| Number of Supporting Layers |
Supporting Position |
Model | A (cm2) | 0.7EA (kN) | Preload (kN/m) |
|---|---|---|---|---|---|
| 1ST | GL.−1.9 m | 1 × H 350 | 173.9 | 2.51 × 10⁶ | 65 |
| 2ST | GL.−3.9 m | 1 × H 400 | 218.7 | 3.15 × 10⁶ | 131 |
| 3ST | GL.−6.3 m | 1 × H 400 | 218.7 | 3.15 × 10⁶ | 196 |
| 4ST | GL.−9.6 m | 2 × H 400 | 437.4 | 6.30 × 10⁶ | 245 |
| 5ST | GL.−12.9 m | 2 × H 400 | 437.4 | 6.30 × 10⁶ | 245 |
Table 5.
Diaphragm wall strength parameter input table for Case 2.
| Thickness (m) | E (kN/m2) | I (m4/m) | Reduction Factor | 0.7EA (kN/m) | 0.7EI (kNm2/m) |
|---|---|---|---|---|---|
| 0.6 | 2.35 × 10⁷ | 0.018 | 0.7 | 9.66 × 10⁶ | 2.90 × 10⁵ |
Table 6.
Support parameter input form of Case 2.
| Number of Supporting Layers | Supporting Position |
Model | A (cm2) | 0.7EA (kN) | Preload (kN/m) |
|---|---|---|---|---|---|
| 1ST | GL.−1.8 m | 1 × H 350 | 173.9 | 2.51 × 10⁶ | 82 |
| 2ST | GL.−3.9 m | 1 × H 400 | 218.7 | 3.15 × 10⁶ | 131 |
| 3ST | GL.−8.5 m | 1 × H 428 | 360.65 | 5.20 × 10⁶ | 163 |
Table 7.
Sensitivity analysis results of friction angle for sandy layers.
| SM | Mmax | Percentage Change | Dmax | Percentage Change | Favg | Percentage Change |
|---|---|---|---|---|---|---|
| (kN-m) | (%) | (mm) | (%) | (kN/m) | (%) | |
| 0.8Φ | 392.24 | 121% | 40.840 | 124% | 278.8 | 114% |
| 0.9Φ | 353.90 | 110% | 36.116 | 110% | 260.4 | 106% |
| 1.0Φ | 323.07 | 100% | 32.872 | 100% | 245.4 | 100% |
| 1.1Φ | 300.21 | 93% | 30.852 | 94% | 233.4 | 95% |
| 1.2Φ | 282.78 | 88% | 29.664 | 90% | 223.3 | 91% |
Table 8.
Sensitivity of friction angle for sandy layers in PLAXIS and SoilWorks.
| SM |
Mmax Percentage Change |
Dmax Percentage Change |
Favg Percentage Change |
|||
|---|---|---|---|---|---|---|
| SoilWorks | PLAXIS | SoilWorks | PLAXIS | SoilWorks | PLAXIS | |
| 0.8Φ | 121% | 139% | 124% | 157% | 114% | 122% |
| 0.9Φ | 110% | 117% | 110% | 119% | 106% | 108% |
| 1.0Φ | 100% | 100% | 100% | 100% | 100% | 100% |
| 1.1Φ | 93% | 89% | 94% | 91% | 95% | 96% |
| 1.2Φ | 88% | 81% | 90% | 86% | 91% | 93% |
Table 9.
Sensitivity analysis results of friction angle for clay layers (undrained).
| CL (Undrained) | Mmax | Percentage Change | Dmax | Percentage Change | Favg | Percentage Change |
|---|---|---|---|---|---|---|
| (kN-m) | (%) | (mm) | (%) | (kN/m) | (%) | |
| 0.8Φ | 267.27 | 106% | 48.232 | 103% | 252.5 | 105% |
| 0.9Φ | 256.45 | 102% | 47.333 | 101% | 246.1 | 102% |
| 1.0Φ | 251.72 | 100% | 46.867 | 100% | 241.4 | 100% |
| 1.1Φ | 246.78 | 98% | 46.424 | 99% | 236.8 | 98% |
| 1.2Φ | 243.96 | 97% | 46.110 | 98% | 232.5 | 96% |
Table 10.
Sensitivity of friction angle for clay layers (undrained) in PLAXIS and SoilWorks.
| CL (Undrained) |
Mmax Percentage Change |
Dmax Percentage Change |
Favg Percentage Change |
|||
|---|---|---|---|---|---|---|
| SoilWorks | PLAXIS | SoilWorks | PLAXIS | SoilWorks | PLAXIS | |
| 0.8Φ | 106% | 133% | 103% | 129% | 105% | 118% |
| 0.9Φ | 102% | 112% | 101% | 110% | 102% | 107% |
| 1.0Φ | 100% | 100% | 100% | 100% | 100% | 100% |
| 1.1Φ | 98% | 93% | 99% | 95% | 98% | 97% |
| 1.2Φ | 97% | 90% | 98% | 93% | 96% | 96% |
Table 11.
Soil strength parameter input table for Case Study 1 in SoilWorks.
| Depth (m) | Soil Classification | Use N Value |
(kN/m2) |
Φ’ (o) |
(kN/m3) |
(kN/m3) |
(kN/m2) |
|
|---|---|---|---|---|---|---|---|---|
| 0.0~4.0 | SF, ML, SM | 5 | 0 | 30 | 19.3 | 19.5 | 12,250 N | 0.33 |
| 4.0~15.7 | GW | 40 | 4.9 | 38 | 21.8 | 22.0 | 2450 N–3430 N | 0.28 |
| 15.7~20.3 | GW, SW | 35 | 0 | 38 | 21.1 | 21.4 | 2450 N–3430 N | 0.28 |
| 20.3~24.4 | ML | 16 | 0 | 32 | 19.4 | 19.7 | 39,200 N | 0.32 |
| 24.4~33.0 | GW | 100 | 9.8 | 40 | 22.1 | 22.3 | 2450 N–3430 N | 0.26 |
Table 12.
Soil strength parameter input table for Case Study 3 in SoilWorks.
| Depth (m) | Soil Classification | Use N Value |
(kN/m2) |
Φ’ (o) |
(kN/m3) |
(kN/m3) |
(kN/m2) |
|
|---|---|---|---|---|---|---|---|---|
| 0.0~4.0 | SF, ML, CL | 18 | 0 | 28 | 20.1 | 20.0 | 44,100 N | 0.347 |
| 4.0~15.7 | GW | 44 | 4.9 | 38 | 22.1 | 22.3 | 2450 N–3430 N | 0.263 |
| 15.7~20.3 | ML, SM | 18 | 0 | 31 | 20.0 | 19.3 | 44,100 N | 0.327 |
| 24.4~33.0 | GW | 100 | 9.8 | 40 | 22.1 | 22.3 | 2450 N–3430 N | 0.263 |
Table 13.
Input parameters for diaphragm wall strength in Case Study 3.
| Thickness (m) |
E (kN/m2) | I (m4/m) | Reduction Factor |
0.7EA (kN/m) | 0.7EI (kNm2/m) |
|---|---|---|---|---|---|
| 0.8 | 2.13 × 10⁷ | 0.04267 | 0.7 | 1.19 × 10⁷ | 6.36 × 10⁵ |
Table 14.
Input parameters for floor structure in Case Study 3.
| Number of Floors | Floor Position | Thickness (cm) | A (m2/m) | 0.25A (m2/m) | I (m4/m) | E (kN/m2) |
|---|---|---|---|---|---|---|
| 1F | GL.+0.0 m | 20 | 0.20 | 0.05 | 6.667 × 10⁻⁴ | 2.46 × 10⁷ |
| B2F | GL.−3.9 m | 45 | 0.45 | 0.1125 | 7.594 × 10⁻³ | 2.46 × 10⁷ |
| B3F | GL.−6.3 m | 45 | 0.45 | 0.1125 | 7.594 × 10⁻³ | 2.46 × 10⁷ |
Disclaimer/Publisher’s Note: The statements, opinions and data contained in all publications are solely those of the individual author(s) and contributor(s) and not of MDPI and/or the editor(s). MDPI and/or the editor(s) disclaim responsibility for any injury to people or property resulting from any ideas, methods, instructions or products referred to in the content. |
© 2023 by the authors. Licensee MDPI, Basel, Switzerland. This article is an open access article distributed under the terms and conditions of the Creative Commons Attribution (CC BY) license (http://creativecommons.org/licenses/by/4.0/).
Copyright: This open access article is published under a Creative Commons CC BY 4.0 license, which permit the free download, distribution, and reuse, provided that the author and preprint are cited in any reuse.


