
Submitted:
17 July 2023
Posted:
19 July 2023
You are already at the latest version
Abstract
Employing numerical methods to simulate manufacturing processes and study their influential factors is increasing. The development of computers and engineering software has increased the ability and accuracy of numerical methods in simulating various aspects of different processes. One of the manufacturing processes that has been considered by many industries in recent years to join metals in solid-state with unique properties is called friction stir welding. It is challenging and, in some cases, impossible to experimentally study the various aspects of this process, such as temperature distribution, stress distribution, and material flow, due to severe plastic deformation in the weld zone. In this case, numerical methods are used to investigate these parameters and better understand the process. This study first investigates various numerical methods researchers use to simulate the process. The ability, pros, and cons of these methods to simulate the process are also examined. Then, the applications of numerical models in simulating the temperature distribution during the process as well as the effects of input parameters on the temperature history of the process, are deeply considered. Next, the application of numerical methods in material flow modeling during the process is investigated. Finally, the modeling of the microstructure of the welding zone is investigated using numerical methods that help significantly in predicting the weld microstructure.
Keywords:
Friction stir welding
; Numerical models
; Strain and temperature distributions
; Material flow
; Force and torque
1. Introduction
Friction stir welding (FSW) as a solid-state welding technique is attracting more attention in industrial applications and research. These demands among engineers, manufacturers, and the market boost the expectation of supply by the researchers in the different areas of FSW. However, experimental research imposition a very high rate of time and cost. In this situation, the simulation and modeling methods will lead us to better, in-depth, low-cost, and fast cognition of the process.
Simulating the FSW process is a challenging task due to various factors such as intricate physical couplings between heat transfer and mechanics, significant strain rates and deformations in the stir zone (SZ) surrounding the pin, and the need to track the material flow. Despite its appeal, FSW simulation remains a complex problem that requires careful consideration of numerous interrelated factors [1,2]. Numerical simulation of the FSW process enables optimum selection of various process parameters such as rotational and traverse speeds [3,4,5], tool penetration depth and tilt angle [6,7,8,9,10], and tool design parameters such as tool shape and dimensions, shoulder and pin geometries [11,12,13,14,15,16,17,18,19,20] etc. The process of FSW simulating is a complex undertaking, as it requires accounting for the interplay between various thermal and mechanical factors. Nevertheless, advanced modeling methods have been developed that could effectively elucidate and forecast essential aspects of FSW process physics. These modeling techniques encompass a vast range of complexity, from elementary conduction heat transfer models to more intricate models that incorporate material flow, as well as fully coupled models that model heat transfer and viscoplastic flow to predict the distributions of temperature, strain, stress, and residual stress along with the microstructure and texture distributions [21,22,23,24].
1.1. Friction stir welding and processing
FSW represents an advanced iteration of the conventional friction welding process and was initially conceived by The Welding Institute (TWI) in 1991 [25,26]. Since then, it has emerged as a leading metal joining technique and is widely regarded as the most crucial development in this field over the past two decades. Originally, FSW garnered significant attention as a solid-state joining process for aluminium alloys; however, its applications have now extended to more complex metallic materials, as well as plastics [27].
This process is carried out with the aid of a particular tool that comprises a shoulder and a profiled pin. This tool is gradually inserted into the joint between two substrates that are firmly clamped and supported by a backing plate. To provide a visual representation of FSW, Figure 1 presents a schematic diagram that showcases the cylindrical tool pin profile and a custom fixture designed to hold the plates securely. During the welding process, the tool's shoulder makes strong contact with the upper surface of the workpiece while an axial force is applied. The heat required to soften the material is produced through plastic deformation and friction [28]. During the process, frictional heat is generated between the workpieces being joined and the welding tool (consisting of a shoulder and a pin). It is worth noting that the tool's shoulder generates a greater amount of heat than the pin surface. Additionally, the rotation of the tool pin causes deformation or stirring within the materials, which generates additional heat [29,30]. When the material surrounding the pin becomes plasticized, the tool translation is applied, which undertakes it to severe plastic deformation. This generates a robust flow of material that is rounded from the tool's leading edge to its trailing edge, where it is forged into the joint by the tool shoulder assisted by the tilt angle. Ultimately, this results in forming a solid-state bond between two plates being joined [31]. Due to the combination of the tool's traverse and rotational movements, the velocities of two symmetric points on the retreating and advancing sides during FSW are not identical. This asymmetry in motion results in a corresponding asymmetry in material flow and heat transfer between two sides of the weld [32,33]. It is worth noting that during the process, the directions of tool traverse and rotational speeds are in alignment on the advancing side, while they are opposite on the retreating side, as shown in Figure 1b.
Friction stir processing (FSP) was developed by Mishra et al. [34] as a process for modifying metal microstructure based on FSW principles. The basis and parameters of these two processes are similar, and there are slight differences between them. Also, there is no difference between the two methods in terms of microstructural changes and material properties.
FSP is a technique in which a rotating pin penetrates the workpiece and makes local microstructural modifications that can enhance the material properties. It should be noted that FSP is not intended for joining two parts; instead, its main objective is to modify the structure of the material. Through FSP, it is possible to improve the strength, modify the microstructure, and create a uniform grain size distribution. Additionally, sediment distribution can be altered, and surface composites can be produced as a result of this process [35]. FSP has been used for various applications, including producing surface composites, homogenizing parts produced by powder metallurgy, modifying microstructures in metal-based composites, and improving cast alloys' properties [36].
Friction stir processing has so far been used with and without the use of additive particles. In the case of no additive particles, the process is precisely the same as the FSW, except that the join of the two pieces is not done [37]. The rotating tool enters the material and modifies the microstructure of the material by applying high heat and strain but using additive particles to produce composites; this process is a bit different from FSW.
With the development of computers and FEM software, the development of numerical models to simulate the welding process has increased. Since the friction stir welding process is challenging by including severe plastic deformations, it is sometimes impossible to study the parameters such as material flow or temperature and residual stress distribution experimentally. Therefore, it is essential to develop numerical models to study these parameters. Based on the importance of FEM models in the FSW/FSP technique, this review article aims to cover the following outlets:
Examining different numerical models for process simulation.
Temperature, stress, and strain distributions during the process.
Modeling the material flow in different types of FSW.
Modeling the microstructural evolutions during the process.
1.2. Process parameters
In friction stir welding, many parameters affect the welding properties. A proper understanding of these parameters is necessary to select them properly and thus achieve a flawless join. Proper selection of these parameters according to different welding conditions as well as the required performance of the join, will result in a join with appropriate mechanical and microstructural properties.
1.2.1. Rotational and traverse speeds
The FSW relies on two significant factors: the traverse speed and the rotational speed of the tool. The tool's rotation induces turbulence and blends the material around the pin, while the pin's translational motion moves the material from the front to the back of the pin. Increasing the rotational speed of the tool results in more heat generation and a more vigorous material mixing process [38,39]. Nevertheless, it is crucial to keep in mind that the surface friction coefficient can vary as the rotation speed increases.
These two significant process parameters affect the microstructure of the welds zone (WZ) or SZ. The occurrence of severe plastic deformation, along with the presence of high temperatures, makes the occurrence of recrystallization inevitable. As the tool's rotational speed increases, the amount of heat produced by plastic deformation and friction increases [40]. With increasing the temperature, the grain growth during the recrystallization is accelerated, resulting in raised grain size. While increasing the tool traverse speed reduces the grain size by decreasing the heat generated and also the amount of time the material is exposed to the process. This slows down grain growth during recrystallization and results in a finer microstructure [41].
Therefore, to achieve a more refined structure, the rotational speed must be slower, and the traverse speed must be increased as much as possible since this trend also reduces the heat generated, and it may not be enough to soften the material and deform the material, which will result in the production of defective welds.
1.2.2. Tool tilt angle
In general, in this process, the tool axis is not perpendicular to the surface of the welding sheets and is slightly inclined along the welding line [42]. This tendency in the direction of the weld line is such that the back of the tool shoulder penetrates more into the sheet than the front of it. This deviation of the tool axis from the welding line (along the welding path) is called the tilt angle. The tool in butt welding does not have an angle from the sides and is perpendicular to the surface of the parts.
This parameter is also one of the influential factors in welding. Previous experiences have shown that this angle size can vary from 0 to 5 degrees for different materials, but for most materials, the best range is 2 to 3 degrees [43,44]. For materials with high melting temperatures, such as stainless steel, an angle of less than 1 degree or even an angle of zero degrees may be used [45].
1.2.3. Tool penetration depth
The penetration depth of the pin into the samples is also effective in obtaining good structure and properties [46]. When it is shallow, the tool shoulder does not touch the surface and can not forge well the material that is flown from the front of the pin to the back [47]. Also, due to insufficient contact of the workpiece's surface with the tool shoulder, less heat is generated, and the materials do not become well soft and prepare for deformation. As a result, a tunnel cavity is formed during the welding, and the surface becomes uneven.
On the other hand, the high depth of penetration causes the tool shoulder to sink too much into the samples, which causes the surface of the samples to be removed and the production of excessive flash to occur, which will reduce the thickness of the sheet. Although in some cases, the measure of penetration depth is from the time the tool pin tip contacts the workpiece surface, because the pin length is known, the measurement of penetration depth is usually from the moment the shoulder touches the workpiece surface.
This value is between 0.1 and 0.5 mm, depending on the sheet thickness, material type, tilt angle, and tool geometries. If a numerical control system is used, the penetration depth amount is simple and calculated from the centre of the tool (on the shoulder surface). But in cases where a mechanical system is used, and especially where the tool also has a tilt angle, The first contact of the tool shoulder with the sheet surface on the back of the tool will be the zero point for measuring the penetration depth [48].
1.2.4. Tool design
The shape of the tool in FSW determines the flow of the material and has the most crucial effect on the weld quality. The difference in the shapes of the pins causes a difference in their contact with the material and affects the material displacement, the heat produced and the force required for welding, etc.
1.2.5. Joint design
The Joint design is one of the most critical parameters in FSW, and so far, this method has been used to join samples in different designs. Different connection designs require different welding parameters and tool designs. The most common joint designs in FSW are butt and lap joints [31,49].
Other designs are created by combining lap and butt joints. Another type of joint design, such as corner joint and three-way joint, which are used in many engineering structures, is done in this way. The critical thing about joints made in this way is that they do not require any special preparation. Two clean metal pieces can be easily joined together by FSW, regardless of the surface conditions of the plates.
2. Process Modeling Techniques
Considerable numerical research has been published on FSW recently, with significant attention given to residual stress, heat transfer, and material flow [50]. Two primary thermo-mechanical modeling techniques are used for numerical simulation:
computational solid mechanics (CSM) models. Within CSM, two principal methods have been employed: the arbitrary Lagrangian-Eulerian (ALE) [62,63,64,65,66,67,68,69,70,71,72,73,74,75] method, the coupled Eulerian-Lagrangian (CEL) approach [76,77,78,79,80,81,82,83,84,85,86,87,88,89,90,91,92,93,94,95,96,97], and the smoothed particle hydrodynamics (SPH) method.
CFD models are based on the assumption that the input heat is due to viscous loss. Equivalent density is usually derived from experimental results such as strain, stress, or temperature distribution. These techniques are deemed appropriate for metal flow solutions that require simultaneous evaluation. However, it is worth noting that CFD methods are often underutilized in other scenarios.
In addition to fluid models, some models based on solid mechanics have been developed to understand the mechanism of material flow in the FSW process. The ALE method prevents excessive distortion of the meshes in modeling the material flow around the pin. This method creates more accurate models to study the material flow than fluid models.
The CEL approach incorporates the best aspects of both the Lagrangian and Eulerian approaches [93]. Its key strength is the ability to control significant distortion issues that can occur during finite element simulations, like those in the FSW process. Mesh distortion in FSW simulation can be avoided via Eulerian analysis, in which the nodes are fixed, and the material flows through the mesh network.
2.1. Computational Fluid Dynamics models (CFD)
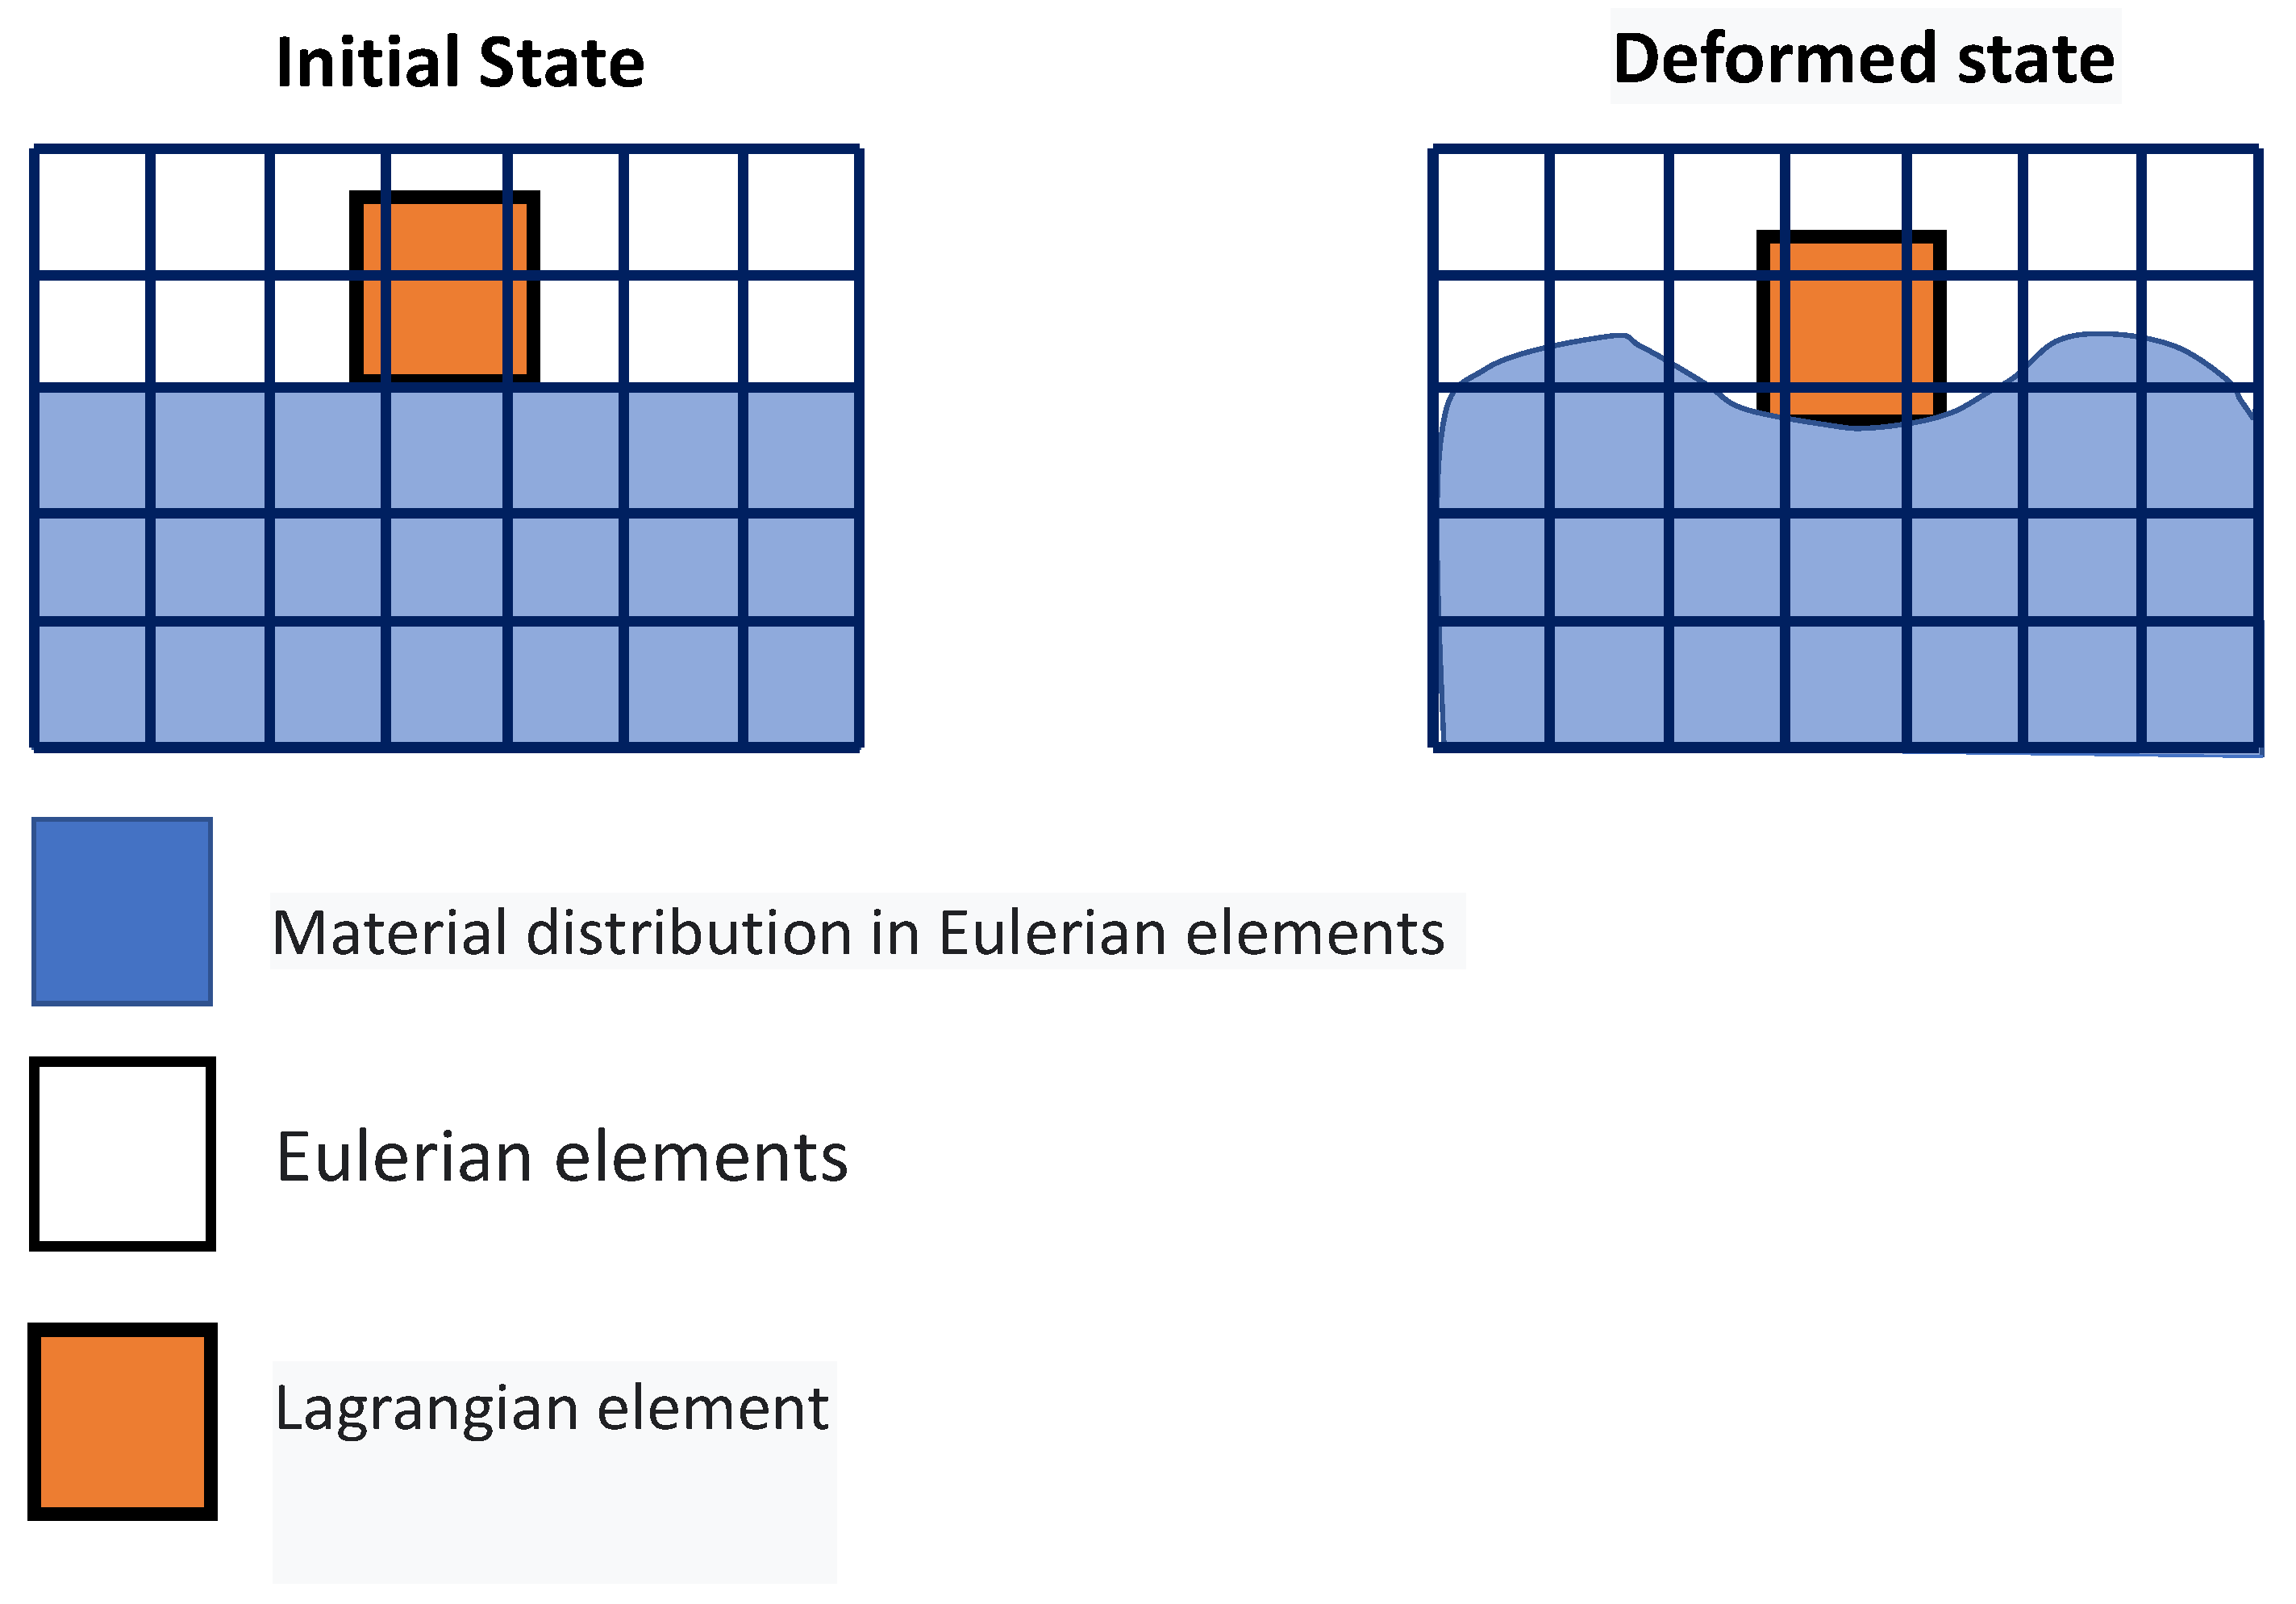
In the context of an Eulerian approach, the positions of nodes are assumed to be fixed in space while the material is observed to flow through non-deforming elements. Not all Eulerian elements will always be filled with material; several may be partially or entirely vacant (Figure 2). Therefore, the Eulerian material boundary, which generally does not match an element boundary, must be calculated for each time increment. To provide the material space to maneuver and flex, the Eulerian mesh is often a straightforward rectangular grid of components that are built to extend far beyond the Eulerian material boundaries. Eulerian material is lost from the simulation if it moves outside the Eulerian mesh. The Eulerian formulation is appropriate for resolving the fluid dynamics issue since it permits material to pass across the mesh. The accurate interface description offered by the Lagrangian formulation is lost by using an Eulerian reference frame, but it does prevent the problem of mesh tangling in the target.
In general, this approach provides a natural perspective on control-volume problems in fluid mechanics. This arrangement is appropriate for steady-state analyses of forming processes in the field of solid mechanics, where the material flow is considerable, but the deformation on the free borders in the boundary shape is minimal. However, because the network does not change, applying this approach to represent the deformation of the free borders that arise throughout the deformation is challenging. Due to the erroneous formulation of free boundaries, the Eulerian approach is generally inappropriate for evaluating regions with shifting borders.
In CFD simulations aimed at investigating the thermal-mechanical conditions during FSW, the general governing equations for material flow and heat transfer for incompressible fluids are usually utilized. This approach assumes a rigid body and excludes the welding tool from the fluid computational domain. The workpiece is taken as a single-phase [98] or multiphase [99] viscous fluid in the literature. In this approach, the mass flow is regarded as an incompressible, non-Newtonian, viscoplastic material flow.
Colegrove et al. [100] utilized the CFD code FLUENT to model the two-dimensional material flow during FSW. Their newly created "slip" model relied on local shear stresses to control the interface conditions. Subrata Pal et al. [101] employed the polycrystalline cubic boron nitride pin to study the heat transfer and material flow during the FSW of SS304 using the three-dimensional CFD code FLUENT. Their simulation was accurate in predicting the FSW material flow characteristics. Tiwari et al. [102] investigated a modified material transfer and heat transfer model for FSW of DH36 steel, utilizing the Eulerian framework in a steady state. They modeled the material viscosity as a non-Newtonian viscoplastic fluid that varied according to flow stress and temperature. The researchers showed that the highest temperature occurred at the point where the sheet and shoulder met and that maximum temperatures varied along the direction of thickness. Using the CFD package FLUENT, Hasan et al. [103] created a couple-thermo flow model for friction stir welding to simulate the flash generation phenomena that take place during the FSW process. Single-phase flow models and multiple-phase flow models were contrasted. When a two-phase flow model was used, a considerable decrease in the pressure values was seen.
Savaş et al. [55] employed the Comsol Multiphysics CFD code to predict the three-dimensional metal flow during FSW of AA 2024-T3 aluminium alloy. Meanwhile, Colegrove et al. [56] utilized a CFD code to examine the material flow around a complex FSW tool and assessed the impact of the rotation speed and tool rake angle. The researchers found that their model overestimated the weld temperature due to an excessive amount of heat production.
Chen et al. [57] conducted a three-dimensional numerical simulation using CFD to investigate the plastic deformation and heat transfer behavior during the FSW of AA2024. They utilized both boundary shear stress (BSS) and boundary velocity (BV) models to evaluate their ability to predict temperature and material deformation in FSW. While there was a notable discrepancy between the predictions made by the experimental data and the BV models, the predicted geometry of the deformation zone by the BSS model was found to be congruent with the experimental findings.
Chen et al. [54] created a thermo-mechanical coupled model based on CFD to explore the heat generation and spatial distribution of the heat flux during FSW of aluminium alloy. Mohan et al. [104] utilized CFD to investigate the temperature distribution, heat generation, and material flow within the stir zone during FSW at extremely high tool rotational speeds. The researchers assumed that the tool and workpiece were in a partial sliding-sticking contact condition, and they incorporated boundary conditions to account for the partial melting possibility at high rotational speeds. They found that plastic heat creation at high rotational speeds had a more significant impact on heat generation than frictional heat generation, and they observed that partial melting did not occur. Yang et al. [105] integrated the anisotropy of mechanical characteristics into a CFD model of the FSW process for the AA6061 alloy. The researchers evaluated the anisotropy distribution and the degree of drop in flow stress/yield strength because of the mechanical anisotropy based on the computed results. Pankaj et al. [106] utilized multiphase CFD simulation to simulate dissimilar FSW of 6061-T6 aluminium alloy and DH36 shipbuilding steel. The researchers investigated how the rotational speed impacted the temperature and flow of plasticized material through the tool-material interaction. Yang et al. [107] simulated Al/Mg dissimilar FSW using the CFD technique. By treating the material mixing in the SZ as a functionally graded material (FGM) for the computation of associated thermophysical parameters, they were able to obtain a more accurate prediction of the production of Al/Mg FSW joints with greater precision.
Al/Cu dissimilar FSW was studied using FLUENT software by Kadian and Biswas [108], who found that the weld had an uneven velocity distribution. To model the Al/steel dissimilar FSW, Liu et al. [109] used the volume of fluid (VOF) technique in FLUENT. The AA6061 and TRIP steels' different thermophysical properties led to the discovery of an asymmetric temperature field during the Steel/Al dissimilar FSW. Using a CFD technique, Bokov et al. [110] investigated how tool shape affected the heating process in a Steel/Al dissimilar FSW. They found that the material flow velocity on the aluminium side was higher than on the steel side. Using a CFD and volume of fluid technique, Zhang et al. [111] developed a multiphase model for studying the heat and mass transfer behavior in dissimilar FSW of AA2024-T4 aluminium alloy and TC4 titanium alloy.
Jiang et al. [112] created a model that utilizes the VOF approach to analyze the mixing of material and material flow in dissimilar FSW of Mg/Al alloys. The model incorporates mass, energy conservation, and momentum equations to evaluate material flow while considering quasi-steady state heat transfer conditions. To achieve this, the researchers assumed that materials behave as a non-Newtonian incompressible viscous fluid. Yang et al. [113] developed a CFD model while conducting ultrasonic vibration-enhanced FSW of 6061-T6 Al alloy. The model presumed that the material acted like a non-Newtonian and incompressible visco-plastic fluid. By comparing their estimated thermo-mechanically affected zone (TMAZ) boundary and thermal cycles with experimental measurements, the researchers were able to obtain fairly consistent results. The material flow during the FSW of 5083 aluminium alloy and stainless steel was examined by Sadeghian et al. [114] using CFD-based simulations. They considered the heat generation in their numerical model based on the FSW tool shape, rotational speed, and yield shear stress of the parent material.
Carlone et al. [115] used the commercial ANSYS CFX package to solve a CFD-based model of the FSW and validate it against thermographic observations of the process. To study the impact of tool tilt angle on the temperature field, material flow, and heat generation in FSW, Zhai et al. [42] undertook both experimental work and numerical modeling based on CFD. The study found good agreement between the projected temperature field and TMAZ from the numerical simulation and experimental observation.
2.2. Numerical models based on solid mechanics (CMS)
In recent decades, the finite element method has been accepted as one of the most effective simulation tools in designing and analyzing many phenomena as a standard tool in the engineering community. Some of the challenges that arise among finite element analysis in the field of solid mechanics problems are: choosing a comprehensive appropriate configuration to analyze the problem, providing a suitable method to prevent network distortion due to large deformations, contact modeling methods at contact surfaces, and expression of proper contact behavior with appropriate friction models.
One of the fundamental principles in numerical simulation of processes that involve significant deformations in nonlinear solid mechanics is utilizing a suitable kinematic depiction for the continuously deforming environments. The Lagrangian and Eulerian views are the two primary classical perspectives regarding the kinematic description of a continuous environment.
When adopting a Lagrangian perspective, the configuration network remains attached to the material and monitors its deformation. This approach is widely used in solid mechanics and proves particularly effective when dealing with the unconstrained flow at free boundaries, interference between various materials, and materials for which the deformation history is critical. The use of this type of networking has significant drawbacks, including network and element distortions. The Lagrangian method makes it simple to monitor surfaces and apply boundary conditions since it allows the mesh and the material to move simultaneously. The material border always coincides with an element boundary since lagrangian elements are always filled with a single material. The Lagrangian formulation functioning is depicted in Figure 3.
Gould and Feng [116] proposed a simple Lagrangian model to forecast the heat transfer and temperature profile inside the FSW process. Some models [24,65,68,117,118,119,120] that accurately anticipated the results of thermal analysis and stress used the Lagrangian approach with severe re-meshing. In the study by Buffa et al. [118], a coupled thermomechanical FEM in commercial DEFORM-3D software was used, along with a lagrangian formulation and implicit approach. The welding seam was modeled in the model using continuum elements. Additionally, the impact of the welding parameters on strain rate, welding forces, temperature history, and material flow was investigated using a rigid visco-plastic material description. Finally, favorable agreements regarding welding forces and temperatures were reached. The temperature distribution across the welding centre line was found to be roughly symmetrical and affected mainly by rotational speed. However, it was shown that the material flow in the stir zone was an asymmetrical phenomenon, primarily controlled by welding traverse and rotational speeds.
The Lagrangian technique was employed by Dong et al. [121] and Chao et al. [122] to compare the numerical and experimental results of the heat energy produced during FSW. In Chao et al. [119] model, the tool was under a steady state condition while the plates were under a transient situation. An experimental temperature recording was done to verify the findings. Utilizing the WELDSIM code, the workpiece was subjected to simulation. However, only half of the workpiece was modeled since a symmetric condition was presumed between the retreating side (RS) and the advancing side (AS). The results revealed that nearly 95% of the heat produced during welding is directed toward the sheets, with the remaining 5% allocated to the welding tool. To address the issue of over-prediction in Lagrangian finite element models, some designs incorporate experimental power data to serve as an input parameter for the model.
Chen and Kovacevic [123] developed coupled thermo-mechanical modeling of FSW using the Lagrangian and re-meshing techniques. The model simulated the tool shoulder as the heat source. Additionally, the effect of the moving heat source on the temperature of the material was studied. The model has limitations in terms of stresses, strain rate, and forces because the influence of the pin was believed to be minimal. Using a thermo-mechanically coupled Lagrangian model, Akbari et al. [124] investigated the contribution of each part of the pin and shoulder to the formation of strain and heat. The findings demonstrate that frictional heat generation, as opposed to plastic deformation, is the primary process for raising workpiece temperature. Additionally, the tool shoulder produces roughly 90% of the heat; the tool pin cannot produce heat or strain in the samples on its own. A thermo-mechanical FSP simulation was created by Asadi et al. [125] utilizing the DEFORM 3D program based on Lagrangian implicit. They assumed that the tool is rigid, the material is characterized as a rigid-viscoplastic material, and the friction is constant. They used the Arrhenius equation to describe the relationship between the flow stress, temperature, and strain rate at high temperatures. For the simulation, they created a non-uniform mesh with automatic re-meshing. To achieve accuracy in the contact between the material and tool, fine elements with a mean size of 0.85 mm were placed under the tool pin and shoulder (Figure 4).
Given the justifications, it may be inferred that neither the Lagrangian nor the Eulerian viewpoints are sufficient to model significantly deformed processes like friction stir welding. Both strategies are complementary, and the strength of each is the weakness of the other. Therefore, new configurations are more suited to replicating the FSW process because they can incorporate the advantages of Lagrangian and Eulerian networking.
The Coupled Eulerian-Lagrangian (CEL) and Arbitrary Lagrangian-Eulerian (ALE) approaches are two numerical techniques used in computational mechanics to solve problems involving large deformations of materials or fluids. These techniques combine the benefits of both Eulerian and Lagrangian approaches to offer a more comprehensive solution. In the ALE approach, the network components in the space are neither fixed nor attached to the object or material being studied. Instead, they have the necessary motion to model the system's dynamic behavior accurately. This can be particularly useful when simulating fluid-structure interactions or other problems where the mesh deformation needs to be tracked as part of the solution. By contrast, the CEL approach combines elements of both Lagrangian and Eulerian approaches by using different reference frames for different regions of the problem domain. This allows for greater flexibility in modeling complex systems, such as fluid flow around a moving object.
The ALE approach combines two networkings discussed above with the relative mobility of the network components and the material. As a result, the material configuration and each network component can move independently. This element of the ALE approach is an effective tool for simulating processes in which the material experiences large-scale local deformation and large-scale unrestricted flow across free boundaries. This allows ALE to be turned into Lagrangian on free boundaries while remaining Eulerian in regions with significant deformation.
The mesh is smoothed at regular intervals to reduce element distortion and to preserve good element aspect ratios, and the same mesh topology is maintained as one of the adaptive meshing capability's core features (Figure 5). The number of components and nodes, as well as their connectivity, remain constant. Both Lagrangian (transient) and Eulerian (steady-state) issues can be analyzed using it.
Utilizing the ALE method, a thermo-mechanical finite element model was fully coupled to simulate FSW. The model incorporated inelastic heat generation to enhance the accuracy of the numerical simulations [126]. Numerical simulations were conducted to simulate the temperature fields during FSW at 600 and 800 rpm rotational speeds. The results indicated that the numerical model was able to replicate the temperature distribution during the FSW process accurately. Xu and Deng [127] modeled the plastic strain and material flow using ABAQUS. The ALE-based model was used to develop the FE modeling of the process using an adaptive meshing technique, temperature-dependent material properties, and massive elastoplastic deformations. The temperature was defined as an input parameter to the model because it was not assumed to as a fully coupled thermomechanical model. It should be noted that the temperature specified was determined via experiment.
Additionally, the velocity gradient at the pin side area was recorded. It was found that the temperature and velocity are higher on the advancing side rather than on the retreating side. Finally, the distributions of the equivalent plastic strain and the distribution of the microstructural zones were compared between the numerical findings and the experimental observations, and a satisfactory correlation was attained.
Schmidt and Hattel [128] utilized a comprehensive 3D thermomechanical finite element model, which was fully coupled to capture the intricate interplay between heat transfer, material deformation, and mechanical loads during FSW. They leveraged ABAQUS/Explicit to implement the ALE method and Johnson-Cook material model, which enabled them to accurately predict the workpiece plastic deformation and failure behavior during welding. To simplify the connection between the rigid tool and workpiece, Schmidt and Hattel cleverly utilized the inherent flexibility of the FSW machine as a cylindrical volume model with inlet and outlet boundary conditions. This allowed for easier modeling of the machine rigidity and stiffness, which would have been more difficult to simulate accurately otherwise.
Mandal et al. [129] focused their modeling efforts on addressing the difficulties associated with temperatures and the high strain rates involved in FSW, which present significant numerical challenges when dealing with nonlinear materials. To address these issues, the researchers opted to use the Johnson-Cook elastoplastic constitutive law within the finite element code ABAQUS to simulate the entire FSW process. One of the main challenges in simulating is managing excessive element distortion, which can cause the simulation to terminate prematurely. Mandal et al. used an ALE approach with extensive re-meshing to mitigate this issue and ensure accurate results. By doing so, they were able to produce a sophisticated model that effectively captures the complex thermomechanical behavior of the material during FSW.
Guerdoux and Fourment [130] established a finite element model utilizing ALE formulation in FORGE software. The study employed Hansel Spittel's material model, re-mesh technology, and Norton's Law to replicate the frictional contact between material and tool. The researchers discovered that flash production on the plate top surface and void development occurred during FSW. The study predicted the appearance of flashes and voids, which were confirmed using experimental data related to welding torque and force. The FE model provides valuable insights into the stages of welding and material flow.
By using the ALE technique, Assidi et al. [131] created a FE model of the FSW process as it was implemented by FORGE 3 FE software. The interaction between the material and the tool and the flash creation that takes place during welding were the main subjects of the investigation. This constitutive model employed Norton and Coulomb’s laws for friction contact modeling and the Hansel-Spitter material model. The investigation found that the distribution of welding forces and temperatures and actual data exhibited good agreement. The work gave researchers new insight into the FSW process regarding the incidence of surface flash and the circumstances at the tool-workpiece contact.
The CEL method is another finite element networking method utilized in procedures with significant plastic deformation like FSW. This technique avoids significant network distortion by modeling the sample using Eulerian relations. Lagrangian relations are also employed in the tool modeling. In this method, the welding process causes significant deformations in the Eulerian network, representing the material, without any issues with network distortion. Lagrangian can interact with Eulerian.
Figure 6.
The Coupled Eulerian-Lagrangian method.
In this method, the nodes are moved, and the mapping process is done after Lagrangian calculations. This method is a kind of simulation of Eulerian finite elements with a Lagrangian stage. The most important feature of the CEL approach is in the definition of free surfaces where the boundaries of matter do not match the boundaries of components. In the CEL approach, the components can be empty, to an occupied size, or filled with material (Figure 7) [76]. In this case, the volume of material within the components is measured by volume fraction, which is obtained from the ratio of the volume of material within the component to the total volume of that component. A part that is filled with material will have a volume fraction of one, and an empty part will have a volume fraction of zero. The component can be occupied by more than one type of material simultaneously.
Many researchers have considered the coupled Eulerian-Lagrange method to model the friction stir welding process [78,132]. In this method, the material is modeled using Eulerian relations, and the welding tool is modeled using Lagrangian relations. The Eulerian region is formed in two parts, filled with material and the empty region, to carefully examine the flow of material and the formation of defects. The presence of an empty area is necessary to check for defects in the sample.
The CEL approach has recently attracted the attention of researchers for FSW modeling. By tracking the material flow into and out of the computational/void domain using a 3D thermo-mechanical-based CEL approach, Bhattacharjee et al. [77] projected surface, sub-surface, and volumetric defects. Iordache et al. [133] suggested a method based on the CEL approach for identifying the best parameters for a butt-welded joint of copper plates. They drastically cut the simulation duration by employing the mass scaling technique.
To explore the FSW of 1Cr11Ni2W2MoV steel, researchers Ragab et al. [134] developed a 3D thermo-mechanical finite element model utilizing the CEL approach. The team incorporated a velocity boundary condition, depicted in Figure 8, to control the material flow within the Eulerian domain.
Hossfeld [135] simulated the entire FSW process of AA 5182 using the CEL approach. The level of resolution attained in this study makes it possible to see how burrs and internal voids form. The FSW of aluminium and brass was studied by Akbari et al. [76] using the CEL model. Their investigation appropriately recognized both the intermetallic composition of aluminium and brass and the influencing factors. To forecast potential circumstances that could result in defect creation, such as excess flash formation and tunnel cavities during the FSW, Ajri and Shin [136] built models using the CEL approach.
Akbari et al. [137] simulated the FSW of AA5083 to AA7075 aluminium alloys using a CEL approach. When the stir zone of the joint was compared to what the modeling had indicated, it was found that the CEL approach had accurately predicted how the material would mix in the SZ. This study applies the Lagrangian formulation to the tool, which is modeled as a rigid body, and the Eulerian domain to the material (AA5083 and AA7075). The Eulerian component was split into two areas containing alloys AA5083 and AA7075 (Figure 9). Then, two halves' different materials were indicated by the VOF feature.
Chen et al. [138] utilized the CEL approach for simulation to investigate material flow at the interface between dissimilar steel and aluminium alloys during friction stir spot welding. They analyzed the distribution of material at different plunging depths and observed how the hook was formed during the welding process. Chauhan et al. [139] employed the CEL approach to predict the occurrence of faults in FSW. Through their model, they could accurately forecast the axial force, spindle torque, and tunnel defect that may arise during the process.
Al-Badour et al. [140] predicted material flow and volumetric flaws like the tunnel during the friction stir welding of aluminium using the CEL approach. Safari et al. [141] created the FEM model of the dissimilar FSW employing the CEL approach. Their findings show that a grooved pin design enhances material velocity around the FSW tool. Using a CEL approach, Ghiasvand et al. [90] studied the impact of FSW tool positioning parameters on the peak temperature in the dissimilar FSW of the alloys AA7075-T6 and AA6061-T6. Due to increased contact surfaces and friction between the sample and tool, the peak process temperature rose dramatically when the plunge depth was increased.
Chauhan et al. [134] studied the impact of various welding settings and tool pin profiles on void formation using the CEL approach. The findings showed that FSW with lower traverse speeds or higher tool rotational speeds could produce fewer voids. For the FSW of the dissimilar alloys AA2024-T3 and AA6061-T6, it was necessary to ascertain the thermal and subsequent residual stress conditions. Grujicic et al. [55] explored dissimilar-filler-metal friction stir welding using a CEL approach to understand inter-material mixing and weld-flaw generation. Using a coupled Eulerian-Lagrangian methodology, Das et al. [142] looked into the material mixing, flaws in FSW of different materials, and the influence of progressive tool wear. With a maximum deviation of 1.2 mm, the created model accurately predicted surface tunnels, excessive flash formations, exit holes, and subsurface tunnel flaws.
When dealing with large deformations in material simulations, mesh distortion can often be a problem. An alternative method to solve this issue is to use meshless or mesh-free methods. These approaches rely on creating interpolation functions at arbitrary discrete points within the domain rather than relying on elements and a structured mesh. One such technique is the smoothed particle hydrodynamics (SPH) method, which has proven to be an effective simulation tool in continuous media mechanics for modeling the FSW process.
The SPH model is Lagrangian in nature, allowing each material node to be tracked over time. This makes it an attractive option for scientists interested in tracking materials during large deformation and strains. In contrast to conventional grid-based approaches, Lagrangian particle methods such as Smoothed Particle Hydrodynamics can replicate interface dynamics, material strain, significant material deformations, and temperature history without the need for intricate tracking mechanisms.
The SPH approach is a mesh-free numerical technique used to investigate force, temperature, strain, and stress distribution. Instead of using fixed grids, SPH spreads numerical nodes over the problem environment, converting the continuous model into a discretized one. Each node is then moved and accelerated based on effective stress or applied hydrostatic pressure, and the kernel function is used to determine the effect of each node on its neighbouring nodes.
Compared to the finite element method, SPH has several advantages, such as the absence of a grid and continuum discretization, making it less prone to mesh distortion issues when simulating large deformations. The particles are used as the basis for an interpolator scheme based on the kernel function, which depends on the smoothing length. In SPH, problem variables such as density, velocity, deformation, and stresses are computed using the kernel interpolation function based on the weighted average value of numerical nodes over their neighbours.
Figure 10 visually demonstrates the similarities between finite element and smoothed particle hydrodynamics approximations. The figure displays a patch of elements in both the FE and equivalent SPH approximations. Interpolation functions are overlaid upon the central element of the FE mesh, while the kernel of the central particle is "sketched" as spanning its neighbours in the SPH mesh.
Various types of interpolation kernel smoothing functions are selected according to the physical characteristics of the problem being modeled, particularly for large deformation problems. For two-dimensional and three-dimensional models, the effective radius of the central element is typically around 27 and 56 elements, respectively, when there is a finite number of neighbours. Additionally, a scaling factor (𝜆) can be applied to increase or decrease the number of neighbouring elements within the effective radius, which directly impacts the model's accuracy and the computation time required for calculations.
Figure 11 illustrates the weighting function of W, which takes on a bell-shaped form with a kernel length denoted by 𝜆ℎ. The value of 𝜆 is determined based on the type of weighting kernel function that is assumed for summing over all particles situated at a distance of 𝜆ℎ from 𝑟.
As such, researchers have recently turned to the SPH method as a means of modeling the welding process. With its ability to accurately capture the effects of large deformations and temperature changes on material behavior, it has shown great promise in advancing our understanding of FSW and allied processes. Pan et al. [143] proposed an SPH model to investigate the FSW of AZ31 magnesium alloy. Their model provided insights into temperature distribution and history, grain size, texture evolution, and microhardness during the process. Bagheri et al. [144] created a similar model to examine how vibration affects heat generation, temperature history, and mechanical properties during FSW with varying traverse speeds. After conducting the analysis, it was observed that the application of vibration during FSW positively impacted both the material flow and weld area size. Additionally, this technique proved to be effective in minimizing or eliminating any joining defects, ultimately improving the welding quality. In addition, they employed an SPH model for numerical analysis of FSW both in underwater and air conditions [145]. Various mesh density and friction coefficient values were utilized to attain the best possible outcome. The findings indicated that during UWFSW, the maximum temperature was lower in comparison to CFSW at all welding velocities. This can be attributed to the superior convective heat transfer coefficient and specific heat involved.
3. Temperature distribution
In the FSW process, the temperature in the stir zone increases due to the severe deformation around the tool as well as the frictional heat generation. The temperature distribution in and around this zone directly affects the microstructural properties such as grain size, grain boundaries, formation and dissolution of sediments, precipitates, intermetallics, size, etc. In addition, the temperature distribution determines the residual stress in the weld metal and its around. Therefore, the temperature distribution will have a significant effect on the mechanical properties of the weld. So, it is necessary to study how the temperature is distributed during welding to understand the mechanical and microstructural properties of the joints.
Determining the temperature distribution in the SZ is very challenging due to the severe deformation, so the maximum temperature in this area is often guessed by the structure of the microstructures formed after the welding process or by installing thermocouples around the weld zone on the heat-affected zone (HAZ) or base metal.
So far, three methods have been used to study the temperature distribution in the stir zone:
The first is the experimental temperature measurement using instruments such as thermocouples in the welding area.
The second approach is estimating the temperature in the welding area according to the microstructures formed after welding.
The third method is to use models or process simulations to calculate the temperature. The use of this method is less challenging than the first and second approaches, and a large part of the research has used this method. The following is a review of each of these methods.
One of the most suitable temperature cycle analysis methods is mathematical equations and finite element simulation. In this method, the temperature can be accurately calculated at any point of the workpiece without problems such as thermocouple placement or calibration. In general, two approaches have been used to calculate the temperature in this area. The first approach is the analytical calculation of temperature using mathematical equations. The second approach simulates the temperature in different areas using the finite element solution.
Heat is created in FSW due to plastic deformation surrounding the rotating tool and friction between the material and the tool. The product of tool speed and frictional force is frictional heat generation. Shear stress and the material velocity adhered to the FSW tool combine to generate heat as a result of plastic deformation around the rotating tool. The frictional heat generation on an element dA is given as [146]:
where δ is contact state variable, ω is tool angular rotation speed, r is position along tool radius, µ is friction coefficient, p contact pressure. Furthermore, the computation of thermal energy resulting from the plastic deformation can be determined as follows:
Therefore, total heat generation can be defined by:
And as a result [1]:
where τcontact is contact shear stress. The heat production occurring at the contact interfaces between the tool and workpiece can be broken down into three distinct components, namely: (1) heat generated beneath the tool shoulder (Q1), (2) heat generated on the pin side of the tool (Q2), and (3) heat generated at the tip of the tool pin (Q3).
where Rshoulder is the tool shoulder radius, RPin is the tool pin radius, and Hpin is the tool probe height. As a result, the total heat generation would be:
As can be seen from this calculation, increasing shoulder diameter increases heat generation significantly. Similarly, increasing the diameter of the pin will increase the amount of heat generated. However, because pin diameter has a smaller impact in Eq. (8) than shoulder diameter, heat generation increases with shoulder diameter growth would be more dominant than pin diameter growth.
As mentioned, measuring the temperature in the stir zone is complicated due to the severe plastic change of the material, and an attempt is made to use simulation to predict the temperature. Simulation models have shown an extraordinary ability to predict temperature. This method estimates the temperature distribution in the weld zone using a finite element solution.
For example, the authors in previous work compared the temperature history from experimental and simulation data to determine the performance of finite element models. Their results showed that simulation models have an extraordinary ability to predict [24]. As shown in Figure 12, there is a very good agreement between the experimental data and the simulation. These results show that the use of simulation models to estimate the temperature in the welding area is a suitable method and does not have the problems of experimental methods.
Shojaeefard et al.[117] simulated FSW using the FEM to study the temperature history and distribution in the welding area in 5083 aluminium. The results of this research showed that the temperature distribution around the welding centre is almost symmetric. This symmetry can be explained by considering the rotational and traverse speeds (Figure 13). With the rotational speed being significantly greater than the traverse speed, it plays an important role in determining the amount of heat generated, while the traverse speed has minimal effect on the temperature distribution, resulting in a nearly symmetrical temperature profile. For instance, if the rotational speed is approximately 1400 rpm and the pin diameter is 3 mm, then the linear speed of the pin owing to the rotational speed would be around 13194 mm/min, which is much higher than the tool traverse speed that usually ranges from 50 to 120 mm/min.
According to Chao et al. [147], the majority of heat produced by friction - approximately 95% - is transferred to the workpiece, while only a small amount of 5% is transferred to the tool. Additionally, roughly 80% of the plastic work rate is dissipated as heat. Larsen et al. [148] utilized inverse modeling techniques to determine the heat transfer coefficient between the backing plate and material, aiming to improve temperature calculations in friction stir welding by reducing the discrepancy between experimental and 3D FE model temperatures. The study revealed that the heat transfer coefficient was not uniform, with its highest value located beneath the welding tool. To address this issue, the researchers employed a gradient-based optimization method and a non-uniform parameterization of the heat transfer coefficient in their inverse modeling approach. This innovative technique allowed them to obtain a more precise determination of the heat transfer coefficient, making it the first instance of this methodology being employed in FSW.
Prasanna et al. [149] developed a finite element (FE) simulation model with enhanced predictive capabilities for temperature history in stainless steel. To validate the model, they tested it against existing experimental data on 304L stainless steel and found that the maximum temperature obtained was 1,057 °C, significantly lower than the steel's melting point of 1,450 °C. Xu et al.'s paper presented the findings of a numerical and experimental observation of heat dissipation and generation during FSW. The study aimed to improve the selection of process parameters and the design of welding tools for manufacturing combat vehicle structures [150].
A 3D FE-coupled thermal-stress model of the friction stir spot weld (FSSW) has been established using Abaqus/Explicit code [151]. For elastic-plastic work deformations, a rate-dependent Johnson-Cook material model was utilized. The model's energy dissipation and temperature distribution have been analyzed in detail.
Utilizing the STAR-CCM+ software, a commercial finite volume method (FVM) code, thermo-mechanical simulation was conducted for sheets of AA5083-H18 in the FSW process [152]. The simulation involved calculating strain rate and temperature distributions under steady-state conditions. Afterwards, the simulated temperatures, including peak values and profiles, were compared to the experimental findings. Notably, accurate simulation outcomes were achieved by incorporating an appropriate thermal boundary condition for the backing plate (anvil). Using the thermal elastic-plastic FE model, a simulation was performed on the transient temperature distribution in 2024-T4 Al FSW joints [153]. It was observed that the temperature value decreases gradually towards the weld periphery in a radiating pattern around the pin, and the peak temperature in the weld can be reached up to around 400°C.
Rajesh et al. [154] studied the FSW of A16061 plates and its associated temperature distribution, utilizing an asymmetrical analytical model that considers the heat input resulting from the combined rotational and traverse motion of the tool shoulder and pin [248]. To evaluate the heat distribution at the FSW joint, a 3D FE heat transfer analysis program was employed, resulting in a plotted representation of the heat distribution in the A1 6061 plate. This study found that the heat distribution from the FE analysis agreed with the values obtained through experimental measurements. This work showcases the potential of analytical and computational tools for understanding the fundamental aspects of FSW and optimizing the welding process for enhanced performance. The welding parameters for FSW were comprehensively examined, including the pin angular velocity, pin and shoulder radius, cone angle, and screw-thread angle [155]. The results demonstrated that increasing the radius of the pin and angular velocity while staying within the FSW limits led to a higher maximum temperature. Conversely, an increase in the cone angle and screw-thread angle resulted in a decrease in the maximum temperature. These findings highlight the critical role of these parameters in determining the temperature distribution during FSW and can provide valuable insights for optimizing the process to enhance its efficiency and quality.
As the largest source of frictional heat generation, the tool shoulder size plays the most critical role in the heat generated. The authors used numerical methods to examine the amount of heat generated by various tools (Figure 14). As it turns out, with increasing shoulder diameter, the temperature rises dramatically.
It was also shown that the HAZ area, the main area for fragment failure, expands with increasing shoulder diameter. The HAZ zone is selected according to the definition of the zone where the temperature is above 400 degrees (Figure 15). As previously stated, a greater maximum temperature in the FSW joint promotes solid diffusion, plasticized mixing, and improved weld quality regarding material flow. On the other hand, because the HAZ is one of the most competent zones for fracture, it causes the weld quality to deteriorate. As a result, the best rotational speed is needed to maintain a high peak temperature in the weld zone while minimizing HAZ expansion.
The tool pin diameter is another critical parameter in determining the temperature of the workpiece. As shown in Figure 15, as the diameter of the tool pin increases, the temperature of the stir zone increases. A rise in temperature occurs due to an increase in pin diameter for two reasons. On the one hand, due to the increase in the contact surface, more frictional heat is produced, and on the other hand, due to more plastic deformation, the heat resulting from the material deformation increases. As shown in this figure, this increase in temperature is minimal compared to the effect of the shoulder diameter, which indicates that the tool shoulder plays a major role in determining temperature rather than the pin.
The tool pin shape is another variable that affects the temperature of the stir zone. Different pins can affect the temperature of the workpiece due to different strain rates as well as different contact levels with the material. Akbari et al. [35] studied the effect of FSP tools with different pin shapes, consisting of hexagonal, triflate, triangular, square, and cylindrical, on temperature using the CEL approach (Figure 16).
After analyzing the data, the researchers determined that there were minor temperature variations among the samples. This was attributed to the tool shoulder being the primary heat source during the process. Since all samples utilized tools with the same shoulder size, the temperature difference between them was negligible. However, they observed that the sample created using a cylindrical tool had elevated temperatures in the region affected by the pin due to the larger surface area of the pin. Conversely, the sample made with a triangular-shaped tool experienced lower temperatures in this particular area due to its smaller pin surface area (Figure 17).
Akbari et al. [124] investigated the role of frictional heat and plastic deformation in heat production. Upon examining two models, one for calculating heat resulting from plastic deformation without accounting for friction and the other for determining the amount of frictional heat without factoring in the conversion of plastic deformation to heat, it was observed that the foremost reason for the rising temperature of the material is the heat generated by friction between the material and the tool (as depicted in Figure 18). Further analysis revealed that the increase in temperature due to frictional heat amounts to approximately 270°C, which is over three times more than the temperature increase resulting from plastic deformation. This examination clearly shows that the process of generating frictional heat is the primary mechanism responsible for elevating the material temperature, as opposed to plastic deformation.
In another study, Mohan et al. [59] investigated the effect of frictional heat generation and plastic deformation on the generated heat using the CFD method. They discovered that as tool rotational speed increases, friction-generated heat reduces while plastic deformation increases (Figure 19). Plastic deformation accounts for 48.84 percent of the total heat output at 18,000 rpm but increases to 58.32 percent and 66.21 percent at 21,000 and 24,000 rpm, respectively.
As mentioned earlier, traverse and rotational speeds play an essential role in the mechanical and microstructural properties of the welds. In previous works, the authors investigated the impact of these parameters on temperature distribution. The results of this study showed that as the rotational speed increases, as shown in Figure 20, the workpiece temperature increases. The rise in temperature results from increased rotational speed, generating additional heat through friction. Furthermore, by increasing the traverse speed, the temperature within the workpiece is diminished. As the traverse speed rises, the welding process becomes expedited, allowing the tool less opportunity to heat the component.
Higher tool rotational speed also results in a HAZ expansion and a higher maximum temperature value. Opposite results can be obtained by traverse speed variation. Figure 20 shows the HAZ width and temperature profiles in an FSW process with a constant rotational speed of 700 rpm and different traverse speeds. The higher the traverse speed, the narrower the HAZ, and the lower the peak temperature.
Cooling is an essential aspect of FSW, which can significantly affect the quality and properties of welded joints. In FSW, the metal around the rotating tool becomes plasticized and heated, and then it cools and solidifies behind the tool. The cooling rate in FSW can be affected by various factors, such as welding parameters, material properties, tool design, and cooling medium. The cooling rate can influence the microstructure and mechanical properties of the weld, including its hardness, strength, ductility, and toughness.
One of the main benefits of FSW is that it is a low-heat-input process, which minimizes thermal distortion and reduces the need for post-weld heat treatment. However, excessive cooling rates or inadequate cooling can lead to defects in the weld, such as porosity, cracking, or incomplete fusion. Various cooling methods can be used to control the cooling rate in FSW, such as air cooling, water cooling, or active cooling, using a cooling channel built into the tool. These methods can help optimize the weld microstructure and mechanical properties, increase its fatigue life, and reduce the risk of defects.
Cooling during friction stir welding in some alloys reduces grain growth and thus strengthens the mechanical properties and improves the welding quality. This is especially true for aluminium alloys. So far, various cooling methods have been performed, and their effect on welding specimens has been investigated. Modeling of cooling conditions during the process is generally done by determining a convection heat transfer coefficient according to cooling conditions. So far, several studies have investigated cooling methods using numerical models. The authors investigated different cooling methods and their effects on the sample's temperature distribution [156]. The results indicate that in the absence of cooling, the maximum temperature observed among all conditions was 493°C. However, it is worth noting that the maximum temperature observed for all samples remained below the melting point of the base material, indicating that a solid-state process had taken place. Figure 21 clearly illustrates that the use of coolants during welding leads to a reduction in weld temperature. Specifically, using air and water coolant decreased maximum temperature by 22.8% and 36.3%, respectively, compared to non-cooled samples. Moreover, the maximum temperature of water-cooled FSP samples was lower than that of air-cooled samples, likely due to the higher convective coefficient and specific heat of water relative to forced air, resulting in a higher cooling rate. Based on these findings, it can be concluded that water has the highest cooling rate, while the lowest cooling rate is observed for non-cooled samples.
Figure 22 illustrates the temperature distribution of the FSP tool and the surface of the top sample at different stages of the process. The figure showcases that using coolants has led to an increase in temperature gradient at the stir zone while simultaneously narrowing down the elevated-temperature distribution zone. As a result, heat is concentrated closer to the FSP tool in the cooling-assisted samples, causing restriction of the HAZ. This restriction effect boosts the mechanical properties of the FSP samples.
4. Strain distribution
Strain is a physical quantity that measures the amount of deformation or change in the length of a material per unit length. In FSW process, strain refers to the localized deformation or distortion that occurs in the metal during the welding process. Over the FSW, the revolving tool generates heat and pressure, which causes the metal to become plasticized and flow around the tool. As the tool moves along the joint line, the metal is subjected to different degrees of strain depending on the local conditions. For example, the metal near the front of the tool experiences high levels of strain due to the intense deformation caused by the pin and shoulder.
The distribution pattern of strain in FSW can be affected by various factors, such as welding parameters, tool design, material properties, and joint geometry. Excessive strain can lead to defects in the welded joint, such as cracks, voids, or residual stresses, compromising its strength and durability. Therefore, understanding and controlling the strain distribution within acceptable limits is an essential aspect of FSW process optimization and quality assurance. Researchers use numerical simulations, experimental tests, and non-destructive evaluation techniques to investigate the strain and other mechanical properties of welded joints made by FSW.
Maximum strains are measured on the advancing side where the tool traverse speed and peripheral velocity are positively combined. This suggests that the rotational and traverse speeds of the tool have a significant impact on material flow and deformation. The effective strain distribution and contours in the weld zone are illustrated in Figure 23 and Figure 24. It is evident from both figures that the advancing side (AS) experiences higher effective strain than the retreating side (RS).
Figure 25a showcases the strain distribution in AZ91 friction stir processing, further supporting the observation that the advancing side experiences higher effective strain. On the other hand, Figure 25b illustrates how effective strain is distributed in the cross-section of an FSP sample behind the tool pin. The figure shows that effective strain in the cross-section increases from the bottom to the top surface. This increase is attributed to the greater plastic deformation near the top surface as a result of the tool shoulder, which accelerates material flow near the top surface. Consequently, this phenomenon causes the shape of SZ to become conical [125]. Furthermore, larger effective strain values on the advancing side lead the stir zone to expand and incline toward the AS (Figure 25c).
Figure 26 displays the strain profiles in the joint cross-section for various shoulder and pin diameters. The figure shows that the strain profiles around the weld line exhibit asymmetry. It can also be inferred that an increase in the pin diameter results in a rise in maximum strain from 30 mm/mm to 45 mm/mm. On the other hand, a comparison between Figures 26a,b indicates that shoulder diameter has a lesser effect on maximum strain than the pin diameter. However, increased shoulder diameter expands the plastically deformed area due to additional material softening and heat generation [117].
A study by Meena et al. [158] utilized finite element analysis to simulate the FSW of polycarbonate. The researchers observed that the highest strain rate occurs in the SZ but sharply decreases at the TMAZ. A low strain-rate regime in the SZ indicates poor material flow due to low plasticization, which may lead to discontinuity formation at the border of the SZ and HAZ. When high tool travelling speed and low heat input are used, fluctuations in strain rate can form tiny planar cracks around the SZ. The simulation results indicate that increasing heat input increases the maximum strain rate in the SZ, as depicted in Figure 27.
Similarly, increasing the tool rotation speed while keeping the traverse speed constant also increases the strain rate. On the other hand, increasing the traverse speed while keeping the rotational velocity constant results in a lower strain rate. The researchers noted that lower heat inputs resulted in lower strain rates, which gave rise to cracks around the joint line. Additionally, an increase in tool rotational velocity resulted in a larger stir zone (plasticized area).
In a study by Memon et al. [157], underwater friction stir welding (UFSW) was simulated for welding on low-carbon steel. The simulation's findings demonstrated that the steel strain rate in the SZ was comparatively higher in the FSW joint than in the UFSW joint. An investigation of the impact of process parameter variations on the mechanical properties during FSW processes was carried out by creating a 3D FE model [159]. To ensure accuracy, the numerical results were compared with experimental results. The findings revealed that there is a strong correlation between microstructural evolution and plastic strain.
The strain distribution during FSW with various tools has been analyzed, and the results are depicted in Figure 28 [124]. The study compares the strain in joints produced using FSW/FSP, shoulderless, and pinless tools. The strain in the joint fabricated using the FSW tool was observed to be significantly higher than those produced using the shoulderless and pinless tools. This effect was attributed to the combined influence of the tool pin and the shoulder.
Additionally, the resulting strain was found to be localized in two distinct zones; one affected by the shoulder and the other by the tool pin. The shoulder-affected zone was located near the top surface of the joint and experienced a significant impact from the tool shoulder during the process. On the other hand, the pin-affected zone was dominated by the cylindrical pin and experienced a greater material strain.
It is worth noting that the maximum strain occurred at the intersection of these two zones, where the tool pin and shoulder effects overlapped. In contrast, in the absence of a pin, the strain was only observed in the shoulder-affected area, which was much lower than that observed for the FSW/FSP tool. Similarly, in the case of a shoulderless tool, only the area affected by the pin showed minimal strain.
These observations highlight the importance of the combination of the shoulder and pin effects in inducing material flow and strain in both zones under the influence of the tool. The shoulder component raises the temperature and facilitates material softening, whereas the pin component induces strain and material flow. In the absence of the tool shoulder, there is inadequate heat generation to soften the material, resulting in minimal strain. Similarly, without the tool pin, material flow is restricted to the upper surface of the sheet owing to the rotation of the tool shoulder (Figure 28).
5. The role of the residual stress
Residual stress is a common phenomenon that occurs in many welding processes, including friction stir welding. In the FSW process, residual stresses are generated due to the thermal and mechanical loadings. During FSW, the material experiences high temperatures and extreme pressures, resulting in plastic deformation and recrystallization. This, in turn, causes residual stresses to develop within the weld region.
There are two primary sources of residual stress in FSW: thermal and mechanical. Thermal stresses arise from the temperature gradients that occur during the welding process. The outer regions of the workpiece are heated and cooled more rapidly than the inner regions, leading to differential thermal expansion and contraction. This can cause tensile or compressive stresses to form in the weld. On the other hand, mechanical stresses arise from the tool movement over the material as it undergoes plastic deformation. These stresses are caused by the interaction between the tool and the material, with the tool exerting pressure and forces on the material in different directions.
The presence of residual stresses can have both positive and negative effects on the properties of the welded joint. On the positive side, residual stresses can improve the fatigue resistance of the material by reducing the likelihood of crack initiation. They can also contribute to increased strength and stiffness in the joint. However, the negative effects of residual stresses can be significant. Tensile residual stresses can lead to cracking and deformation, while compressive stresses can cause buckling and distortion. In addition, residual stresses can affect dimensional stability and contribute to corrosion and stress corrosion cracking.
To mitigate the negative effects of residual stresses, various techniques can be employed to reduce their magnitude. These include post-weld heat treatment, shot peening, and stress relief annealing. By managing residual stresses in FSW, it is possible to produce high-quality welds with improved properties and reliability.
To ensure optimal joint quality and minimize residual stress in FSW, it is important to predict the clamping force applied to the plates accurately. This is especially crucial for robotic FSW, where understanding the mechanics of the process and developing effective regulation models require precise force history data. A 3D FE model can be used to analyze the thermal history and stress evolution during FSW, enabling the computation of mechanical forces along the longitudinal, lateral, and vertical axes. By studying the relationship between factors such as tool traverse and rotational speeds, fixture release, and calculated residual stress, we can gain valuable insights into optimizing the welding process.
Due to the simultaneous application of heat and accompanying constraints in fusion welding, the workpiece develops a complicated combination of thermal and mechanical strains. These forces, known as residual stresses in fusion welding, usually approach the yield strength of the base material. Nonetheless, these stresses are minimal because FSW is a low-temperature solid-state welding method. Rigid and robust fixtures of FSW, on the other hand, place a far greater restraint on the joint plates, resulting in a higher residual stress value. These constraint stresses are caused by the weld's inability to contract.
Khandkar et al. [158] utilized a sequentially coupled thermomechanical FEM to investigate the residual stresses developed during FSW. The initial step in their model involves conducting thermal analysis to generate temperature profiles during the welding process. Subsequently, these outcomes serve as thermal input for the mechanical analysis, enabling the prediction of residual stresses and strains resulting from temperature fluctuations within confined metal plates. Some considerations are developed in works that numerically study the residual stresses in FSW joints. First and foremost, the tool's local mechanical action, particularly that of the tool pin, is ignored. Only the thermal flux is considered to study the process macro-effect on the material. Furthermore, the thermal models used to describe the heat flux caused by the tool action are always axisymmetric; therefore, the effect of asymmetric material flow in FSW is ignored.
Most of these limits were overcome by the model presented by Fratini et al. [160]. Using the FEM model, they calculated a real thermal flow that occurs during an FSW operation. Such temperature histories are supplied to a separate elastoplastic FEM model at each node of the model. As a result, the residual stress status for the butt joint under investigation is determined. In this method, the final stress condition in the material after the clamping constraints were released was highlighted in terms of longitudinal stress, i.e., the stress in the welding direction, transverse stress, and normal stress. The contours of transverse and longitudinal residual stresses are depicted in Figures 29a,b. Both transverse and longitudinal residual stresses are distributed asymmetrically, as expected, given the asymmetric nature of the material flow. The asymmetric pattern of stresses is also visible in Figure 29c, which depicts normal residual stresses. The longitudinal residual stresses are positive with the external zones under compressive stress, whereas the transverse residual stresses are responsible for the welded plate in terms of the out-of-plane distortion. It can be seen in Figure 29c that the through-thickness variation of the residual stress can be ignored.
By examining the residual stress patterns in the transverse section of a joint, valuable insight can be gained. The central region of the transverse section, as depicted in Figure 30, displays the mean residual stress. Although there is an absence of normal stresses in this diagram, longitudinal stresses are slightly greater than their transverse counterparts. Notably, the advancing side exhibits higher longitudinal stresses compared to the retreating side, particularly near the tool shoulder edge [161].
The investigation examined the impact of active cooling on the formation of welding stresses during friction stir welding [162]. The primary objective was to determine whether the use of liquid CO2 cooling systems, which are practical in several settings, could effectively decrease residual stress. The analysis indicated that a considerable reduction in residual stress could be attained, especially along the weld line, depending on the location, power, and size of the cooling sinks. Techniques employed near the boundary between the HAZ and TMAZ were observed to be more adept at lowering the stress at the weld centerline compared to those applied below the edge of the tool shoulder.
The application of the laser-ultrasonic technique was examined to identify and quantify defects, as well as to measure residual stress levels in joints created through FSW [163]. Combining the Fourier domain synthetic aperture focusing technique with laser-ultrasonic testing yields highly accurate outcomes in detecting a lack of penetration in butt joints. The detection threshold is consistent with reduced mechanical qualities. Moreover, ultrasonic frequencies up to 200 MHz enable the identification of kissing bonds in lap joints. The laser-ultrasonic technique can also be employed to explore residual stresses produced by FSW. The residual stress patterns measured across the weld line correspond well with findings from a finite element model and strain gauge measurements.
A framework for analysis was introduced to forecast the residual stresses that arise from laser shock peening of an FSW 2195 aluminium alloy specimen. This was achieved through the utilization of LS-DYNA, a finite element software [164]. An analytical framework was utilized to determine the residual stresses caused by laser shock peening. The approach involved utilizing the generated pressures as forces in an explicit transient analysis, followed by conducting an implicit spring-back analysis to identify the final residual stresses. To verify the accuracy of the methodology, a comparison was made between the residual stresses obtained from the analysis and those from a test specimen of laser-peened base material that was not subjected to friction stir welding. To simplify the study, discrete, separate materials were defined for variable material qualities and regions. The peening transient analysis integrated the welding residual stresses along with the peening residual stresses, and the blind-hole method was employed to examine the residual stresses of FSW that had undergone various welding parameters [164]. The energy parameter obtained from the FE analysis results was used to correct the strain-releasing coefficients A and B. The findings revealed that longitudinal residual stresses were asymmetrically distributed at different sides of the weld centre, with substantial longitudinal residual stresses on the advancing side and comparatively low longitudinal residual stresses on the retreating side. The transverse residual stresses amounted to around 12.7% of the base metal strength.
A study aimed to investigate how the type of alloy and welding parameters affect the magnitude and distribution of residual stresses in friction stir welding [165]. It was found that the strains produced were significantly lower than the yield strength of the materials at room temperature. On age-hardenable structural alloys, an "M-shaped" distribution of residual stress was consistently observed, with a more pronounced effect in the 6082-T6 alloy compared to the 2024-T3 alloy. However, a "plateau" distribution was observed in the strain-hardenable 5754 H111 alloy. The differences in microstructural variations in the weld centre were identified as the primary cause of the low magnitudes and discrepancies in longitudinal residual stress distribution. To explore the impact of tool traverse speed on residual stress and heat distribution, a 3D numerical simulation of FSW was conducted [166]. The suggested model took into account that material properties are temperature-dependent parameters. The resulting residual stresses indicated that heat distribution varies and is not uniform throughout the thickness of the material. However, the model only considered the impact of heat when predicting residual stress. As a result, minor differences were observed between the simulation results and experimental data. This was primarily attributed to the fact that other factors beyond heat, such as microstructural variations, may also contribute to the residual stress distribution in the actual material.
Ultrasonic measurements are a useful tool for estimating through-thickness residual stresses in aluminium plates during FSW. This method relies on the acoustic-elasticity law, which describes the relationship between material stress and acoustic waves. Specifically, longitudinal critically refracted (LCR) waves are utilized to evaluate ultrasonic stress, propagating parallel to the surface within an effective depth. Using ultrasonic transducers with distinct frequencies (1, 2, 4, and 5 MHz), the distribution of through-thickness longitudinal residual stresses can be examined by analyzing the LCR waves produced. Utilizing the FE analysis along with the LCR method (known as the FELCR method), the through-thickness longitudinal residual stress distribution of the FSW 5086 aluminium plates was achieved [167]. The findings of the ultrasonic measurement and the FE simulation were found to be in good agreement. As a result, the FELCR approach may be used for the FSW plates with success.
A research team consisting of Kaid and colleagues [168] has devised a structural-thermal model that is both non-linear and transient, capable of simulating residual stress during friction stir welding of aluminium alloy in three dimensions (3D). Their findings indicated that the residual stress increases as the welding speed increases.
A recent investigation utilized a sequential simulation process to numerically evaluate residual stresses [85]. Initially, the temperature environment was obtained from the CEL model and then applied separately to the mechanical model to analyze residual stress distribution throughout the entire dissimilar workpiece volume. The longitudinal stress component was observed to have a higher value than the transverse value. It transitioned from tensile in the central welding region to compressive outside the shoulder diameter before returning to tensile near the outer edges of the alloys. Alternatively, the transverse residual stress had a kidney-shaped profile with a compressive force below the tool probe and shoulder zone before flipping to tension with limited value beyond the shoulder diameter. The results indicated that the retreating side exhibited higher residual stresses than the advancing side (Figure 31).
The prediction of residual stresses in the joining process of duplex stainless steel (DSS) to a Cu-alloy through FSW was conducted by Shokri et al. [169] using thermomechanical simulation based on the CEL approach. The study revealed that DSS exhibited higher residual stresses than the Cu alloy. Moreover, an increase in rotation speed resulted in a decrease in longitudinal residual stress, whereas an increase in travel speed led to an increase in longitudinal residual stress. However, both speed parameters had a negligible impact on transversal residual stress.
Geng and colleagues [170] conducted a numerical analysis of the thermomechanical conditions during friction stir lap welding of dissimilar Al/steel materials. Using a three-dimensional Eulerian-based finite element model, they investigated the distribution of residual stresses. Their findings showed that increasing the rotational speed led to a higher cooling rate and welding temperature, increasing residual stress levels in the weld zone. In addition, they observed different shapes of residual stresses near the interface - an M-shape in the Al alloy and a W-shape in the steel - due to the thermomechanical processing conditions and the mismatch of thermal expansion coefficients. Furthermore, increasing the rotational speed led to a decrease in near interfacial compressive stress on the steel side.
To control and eliminate the residual stress and distortion of the FSW joint, He et al. [171] employed an external stationary shoulder. The impact of rotational speeds on temperature and stress distribution during welding was analyzed through the utilization of a thermo-mechanical model. They observed that the region where SZ and HAZ met had a significant amount of high local tensile residual stress. The cause of this stress was attributed to the mechanical force and high temperature generated by the rotational shoulder. In contrast, when utilizing stationary shoulder friction stir welding, the weld experienced an additional tensile strain from the stationary shoulder. This beneficially counteracted the compressive plastic strain and allowed for better residual stress control. Moreover, the peak tensile residual stress generated during stationary shoulder friction stir welding was about 45.9% lower than that produced by conventional FSW.
A numerical model that linked the finite element method was deployed to examine the residual stresses resulting from thermal cycling due to FSW [172]. The anticipated longitudinal stresses displayed a "W" profile and reached their maximum at 300 MPa, with tensile stress peaks within the weld and compressive stresses beyond it. The utilization of high rotational speed and low welding velocity, known as 'hot' welding conditions, notably amplified residual stresses, primarily in the transverse direction. Conversely, 'cold' welding conditions produced lower residual stresses. Neutron diffraction validated the size and distribution of the residual stresses computed through the finite element model.
Yan et al. [173] conducted numerical simulations to analyze the impact of mechanical loads on the FSW process. Their findings indicate that the downforce effectively minimizes residual stress, while torque causes an uneven distribution of residual stress. Furthermore, the mechanical loads entirely alter the residual distortion pattern from a saddle state to an anti-saddle state. A 3D thermo-mechanical model was created by Jin and Sandström [174] to analyze residual stress distributions following the FSW of copper canisters. The model coupled heat transfer and elastoplasticity analyses. The simulation findings reveal that the residual stress pattern within a thick-walled copper canister is influenced by the circumferential angle and exhibits asymmetry around the weld line. The weld line and its vicinity exhibit both tensile and compressive stresses. In general, the maximum tensile stress, as determined through FE analysis or assessed via hole-drilling or X-ray diffraction methods, remains below 50 MPa.
The impact of active cooling on the formation of welding stresses in FSW was studied to examine whether liquid CO2 cooling systems, applied at feasible locations, could produce substantial reductions in residual stress [175]. The simulations indicated that significant reductions in residual stress could be achieved by varying the size, power, and location of the cooling sinks, particularly at the weld line. The approaches used were more effective at reducing the welding centerline stress rather than those at the HAZ/TMAZ boundary (i.e., below the edge of the tool shoulder).
Bastier et al. [176] conducted a simulation of FSW consisting of two main stages. The first stage involved using a 3D-mixed FE Model to determine the material flow and temperature field during the process. The second stage utilized an elastoviscoplastic constitutive law to estimate the residual state resulting from the process. The longitudinal residual stress field displayed a bimodal profile with two peaks in the area with a high gradient of dissolved precipitates. The study observed that higher welding speeds and lower rotational speeds resulted in lower temperatures and residual distortions.
To analyze the effects of tool traverse speed on heat distribution and residual stress, a three-dimensional numerical simulation was conducted for FSW [177]. The proposed model incorporated temperature-dependent parameters to account for material characteristics. The analysis of residual stresses revealed an asymmetrical and varying heat distribution throughout the thickness. Specifically focusing on the impact of heat, the study primarily examined its contribution to the resulting residual stress. It was acknowledged as the primary factor introducing slight disparities between the simulation and experimental outcomes.
Furthermore, the investigation also explored the effects of alloy type and welding parameters on the magnitude and distribution of residual stresses across the FSW process [178]. The stresses exerted are significantly lower than the yield strength of the base material at room temperature. Age hardenable structural alloys, particularly 6082-T6 alloy compared to 2024-T3 alloy, consistently exhibit an "M-shaped" distribution pattern. Conversely, a "plateau" distribution is observed in the strain hardenable 5754 H111 alloy. The relatively low magnitude and variations in the distribution of longitudinal residual stress can primarily be attributed to microstructural modifications occurring at the weld centre.
6. Forces and torque during FSW processing
The force and torque applied to the tool during FSW are the determining parameters in the life of the welding tool. Due to the rotational and traverse speed during the process, forces are applied to the tool that causes erosion and thus reduce its life and increase the costs of the process. In addition, erosion of the tool may contaminate the joint and thus reduce the joint properties. Also, the torque on the tool is directly related to the power required for the welding process, and more power is required as the torque increases. For this purpose, measuring and controlling the force during the process is necessary to optimize the tool design, increase the life of the tool, design the retainers, increase the quality of the weld, and thus increase the strength of the weld. Generally, during the FSW, three axial, lateral, and longitudinal forces are applied to the tool (Figure 32). The vertical force acting on the tool acts to lift the tool. Because of this need to maintain the position of the tool during welding, downward vertical force is essential. The linear passage of the FSW tool through the material produces longitudinal forces on the tool. The longitudinal acting force is positive in the traverse direction and parallel to the tool motion. This force arises as a result of the material resistance to the tool motion. It is reasonable to assume that as the material temperature around the tool rises, this force will decrease. Due to the Magnus effect, the combination of tool rotational and traverse speed results in an asymmetric flow field surrounding the tool, as well as a lateral force on the tool that is perpendicular to the direction of linear motion [179]. Over the FSW, the tool position is controlled in two ways by:
the vertical position of the tool,
the force applied to the tool, which causes a change in the position of the tool.
Welding forces have been measured so far in two ways, numerically and experimentally. In experimental models, the forces applied to the tool during the process are measured by designing a special dynamometer. In numerical methods, the forces acting on the tool are generally estimated using a finite element simulation model.
Some articles discuss reliable numerical modeling of the forces generated throughout the process. Ulysse [180] presented a 3D FEM visco-plastic model for FSW of thick aluminium plates using FIDAP (Fluid Dynamics Analysis Package). The author utilized the model to forecast the forces operating on the tool pin after attaining a fair agreement between the expected and measured temperatures.
Colegrove and Shercliff [100] employed commercial CFD software to numerically investigate the effects of pin geometry on FSW, using both 2D and 3D models. Despite this approach, they found that the software's ability to predict welding forces was inadequate. Buffa et al. [118, 120] are one of the few authors reporting successful modeling of the FSW process using DEFORM-3D. They only modeled a cylindrical, smooth tool pin; however, they did validate the model by comparing experimental and anticipated temperatures. Shojaeefard et al. [181] reported successful modeling of the forces generated during FSW using DEFORM-3D software.
Figure 33 depicts the tool forces and torque that were documented by Trimble et al. [182] during their testing. During the initial plunge, when the workpiece makes contact first with the pin and then with the shoulder, the forces exerted on the tool experience significant fluctuations due to the interplay between work hardening (under axial shear and compression) and softening (as a consequence of heat generation) [179,183]. During the initial plunge of the tool into the material, when the shoulder reaches the desired depth, both the axial force and torque reach their maximum values. Subsequently, as the tool moves through the workpiece, the forces on the tool stabilize at a steady state, which is typically lower than the maximum forces experienced during plunging. However, tool failure is still risky during the plunge stage.
Numerical analysis along with experimental observation of the FSW process using a threaded pin was carried out by Atharifar et al. [179]. In the context of friction stir welding of AA6061, analysis was conducted on the various forces acting on both the pin and shoulder components. Specifically, the axial, longitudinal, and lateral forces were computed, revealing that increasing rotational speed led to a corresponding increase in axial forces while decreasing tool traverse speed resulted in the same effect. This finding was corroborated by experimental and FEA data. Interestingly, the calculated longitudinal stresses on both the tool pin and shoulder decreased as the rotational speed was raised and the tool traverse speed was lowered. This can be attributed to the fact that higher rates of heat generation caused by increased rotational speed result in lower flow stress, leading to reduced longitudinal force. Dynamic pressure distribution changes along the welding line were also identified as a factor affecting longitudinal force, with traverse speed having less impact than rotational speed on both axial and lateral forces. Moreover, it was found that the axial, lateral, and longitudinal forces experienced by the tool shoulder were considerably greater than those encountered by the tool pin. Finally, high moments were observed at low rotational and high traverse speeds. Table 4 presents a summary of how the forces acting on the welding tool are affected by travel and rotational speeds [184]. It is important to note that there are signs of either +/-in each cell, indicating if an increase in the column parameter results in an increase or decrease in the corresponding row parameter. Additionally, the symbol ~ indicates weak or no effect.
Atharifar et al. [179] investigated the variations of forces and moments acted on the FSW tool by changing the traverse and rotational speed. They found the longitudinal force diminishes as the rotational speed increases. Raising the traverse speed causes a rise in the longitudinal force. They stated that the maximum magnitude of this force is reached when the tool's rotational speed is at its minimum (300 rpm) and the traverse speed is at its maximum (210 mm/min), and the opposite is true as well. To attain fast welding while minimizing resistive force on the FSW tool, it's necessary to tilt both the rotating and traverse speed during the process.
The variation of total axial force as a function of welding parameters is investigated in this study. When the rotational and traverse speeds reach their lowest and highest points, respectively, the minimal axial force is obtained. As a result, when the traverse and rotational speeds rise, the total axial force applied to the FSW tool increases. Increased rotating speed increases the lateral force substantially. They show that tool traverse speed does not affect lateral force.
Numerical calculations depicted in Figure 34 display the forces exerted on the welding tool at different speeds. All forces experienced a significant increase as traverse speed escalated. The reason for this is the reduction in workpiece thermal softening caused by reduced heat generation, which raises the resistance that acts on the tool as it moves along the joint line. Conversely, increasing the rotational speed had the opposite effect because it produced more heat [182].
Figure 35 illustrates the computation of the impact of tool diameter on total torque, as well as the sliding and sticking components. Specifically, the sliding torque (ML) exhibits exponential growth with increasing tool shoulder diameter, while the sticking torque (MT) experiences a sharp decline. Nevertheless, the decrease in sticking torque was not significant enough, ultimately resulting in an increase in total torque.
7. Material flow during the FSW process
The material flow plays a critical role in the FSW process, as it affects the microstructure, mechanical properties, and overall weld quality. Material flow refers to the movement and mixing of the two materials being joined along the joint line. As the rotating tool moves along the joint line, it creates a continuous mixing and deformation of the materials, resulting in a homogeneous microstructure. The material first undergoes plastic deformation in front of the tool, followed by lateral flow around the tool to form a solid-state bond. This continuous mixing and deformation ensure that the welding process occurs without melting the material, making it ideal for high-strength materials and alloys.
The importance of material flow in FSW is highlighted by its effects on the microstructure and mechanical properties of the weld. Proper material flow ensures a uniform distribution of grain structure, which results in better strength, toughness, ductility, and corrosion resistance. On the other hand, improper material flow can lead to defects such as voids, porosity, and cracks, which can reduce the strength and reliability of the joint.
The material flow in FSW is a complex process that is influenced by multiple variables, such as tool geometry, process parameters, and the material being welded. Understanding the material flow characteristics is crucial for achieving high-quality welds and optimal tool design. However, being a complex phenomenon, the underlying deformation mechanism during FSW is not yet fully understood. It is important to note that several factors can affect the material flow during FSW. These include the tool geometry, such as pin and shoulder design and their relative dimensions, welding parameters, material properties, workpiece temperature, and other relevant considerations. The material flow within the stir zone, the region of the weld where the tool exerts its maximum influence, is likely to involve multiple deformation processes. The exact nature of these processes and how they interact with each other is still being studied by researchers and engineers in the field [27].
A study on the material flow of a workpiece has shown that it can be separated into three distinct layers: the top, middle, and bottom. The material flow characteristics of the AS and RS are found to differ significantly. On the RS, the material particles do not enter the AS, and those on the top surface are rotated towards the back but are not pushed into the stir zone by the tool. On the other hand, the material particles on the AS, which are rotated to the retreating side on the top surface, pile up near the border of the retreating side's stir zone. This accumulation of material causes weld flash to occur. [5].
The material flow within the welding plate thickness is depicted in Figure 36 and Figure 37. Upon comparing it to the flow pattern on the top surface, one can infer that the material particles located at the centre of the welding plate may move into the area underneath the shoulder, unlike those on the top surface. The welding tool exerts pressure to push back the material particles on the RS, while the ones on the AS can be rotated by the tool for multiple rotations before being shed off from the spinning pin. Empirical evidence has also confirmed this type of material flow [5].
Figure 37 displays the flow pattern on the bottom surface, which indicates a significant reduction in the rotating zone at the centre of the plate thickness and on the bottom surface. This phenomenon is responsible for the inverse trapezoidal shape of the stir zone.
The influence of tool traverse and rotational speed on material flow has been studied, and it has been discovered that the stirring effect rises as the rotational speed increases. On the other hand, extreme increases in tool rotating speed might result in the creation of weld flash and, as a result, negatively impact weld quality.
Tutunchilar et al. [186] explored the material flow during FSP of LM13 alloy. Using Deform-3D software, they simulated the process, assuming a constant shear friction of 0.5. Figure 38 illustrates the material flow pattern that takes place at the weld centre. The initial position of points along the centre line is shown in Figure 38a, while their positions over the FSW are depicted in Figures 38b–e. Points P7 and P8 near the bottom of the SZ exhibit a semicircular movement from the leading edge to the trailing edge. This behavior was anticipated due to the frictional shear force generated by the tool shoulder. Despite the movement of the tool pin behind it, the material adjacent to the top surface stretches towards the advancing side. This phenomenon was expected. Notably, the final location of all points, except for P1, corresponds to the SZ form, which was a fascinating discovery. P1 is an exception, as it remains attached to the shoulder and rotates with it for an unknown amount of time.
Flow patterns in the AS and RS are depicted in Figure 39. As shown, points stated at the AS spin around the pin before returning to the AS. However, the points at the RS (Figure 39) do not behave in this way, and after passing through the tool, they are distributed over both sides. Furthermore, points near the SZ root remain at the RS, and material extending toward the AS accelerates as one gets closer to the top surface. In other words, the majority of materials from all sides, after passing the tool over them, are eventually located on the AS.
Jain et al. [187] investigated the influence of smooth conical and threaded conical pin profiles on the material flow characteristics. They showed the material movement around the pin through the RS, which is slightly stretched towards the AS, holding its final position almost behind the initial position. Moreover, the thread on the tool produces a skewing action leading to a vertical flow of the material. Roy et al. [188] introduced a 3D thermal pseudo-mechanical model within an Eulerian framework to simulate the FSW of AA6061 aluminium alloy under quasi-steady state conditions. According to their findings, increasing the traverse speed and angular velocity of the pin boosted material flow, resulting in a distinct vortex on the advancing side. A CFD model was developed to simulate an aluminium-steel dissimilar butt weld using Comsol v4.3 finite element software [189]. The simulated material flow was found to be laminar and influenced by the shape of the welding tool.
A three-dimensional numerical model was showcased to analyze the material flow during the FSW process [190]. The findings suggest that the material ahead of the pin undergoes an upward motion owing to the pin's extrusion effect and rotates along with it. On the other hand, after the tool rotation, the material experiences a downward movement and settles in the wake. A study was conducted to explore the direction of material flow during FSW of transparent polyvinyl chloride (PVC), to simulate flows in aluminium alloys [191]. The investigation involved the use of a high-speed video camera, which helped capture the material flow in action. Particle Image Velocimetry (PIV) was also used to measure the material flow velocity. Numerical simulations were carried out with the help of DEFORM-3D FE software to understand the phenomenon further. Findings from the study revealed that the material flows in different directions at the AS and RS, with material velocities ranging from about 2 to 20 mm/s and 1 to 5 mm/s respectively.
A study was conducted using a finite volume model of the FSW process to investigate how shoulder and pin geometry alterations impact the plastic flow behavior of the material [192,193]. It was observed that reducing the pin cone angle or decreasing the width of the screw groove could increase the velocity of material inside the weld. Additionally, for a rotational tool with a left screw pin rotating clockwise, the material flow direction near the pin is downward, while the flow direction near the thermal-mechanical affected zone is upward, which contrasts with the flow direction for a right screw pin.
The study examined the material flow during ultra-thin 2024 aluminium alloy plate friction stir welding [194]. The copper powder was utilized as a marker material to track the material flow. The investigation employed both visual experimentation and numerical computation to gain insights into the material flow. By analyzing the results, the study revealed that rotational speed significantly impacted material flow. As the rotational speed/welding speed ratio remained constant, an increase in rotational speed led to an increase in the flow velocity of plasticized material. Conversely, the flow velocity of plasticized material decreased as the distance from the weld centre increased. Additionally, the maximum and minimum values of the flow velocity of plasticized material were observed at the intersection of the triple spiral groove of the shoulder and both sides of its outer diameter edge, respectively.
Bhattacharjee and colleagues [77] employed a 3D thermo-mechanical approach that combined the Eulerian-Lagrangian methods to examine typical flaws that arise during FSW. Their findings indicated that welding joints with slight tunnel defects were apparent when tilt angles were at 0°. Su et al. [195] developed a CFD model to investigate the relationship between FSW tool eccentricity and periodic material flow. The findings of their study indicate that tool eccentricity can be regarded as the primary cause of the observed periodic material flow behavior during the FSW process. Liu et al. [196] developed a comprehensive thermo-mechanical model for observing material movement around a tool. Their findings highlighted the complex nature of material flow on the advancing side horizontal and vertical planes, which differs greatly from that on the retreating side. Notably, the researchers discovered a region with low material density located at the back of the pin. This discovery sheds light on the underlying cause of defects, such as grooves or voids in the material.
Luo and colleagues [197] utilized the particle tracking method to investigate the behavior of material flow in different regions of a weld seam. The upper surface material was observed to move downwards due to the shoulder extrusion, while the lower portion material moved upwards in a spiral fashion as a result of the tool pin. Moreover, the amount of material flowing on the advancing side was found to be greater than that on the retreating side. The researchers also noted that abnormal material flow tended to cause defects like holes and cracks at a low rotational speed and high traverse speed. Specifically, they identified that when the welding speed was increased by two times, holes were formed in the lower portion of the advancing side (as depicted in Figure 40b). Additionally, a crack defect occurred after welding when the rotational speed was reduced by half (Figure 40a).
The impact of various pin profiles, such as conical and tapered hexagonal, on material flow during FSW was investigated by Naumov et al. [198]. In Figure 41, the flow stress iso-surfaces of 200 MPa were used to illustrate the variation in material flow between the two probe profiles. The iso-surfaces appeared similar for both probe profiles located directly under the shoulder and near the outer edge. However, the flow stress distribution around the two tool probes exhibited different morphologies. Naumov et al. demonstrated that the material reaches the stress of 200 MPa near all edges of the tapered hexagonal probe due to high strain rate values in these areas, in contrast to the conical probe where flow stress of 200 MPa could only be found under and near the bottom tip of the probe.
DEFORM™, an implicit Lagrangian code, was employed by Buffa [199] to elucidate the joint properties and material flow during FSW of Ti6Al4V and AISI 304. Their approach involved a single-block model, and to accommodate the distinct nature of both materials within the same joint, a numerical trick was implemented. The material model used was bi-phasic, with each phase representing one of the two materials - Ti6Al4V and AISI 304. The single-block workpiece was initially constructed entirely from Ti6Al4V, with a simulated "phase transformation" induced only in the region corresponding to the steel sheet. Once the transformation was completed, phase change was disabled throughout the object, thus yielding a workpiece composed of two distinct materials. Buffa et al. [198] utilized the same numerical approach to analyze the impact of process parameters on temperature distribution, strain distribution, and material flow in lap joints of AA2024 aluminium alloy and Ti6Al4V titanium alloy through FSW. To model a dissimilar FSW joint, they incorporated a fictitious phase transformation. The top sheet was created using titanium. During the experiment, an upward material flow was noticed at the sides of the SZ in the aluminium sheet, while a downward material flow was generated at the centre of the SZ in the titanium sheet. The combination of these two opposing material flows resulted in a distinct “waived” profile observed in both the macrographs and predicted by the model.
A numerical model based on computational fluid dynamics was developed by Padmanaban et al. [200] to forecast the material flow during FSW of dissimilar aluminium alloys - AA2024 and AA7075. Their analysis revealed that augmenting the rotational speed and shoulder diameter resulted in an upsurge of material flow while increasing the traverse speed reduced the material flow within the SZ. A coupled Eulerian-Lagrangian approach was employed by Das et al. [142] to simulate material mixing and defects numerically. They utilized the EVF method to anticipate the presence of dissimilar welding materials on the RS and AS of the weld centerline. An EVF value of 0.5 indicated that a single element contained both materials.
With the tool rotation, the material on the retreating side was pushed into the advancing side, while an equal amount of material from the AS was pushed into the RS. Figure 42c and d shows the cross-sectional view of the material flow at the end of the dwelling stage. Figure 42c showcased the presence of some AZ31B on the AS, whereas the existence of AA6061 on the RS was minimal in Figure 42d. This demonstrated that material from the RS flowed more easily into the AS than vice versa at the end of the dwelling stage due to the lower modulus of elasticity of AZ31B compared to AA6061. The easy plasticization, rotation, and material deposition around the dwelling tool were noted as a result. The simulation results demonstrated that the welding plate position significantly influenced the formation of defects, both on the AS and RE. For instance, when AZ31B was placed on the AS, the surface tunnel defect reached almost half the thickness of the workpiece. Additionally, the numerical model effectively captured the formation of defects resulting from changes in tool dimensions caused by wear. At higher tool rotations and traverse speeds, the length of the pin decreased by up to 30% after welding, resulting in the formation of surface tunnel defects.
In a study by Mirzaei et al. [201], numerical modeling was used to explore the double shoulder friction stir welding of AZ91 magnesium alloy using the CEL method. The investigation focused on the impact of pin profile on material flow during welding (Figure 43). Results indicated that the movement of material in the shoulder-driven and pin-driven zones was distinct, with material flowing from the AS towards the RS in the latter. The authors noted that while the trigonal pin could move larger boxes of material due to its longer sweeping lever, the hexagonal pin tool produced the most even material movement and optimal material coalescence. Conversely, the inward conical pin tool resulted in weak material flow patterns and tunnel cavity formation in the welding zone. However, the outward conical pin tool created a subsidiary material flow that improved material coalescence, leading to increased strain, smaller grain size, and superior mechanical properties compared to the inward conical pin tool.
In a research article by Akbari et al. [202], dissimilar friction stir lap welding of aluminium and brass using the CEL method was studied to investigate material mixing and SZ formation. The model provided successful predictions of SZ formation and material mixing at the Al/CuZn34 interface, with aluminium penetrating the centre of brass and ear-shaped brass penetrating the Al sheet at the periphery of the SZ (Figure 44).
Furthermore, the authors demonstrated that decreasing the traverse speed increased the amount of dispersed brass within the aluminium matrix while increasing the traverse speed had the opposite effect. This outcome was attributed to improved heat production and favourable material flow.
8. Microstructural modeling and simulation
Over the past few years, numerous models have been suggested to replicate microstructure transformations in metallic alloys during the FSW process and resulting hardness profiles. The ultimate aim of these models is to ascertain the final properties of combined materials and the positive/negative consequences of the FSW process on them. The development of these approaches is typically tailored based on the authors' objectives and ideas and is executed at a specific scale. Furthermore, the methods commonly discussed in the literature can be divided into three primary categories:
Molecular Dynamics models,
Precipitation modeling,
Grain Evolution modeling.
8.1. Molecular Dynamics (MD) models
Molecular Dynamics (MD) models are a type of computational simulation that use Newton's laws to study the behavior of atoms and molecules in a system over time. In the context of FSW, MD models simulate the movement of atoms around the weld zone as they heat up and interact with one another during the welding process.
MD models can provide information on the evolution of the microstructure during FSW, including the formation of dislocations, grain boundaries, and other crystal defects. They also offer insights into the role of different parameters, such as temperature, pressure, and deformation rate, on the welded joint's final properties.
One of the significant advantages of MD models is their ability to capture the atomic-level details of the welding process, which is impossible with other modeling approaches. However, MD models are computationally expensive and require high-performance computing resources to run simulations for a sufficient duration to obtain meaningful results.
There have been some studies that suggest the feasibility of defect analyses through molecular dynamics simulations. Dmitriev et al. [203] conducted an atomic scale modeling study to investigate the mechanisms responsible for structural inhomogeneity during FSW when significant plastic deformation occurs. The simulation involved the movement of atoms induced by the tool's motion, resulting in non-equilibrium states in the crystal lattice that were analyzed and discussed.
Nikonov et al. [204] proposed a simulation to reproduce atom movement induced by mixing when a cylindrical tool passes between two inter-crystallite boundaries of similar grain orientation. In this case, copper material was used, and new positions of atoms were shown with various shades of grey, indicating the movements of the material. The thickness of the area impacted by FSW was about the size of the tool, which is approximately 3.6 nm. At a larger distance, atoms still occupied their original position. The spatial distribution of atoms in the two metals and structural defects was presented in the same direction. The material was moved toward the right-hand side part as a combination of rotational and feeding rate directions. A common neighbour method was used for analysis, revealing low structural defects in pieces. The original local topology was well preserved, as expected, in the neighbourhood of the original boundaries.
According to Dmitriev et al. [203] and Nikonov et al., molecular dynamics simulations can contribute to a better understanding of the basic laws governing the origin of structural inhomogeneity in FSW processes. However, integrating the results of molecular dynamics simulations at the macro-scale may pose some difficulties. It may be challenging to link process parameters used in molecular dynamics simulations to realistic process values, making it complex to investigate the effect of FSW process conditions on defect occurrence and weld quality and optimize welding parameters. This point has been discussed extensively in the literature.
8.2. Precipitate size distribution (PSD) models
In materials science and engineering, precipitation modeling is focused on studying the evolution of precipitates within a metal matrix at the micro-scale. These approaches aim to understand how the size distribution of precipitates changes over time during the FSW process, as induced by temperature and heat evolutions.
Numerous models have been documented in the literature that allows the tracking of phase fractions during the FSW process through additive approaches that are considered semi-analytical. According to Simar et al. [203], these approaches are called 'Internal variable models', relying solely on numerical integration of the material's thermal cycles. The temperature evolution is estimated preliminarily at a macro-scale using thermo-mechanical simulations of the FSW process or even analytical estimation. Precipitate evolutions are then computed step by step based on an integrative approach, with the temperature evolution serving as input to determine the increase or decrease of precipitate fractions during infinitesimal time steps. To couple precipitate evolution to FE simulation, the dissolution model is kept simple following the proposal by Myhr and Grong [205].
Frigaard et al. [206] utilized a model to anticipate microstructure changes in the HAZ and present comparisons with experimental observations. Validation of the heat flow model introduced for welding temperature evolution was also conducted through these comparisons. The primary focus of the microstructure evolutions is on Vickers hardness measurement. Two grades of aluminium, AA7108-T6 and AA6082-T6, were examined. The process model accurately predicts the response of the parent material, as evidenced by the similarities in predicted and expected hardness profiles. During cooling, there is a clear decrease in hardness in the HAZ due to the partial dissolution of hardening phases (β’’ and η’ respectively) in the two grades, resulting in the growth of non-hardening phases (β’ and η respectively) and solute depletion in the aluminium matrix.
The PSD model was first introduced by Wagner and Kampmann [207] and subsequently enhanced by Myhr and Grong [208] through a finite difference approach. This method allows for monitoring of the evolving precipitate size distribution across all stages of the precipitation process. Compared to the semi-analytical models outlined earlier, this approach provides a more comprehensive understanding of the size distribution and precipitate evolution, which is crucial in predicting complex phenomena and properties such as corrosion behavior or fracture toughness, as previously noted.
Several authors have utilized a model to simulate the evolution of PSD during heating and cooling stages in FSW processes. Gallais et al. [209] noted that there are numerous models reported in the literature, ranging from Monte-Carlo to phenomenological approaches, which cover various time and spatial scales. However, both approaches have limitations and cannot provide relevant information on material enduring non-isothermal transformations at the weld scale. Consequently, the PSD model appears to be the only relevant approach capable of providing valuable data by integrating the entire precipitation stages endured in materials, including growth, nucleation, and coarsening. One of the first proposed approaches dedicated to the modeling of microstructure evolution in FSW was suggested by Simar et al. [210]. It considered the influence of supersaturated solid solution and followed the coarsening and dissolution of fine hardening precipitates in AA6005A-T6 grades during thermal cycles. Successful comparisons were developed with experimental results.
A PSD model focused on AA7449 aluminium grades, which includes recrystallization mechanisms, was developed by Dos Santos et al. [211]. This model was integrated into a process model that utilizes the CFD framework developed in FLUENT. The PSD model tracks the development of three distinct precipitate populations and considers the impact of grain refinement on precipitation mechanisms in a coupled approach between grains and precipitates. This method can be applied to various aluminium grades and process parameters, and it closely imitates the size distribution and temporal evolution of precipitates.
8.3. Grain evolution (GE) modeling
The hot forming of aluminium alloys in FSW processing causes dynamic recrystallization (DRX) to occur in the SZ, leading to a refined and homogenous microstructure. There have been attempts by various authors to predict the grain size evolution during FSW, but there are still controversies regarding the underlying mechanisms, as pointed out by Huang and Logé [212]. Low and medium Stacking Fault Energy (SFE) materials such as 304 stainless steel typically exhibit Discontinuous Dynamic Recrystallization (DDRX), where nucleation of annealed grains happens during strain, according to Humphreys and Hatherly [213]. However, aluminium alloys are considered high SFE alloys, and two other types of DRX, namely Geometric Dynamic Recrystallization (GDRX) and Continuous Dynamic Recrystallization (CDRX), are commonly observed under these conditions, as noted by Doherty et al. [214].
The phenomenon known as CDRX involves the fragmentation of grains due to the formation of new grain boundaries, according to Gourdet and Montheillet's explanation [215]. Meanwhile, Huang and Logé [212] propose that subgrains with Low Angle Grain Boundaries (LAGBs) undergo progressive rotation during deformation to form new grains with High Angle Grain Boundaries (HAGBs). As a result, smaller and more homogeneous equiaxed grains are generated. On the other hand, GDRX suggests that elongation occurs in deformed grains until serrations are pinched off, leading to the appearance of new equiaxed grains and a decrease in grain thickness. However, there are limited numerical models for both CDRX and GDRX, so current reviews on grain size evolution in the SZ mainly focus on these two approaches. While the mechanisms behind GDRX are generally well understood, its modeling is often based on simple geometric assumptions such as cubic or spherical grain shapes, as proposed by Gholinia et al. [216] for an Al-3Mg-0.2Cr-0.2Fe alloy. Similarly, Gourdet et al. [217] used MacQueen's GDRX theory based on similar hypotheses. A more sophisticated model was employed by De Pari and Misiolek [218], who utilized a truncated octahedron to produce significant results.
Using FE or analytical models can help predict the thermomechanical history, which can then be coupled with microstructural evolution. Various methods can be used to develop the latter, including fully analytical models or less conventional approaches such as cellular automation (CA) or Monte Carlo (Potts models). Microstructure evolution modeling can be categorized into three groups:
- (i)
- material models based on physical properties and evolution laws such as DDRX, CDRX, or GDRX models,
- (ii)
- empirical methods commonly used in Cellular Automaton – Finite Element (CAFE) models, but require extensive calibration steps,
- (iii)
- Monte Carlo methods that consider final observations as a possible evolution through stochastic simulation.
Limited sources in the literature focus on modeling microstructure evolution in FSW using the DDRX approach to nucleate new grains in aluminium alloys during stirring processes. However, Hofmann and Vecchio [219] developed activities to apply the Derby-Ashby [220] model to cooling curves obtained from thermocouples data when measuring temperature in stirred aluminium alloys. This model is associated with DDRX phenomena and is one of the few reported activities in the literature to model DDRX phenomena during the stirring of aluminium alloys.
Hofmann and Vecchio [219] investigated two processes, FSP and Submerged FSP (SFSP), developed on AA6061 aluminium grade. These processes aim to produce bulk samples with fine-grained microstructure by inducing severe plastic deformation on the material. Though FSP and SFSP differ from the FSW processes investigated in this article, both lead to large recrystallization mechanisms when the material undergoes a high stirring mechanism. In both cases, strain and temperature evolutions on the material induce recrystallization, leading to a new microstructure.
Wan et al. [221] proposed a Zener-Hollomon (Z-H) parameter to model grain size evolution during FSW. This approach is related to the nucleation of new grains on current grain boundaries and corresponds to physical processes occurring in DDRX approaches. The anticipated sizes of the grains vary from 9.32 to 9.62 μm in proximity to the upper surface and from 8.29 to 8.84 μm near the lower surface. As the rotational speed escalates, there is an increase in the average grain size on both the top and bottom surfaces. Specifically, the average grain size progresses from 9.11 μm at 715 rpm to 27.5 μm at 1500 rpm. The authors provide an explanation that emphasizes the heightened significance of cooling during the thermal cycle at higher rotational speeds. This leads to particles experiencing prolonged cooling durations, thereby resulting in extended recovery and grain growth after recrystallization.
The research conducted by Shojaeefard et al. [222] utilized an Avrami model from DEFORM-3DTM software coupled with numerical fields to predict microstructural changes during the FSW process. They also used a modified Laasraoui Jonas model coupled with a CA method to simulate recrystallization mechanisms and then compared their experimental results. The study focused on AA1100 aluminium grades. The microstructure evolution model was based on both grain growth kinetics and nucleation rate, categorizing it as a DDRX approach. Figure 45 presents the results obtained by Shojaeefard et al. [222] on AA1100 aluminium grades, which showed good agreement between experimental and simulation measurements in the SZ.
Robson and Campbell [223] present an innovative model for microstructure evolution in the stir zone, focusing on recrystallization and grain growth. The foundation of their approach lies in the GDRX model initially proposed by Prangnell and Heason [224]. Additionally, they have developed a process model capable of accurately predicting the primary thermomechanical fields within the nugget zone. All experimental tests and computations have been calibrated explicitly for AA2524 aluminium alloys. Notably, the research findings have also been extended to explore the influence of dispersoid particles and the effect of cooling rate. The study also takes into account the phenomenon of grain coarsening after stirring.
The widely adopted Gourdet and Montheillet (GM) model [215] presents a comprehensive framework for understanding continuous dynamic recrystallization (CDRX). According to this model, CDRX can be attributed to the interplay of three fundamental mechanisms: dynamic recovery, strain hardening, and high-angle grain boundary (HAGB) migration. The GM model characterizes the polycrystalline structure by analyzing the dislocation density distribution within the joint and sub-joints during deformation.
During the process, a portion of the dislocations generated by strain hardening forms new sub-joints with minimal disorientation angles (approximately 1°). Meanwhile, the remaining dislocations either vanish at the grain boundaries or merge into pre-existing sub-joints. In the latter case, the disorientation of the sub-joints gradually increases, eventually reaching a critical angle (approximately 15°) where they transform into joints. The model considers grain boundaries as mobile interfaces that undergo an elimination mechanism when encountering migrating dislocations. A fraction of the recovered dislocations contributes to forming low-angle grain boundaries (LAGBs) while existing boundaries assimilate others. Additionally, some dislocations are eliminated by HAGBs.
Applications of Monte-Carlo models in FSW modeling have been utilized to analyze the alteration in grain texture maps during the forming process, specifically in response to temperature fields. Some literature exists on developing and applying Potts models to simulate microstructure evolution in FSW processes. Grujicic et al. [225] implemented a thermo-mechanical model incorporating microstructure evolution through a Monte Carlo simulation algorithm. This model successfully predicted grain structure changes within the weld zones throughout the entire process, including the cooling stage. In this model, temperature variations were computed using a FEM. The competition between recrystallization mechanisms and grain growth, which contributes to grain refinement, was modeled based on local temperature distributions.
Zhang et al. [226] similarly employed a similar approach to study grain growth evolution in AA6082-T6 aluminum grade. Additionally, particles were monitored through thermo-mechanical simulations to estimate the stirring domain known as the TMAZ. The region experiencing grain growth evolution is also associated with HAZ. Zhang emphasized the efficacy of these methods in accurately predicting grain growth, topological features, and various phenomena such as welding, abnormal grain growth, anisotropic grain growth, and polycrystalline microstructure evolution. It is worth noting that these models are commonly applied to simulate grain structure alterations resulting from recrystallization processes and the corresponding changes in temperature fields leading to texture evolution in different domains. Consequently, this comprehensive approach provides a final representation of the microstructure field induced by the FSW process.
The research done by Yu et al. [227] utilized the Monte Carlo technique to create a computational model for simulating the dynamic recrystallization process in FSW of aluminium plates. The study involved selecting a suitable DRX nucleation model designed explicitly for Monte Carlo simulation. Furthermore, they adjusted the Monte Carlo simulation step to ensure its correlation with real-time conditions.
On the transverse cross-section, within the horizontal plane that includes tracking point C2 (positioned 2 mm below the top surface of the workpiece), a total of 5 points were chosen on both the advancing and retreating sides, as depicted in Figure 46a. These selected points were situated at a distance of 3-7 mm from the centre C2 of the weld nugget zone (WNZ), with an increment of 1 mm. The simulated grain structure at these locations within the WNZ and the TMAZ of the final weld was illustrated in Figures 46b,c, respectively, revealing the impact under two distinct welding conditions.
Due to the lower rotational speed of the tool, which is associated with reduced heat input, the grain size in the case of 600 rpm is observed to be smaller than that of 800 rpm, as depicted in Figures 46b,c. As the distance from the joint centre (C2, 0 mm) increases, the area occupied by refined dynamically recrystallized grains gradually decreases. Finer grains are observed within a range of 4 mm from the weld centre. Complete DRX takes place within a 3 mm range around the weld centre.
Additionally, there are notable differences in grain structures between the advancing and retreating sides. On the advancing side, the microstructures within a 5-6 mm distance from the centre exhibit a distinct boundary separating the weld and the base metal. However, the microstructure variation is less pronounced in the same region on the retreating side. In both test cases, not only the grain size but also the distribution of grain structure exhibits noticeable dissimilarities, particularly on the retreating side of the joint.
According to the illustration provided in Figure 46, it can be observed that the number of DRX grains on the RS is higher under the condition of 600 rpm compared to that at 800 rpm. This suggests that as the heat input increases during FSW, the extent of dynamic recrystallization within the weld diminishes. One potential explanation for this phenomenon is that dislocations become more prone to activation and migration under higher temperature conditions, resulting in significant dislocation annihilation. Consequently, the reduced density of dislocations leads to a decreased likelihood of dynamic recrystallization taking place.
Zhang and colleagues [228] utilized a sophisticated three-dimensional Monte Carlo model, incorporating nucleation in each Monte Carlo step, to simulate the process of grain growth during FSW. Their findings indicated that the presence of equiaxed grains within the SZ escalated as the shoulder's diameter and rotation speed were augmented. Moreover, an exciting observation emerged, revealing that as the rotational speed or shoulder diameter increased, the grain sizes tended to greater uniformity from the retreating side to the advancing side.
In their study, Wu and colleagues [229] employed the Monte Carlo method to simulate grain growth during FSW of AA6082-T6 while considering the effects of precipitation. The results revealed that reducing the volume fraction of precipitation from 0.8% to 0.2% after welding could increase the final grain size in the nugget zone by approximately 39.7%. Additionally, it was observed that both the speed of grain growth and the ultimate grain size on the top surface exceeded those on the bottom surface. This disparity can be attributed to the rise in welding temperature resulting from increased rotation speeds or axial forces, which subsequently lead to decreased volume fractions of precipitates and, consequently, larger grain sizes.
Khodabakhshi and colleagues [230] devised a novel approach that merged CFD modeling with Monte Carlo simulation to forecast the process of grain refinement during the FSP of an Al-Mg alloy. Considering crucial parameters such as rotational tool speed (w) and traverse velocity (v), thermal and strain rate distributions were simulated and subsequently utilized as inputs for a statistical model of dynamic recrystallization. As a result of FSP, equiaxed grains were generated, exhibiting average sizes ranging from 3 to 10 µm. These dimensions depended on the heat input index expressed in terms of w/v ratios falling within the range of 4 to 28 revolutions per minute per millimetre.
9. Summary conclusions
Numerical models play a crucial role in the advancement of friction stir welding, providing numerous benefits that contribute to the development and optimization of this innovative joining process. Numerical models simulate the complex thermal and mechanical phenomena occurring during FSW, allowing researchers and engineers to gain a deeper understanding of the process. These models help elucidate the intricate interaction between the rotating tool, workpiece, and heat generation, aiding in the identification of critical parameters and their impact on weld quality. Moreover, Numerical models assist in predicting and mitigating defects commonly associated with FSW, such as voids, tunnelling, or excessive flash formation. These models simulate the material flow, temperature distribution, and stress state during welding, enabling the identification of potential defect-prone zones. By identifying critical process parameters, engineers can implement modifications to minimize or eliminate defects, ensuring high-quality welds.
This paper provides a comprehensive review of the research activities and advancements made in numerical analysis techniques for friction stir welding. The focus is on the applicability of these techniques to component manufacturing. To begin with, various types of numerical methods and modeling techniques employed in FSW analysis are examined. These methods include finite element analysis, computational fluid dynamics, and other simulation approaches. The advantages and limitations of each method are discussed, shedding light on their suitability for FSW simulations.
Next, the paper delves into the variables that play a crucial role in the numerical modeling of the FSW process. Important factors such as tool geometry, rotational speed, and traverse speed are thoroughly considered. The influence of these variables on the thermal and mechanical behavior during FSW is explored, providing insights into their impact on weld quality.
Furthermore, the paper highlights the modeling of microstructure behavior in FSW. This aspect focuses on predicting the evolution of grain structure, phase transformations, and material properties within the weld zone. The importance of accurately capturing these microstructural changes is emphasized as they directly affect the mechanical strength and integrity of the welded joint.
Throughout the paper, the practical applicability of numerical analysis techniques in the manufacturing of components using FSW is underscored. The ability to optimize process parameters, predict defects, and enhance weld quality through numerical simulations is highlighted. By leveraging these techniques, engineers and researchers can expedite the development and optimization of FSW processes, resulting in improved manufacturing outcomes.
The references provided in this paper are not exhaustive; however, they offer a comprehensive overview of the utilization of various numerical methods within the subject area. The primary objective of this paper is to examine recent advancements in numerical analysis of friction stir welding and establish a foundation for future investigations.
Nomenclature
| ALE | Arbitrary Lagrangian-Eulerian |
| AS | Advancing side |
| BSS | Boundary shear stress |
| BV | Boundary velocity |
| CA | Cellular automaton |
| CDRX | Continuous Dynamic Recrystallization |
| CEL | Coupled Eulerian-Lagrangian |
| CFD | Computational fluid dynamics |
| CFSW | Conventional friction stir welding |
| SM | Computational solid mechanics |
| DDRX | Discontinuous Dynamic Recrystallization |
| DRX | Dynamic recrystallization |
| FE | Finite element |
| FEM | Finite element method |
| FGM | Functionally graded material |
| FSP | Friction stir processing |
| FSSW | Friction stir spot weld |
| FSW | Friction stir welding |
| FVM | Finite volume method |
| GDRX | Geometric Dynamic Recrystallization |
| HAGBs | High Angle Grain Boundaries |
| HAZ | Heat-affected zone |
| LAGBs | Low Angle Grain Boundaries |
| LCR | Longitudinal critically refracted |
| NZ | Nugget zone |
| PIV | Particle Image Velocimetry |
| RS | Retreating side |
| SFE | Stacking Fault Energy |
| SFSP | Submerged FSP |
| SPH | Smoothed particle hydrodynamics |
| SZ | Stir zone |
| TMAZ | Thermo-mechanically affected zone |
| TWI | The Welding Institute |
| UFSW | Underwater friction stir welding |
| VOF | Volume of fluid |
| WZ | Welds zone |
References
- Çam, G.; Javaheri, V.; Heidarzadeh, A. Advances in FSW and FSSW of dissimilar Al-alloy plates. Journal of Adhesion Science and Technology 2023, 37, 162–194. [Google Scholar] [CrossRef]
- Sambasivam, S.; Gupta, N.; saeed jassim, A.; Pratap Singh, D.; Kumar, S.; Mohan Giri, J.; Gupta, M. A review paper of FSW on dissimilar materials using aluminum. Materials Today: Proceedings 2023. [CrossRef]
- Zhang, Z.; Zhang, H.W. Numerical studies on the effect of transverse speed in friction stir welding. Materials & Design 2009, 30, 900–907. [Google Scholar] [CrossRef]
- Aziz, S.B.; Dewan, M.W.; Huggett, D.J.; Wahab, M.A.; Okeil, A.M.; Liao, T.W. A Fully Coupled Thermomechanical Model of Friction Stir Welding (FSW) and Numerical Studies on Process Parameters of Lightweight Aluminum Alloy Joints. Acta Metallurgica Sinica (English Letters) 2018, 31, 1–18. [Google Scholar] [CrossRef]
- Zhang, Z.; Zhang, H.W. Numerical studies on controlling of process parameters in friction stir welding. Journal of Materials Processing Technology 2009, 209, 241–270. [Google Scholar] [CrossRef]
- Shojaeefard, M.; Akbari, M.; Asadi, P. Multi objective optimization of friction stir welding parameters using FEM and neural network. Int. J. Precis. Eng. Manuf. 2014, 15, 2351–2356. [Google Scholar] [CrossRef]
- Dialami, N.; Cervera, M.; Chiumenti, M. Effect of the Tool Tilt Angle on the Heat Generation and the Material Flow in Friction Stir Welding. Metals 2019, 9. [Google Scholar] [CrossRef]
- Aghajani Derazkola, H.; Kordani, N.; Aghajani Derazkola, H. Effects of friction stir welding tool tilt angle on properties of Al-Mg-Si alloy T-joint. CIRP Journal of Manufacturing Science and Technology 2021, 33, 264–276. [Google Scholar] [CrossRef]
- Long, L.; Chen, G.; Zhang, S.; Liu, T.; Shi, Q. Finite-element analysis of the tool tilt angle effect on the formation of friction stir welds. Journal of Manufacturing Processes 2017, 30, 562–569. [Google Scholar] [CrossRef]
- Meyghani, B.; Awang, M. The Influence of the Tool Tilt Angle on the Heat Generation and the Material Behavior in Friction Stir Welding (FSW). Metals 2022, 12, 1837. [Google Scholar]
- Marzbanrad, J.; Akbari, M.; Asadi, P.; Safaee, S. Characterization of the Influence of Tool Pin Profile on Microstructural and Mechanical Properties of Friction Stir Welding. Metallurgical and Materials Transactions B 2014, 45, 1887–1894. [Google Scholar] [CrossRef]
- Fourment, L.; Guerdoux, S. 3D numerical simulation of the three stages of Friction Stir Welding based on friction parameters calibration. International Journal of Material Forming 2008, 1, 1287–1290. [Google Scholar] [CrossRef]
- Kim, S.-D.; Yoon, J.-Y.; Na, S.-J. A study on the characteristics of FSW tool shapes based on CFD analysis. Weld World 2017, 61, 915–926. [Google Scholar] [CrossRef]
- Dialami, N.; Cervera, M.; Chiumenti, M.; Agelet de Saracibar, C. A fast and accurate two-stage strategy to evaluate the effect of the pin tool profile on metal flow, torque and forces in friction stir welding. International Journal of Mechanical Sciences 2017, 122, 215–227. [Google Scholar] [CrossRef]
- Ghiasvand, A.; Hassanifard, S. Numerical simulation of FSW and FSSW with pinless tool of AA6061-T6 Al alloy by CEL approach. Journal of Solid and Fluid Mechanics 2018, 8, 65–75. [Google Scholar] [CrossRef]
- Malik, V.; Sanjeev, N.K.; Hebbar, H.S.; Kailas, S.V. Investigations on the Effect of Various Tool Pin Profiles in Friction Stir Welding Using Finite Element Simulations. Procedia Engineering 2014, 97, 1060–1068. [Google Scholar] [CrossRef]
- Chupradit, S.; Bokov, D.O.; Suksatan, W.; Landowski, M.; Fydrych, D.; Abdullah, M.E.; Derazkola, H.A. Pin Angle Thermal Effects on Friction Stir Welding of AA5058 Aluminum Alloy: CFD Simulation and Experimental Validation. Materials 2021, 14. [Google Scholar] [CrossRef]
- Ghiasvand, A.; Kazemi, M.; Mahdipour Jalilian, M.; Ahmadi Rashid, H. Effects of tool offset, pin offset, and alloys position on maximum temperature in dissimilar FSW of AA6061 and AA5086. Int J Mech Mater Eng 2020, 15, 6. [Google Scholar] [CrossRef]
- Aghajani Derazkola, H.; Simchi, A. Experimental and thermomechanical analysis of the effect of tool pin profile on the friction stir welding of poly(methyl methacrylate) sheets. Journal of Manufacturing Processes 2018, 34, 412–423. [Google Scholar] [CrossRef]
- Hasan, A.F.; Bennett, C.J.; Shipway, P.H. A numerical comparison of the flow behaviour in Friction Stir Welding (FSW) using unworn and worn tool geometries. Materials & Design 2015, 87, 1037–1046. [Google Scholar] [CrossRef]
- Shirvanimoghaddam, K.; Khayyam, H.; Abdizadeh, H.; Karbalaei Akbari, M.; Pakseresht, A.H.; Abdi, F.; Abbasi, A.; Naebe, M. Effect of B4C, TiB2 and ZrSiO4 ceramic particles on mechanical properties of aluminium matrix composites: Experimental investigation and predictive modelling. Ceramics International 2016, 42, 6206–6220. [Google Scholar] [CrossRef]
- Shirvanimoghaddam, K.; Khayyam, H.; Abdizadeh, H.; Karbalaei Akbari, M.; Pakseresht, A.H.; Ghasali, E.; Naebe, M. Boron carbide reinforced aluminium matrix composite: Physical, mechanical characterization and mathematical modelling. Materials Science and Engineering: A 2016, 658, 135–149. [Google Scholar] [CrossRef]
- Shojaeefard, M.H.; Akbari, M.; Asadi, P.; Khalkhali, A. The effect of reinforcement type on the microstructure, mechanical properties, and wear resistance of A356 matrix composites produced by FSP. The International Journal of Advanced Manufacturing Technology 2016, 1–17. [Google Scholar] [CrossRef]
- Shojaeefard, M.H.; Akbari, M.; Khalkhali, A.; Asadi, P. Effect of tool pin profile on distribution of reinforcement particles during friction stir processing of B4C/aluminum composites. Proceedings of the Institution of Mechanical Engineers, Part L: Journal of Materials Design and Applications 2016. [CrossRef]
- Akbari, M.; Rahimi Asiabaraki, H.; Hassanzadeh, E.; Esfandiar, M. Simulation of dissimilar friction stir welding of AA7075 and AA5083 aluminium alloys using Coupled Eulerian–Lagrangian approach. Welding International 2023, 1–11. [Google Scholar]
- Akbari, M.; Asiabaraki, H.R.; Aliha, M.R.M. Investigation of the effect of welding and rotational speed on strain and temperature during friction stir welding of AA5083 and AA7075 using the CEL approach. Engineering Research Express 2023, 5, 025012. [Google Scholar] [CrossRef]
- Mishra, R.S.; Ma, Z.Y. Friction stir welding and processing. Materials Science and Engineering: R: Reports 2005, 50, 1–78. [Google Scholar] [CrossRef]
- Khalaf, H.I.; Al-Sabur, R.; Abdullah, M.E.; Kubit, A.; Derazkola, H.A. Effects of Underwater Friction Stir Welding Heat Generation on Residual Stress of AA6068-T6 Aluminum Alloy. Materials 2022, 15. [Google Scholar] [CrossRef]
- Gadakh, V.S.; Adepu, K. Heat generation model for taper cylindrical pin profile in FSW. Journal of Materials Research and Technology 2013, 2, 370–375. [Google Scholar] [CrossRef]
- Terasaki, T.; Akiyama, T. Mechanical Behaviour of Joints in FSW: Residual Stress, Inherent Strain and Heat Input Generated by Friction Stir Welding. Weld World 2003, 47, 24–31. [Google Scholar] [CrossRef]
- Akbari, M.; Rahimi Asiabaraki, H. Modeling and optimization of tool parameters in friction stir lap joining of aluminum using RSM and NSGA II. Welding International 2023, 37, 21–33. [Google Scholar] [CrossRef]
- Krasnowski, K.; Hamilton, C.; Dymek, S. Influence of the tool shape and weld configuration on microstructure and mechanical properties of the Al 6082 alloy FSW joints. Archives of Civil and Mechanical Engineering 2015, 15, 133–141. [Google Scholar] [CrossRef]
- Sadoun, A.M.; Wagih, A.; Fathy, A.; Essa, A.R.S. Effect of tool pin side area ratio on temperature distribution in friction stir welding. Results in Physics 2019, 15, 102814. [Google Scholar] [CrossRef]
- Mishra, R.S.; Ma, Z.Y. Friction stir welding and processing. Materials Science and Engineering: R: Reports 2005, 50, 1–78. [Google Scholar] [CrossRef]
- Akbari, M.; Ezzati, M.; Asadi, P. Investigation of the effect of tool probe profile on reinforced particles distribution using experimental and CEL approaches. International Journal of Lightweight Materials and Manufacture 2022, 5, 213–223. [Google Scholar] [CrossRef]
- Das, S.S.; Raja, A.R.; Nautiyal, H.; Gautam, R.K.S.; Jha, P.; Sharma, J.; Singh, S. A Review on Aluminum Matrix Composites Synthesized by FSP. In Proceedings of the Macromolecular Symposia; 2023; p. 2200119. [Google Scholar]
- Akbari, M.; Asadi, P.; Aliha, M.; Berto, F. Modeling and Optimization of Process Parameters of the Piston Alloy-Based Composite Produced by Fsp Using Response Surface Methodology. Surface Review and Letters 2023, 30, 2350041. [Google Scholar]
- Mehri, A.; Abdollah-zadeh, A.; Habibi, N.; Hajian, M.; Wang, J.T. The Effects of Rotational Speed on Microstructure and Mechanical Properties of Friction Stir-Welded 7075-T6 Thin Sheet. J. of Materi Eng and Perform 2020, 29, 2316–2323. [Google Scholar] [CrossRef]
- Elmetwally, H.T.; SaadAllah, H.N.; Abd-Elhady, M.; Abdel-Magied, R.K. Optimum Rotational and Traverse Speeds of Al-Cu Joints Welded by FSW Based on the Formability of The Joint. 2021.
- Khan, N.Z.; Bajaj, D.; Siddiquee, A.N.; Khan, Z.A.; Abidi, M.H.; Umer, U.; Alkhalefah, H. Investigation on effect of strain rate and heat generation on traverse force in FSW of dissimilar aerospace grade aluminium alloys. Materials 2019, 12, 1641. [Google Scholar] [PubMed]
- Zhang, C.; Huang, G.; Cao, Y.; Zhu, Y.; Liu, Q. On the microstructure and mechanical properties of similar and dissimilar AA7075 and AA2024 friction stir welding joints: Effect of rotational speed. Journal of Manufacturing Processes 2019, 37, 470–487. [Google Scholar] [CrossRef]
- Zhai, M.; Wu, C.; Su, H. Influence of tool tilt angle on heat transfer and material flow in friction stir welding. Journal of Manufacturing Processes 2020, 59, 98–112. [Google Scholar] [CrossRef]
- Rajendran, C.; Srinivasan, K.; Balasubramanian, V.; Balaji, H.; Selvaraj, P. Effect of tool tilt angle on strength and microstructural characteristics of friction stir welded lap joints of AA2014-T6 aluminum alloy. Transactions of Nonferrous Metals Society of China 2019, 29, 1824–1835. [Google Scholar] [CrossRef]
- Kumar, S.S.; Murugan, N.; Ramachandran, K.K. Effect of tool tilt angle on weld joint properties of friction stir welded AISI 316L stainless steel sheets. Measurement 2020, 150, 107083. [Google Scholar] [CrossRef]
- Park, J.-H.; Park, S.-H.; Park, S.-H.; Joo, Y.-H.; Kang, M. Evaluation of mechanical properties with tool rotational speed in dissimilar cast aluminum and high-strength steel of lap jointed friction stir welding. 한국기계가공학회지 2019, 18, 90–96. [Google Scholar]
- Anand, R.; Sridhar, V.G. Studies on process parameters and tool geometry selecting aspects of friction stir welding – A review. Materials Today: Proceedings 2020, 27, 576–583. [Google Scholar] [CrossRef]
- Correia, A.N.; Santos, P.A.M.; Braga, D.F.O.; Baptista, R.; Infante, V. Effects of Friction Stir Welding Process Control and Tool Penetration on Mechanical Strength and Morphology of Dissimilar Aluminum-to-Polymer Joints. Journal of Manufacturing and Materials Processing 2023, 7. [Google Scholar] [CrossRef]
- Yoon, J.; Kim, C.; Rhee, S. Performance of Plunge Depth Control Methods During Friction Stir Welding. Metals 2019, 9, 283. [Google Scholar]
- Asadi, P.; Aliha, M.R.M.; Akbari, M.; Imani, D.M.; Berto, F. Multivariate optimization of mechanical and microstructural properties of welded joints by FSW method. Engineering Failure Analysis 2022, 140, 106528. [Google Scholar] [CrossRef]
- Asadi, P.; Akbari, M.; Karimi-Nemch, H. 12 - Simulation of friction stir welding and processing. In Advances in Friction-Stir Welding and Processing, Givi, M.K.B., Asadi, P., Eds.; Woodhead Publishing: 2014; pp. 499-542.
- Colegrove, P.; Shercliff, H. Two-dimensional CFD modelling of flow round profiled FSW tooling. Science and technology of welding and joining 2004, 9, 483–492. [Google Scholar]
- Kim, S.-D.; Yoon, J.-Y.; Na, S.-J. A study on the characteristics of FSW tool shapes based on CFD analysis. Weld World 2017, 61, 915–926. [Google Scholar]
- Pal, S.; Phaniraj, M. Determination of heat partition between tool and workpiece during FSW of SS304 using 3D CFD modeling. Journal of Materials Processing Technology 2015, 222, 280–286. [Google Scholar]
- Hasan, A. CFD modelling of friction stir welding (FSW) process of AZ31 magnesium alloy using volume of fluid method. Journal of Materials Research and Technology 2019, 8, 1819–1827. [Google Scholar]
- Savaş, A. Investigating the influence of tool shape during FSW of aluminum alloy via CFD analysis. Journal of the Chinese Institute of Engineers 2016, 39, 211–220. [Google Scholar]
- Colegrove, P.A.; Shercliff, H.R. 3-Dimensional CFD modelling of flow round a threaded friction stir welding tool profile. Journal of Materials Processing Technology 2005, 169, 320–327. [Google Scholar] [CrossRef]
- Chen, G.; Ma, Q.; Zhang, S.; Wu, J.; Zhang, G.; Shi, Q. Computational fluid dynamics simulation of friction stir welding: A comparative study on different frictional boundary conditions. Journal of Materials Science & Technology 2018, 34, 128–134. [Google Scholar] [CrossRef]
- Chen, G.; Feng, Z.; Zhu, Y.; Shi, Q. An alternative frictional boundary condition for computational fluid dynamics simulation of friction stir welding. J. of Materi Eng and Perform 2016, 25, 4016–4023. [Google Scholar]
- Mohan, R.; Jayadeep, U.; Manu, R. CFD modelling of ultra-high rotational speed micro friction stir welding. Journal of Manufacturing Processes 2021, 64, 1377–1386. [Google Scholar]
- Chen, G.; Shi, Q.; Zhang, S. Recent development and applications of CFD simulation for friction stir welding. In Proceedings of the CFD Modeling and Simulation in Materials Processing 2018; 2018; pp. 113–118. [Google Scholar]
- Kumar, R.R.; Kumar, A.; Kumar, A.; Ansu, A.K.; Goyal, A.; Saxena, K.K.; Prakash, C.; Prasad, J.L. Thermal simulation on friction stir welding of AA6061 aluminum alloy by computational fluid dynamics. International Journal on Interactive Design and Manufacturing (IJIDeM) 2023. [CrossRef]
- Myung, D.; Noh, W.; Kim, J.-H.; Kong, J.; Hong, S.-T.; Lee, M.-G. Probing the Mechanism of Friction Stir Welding with ALE Based Finite Element Simulations and Its Application to Strength Prediction of Welded Aluminum. Metals and Materials International 2021, 27, 650–666. [Google Scholar] [CrossRef]
- Jain, R.; Pal, S.K.; Singh, S.B. Finite Element Simulation of Temperature and Strain Distribution during Friction Stir Welding of AA2024 Aluminum Alloy. Journal of The Institution of Engineers (India): Series C 2017, 98, 37–43. [Google Scholar] [CrossRef]
- Gök, K.; Aydin, M. Investigations of friction stir welding process using finite element method. The International Journal of Advanced Manufacturing Technology 2013, 68, 775–780. [Google Scholar] [CrossRef]
- Fratini, L.; Buffa, G.; Palmeri, D.; Hua, J.; Shivpuri, R. Material flow in FSW of AA7075–T6 butt joints: numerical simulations and experimental verifications. Science and Technology of Welding and Joining 2006, 11, 412–421. [Google Scholar] [CrossRef]
- Akbari, M.; Asadi, P. Optimization of microstructural and mechanical properties of friction stir welded A356 pipes using Taguchi method. Materials Research Express 2019, 6, 066545. [Google Scholar] [CrossRef]
- Chinna Rao, J.T.; Harikiran, V.; Gurudatta, K.S.S.; Kumar Raju, M.V.D. Temperature and strain distribution during friction stir welding of AA6061 and AA5052 aluminum alloy using deform 3D. Materials Today: Proceedings 2022, 59, 576–582. [Google Scholar] [CrossRef]
- Buffa, G.; Fratini, L.; Micari, F.; Shivpuri, R. Material Flow in FSW of T-joints: Experimental and Numerical Analysis. International Journal of Material Forming 2008, 1, 1283–1286. [Google Scholar] [CrossRef]
- Buffa, G.; Hua, J.; Shivpuri, R.; Fratini, L. Design of the friction stir welding tool using the continuum based FEM model. Materials Science and Engineering: A 2006, 419, 381–388. [Google Scholar] [CrossRef]
- Asadi, P.; Besharati Givi, M.K.; Akbari, M. Microstructural simulation of friction stir welding using a cellular automaton method: a microstructure prediction of AZ91 magnesium alloy. Int J Mech Mater Eng 2015, 10, 20. [Google Scholar] [CrossRef]
- Buffa, G.; Hua, J.; Shivpuri, R.; Fratini, L. A continuum based fem model for friction stir welding—model development. Materials Science and Engineering: A 2006, 419, 389–396. [Google Scholar] [CrossRef]
- Trimble, D.; Monaghan, J.; O’Donnell, G.E. Force generation during friction stir welding of AA2024-T3. CIRP Annals 2012, 61, 9–12. [Google Scholar] [CrossRef]
- Pashazadeh, H.; Teimournezhad, J.; Masoumi, A. Numerical investigation on the mechanical, thermal, metallurgical and material flow characteristics in friction stir welding of copper sheets with experimental verification. Materials & Design 2014, 55, 619–632. [Google Scholar] [CrossRef]
- Buffa, G.; Fratini, L.; Shivpuri, R. CDRX modelling in friction stir welding of AA7075-T6 aluminum alloy: Analytical approaches. Journal of Materials Processing Technology 2007, 191, 356–359. [Google Scholar] [CrossRef]
- Fratini, L.; Macaluso, G.; Pasta, S. Residual stresses and FCP prediction in FSW through a continuous FE model. Journal of Materials Processing Technology 2009, 209, 5465–5474. [Google Scholar] [CrossRef]
- Akbari, M.; Asadi, P. Dissimilar friction stir lap welding of aluminum to brass: Modeling of material mixing using coupled Eulerian–Lagrangian method with experimental verifications. Proceedings of the Institution of Mechanical Engineers, Part L: Journal of Materials: Design and Applications 2020, 234, 1117–1128. [Google Scholar] [CrossRef]
- Bhattacharjee, R.; Datta, S.; Hammad, A.; Biswas, P. Prediction of various defects and material flow behavior during dissimilar FSW of DH36 shipbuilding steel and marine grade AA5083 using FE-based CEL approach. Modelling and Simulation in Materials Science and Engineering 2023, 31, 035004. [Google Scholar]
- Asadi, P.; Mirzaei, M.; Akbari, M. Modeling of pin shape effects in bobbin tool FSW. International Journal of Lightweight Materials and Manufacture 2022, 5, 162–177. [Google Scholar] [CrossRef]
- Raut, N.; Yakkundi, V.; Vartak, A. A numerical technique to analyze the trend of temperature distribution in the friction stir welding process for titanium Ti 6Al 4V. Materials Today: Proceedings 2021, 41, 329–334. [Google Scholar]
- Malik, V.; Sanjeev, N.; Hebbar, H.S.; Kailas, S.V. Time efficient simulations of plunge and dwell phase of FSW and its significance in FSSW. Procedia Materials Science 2014, 5, 630–639. [Google Scholar]
- Grujicic, M.; Yavari, R.; Ramaswami, S.; Snipes, J.; Galgalikar, R. Computational analysis of inter-material mixing and weld-flaw formation during dissimilar-filler-metal friction stir welding (FSW). Multidiscipline Modeling in Materials and Structures 2015, 11, 322–349. [Google Scholar]
- Iordache, M.D.; Badulescu, C.; Diakhate, M.; Constantin, M.A.; Nitu, E.L.; Demmouche, Y.; Dhondt, M.; Negrea, D. A numerical strategy to identify the FSW process optimal parameters of a butt-welded joint of quasi-pure copper plates: modeling and experimental validation. The International Journal of Advanced Manufacturing Technology 2021, 115, 2505–2520. [Google Scholar]
- Das, D.; Bag, S.; Pal, S.; Sharma, A. Material Defects in Friction Stir Welding through Thermo–Mechanical Simulation: Dissimilar Materials with Tool Wear Consideration. Materials 2023, 16, 301. [Google Scholar]
- Salloomi, K.N. Defect monitoring in dissimilar friction stir welding of aluminum alloys using Coupled Eulerian-Lagrangian (CEL) finite element model. Advances in Materials and Processing Technologies 2022, 1–17. [Google Scholar]
- Raut, N.N.; Yakkundi, V.; Vartak, A.; Teli, S. Effect of Plunging and Dwelling Period on Temperature Profile and Energy Dissipation in FSSW and Its Relevance in FSW. In Proceedings of the Proceedings of International Conference on Intelligent Manufacturing and Automation: ICIMA 2020, 2020; pp. 211–220.
- Chalurkar, C.; Shukla, D.K. Temperature Analysis of Friction Stir Welding (AA6061-T6) with Coupled Eulerian-Lagrangian Approach. In Proceedings of the IOP Conference Series: Materials Science and Engineering; 2022; p. 012035. [Google Scholar]
- Salih, O.S.; Ou, H.; Sun, W. Heat generation, plastic deformation and residual stresses in friction stir welding of aluminium alloy. International Journal of Mechanical Sciences 2023, 238, 107827. [Google Scholar]
- Salloomi, K.N.; Al-Sumaidae, S. Coupled Eulerian–Lagrangian prediction of thermal and residual stress environments in dissimilar friction stir welding of aluminum alloys. Journal of Advanced Joining Processes 2021, 3, 100052. [Google Scholar]
- Teng, L.; Lu, X.; Luan, Y.; Sun, S. Predicting axial force in friction stir welding thick 2219 aluminum alloy plate. The International Journal of Advanced Manufacturing Technology 2023, 126, 1025–1034. [Google Scholar] [CrossRef]
- Ghiasvand, A.; Suksatan, W.; Tomków, J.; Rogalski, G.; Derazkola, H.A. Investigation of the Effects of Tool Positioning Factors on Peak Temperature in Dissimilar Friction Stir Welding of AA6061-T6 and AA7075-T6 Aluminum Alloys. Materials 2022, 15, 702. [Google Scholar] [PubMed]
- Iordache, M.; Nitu, E.; Bădulescu, C.; Iacomi, D.; Boţilă, L.N.; Radu, B. Evaluation of Thermal Distribution in Friction Stir Welding on Dissimilar Materials (Cu-Al) Using Infrared Thermography and Numerical Simulation. In Proceedings of the Advanced Materials Research; 2016; pp. 113–118. [Google Scholar]
- Ajri, A.; Shin, Y.C. Investigation on the effects of process parameters on defect formation in friction stir welded samples via predictive numerical modeling and experiments. Journal of Manufacturing Science and Engineering 2017, 139. [Google Scholar]
- Akbari, M.; Asadi, P.; Behnagh, R.A. Modeling of material flow in dissimilar friction stir lap welding of aluminum and brass using coupled Eulerian and Lagrangian method. The International Journal of Advanced Manufacturing Technology 2021, 113, 721–734. [Google Scholar]
- Al-Badour, F.; Merah, N.; Shuaib, A.; Bazoune, A. Coupled Eulerian Lagrangian finite element modeling of friction stir welding processes. Journal of Materials Processing Technology 2013, 213, 1433–1439. [Google Scholar] [CrossRef]
- Ragab, M.; Liu, H.; Yang, G.-J.; Ahmed, M.M. Friction stir welding of 1Cr11Ni2W2MoV martensitic stainless steel: Numerical simulation based on coupled Eulerian Lagrangian approach supported with experimental work. Applied Sciences 2021, 11, 3049. [Google Scholar]
- Das, D.; Bag, S.; Pal, S. Investigating surface defect by tool-material interaction in friction stir welding using coupled Eulerian-Lagrangian approach. Manufacturing Letters 2021, 30, 23–26. [Google Scholar]
- Choudhary, A.K.; Jain, R. Numerical prediction of various defects and their formation mechanism during friction stir welding using coupled Eulerian-Lagrangian technique. Mechanics of Advanced Materials and Structures 2022, 1–14. [Google Scholar]
- Nandan, R.; Roy, G.G.; Lienert, T.J.; Debroy, T. Three-dimensional heat and material flow during friction stir welding of mild steel. Acta Materialia 2007, 55, 883–895. [Google Scholar] [CrossRef]
- Liu, X.; Chen, G.; Ni, J.; Feng, Z. Computational Fluid Dynamics Modeling on Steady-State Friction Stir Welding of Aluminum Alloy 6061 to TRIP Steel. Journal of Manufacturing Science and Engineering 2016, 139. [Google Scholar] [CrossRef]
- Colegrove, P.A.; Shercliff, H.R. Two-dimensional CFD modelling of flow round profiled FSW tooling. Science and Technology of Welding and Joining 2004, 9, 483–492. [Google Scholar] [CrossRef]
- Pal, S.; Phaniraj, M.P. Determination of heat partition between tool and workpiece during FSW of SS304 using 3D CFD modeling. Journal of Materials Processing Technology 2015, 222, 280–286. [Google Scholar] [CrossRef]
- Tiwari, A.; Pankaj, P.; Suman, S.; Biswas, P. CFD Modelling of Temperature Distribution and Material Flow Investigation During FSW of DH36 Shipbuilding Grade Steel. Trans Indian Inst Met 2020, 73, 2291–2307. [Google Scholar] [CrossRef]
- Hasan, A.F. CFD modelling of friction stir welding (FSW) process of AZ31 magnesium alloy using volume of fluid method. Journal of Materials Research and Technology 2019, 8, 1819–1827. [Google Scholar] [CrossRef]
- Mohan, R. ; U. B, J.; R, M. CFD modelling of ultra-high rotational speed micro friction stir welding. Journal of Manufacturing Processes 2021, 64, 1377–1386. [Google Scholar] [CrossRef]
- Yang, C.; Wu, C.; Gao, S. Computational fluid dynamics model of AA6061 friction stir welding with considering mechanical anisotropy. Materials Today Communications 2022, 32, 103991. [Google Scholar] [CrossRef]
- Pankaj, P.; Tiwari, A.; Dhara, L.N.; Biswas, P. Multiphase CFD simulation and experimental investigation of friction stir welded high strength shipbuilding steel and aluminum alloy. CIRP Journal of Manufacturing Science and Technology 2022, 39, 37–69. [Google Scholar] [CrossRef]
- Yang, C.; Wu, C.; Shi, L. Modeling the dissimilar material flow and mixing in friction stir welding of aluminum to magnesium alloys. Journal of alloys and compounds 2020, 843, 156021. [Google Scholar]
- Kadian, A.K.; Biswas, P. The study of material flow behaviour in dissimilar material FSW of AA6061 and Cu-B370 alloys plates. Journal of Manufacturing Processes 2018, 34, 96–105. [Google Scholar] [CrossRef]
- Liu, X.; Chen, G.; Ni, J.; Feng, Z. Computational fluid dynamics modeling on steady-state friction stir welding of aluminum alloy 6061 to TRIP steel. Journal of Manufacturing Science and Engineering 2017, 139. [Google Scholar]
- Bokov, D.O.; Jawad, M.A.; Suksatan, W.; Abdullah, M.E.; Świerczyńska, A.; Fydrych, D.; Derazkola, H.A. Effect of pin shape on thermal history of aluminum-steel friction stir welded joint: Computational fluid dynamic modeling and validation. Materials 2021, 14, 7883. [Google Scholar] [PubMed]
- Zhang, X.; Shi, L.; Wu, C.; Yang, C.; Gao, S. Multi-phase modelling of heat and mass transfer during Ti/Al dissimilar friction stir welding process. Journal of Manufacturing Processes 2023, 94, 240–254. [Google Scholar] [CrossRef]
- Jiang, T.; Wu, C.; Shi, L. Effects of tool pin thread on temperature field and material mixing in friction stir welding of dissimilar Al/Mg alloys. Journal of Manufacturing Processes 2022, 74, 112–122. [Google Scholar] [CrossRef]
- Yang, C.; Wu, C.; Shi, L. Analysis of friction reduction effect due to ultrasonic vibration exerted in friction stir welding. Journal of Manufacturing Processes 2018, 35, 118–126. [Google Scholar]
- Sadeghian, B.; Taherizadeh, A.; Atapour, M. Simulation of weld morphology during friction stir welding of aluminum-stainless steel joint. Journal of Materials Processing Technology 2018, 259, 96–108. [Google Scholar]
- Carlone, P.; Palazzo, G.S. Influence of process parameters on microstructure and mechanical properties in AA2024-T3 friction stir welding. Metallography, Microstructure, and Analysis 2013, 2, 213–222. [Google Scholar]
- Gould, J.E.; Feng, Z. Heat flow model for friction stir welding of aluminum alloys. Journal of Materials Processing and Manufacturing Science 1998, 7, 185–194. [Google Scholar]
- Shojaeefard, M.H.; Khalkhali, A.; Akbari, M.; Asadi, P. Investigation of friction stir welding tool parameters using FEM and neural network. Proceedings of the Institution of Mechanical Engineers, Part L: Journal of Materials Design and Applications 2013.
- Buffa, G.; Hua, J.; Shivpuri, R.; Fratini, L. A continuum based fem model for friction stir welding—model development. Materials Science and Engineering: A 2006, 419, 389–396. [Google Scholar] [CrossRef]
- Buffa, G.; Hua, J.; Shivpuri, R.; Fratini, L. Design of the friction stir welding tool using the continuum based FEM model. Materials Science and Engineering: A 2006, 419, 381–388. [Google Scholar] [CrossRef]
- Buffa, G.; Ducato, A.; Fratini, L. FEM based prediction of phase transformations during Friction Stir Welding of Ti6Al4V titanium alloy. Materials Science and Engineering: A 2013, 581, 56–65. [Google Scholar] [CrossRef]
- Dong, P.; Lu, F.; Hong, J.; Cao, Z. Coupled thermomechanical analysis of friction stir welding process using simplified models. Science and Technology of welding and joining 2001, 6, 281–287. [Google Scholar]
- Chao, Y.J.; Qi, X.; Tang, W. Heat transfer in friction stir welding—experimental and numerical studies. J. Manuf. Sci. Eng. 2003, 125, 138–145. [Google Scholar]
- Chen, C.; Kovacevic, R. Thermomechanical modelling and force analysis of friction stir welding by the finite element method. Proceedings of the Institution of Mechanical Engineers, Part C: Journal of Mechanical Engineering Science 2004, 218, 509–519. [Google Scholar]
- Akbari, M.; Aliha, M.R.M.; Berto, F. Investigating the role of different components of friction stir welding tools on the generated heat and strain. Forces in Mechanics 2023, 10, 100166. [Google Scholar] [CrossRef]
- Asadi, P.; Mahdavinejad, R.A.; Tutunchilar, S. Simulation and experimental investigation of FSP of AZ91 magnesium alloy. Materials Science and Engineering: A 2011, 528, 6469–6477. [Google Scholar] [CrossRef]
- Shi QY, W.X. , Kang X, Sun YJ. Temperature fields during friction stir welding. J Tsinghua Univ 2010;, 50, 980-983.
- Deng, X.; Xu, S. Two-dimensional finite element simulation of material flow in the friction stir welding process. Journal of manufacturing processes 2004, 6, 125–133. [Google Scholar]
- Schmidt, H.N.B.; Hattel, J. Modelling thermomechanical conditions at the tool/matrix interface in Friction Stir Welding. In Proceedings of the 5th International Friction Stir Welding Symposium; 2004. [Google Scholar]
- Mandal, S.; Rice, J.; Elmustafa, A. Experimental and numerical investigation of the plunge stage in friction stir welding. Journal of materials processing technology 2008, 203, 411–419. [Google Scholar]
- Guerdoux, S.; Fourment, L. A 3D numerical simulation of different phases of friction stir welding. Modelling and Simulation in Materials Science and Engineering 2009, 17, 075001. [Google Scholar] [CrossRef]
- Assidi, M.; Fourment, L. Accurate 3D friction stir welding simulation tool based on friction model calibration. International Journal of Material Forming 2009, 2, 327–330. [Google Scholar]
- Asadi, P.; Akbari, M. Numerical modeling and experimental investigation of brass wire forming by friction stir back extrusion. The International Journal of Advanced Manufacturing Technology 2021, 116, 3231–3245. [Google Scholar] [CrossRef]
- Iordache, M.D.; Badulescu, C.; Diakhate, M.; Constantin, M.A.; Nitu, E.L.; Demmouche, Y.; Dhondt, M.; Negrea, D. A numerical strategy to identify the FSW process optimal parameters of a butt-welded joint of quasi-pure copper plates: modeling and experimental validation. The International Journal of Advanced Manufacturing Technology 2021, 115, 2505–2520. [Google Scholar] [CrossRef]
- Ragab, M.; Liu, H.; Yang, G.-J.; Ahmed, M.M.Z. Friction Stir Welding of 1Cr11Ni2W2MoV Martensitic Stainless Steel: Numerical Simulation Based on Coupled Eulerian Lagrangian Approach Supported with Experimental Work. Applied Sciences 2021, 11, 3049. [Google Scholar]
- Hoßfeld, M. A fully coupled thermomechanical 3D model for all phases of friction stir welding. 2016.
- Ajri, A.; Shin, Y. Investigation on the Effects of Process Parameters on Defect Formation in Friction Stir Welded Samples via Predictive Numerical Modeling and Experiments; 2017; p. V001T002A008.
- Akbari, M.; Rahimi Asiabaraki, H.; Hassanzadeh, E.; Esfandiar, M. Simulation of dissimilar friction stir welding of AA7075 and AA5083 aluminium alloys using Coupled Eulerian–Lagrangian approach. Welding International 2023, 37, 174–184. [Google Scholar] [CrossRef]
- Chen, K.; Liu, X.; Ni, J. Thermal-mechanical modeling on friction stir spot welding of dissimilar materials based on Coupled Eulerian-Lagrangian approach. The International Journal of Advanced Manufacturing Technology 2017, 91, 1697–1707. [Google Scholar] [CrossRef]
- Chauhan, P.; Jain, R.; Pal, S.K.; Singh, S.B. Modeling of defects in friction stir welding using coupled Eulerian and Lagrangian method. Journal of Manufacturing Processes 2018, 34, 158–166. [Google Scholar] [CrossRef]
- Al-Badour, F.; Merah, N.; Shuaib, A.; Bazoune, A. Thermo-mechanical finite element model of friction stir welding of dissimilar alloys. The International Journal of Advanced Manufacturing Technology 2014, 72, 607–617. [Google Scholar] [CrossRef]
- Safari, M.; Joudaki, J. Coupled Eulerian-Lagrangian (CEL) Modeling of Material Flow in Dissimilar Friction Stir Welding of Aluminum Alloys. Iranian Journal of Materials Forming 2019, 6, 10–19. [Google Scholar] [CrossRef]
- Das, D.; Bag, S.; Pal, S.; Sharma, A. Material Defects in Friction Stir Welding through Thermo–Mechanical Simulation: Dissimilar Materials with Tool Wear Consideration. Materials 2023, 16, 301. [Google Scholar]
- Pan, W.; Li, D.; Tartakovsky, A.M.; Ahzi, S.; Khraisheh, M.; Khaleel, M. A new smoothed particle hydrodynamics non-Newtonian model for friction stir welding: Process modeling and simulation of microstructure evolution in a magnesium alloy. International Journal of Plasticity 2013, 48, 189–204. [Google Scholar] [CrossRef]
- Bagheri, B.; Abdollahzadeh, A.; Abbasi, M.; Kokabi, A.H. Numerical analysis of vibration effect on friction stir welding by smoothed particle hydrodynamics (SPH). The International Journal of Advanced Manufacturing Technology 2020, 110, 209–228. [Google Scholar] [CrossRef]
- Bagheri, B.; Abbasi, M.; Abdolahzadeh, A.; Kokabi, A.H. Numerical analysis of cooling and joining speed effects on friction stir welding by smoothed particle hydrodynamics (SPH). Archive of Applied Mechanics 2020, 90, 2275–2296. [Google Scholar] [CrossRef]
- Schmidt, H.; Hattel, J.; Wert, J. An analytical model for the heat generation in friction stir welding. MODELLING AND SIMULATION IN MATERIALS SCIENCE AND ENGINEERING 2004, 12, 143–157. [Google Scholar] [CrossRef]
- Chao, Y.; Qi, X.; Tang, W. Heat Transfer in Friction Stir Welding—Experimental and Numerical Studies. Journal of Manufacturing Science and Engineering-transactions of The Asme - J MANUF SCI ENG 2003, 125. [CrossRef]
- Anders, L.; Mathias, S.; Hattel, J.H. Estimating the workpiece-backing plate heat transfer coefficient in friction stirwelding. Engineering Computations 2012, 29, 65–82. [Google Scholar] [CrossRef]
- Prasanna, P.; Rao, B.S.; Rao, G.K.M. Finite element modeling for maximum temperature in friction stir welding and its validation. Int J Adv Manuf Technol 2010, 51, 925–933. [Google Scholar] [CrossRef]
- Xu JD, V.S. , Ritter RJ, Colligan KJ, Pickens JR.
- numerical study of thermal process in friction stir welding. ASM Conf Proc: Join Adv Special Mater 2004;, 10-19.
- Awang, M.; Mucino, V.H. Energy generation during friction stir spot welding (FSSW) of Al 6061-T6 plates. Materials and Manufacturing Processes 2010, 25, 167–174. [Google Scholar]
- Kim, D.; Badarinarayan, H.; Kim, J.H.; Kim, C.; Okamoto, K.; Wagoner, R.; Chung, K. Numerical simulation of friction stir butt welding process for AA5083-H18 sheets. European Journal of Mechanics-A/Solids 2010, 29, 204–215. [Google Scholar]
- LÜ, S.; Yan, J.; Li, W.; Yang, S. SIMULATION ON TEMPERATURE FIELD OF FRICTION STIR WELDED JOINTS OF2024-T4 AL. 金属学报英文版 2005, 18, 552. [Google Scholar]
- Rajesh, S.; Bang, H.S.; Kim, H.J.; Bang, H.S. Analysis of complex heat flow phenomena with friction stir welding using 3D-analytical model. In Proceedings of the Advanced Materials Research; 2007; pp. 339–344. [Google Scholar]
- Zhang, Z.; Bie, J.; Liu, Y.; Zhang, H. Effect of traverse/rotational speed on material deformations and temperature distributions in friction stir welding. Journal of Materials Science & Technology 2008, 24, 907. [Google Scholar]
- Akbari, M.; Asadi, P. Effects of different cooling conditions on friction stir processing of A356 alloy: Numerical modeling and experiment. Proceedings of the Institution of Mechanical Engineers, Part C: Journal of Mechanical Engineering Science 2021, 236, 4133–4146. [Google Scholar] [CrossRef]
- Besharati-Givi, M.-K.; Asadi, P. Advances in friction-stir welding and processing; Elsevier: 2014.
- Meena, S.L.; Murtaza, Q.; Walia, R.S.; Niranjan, M.S.; Tyagi, A. Modelling and simulation of FSW of polycarbonate using Finite element analysis. Materials Today: Proceedings 2022, 50, 2424–2429. [Google Scholar] [CrossRef]
- 张昭; 张洪武. Effect of process parameters on quality of friction stir welds. 材料研究学报 2006, 20, 504–512.
- Fratini, L.; Macaluso, G.; Pasta, S. Residual stresses and FCP prediction in FSW through a continuous FE model. Journal of Materials Processing Technology 2009, 209, 5465–5474. [Google Scholar] [CrossRef]
- Ge, Y.Z.; Sutton, M.A.; Deng, X.; Reynolds, A.P. Limited weld residual stress measurements in fatigue crack propagation: Part I. Complete field representation through least-squares finite-element smoothing. Fatigue & Fracture of Engineering Materials & Structures 2006, 29, 524–536. [Google Scholar] [CrossRef]
- Richards, D.G.; Prangnell, P.B.; Withers, P.J.; Williams, S.W.; Nagy, T.; Morgan, S. Efficacy of active cooling for controlling residual stresses in friction stir welds. Science and Technology of Welding and Joining 2010, 15, 156–165. [Google Scholar] [CrossRef]
- Lévesque, D.; Dubourg, L.; Blouin, A. Laser ultrasonics for defect detection and residual stress measurement of friction stir welds. Nondestructive Testing and Evaluation 2011, 26, 319–333. [Google Scholar] [CrossRef]
- Carney, K.; Hatamleh, O.; Smith, J.; Matrka, T.; Gilat, A.; Hill, M.; Truong, C. A numerical simulation of the residual stresses in laser-peened friction stir-welded aluminum 2195 joints; 2011; Volume 2, pp. 62-73.
- Deplus, K.; Simar, A.; Haver, W.V.; Meester, B.d. Residual stresses in aluminium alloy friction stir welds. The International Journal of Advanced Manufacturing Technology 2011, 56, 493–504. [Google Scholar] [CrossRef]
- Riahi, M.; Nazari, H. Analysis of transient temperature and residual thermal stresses in friction stir welding of aluminum alloy 6061-T6 via numerical simulation. The International Journal of Advanced Manufacturing Technology 2011, 55, 143–152. [Google Scholar] [CrossRef]
- Sadeghi, S.; Najafabadi, M.A.; Javadi, Y.; Mohammadisefat, M. Using ultrasonic waves and finite element method to evaluate through-thickness residual stresses distribution in the friction stir welding of aluminum plates. Materials & Design (1980-2015) 2013, 52, 870–880. [Google Scholar] [CrossRef]
- Kaid, M.; Zemri, M.; Brahami, A.; Zahaf, S. Effect of friction stir welding (FSW) parameters on the peak temperature and the residual stresses of aluminum alloy 6061-T6: numerical modelisation. International Journal on Interactive Design and Manufacturing (IJIDeM) 2019, 13, 797–807. [Google Scholar] [CrossRef]
- Shokri, V.; Sadeghi, A.; Sadeghi, M.H. Thermomechanical modeling of friction stir welding in a Cu-DSS dissimilar joint. Journal of Manufacturing Processes 2018, 31, 46–55. [Google Scholar] [CrossRef]
- Geng, P.; Morimura, M.; Wu, S.; Liu, Y.; Ma, Y.; Ma, N.; Aoki, Y.; Fujii, H.; Ma, H.; Qin, G. Prediction of residual stresses within dissimilar Al/steel friction stir lap welds using an Eulerian-based modeling approach. Journal of Manufacturing Processes 2022, 79, 340–355. [Google Scholar] [CrossRef]
- He, W.; Li, M.; Song, Q.; Liu, J.; Hu, W. Efficacy of External Stationary Shoulder for Controlling Residual Stress and Distortion in Friction Stir Welding. Trans Indian Inst Met 2019, 72, 1349–1359. [Google Scholar] [CrossRef]
- Dubourg, L.; Doran, P.; Gharghouri, M.A.; Larose, S.; Jahazi, M. Prediction and measurements of thermal residual stresses in AA2024-T3 friction stir welds as a function of welding parameters. In Proceedings of the Materials Science Forum; 2010; pp. 1215–1220. [Google Scholar]
- Aiping, Y.D.S.Q.W.; Silvanus, J. Numerical analysis on the functions of stir tool's mechanical loads during friction stir welding. Acta Metall Sin 2009, 45, 994–999. [Google Scholar]
- Jin, L.-Z.; Sandström, R. Numerical simulation of residual stresses for friction stir welds in copper canisters. Journal of manufacturing processes 2012, 14, 71–81. [Google Scholar]
- Richards, D.; Prangnell, P.; Withers, P.; Williams, S.; Nagy, T.; Morgan, S. Efficacy of active cooling for controlling residual stresses in friction stir welds. Science and Technology of Welding and Joining 2010, 15, 156–165. [Google Scholar]
- Bastier, A.; Maitournam, M.; Roger, F.; Van, K.D. Modelling of the residual state of friction stir welded plates. Journal of materials processing technology 2008, 200, 25–37. [Google Scholar]
- Riahi, M.; Nazari, H. Analysis of transient temperature and residual thermal stresses in friction stir welding of aluminum alloy 6061-T6 via numerical simulation. International Journal of Advanced Manufacturing Technology 2011, 55. [Google Scholar]
- Deplus, K.; Simar, A.; Haver, W.V.; Meester, B.d. Residual stresses in aluminium alloy friction stir welds. The International Journal of Advanced Manufacturing Technology 2011, 56, 493–504. [Google Scholar]
- Atharifar, H.; Lin, D.; Kovacevic, R. Numerical and Experimental Investigations on the Loads Carried by the Tool During Friction Stir Welding. J. of Materi Eng and Perform 2009, 18, 339–350. [Google Scholar] [CrossRef]
- Ulysse, P. Three-dimensional modeling of the friction stir-welding process. International Journal of Machine Tools and Manufacture 2002, 42, 1549–1557. [Google Scholar] [CrossRef]
- Shojaeefard, M.H.; Khakhali, A.; Akbari, M. Investigation of friction stir welding tool parameters using FEM and neural network. Proceedings of the Institution of Mechanical Engineers, Part L: Journal of Materials: Design and Applications 2013, In press.
- Trimble, D.; Monaghan, J.; O’Donnell, G.E. Force generation during friction stir welding of AA2024-T3. CIRP Annals - Manufacturing Technology 2012, 61, 9–12. [Google Scholar] [CrossRef]
- Nandan, R.; Roy, G.G.; Lienert, T.J.; DebRoy, T. Numerical modelling of 3D plastic flow and heat transfer during friction stir welding of stainless steel. Science and Technology of Welding & Joining 2006, 11, 526–537. [Google Scholar] [CrossRef]
- Rai, R.; De, A.; Bhadeshia, H.K.D.H.; DebRoy, T. Review: friction stir welding tools. Science and Technology of Welding and Joining 2011, 16, 325–342. [Google Scholar] [CrossRef]
- Arora, A.; De, A.; DebRoy, T. Toward optimum friction stir welding tool shoulder diameter. Scripta Materialia 2011, 64, 9–12. [Google Scholar] [CrossRef]
- Tutunchilar, S.; Haghpanahi, M.; Besharati Givi, M.K.; Asadi, P.; Bahemmat, P. Simulation of material flow in friction stir processing of a cast Al–Si alloy. Materials & Design 2012, 40, 415–426. [Google Scholar] [CrossRef]
- Jain, R.; Pal, S.K.; Singh, S.B. Finite element simulation of pin shape influence on material flow, forces in friction stir welding. The International Journal of Advanced Manufacturing Technology 2018, 94, 1781–1797. [Google Scholar] [CrossRef]
- Roy, B.S.; Saha, S.C.; Deb Barma, J. 3-D modeling & numerical simulation of friction stir welding process. In Proceedings of the Advanced Materials Research; 2012; pp. 1189–1193. [Google Scholar]
- Idagawa, H.; Torres, E.; Ramirez, A. CFD modeling of dissimilar aluminum-steel friction stir welds. 2013.
- 王广欣; 朱莉莉; 张昭. Modeling of material flow in friction stir welding process. 中国焊接: 英文版 2007, 16, 63–70.
- Shimoda, Y.; Tsubaki, M.; Yasui, T.; Fukumoto, M. Experimental and Numerical Studies of Material Flow during Welding by Friction Stirring. QUARTERLY JOURNAL OF THE JAPAN WELDING SOCIETY 2011, 29, 114s–118s. [Google Scholar] [CrossRef]
- Ji, S.; Shi, Q.; Zhang, L.; Zou, A.; Gao, S.; Zan, L. Numerical simulation of material flow behavior of friction stir welding influenced by rotational tool geometry. Computational Materials Science 2012, 63, 218–226. [Google Scholar]
- Shude, J.; Aili, Z.; Yumei, Y.; Guohong, L.; Yanye, J.; Fu, L. Numerical simulation of effect of rotational tool with screw on material flow behavior of friction stir welding of Ti6Al4V alloy. 2012.
- Qin, D.Q.; Fu, L.; Shen, Z.K. Visualisation and numerical simulation of material flow behaviour during high-speed FSW process of 2024 aluminium alloy thin plate. The International Journal of Advanced Manufacturing Technology 2019, 102, 1901–1912. [Google Scholar] [CrossRef]
- Su, H.; Wang, T.; Wu, C. Formation of the periodic material flow behaviour in friction stir welding. Science and Technology of Welding and Joining 2021, 26, 286–293. [Google Scholar] [CrossRef]
- Liu, Q.; Han, R.; Gao, Y.; Ke, L. Numerical investigation on thermo-mechanical and material flow characteristics in friction stir welding for aluminum profile joint. The International Journal of Advanced Manufacturing Technology 2021, 114, 2457–2469. [Google Scholar] [CrossRef]
- Luo, H.; Wu, T.; Wang, P.; Zhao, F.; Wang, H.; Li, Y. Numerical Simulation of Material Flow and Analysis of Welding Characteristics in Friction Stir Welding Process. Metals 2019, 9. [Google Scholar] [CrossRef]
- Naumov, A.; Rylkov, E.; Polyakov, P.; Isupov, F.; Rudskoy, A.; Aoh, J.-N.; Popovich, A.; Panchenko, O. Effect of Different Tool Probe Profiles on Material Flow of Al–Mg–Cu Alloy Joined by Friction Stir Welding. Materials 2021, 14, 6296. [Google Scholar]
- Buffa, G. Joining Ti6Al4V and AISI 304 through friction stir welding of lap joints: experimental and numerical analysis. International Journal of Material Forming 2016, 9, 59–70. [Google Scholar] [CrossRef]
- Padmanaban, R.; Kishore, V.R.; Balusamy, V. Numerical Simulation of Temperature Distribution and Material Flow During Friction Stir Welding of Dissimilar Aluminum Alloys. Procedia Engineering 2014, 97, 854–863. [Google Scholar] [CrossRef]
- Mirzaei, M.; Asadi, P.; Fazli, A. Effect of Tool Pin Profile on Material Flow in Double Shoulder Friction Stir Welding of AZ91 Magnesium Alloy. International Journal of Mechanical Sciences 2020, 183, 105775. [Google Scholar] [CrossRef]
- Akbari, M.; Asadi, P.; Behnagh, R.A. Modeling of material flow in dissimilar friction stir lap welding of aluminum and brass using coupled Eulerian and Lagrangian method. The International Journal of Advanced Manufacturing Technology 2021, 113, 721–734. [Google Scholar] [CrossRef]
- Yu, A.D.E.K.A.; Psakhie, N.V.R.S. Study patterns of microstructure formation during friction stir welding.
- Nikonov, A.Y.; Dmitriev, A.I.; Konovalenko, I.S.; Kolubaev, E.A.; Astafurov, S.V.; Psakhie, S.G. Features of interface formation in crystallites under mechanically activated diffusion. In A molecular dynamics study. In Proceedings of the COMPLAS XIII: proceedings of the XIII International Conference on Computational Plasticity: fundamentals and applications; 2015; pp. 982–991. [Google Scholar]
- Myhr, O.; Grong, Ø.; Klokkehaug, S.; Fjoer, H.; Kluken, A. Process model for welding of Al–Mg–Si extrusions Part 1: Precipitate stability. Science and Technology of Welding and Joining 1997, 2, 245–253. [Google Scholar]
- Frigaard, Ø.; Grong, Ø.; Midling, O. A process model for friction stir welding of age hardening aluminum alloys. Metall and Mat Trans A 2001, 32, 1189–1200. [Google Scholar]
- Wagner, R.; Kampmann, R.; Voorhees, P.W. Homogeneous Second-Phase Precipitation. In Phase Transformations in Materials; 2001; pp. 309-407.
- Myhr, O.; Grong, Ø. Modelling of non-isothermal transformations in alloys containing a particle distribution. Acta Materialia 2000, 48, 1605–1615. [Google Scholar]
- Gallais, C.; Denquin, A.; Bréchet, Y.; Lapasset, G. Precipitation microstructures in an AA6056 aluminium alloy after friction stir welding: Characterisation and modelling. Materials Science and Engineering: A 2008, 496, 77–89. [Google Scholar] [CrossRef]
- Simar, A.; Bréchet, Y.; de Meester, B.; Denquin, A.; Pardoen, T. Sequential modeling of local precipitation, strength and strain hardening in friction stir welds of an aluminum alloy 6005A-T6. Acta Materialia 2007, 55, 6133–6143. [Google Scholar] [CrossRef]
- dos Santos, J.F.; Staron, P.; Fischer, T.; Robson, J.D.; Kostka, A.; Colegrove, P.; Wang, H.; Hilgert, J.; Bergmann, L.; Hütsch, L.L.; et al. Understanding precipitate evolution during friction stir welding of Al-Zn-Mg-Cu alloy through in-situ measurement coupled with simulation. Acta Materialia 2018, 148, 163–172. [Google Scholar] [CrossRef]
- Huang, K.; Logé, R.E. A review of dynamic recrystallization phenomena in metallic materials. Materials & Design 2016, 111, 548–574. [Google Scholar]
- Humphreys, J.; Hatherly, M. Preface to the Second Edition. In Recrystallization and Related Annealing Phenomena (Second Edition), Humphreys, F.J., Hatherly, M., Eds.; Elsevier: Oxford, 2004. [Google Scholar]
- Doherty, R.D.; Hughes, D.A.; Humphreys, F.J.; Jonas, J.J.; Juul Jensen, D.; Kassner, M.E.; King, W.E.; McNelley, T.R.; McQueen, H.J.; Rollett, A.D. Current issues in recrystallization: A review. Materials Today 1998, 1, 14–15. [Google Scholar] [CrossRef]
- Gourdet, S.; Montheillet, F. A model of continuous dynamic recrystallization. Acta Materialia 2003, 51, 2685–2699. [Google Scholar] [CrossRef]
- Gholinia, A.; Humphreys, F.J.; Prangnell, P.B. Production of ultra-fine grain microstructures in Al–Mg alloys by coventional rolling. Acta Materialia 2002, 50, 4461–4476. [Google Scholar] [CrossRef]
- Gardner, K.J.; Grimes, R. Recrystallization during hot deformation of aluminium alloys. Metal Science 1979, 13, 216–222. [Google Scholar] [CrossRef]
- Pari, L.D.; Misiolek, W.Z. Theoretical predictions and experimental verification of surface grain structure evolution for AA6061 during hot rolling. Acta Materialia 2008, 56, 6174–6185. [Google Scholar] [CrossRef]
- Hofmann, D.C.; Vecchio, K.S. Thermal history analysis of friction stir processed and submerged friction stir processed aluminum. Materials Science and Engineering: A 2007, 465, 165–175. [Google Scholar] [CrossRef]
- Derby, B.; Ashby, M.F. On dynamic recrystallisation. Scripta Metallurgica 1987, 21, 879–884. [Google Scholar] [CrossRef]
- Wan, Z.Y.; Zhang, Z.; Zhou, X. Finite element modeling of grain growth by point tracking method in friction stir welding of AA6082-T6. The International Journal of Advanced Manufacturing Technology 2017, 90, 3567–3574. [Google Scholar] [CrossRef]
- Shojaeefard, M.H.; Akbari, M.; Khalkhali, A.; Asadi, P.; Parivar, A.H. Optimization of microstructural and mechanical properties of friction stir welding using the cellular automaton and Taguchi method. Materials & Design 2014, 64, 660–666. [Google Scholar] [CrossRef]
- Robson, J.D.; Campbell, L. Model for grain evolution during friction stir welding of aluminium alloys. Science and Technology of Welding and Joining 2010, 15, 171–176. [Google Scholar] [CrossRef]
- Prangnell, P.; Heason, C. Grain structure formation during friction stir welding observed by the ‘stop action technique’. Acta Materialia 2005, 53, 3179–3192. [Google Scholar]
- Grujicic, M.; Ramaswami, S.; Snipes, J.; Avuthu, V.; Galgalikar, R.; Zhang, Z. Prediction of the Grain-Microstructure Evolution Within a Friction Stir Welding (FSW) Joint via the Use of the Monte Carlo Simulation Method. J. of Materi Eng and Perform 2015, 24, 3471–3486. [Google Scholar] [CrossRef]
- Zhang, Z.; Wu, Q.; Grujicic, M.; Wan, Z.Y. Monte Carlo simulation of grain growth and welding zones in friction stir welding of AA6082-T6. Journal of Materials Science 2016, 51, 1882–1895. [Google Scholar] [CrossRef]
- Yu, P.; Wu, C.; Shi, L. Analysis and characterization of dynamic recrystallization and grain structure evolution in friction stir welding of aluminum plates. Acta Materialia 2021, 207, 116692. [Google Scholar] [CrossRef]
- Zhang, Z.; Hu, C.P. 3D Monte Carlo simulation of grain growth in friction stir welding. Journal of Mechanical Science and Technology 2018, 32, 1287–1296. [Google Scholar] [CrossRef]
- Wu, Q.; Zhang, Z. Precipitation-Induced Grain Growth Simulation of Friction-Stir-Welded AA6082-T6. J. of Materi Eng and Perform 2017, 26, 2179–2189. [Google Scholar] [CrossRef]
- Khodabakhshi, F.; Derazkola, H.A.; Gerlich, A.P. Monte Carlo simulation of grain refinement during friction stir processing. Journal of Materials Science 2020, 55, 13438–13456. [Google Scholar] [CrossRef]
Figure 1.
(a) a simple FSW tool, (b) schematic of the FSW process, and (c) setup of FSW showing the designed fixture.
Figure 1.
(a) a simple FSW tool, (b) schematic of the FSW process, and (c) setup of FSW showing the designed fixture.
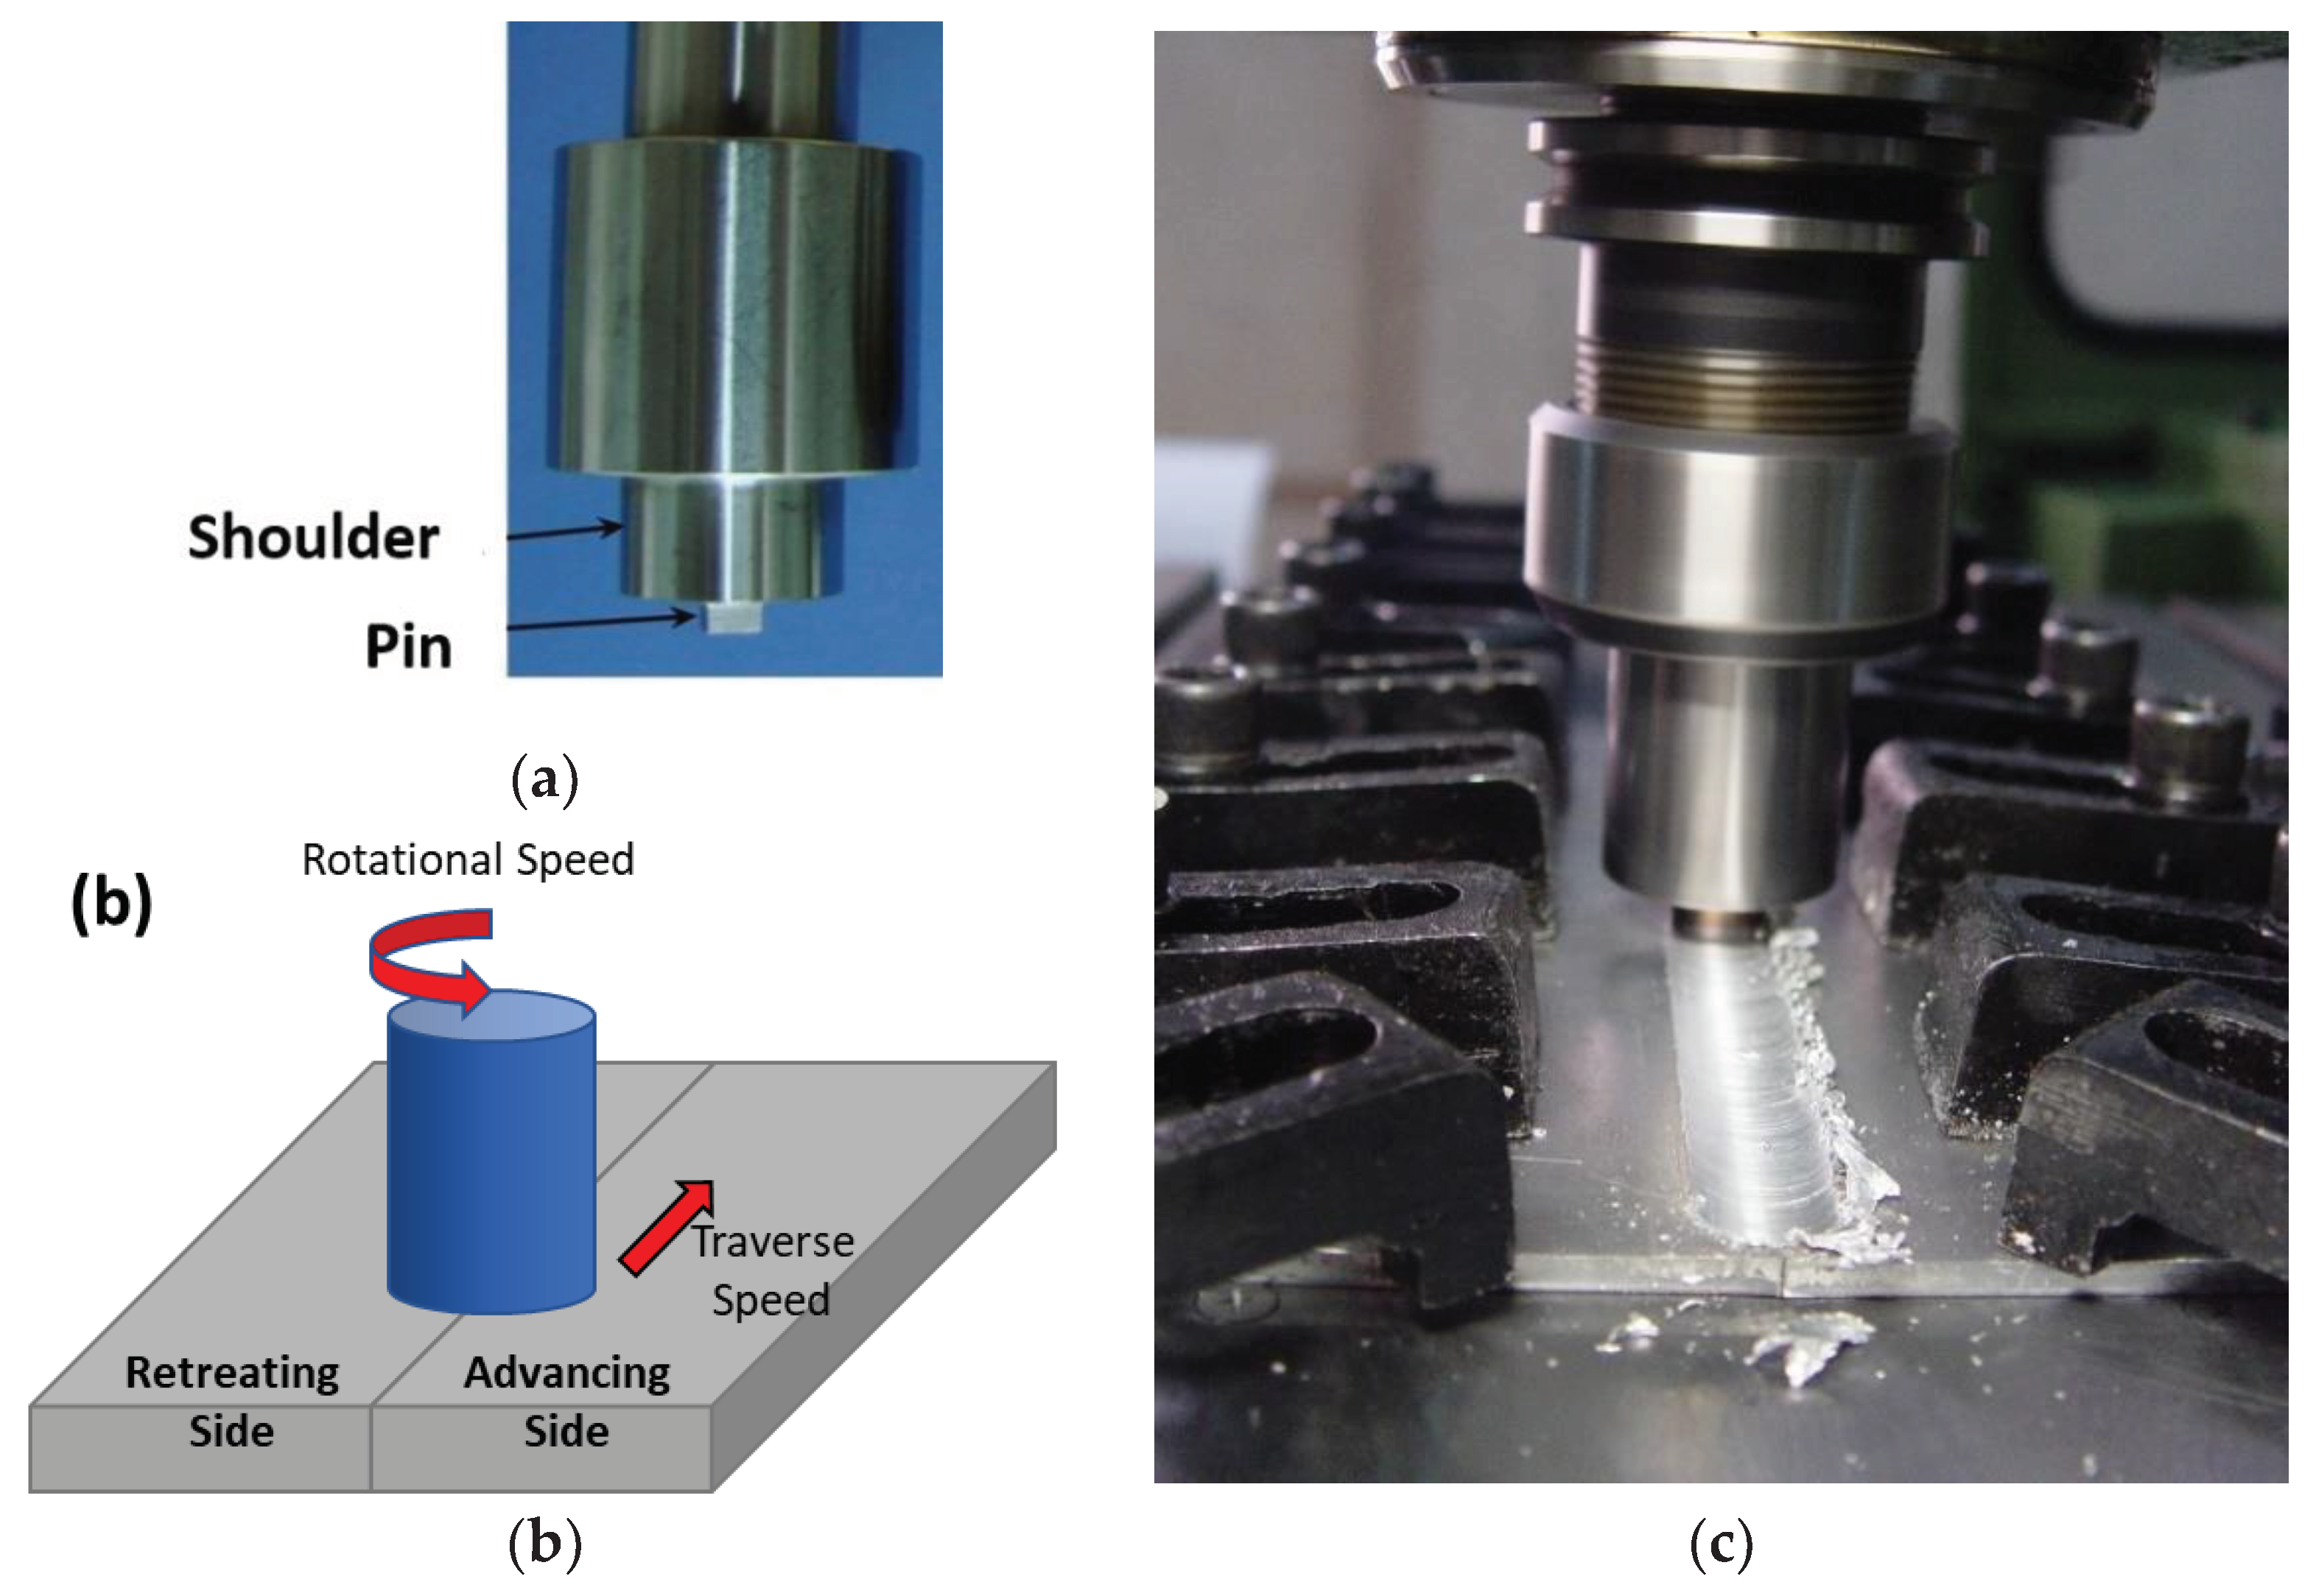
Figure 2.
Split operation of the Eulerian formulation.
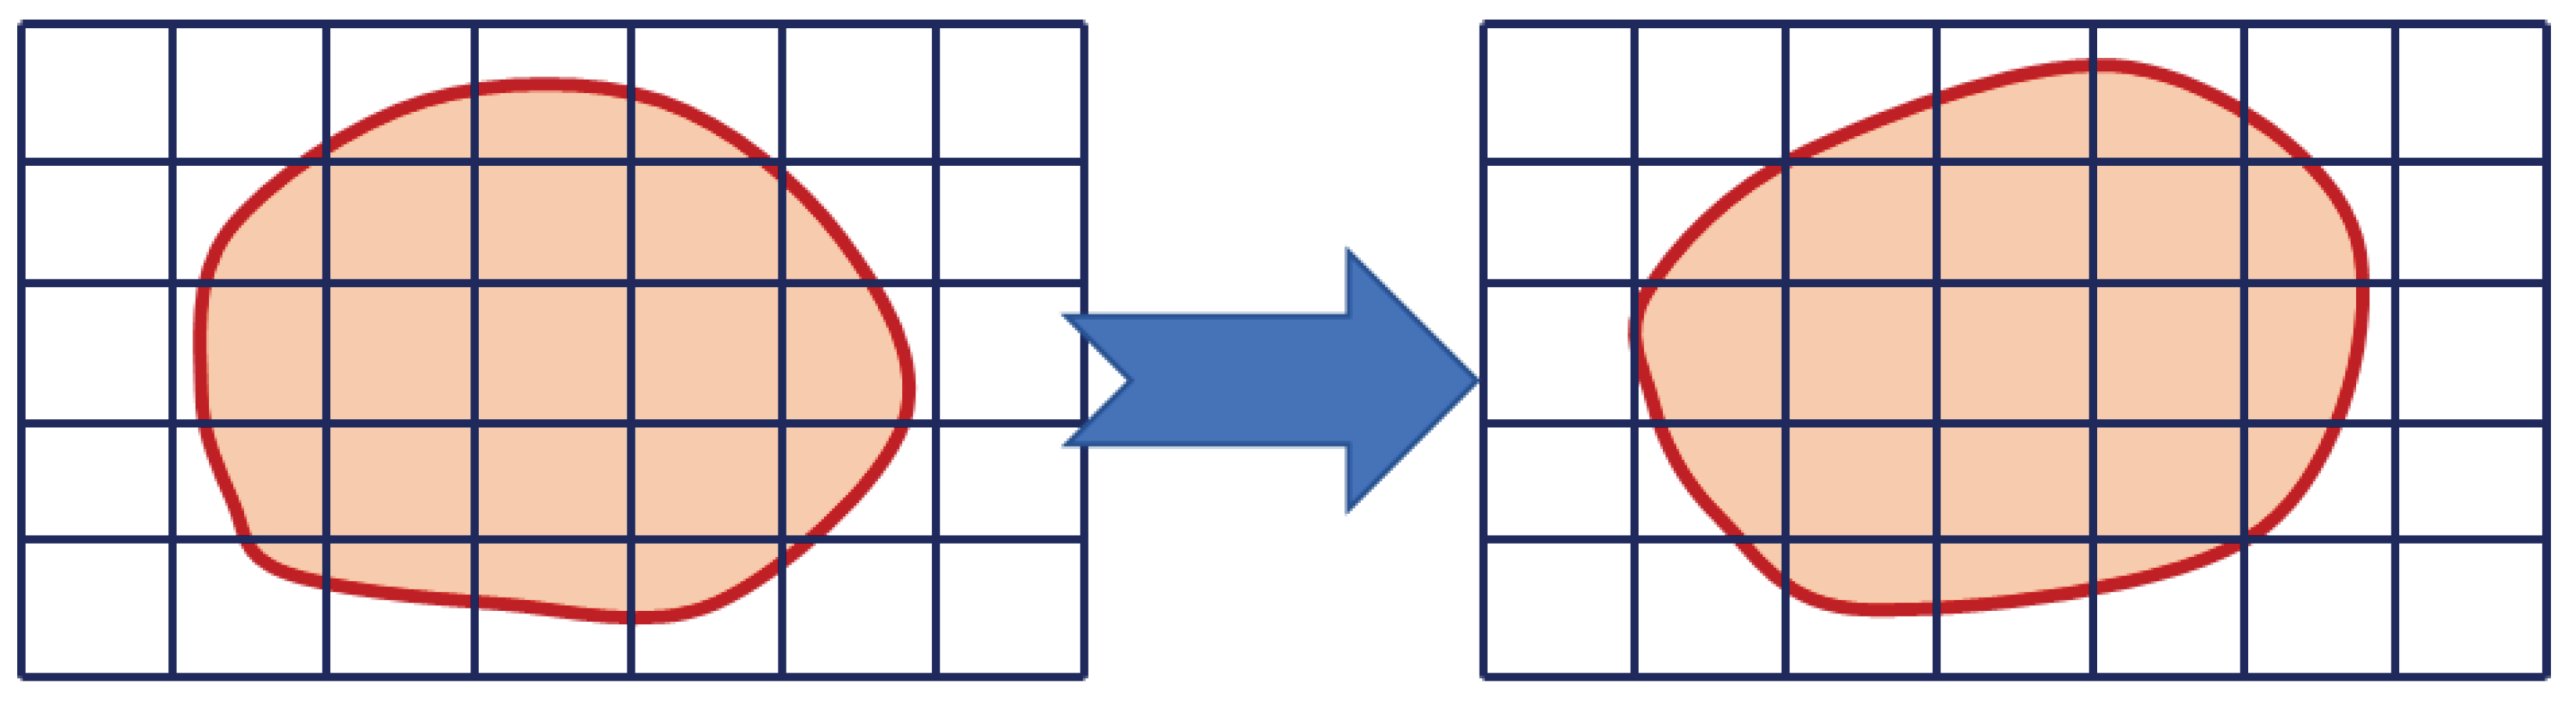
Figure 3.
Operation of the Lagrangian formulation.
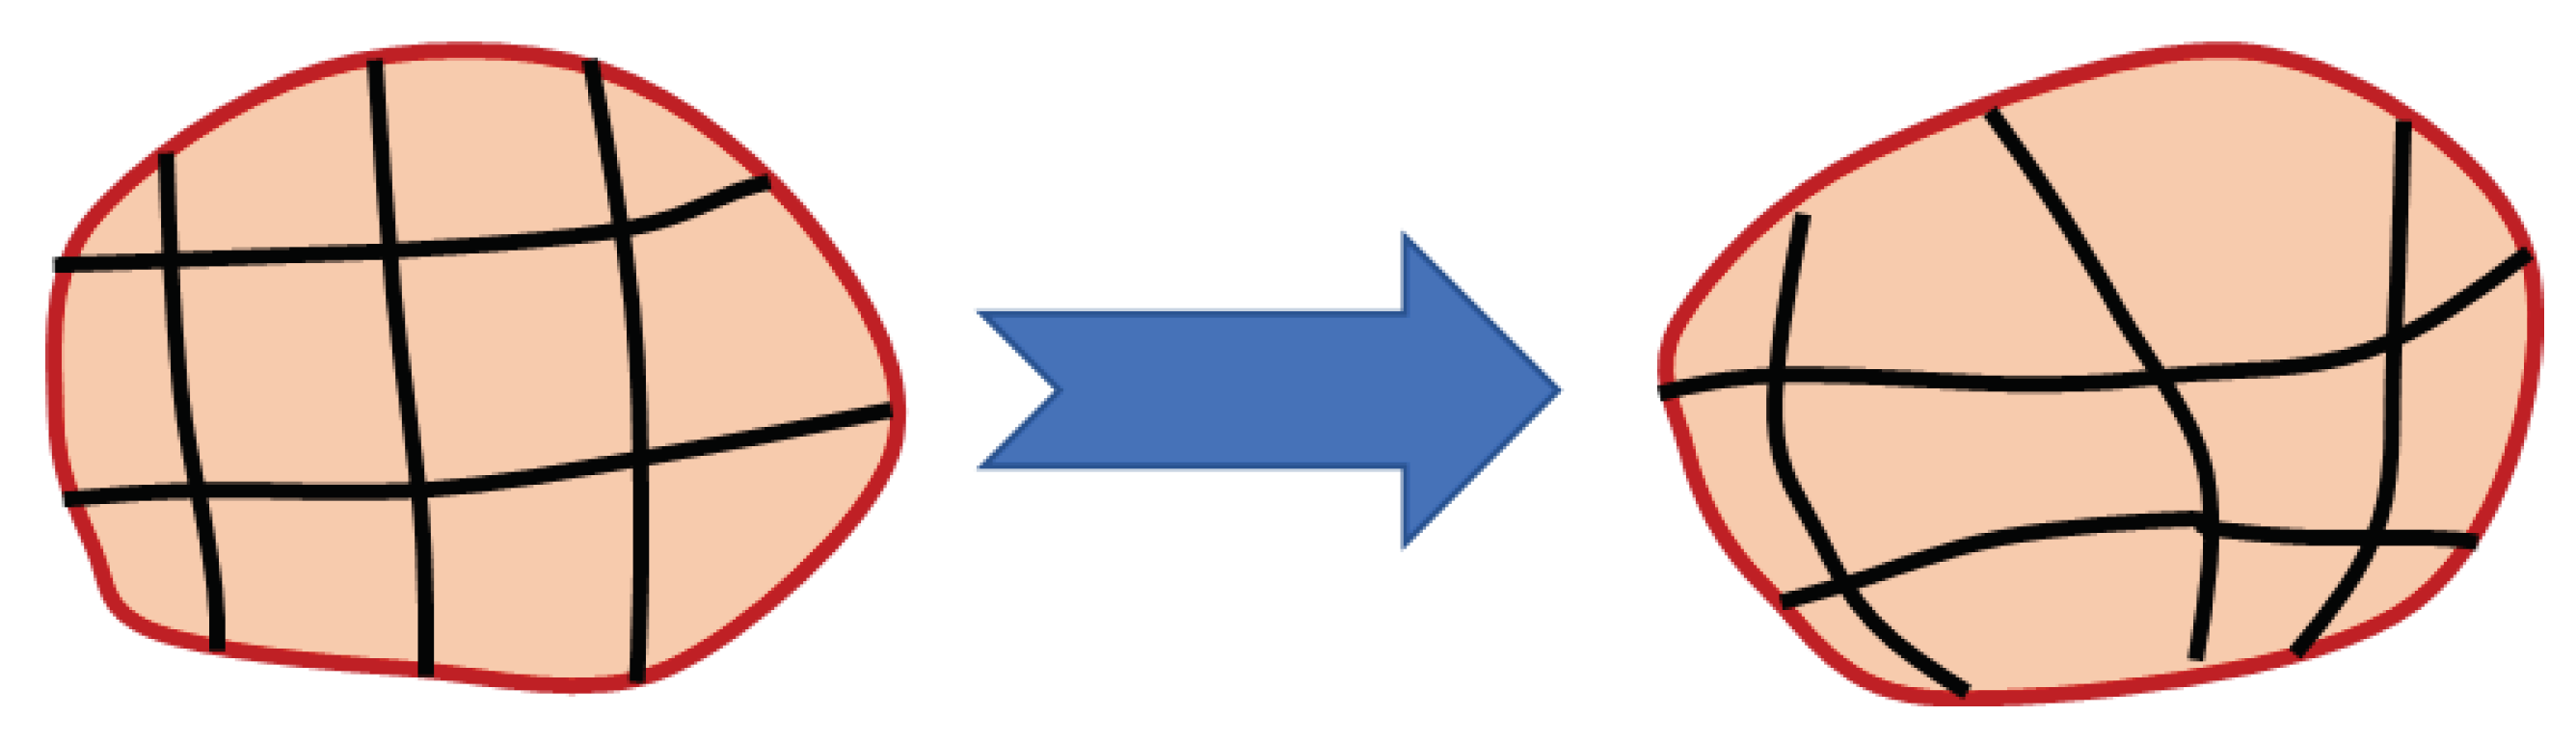
Figure 4.
Schematic illustration of the FSP tool and workpiece [125].
Figure 4.
Schematic illustration of the FSP tool and workpiece [125].
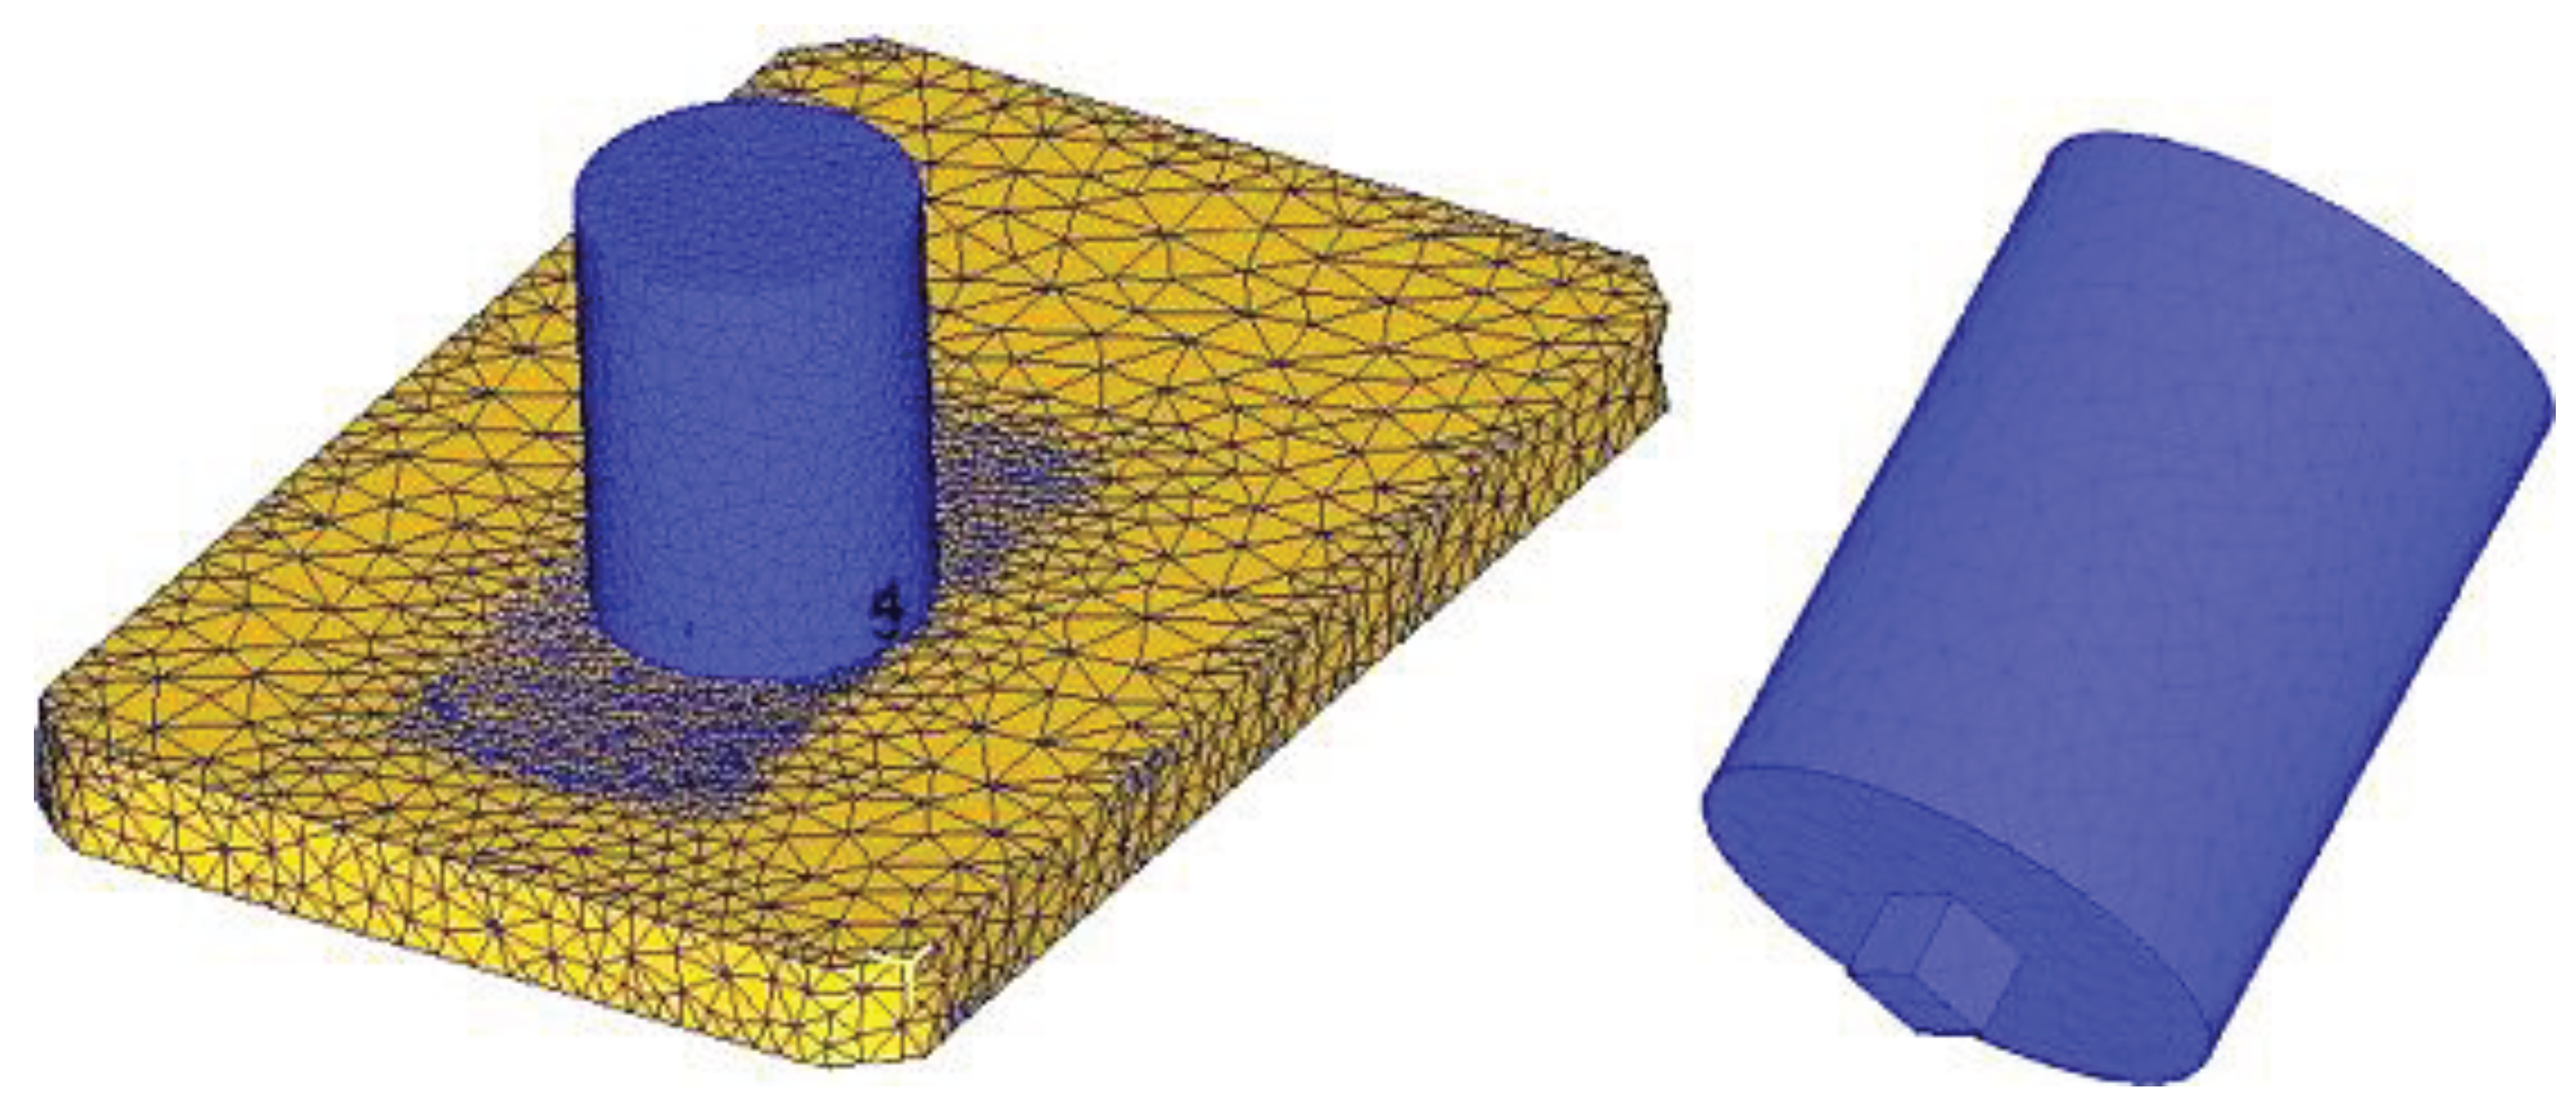
Figure 5.
Operation of ALE formulation.
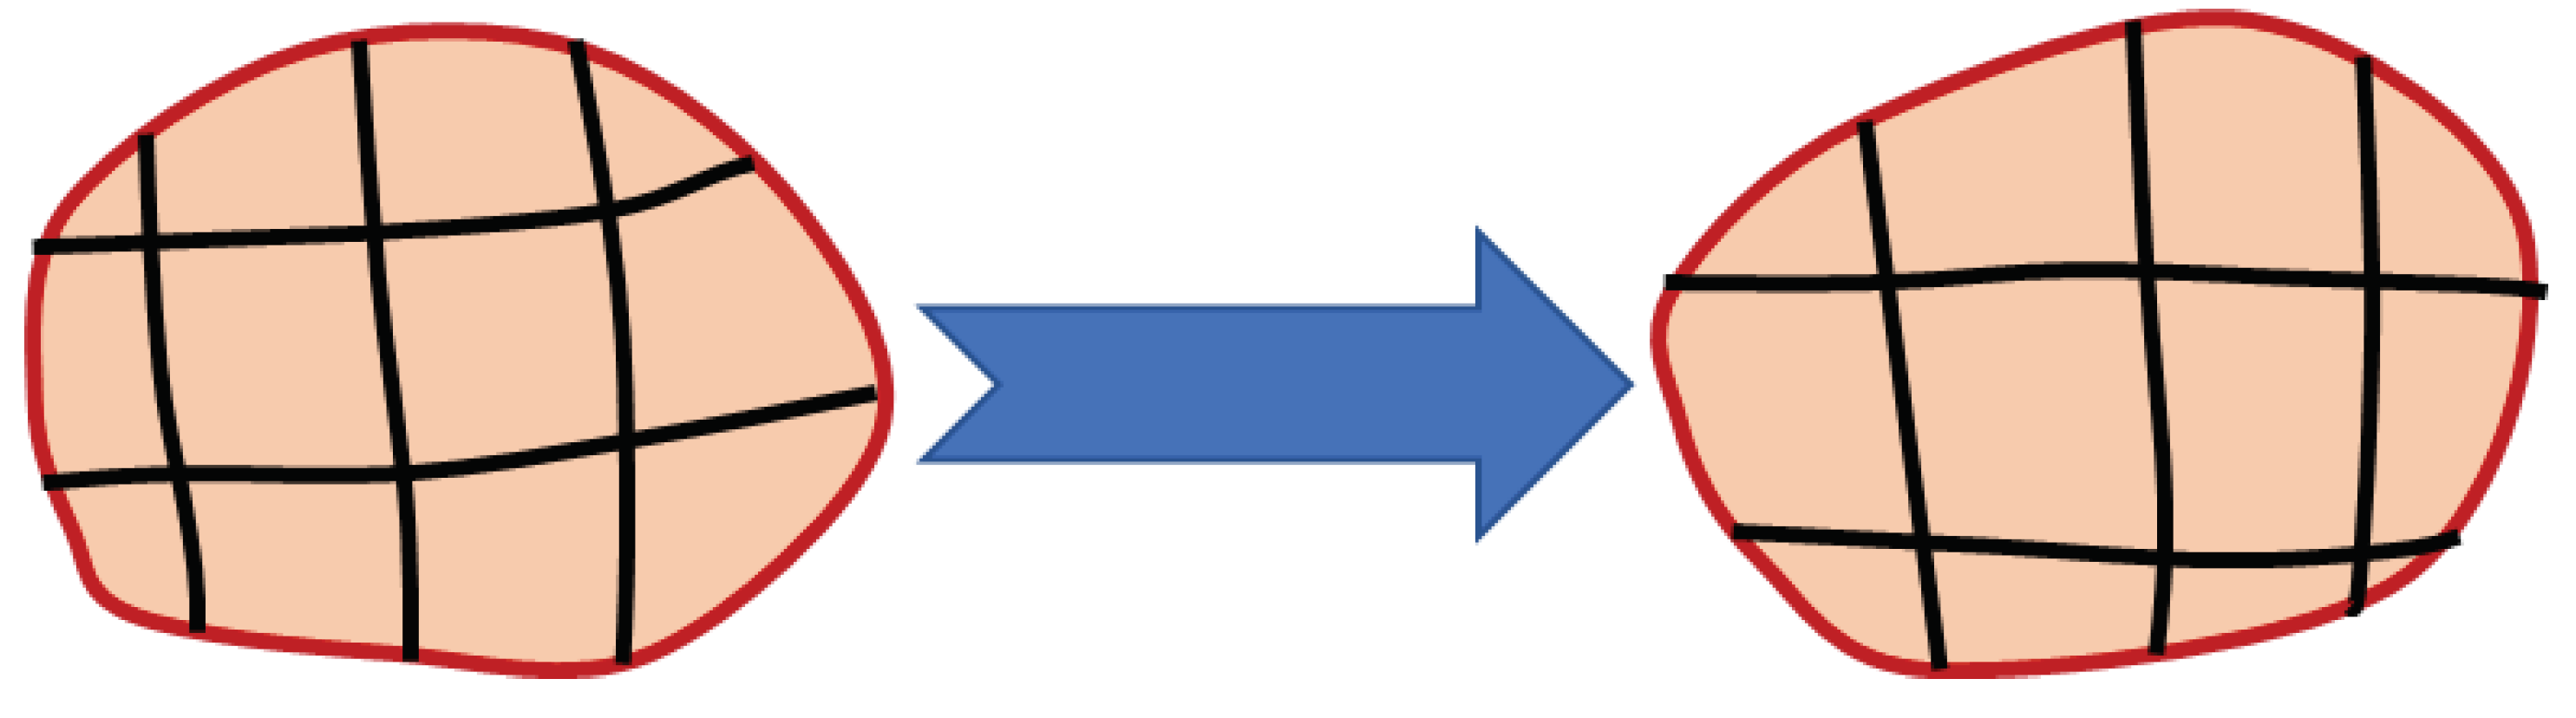
Figure 7.
Illustration of split operator used in the CEL approach.
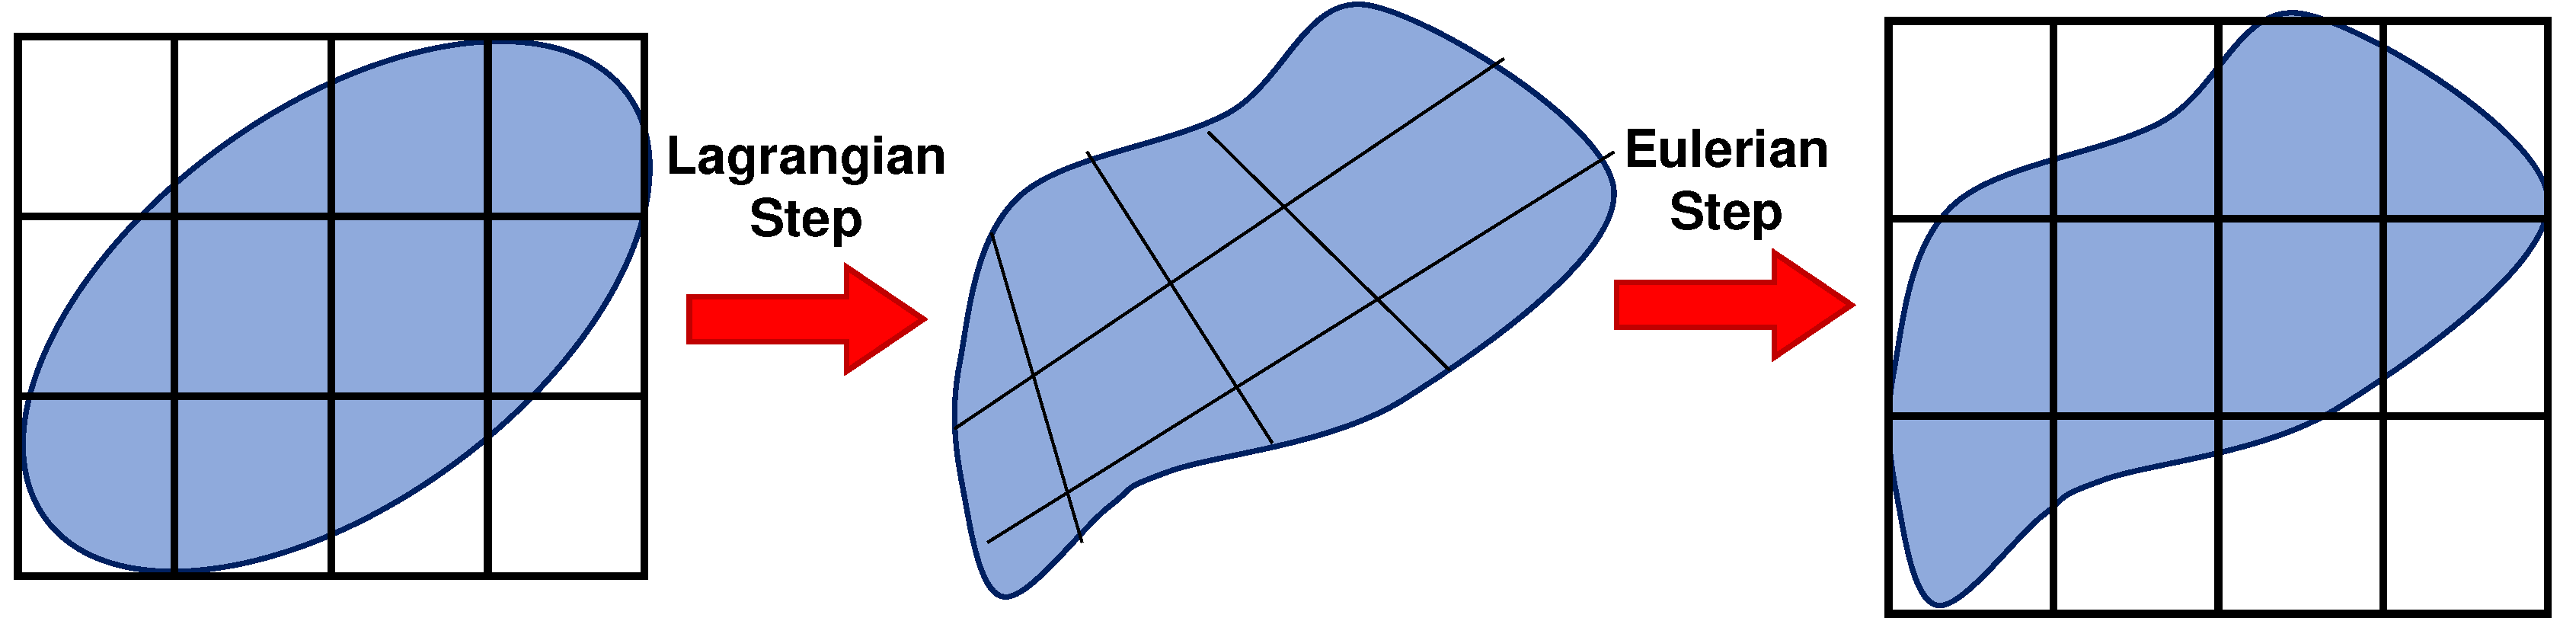
Figure 8.
Velocity boundary conditions employed in Ragab et al. model [134].
Figure 8.
Velocity boundary conditions employed in Ragab et al. model [134].
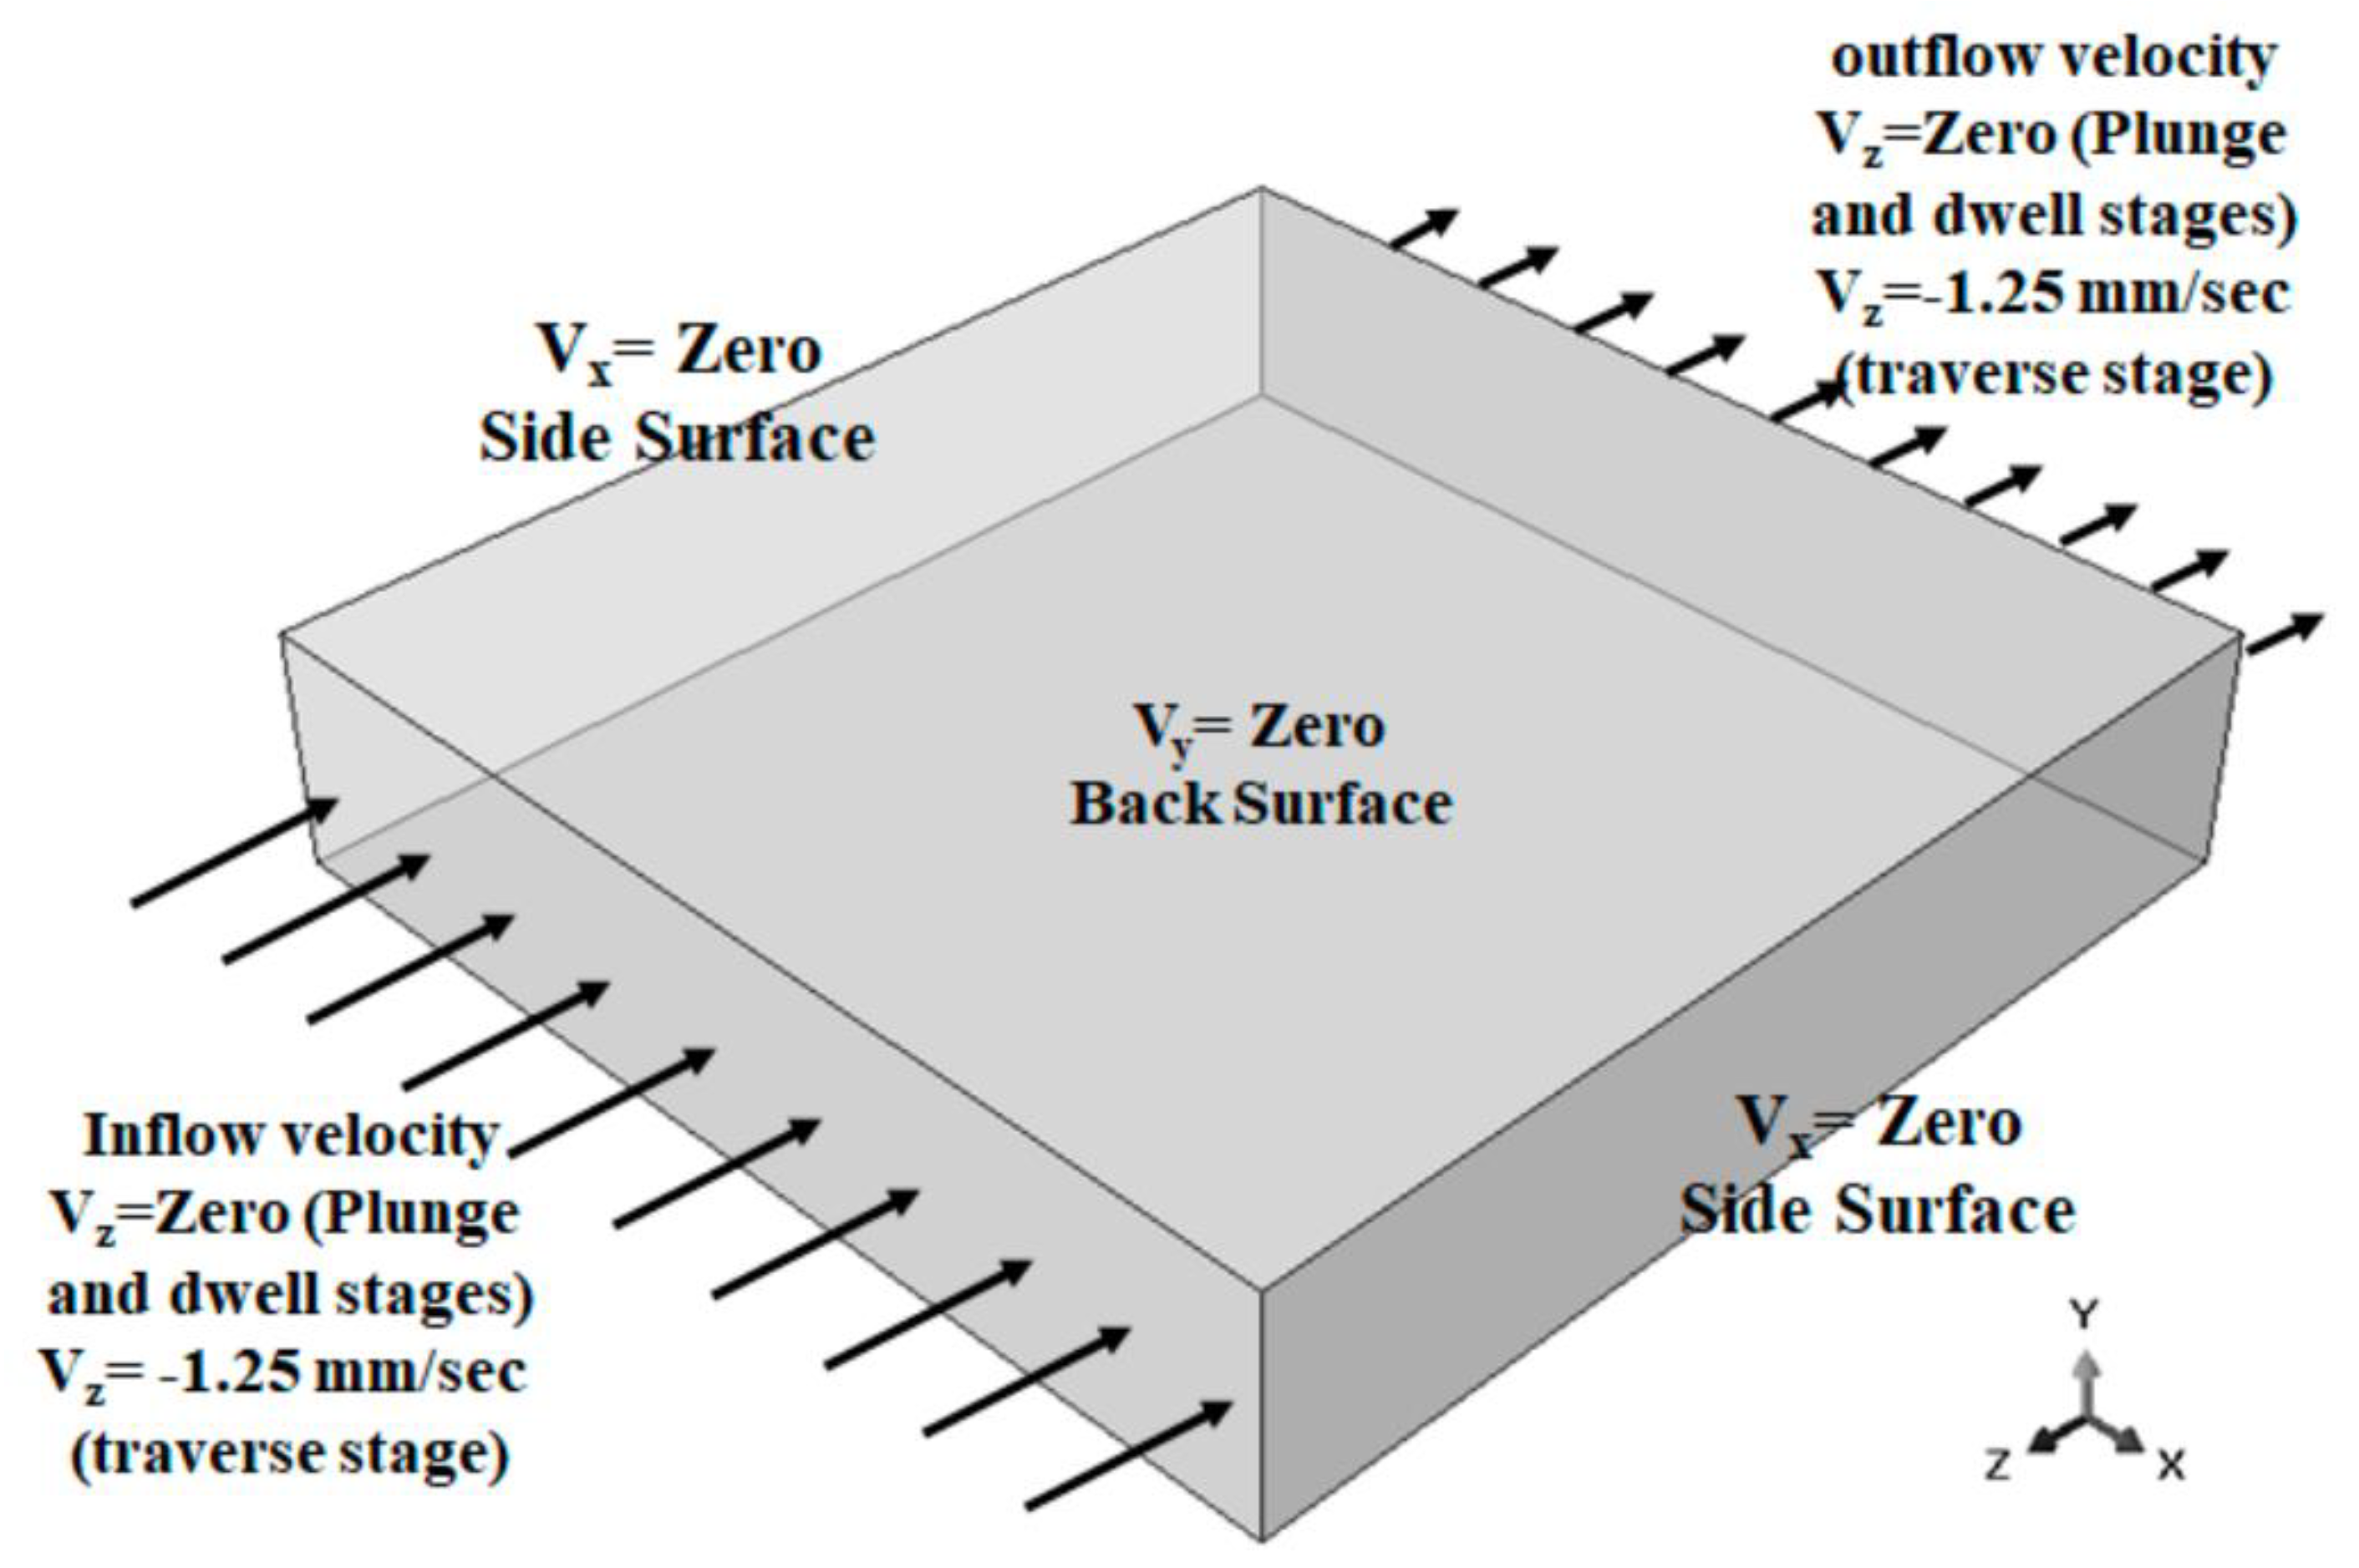
Figure 9.
The placement of alloys during FSW [137].
Figure 9.
The placement of alloys during FSW [137].
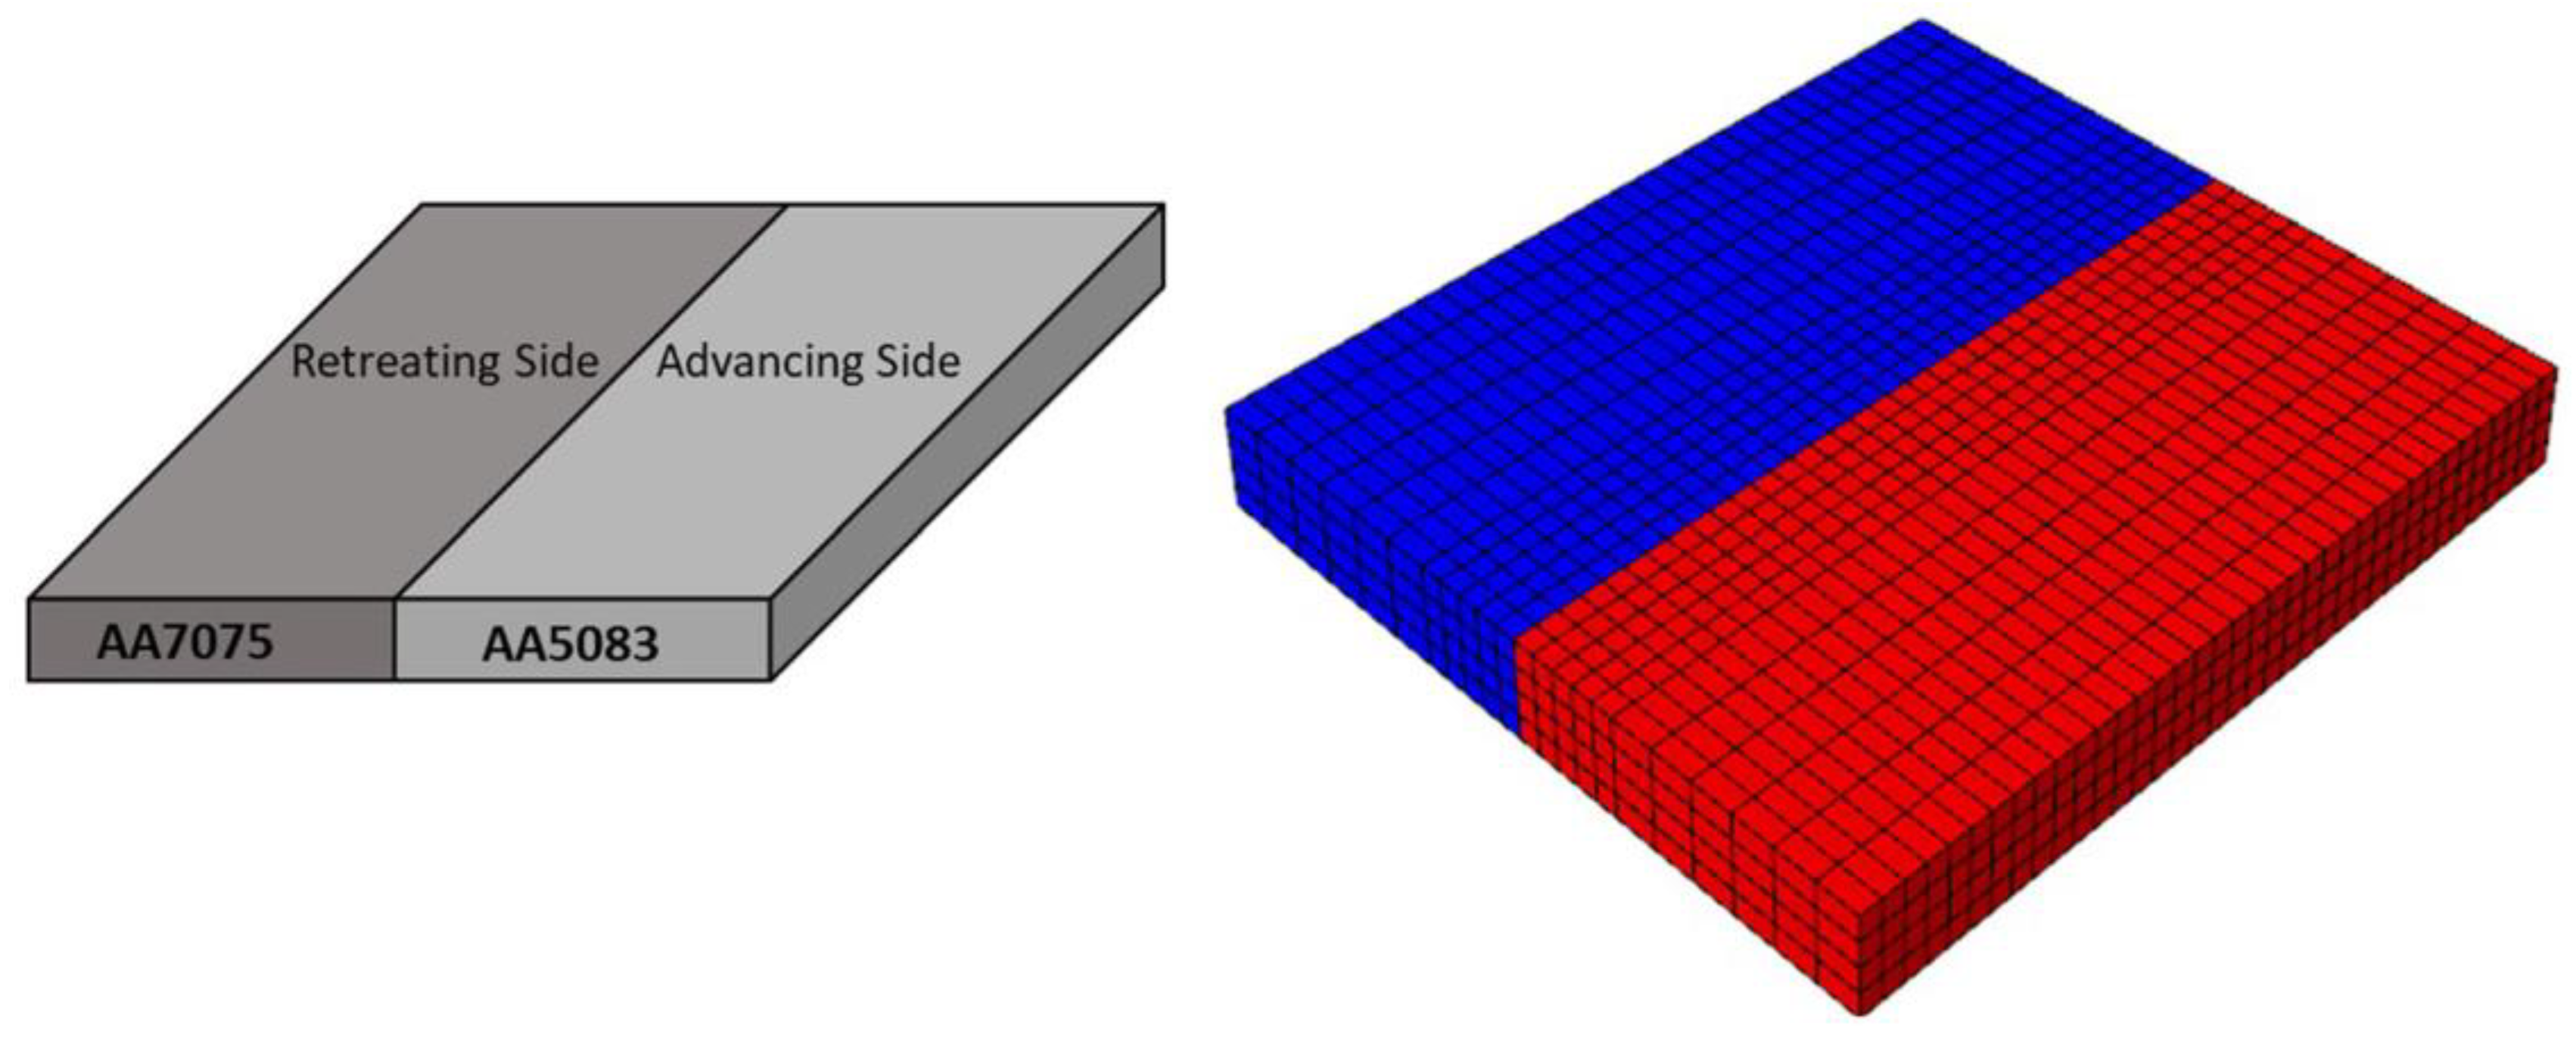
Figure 10.
The schematics of the conversion of FEM to SPH models.
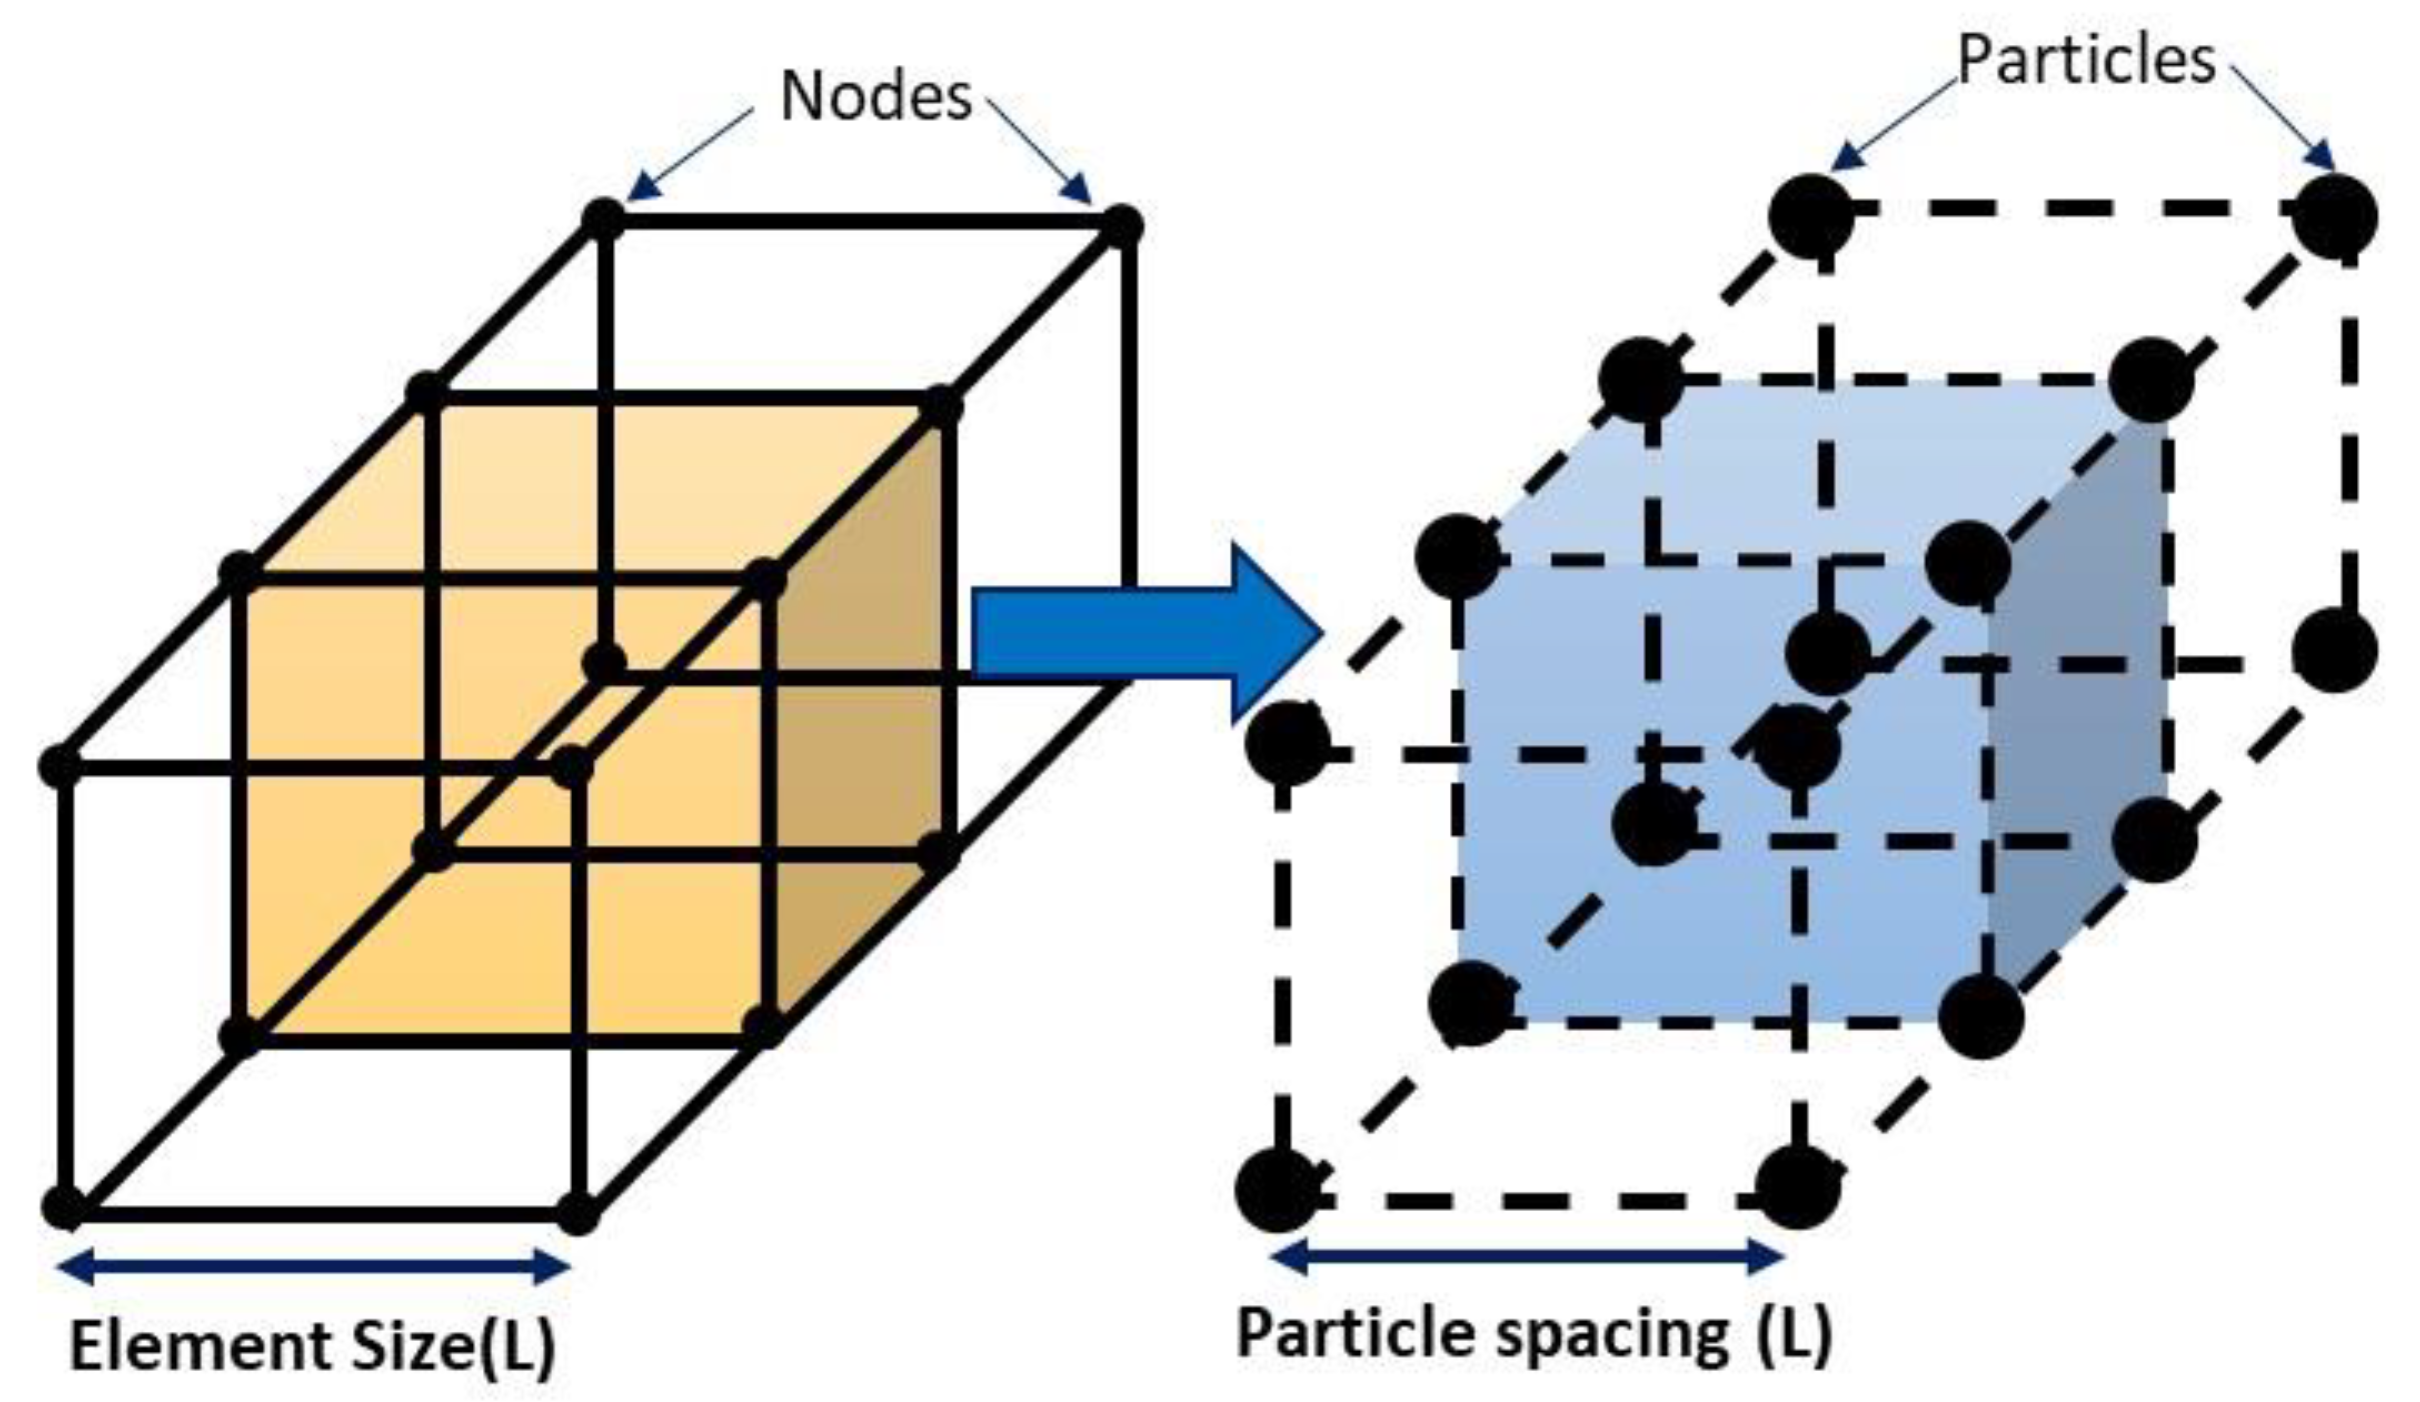
Figure 11.
Interpolation in SPH approach.
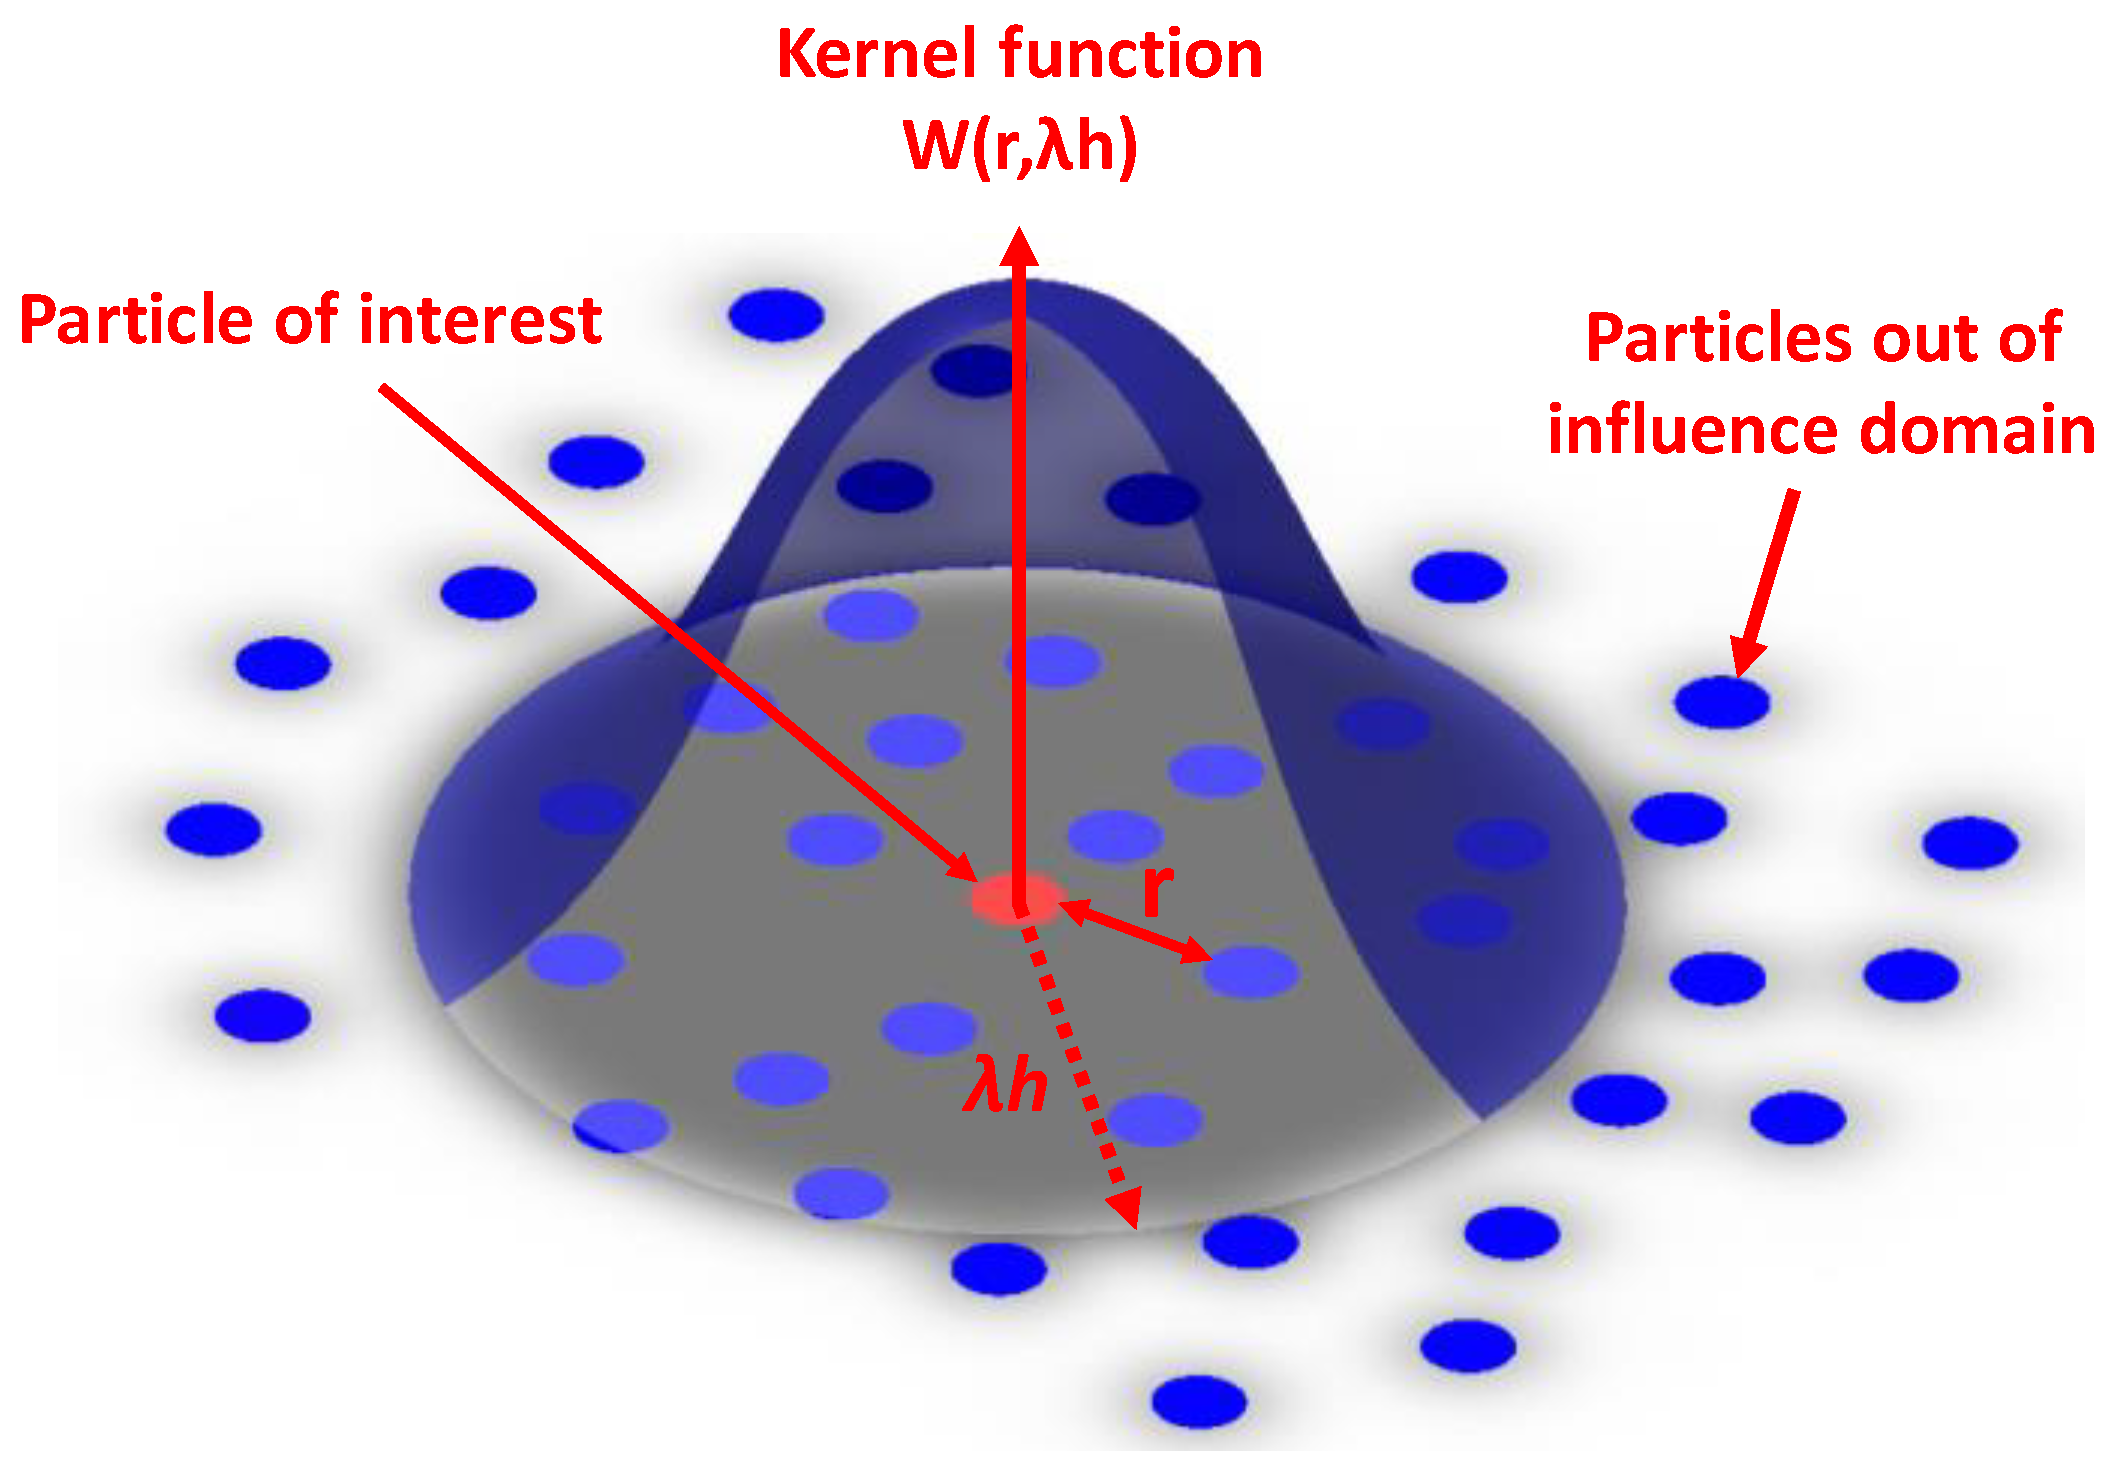
Figure 12.
Comparison of welding temperatures obtained from experimental and numerical methods [24].
Figure 12.
Comparison of welding temperatures obtained from experimental and numerical methods [24].
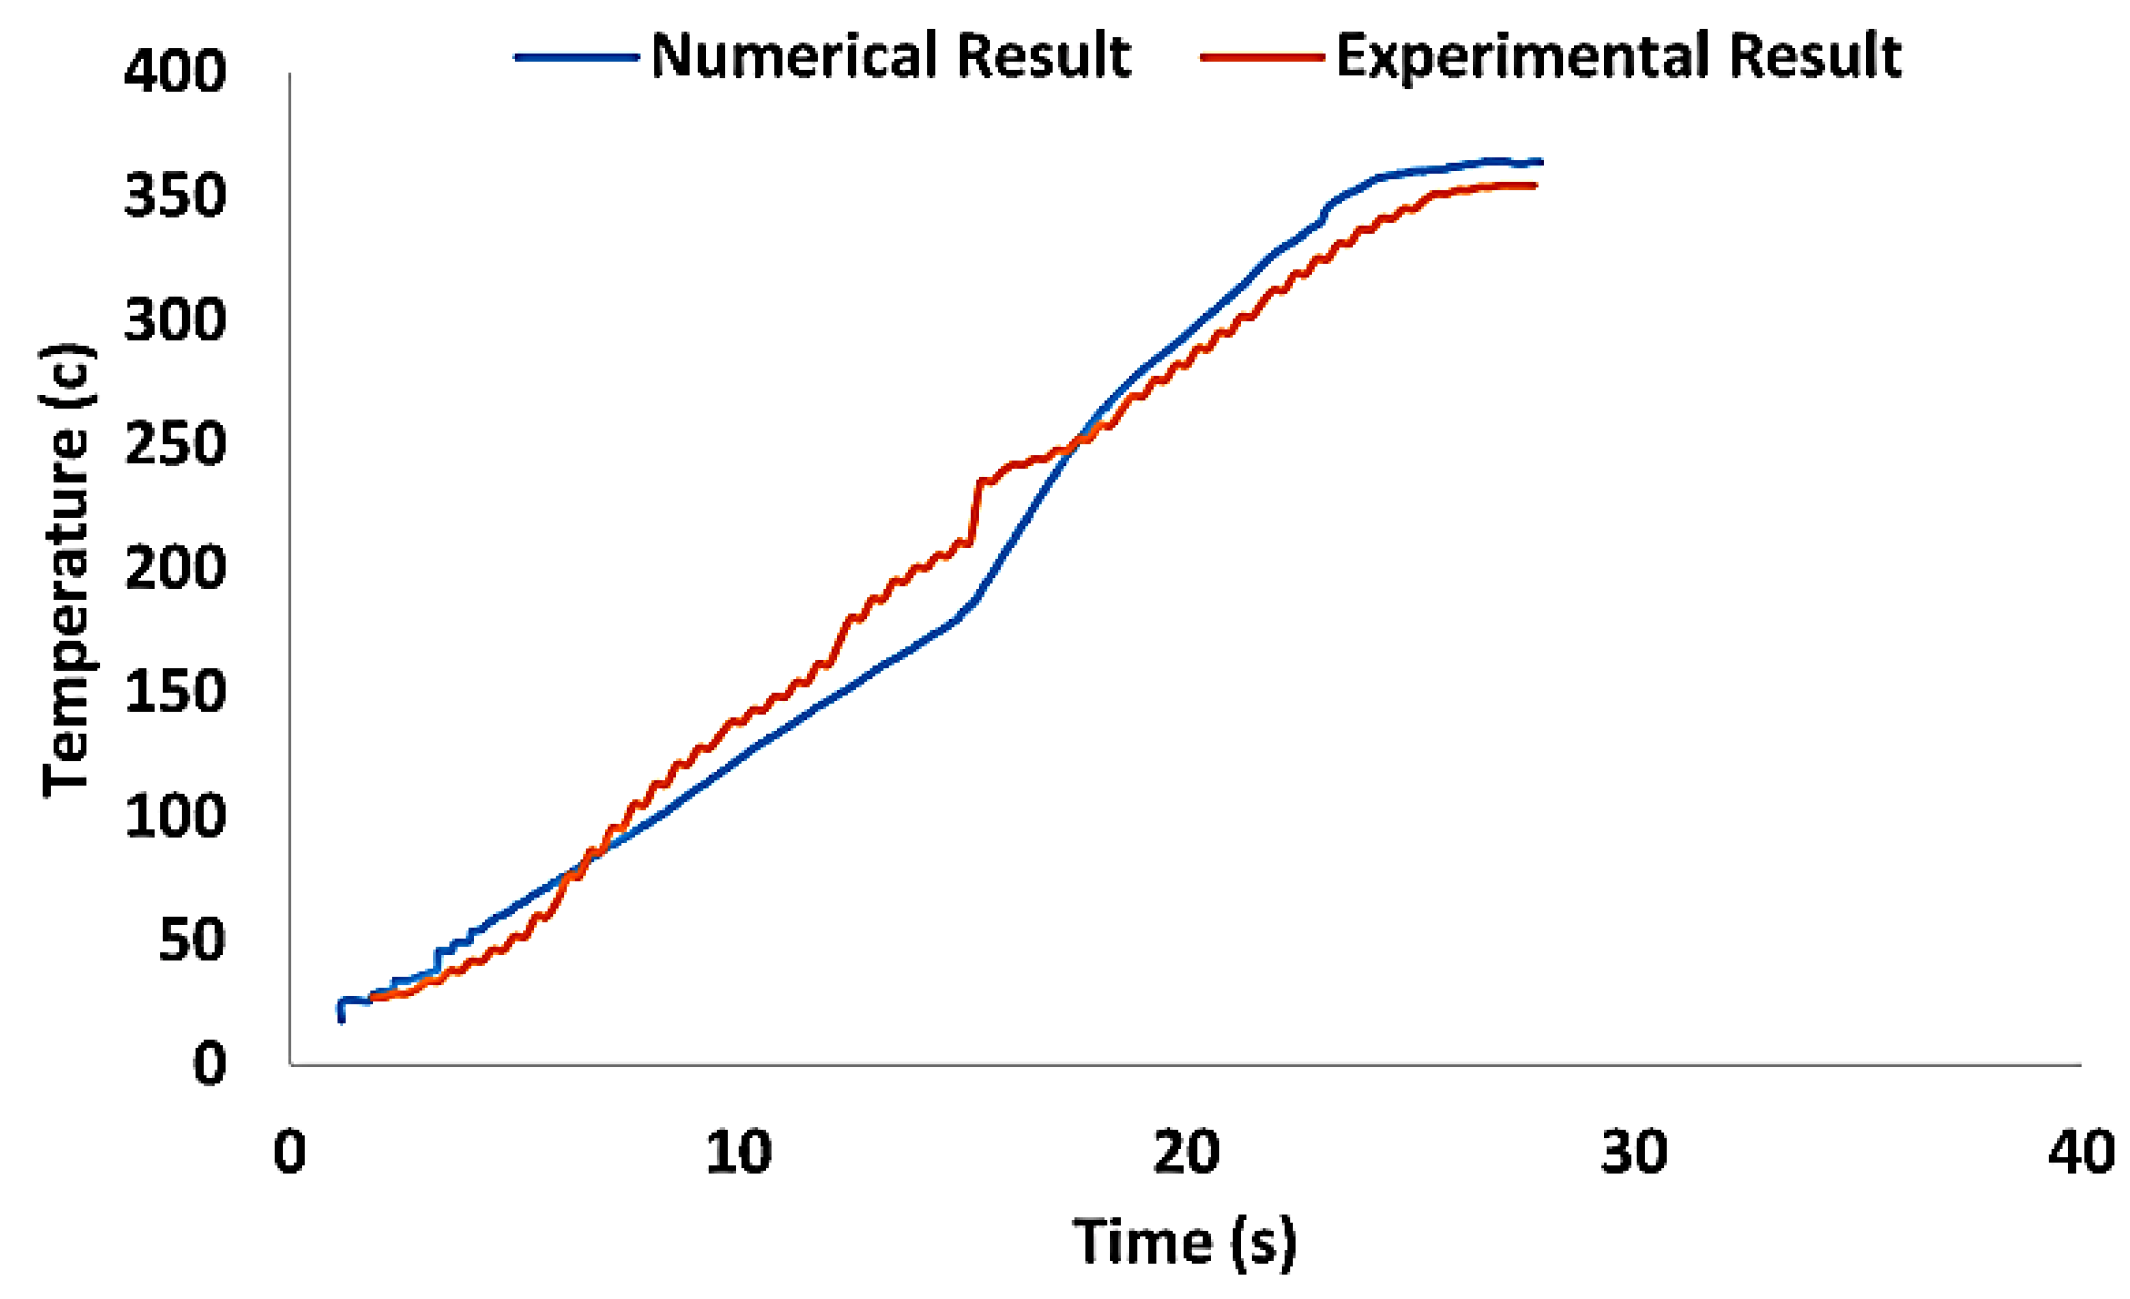
Figure 13.
Distribution of Temperature in the cross-section of joint the in FSW of aluminium 5083[50].
Figure 13.
Distribution of Temperature in the cross-section of joint the in FSW of aluminium 5083[50].
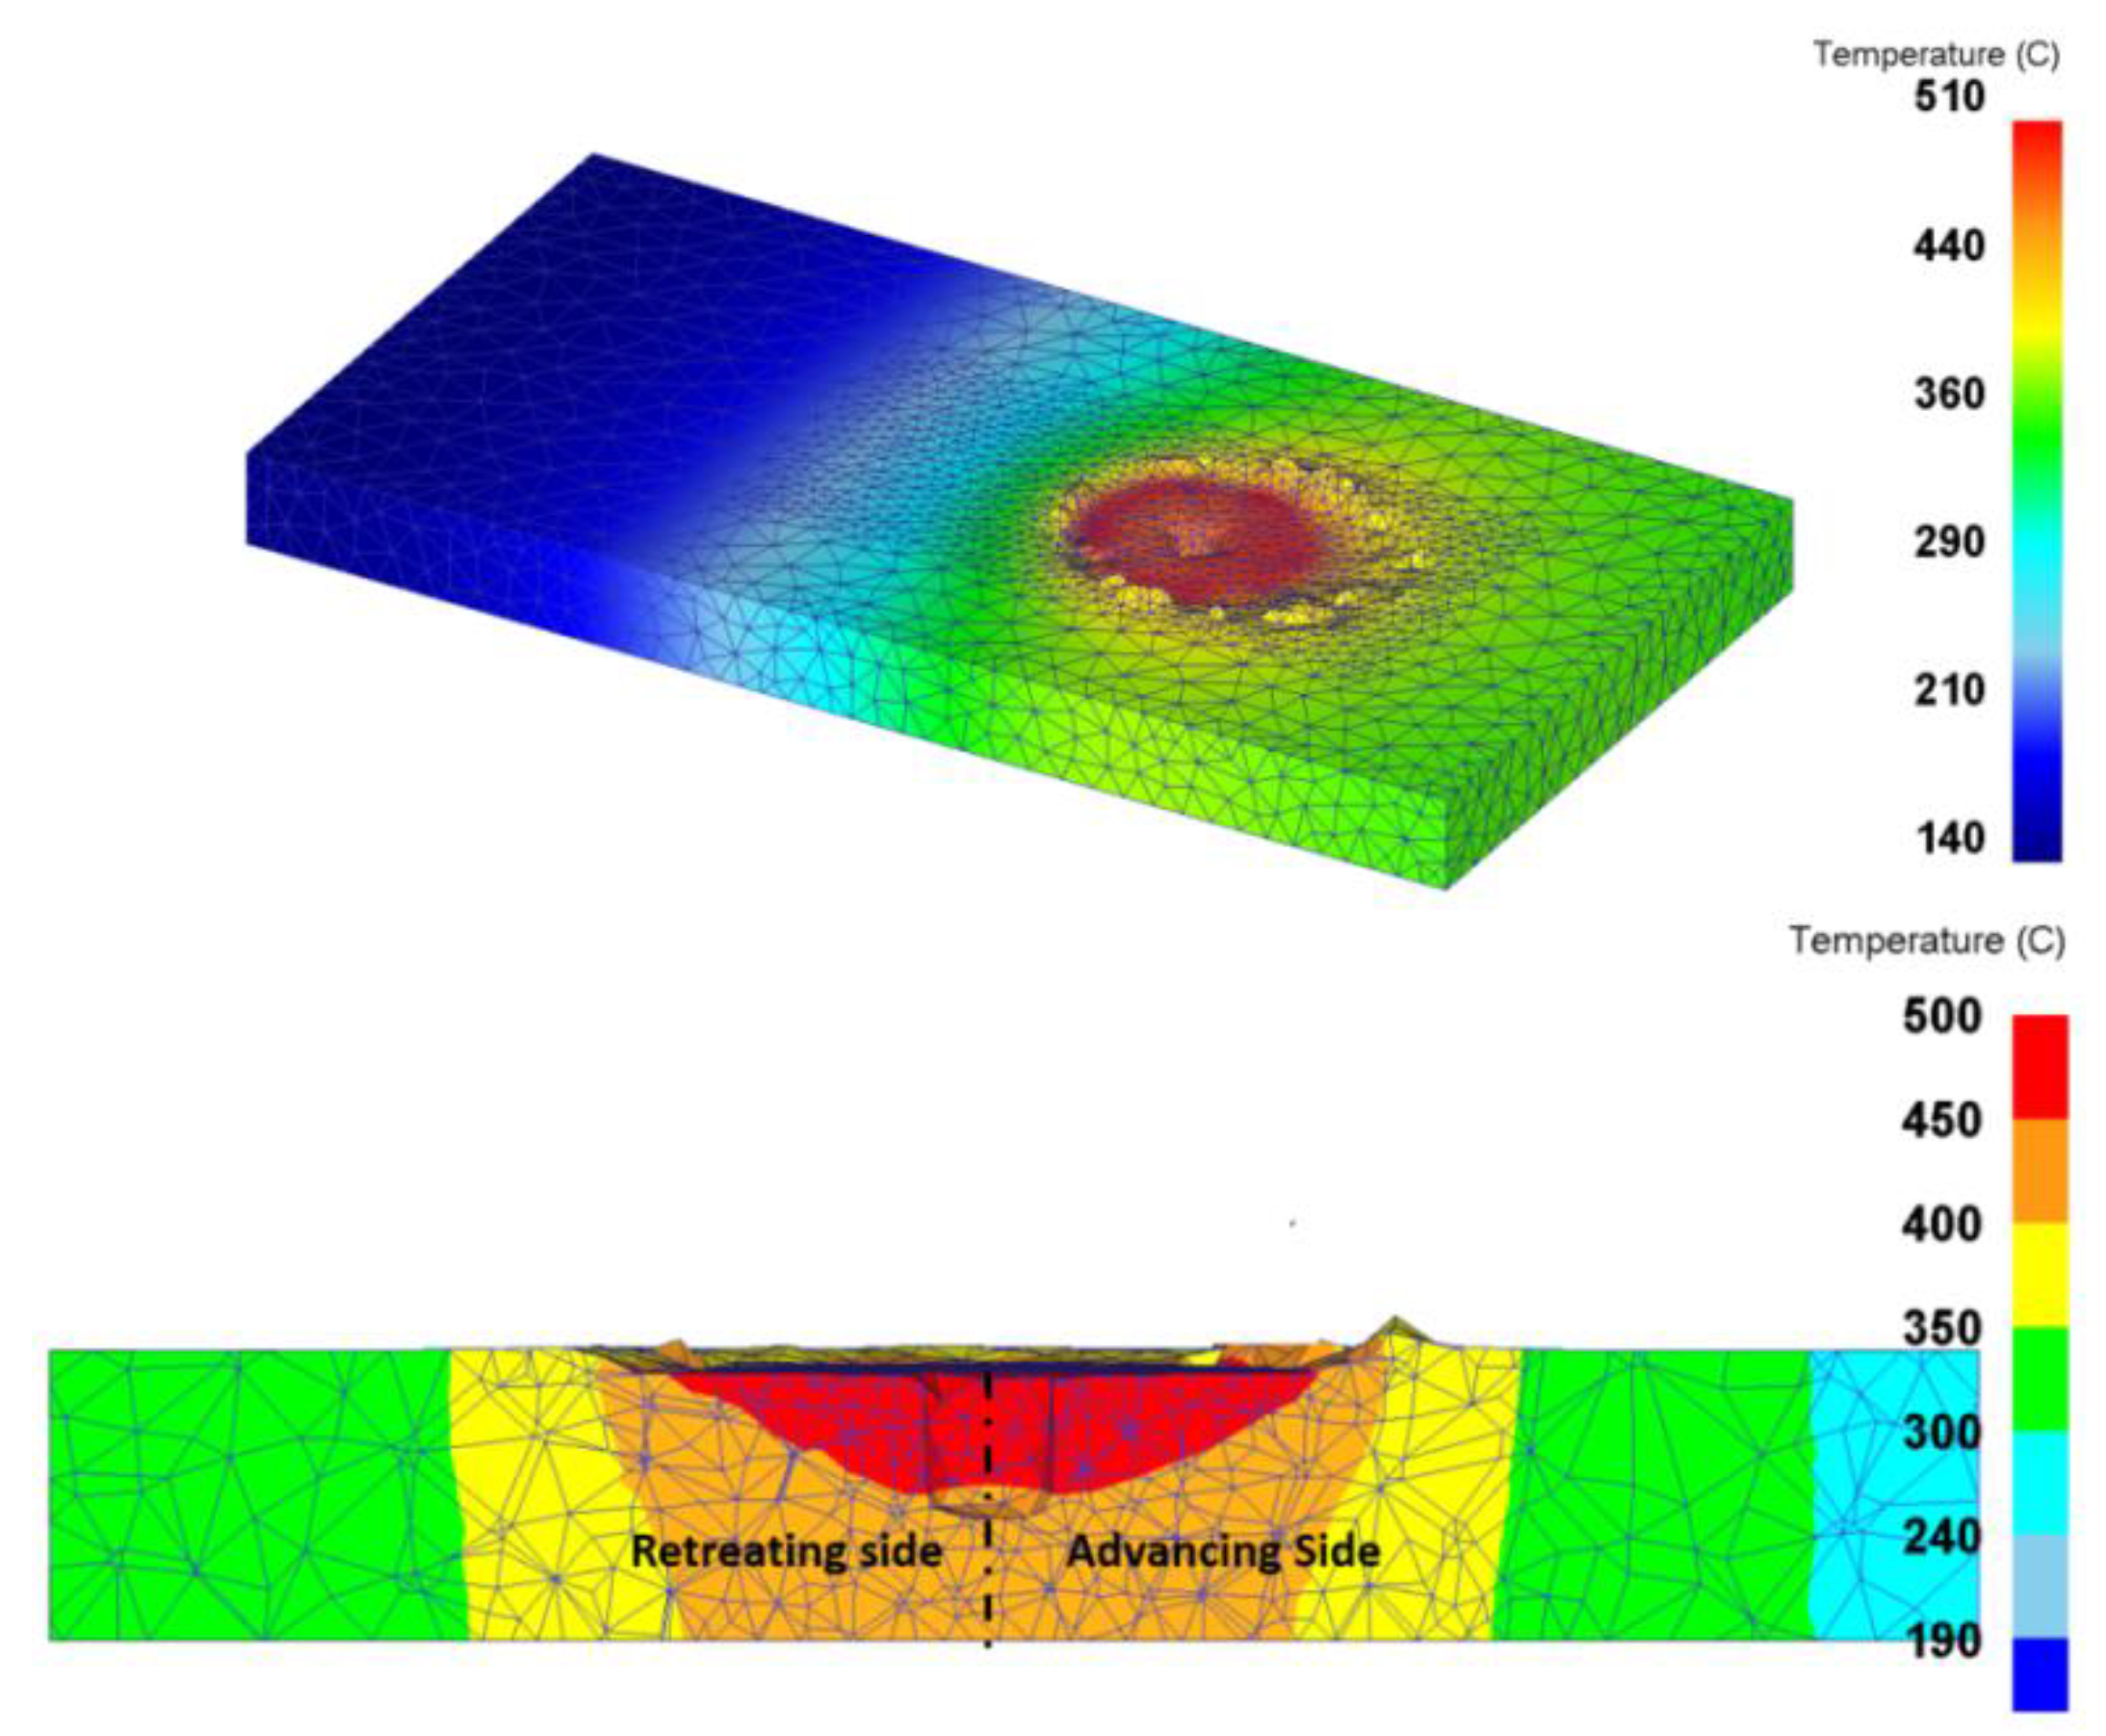
Figure 14.
Impact of pin and shoulder diameter on temperature distribution [117].
Figure 14.
Impact of pin and shoulder diameter on temperature distribution [117].
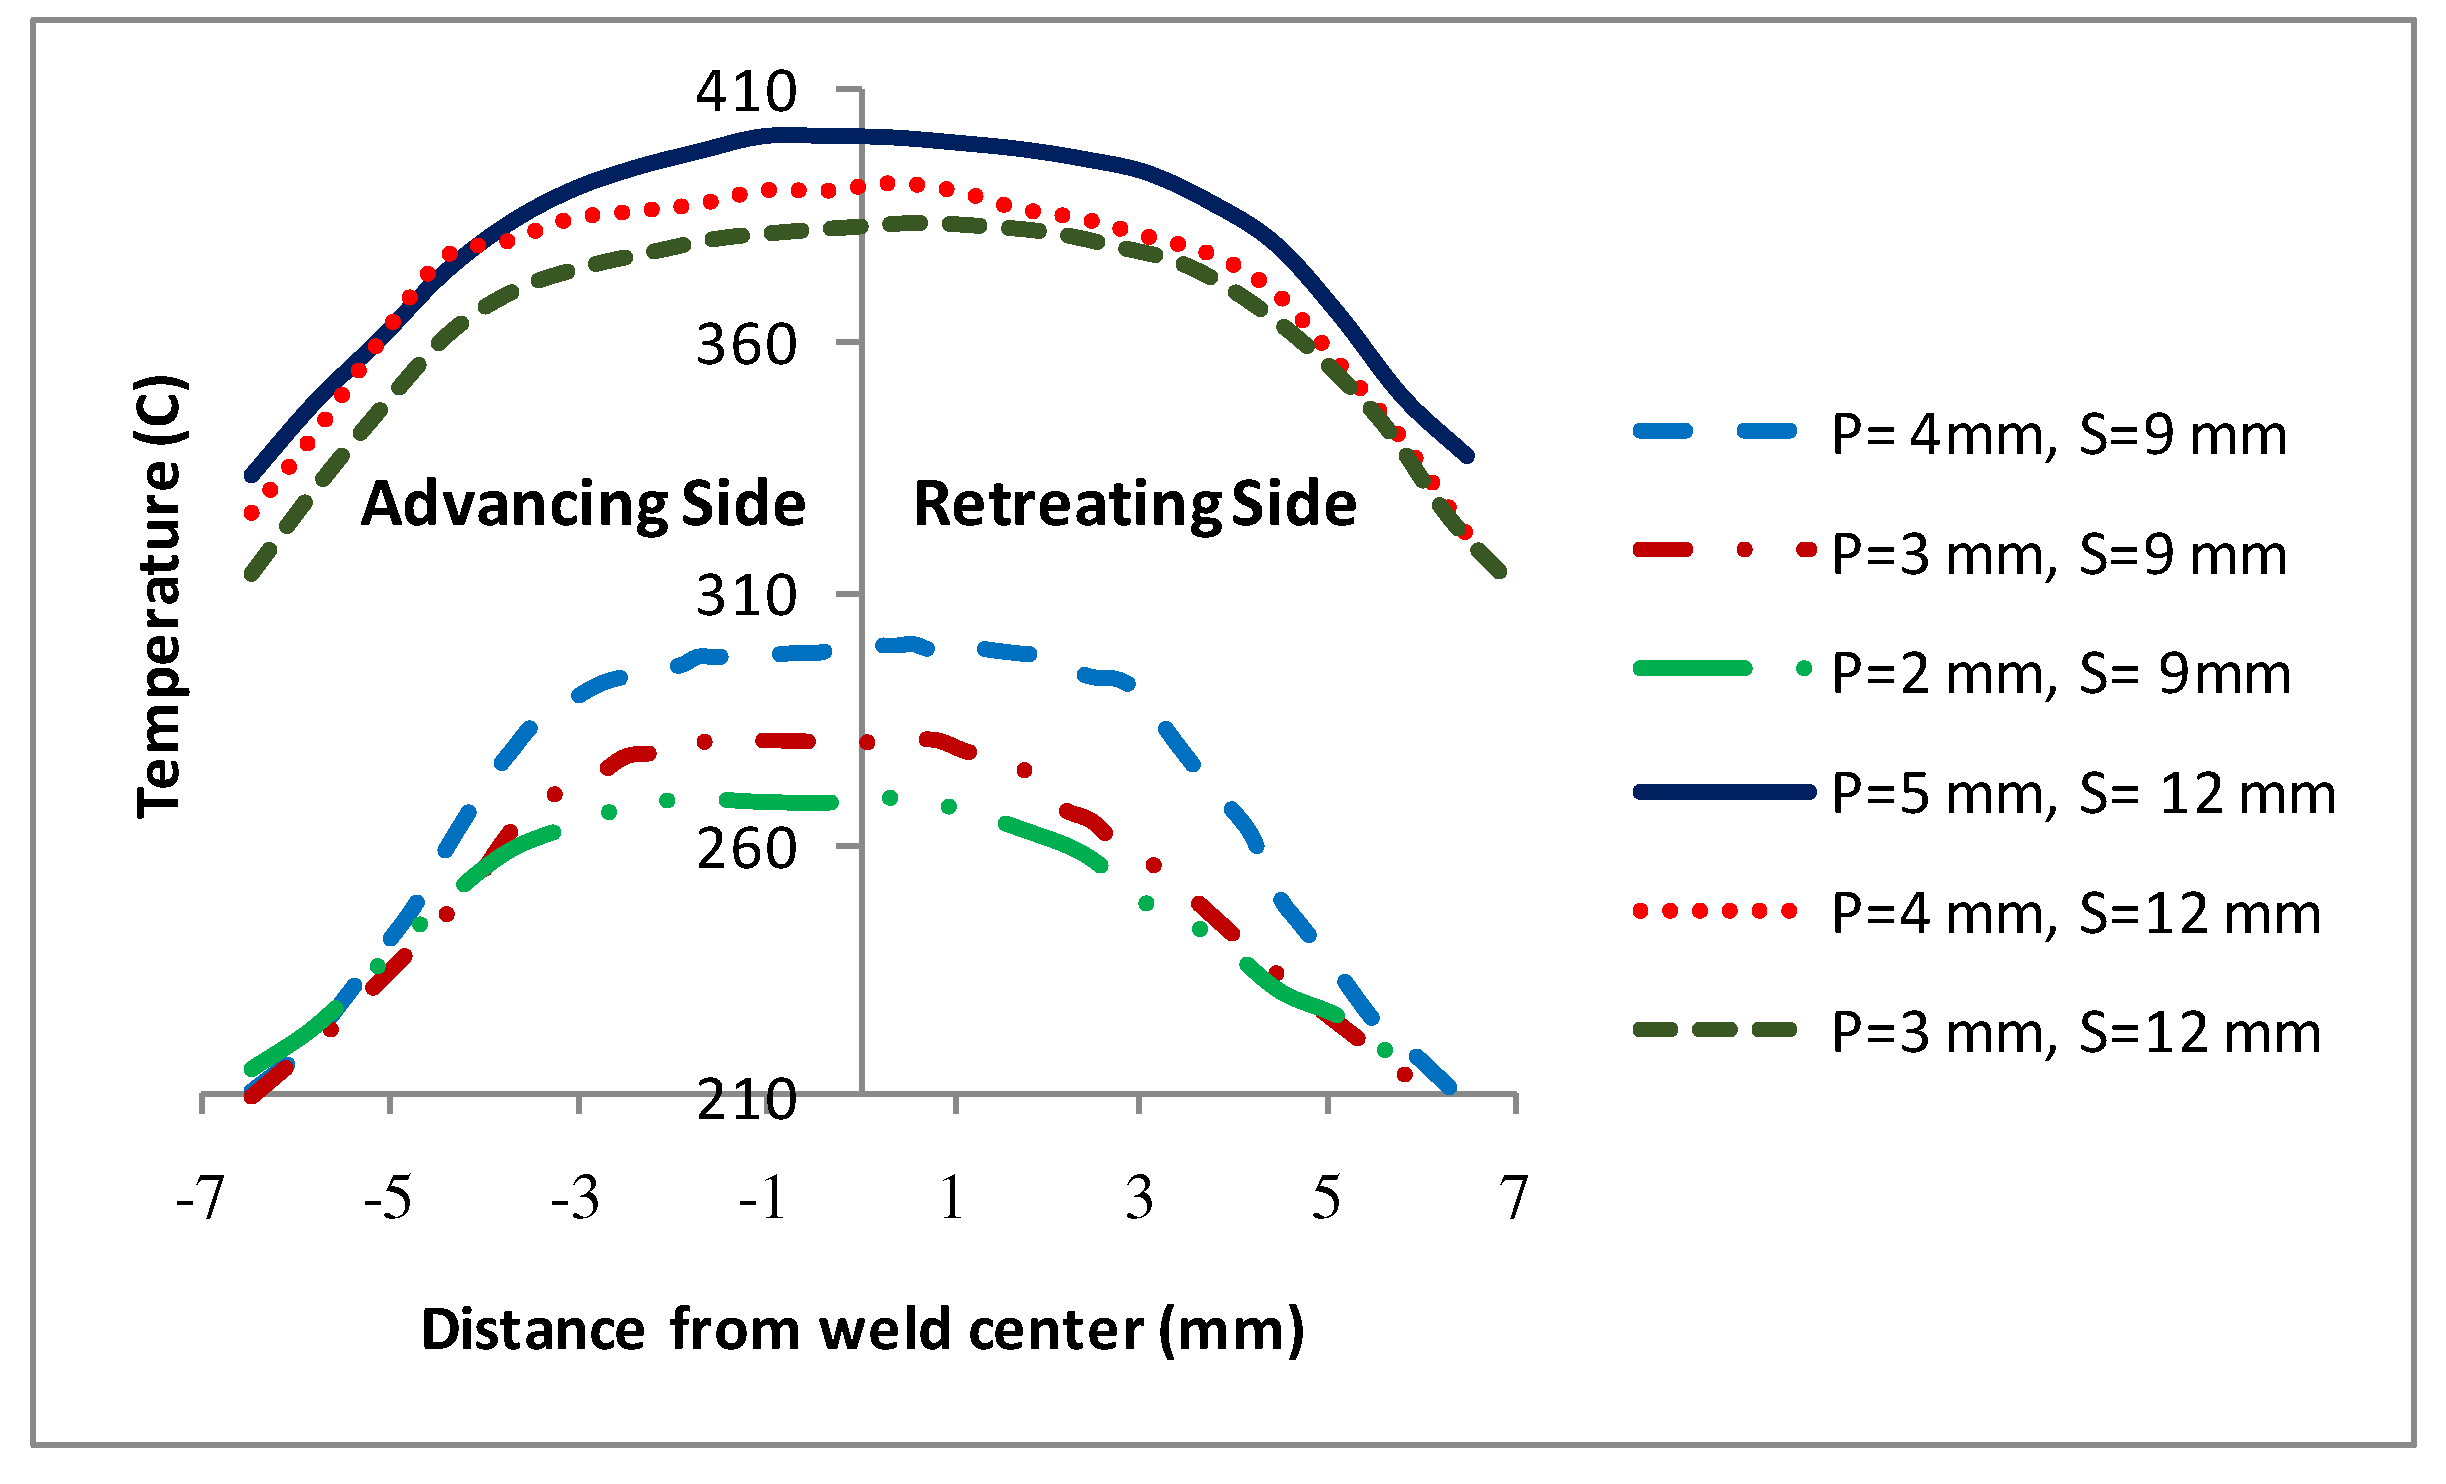
Figure 15.
Temperature contours in the weld cross-section. Pin and shoulder diameters: (a) 3 and 9 mm, and (b) 3 and 12 mm [117].
Figure 15.
Temperature contours in the weld cross-section. Pin and shoulder diameters: (a) 3 and 9 mm, and (b) 3 and 12 mm [117].
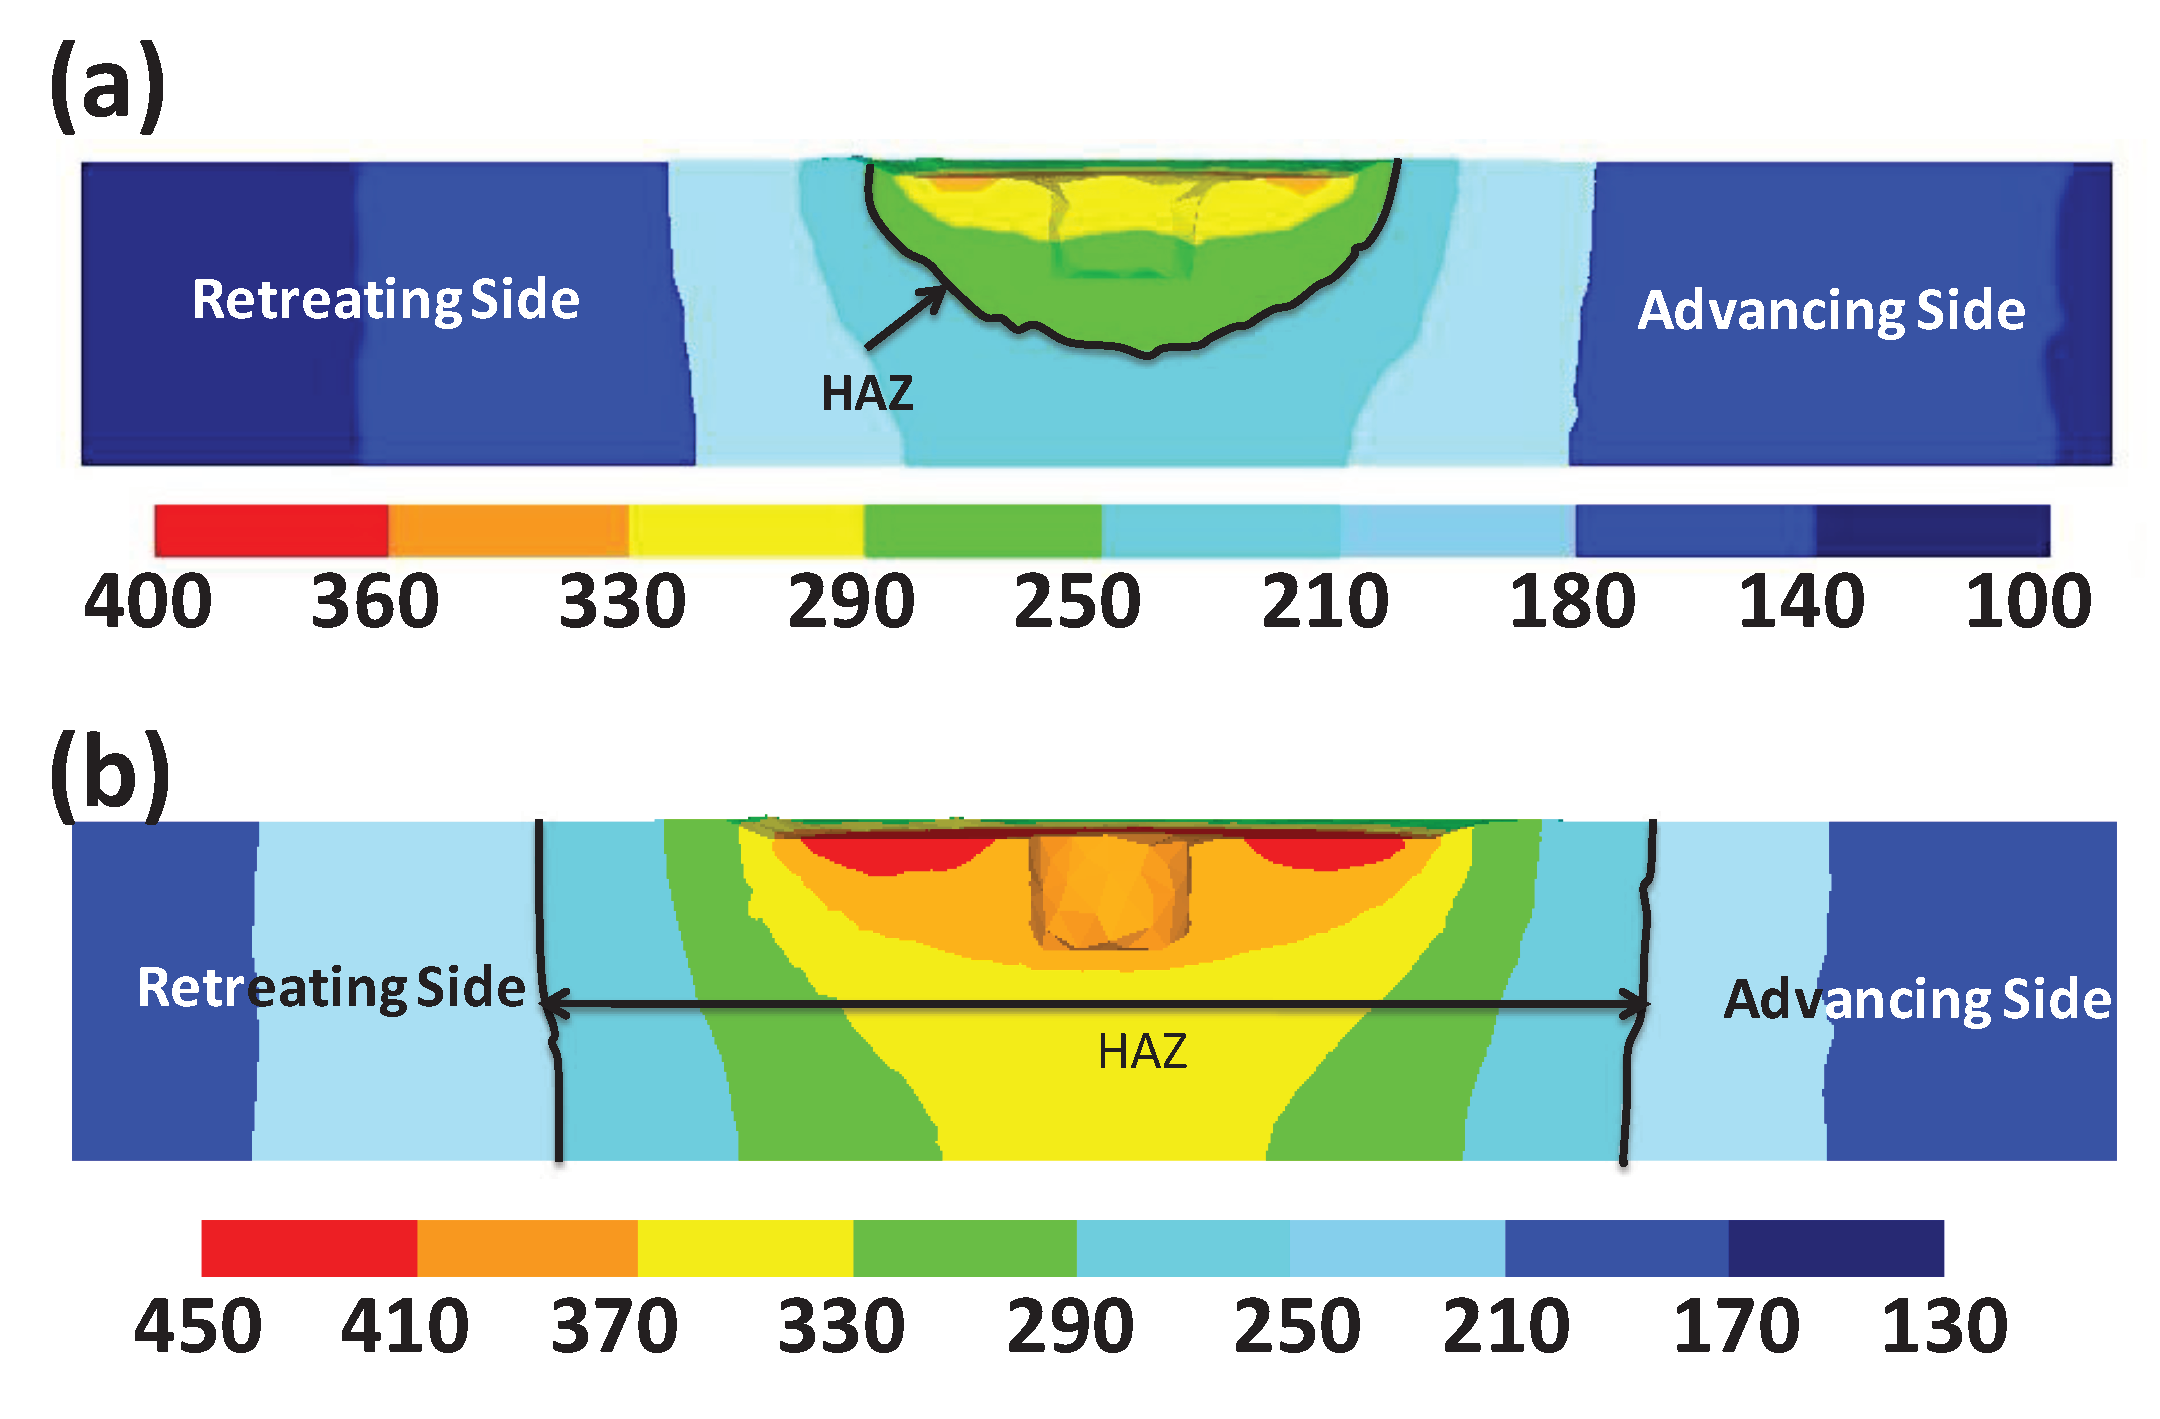
Figure 16.
Various pins employed in Akbari et al. investigation [35].
Figure 16.
Various pins employed in Akbari et al. investigation [35].
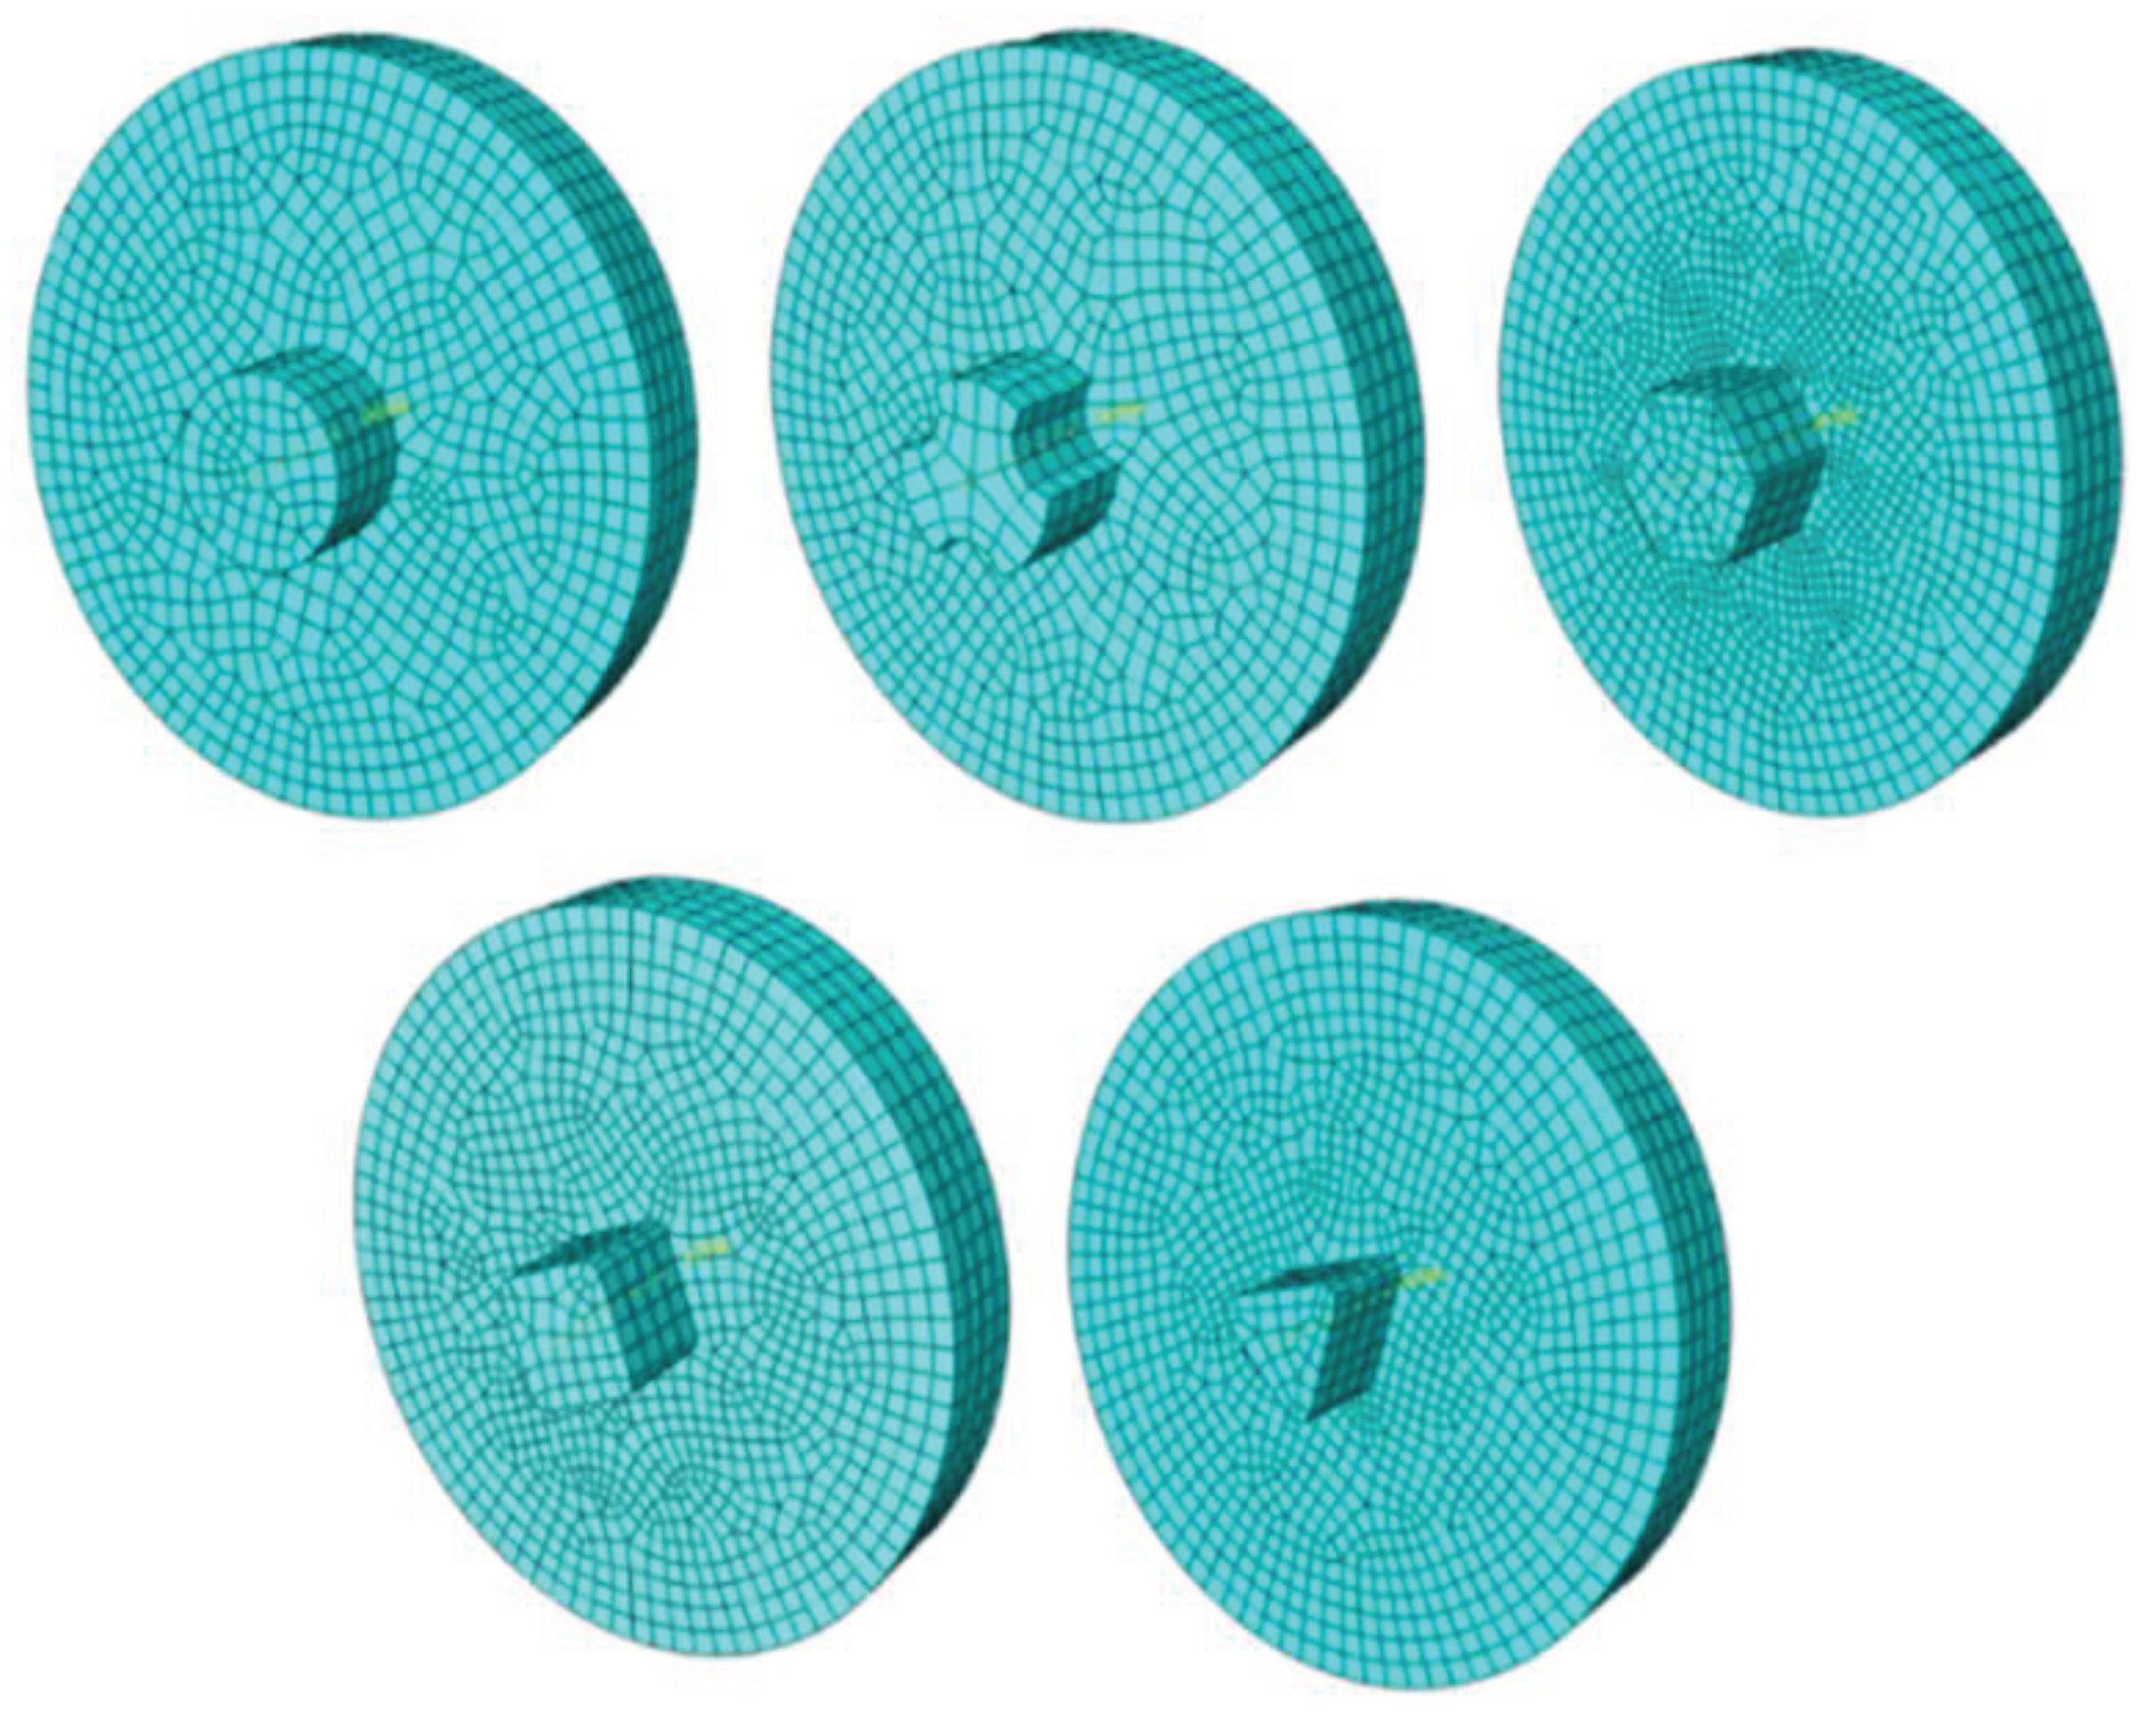
Figure 17.
Temperature variation of the cross-section of the weld fabricated with various pin shapes of (a) cylindrical, (b) hexagonal, (c) square, (d) triangular, and (e) triflate pin profiles [35].
Figure 17.
Temperature variation of the cross-section of the weld fabricated with various pin shapes of (a) cylindrical, (b) hexagonal, (c) square, (d) triangular, and (e) triflate pin profiles [35].
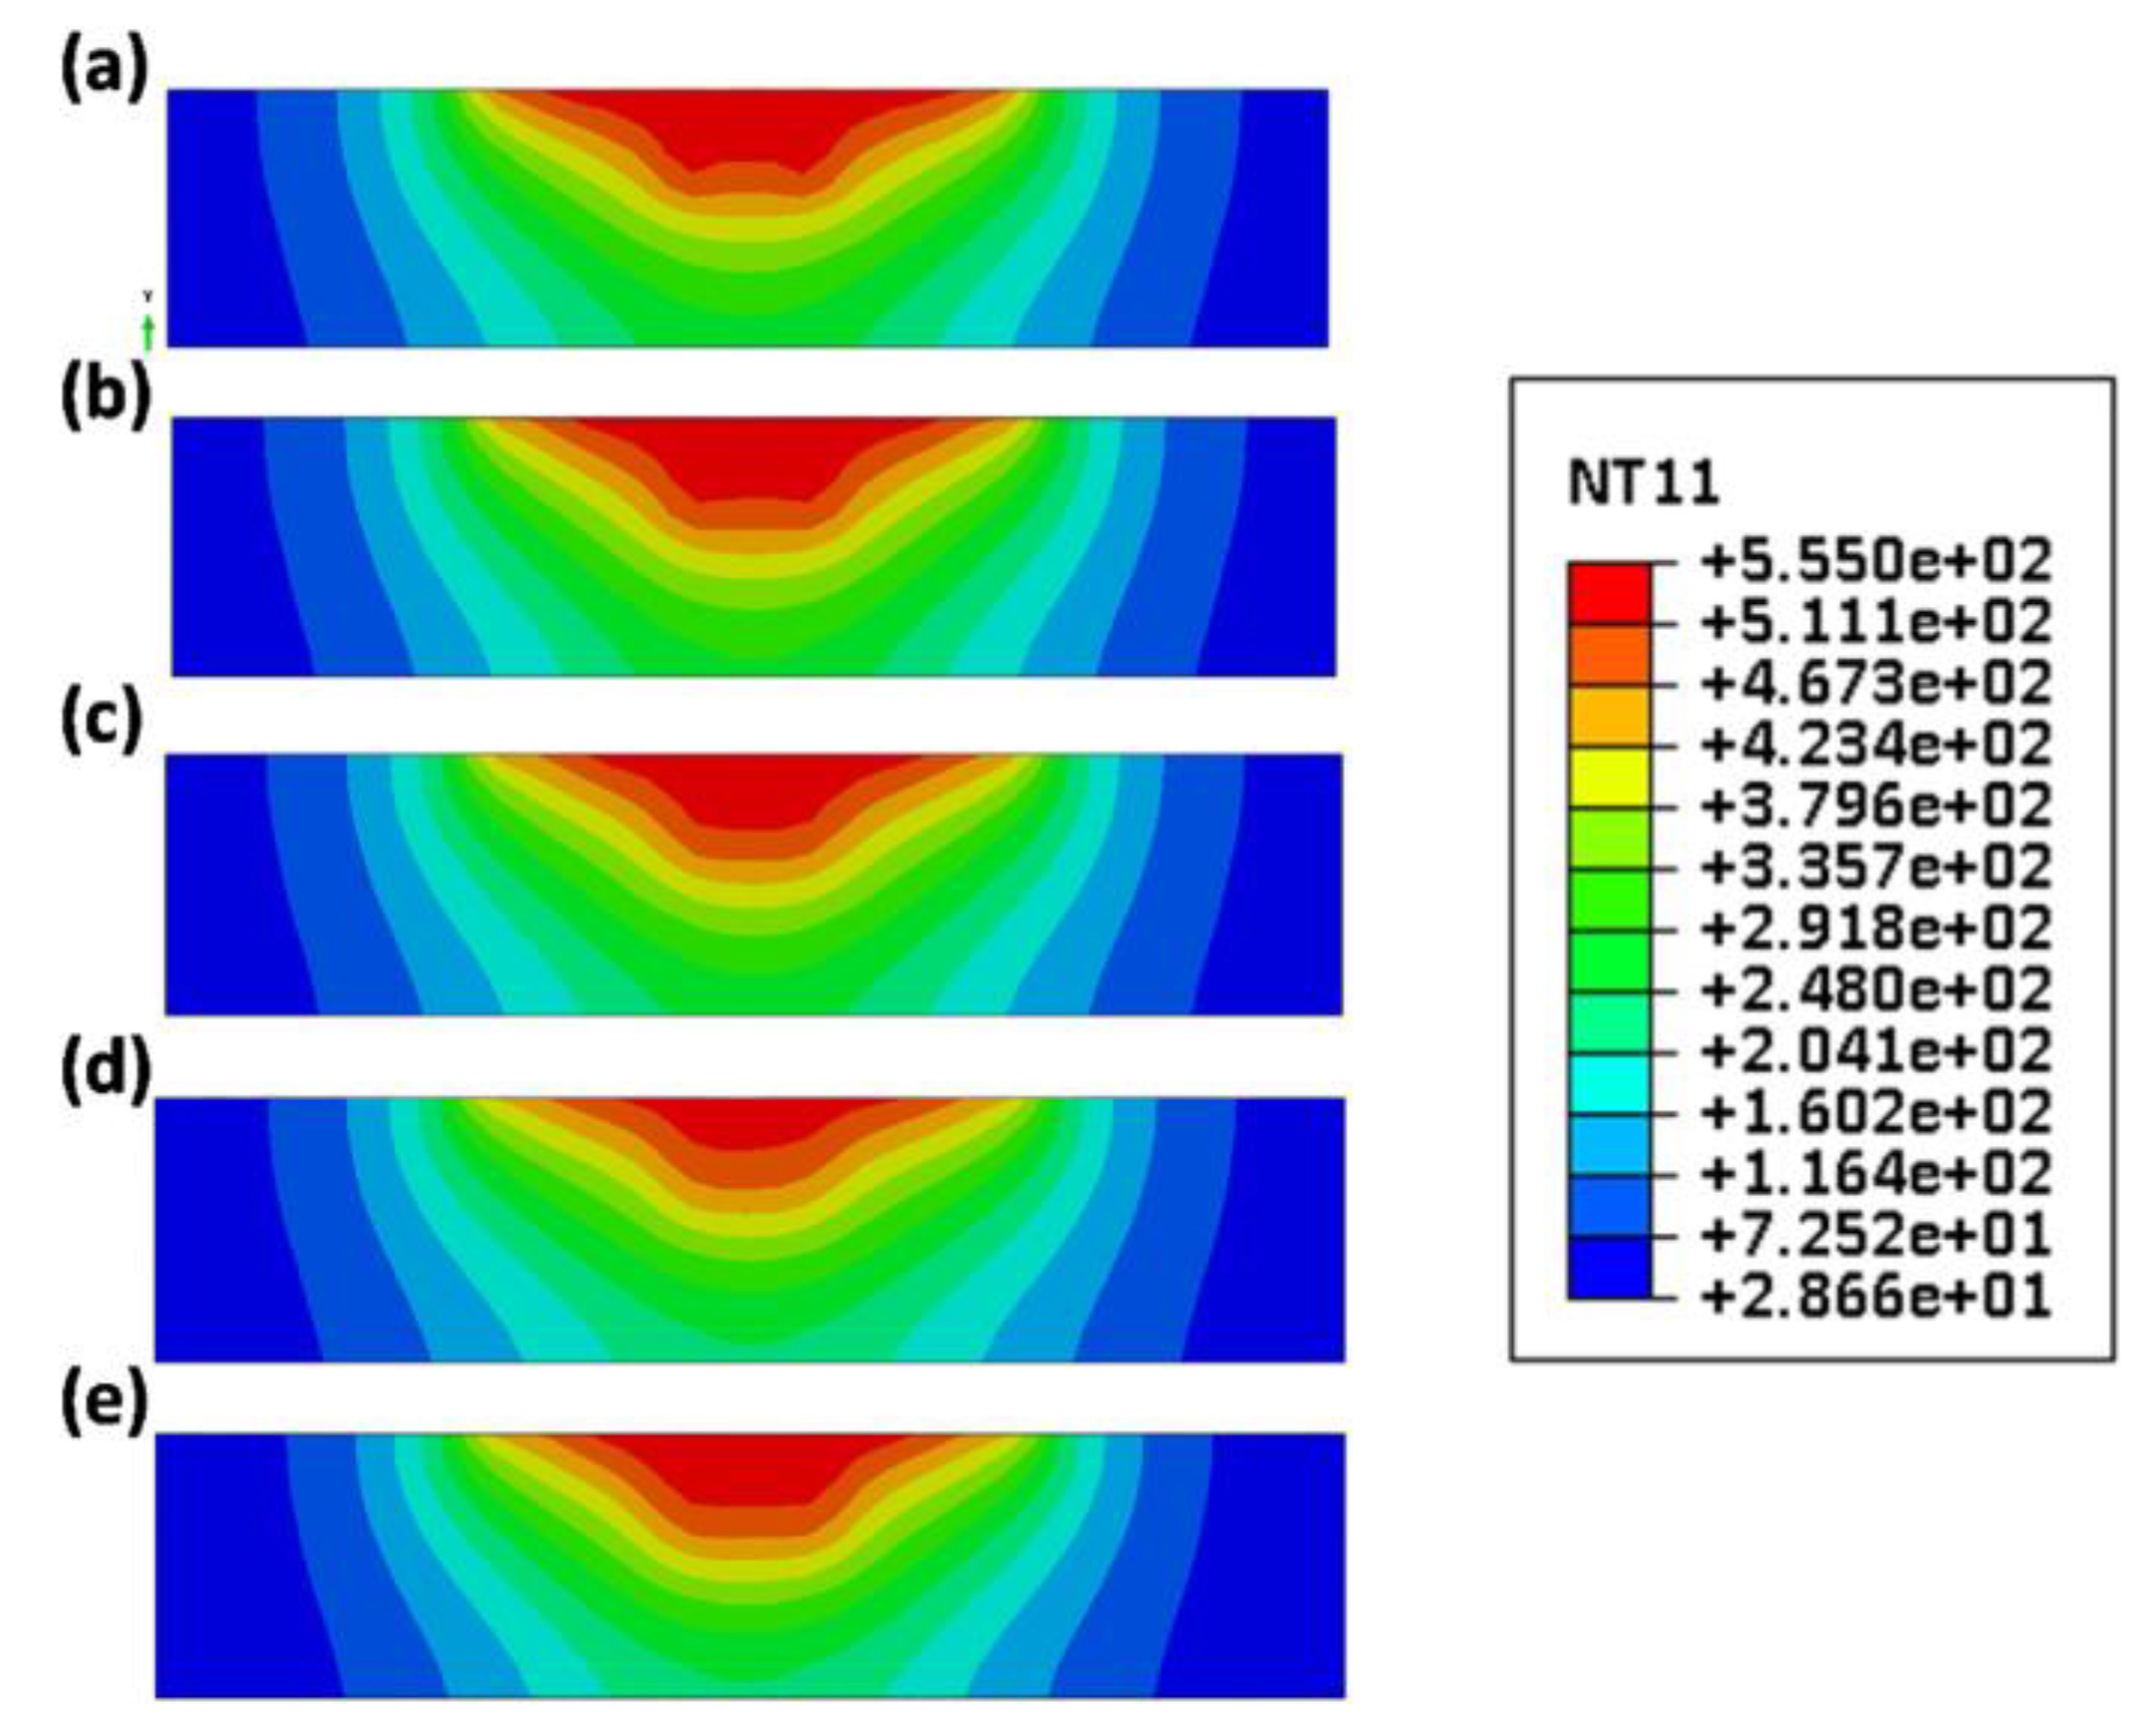
Figure 18.
Increase of Temperature in the material due to the (a) plastic deformation heat and (b) frictional heat [124].
Figure 18.
Increase of Temperature in the material due to the (a) plastic deformation heat and (b) frictional heat [124].
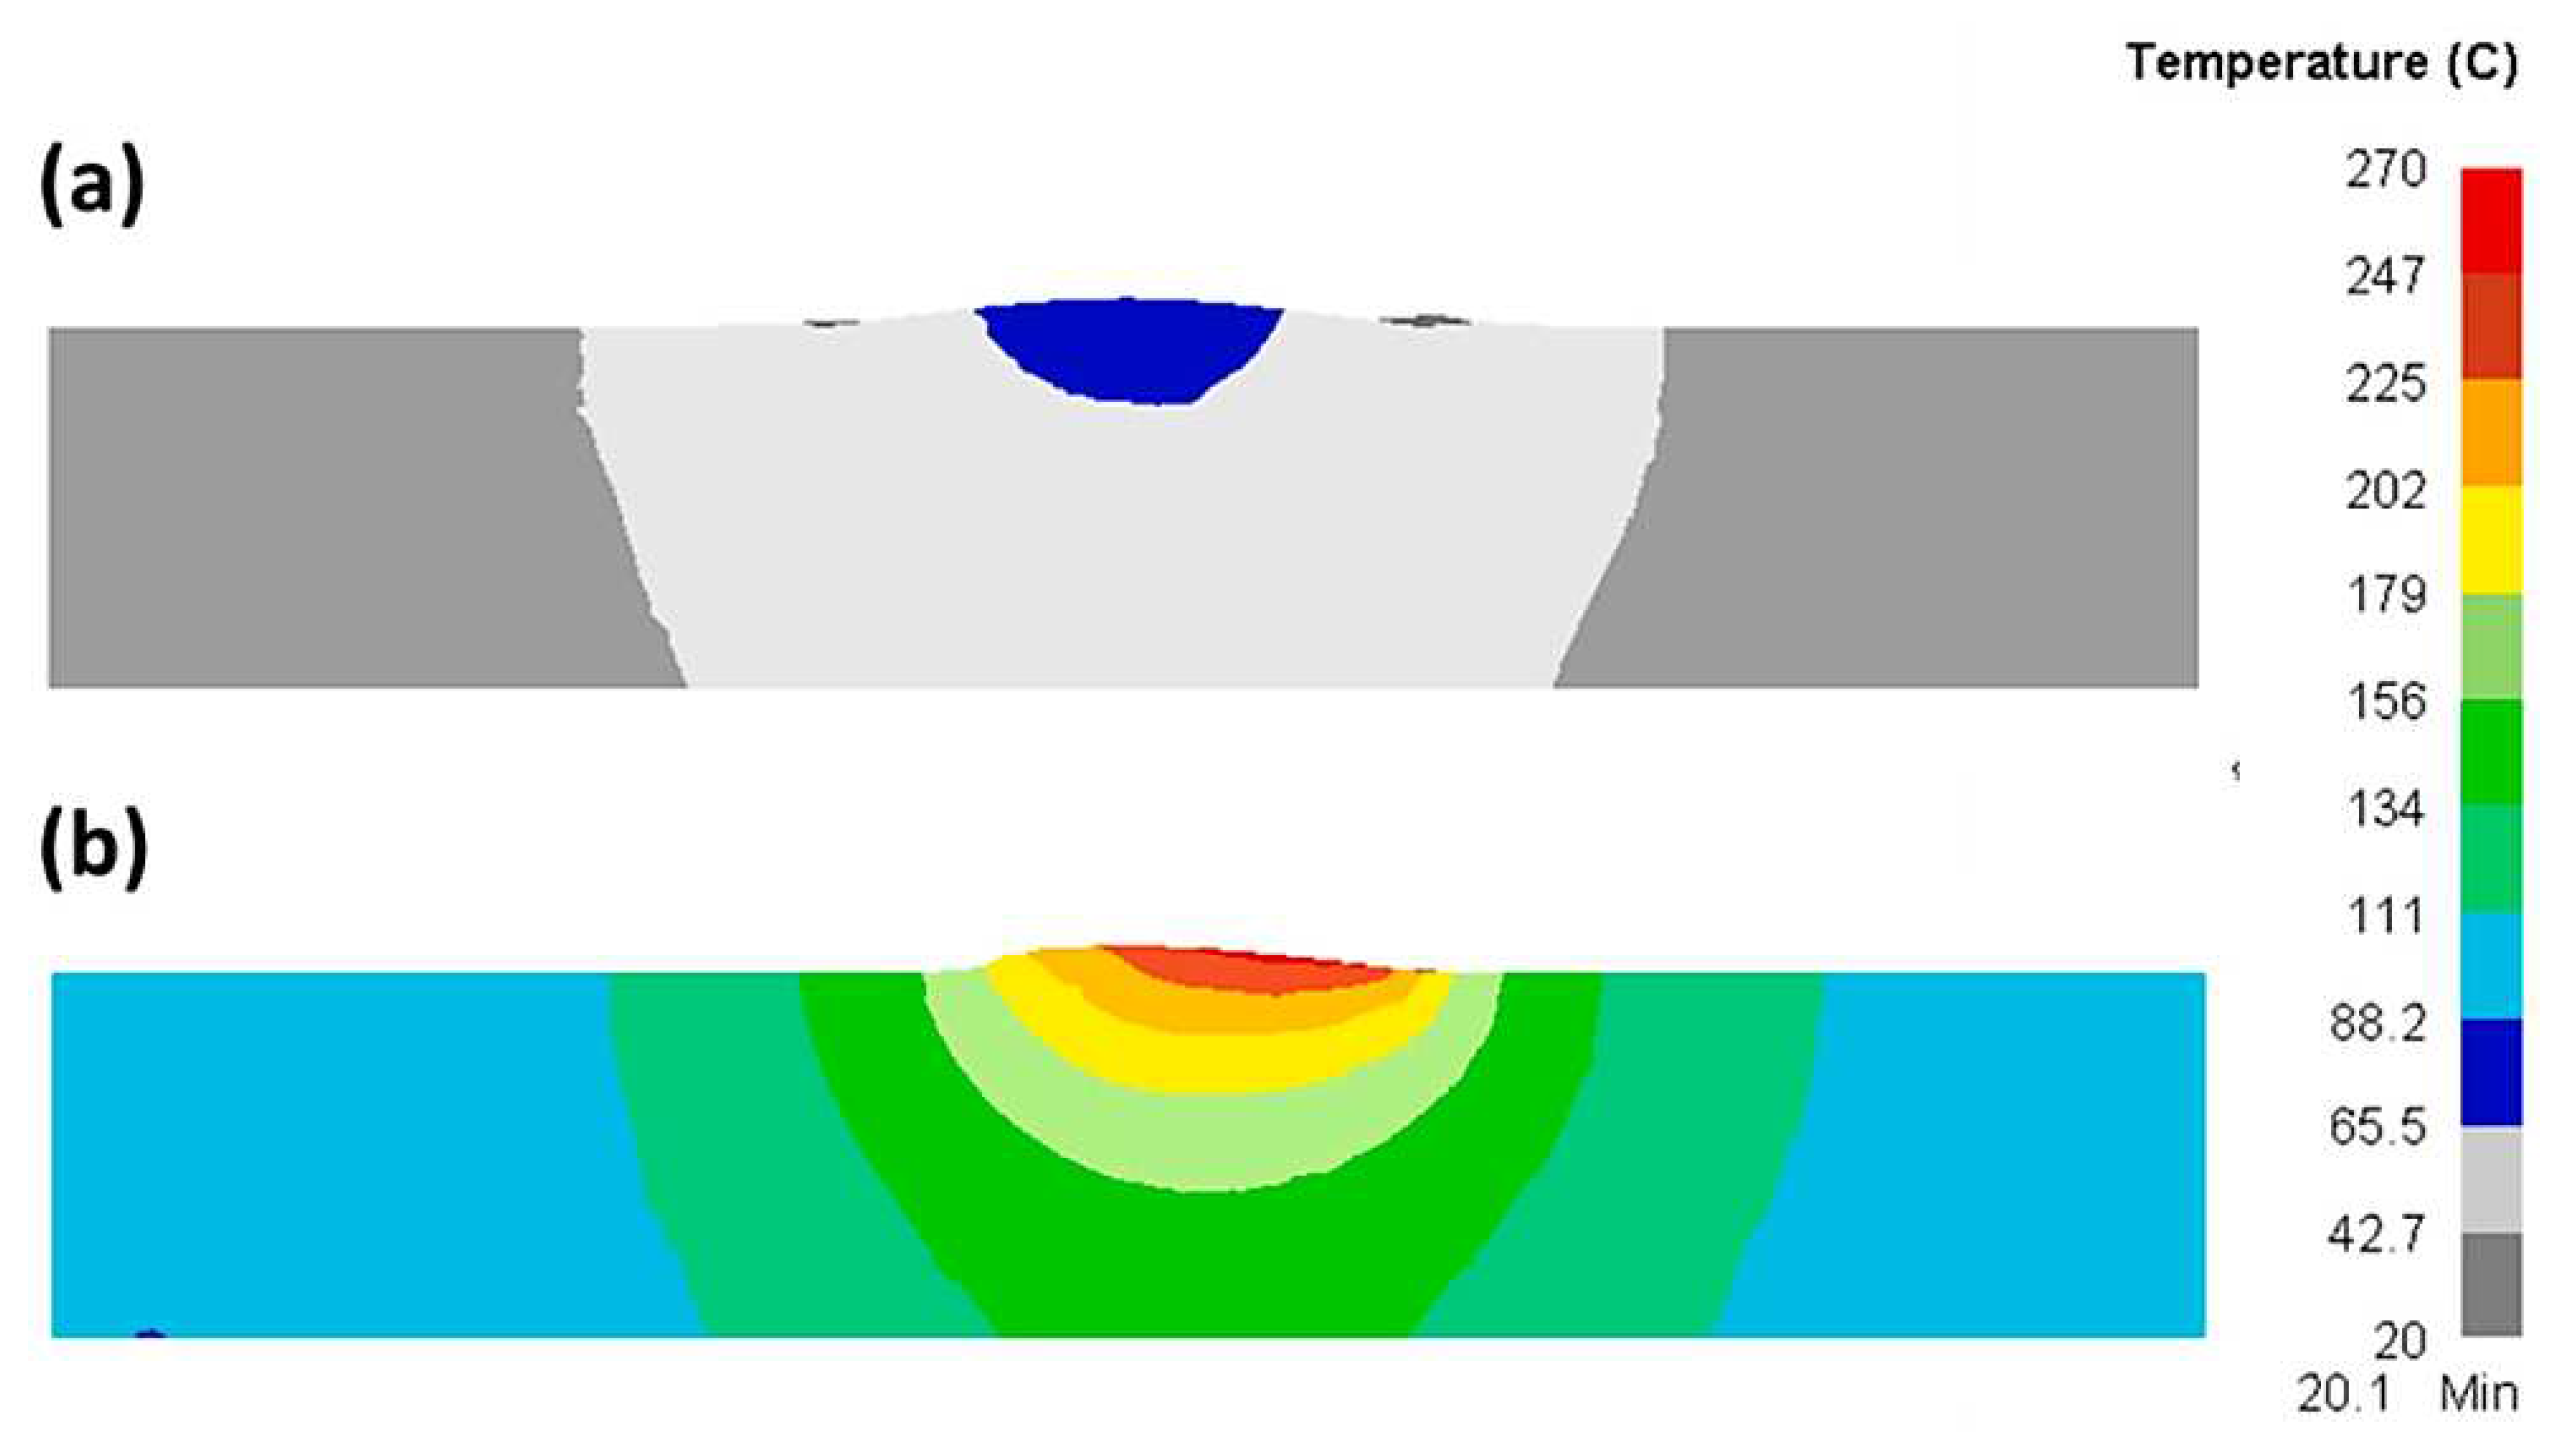
Figure 19.
Plastic deformation heat, frictional heat, and total heat generation at different rotational speeds and constant traverse speed of 60 mm/min (a) shoulder, (b) pin, (c) tip [59].
Figure 19.
Plastic deformation heat, frictional heat, and total heat generation at different rotational speeds and constant traverse speed of 60 mm/min (a) shoulder, (b) pin, (c) tip [59].
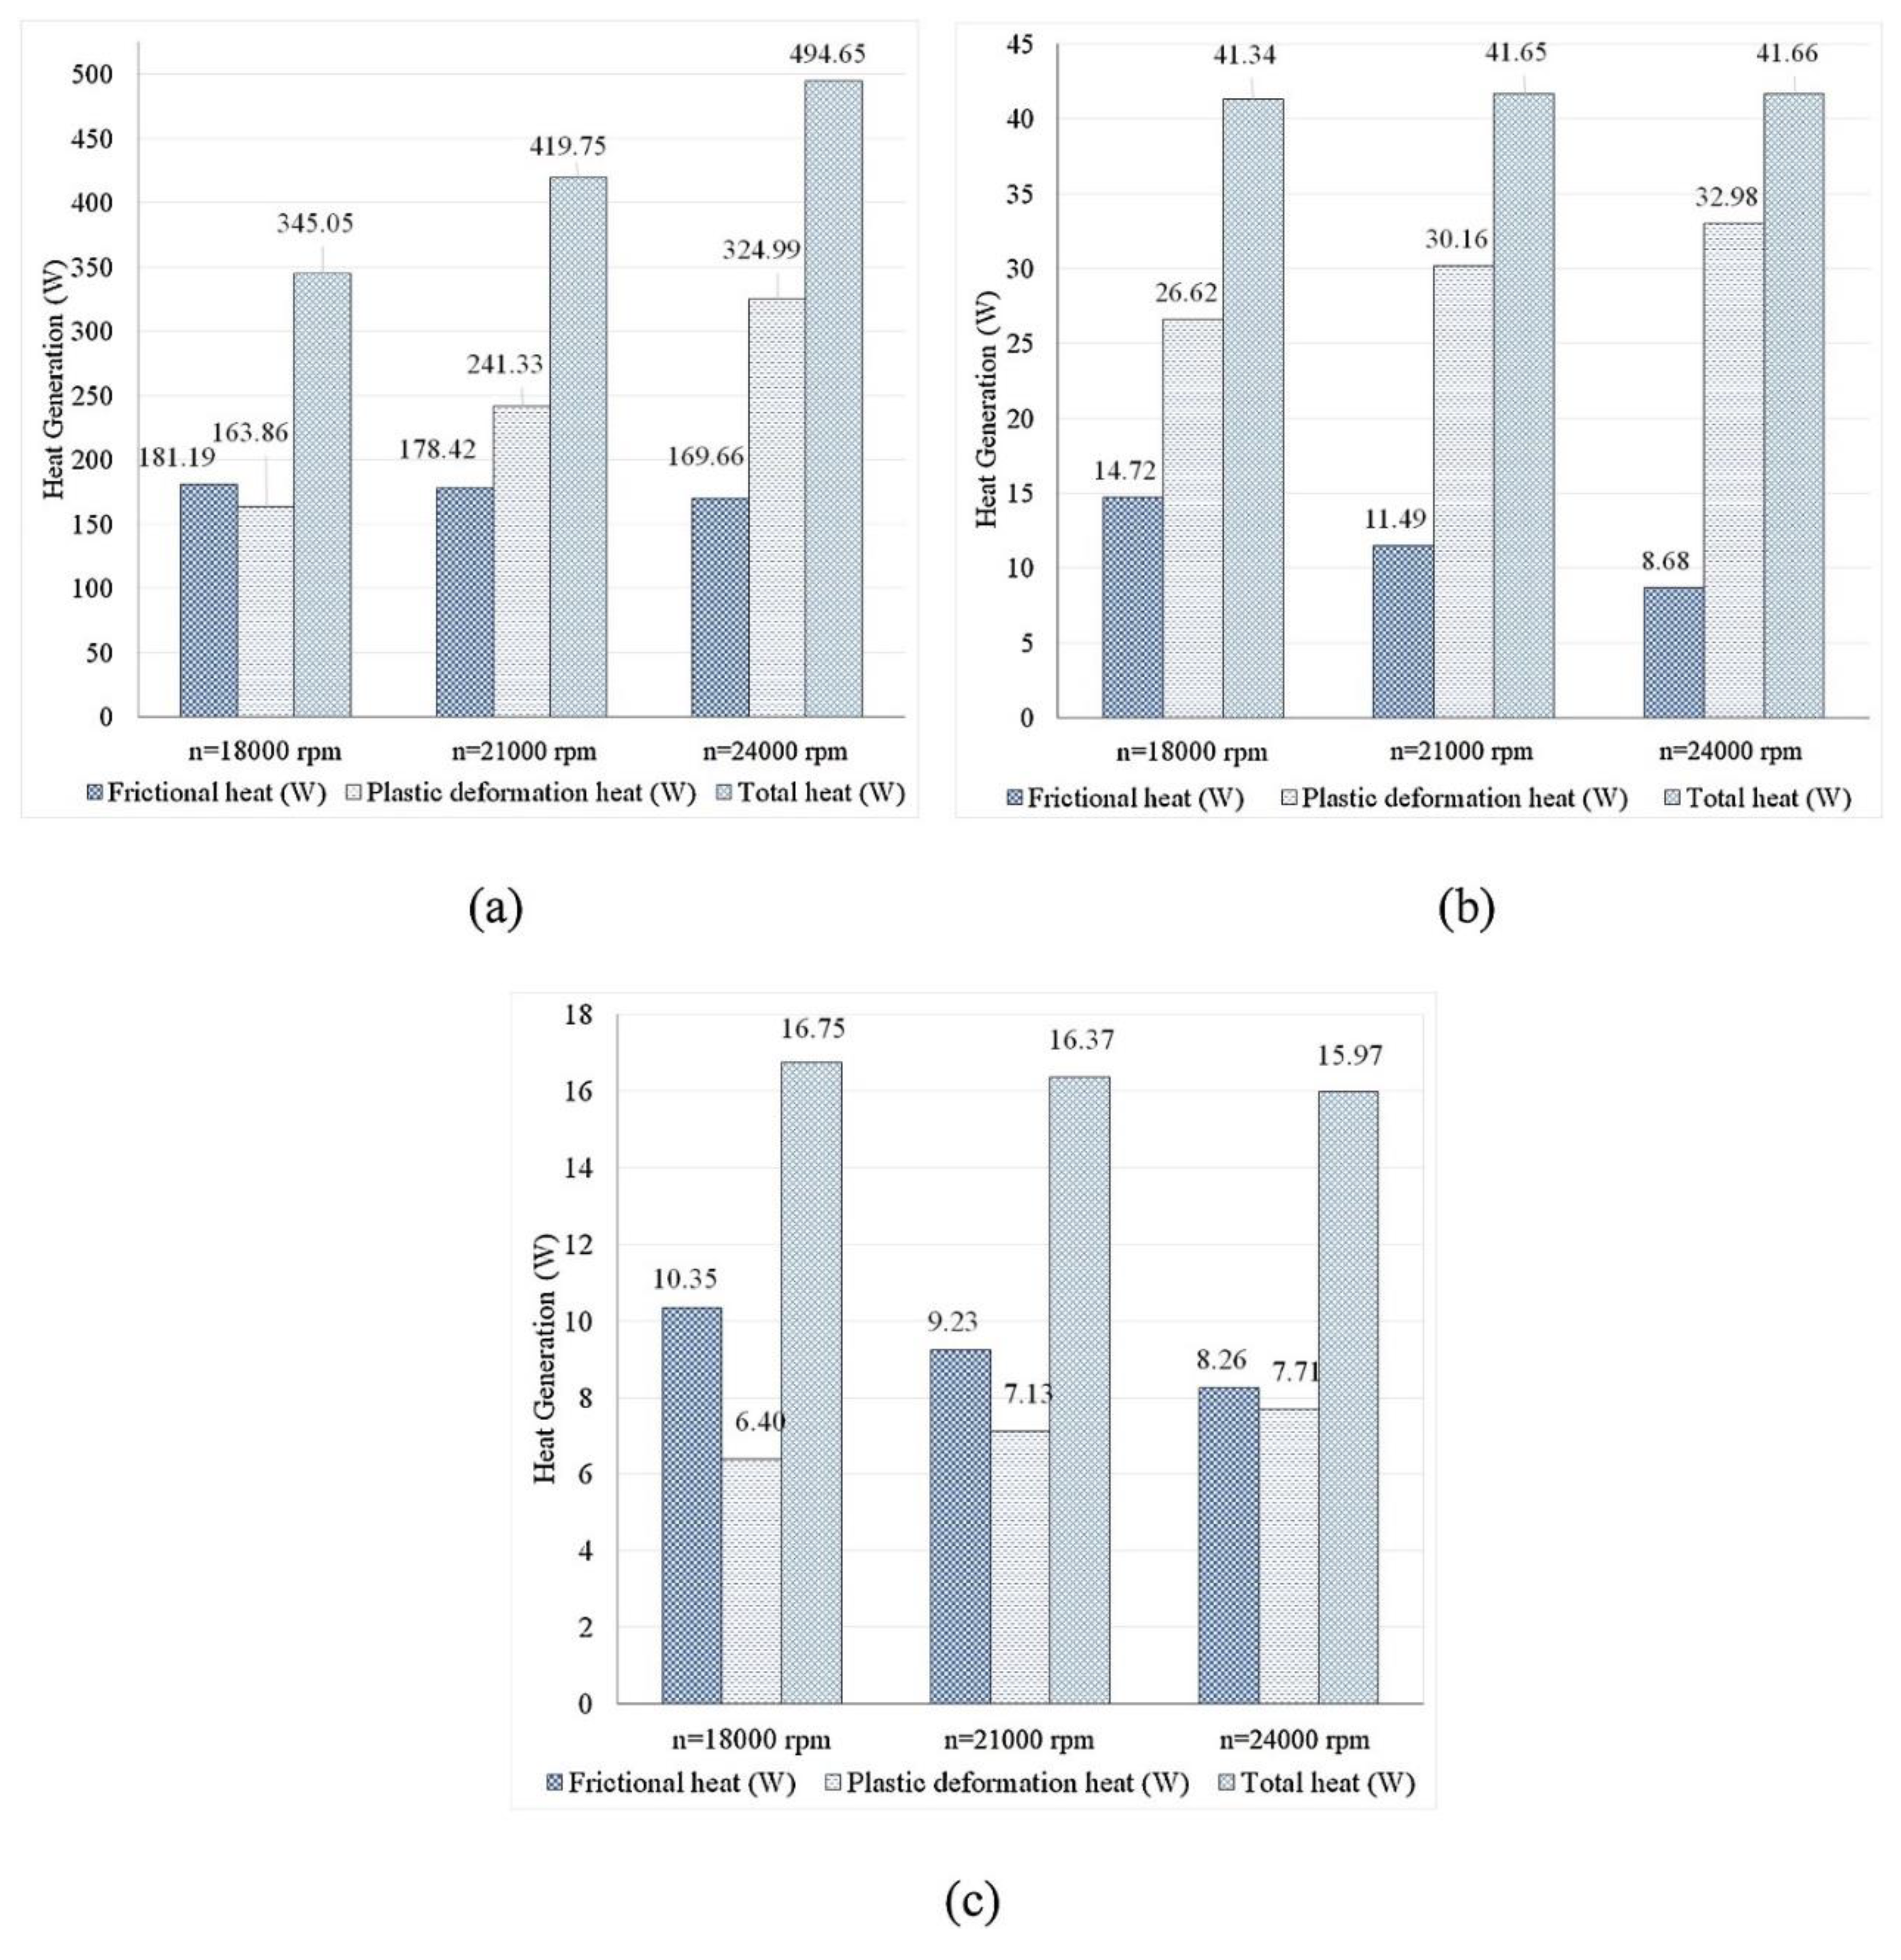
Figure 20.
The temperature contours and profiles in the weld cross-section. The rotational speed was 700 rpm, and traverse speeds were (a-1) 18, (a-2) 30, (a-3) 42, and (a-4) 60 mm/min [6].
Figure 20.
The temperature contours and profiles in the weld cross-section. The rotational speed was 700 rpm, and traverse speeds were (a-1) 18, (a-2) 30, (a-3) 42, and (a-4) 60 mm/min [6].
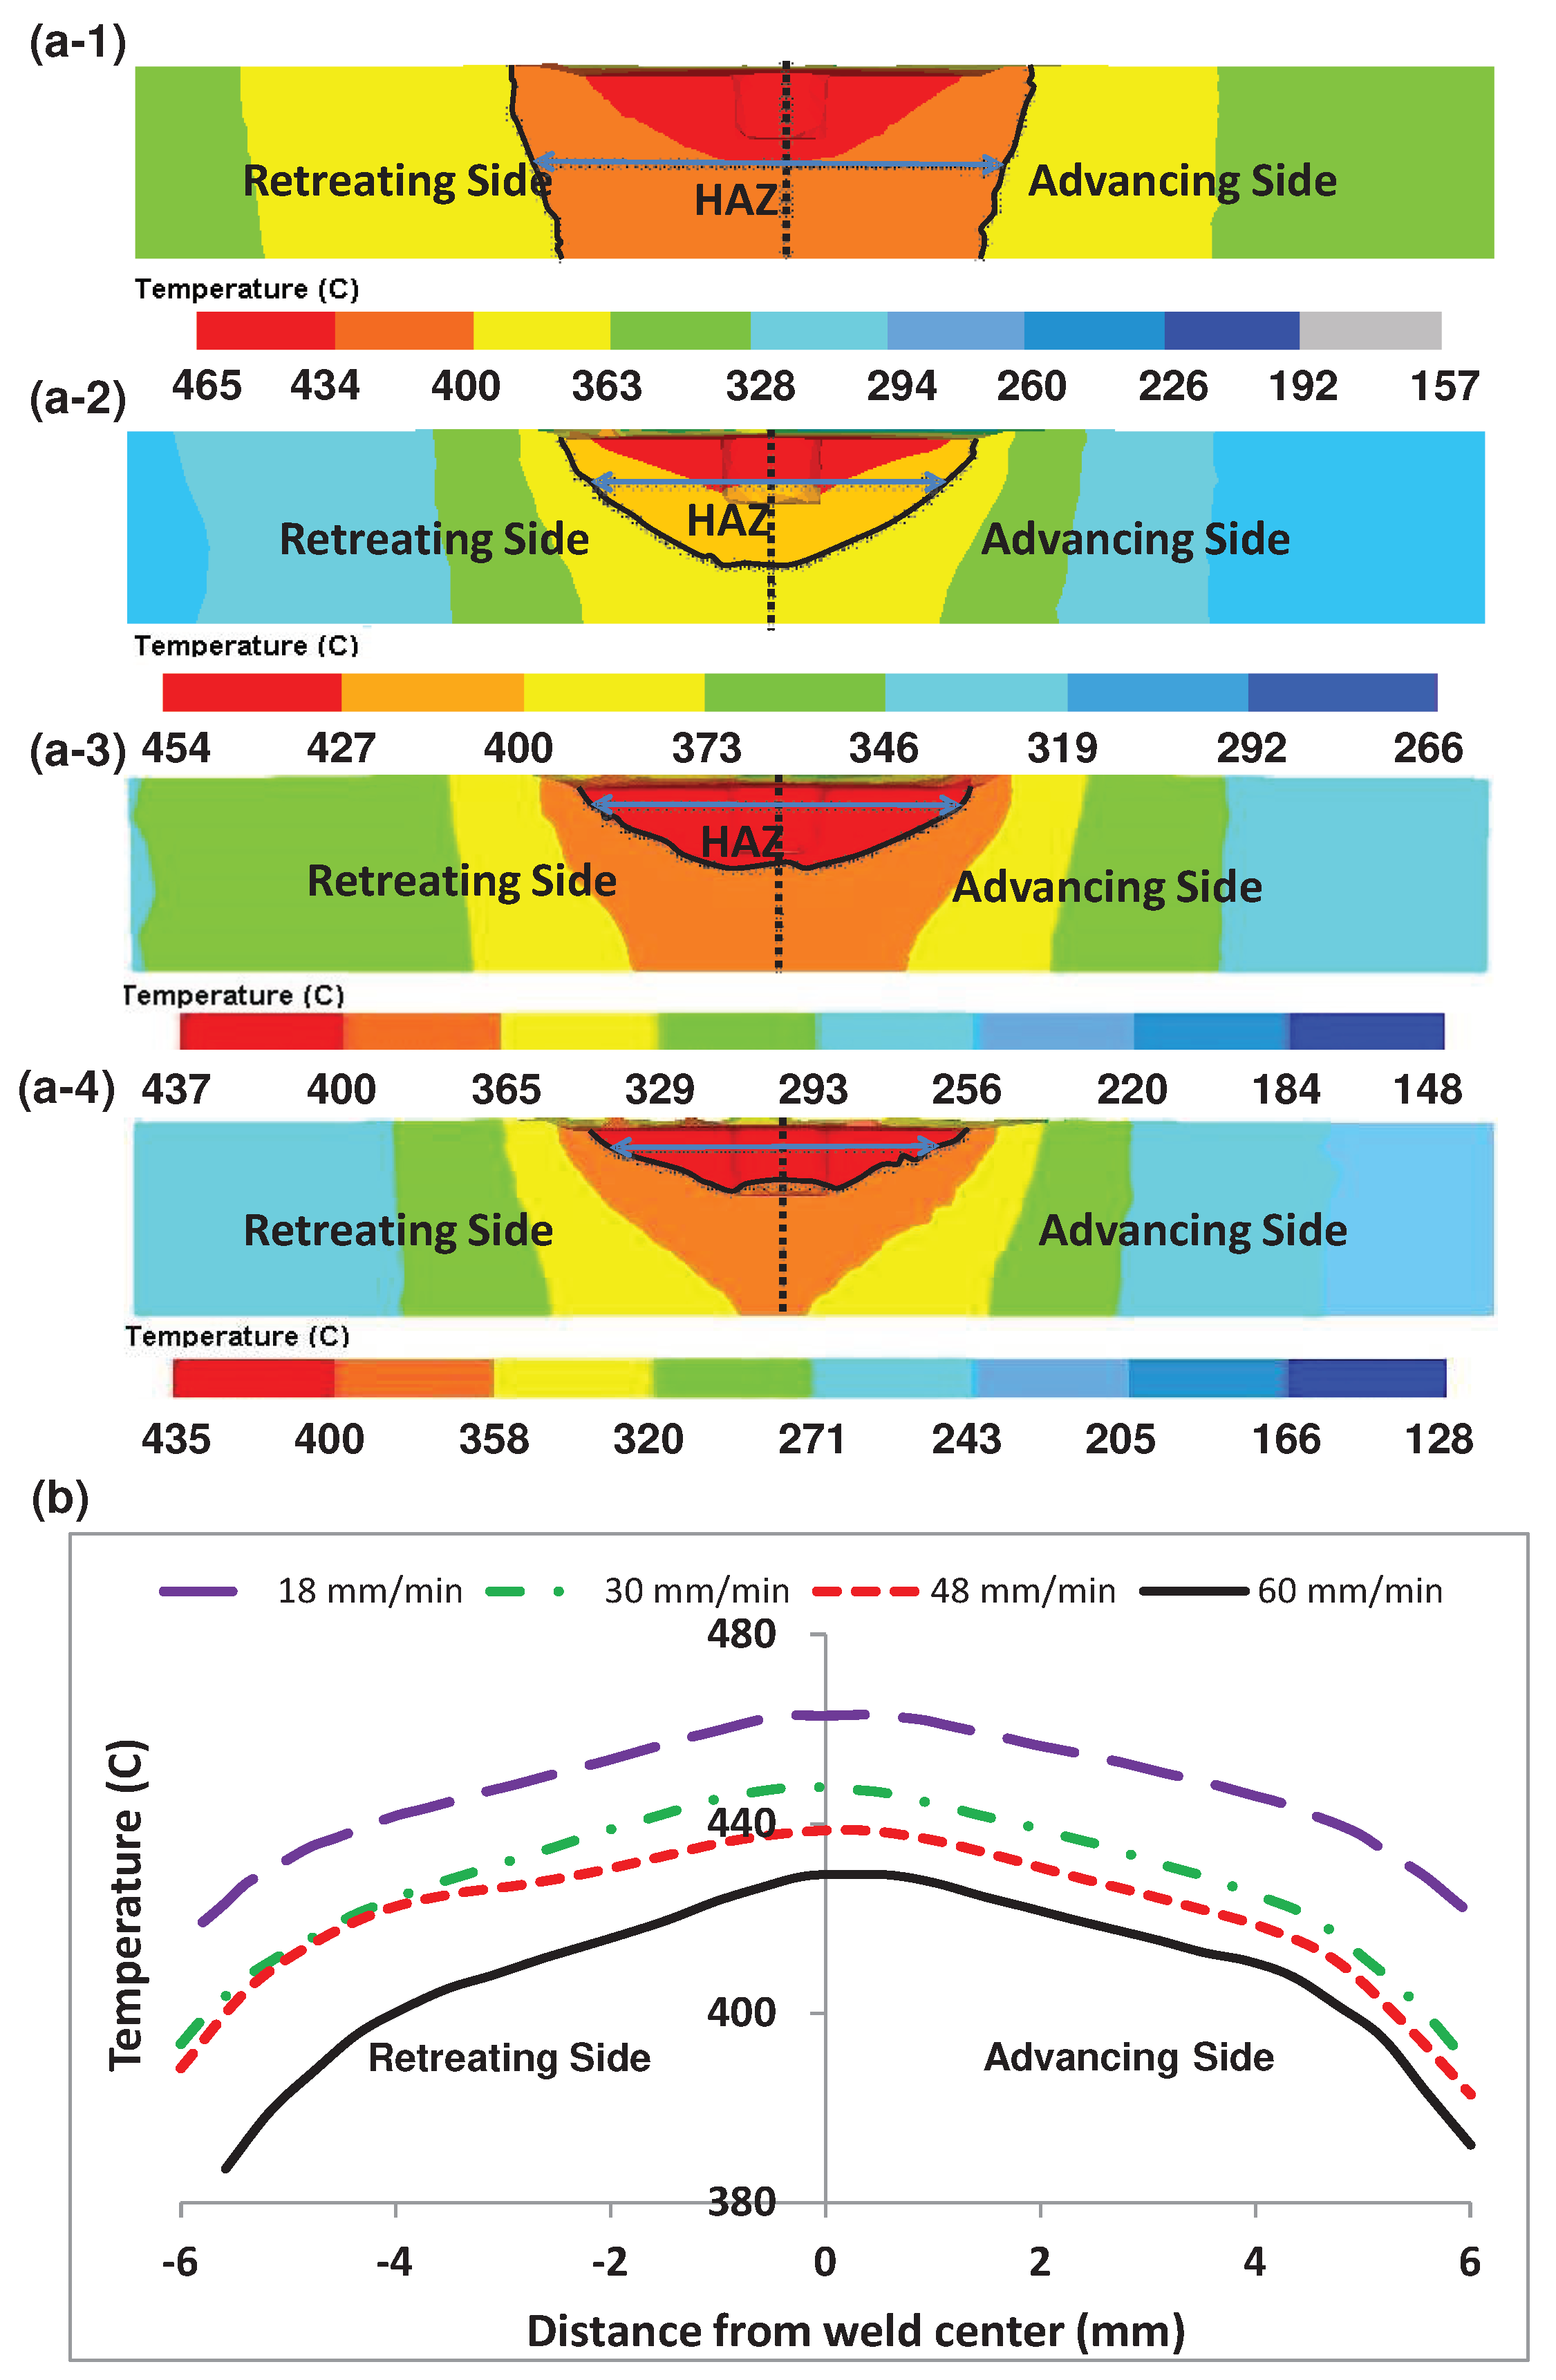
Figure 21.
Temperature profile experienced by the material at a) water-cooled sample, b) air-cooled sample, c) non-cooled sample [156].
Figure 21.
Temperature profile experienced by the material at a) water-cooled sample, b) air-cooled sample, c) non-cooled sample [156].
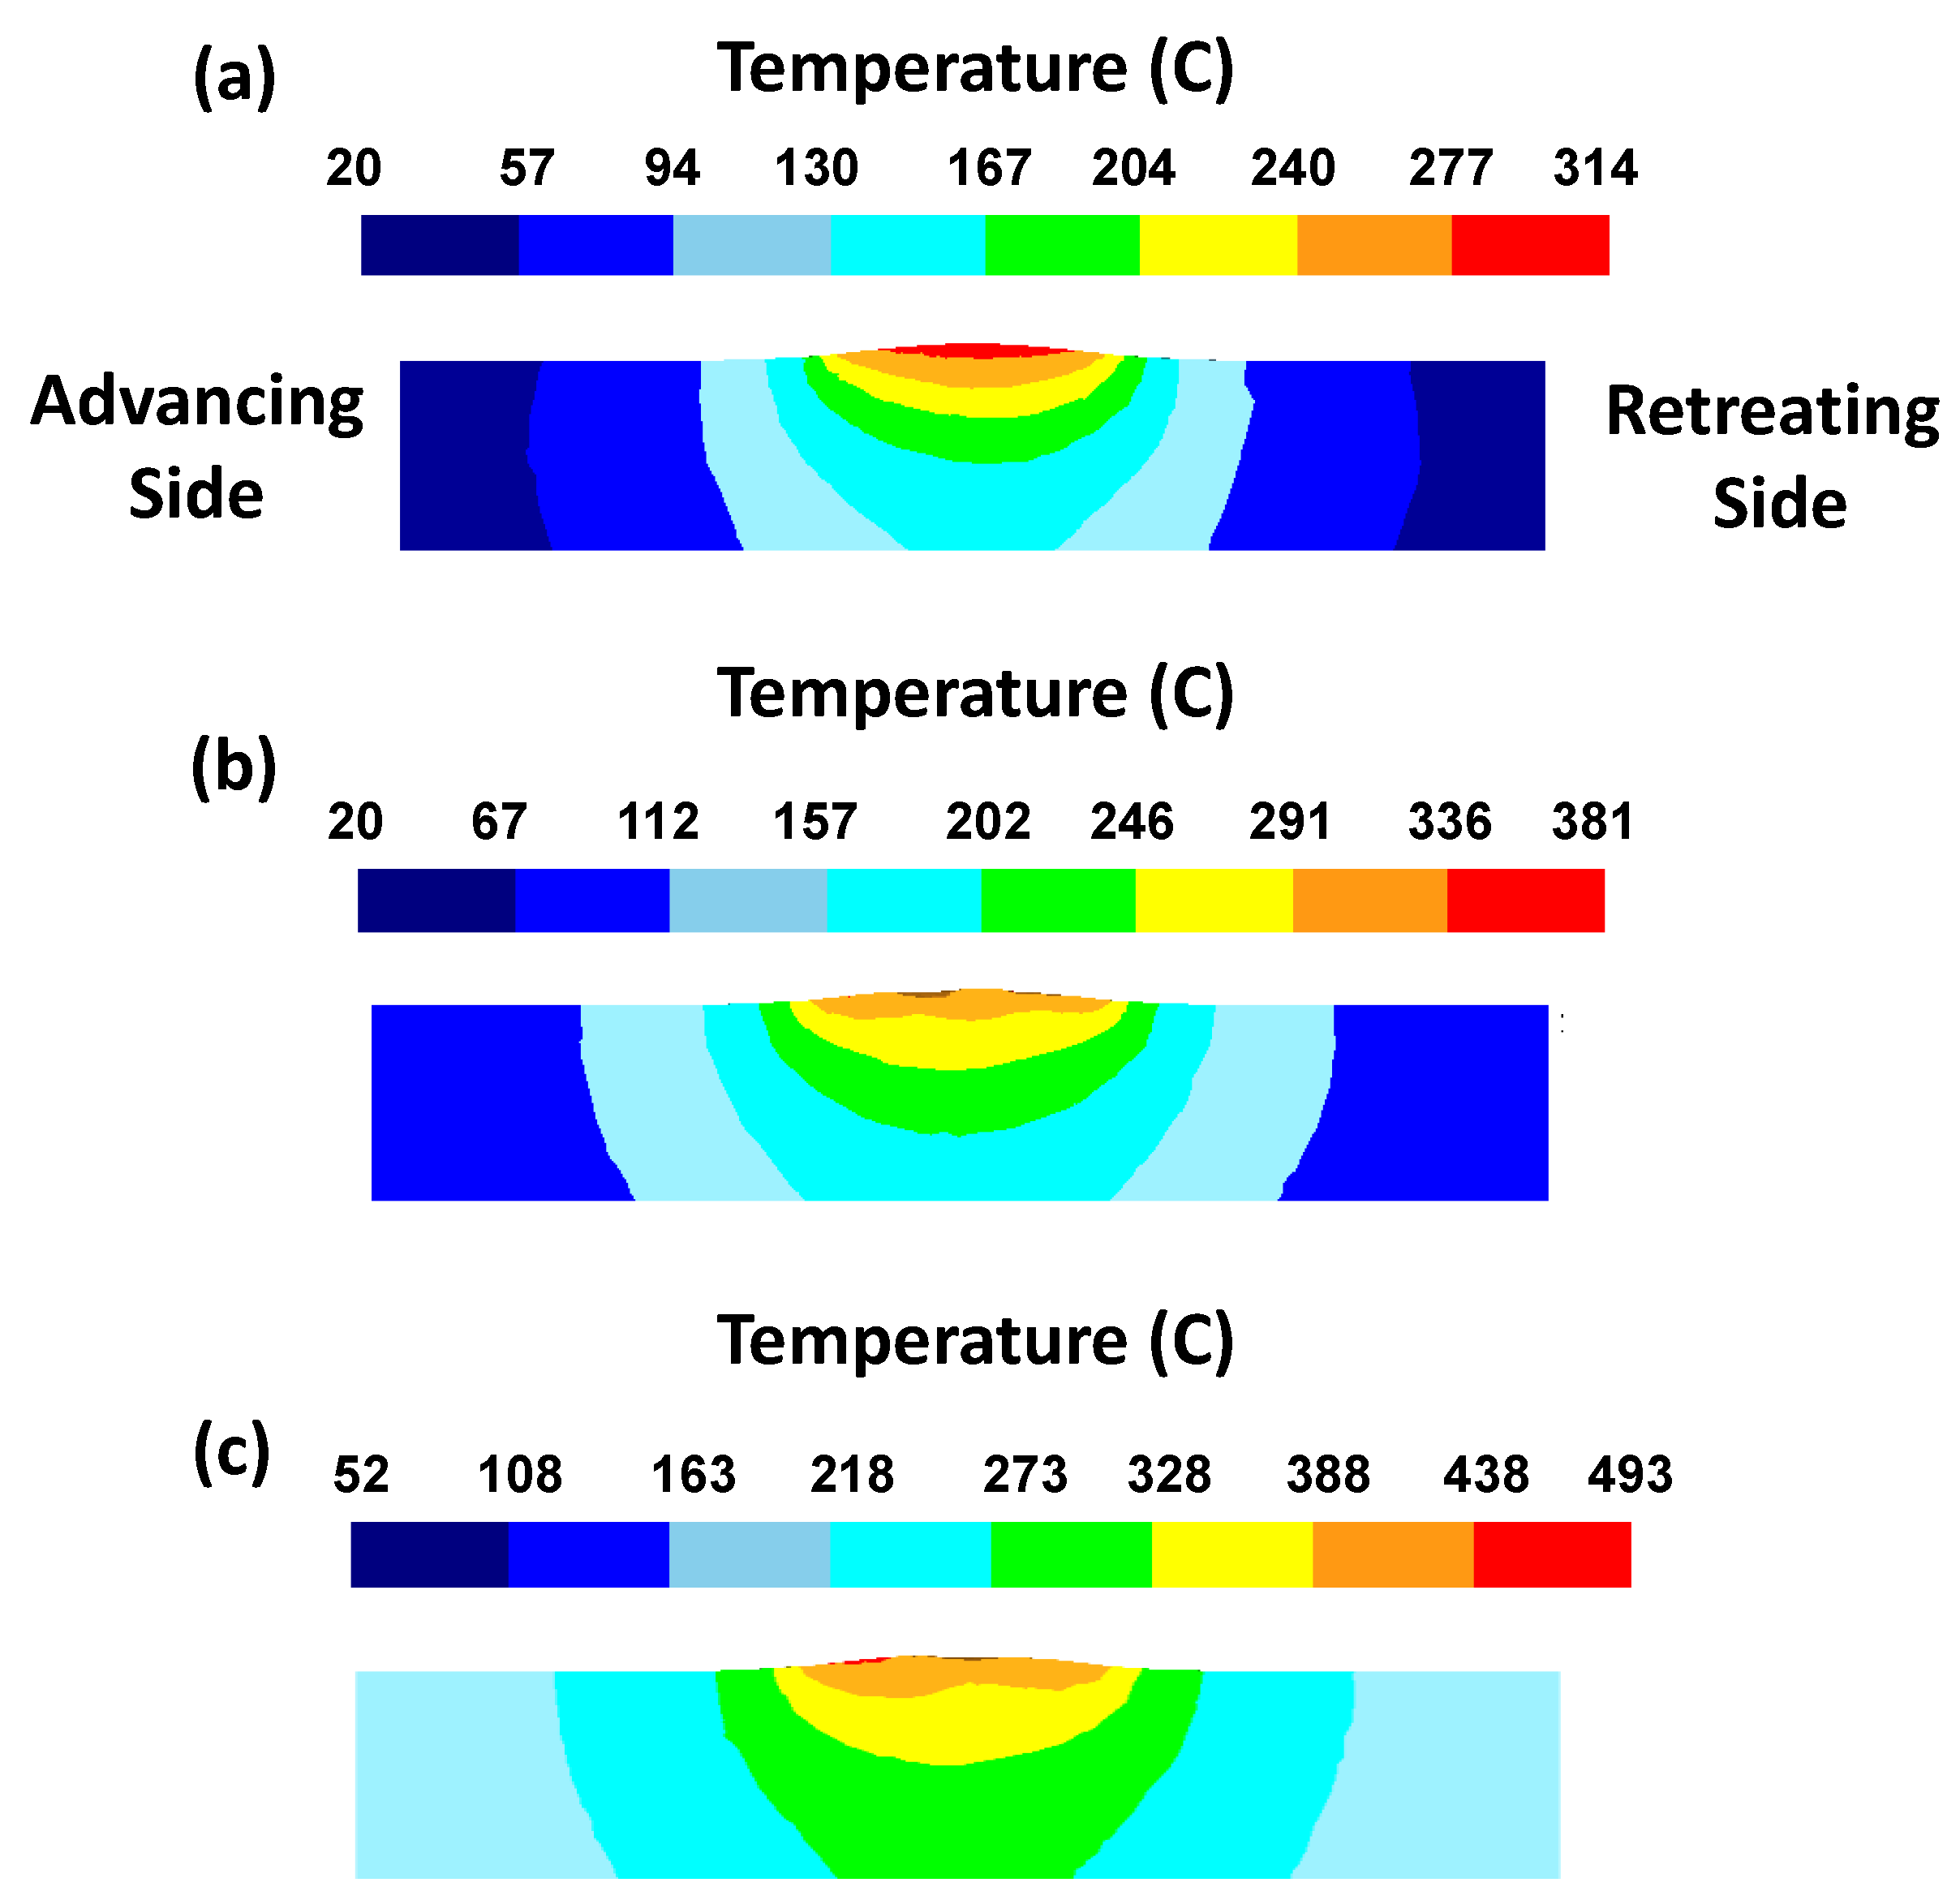
Figure 22.
Temperature distribution on the top surface [156].
Figure 22.
Temperature distribution on the top surface [156].
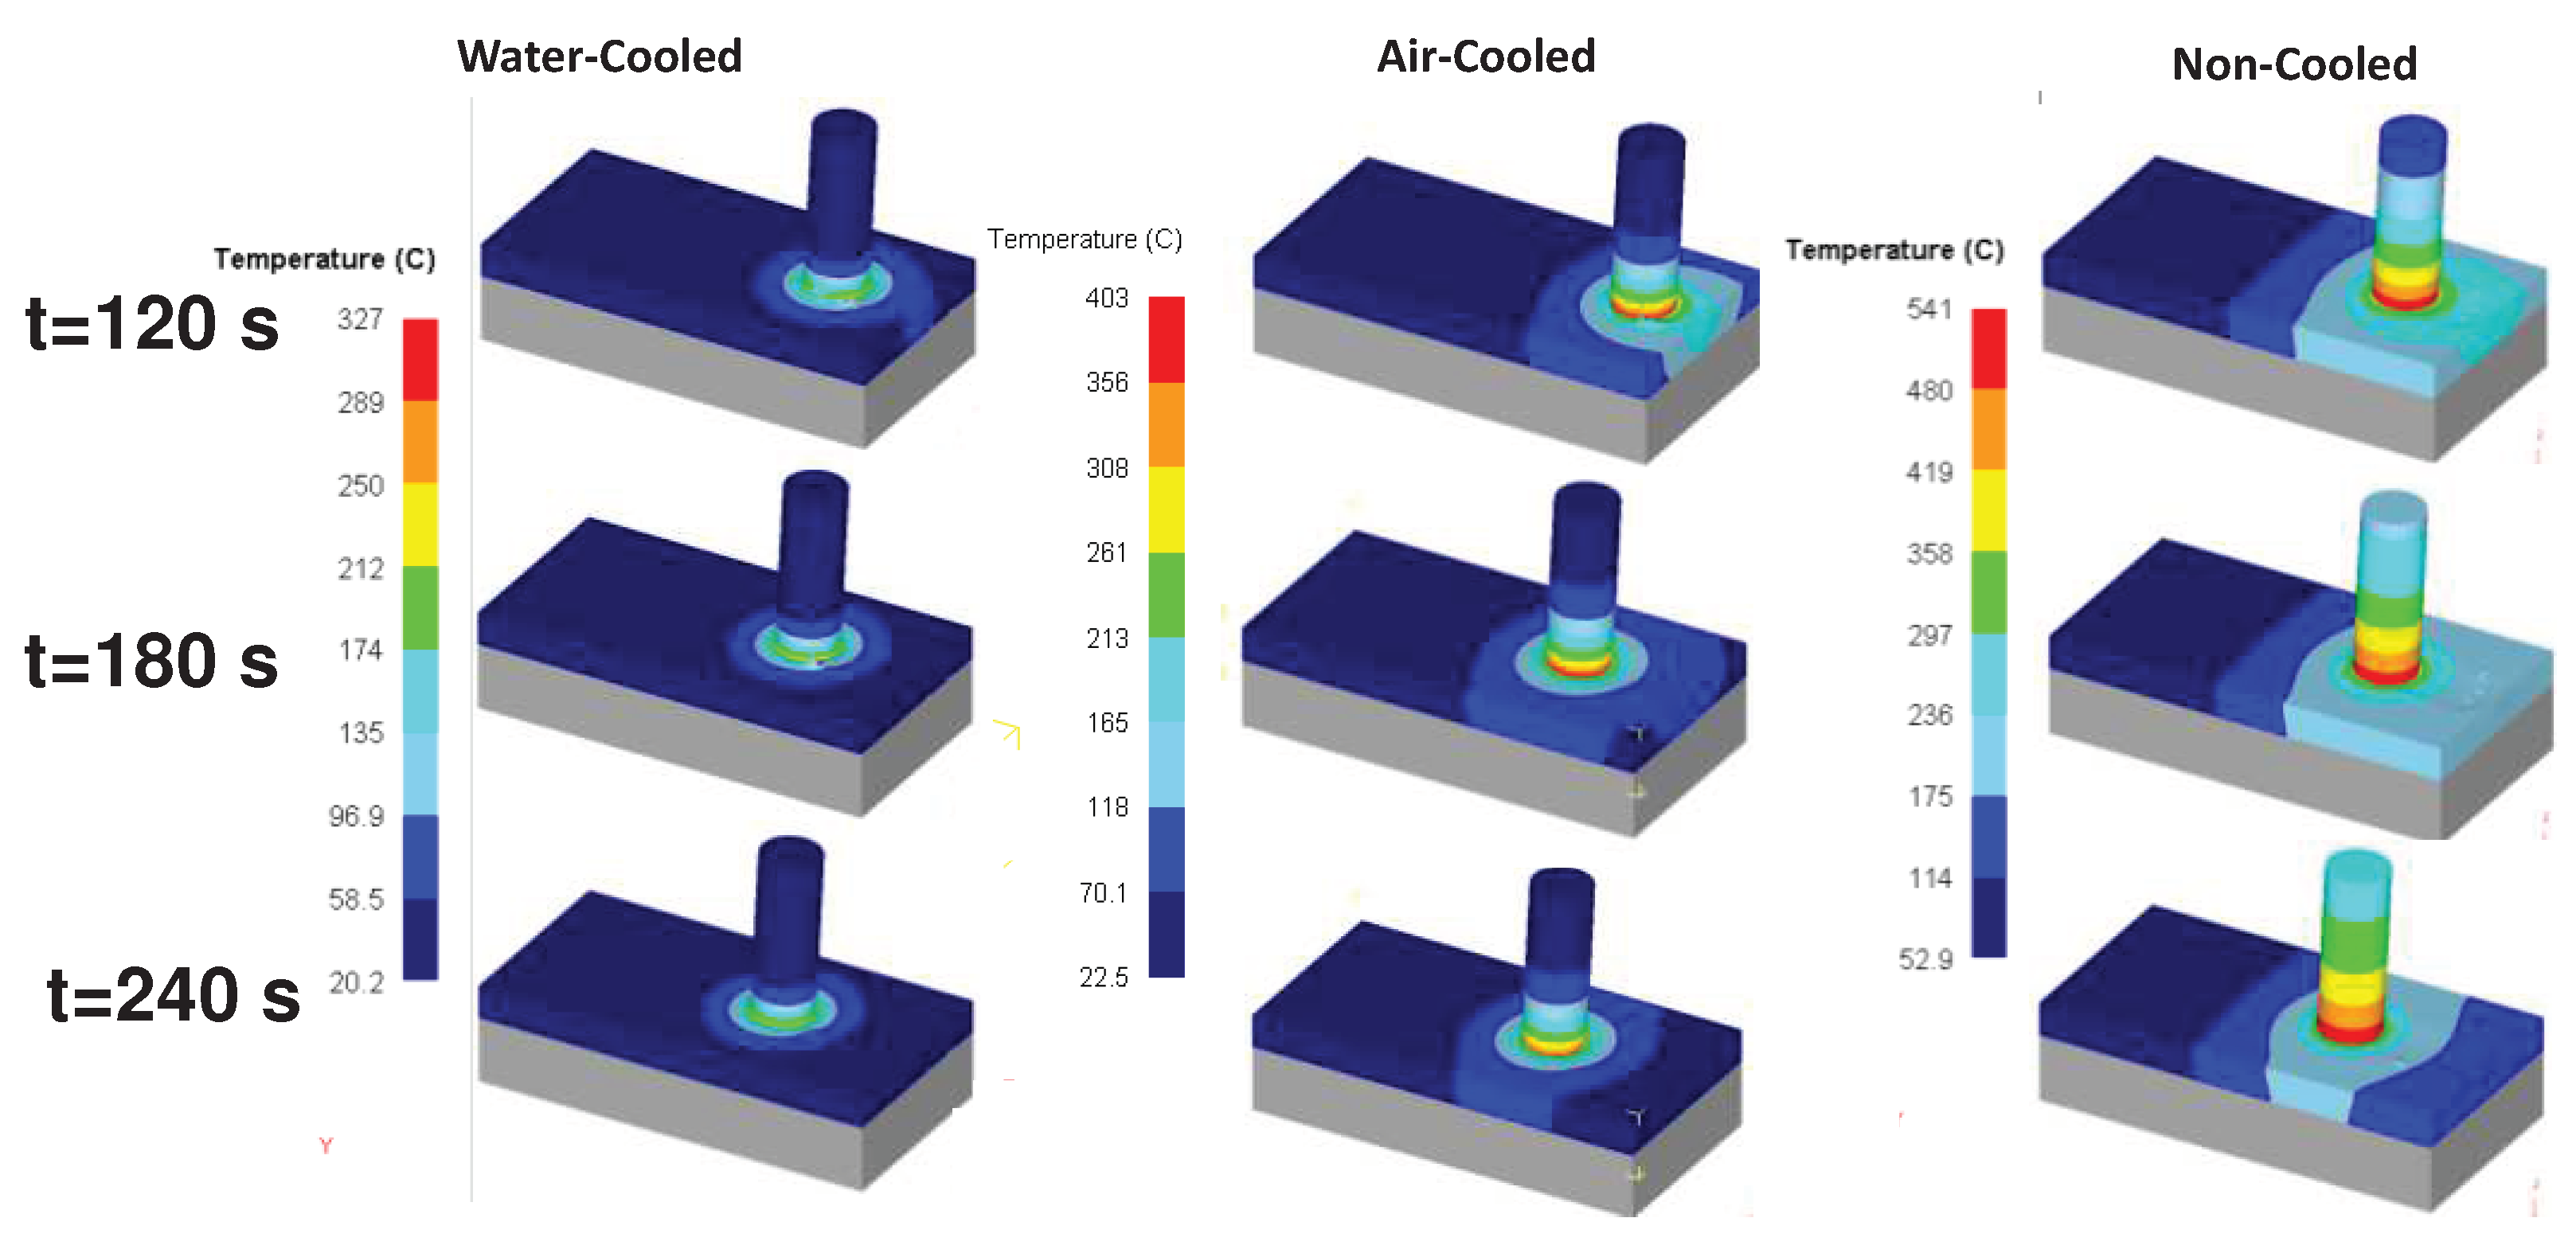
Figure 23.
Effective strain distributions along cross-section in FSP joint as a function [50].
Figure 23.
Effective strain distributions along cross-section in FSP joint as a function [50].
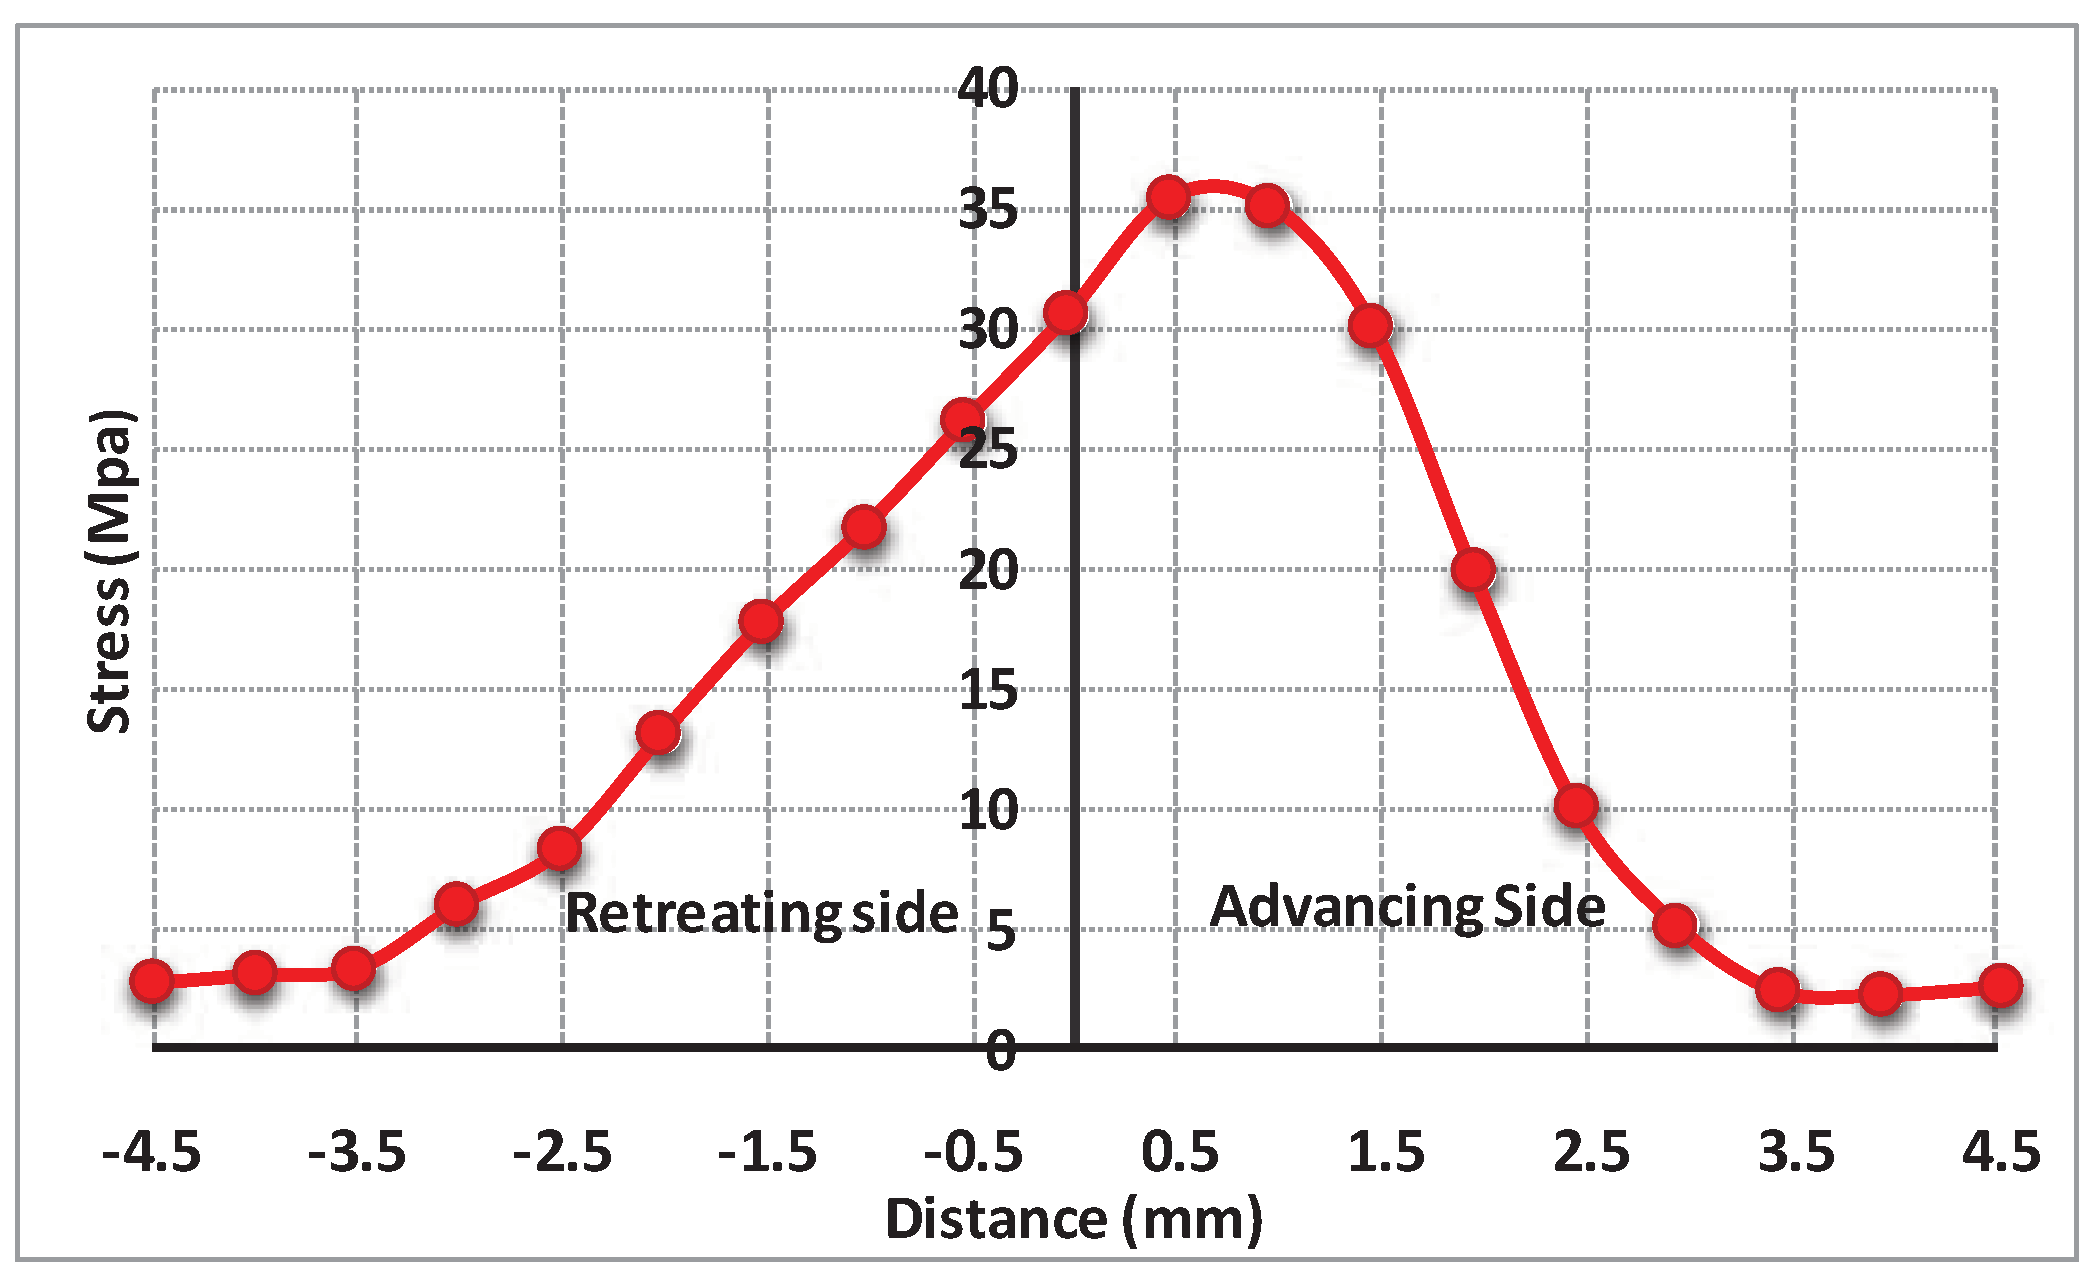
Figure 24.
Strain distribution at the cross-section of FSPEd samples [50].
Figure 24.
Strain distribution at the cross-section of FSPEd samples [50].
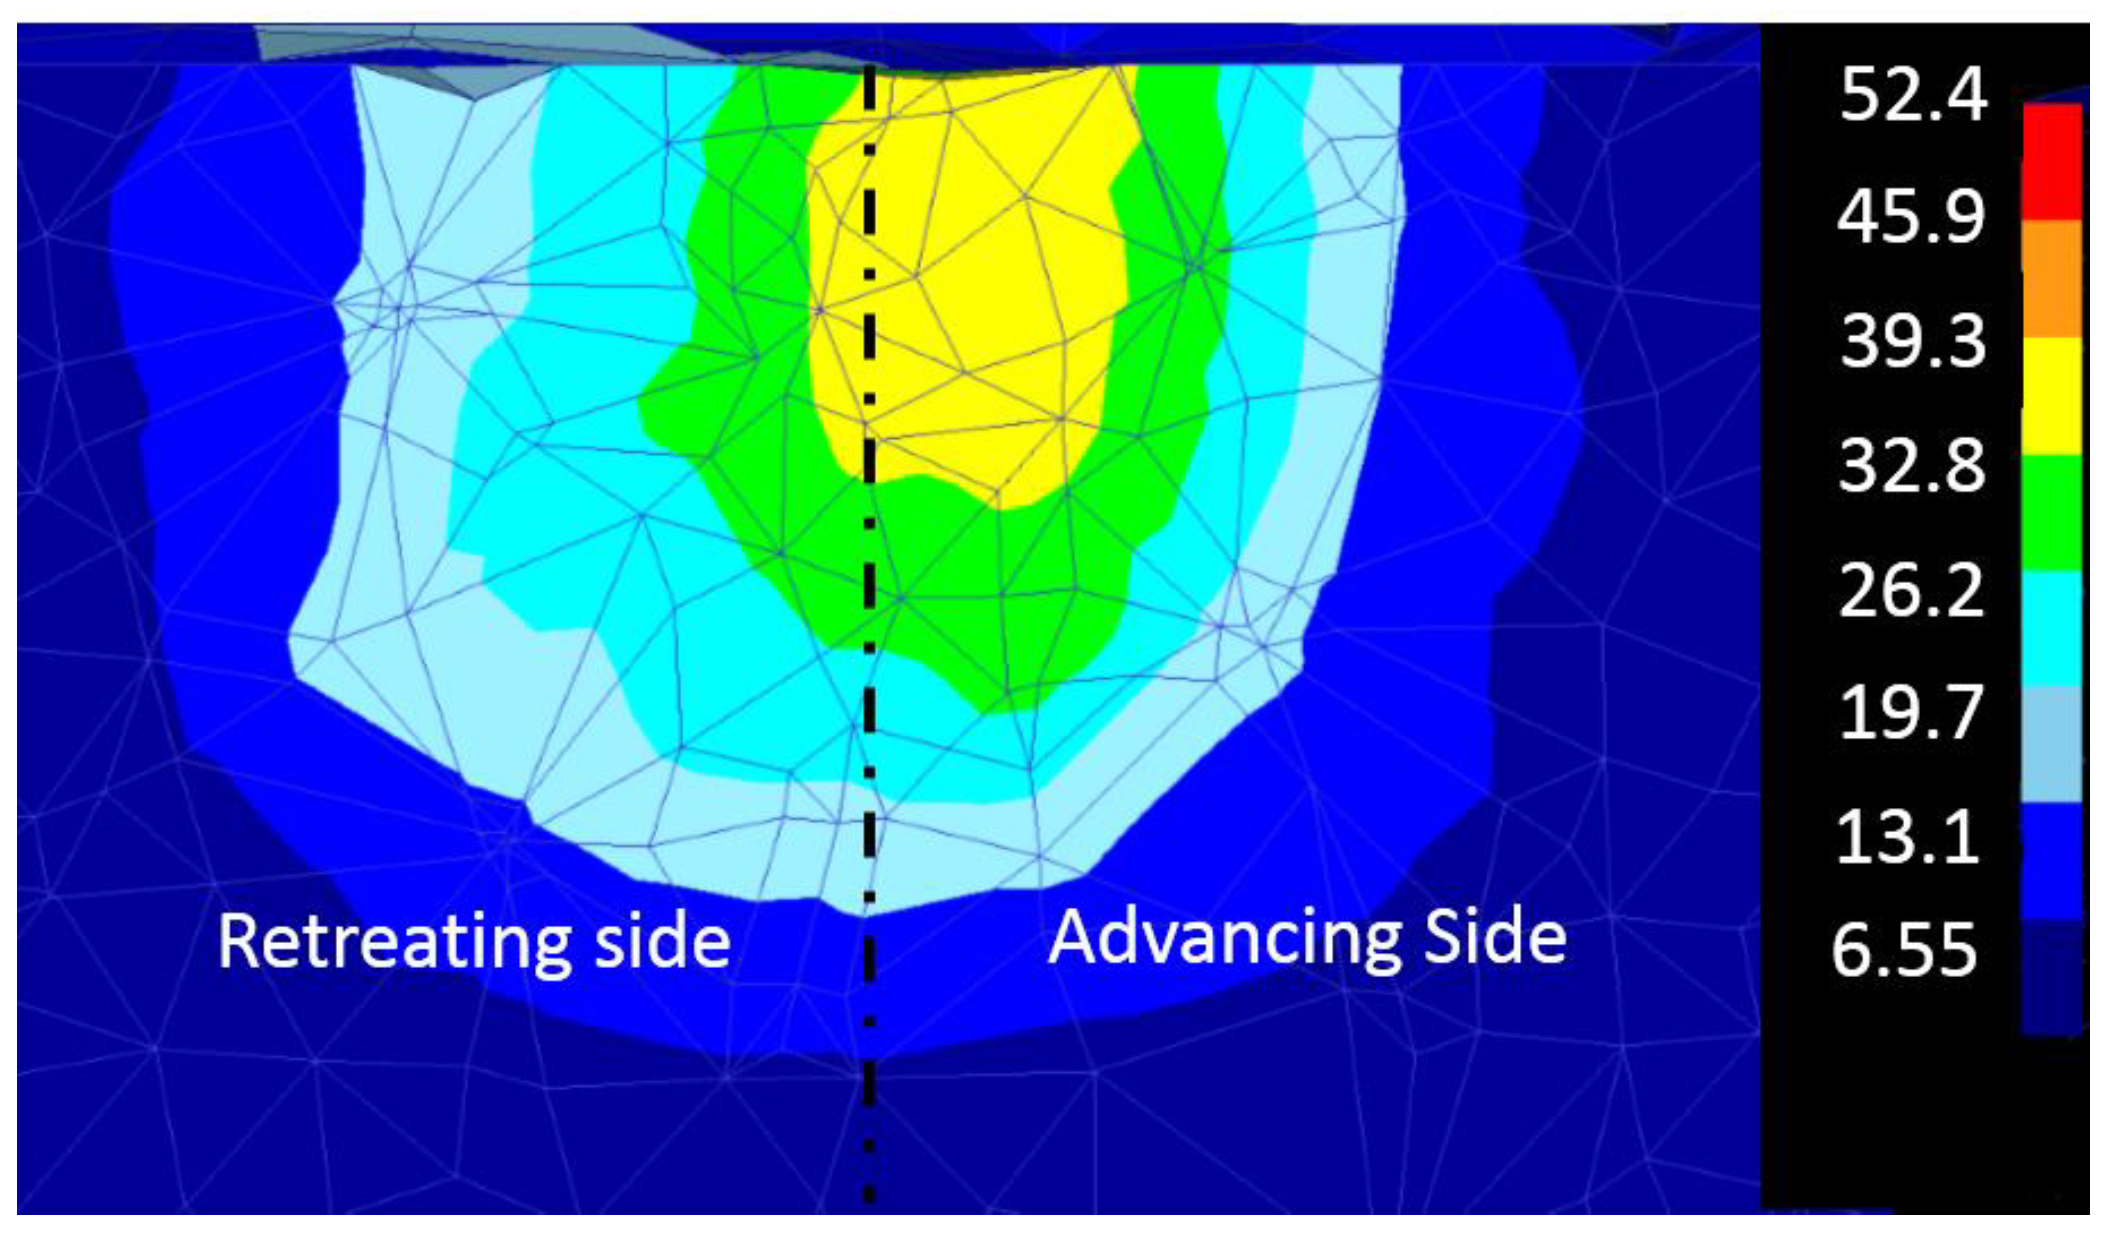
Figure 25.
The strain distribution in (a) top view and (b) cross-section of FSPed sample [125]. (c) Cross-section macro-image from FSPed AZ91 magnesium alloy [157].
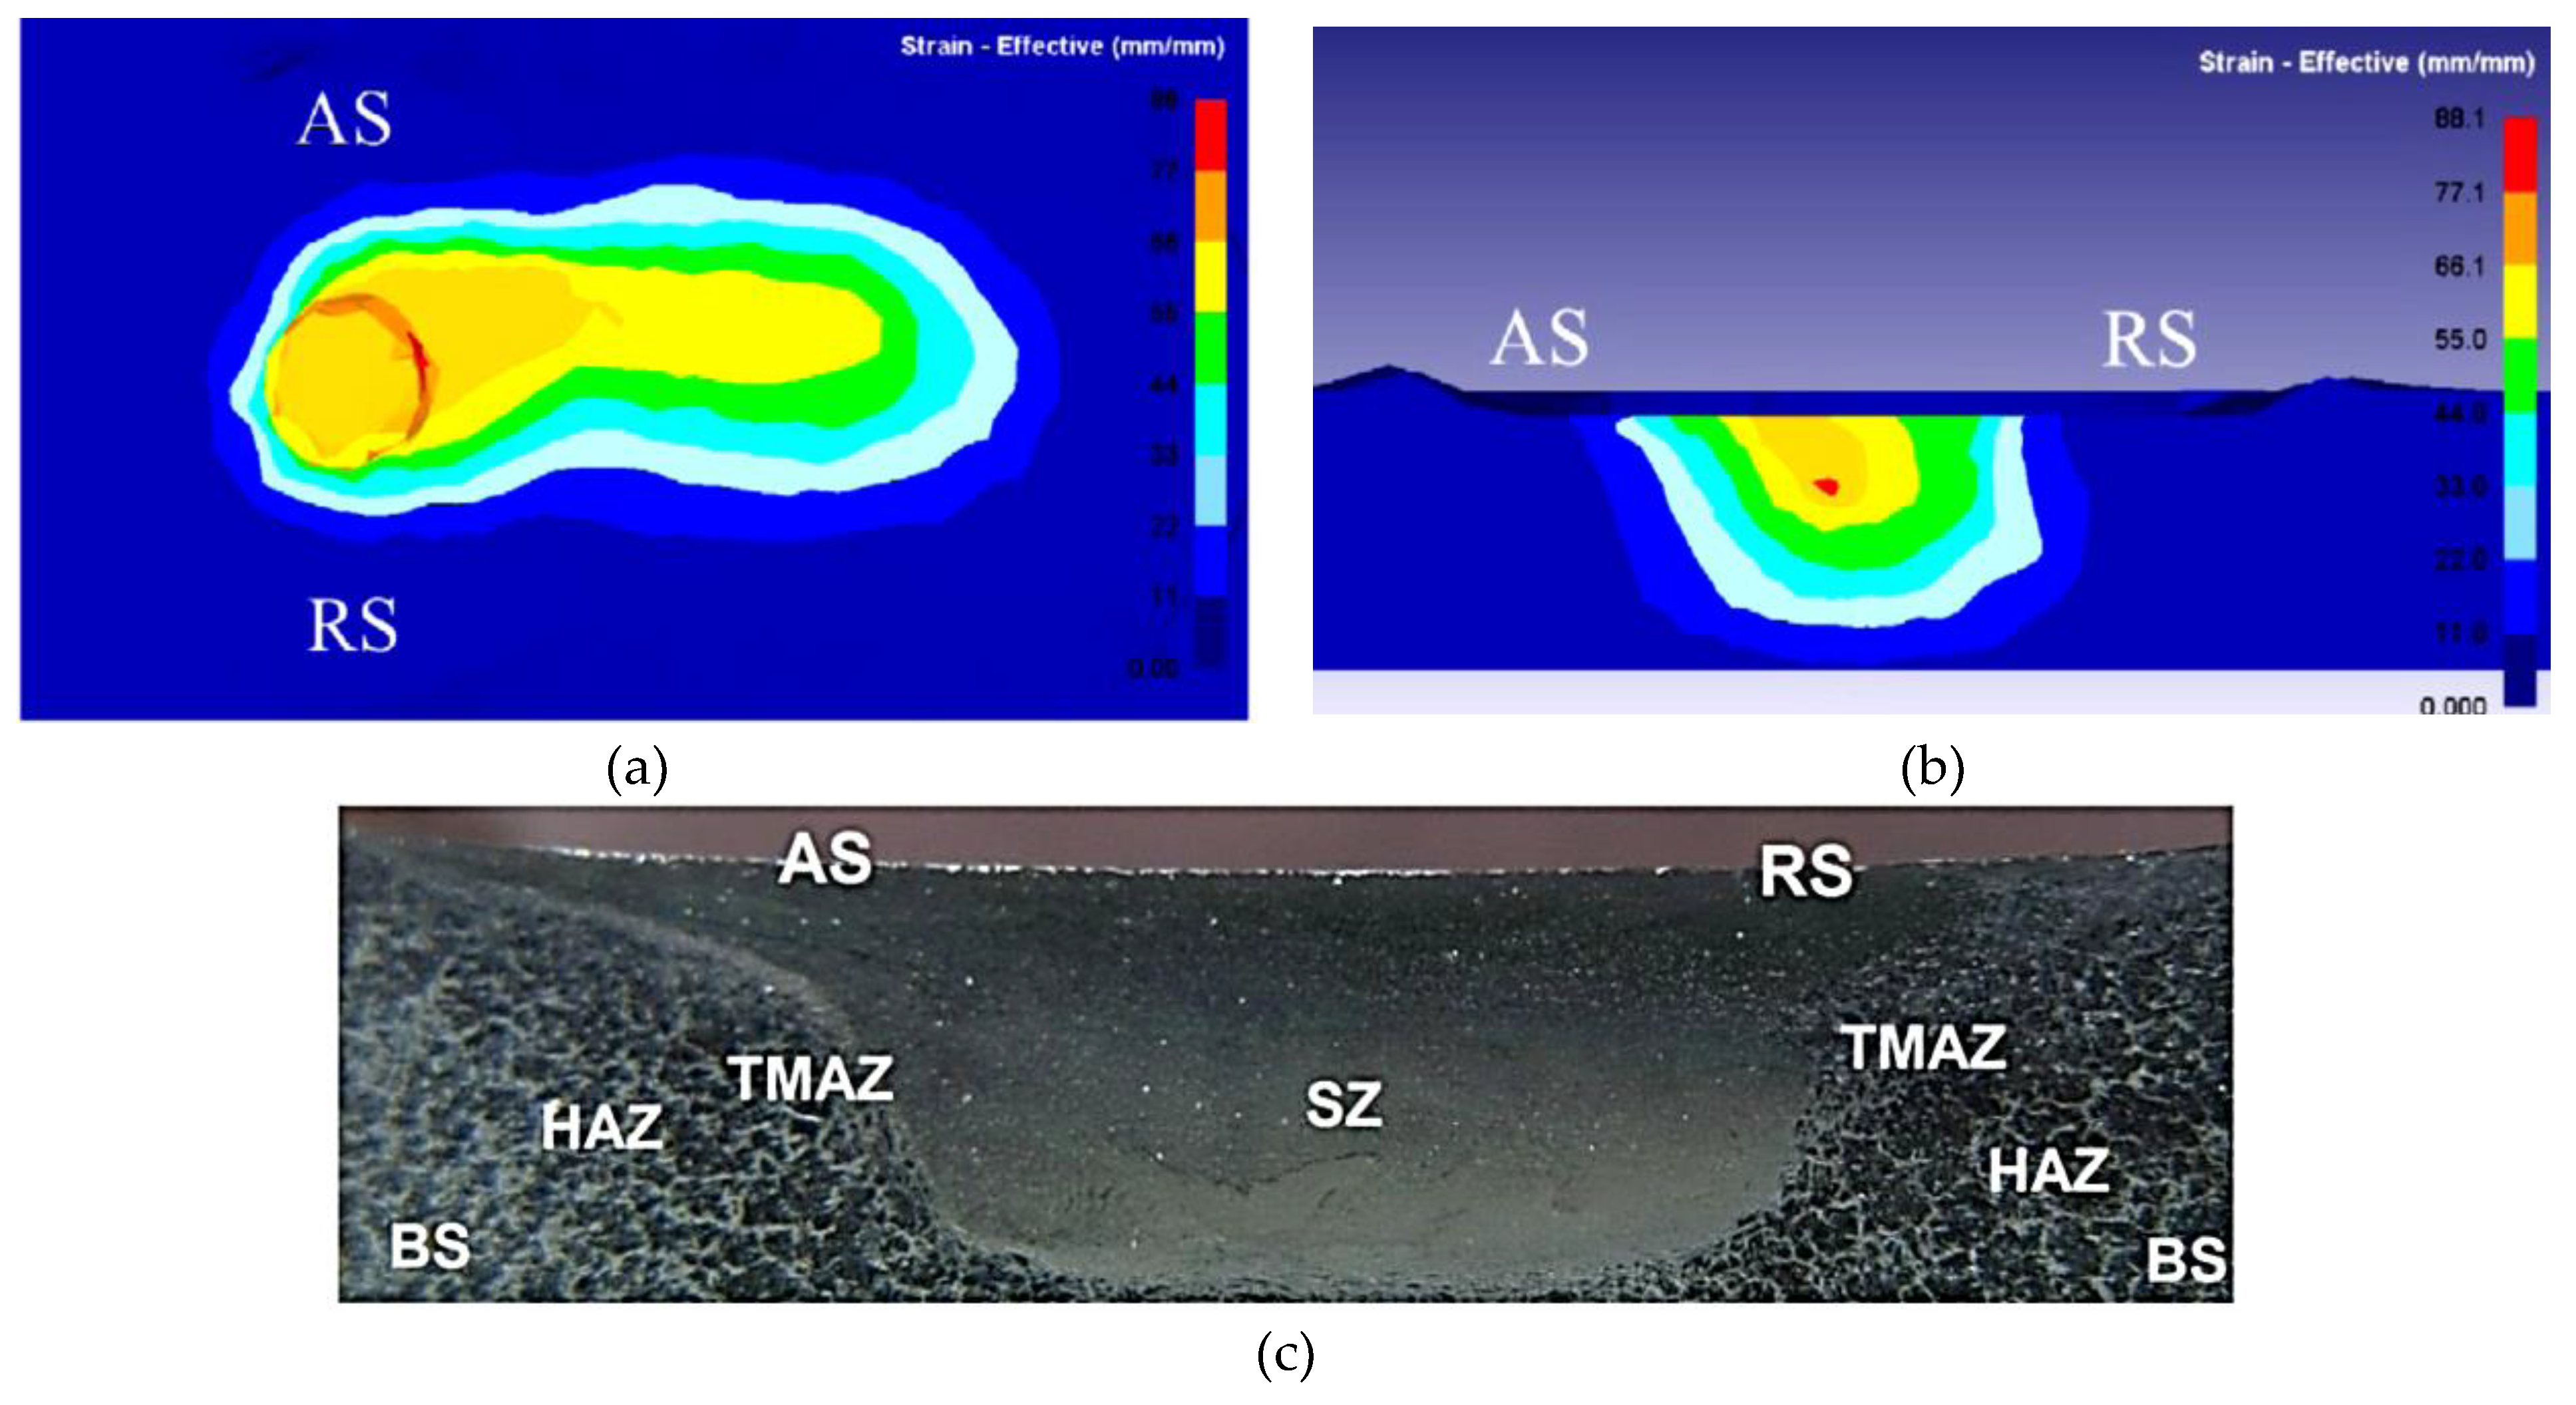
Figure 26.
Strain profiles in the transverse section of the weld produced by different tool pin diameters and for shoulder diameters of (a) 9 mm and (b) 12 mm [117].
Figure 26.
Strain profiles in the transverse section of the weld produced by different tool pin diameters and for shoulder diameters of (a) 9 mm and (b) 12 mm [117].
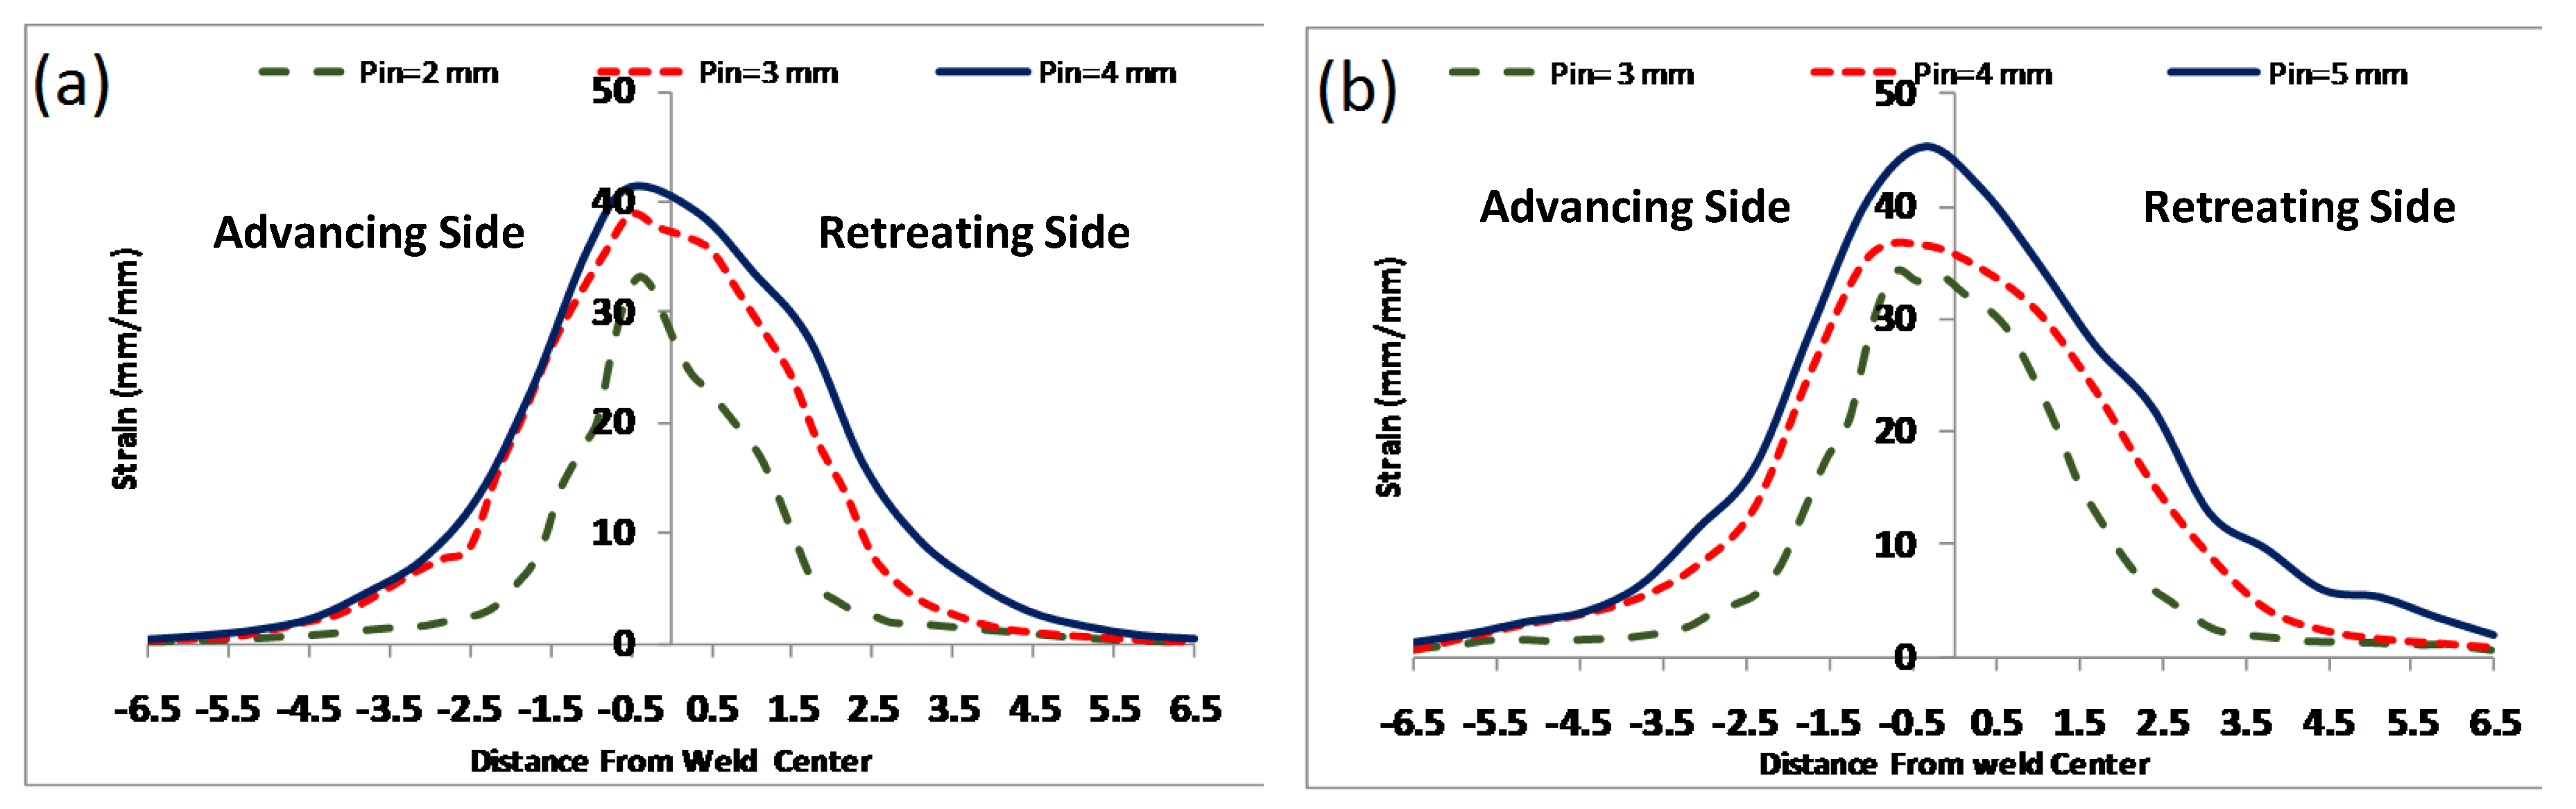
Figure 27.
Effect of tool rotational speed on strain rate [158].
Figure 27.
Effect of tool rotational speed on strain rate [158].
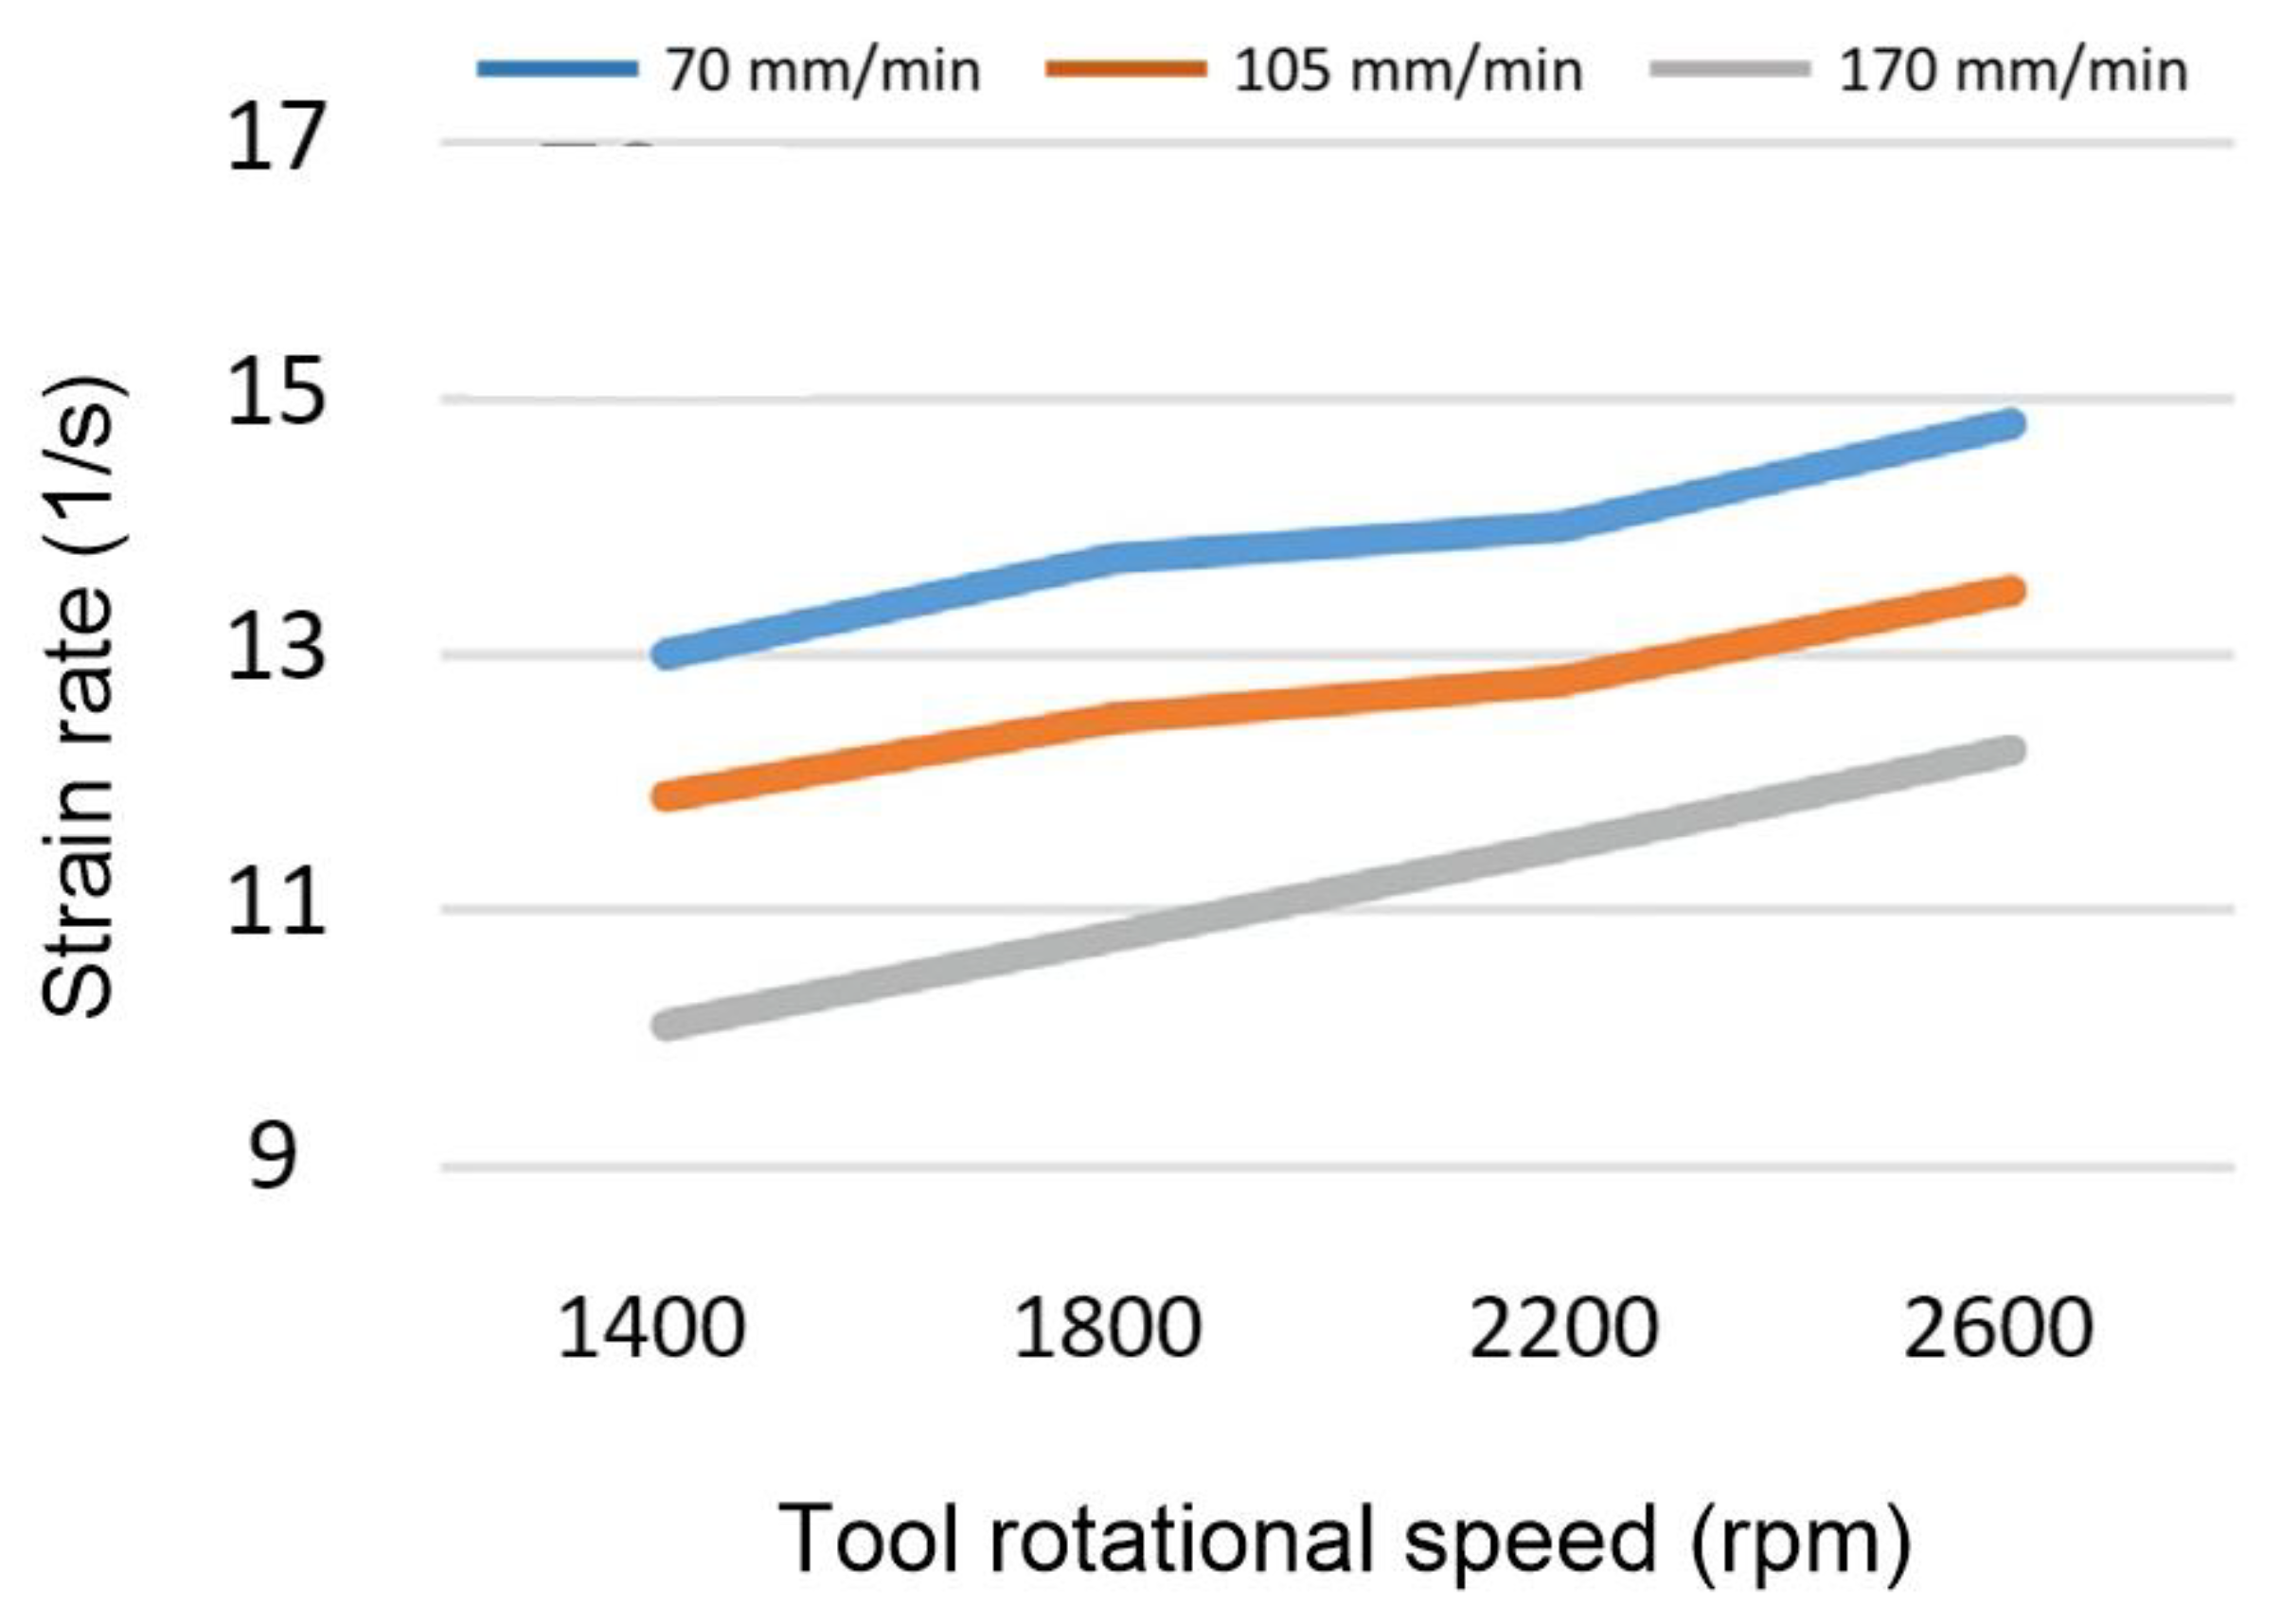
Figure 28.
strain distribution in the cross-section of the workpiece fabricated with (a) FSW tool, (b) pinless tool, and (c) shoulderless tool [124].
Figure 28.
strain distribution in the cross-section of the workpiece fabricated with (a) FSW tool, (b) pinless tool, and (c) shoulderless tool [124].
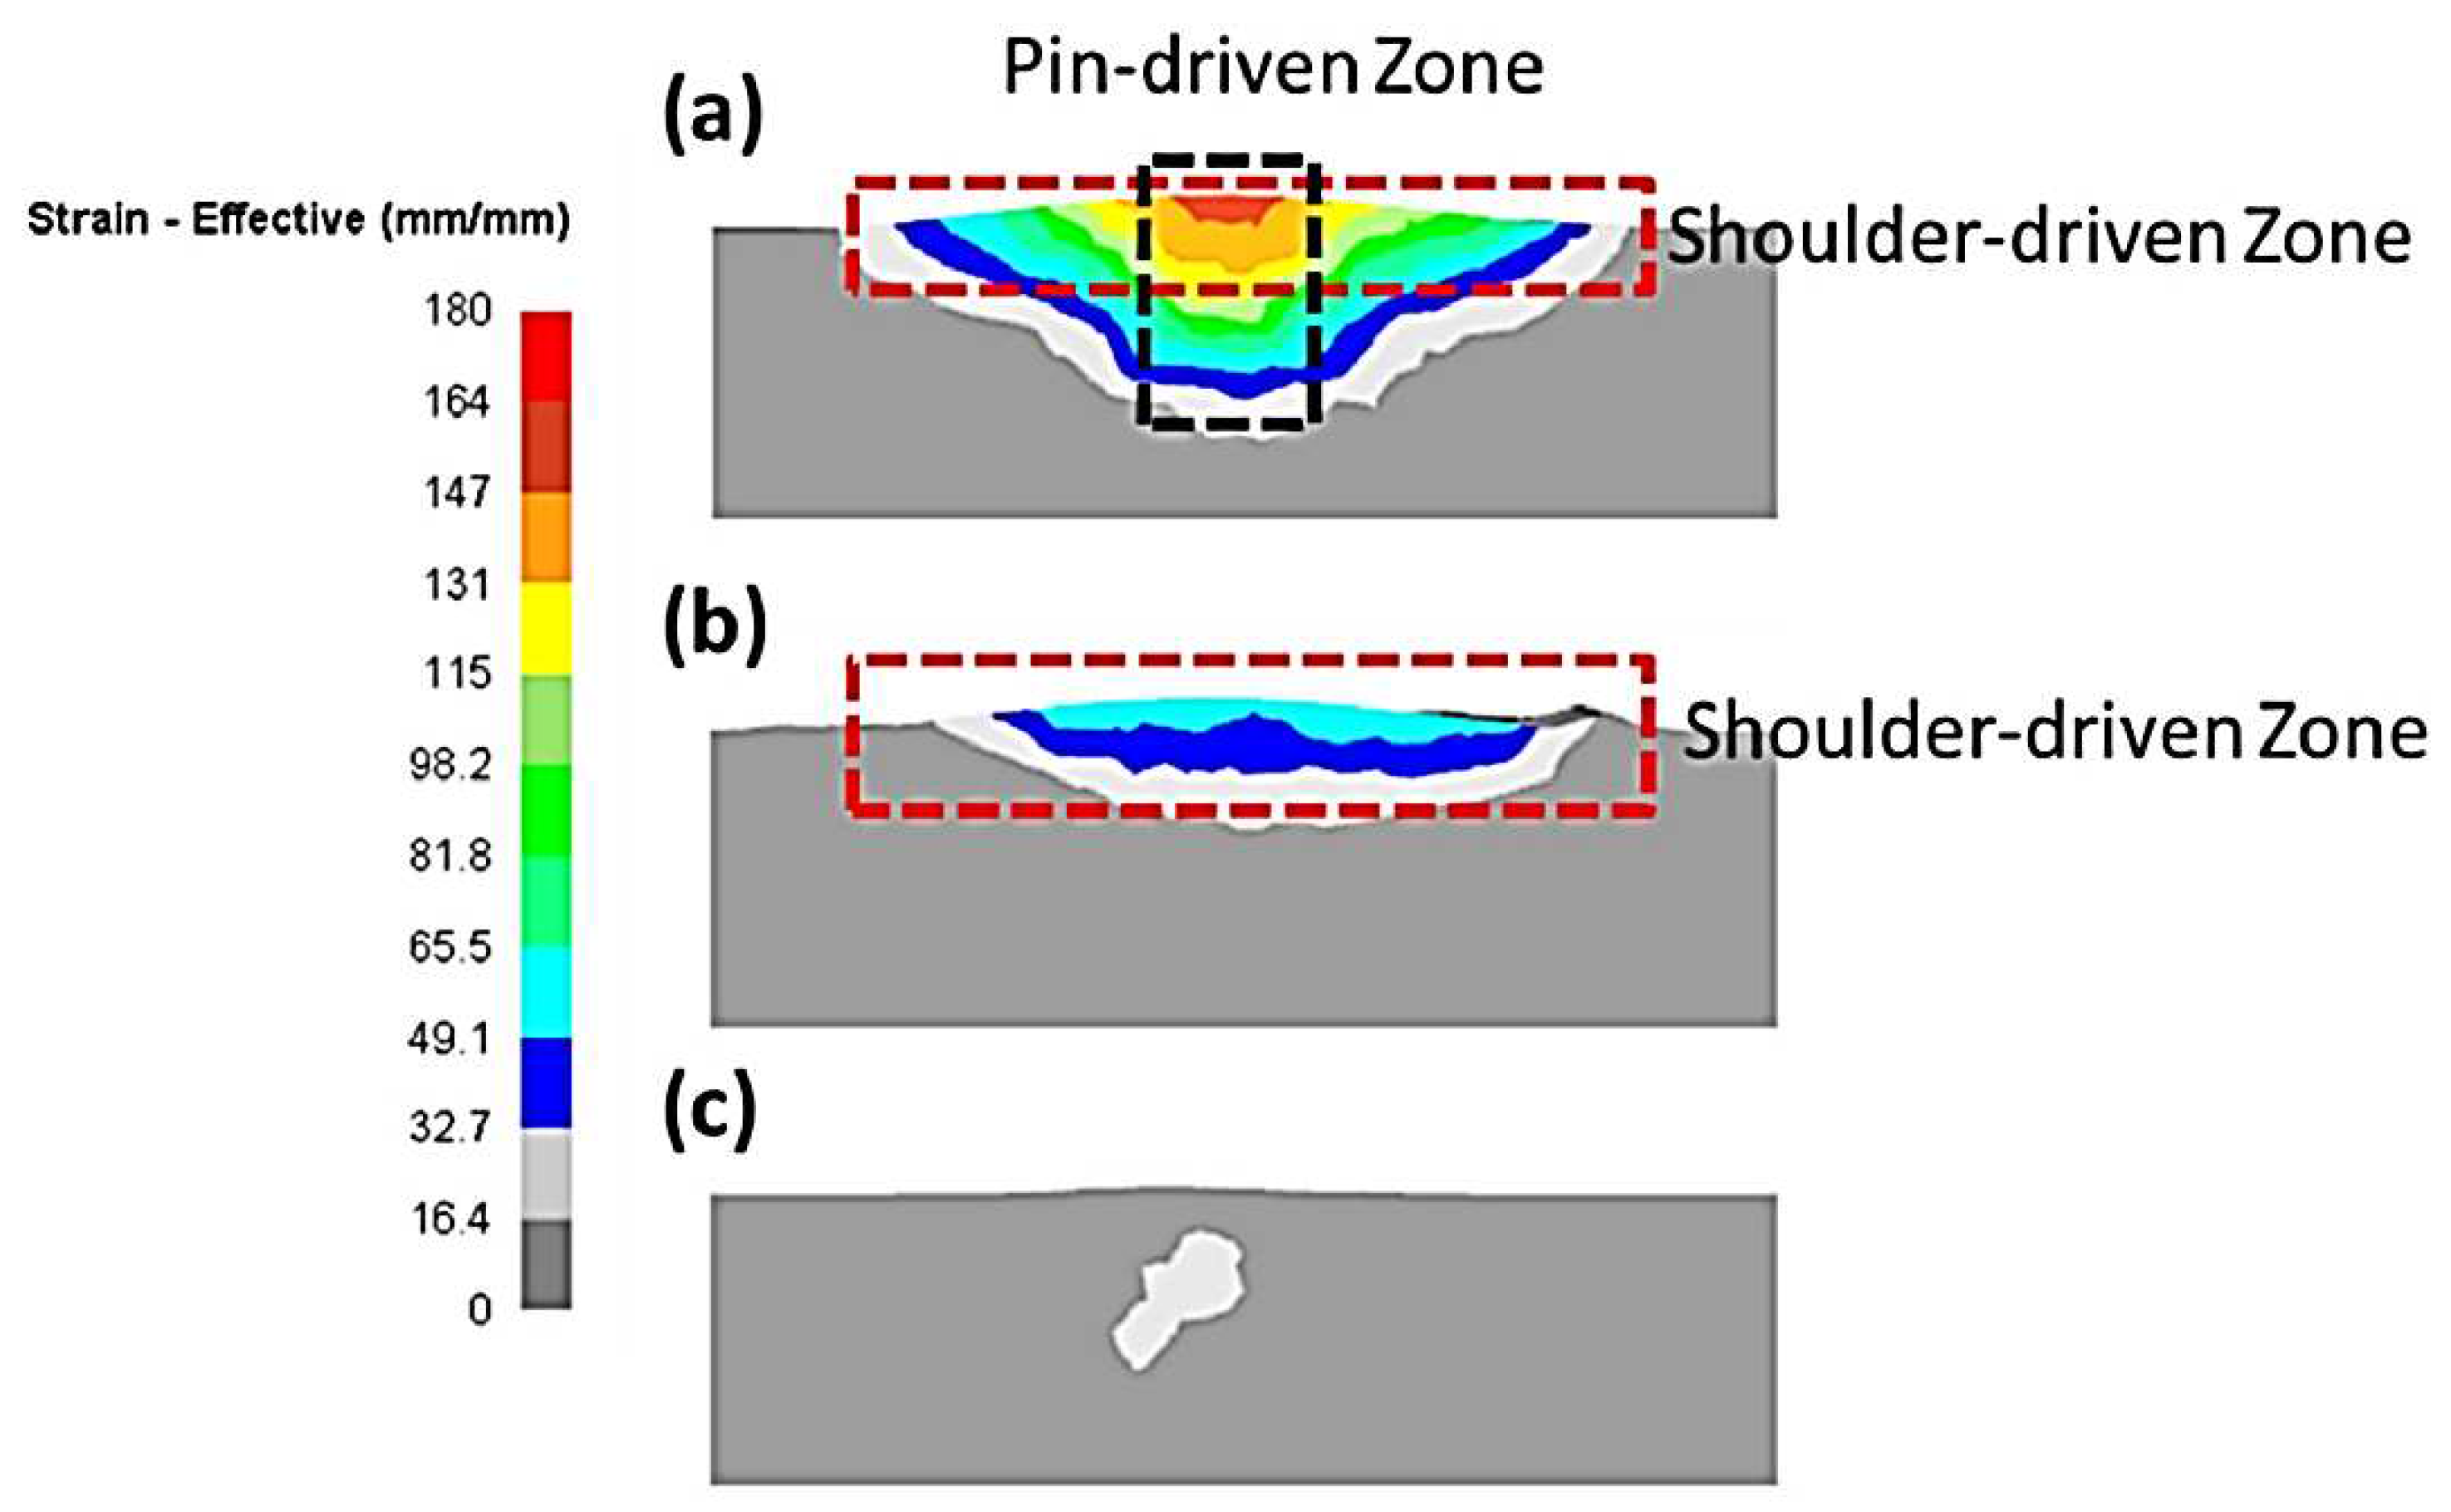
Figure 29.
(a) Longitudinal residual stresses, (b) transverse residual stresses, and (c) normal residual stresses. All residual stresses are reported in Pa [160].
Figure 29.
(a) Longitudinal residual stresses, (b) transverse residual stresses, and (c) normal residual stresses. All residual stresses are reported in Pa [160].
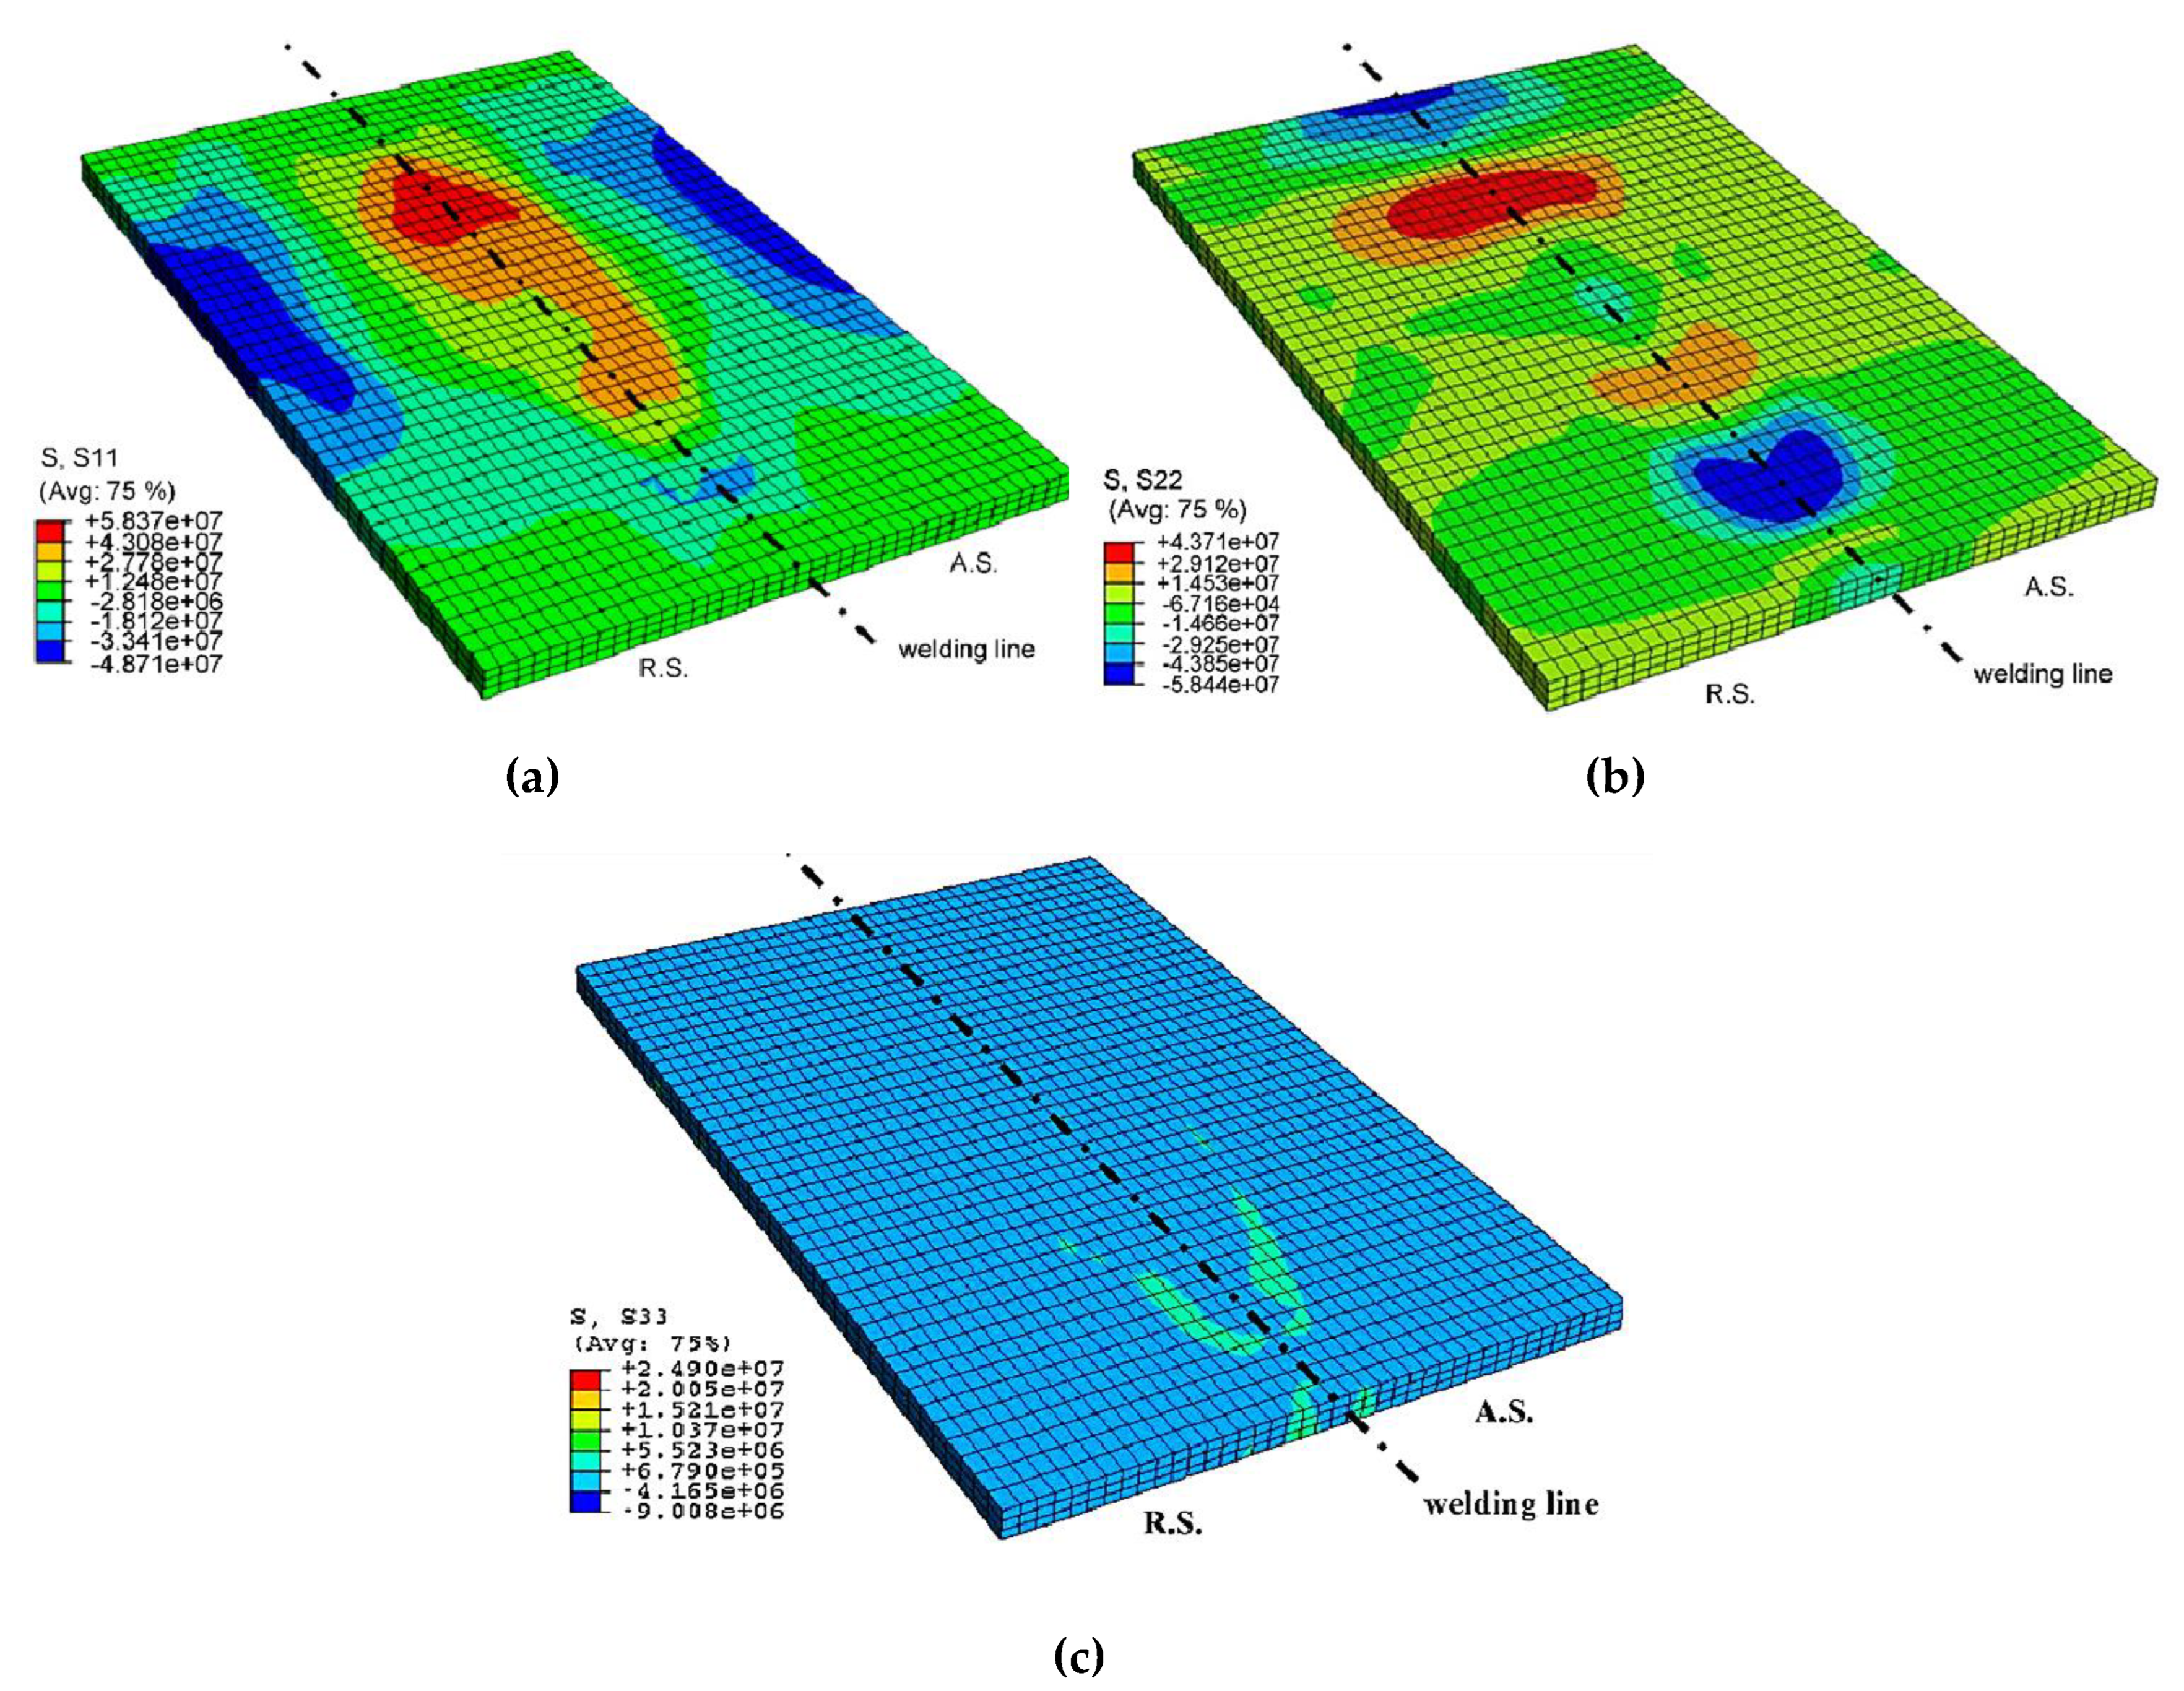
Figure 30.
Average residual stresses in the transverse section in the middle of the joint; the longitudinal stress is higher than the transversal one, while the normal stress is close to zero [161].
Figure 30.
Average residual stresses in the transverse section in the middle of the joint; the longitudinal stress is higher than the transversal one, while the normal stress is close to zero [161].
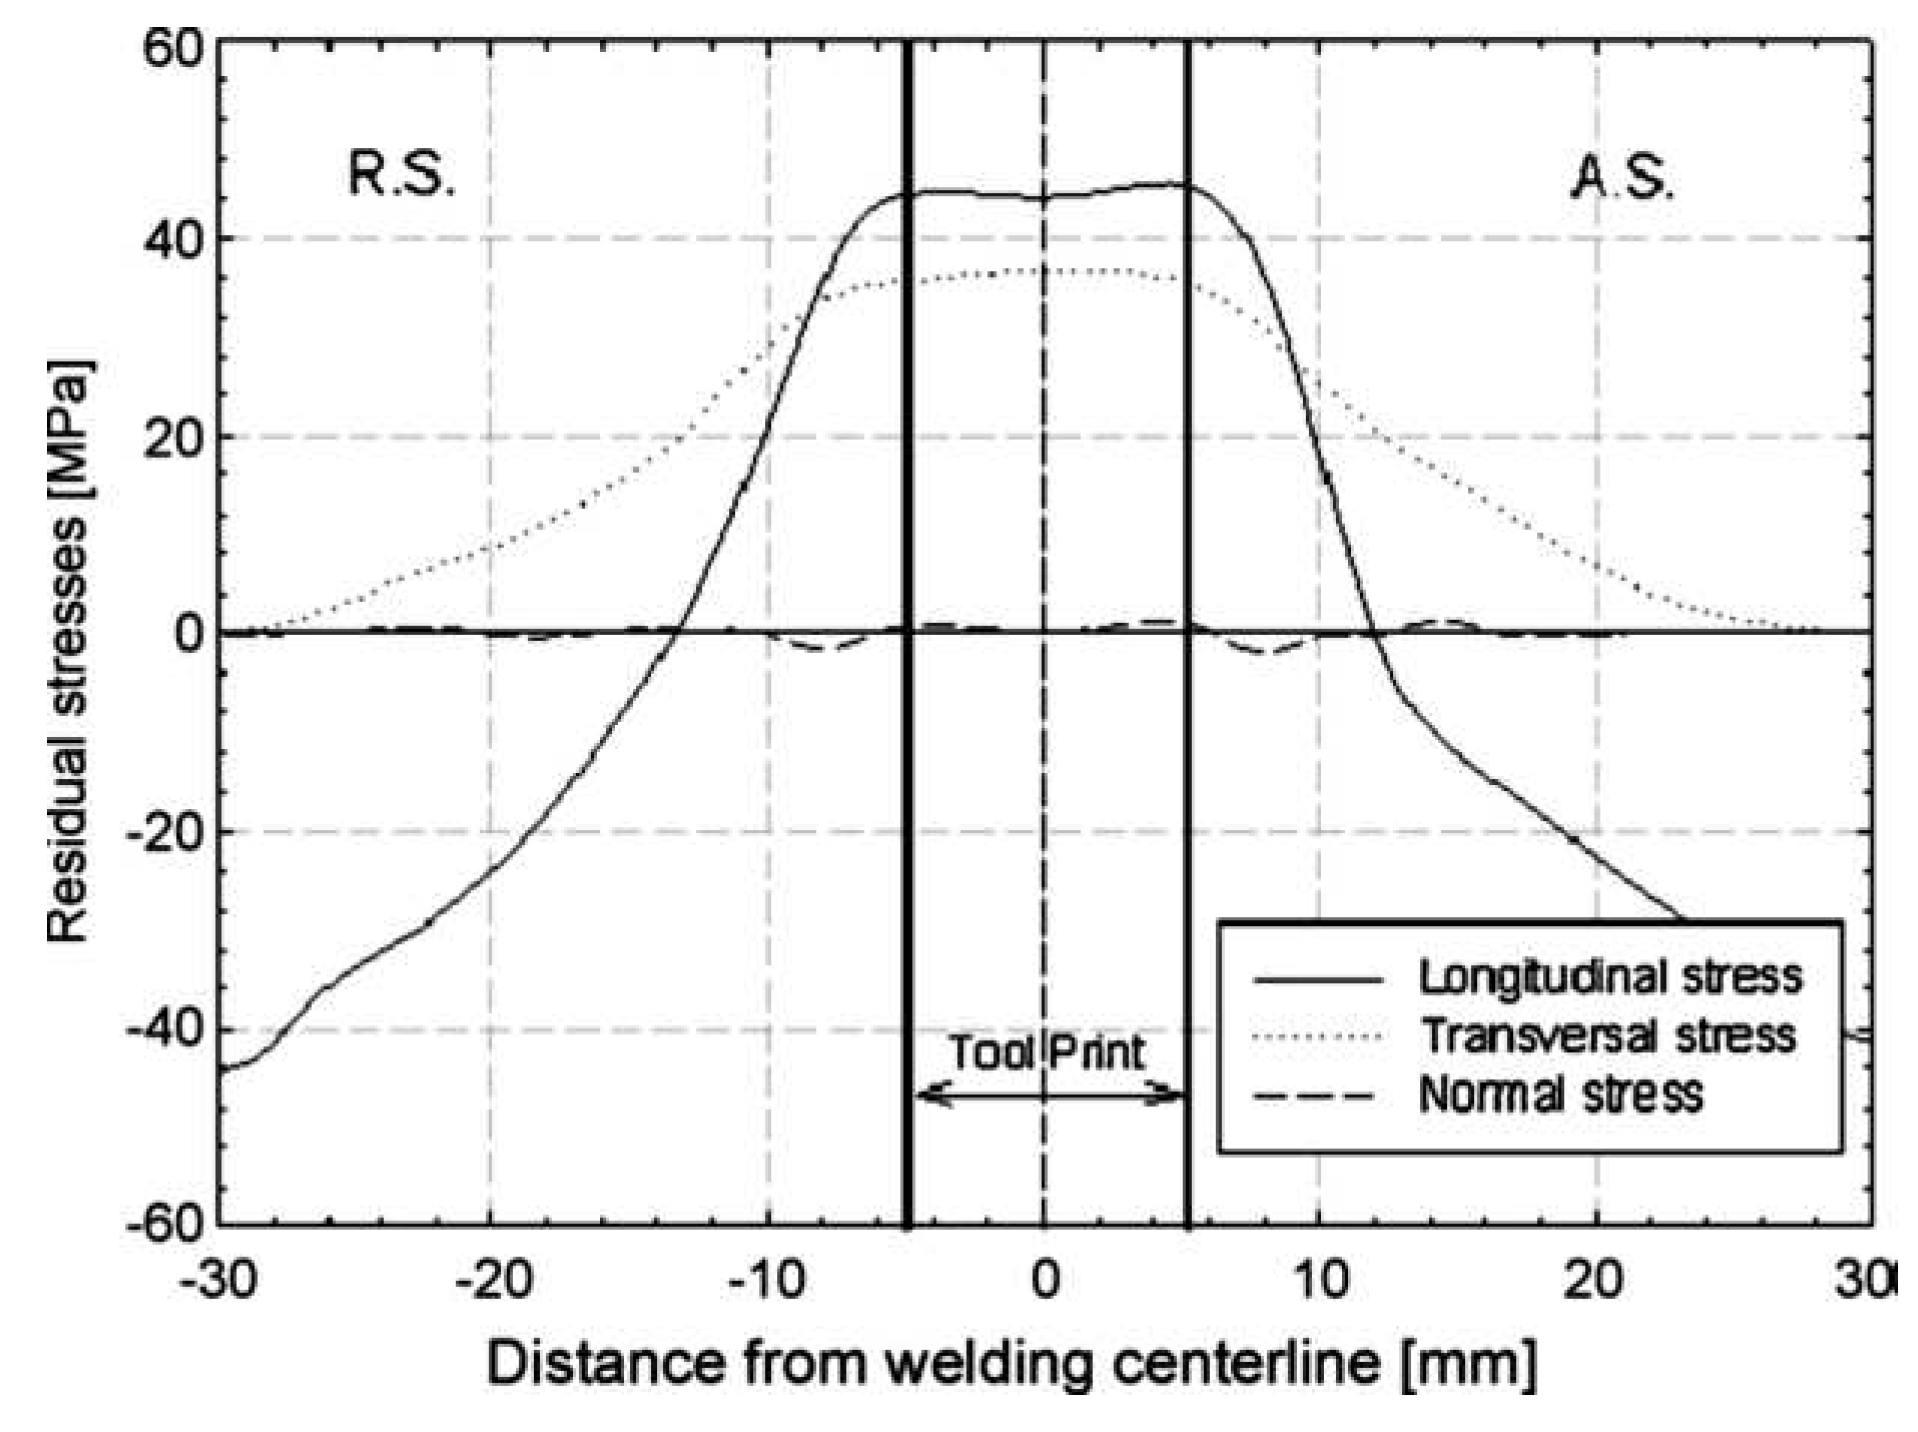
Figure 31.
Residual stress distribution for case A, a- longitudinal contours, b- transverse contours, c- comparison between experimental and numerical results along the transverse red path [88].
Figure 31.
Residual stress distribution for case A, a- longitudinal contours, b- transverse contours, c- comparison between experimental and numerical results along the transverse red path [88].
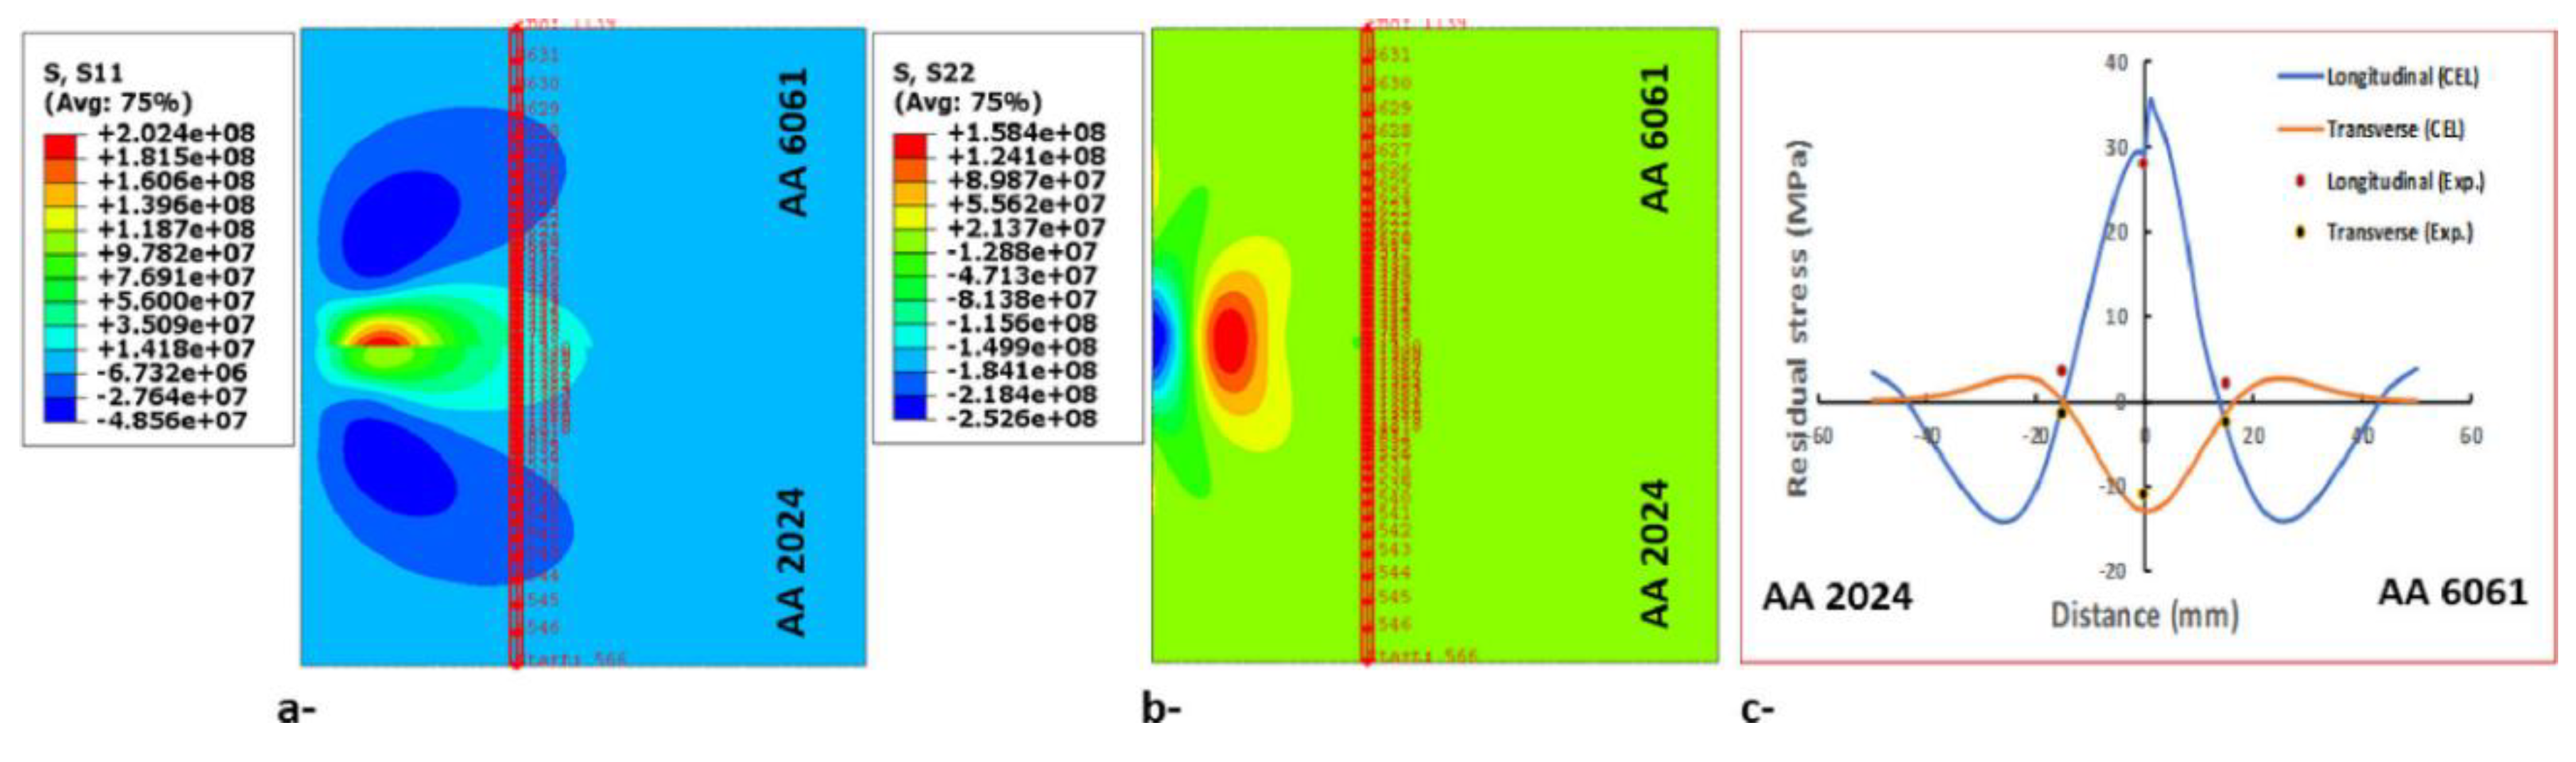
Figure 32.
Forces applied to the tool during the FSW.
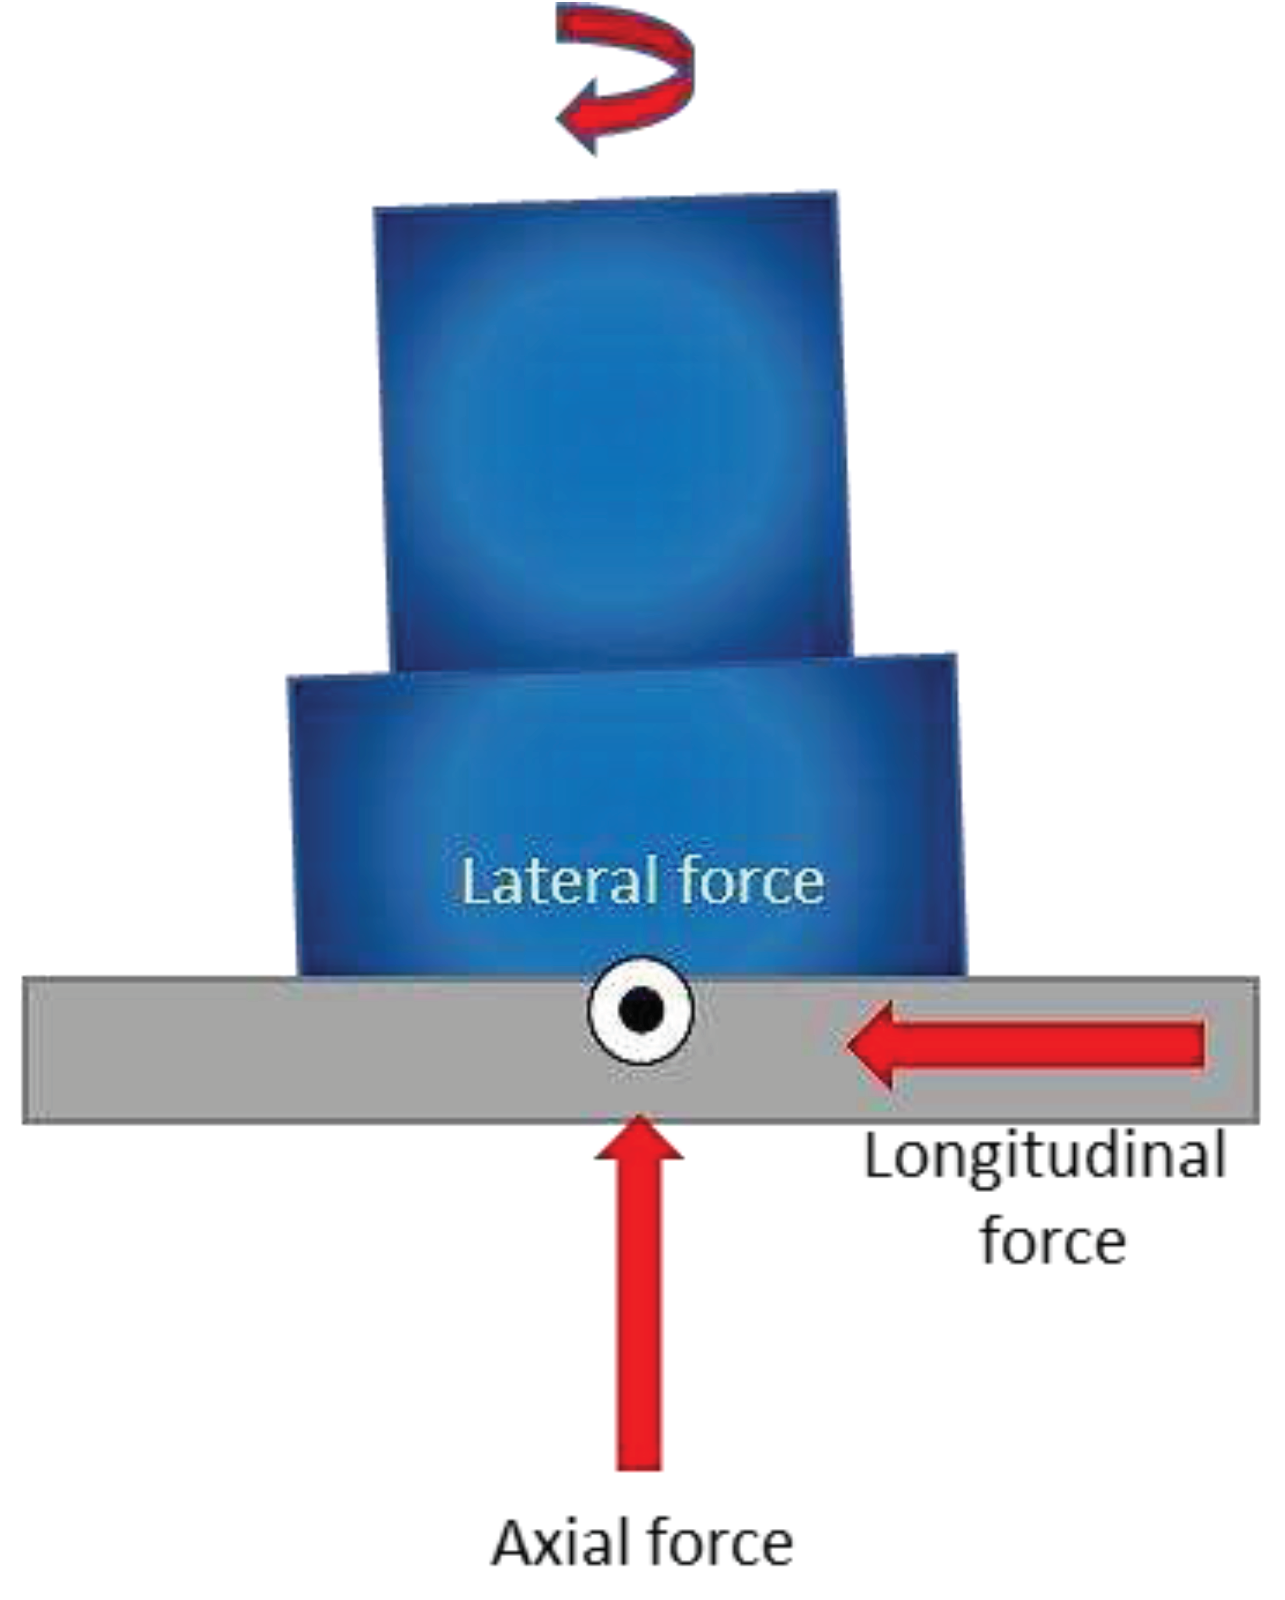
Figure 33.
Experimental force and temperate generation [182].
Figure 33.
Experimental force and temperate generation [182].
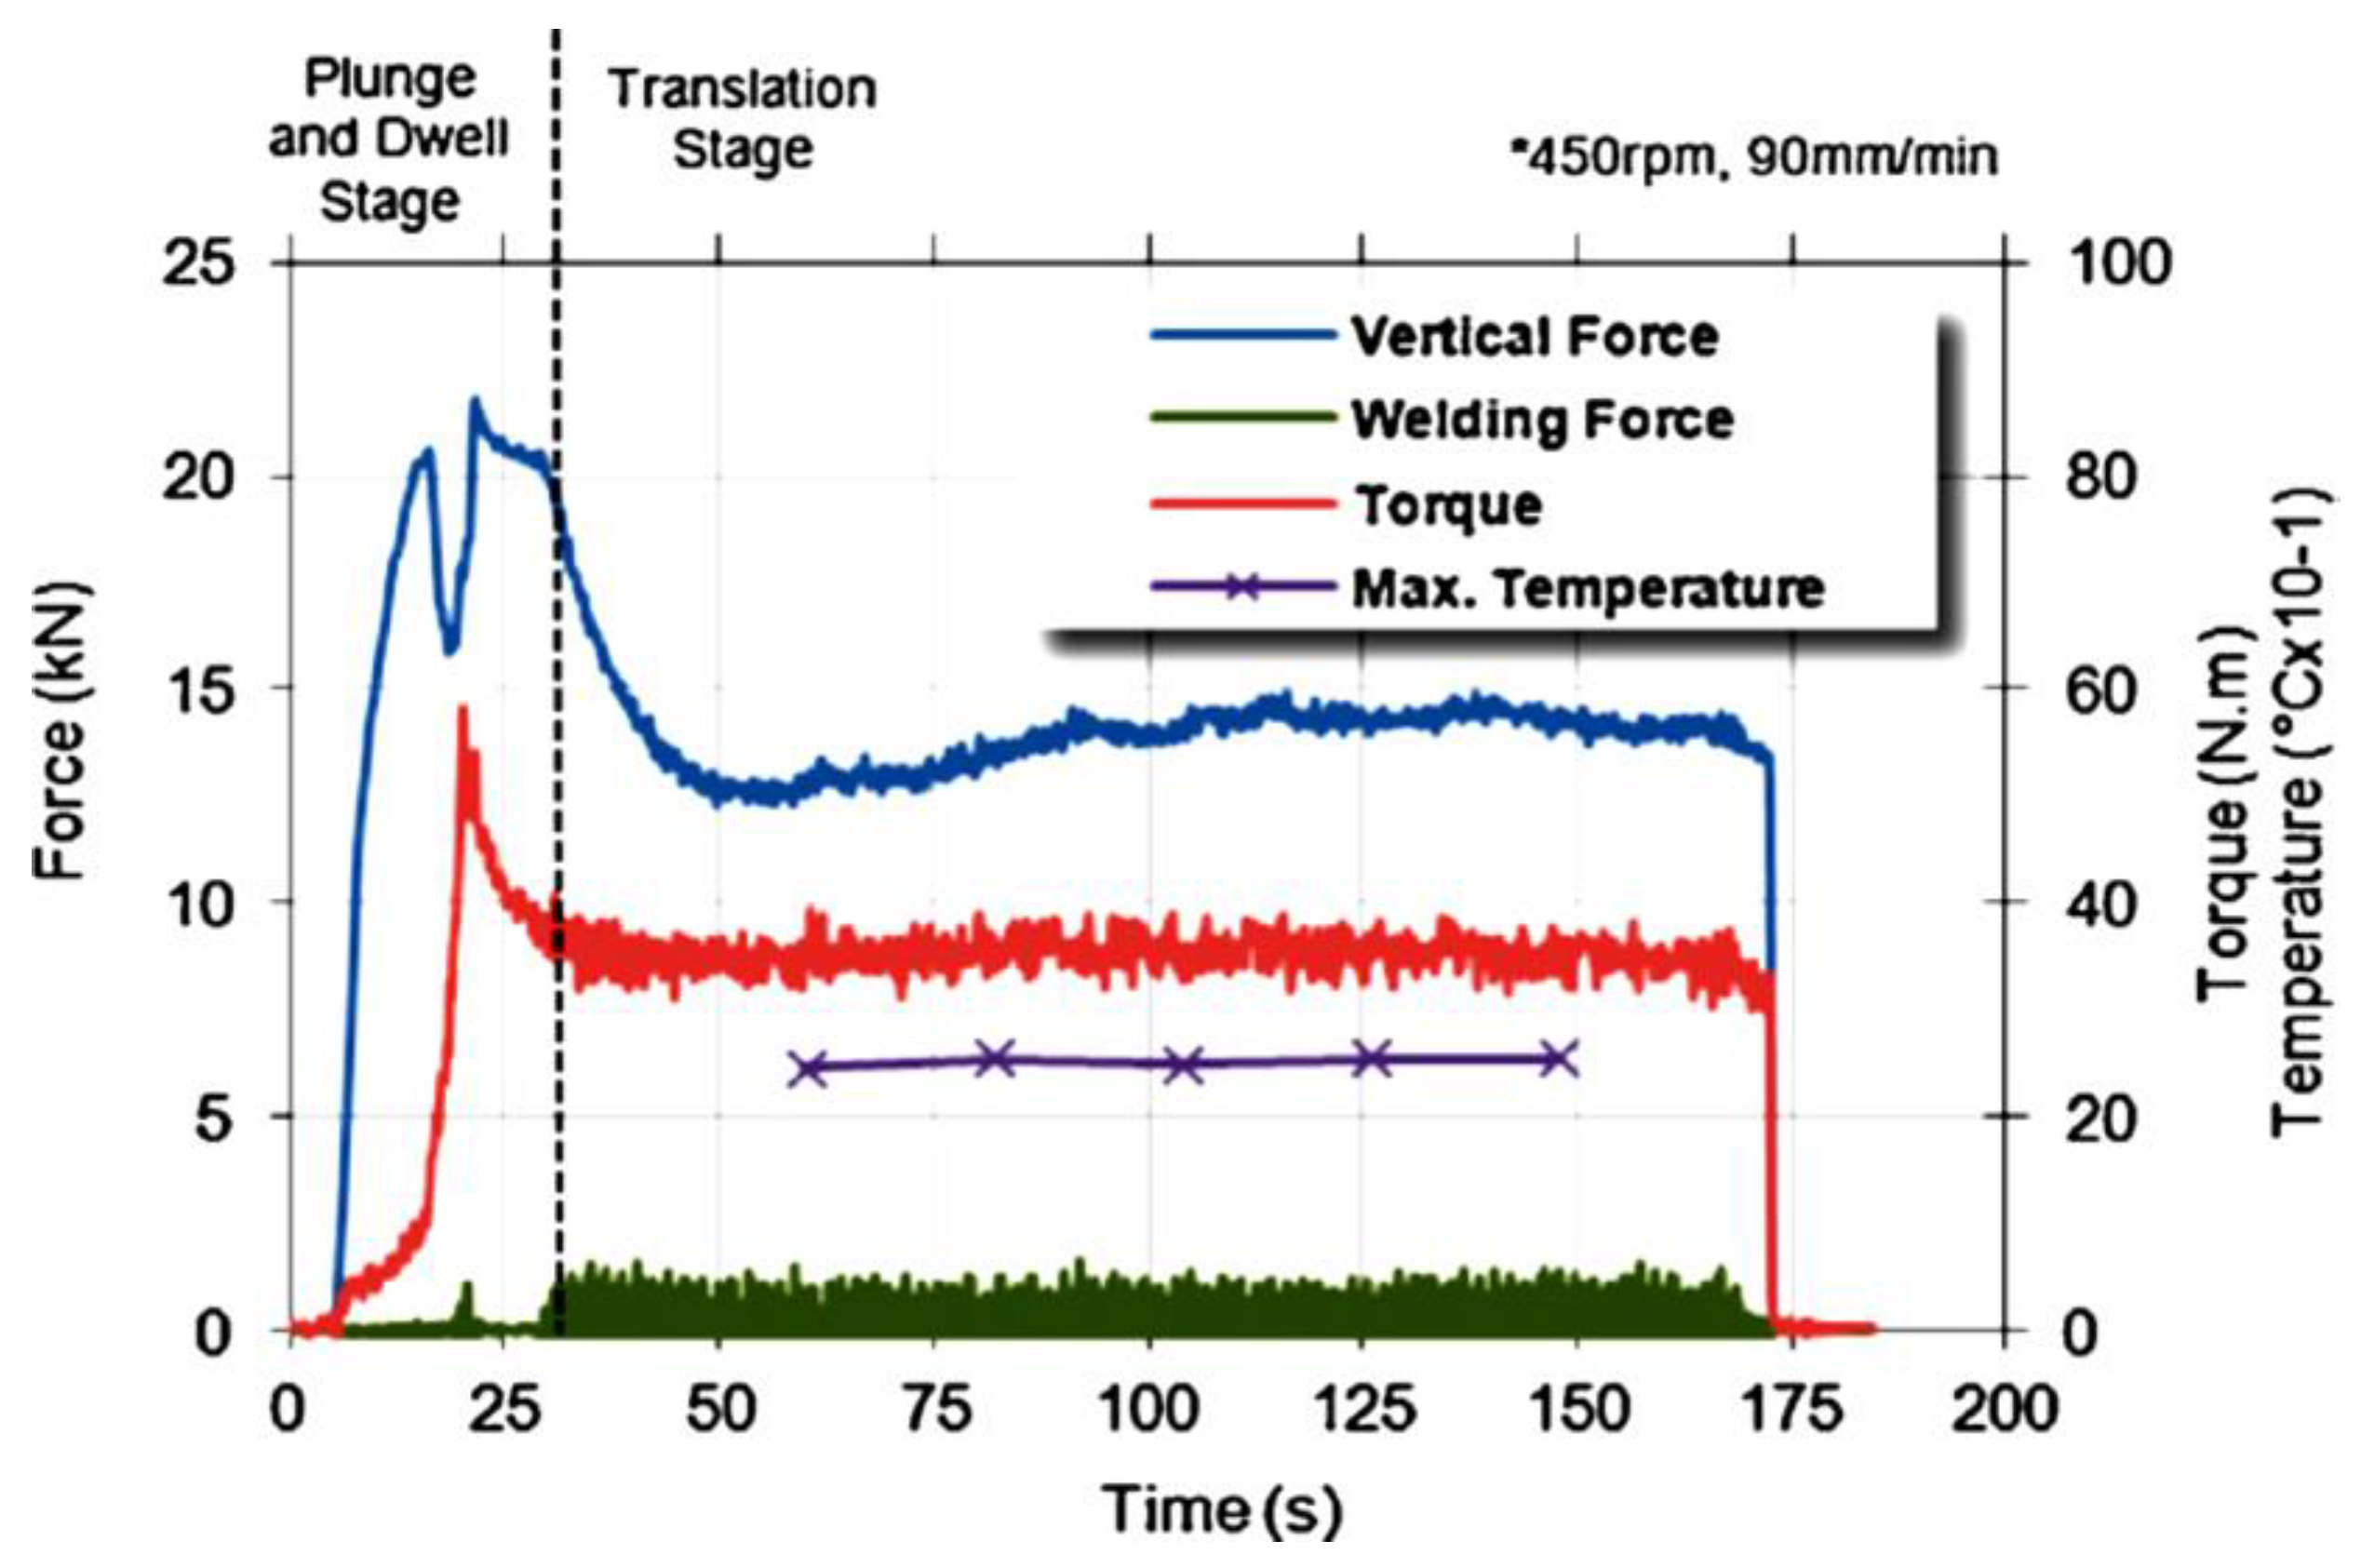
Figure 34.
FEM predicted forces for various traverse speeds [182].
Figure 34.
FEM predicted forces for various traverse speeds [182].
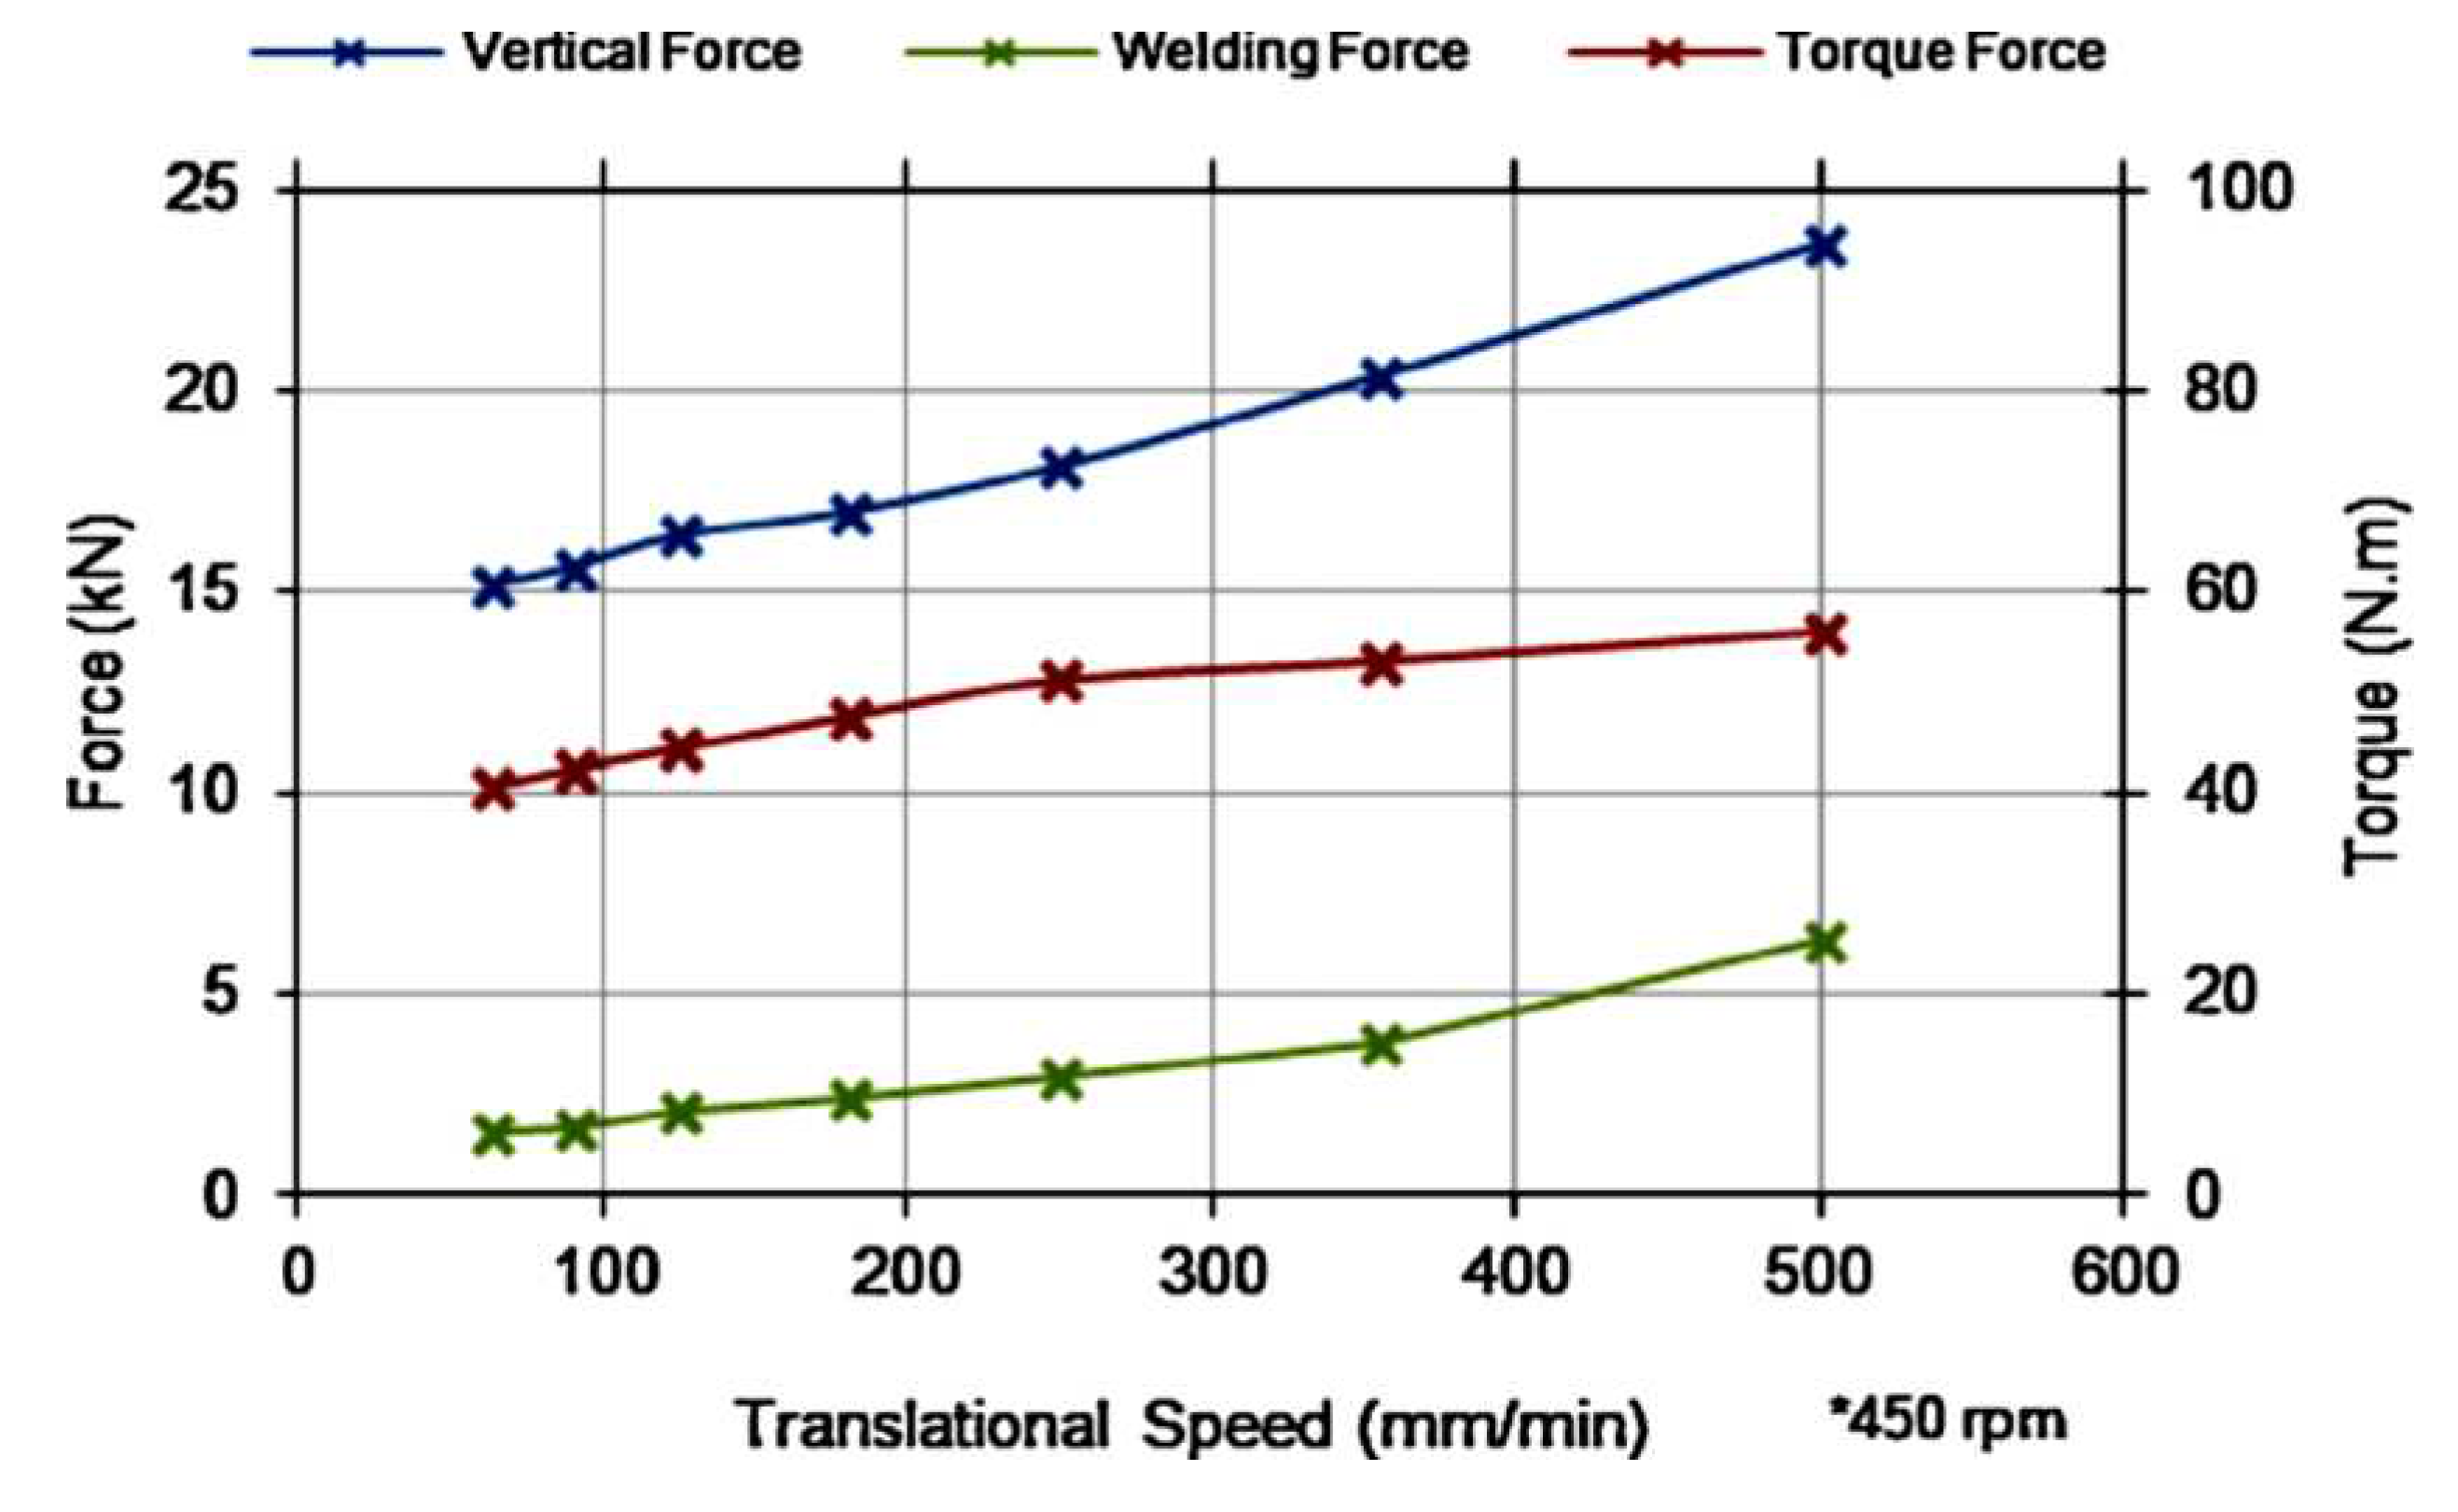
Figure 35.
Effect of shoulder diameter on the sliding, sticking, and total torque during FSW [185].
Figure 35.
Effect of shoulder diameter on the sliding, sticking, and total torque during FSW [185].
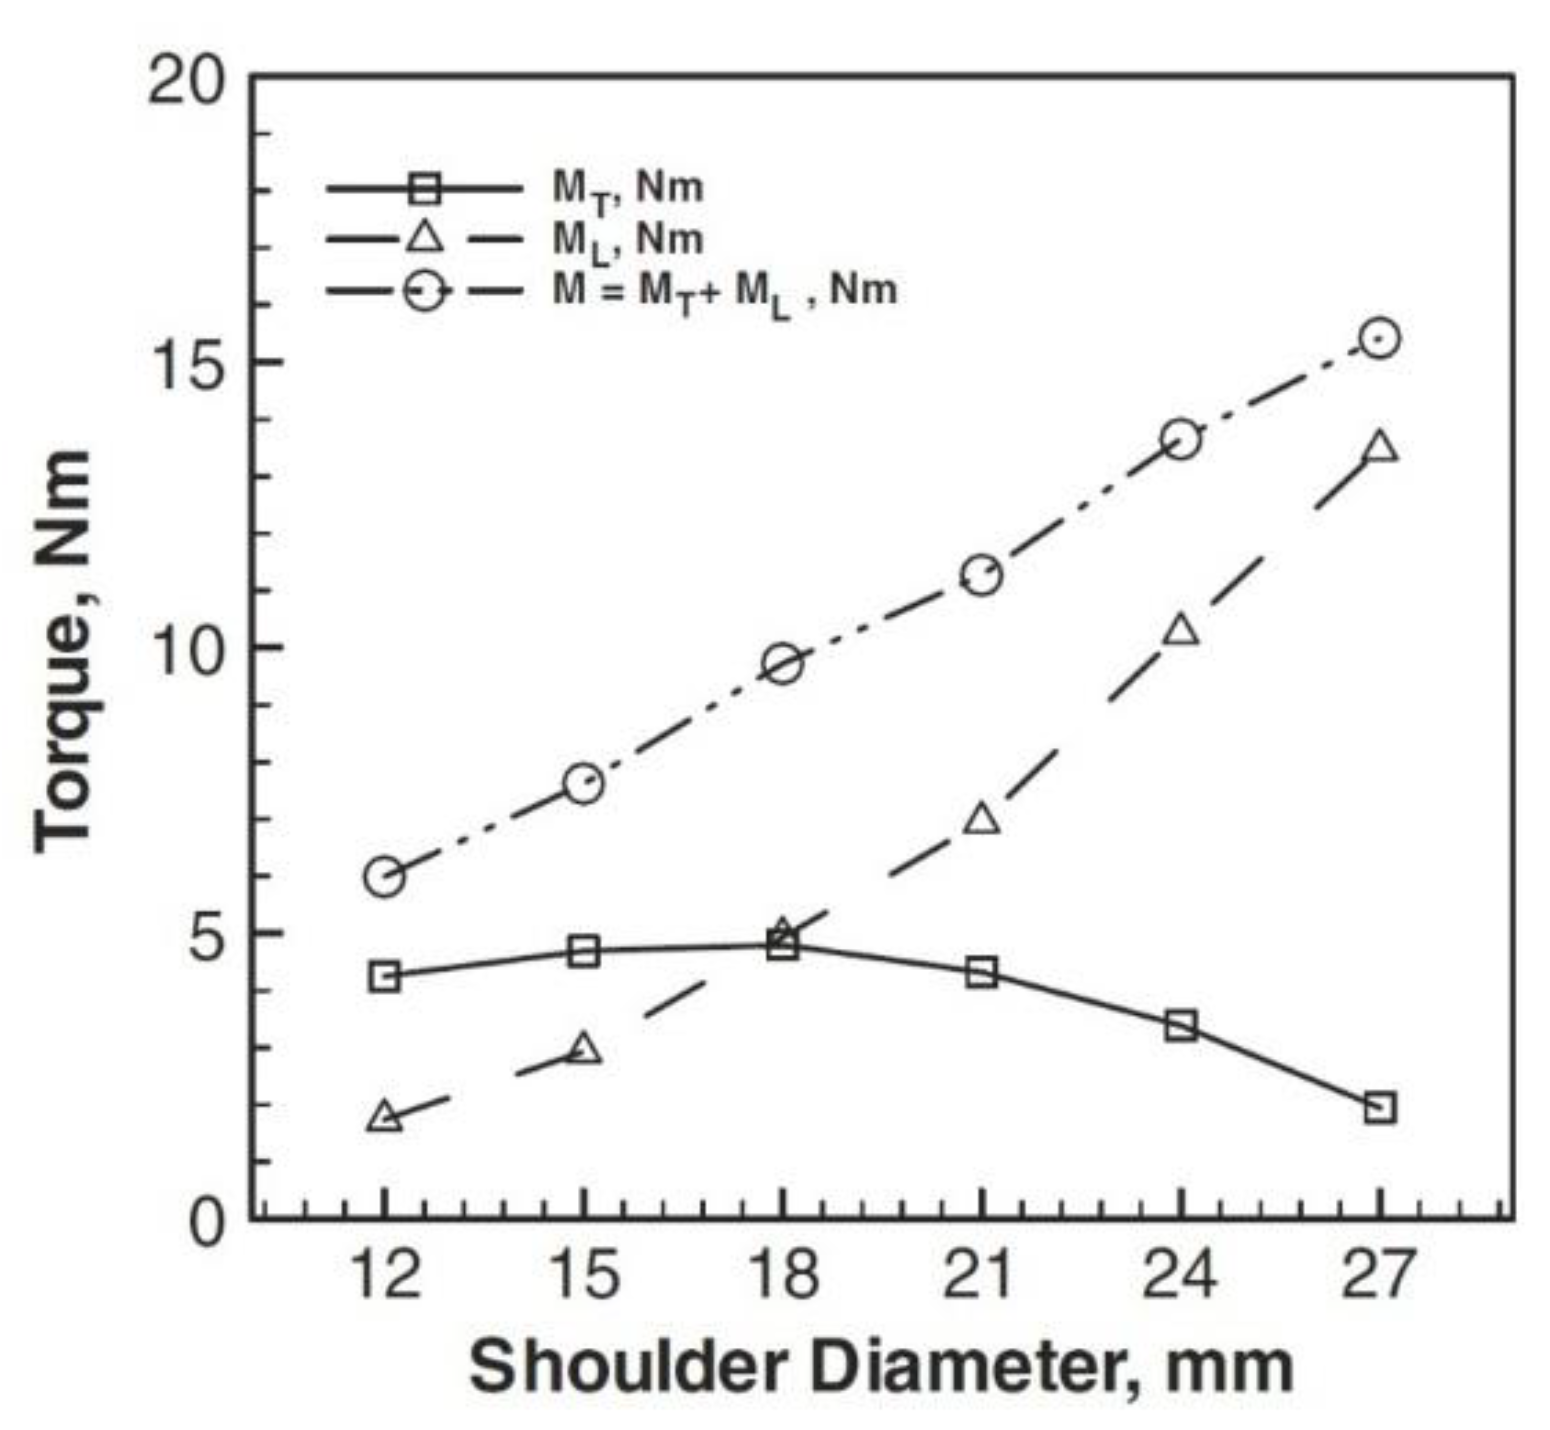
Figure 36.
Material flow at (a) retreating side and (b) advancing side, in the middle of the welding plate thickness, when v = 2.363 mm/s and ω = 240 rpm [5].
Figure 36.
Material flow at (a) retreating side and (b) advancing side, in the middle of the welding plate thickness, when v = 2.363 mm/s and ω = 240 rpm [5].
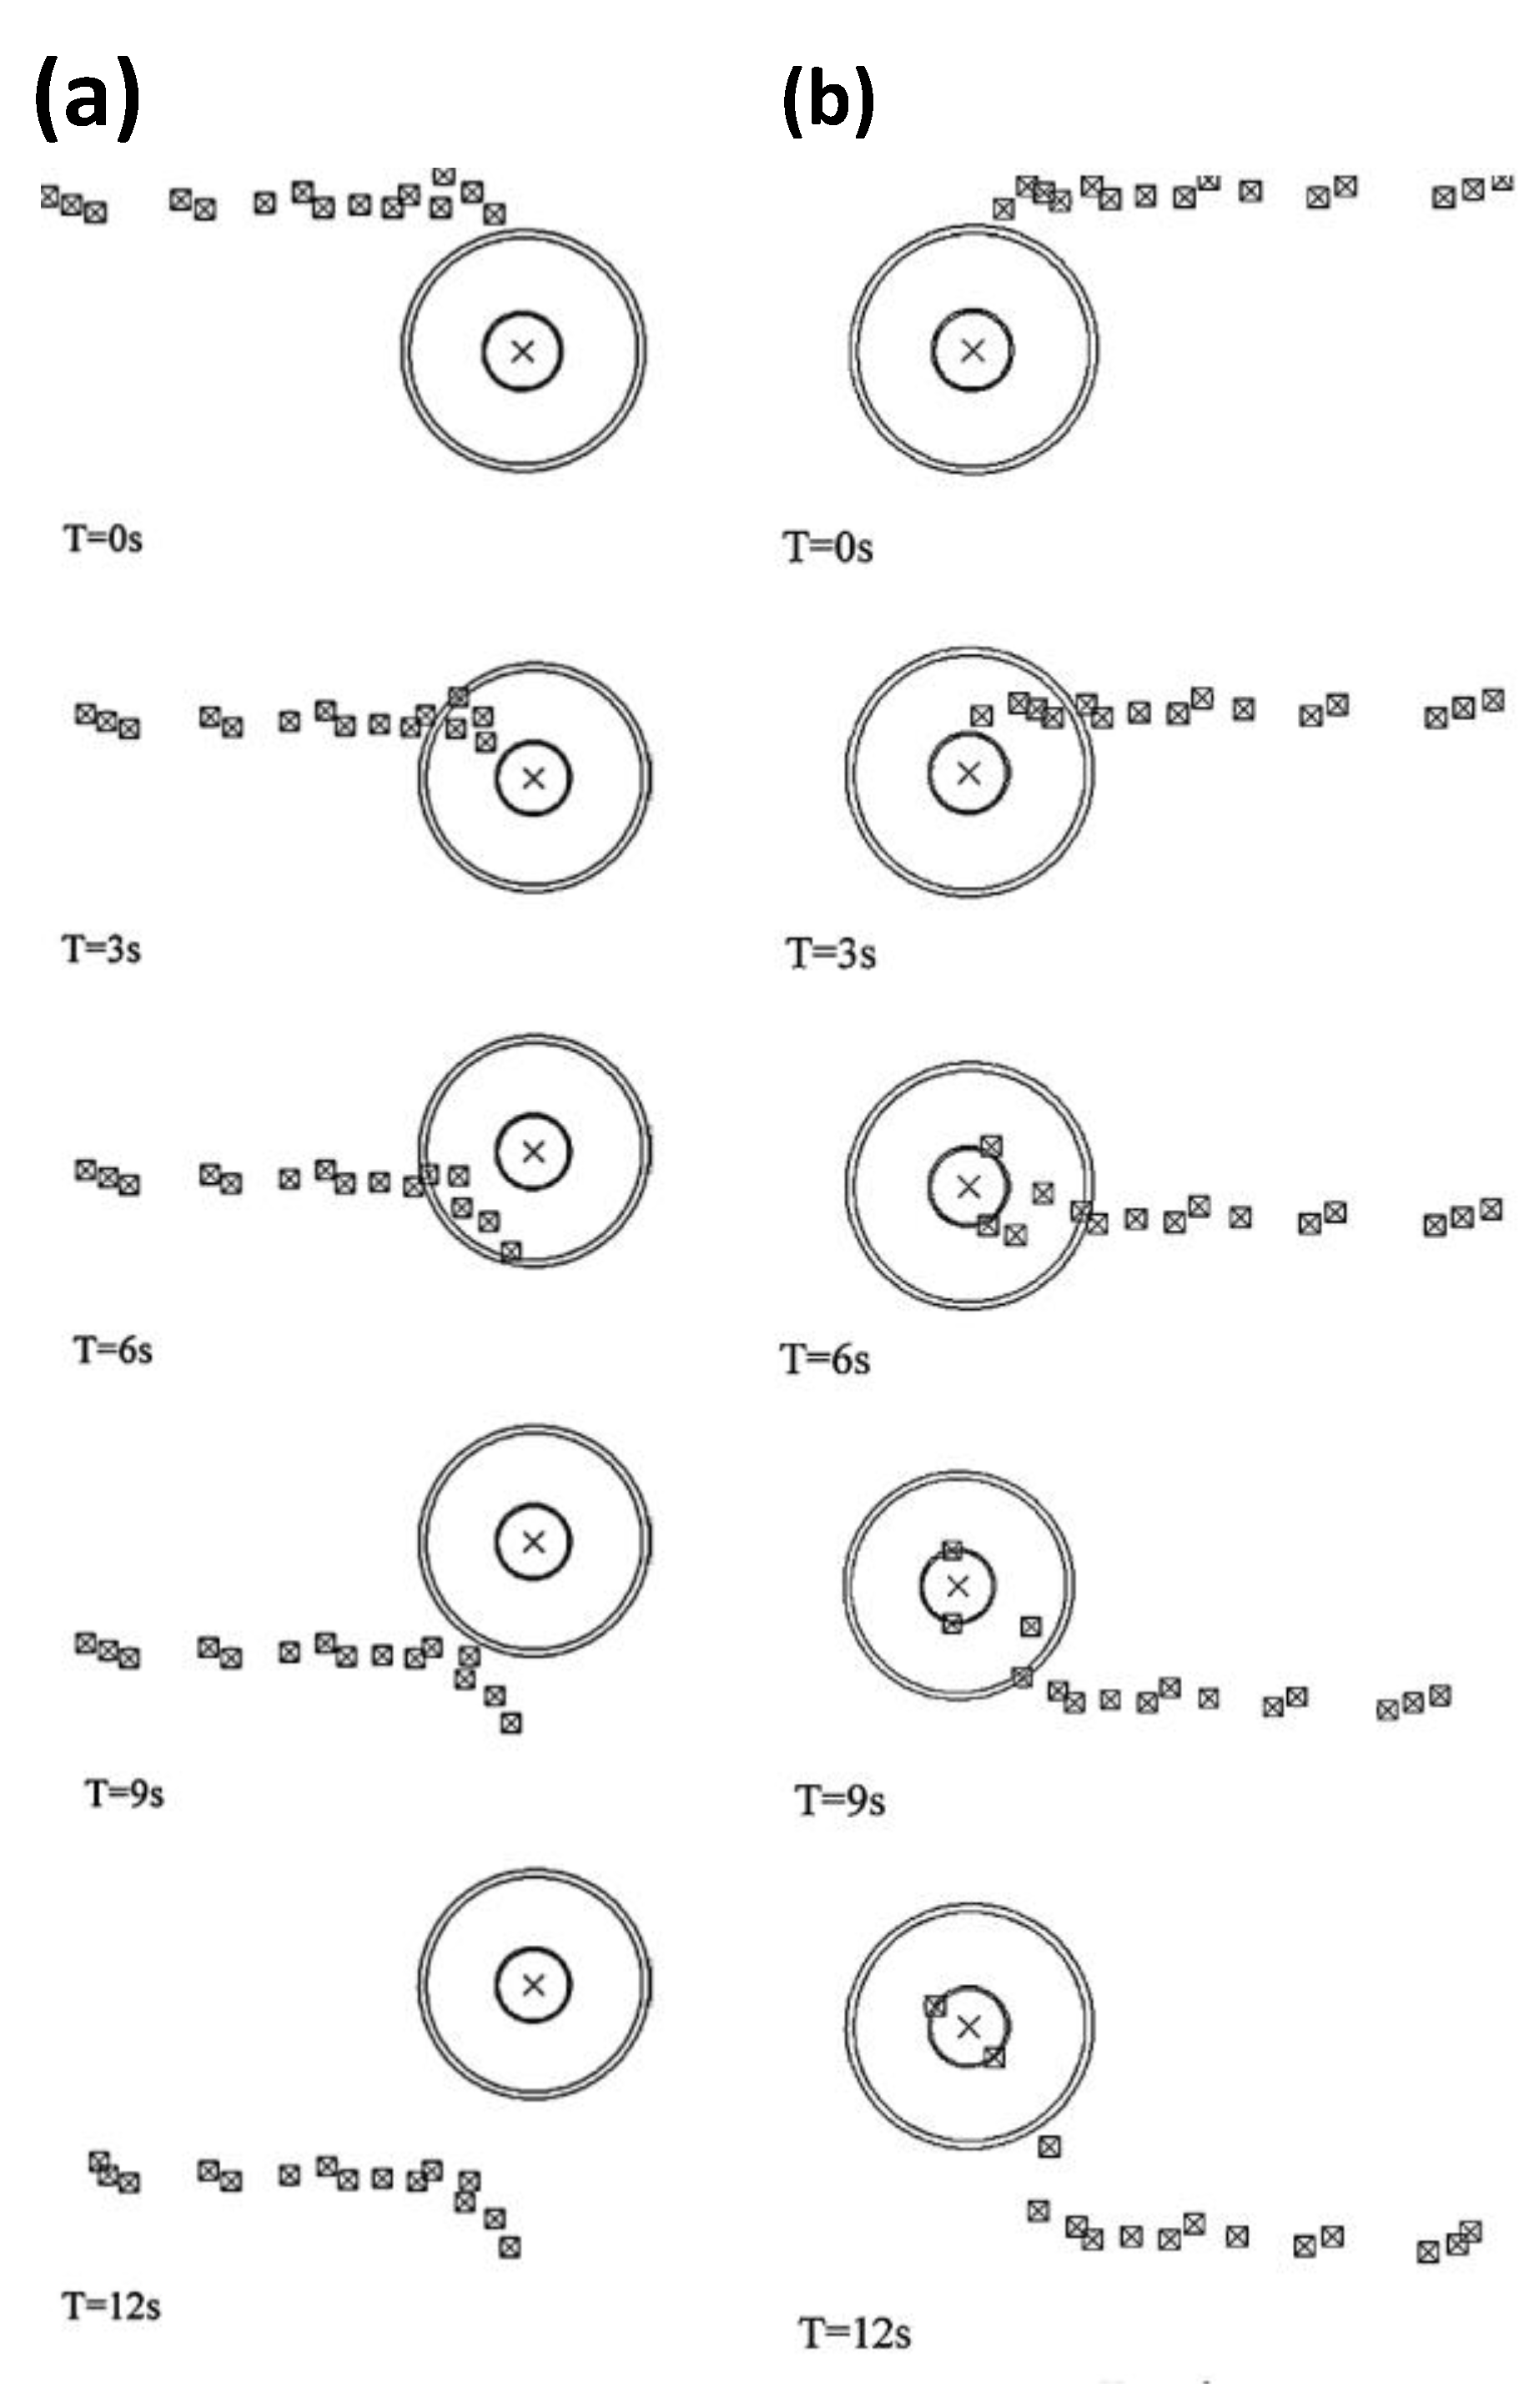
Figure 37.
Material flow at (a) retreating side (b) advancing side, on the bottom surface, when v = 2.363 mm/s and ω = 240 rpm [5].
Figure 37.
Material flow at (a) retreating side (b) advancing side, on the bottom surface, when v = 2.363 mm/s and ω = 240 rpm [5].
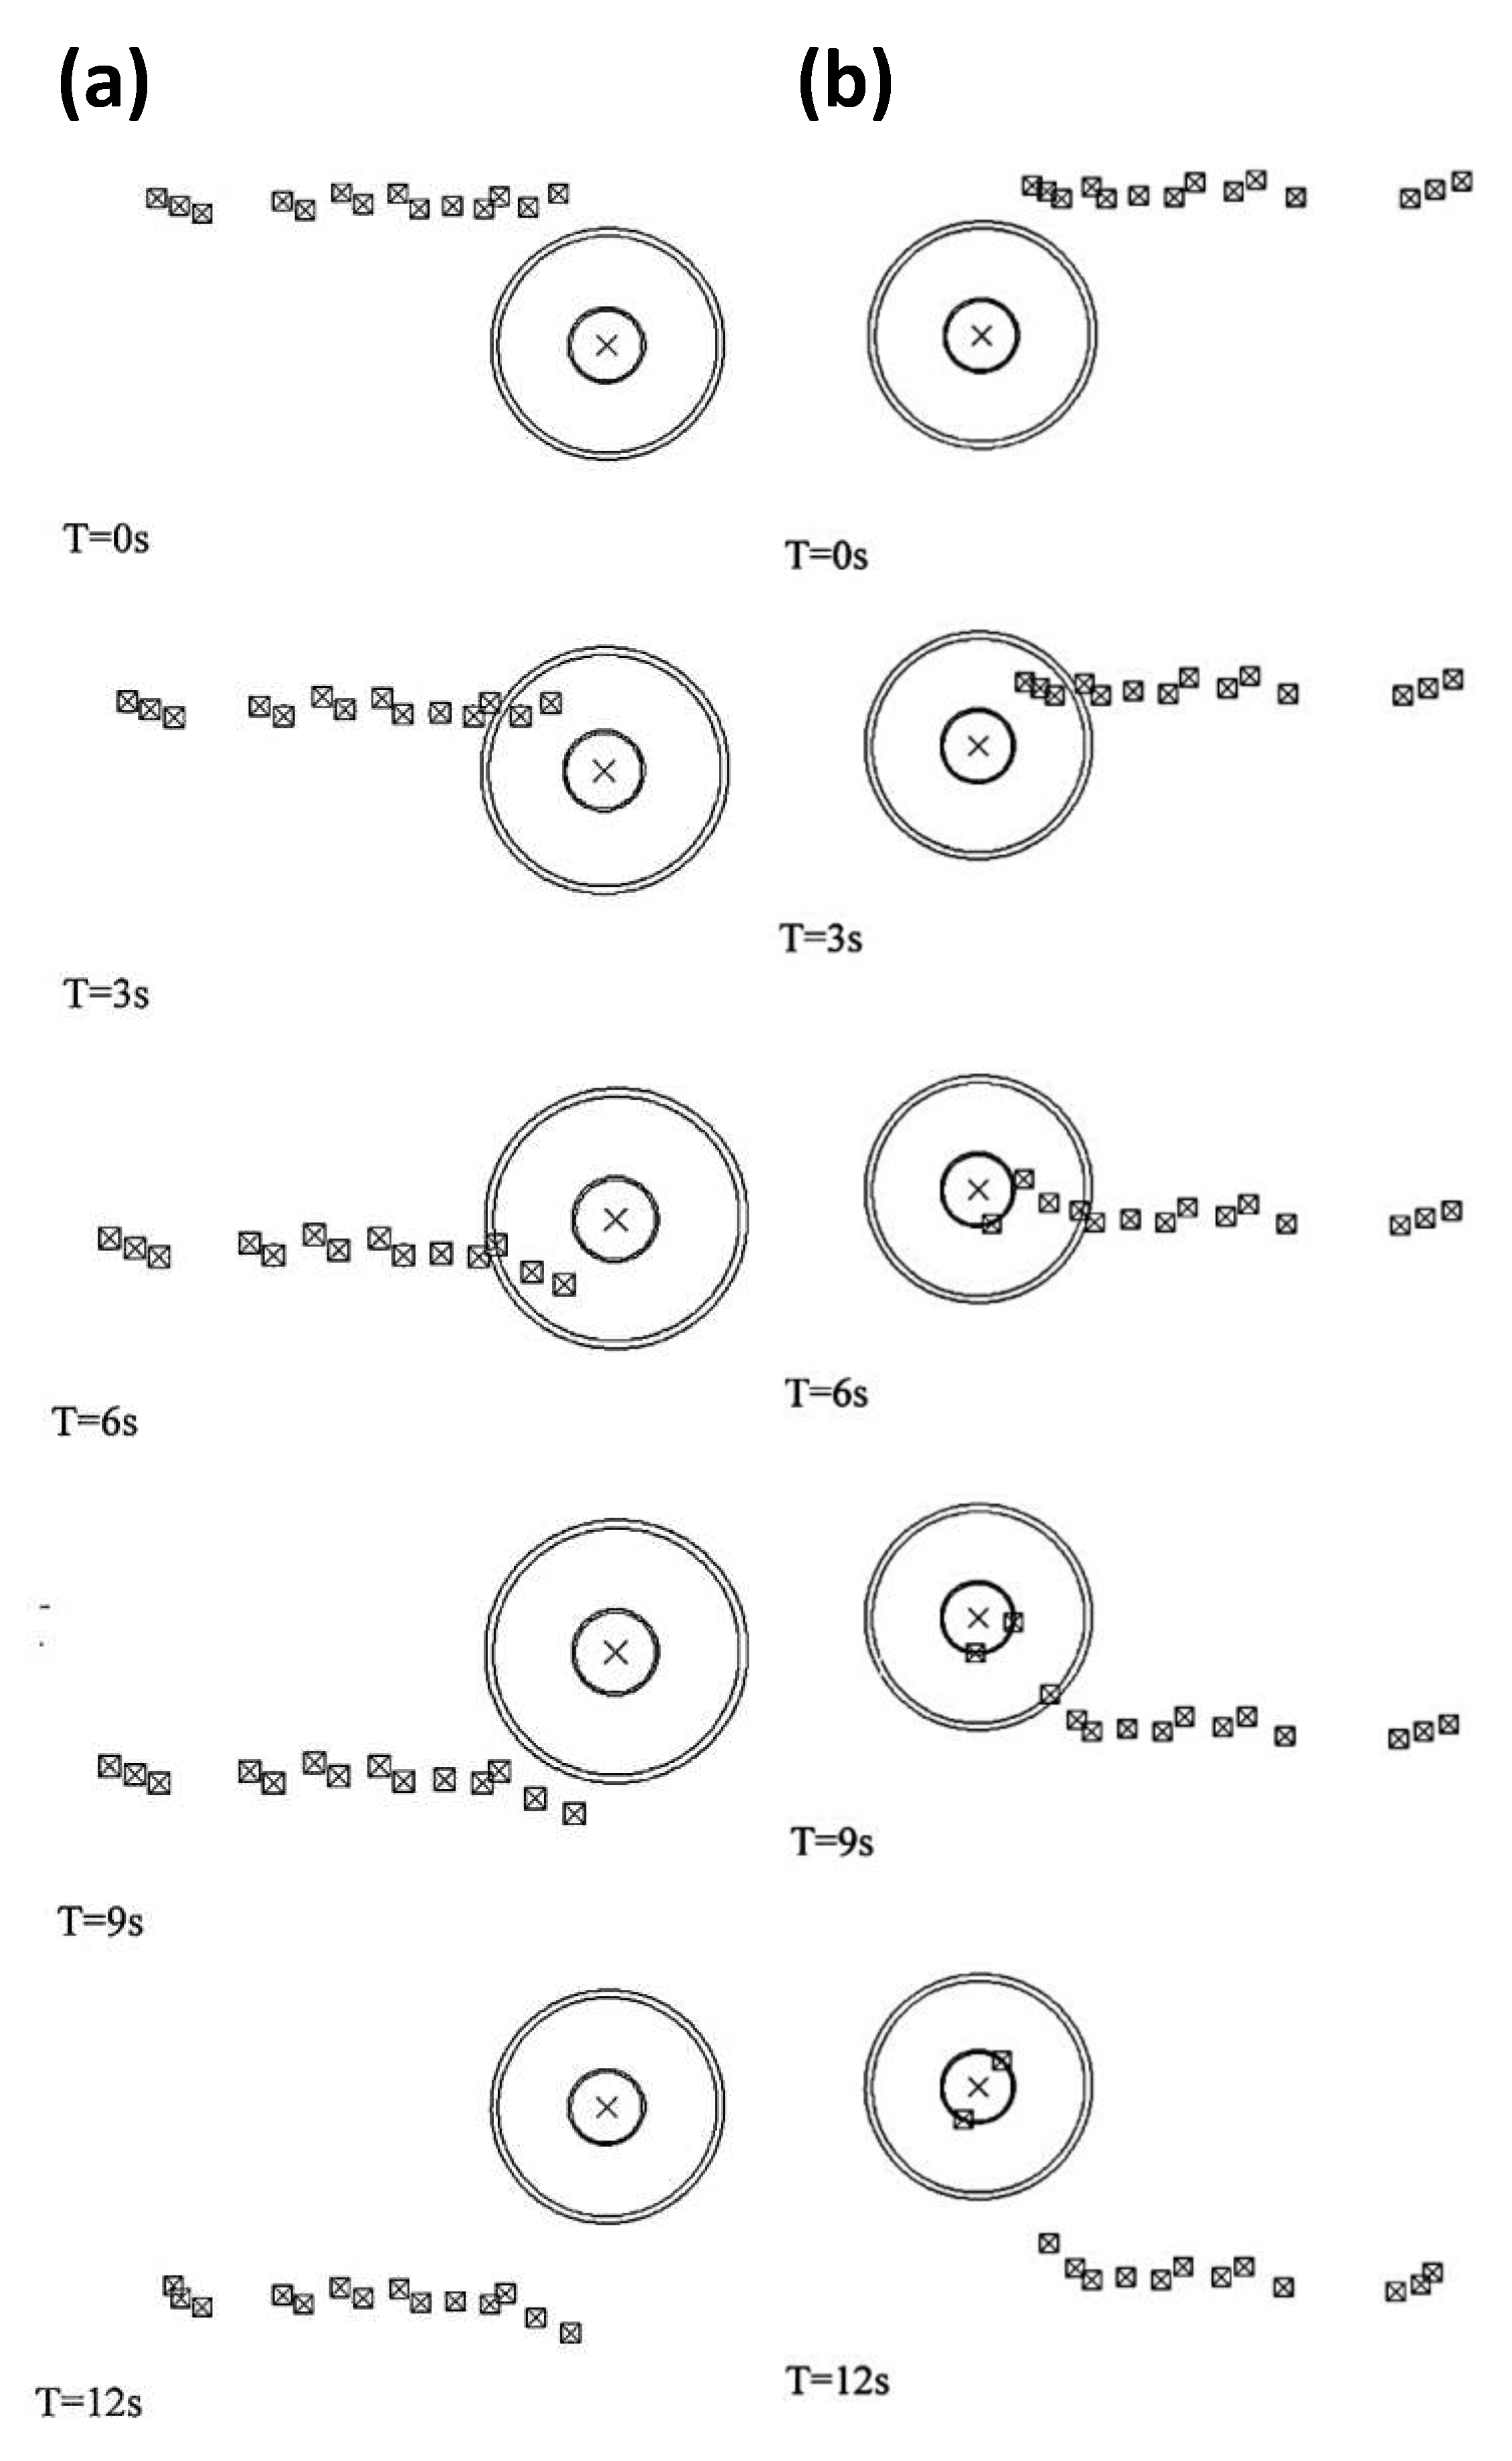
Figure 38.
Centerline points flow pattern [186].
Figure 38.
Centerline points flow pattern [186].
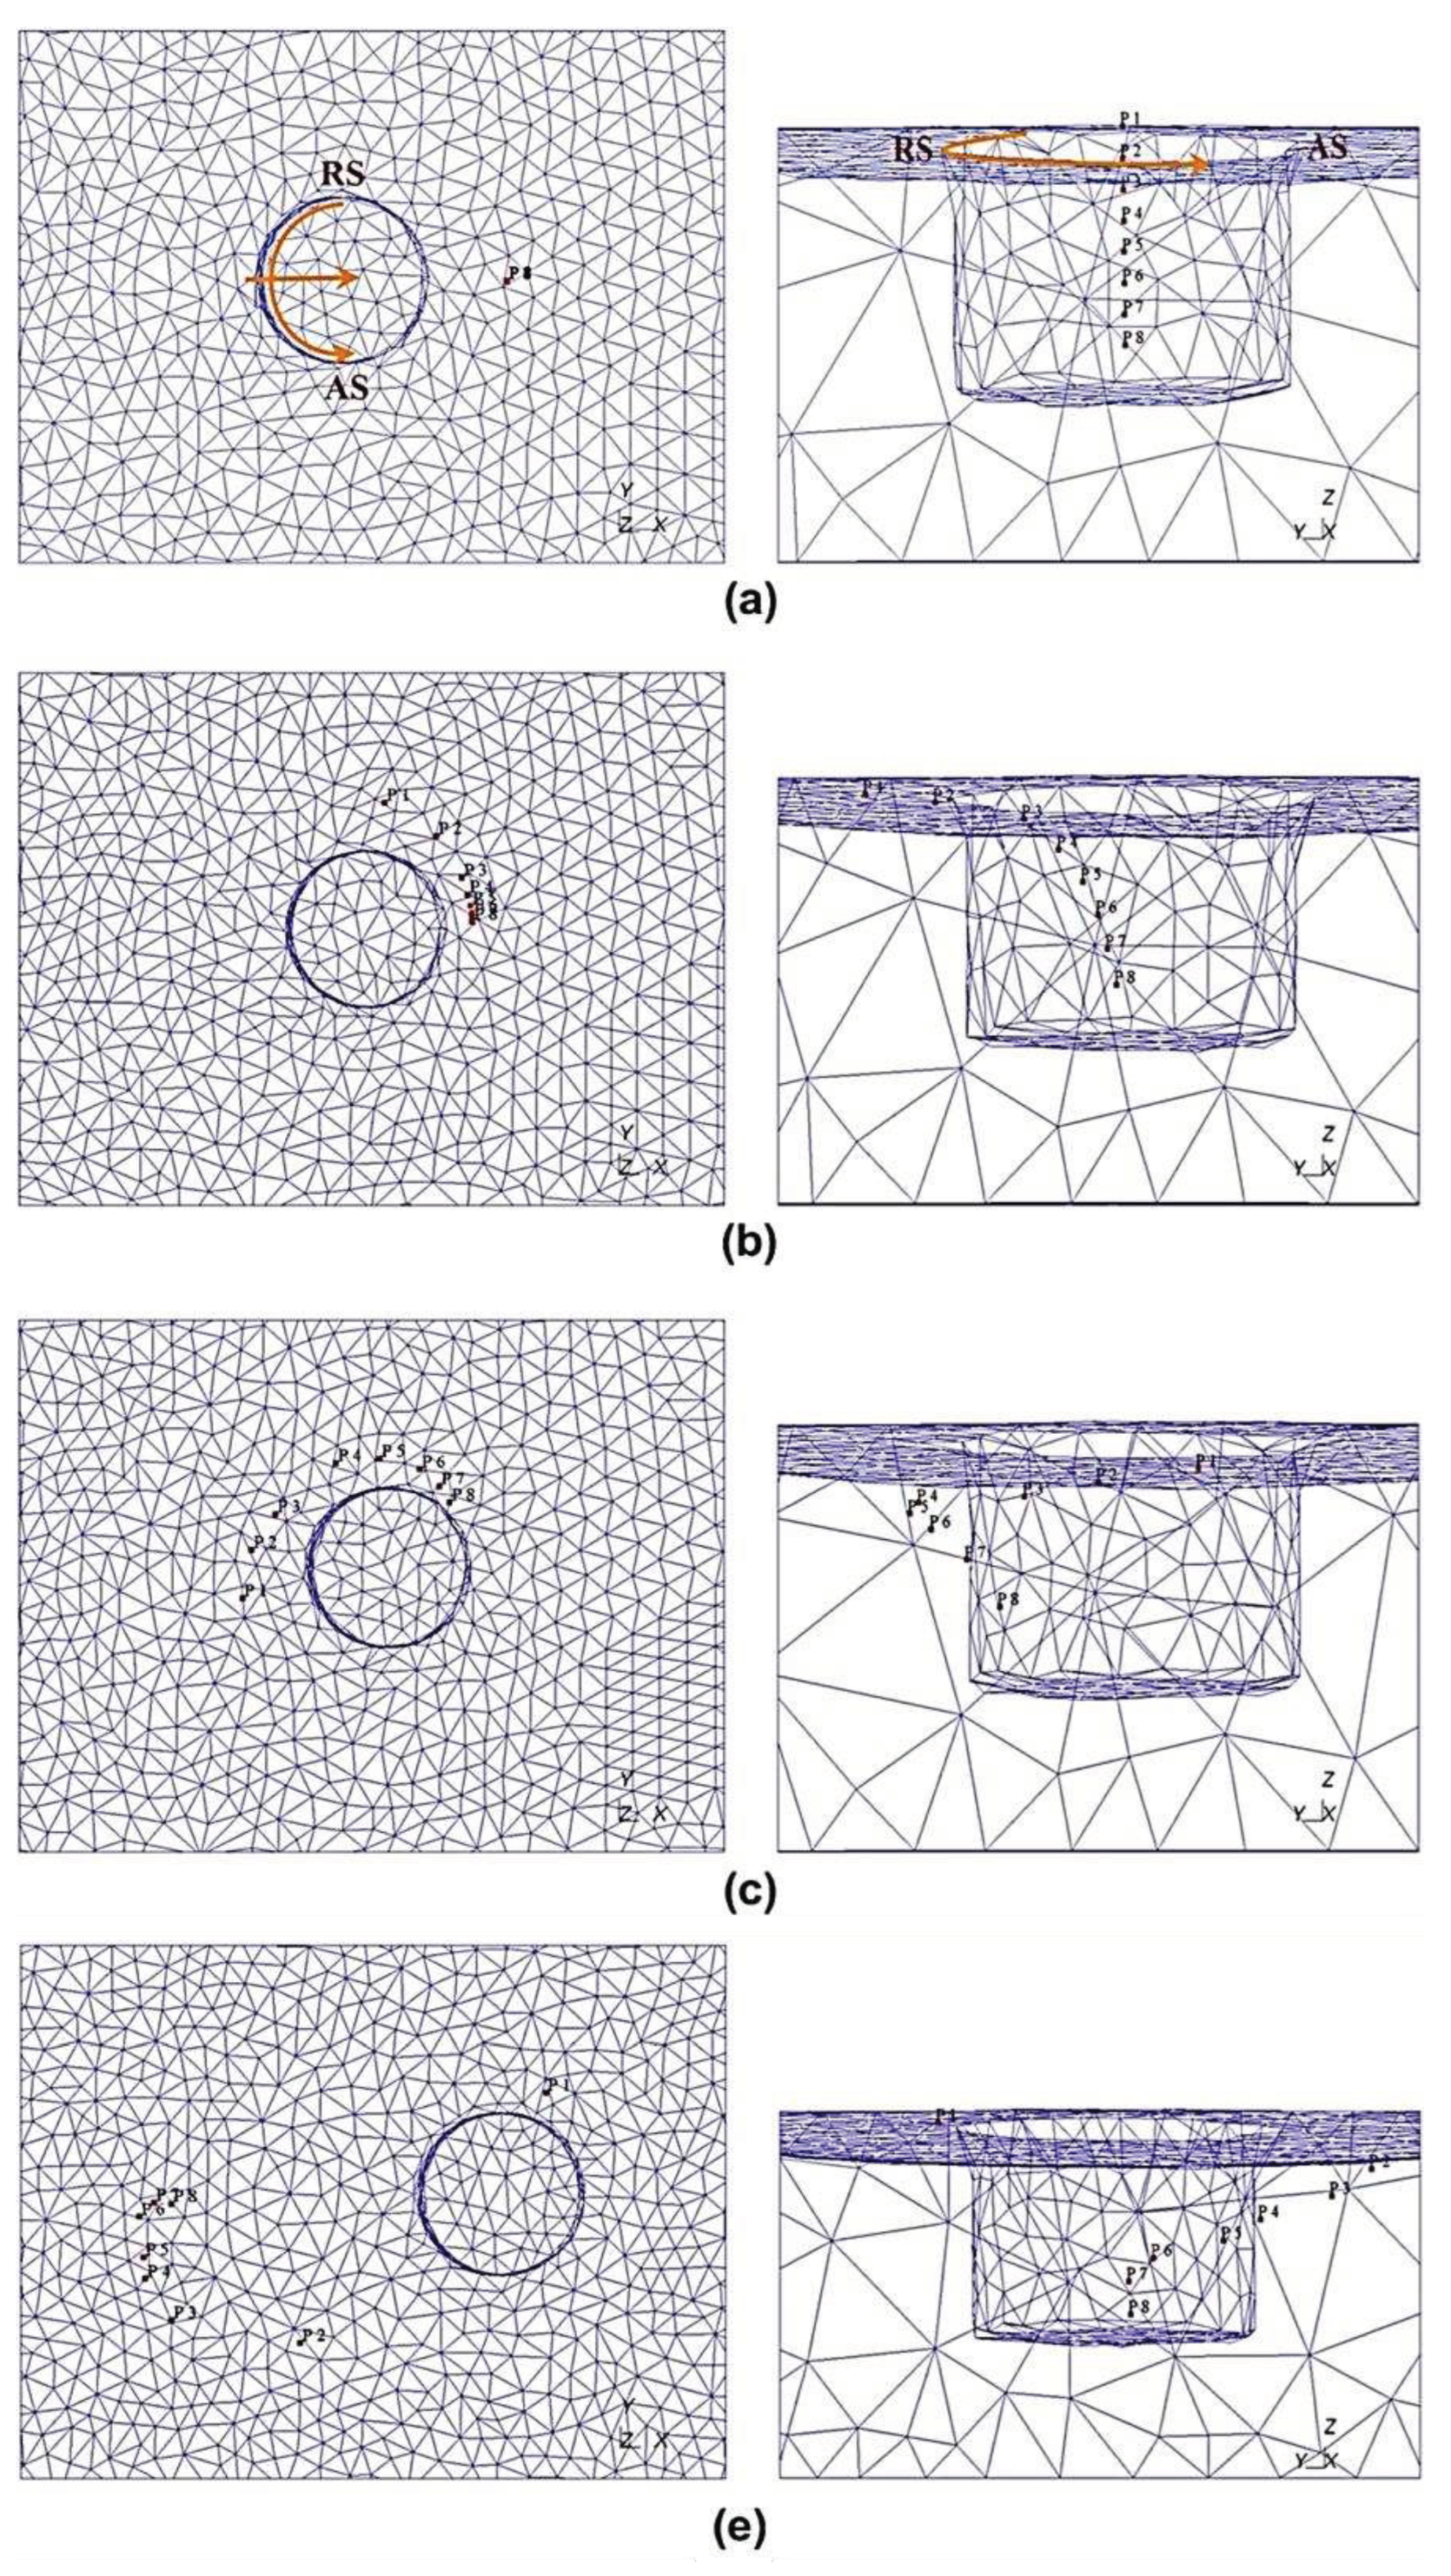
Figure 39.
Flow pattern in the advancing side points [186].
Figure 39.
Flow pattern in the advancing side points [186].
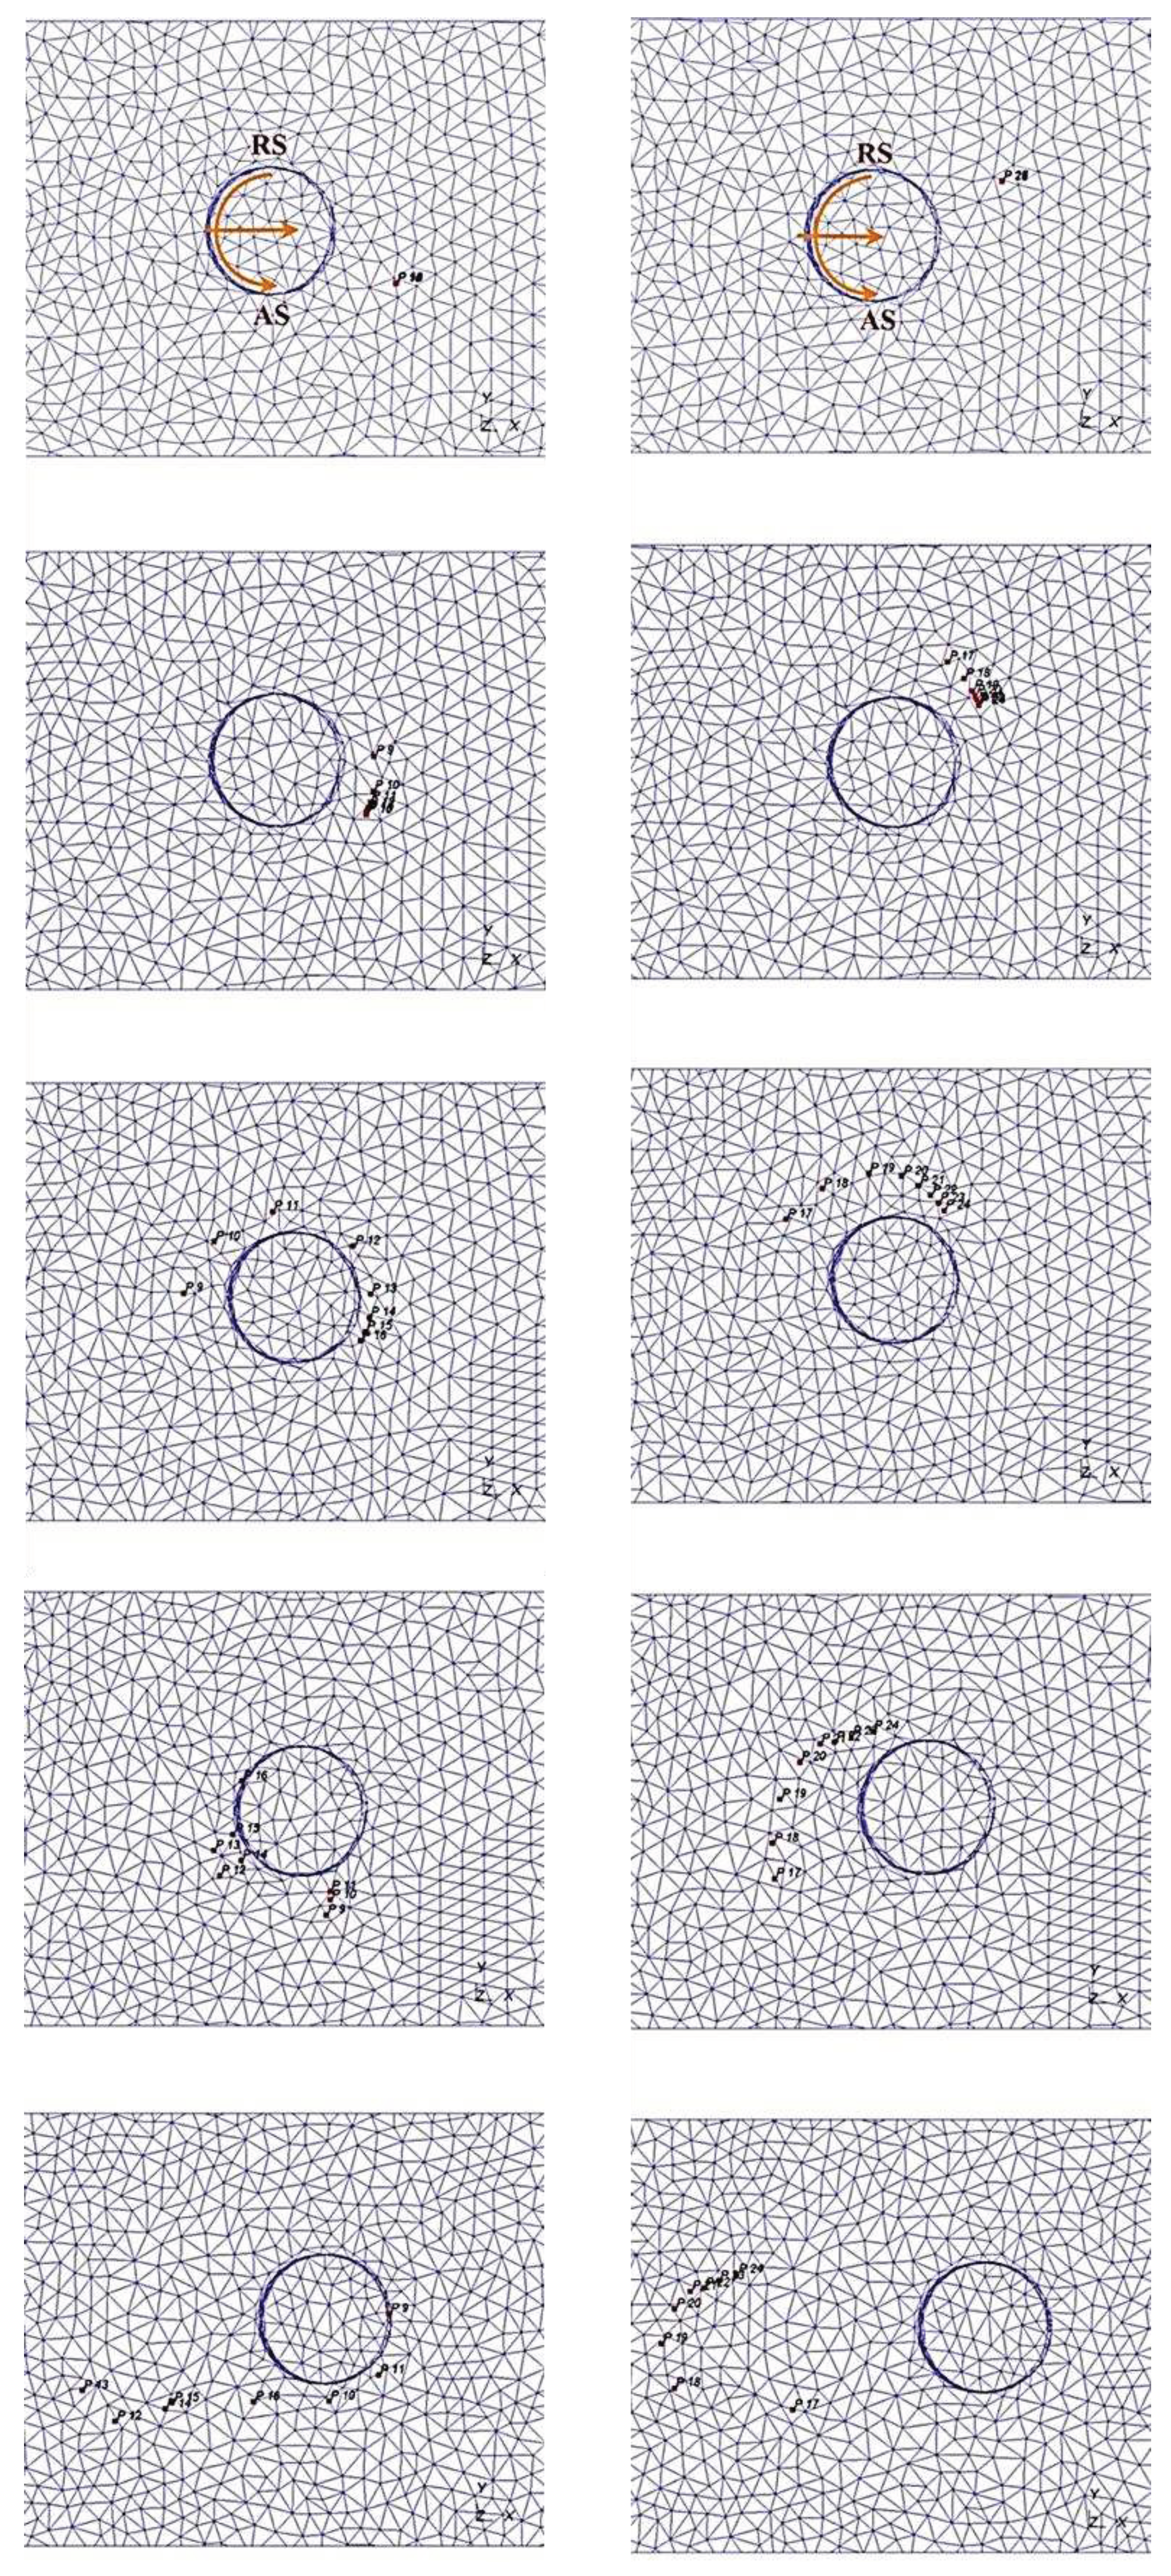
Figure 40.
Simulation of FSW along with the defects formation. (a) Crack defects; and (b) hole defects [197].
Figure 40.
Simulation of FSW along with the defects formation. (a) Crack defects; and (b) hole defects [197].
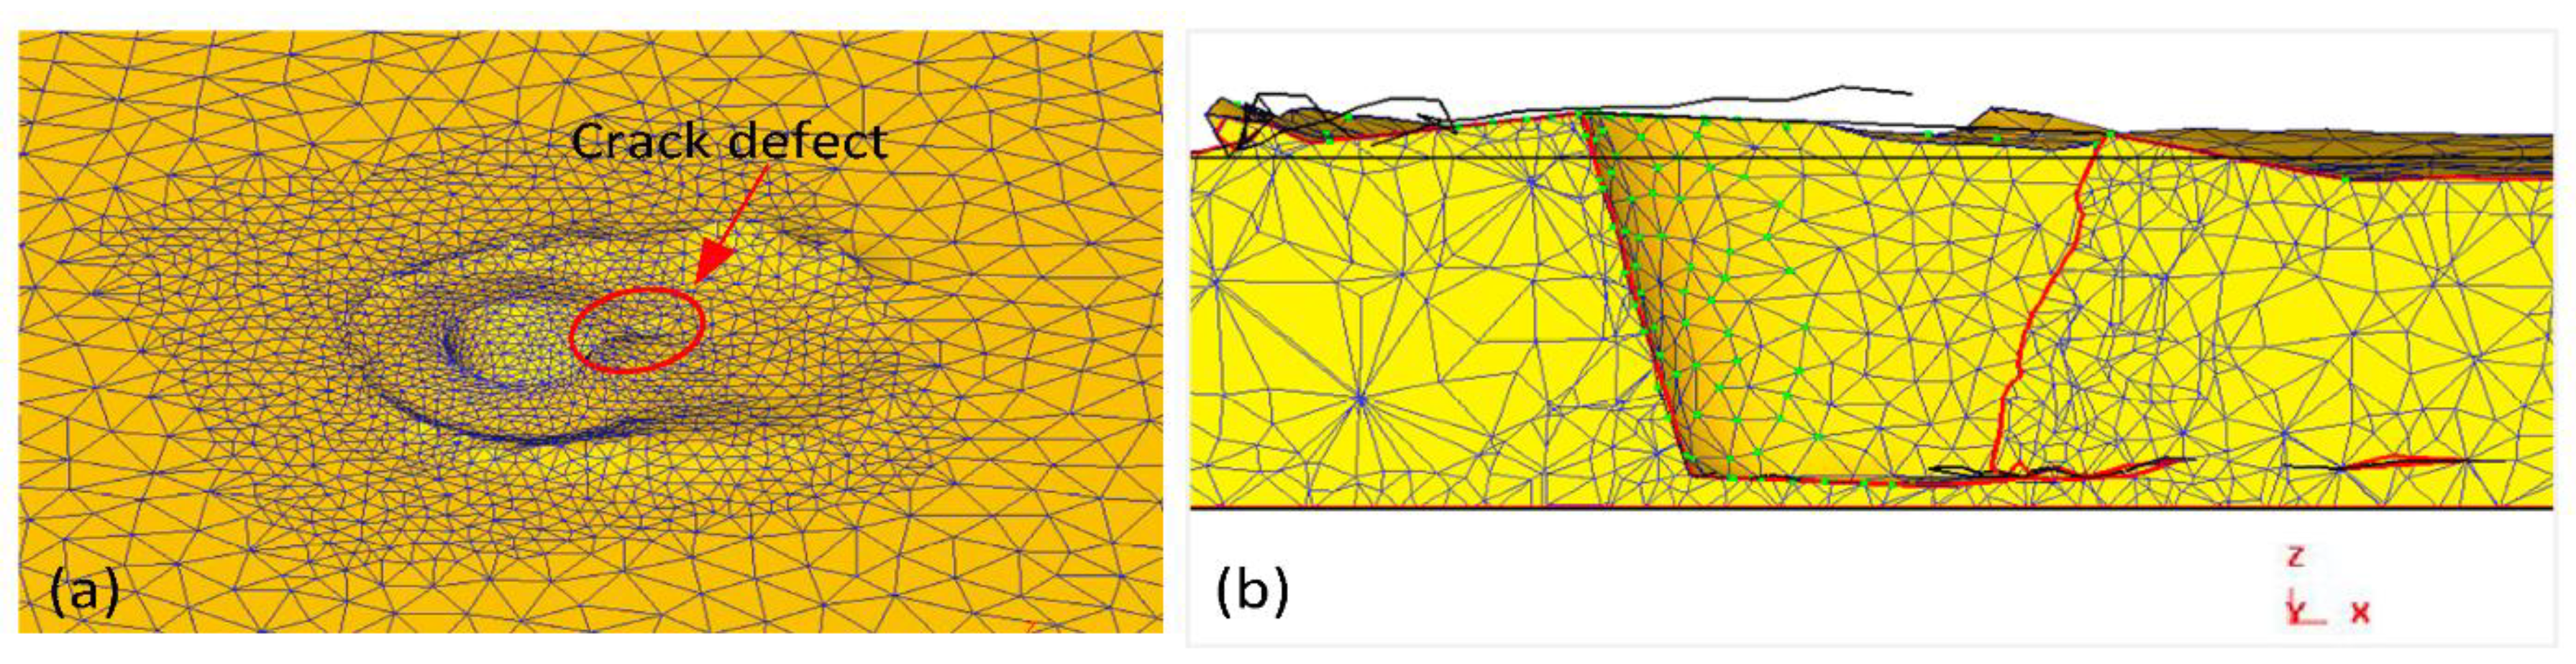
Figure 41.
The isosurface of flow stress is equal to 200 MPa for both FSW−C (left) and FSW−H (right) samples. [198].
Figure 41.
The isosurface of flow stress is equal to 200 MPa for both FSW−C (left) and FSW−H (right) samples. [198].
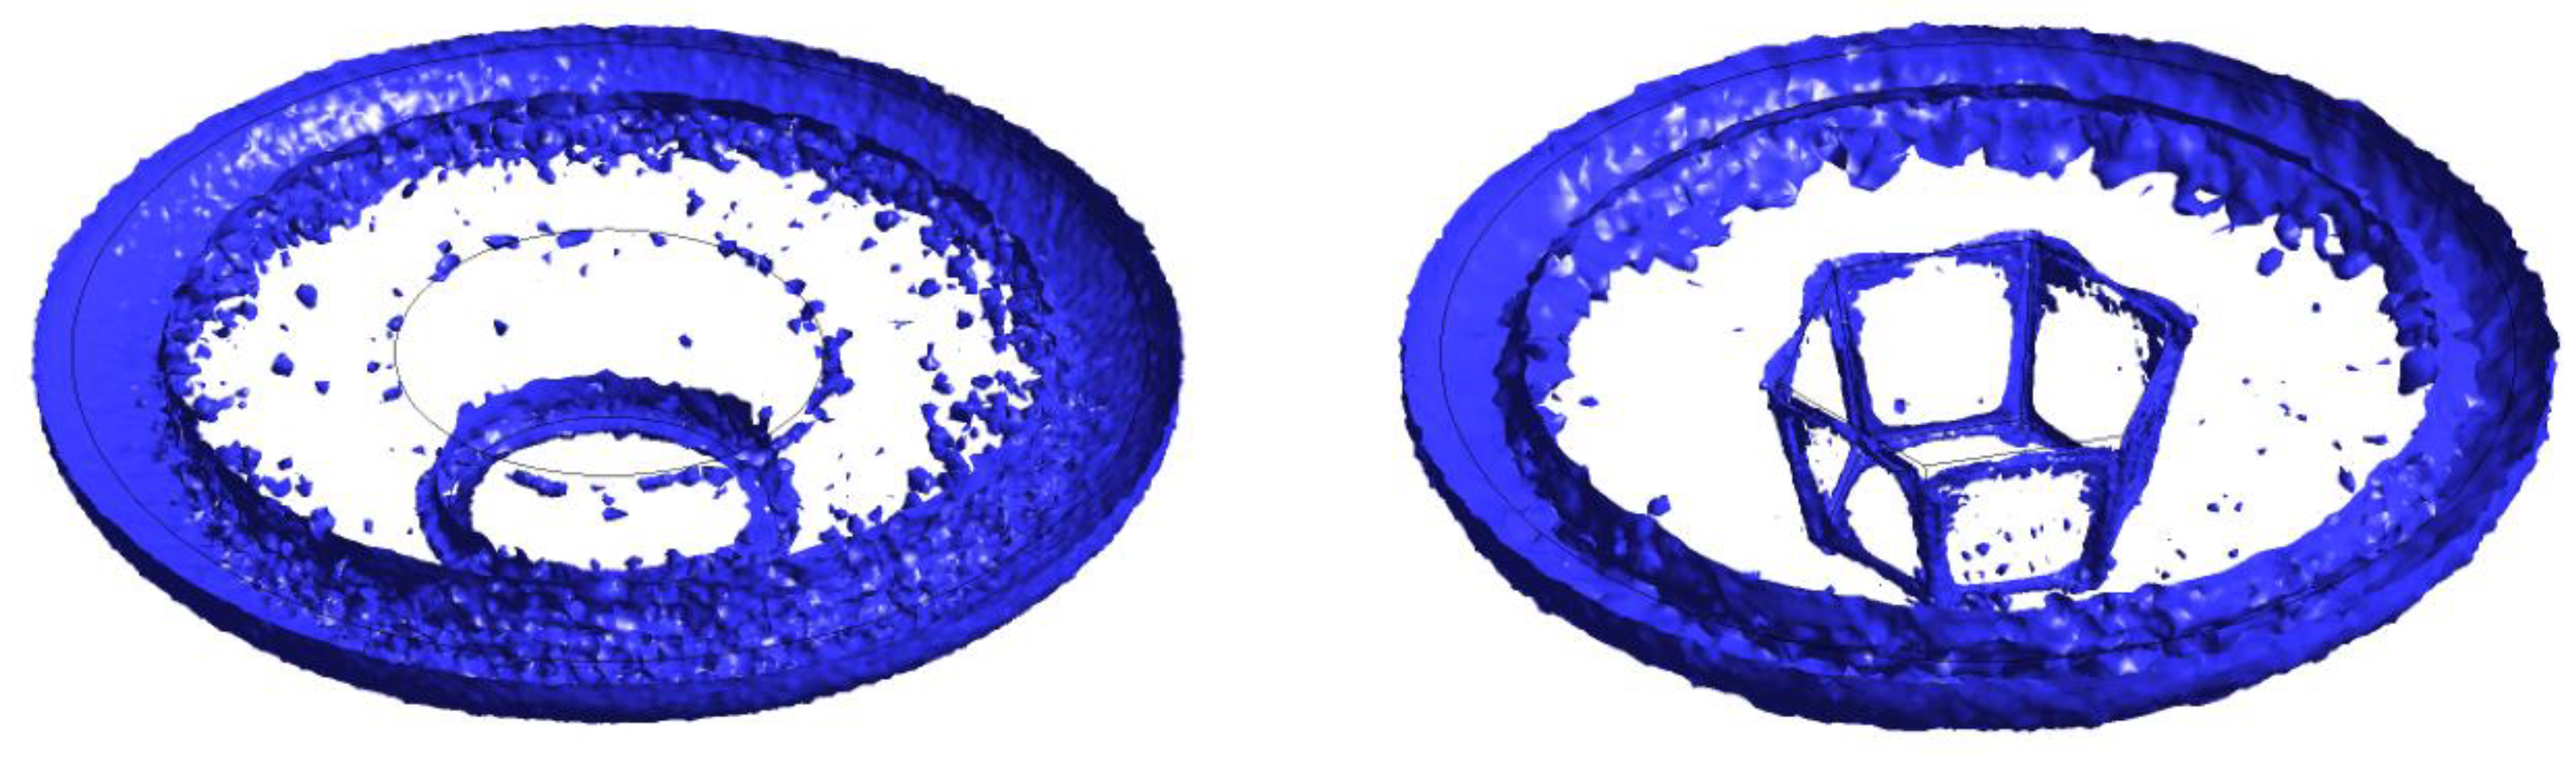
Figure 42.
The material flow on the top surface of the stir zone (a) retreating side (b) advancing side, and the cross-section (c) retreating side and (d) advancing side.
Figure 42.
The material flow on the top surface of the stir zone (a) retreating side (b) advancing side, and the cross-section (c) retreating side and (d) advancing side.
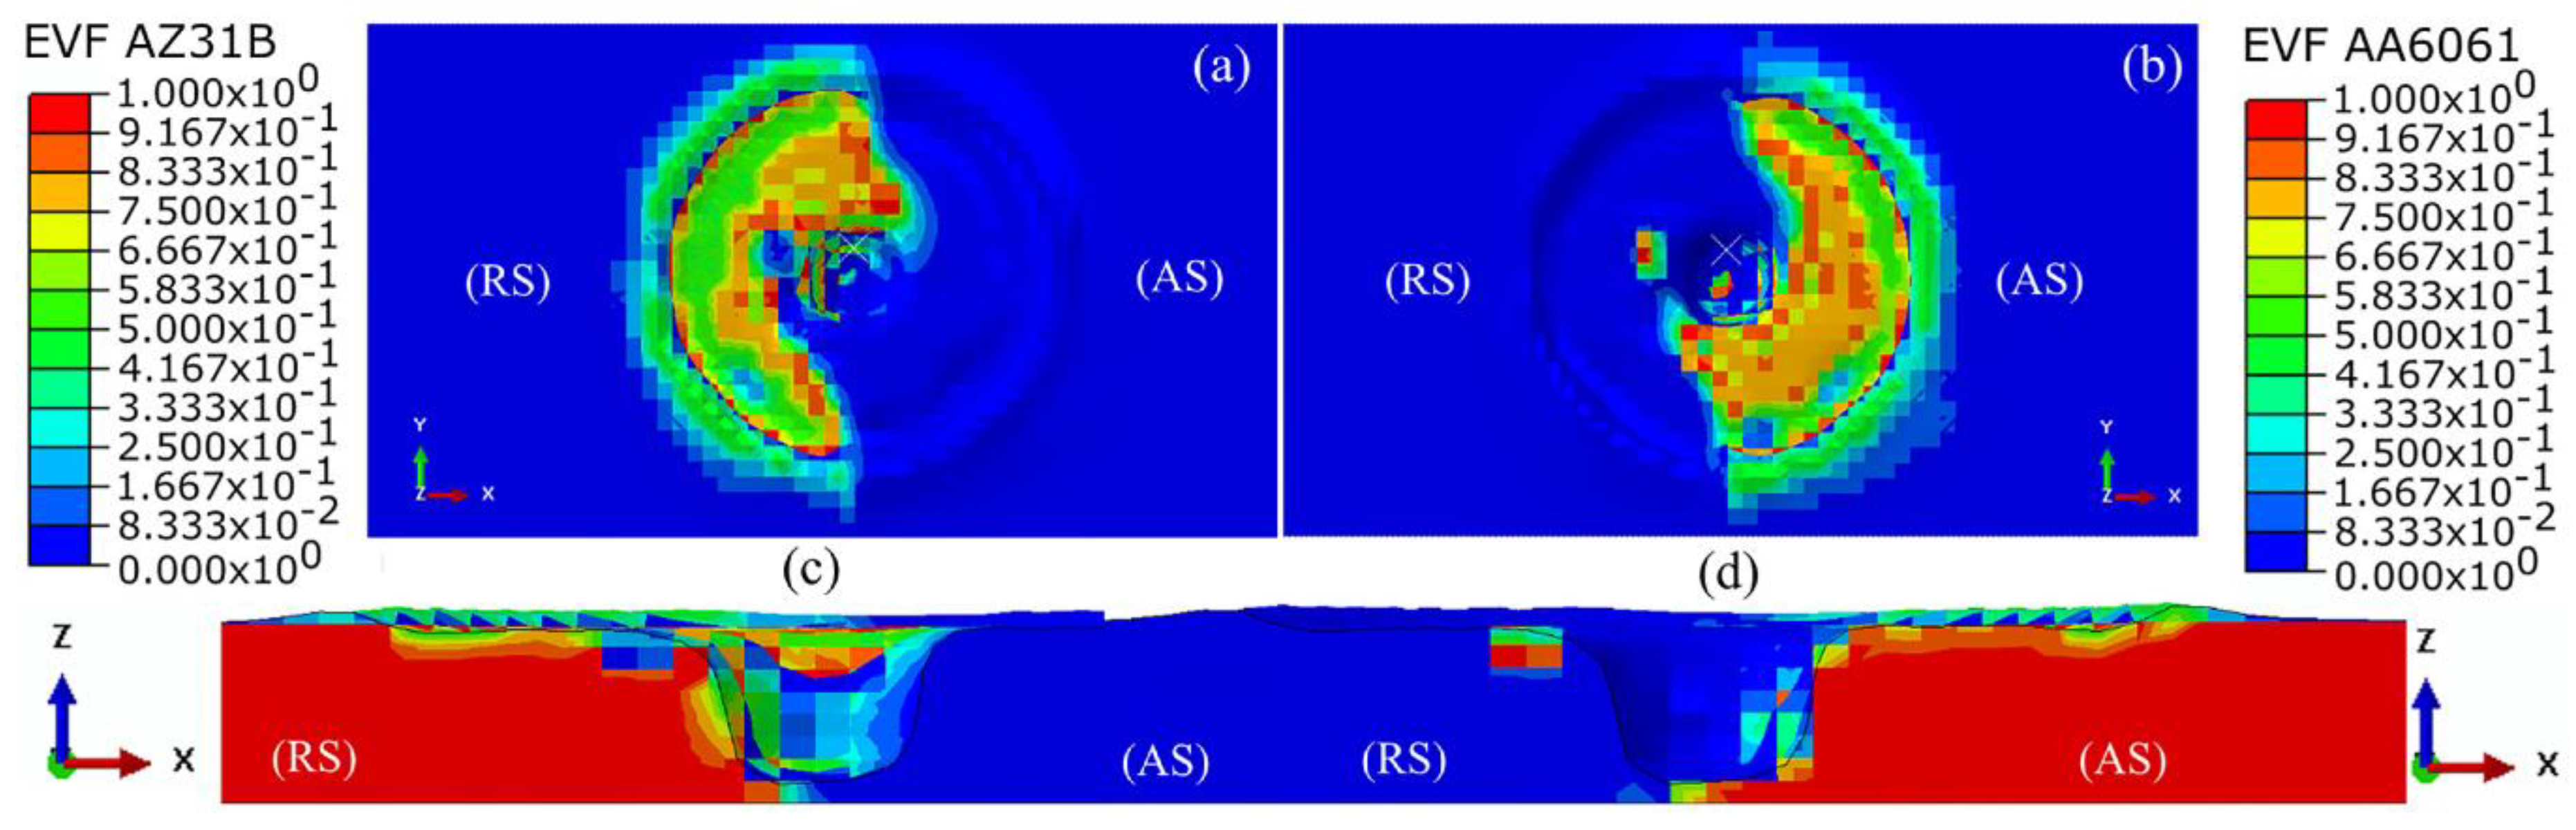
Figure 43.
Material flow in 3D separated and cross-section views in the DSFSW AZ91 magnesium alloy produced by different pin profiles of (a) trigonal, (b) square, (c) hexagonal, (d) inward conical, and (e) outward conical [201].
Figure 43.
Material flow in 3D separated and cross-section views in the DSFSW AZ91 magnesium alloy produced by different pin profiles of (a) trigonal, (b) square, (c) hexagonal, (d) inward conical, and (e) outward conical [201].
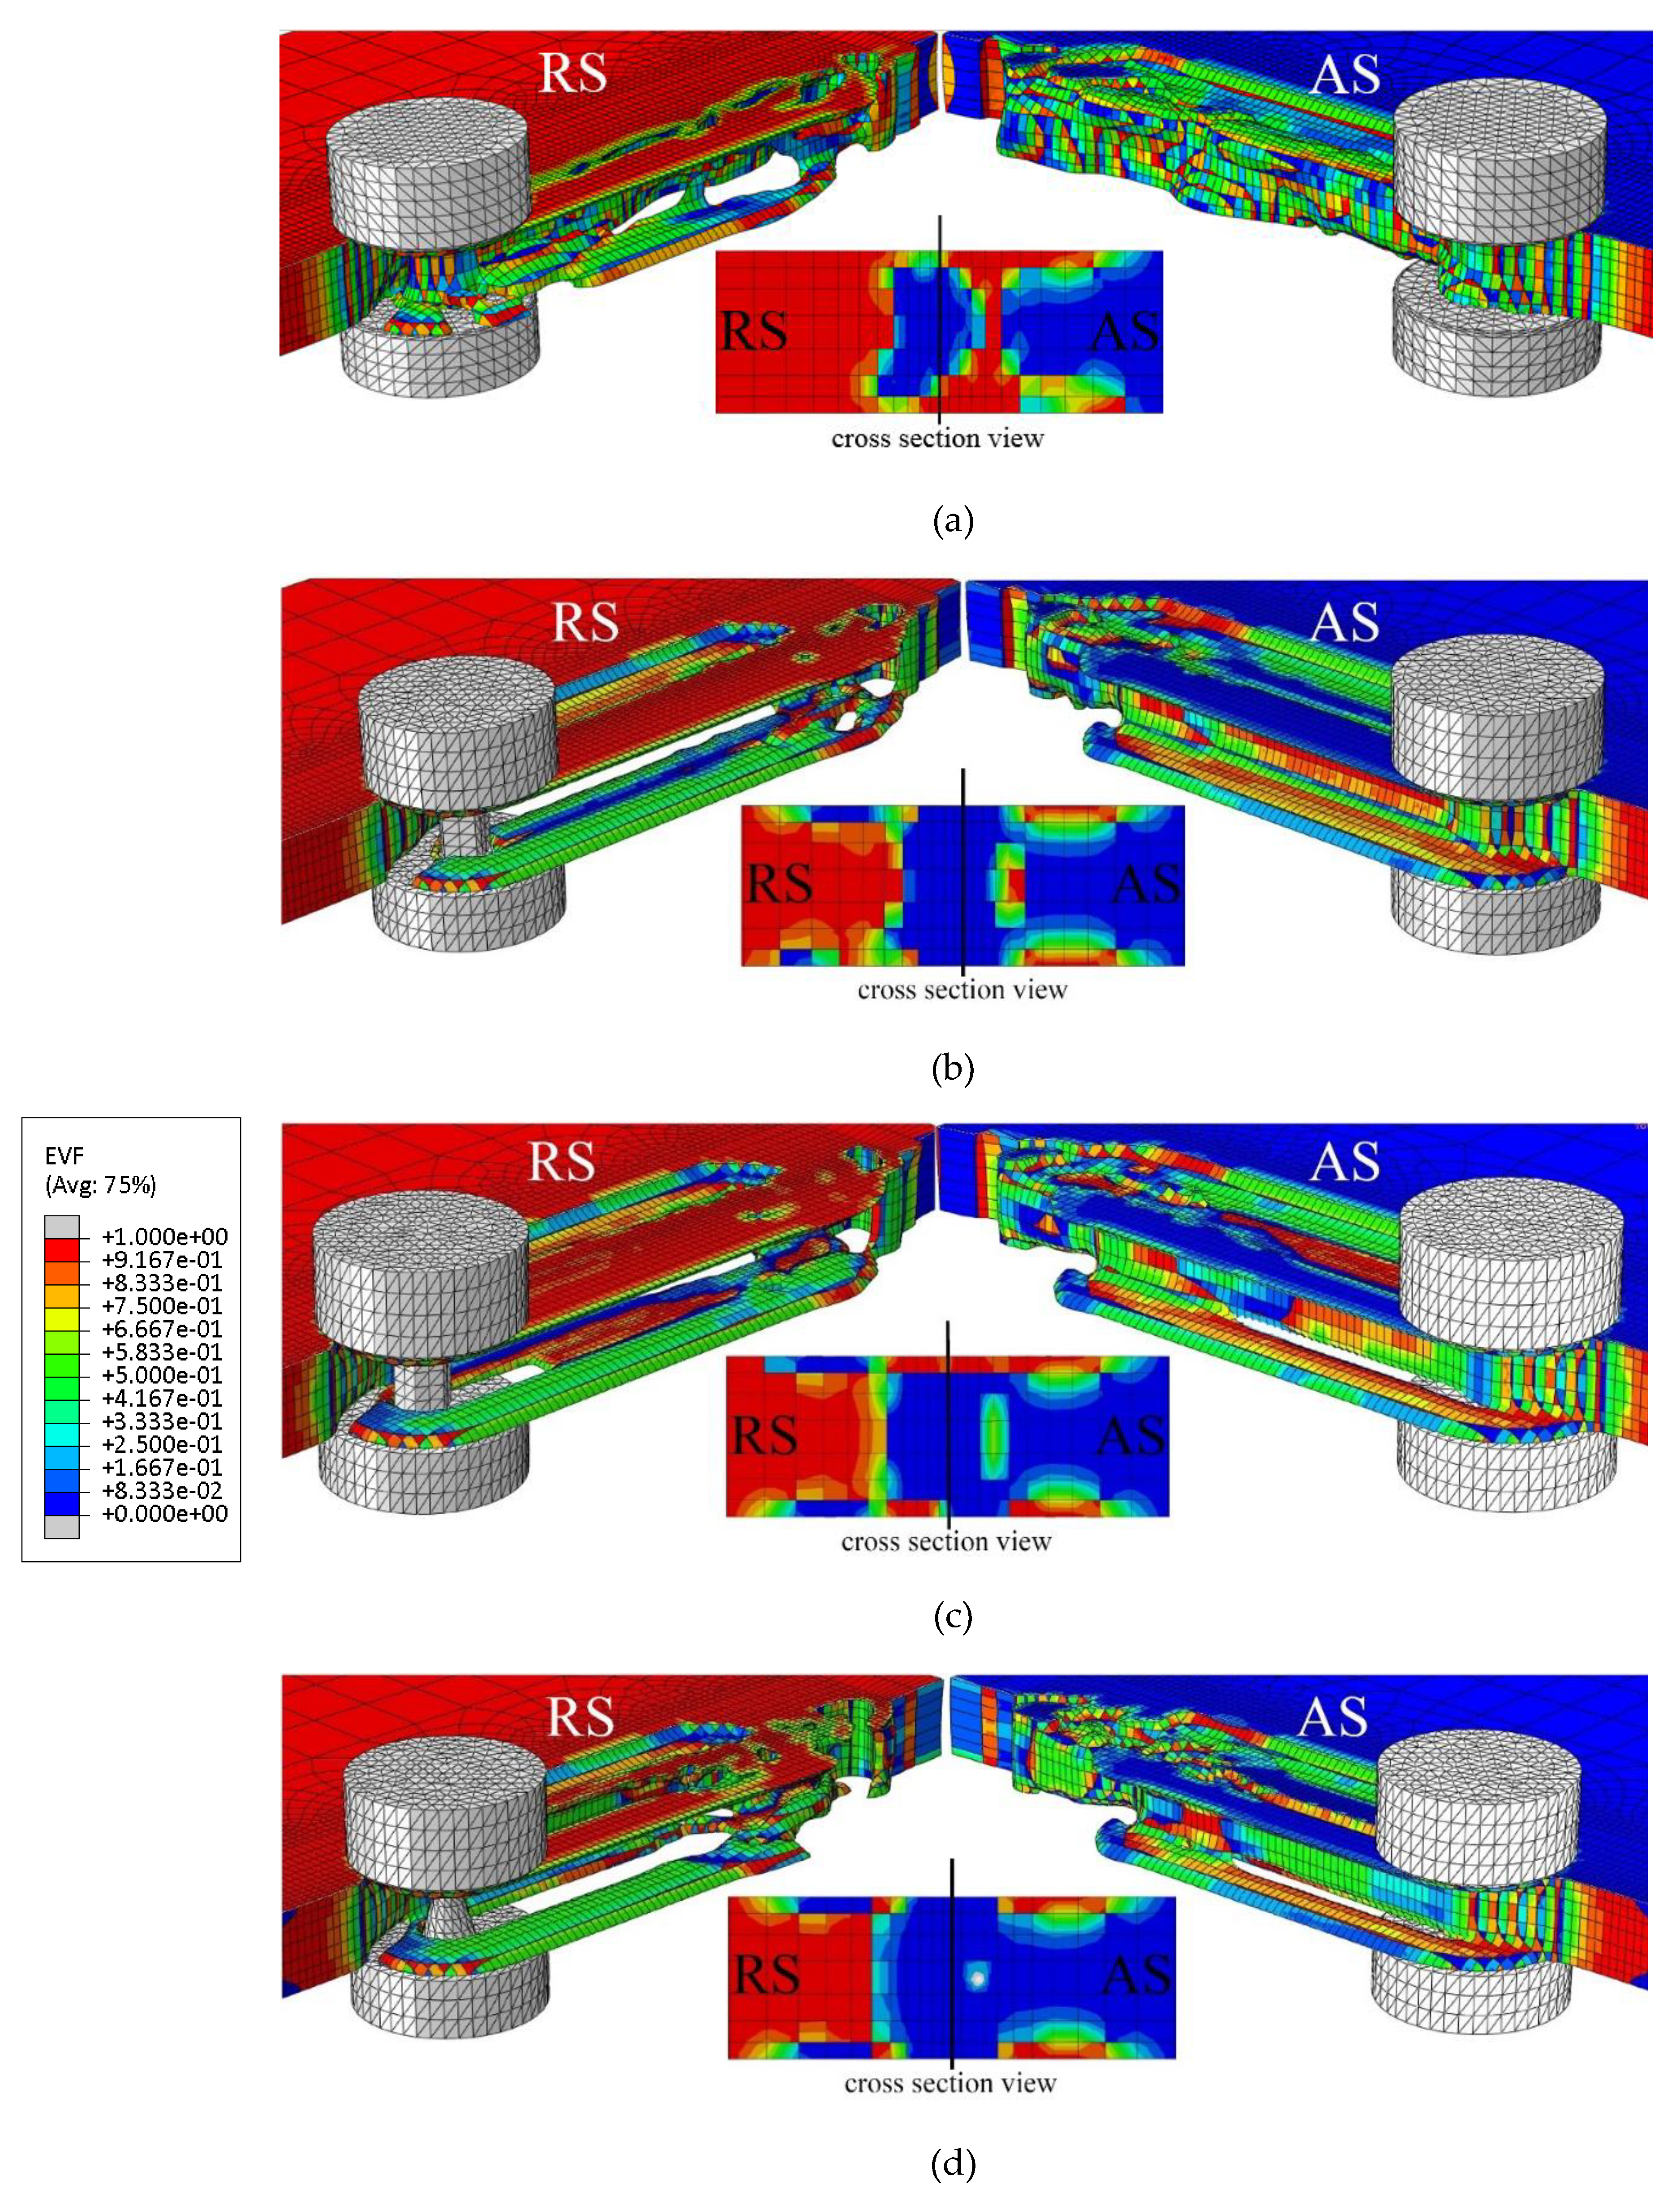
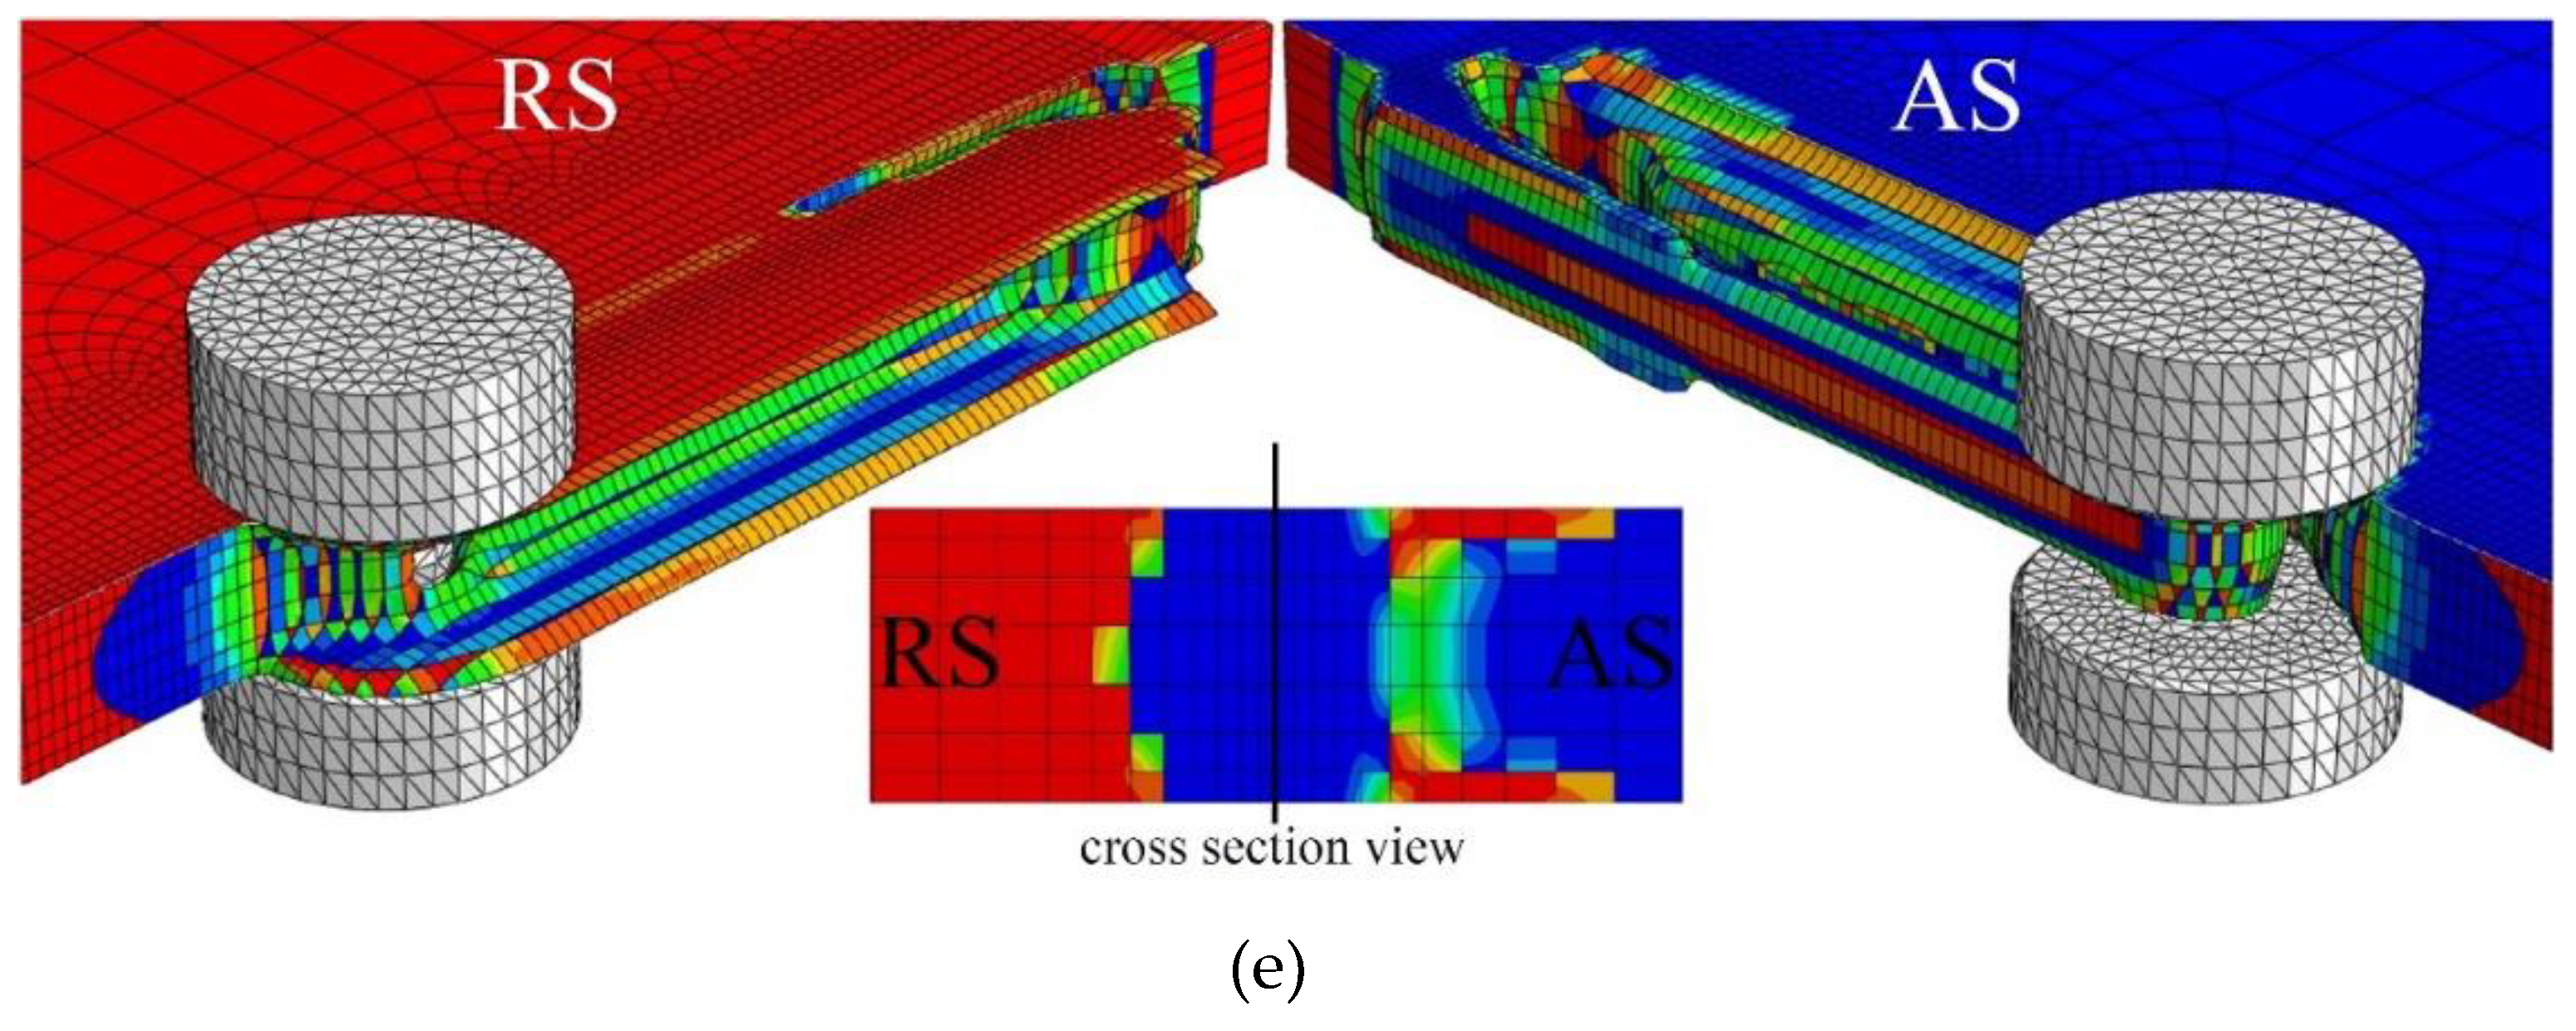
Figure 44.
The SZ formation in FSLW of Al-brass at different tool rotational speeds of a 6.5 mm/min, b 12.5 mm/min, and c 25 mm/min.
Figure 44.
The SZ formation in FSLW of Al-brass at different tool rotational speeds of a 6.5 mm/min, b 12.5 mm/min, and c 25 mm/min.
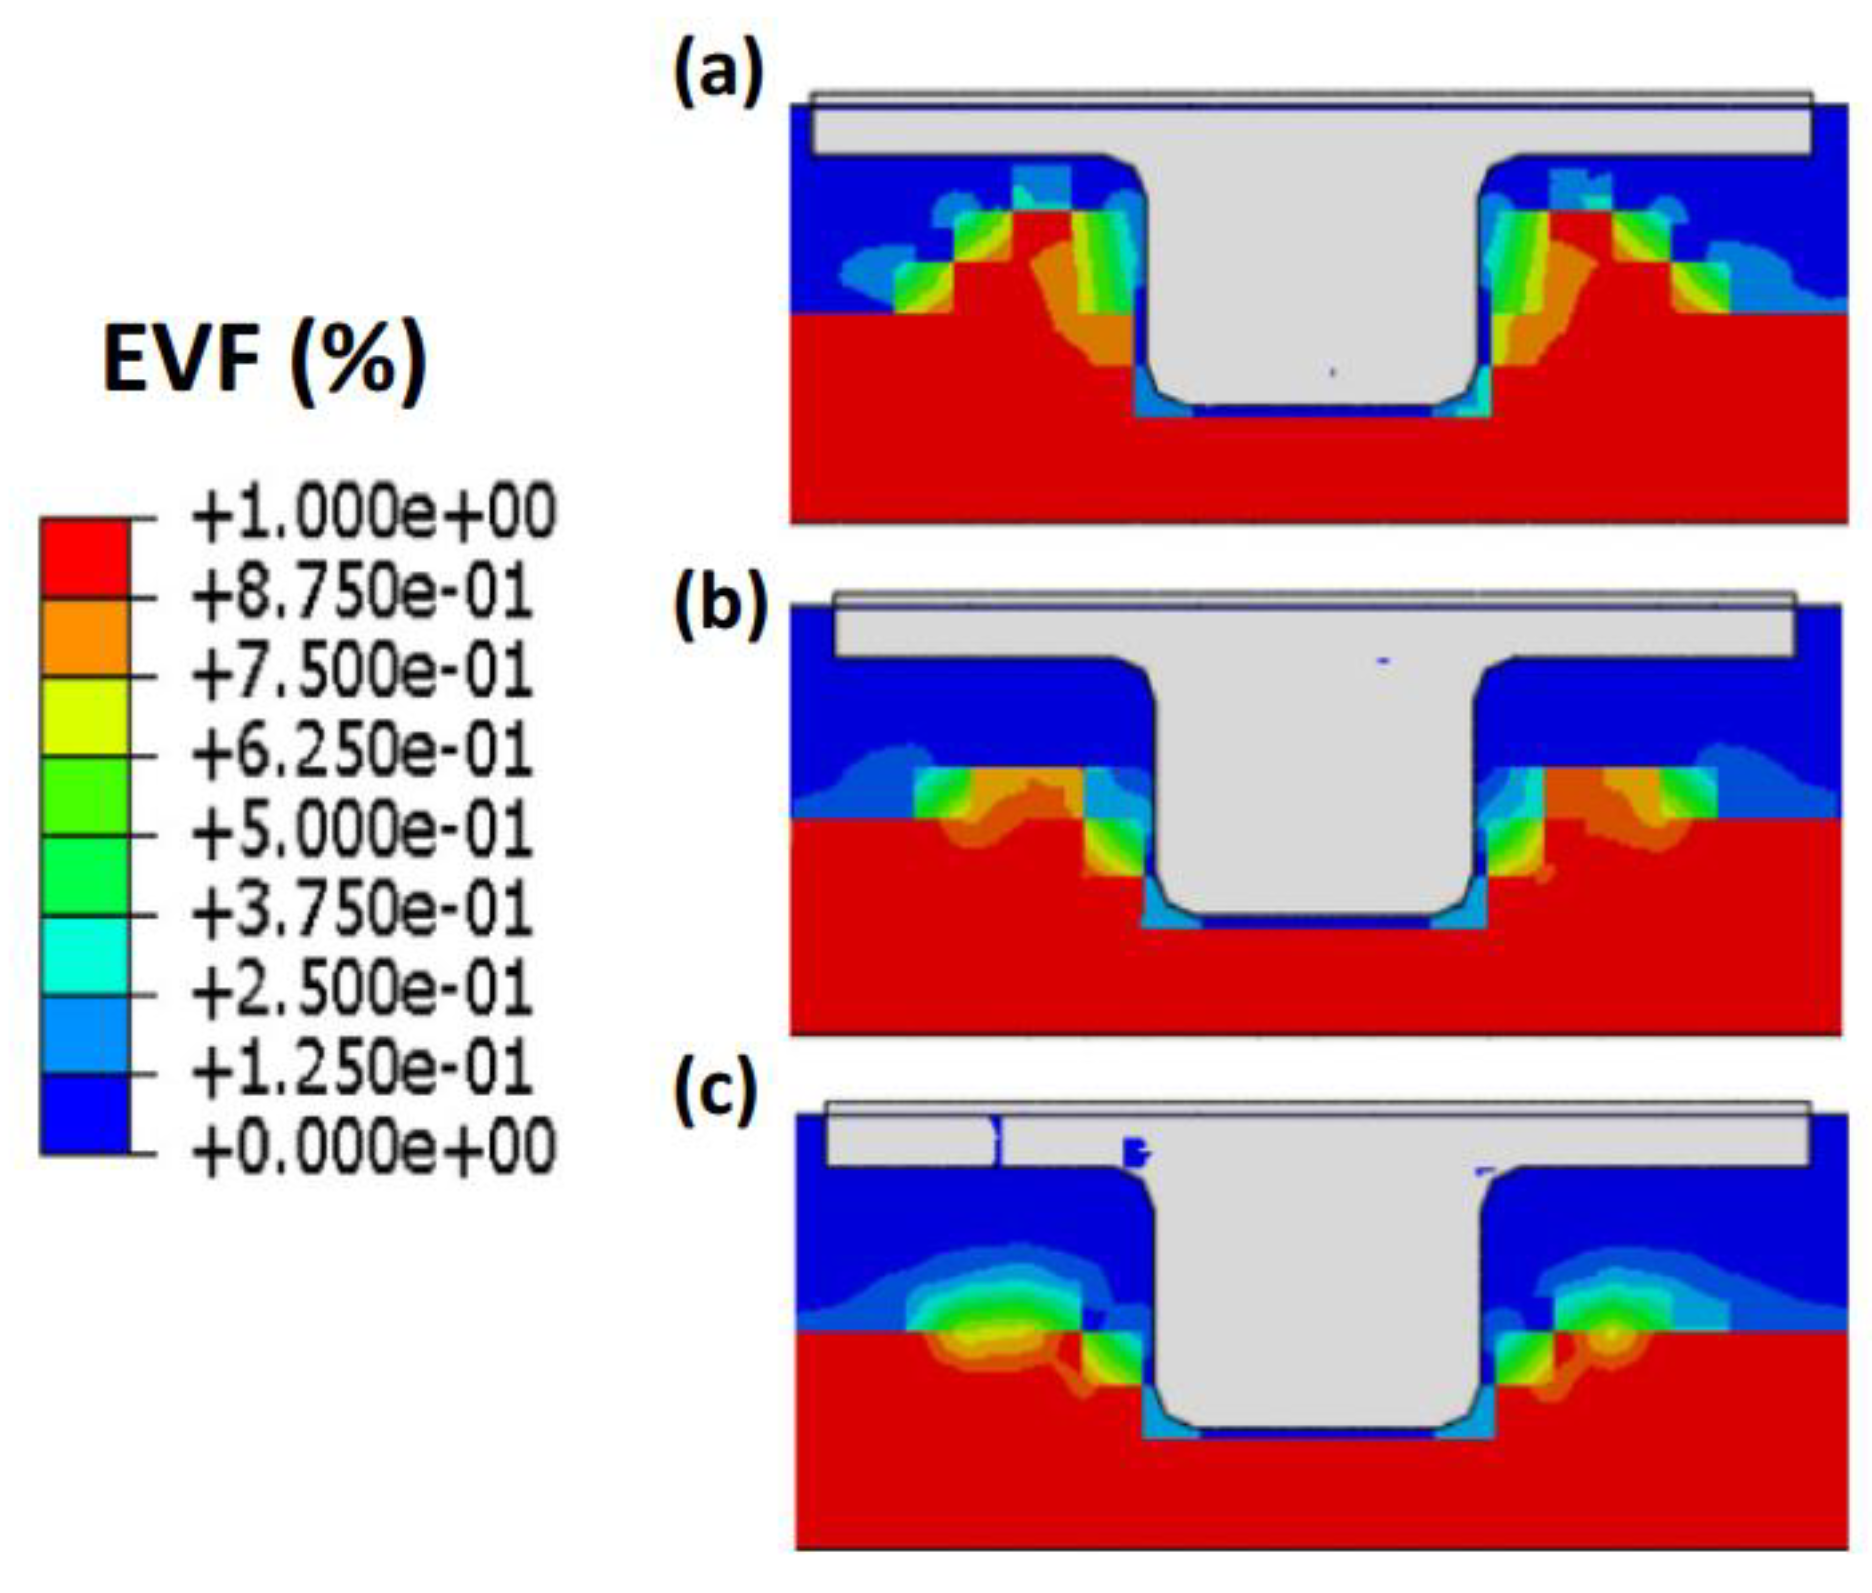
Figure 45.
Simulated and experimental microstructure of SZ for rotational speed, traverse speed, and shoulder diameter of (a) 900 rpm, 16 mm, and 120 mm/min, (b) 1120 rpm, 14 mm and 120 mm/min, (c) 900 rpm, 14 mm and 80 mm/min respectively.
Figure 45.
Simulated and experimental microstructure of SZ for rotational speed, traverse speed, and shoulder diameter of (a) 900 rpm, 16 mm, and 120 mm/min, (b) 1120 rpm, 14 mm and 120 mm/min, (c) 900 rpm, 14 mm and 80 mm/min respectively.
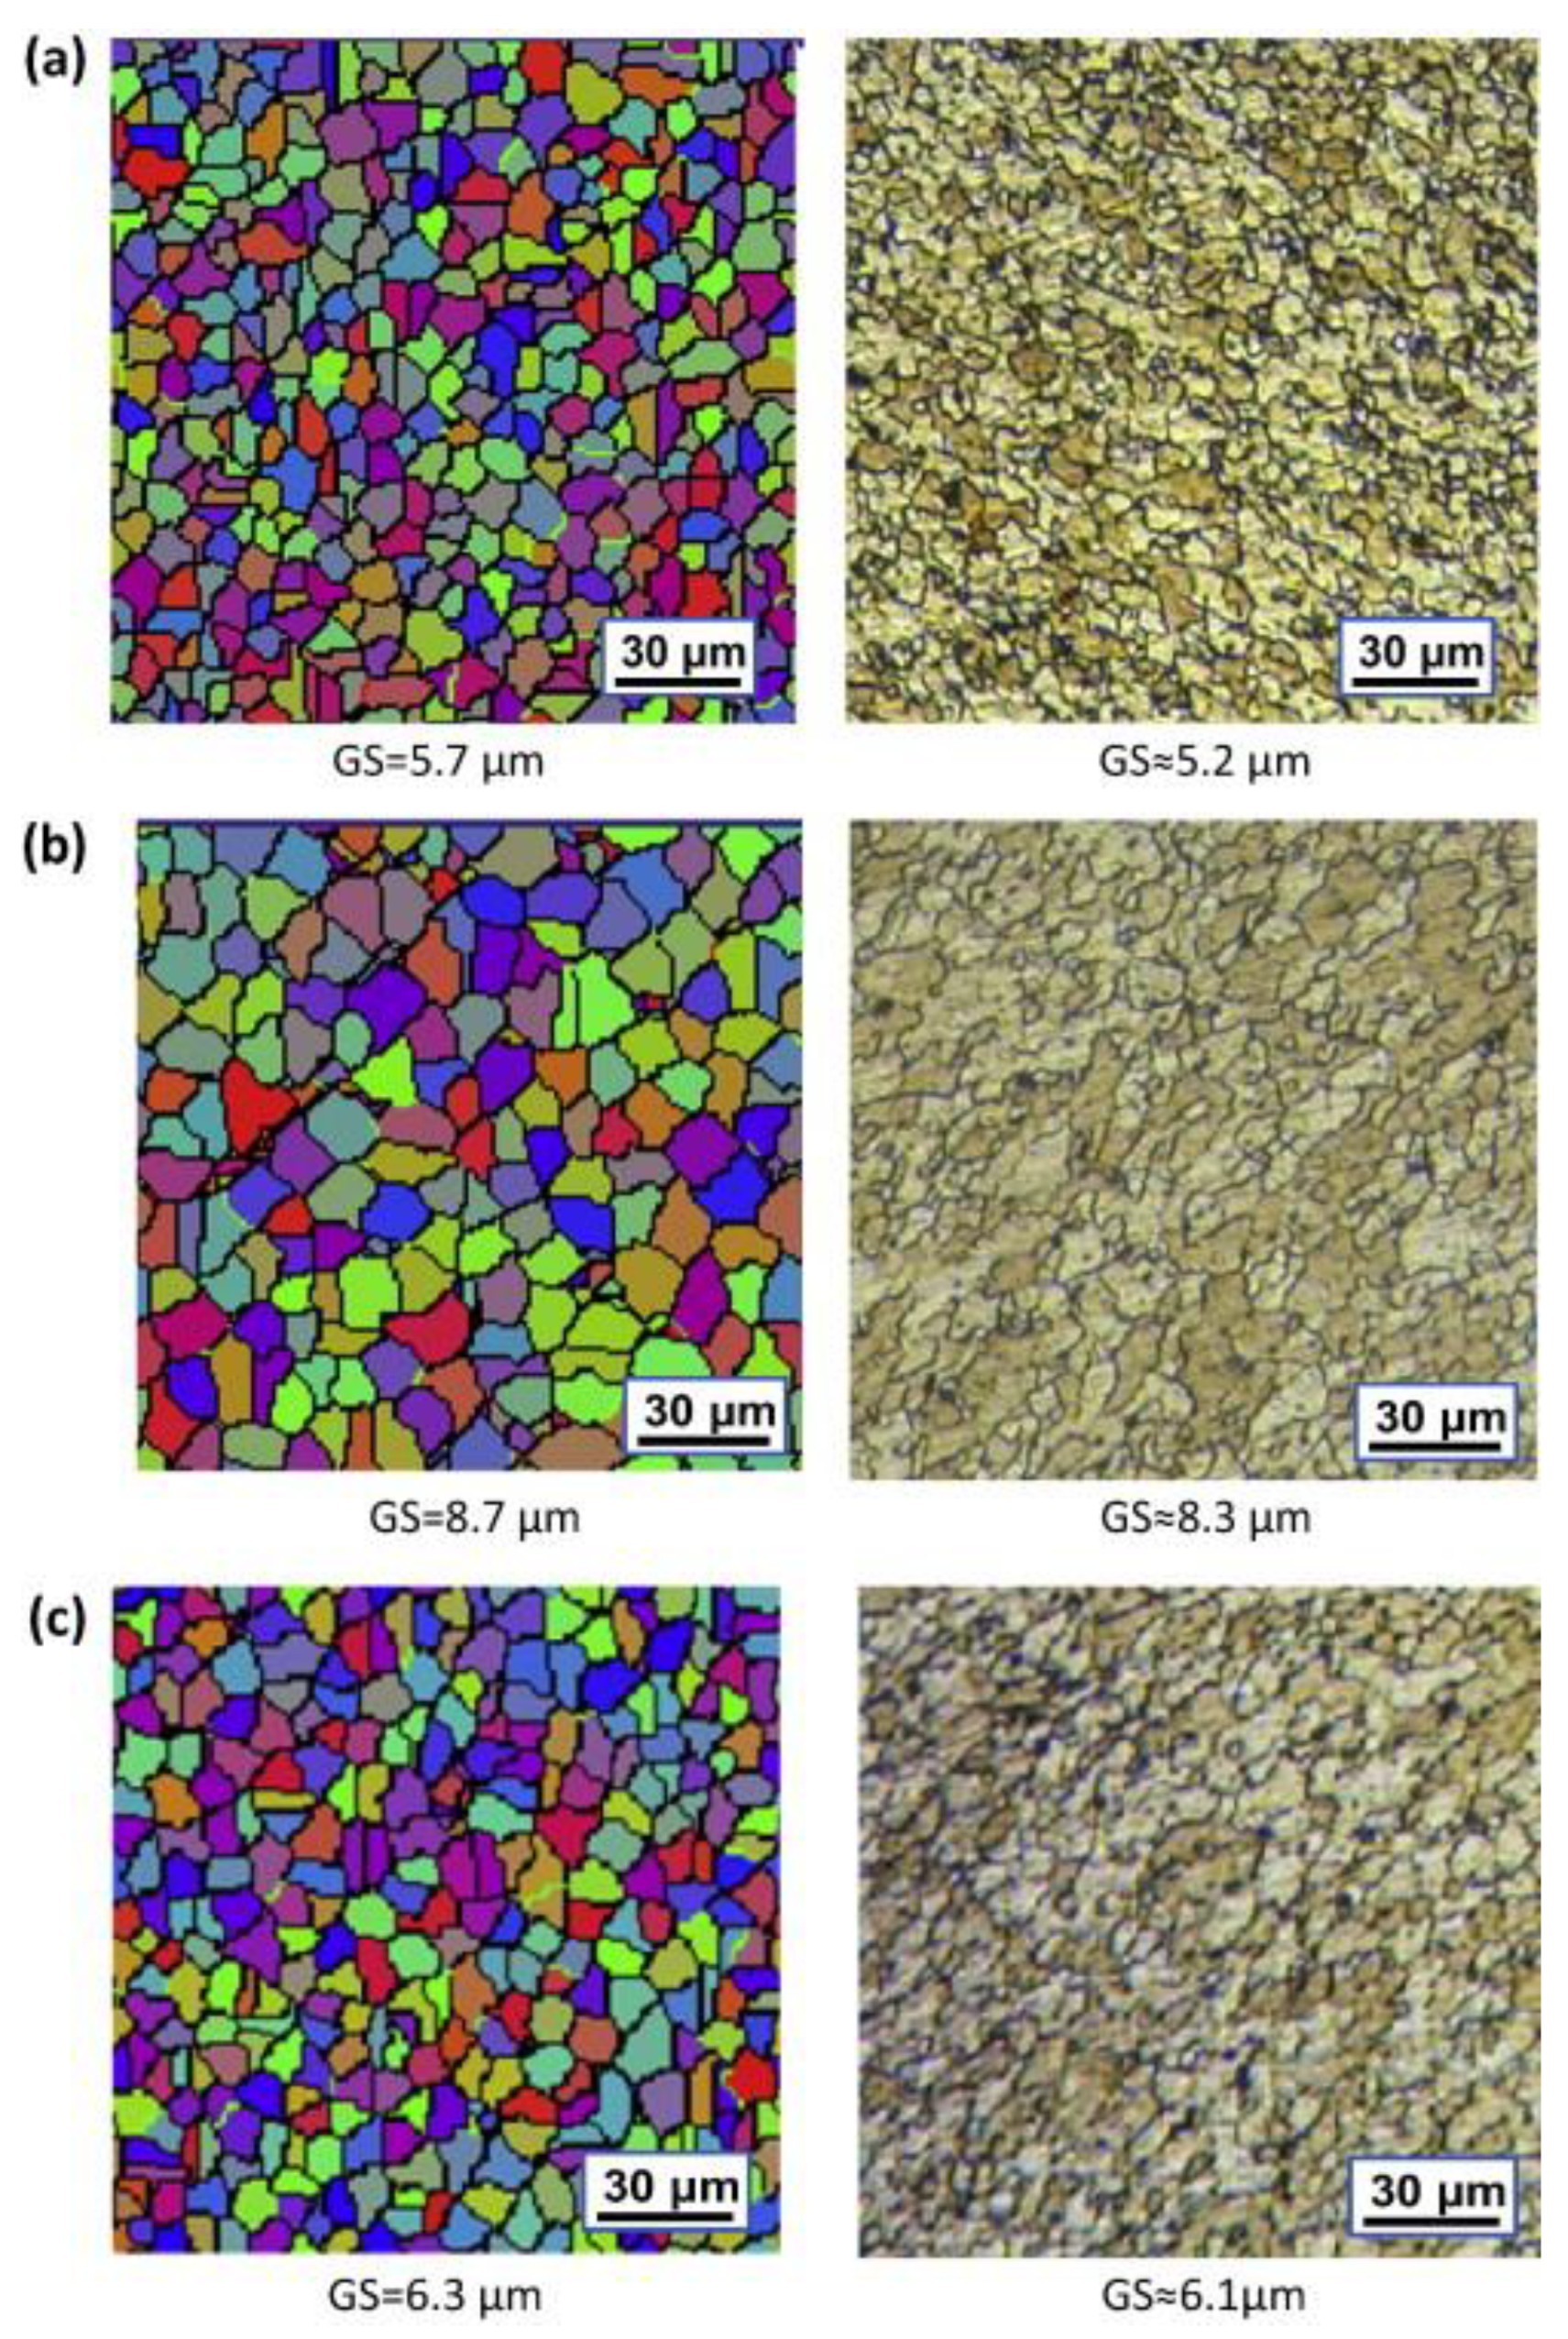
Figure 46.
The simulated grain structure in welds. (a) Schematic of selected points, (b) 800 rpm-100 mm/min, (c) 600 rpm-100 mm/min [227].
Figure 46.
The simulated grain structure in welds. (a) Schematic of selected points, (b) 800 rpm-100 mm/min, (c) 600 rpm-100 mm/min [227].
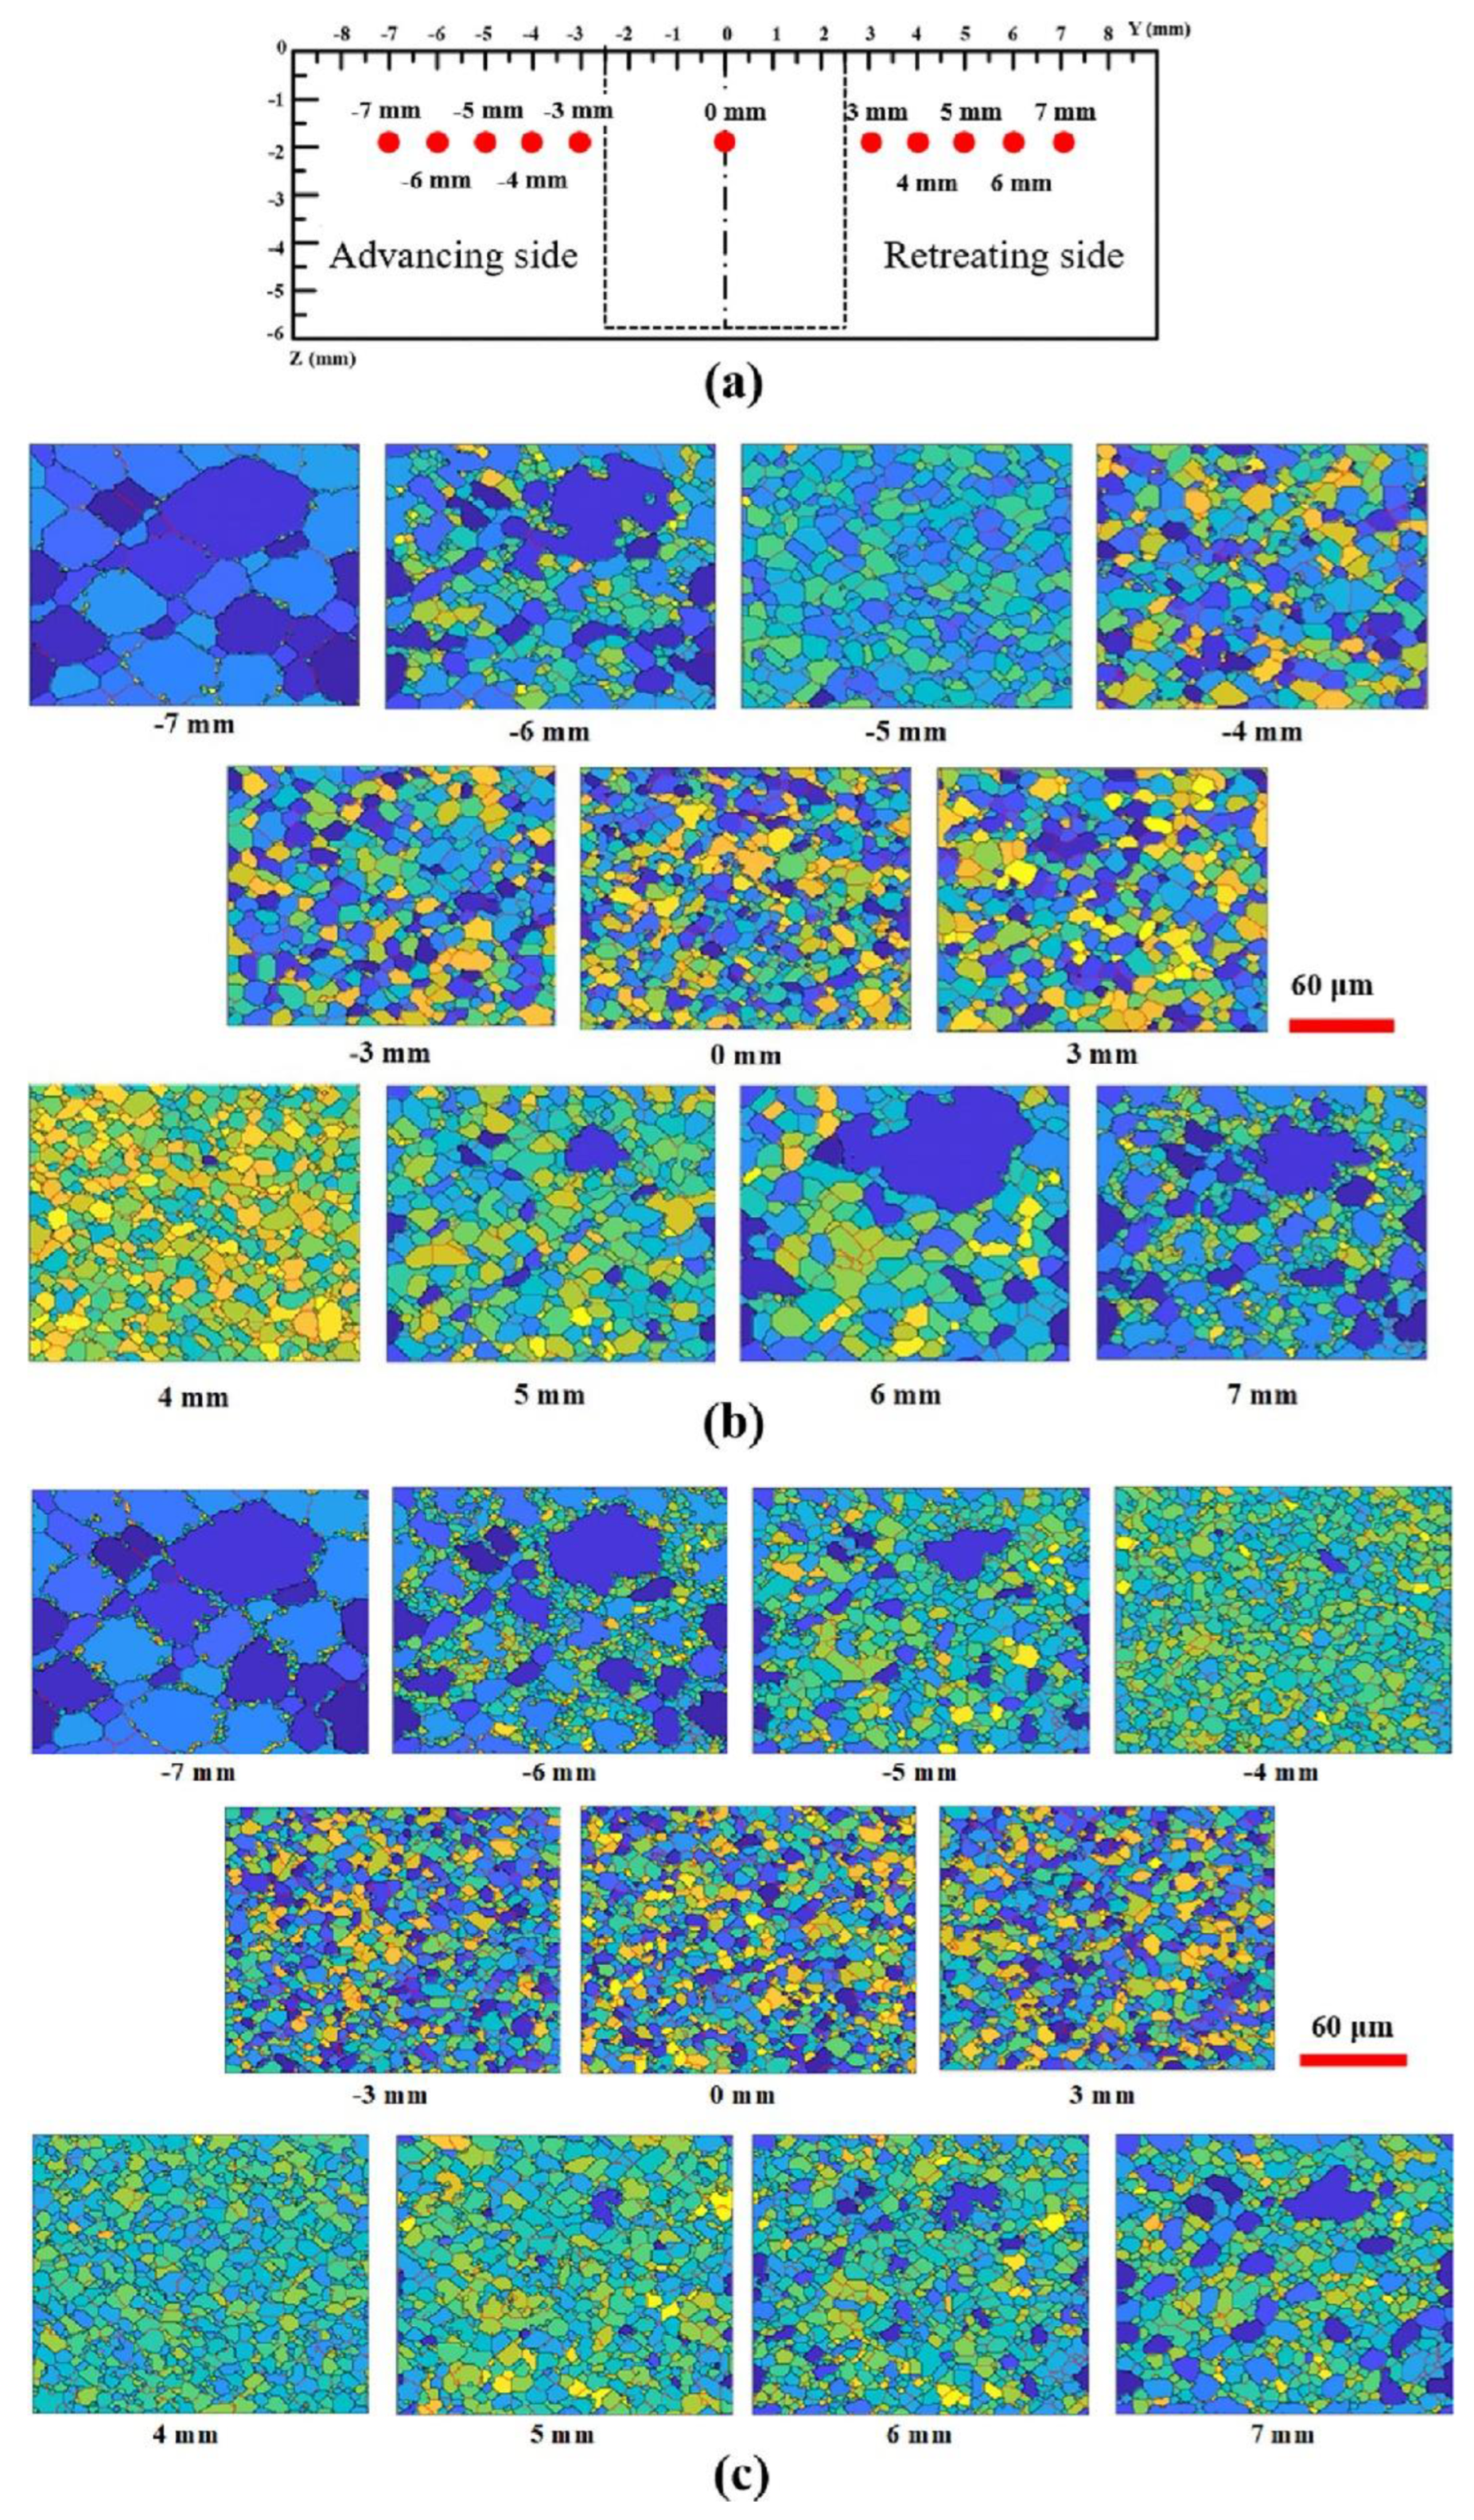

Table 4.
Effect of traverse speed and rotational speed on moment and forces.
| Traverse speed | Rotational speed | ||
|---|---|---|---|
| On pin | Longitudinal force | + | - |
| Axial force | ~ | + | |
| Lateral force | ~ | + | |
| Moment about the tool axis | ~ | - | |
| On shoulder | Longitudinal force | + | - |
| Axial force | - | + | |
| Lateral force | ~ | + | |
| Moment about the tool axis | ~ | - | |
| Total | Longitudinal force | + | - |
| Axial force | - | + | |
| Lateral force | ~ | + | |
| Moment about the tool axis | + | - |
Disclaimer/Publisher’s Note: The statements, opinions and data contained in all publications are solely those of the individual author(s) and contributor(s) and not of MDPI and/or the editor(s). MDPI and/or the editor(s) disclaim responsibility for any injury to people or property resulting from any ideas, methods, instructions or products referred to in the content. |
© 2023 by the authors. Licensee MDPI, Basel, Switzerland. This article is an open access article distributed under the terms and conditions of the Creative Commons Attribution (CC BY) license (https://creativecommons.org/licenses/by/4.0/).
Copyright: This open access article is published under a Creative Commons CC BY 4.0 license, which permit the free download, distribution, and reuse, provided that the author and preprint are cited in any reuse.


