

Submitted:
17 July 2023
Posted:
18 July 2023
You are already at the latest version
Abstract
In the last two centuries, land use change (LUC) has been the most important direct changes driver for terrestrial ecosystems. To contrast the consequent ecosystems degradation, forward-looking spatial policies and target landscape and land-use planning processes, promoting a sustainable land use change, are needed. The present paper proposes a framework of action including different landscape planning and ecological approaches: from the spatial modelling to recognize the LUC and build different scenarios, to the ecosystem services (ESs) assessment to evaluate the possible environmental impacts. Three different scenarios were built: Trend, No-Tillage and Energy crops. The Sediment Delivery Ratio and Carbon Storage and Sequestration ESs were assessed and compared for each scenario. The aim of the paper is to support decision-makers and local communities into the landscape planning process. Results show that a regional development in line with past trend could lead to further land degradation. Instead, the two scenarios proposed in compliance with EU policies, could bring benefits only if related to moderate LUCs and respecting the naturally grass-vegetated land. From the local to global scale, a guided and shared LUC management allows implementing sustainable development, basing on a deep knowledge of physical-environmental but also social and economic issues.
Keywords:
Land-use change
; Land-use planning
; Ecosystem services
; Erosion
; Climate change
; Agricultural policies
; Soil tillage
1. Introduction
Natural or human-induced factors that directly or indirectly cause a change in an ecosystem are defined as “drivers” (MEA, 2005). In the last two centuries, land use change has been the most important direct changes driver for terrestrial ecosystems. Habitats endangerment, nutrient cycle alteration, hydrogeological risk implementation, etc. (Agarwal et al., 2002; Foley et al., 2005), are some of effects related to LUC driver, which are affecting the quality and permanence of ecosystems and human well-being, at different spatial and temporal scales. Both the assessment and the management of drivers and, consequently, their effects are strategic and complex (MEA, 2005).
In such a situation, it is evident the need for spatial policies promoting a sustainable land use change. Counteracting unguided LUC, or at least limiting or mitigating its effects, is one of the global challenges that academia and international organizations, such as the local communities, are facing. In the last decade various landcsape policies have promoted sustainable land use: the Community Agricultural Policy (CAP) (EC, 2018; De Castro et al., 2020; Pe’er et al., 2020), the European Strategy for Biodiversity 2030 (EC, 2011; EC, 2013; EC, 2020a; Rinaldi , 2021; Hermoso et al., 2022), the Green Deal (EC, 2019; Montanarella & Panagos, 2021), the 2030 Agenda (Ruiz-Mallén & Heras, 2020; UN, 2015), the Renewable Energy Directive I, II, III (Bórawski et al., 2019; EC, 2020b; Ike et al., 2020), etc., all recognize a fundamental role for the landscape and its correct management and use, even if related to different interests: agricultural uses, natural areas, bioenergy, transport, housing, etc. As consequence, the different policies refer to set objectives without mentioning where and how they have to be acheived (Primdahl, 2014; Hersperger et al., 2020). The soil, which is the first limited resource on the Planet, is the focus of interest of several development policies (Amudson, 2020; Montanarella & Panagos, 2021) and their achievement, in a short time, could lead to excessive soil consumption or to a conflict among the objectives (agriculture, afforestation and nature conservation policies) (Randelli & Martellozzo, 2019). In this regard, policy makers should be able to analyze the productive potential of goods and services and then to find a synthesis between human necessities and preservation of natural resources, which shouldn’t be seen as alternative to one another, but rather as a unique and inseparable issue (De Groot et al., 2010; Zhou et al., 2019; Wu, 2021).
Solid methodologies are essential to implement effective policies. The land-use modelling (Veldkamp and Lambin, 2001; Ren et al., 2019; Verburg et al., 2019; Cremen et al., 2022) or multi-criteria decision analysis (MCDA) (Malczewski, 2006; Montibelle et al., 2006; Romano et al., 2015; Wotlolan et al., 2021) offer valid opportunities to investigate spatially explicit scenarios. In addition, to assess the possible LUC impacts on evnironment, the ecosystem services (ESs) approach (Costanza et al., 1997; MEA, 2005; Costanza et al., 2017; Hernández-Blanco et al., 2022) is considered a strategic tool to pursue sustainable development and include the environmental issues into the land-use planning and management strategies (Albert et al., 2014; Comino et al., 2014; Albert et al., 2016; von Haaren et al., 2019). ESs are the set of benefits that humans derive from ecosystems and are classified in supply, regulation, socio-cultural and supporting services (MEA, 2005; TEEB Foundations, 2010; TEEB Synthesis, 2010; Haines-Young & Potschin, 2012), and are usually assessed by bio-physical, socio-cultural and monetary ways (Fisher & Turner, 2008; Häyhä & Franzese, 2014; Finisdore et al., 2020; Ndong et al., 2020). Their evaluation is essential for analyzing the state of well-being of a landscape, monitoring it over time, supporting building of LUC scenarios. The ESs assessment must be integrated in the landscape planning process, but, despite the scientific community has long signaled the need, the application of integrated evaluations is still not widespread: there’s still a lack of knowledge needing to be filled, especially as regards universality of methods and easiness of application in environmental impact assessments (Koschke et al., 2013). The main difficulties in the assessment process are related to the multiplicity of ESs typologies to consider, the assessment methods available and the subjects-stakeholders involved in the evaluation process, together with the numerous points of contact with the landscape planning and the human well-being elements. Anyway, an integrate use of land-use modelling and ES analysis, their mapping and assessment, can provide a methodological framework in support of decision-makers choices (De Groot et al. 2010; Shoyama and Yamagata, 2014; Zhang et al., 2015). The value of ESs can be expressed both in qualitative and in quantitative terms, in compliance with the socio-cultural or monetary or physical assessment ways. The land-use/cover recognition is the base for their assessment, specifically in broad level landscape analysis. The scientific literature is rich of studies based on empirical land-cover dependent evaluations (Koschke et al., 2012; Costanza et al., 2014; Potschin & Haines-Young, 2016; Adem et al., 2023). One of the widely used evaluation methods is the Benefit Transfer Method (Richardson et al., 2015; Zhou et al., 2020; Johnston & Wainger, 2015), in which values are commonly determined in relation to different land-cover types and their spatial pattern (Verhagen et al., 2016). Closely linked to the land cover composition and configuration is the issue of landscape management: land management in addition to physically characterizing it, affects deeply the overall ES provision, as it can improve systems efficiency and environmental quality (Caride et al., 2012; Koschke et al. 2013; Panagos et al., 2015). Accordingly, different kinds of land management may determine different outputs of ESs, supported by new and more articulated assessment methods that integrate expert opinions and spatial modelling tools (Costanza et al., 2014; von Thenen et al., 2020; Marino et al., 2022).
Considering this, implementing the land use management in compliance with different polies and development strategies, directly influences the land-use, the human activities, their environmental impacts and ESs supply, avoiding or, at least, mitigating negative effects of LUCs.
The present paper builds three different scenarios of land-use change in Campania region (southern Italy) and assess their possible impacts by means of the ESs theory. The Campania region, since the sixties, was subjected to substantial LUCs characterized by the complexity of local dynamics. In compliance with the past trend, it is possible to hypothesize that it is going to undergo an important LUC in the coming years (Pindozzi et al., 2013; Cervelli et al., 2022), especially related to the depopulation of inland areas and the abandonment of agricultural uses inside these contexts, with consequent problems related not only to loss of production and income, but also to the landscape maintenance and care. Starting from the past development awareness, a first scenario, resulting from the projection of the dynamics of the last 12 years, was developed. In addition, two intervention scenarios have been taken into consideration, in compliance with different EU and national landscape intervention policies:
- -
- the possible introduction of energy crops, as an alternative source of income for farmers, in compliance with RED I, II, III policies,
- -
- the no-tillage practice, as an alternative measure focused on erosion prevention, in compliance with the CAP’s aim (“ACA3 - Reduced soil tillage techniques” Action 3.1 - Adoption of no-till / “No tillage” (NT) seeding techniques; Action 3.2 - Adoption of minimal tillage / “Minimum tillage” (MT) and/or band working techniques/strip tillage).
The scenarios are closely related with the soil erosion issue which, in many Mediterranean areas, represents the first step towards progressive desertification (Caprioli and Tarantino, 2006). Soil erosion is mainly due to climate conditions, soil composition and land management (Smith & Wischmeier, 1962; Meyer & Wischmeier, 1969; Pimentel & Kounang, 1998; Nearing et al., 2004; Xiong et al., 2019; Borrelli et al., 2020). Since first two factors are not directly manageable in compliance with human policies, the land management policies play a fundamental role in the mitigation of the phenomenon, encouraging or sustaining by incentivization new crops in place of the currents (Guerra et al., 2016), as well as conservative agricultural practices like cover cropping and reduced tillage (Panagos et al., 2015). In the present study, in compliance with the erosion aspects and via the Sediment delivery ratio service (InVEST Software), the influence of new crops and tillage on soil loss were deepened. A particular attention was given also to soil carbon, considering the positive relation that it has with erosion issue and in general with soil bio-physicochemical properties (Lal, 2004). Moreover, the analysis of landscape carbon stock intended to relate a typically regional-concerning issue, such as erosion, with one of the greatest international-concerning issue, that is global warming. In the present paper, the Carbon Storage and Sequestration (CSS) service (InVEST software) was assessed, as measure to contribute to Earth’s climate change mitigation. The landscape management, affecting the ecosystems survival, play an important role also in removing greenhouse gases (GHGs) such as CO2 from the atmosphere: the landscape composition with forests, grasslands, peat swamps, and other terrestrial ecosystems collectively store carbon (Lal, 2004; Natural Capital Project, 2023), keeping CO2 out of the atmosphere, where it would contribute to climate change.
The aim of the present work is to support decision-makers and local communities to achieve a sustainable development, by means of the building of different LUC scenarios for agricultural lands and assessing and comparing their effects on future provision of ESs.
In the landscape planning process, the choice among different scenarios is a complex phase, which includes many stakeholders, different points of view, a holistic and deepened analysis of the territory and a complex and transparent, shared participatory process (Shoyama and Yamagata, 2014). The support of land-use and landscape approaches, by means of landscape analysis, modelling, land use scenarios building and impact assessment, helps decision makers, supported by expert-based opinion and spatially explicit assessment, to reach the sustainable development, in compliance with environmental resources and community’s needs. The landscape analyses, the in-depth knowledge, the landscape dynamics and peculiarities, the environmental monitoring are strategic to:
- better respond to societal and policy goals;
- ensure development without depleting resources;
- avoid land use conflicts.
In compliance with the Drivers-Pressures-State-Responses (DPSR) model (Rapport & Friend, 1979; EC, 1999; Carr et al., 2007; Malekmohammadi & Jahanishakib, 2017; von Haaren et al., 2019), an integrated assessment requires to include the different drivers acting on the territory, identify the pressures that characterize the different possible states, to suggest the most suitable responses to pursue sustainable development.
The present work starts from different scenarios building, by means of Dyna-CLUE modelling, for lands suitable to abandonment in the next years (low-medium term, about ten years). Then, the work focuses on two specific ES assessment by means of InVEST software.
Although the assessment and trade-offs among different ESs are need to clearly identify a pathway to the best kind of regional development, the study-case provides a methodological reference for a rational spatial planning, proposing a methodological framework of action referred to integrated approaches of land-use and landscape planning.
2. Materials and Methods
2.1. Study Area
Campania is a region of southern Italy (Figure 1), located on the Tyrrhenian shore of the peninsula. It covers about 13.600 km2, with a population of almost 6 million people, more than half of which living within the metropolitan area of Naples. Morphology and landscapes of the region are considerably heterogeneous in its different parts, so much so that it can be divided into several sub-regions: broad plains, internal hilly areas and mountain range, sparse mountains, promontories, volcanoes and three main islands. Population and most human activities are gathered on the plains, especially the Volturno and Sele Valleys, determining a vast complex pattern of continuous and discontinuous urban fabric mixed with industrial areas and plots of intensive agriculture land (Pindozzi et al., 2017). The surrounding hilly areas are less populated and mainly shaped by extensive agriculture. Campania holds several important natural or semi-natural areas: broad-leaved forests, Meditherranian coniferous forests, grassland, maquis, wetlands, cliffs, and other bare rocks formations. The importance of such natural sites is testified by the institution of two national parks and several other legally protected areas: 108 Site of Community Importance (SCI) and 31 Special protection Areas (SPAs) (https://www.mase.gov.it/pagina/schede-e-cartografie).
Although the primary sector accounts for the minor part of GDP, Campania is one of the most important Italian regions in terms of agriculture, particularly regarding high quality agri-food products, and much of the territory have been deeply modelled by agriculture (https://land.copernicus.eu/pan-european/corine-land-cover). The largest share of GDP is represented by services, among which tourism is the most important resource, thanks to a huge number of historical and archeological sites, such as Naple’s city center and Pompeii, seaside resorts and world-famous landscape beauties, such as Sorrento, Capri and the Amalfi Coast. In such a context, environmental recovery and landscape preservation are essential to regional development.
2.2. Steps in Method
Starting from the DPSIR framework (Figure 2), promoted by the Organization for Economic Cooperation and Development (OECD, 1993) to describe the interactions between a phenomenon and socioeconomic and environmental systems (Patricio et al., 2016), the present work supports the landscape planning and management in Campania region, integrating different approaches, focused on both land-use planning and landscape ecology.
The Dyna-CLUE model was used to recognize and identify the past land-use changes and to build three possible LUCs scenarios. The InVEST software was used to assess and compare the possible impact of the hypothesized land-use changes on the environmental components. Considering the broad-scale analysis level, the Corine Land cover maps, referred to 2006, 2012 and 2018, were used. The spatial resolution of the study is fixed to the Corine Land Cover (1:100 000) in compliance with the correspondence with the ES classes found in literature. Such spatial resolution does not allow more detailed investigation (Tianhong et al., 2010), but it is useful to preliminary assessment that can give interesting results consistent with the scale usually addressed for strategic planning and, notably, for the decision making support system. The methodology entailed tree steps in method:
- Past LUCs modelling analysis;
- Future LUCs scenarios building;
- ES assessment for each scenarios.
2.3. The Land Use Change Scenarios Building
Future LUCs were simulated in three different scenarios developed under alternative strategies of land management.
The first one, called “trend scenario” (TrS) represents a simple projection of the recent trends.
The other two scenarios are related to the latest EU common agricultural policy (CAP) programs and the new perspectives of development policies, ever more sensitive to environmental issues and sustainability:
- -
- The “no-tillage scenario” (NTS) investigates the perspectives of cereal crops, thought to be slightly increasing as a consequence of European subsidies to farmers for no-tillage aimed at reducing soil erosion.
- -
- The “energy crops scenario” (ECS), finally, presupposes the introduction of non-food crops for bioremediation of polluted areas.
The overall duration of simulations was 12 years, from 2018 to 2030, subdivided into yearly time steps.
A specific land-use map was developed and was used as the baseline for the scenarios comparison, starting from the Corine Land Cover (CLC) maps referred to 2006, 2012 and 2018. The CLC maps, created within the European Program for Earth Observation, result from the processing of Landsat images with a nominal scale of 1:100.000, a minimum mapping unit of 25ha and a change detection threshold of 5ha. In these maps different land-cover types are classified into 44 main classes on three levels of detail. In order to increase the thematic accuracy, which is currently about 85% (Petropoulos et Islam, 2017), CLC maps precision was improved with information derived from LUCAS surveys (Gallego, 2002) and aerial photographs. In the present paper the different land-use types were merged into 8 thematic classes with a resolution of 100m (Table 1).
The Dyna-CLUE (Dynamic Conversion of Land Use and its Effects) model was used for the simulation of the different scenarios (Verburg and Overmars, 2009). This modelling system takes account of both intrinsic and extrinsic driving factors of LUC, so that different land-cover types are allocated at grid cell level in compliance with a weighted combination of location characteristics (geomorphology, climate, distance to main facilities and infrastructures, etc.), agents operating in the region, socioeconomic conditions and spatial policies (Verburg and Overmars, 2009; Hellmann and Verburg, 2011; Xu et al., 2013; Shoyama and Yamagata; 2014).
Agents’ competitive strength plays an important role in the Dyna-CLUE modelling framework and it is weighted by settings a parameter known as conversion elasticity, which can assume values between 0 and 1, respectively for easy and difficult conversion of a land-use type into different ones. Aptitude to conversion is related to the level of capital investment on each single class (Verburg et al., 2002; Verburg and Veldkamp, 2004) so that the lowest value was given to non-irrigated arable land, while the highest value was given to urban fabric (Table 1).
In order to prevent urban areas from being converted into agricultural land, as well as all the other transitions that are actually quite unlikely to happen (Table 2), a conversion matrix representing the allowed changes between different land-cover types must be set (Verburg and Veldkamp, 2004).
The effect of location features on assigning each land-use type at grid cell level is estimated by a regression analysis correlating every single land cover, used as a dependent variable, with those factors deemed to be significant on its actual pattern, used as independent variables. Statistics are based on the logit model in compliance with the following formula:
where Pi is the probability for the allocation of a specific land cover on the cell i, X1,2…n are the values assumed by the driving factors in the cell i, while β1,2…n coefficients are the weights of each factor in determining that land cover, calculated by running the regression, as well as the β0 constant value (Verburg and Veldkamp, 2004).
ln(Pi/1 − Pi) = β0 + β1X1,i + β2X2,i … + βnXn,i
A stepwise procedure is used in the regression to exclude directly those variables not showing a significant influence on actual land-use pattern (Verburg et al., 2002).
Regression analysis was based on dependent variables derived from the 2012 land-cover map. The introduction of a new land-cover type such as energy crops, not yet existing on the current land-use classification, made it necessary to use a proxy able to represent its hypothetical spatial distribution in compliance with a criterion of suitability (Hellmann and Verburg, 2011; Pindozzi et al., 2017). Then a suitability map based on Multi-Criteria Evaluation (MCE) was used to simulate a possible land-use pattern of energy crops on the related scenario. The energy crops scenario map developed in Cervelli (Cervelli et al., 2016) study for Campania region was used. Geophysical and anthropic factors thought to be meaningful driving forces of LUC in the study area, used as independent variables of the regression analysis (Table 3).
In compliance with Pontius and Schneider (Pontius and Schneider, 2001), the validation of the regression analysis was performed by the relative operating characteristic (ROC) method, comparing the simulated spatial arrangement of every single land-use type with the 2018 actual one (or the suitability map as regards energy crops). ROC values higher than 0.5 suggests a correlation between predicted and observed land cover, as more significant as it is closer to 1.
The quantity of land undergoing conversion into different classes (demand) was calculated for every year of the simulation in compliance with different purposes of each scenario (Verburg et al., 2002; Verburg and Veldkamp, 2004).
Land requirements for TrS were computed in compliance with actual LUCs occurred during the period 2012-2018 in terms of absolute surfaces gained or lost by each land-cover class.
As regards NTS and ECS, demands are based on goals thought to be plausible, in compliance with the regional agricultural policies and into the wider context of current European agriculture conditions.
Specifically, about the NTS, it is related to the payments for environmental commitments, climate and other management commitments (ACA payments), that require to farmers very specific production and management behaviors. The ACA payments (that will operate very similar to that of Measures 10 and 11 of the 2014-2020 programming), will have the objective of offsetting the higher costs and lost income associated with the voluntary adoption of the commitments for the climate and the environment. Among these ACA, interventions “3” are intended for “ACA3 - Reduced soil tillage techniques”, as reported in the Italian National Strategic Plan, sent to the European Commission.
The ACA3 interventions, aimed at improving environmental performance, are divided into two actions (basic commitments):
- -
- adoption of no-till / No tillage (NT) seeding techniques;
- -
- adoption of minimum tillage techniques / Minimum tillage (MT) and/or band tillage / strip tillage techniques.
Assuming that not all available soils will be maintained with no-tillage or minimum tillage techniques, an overall +2% was earmarked for non-irrigated arable land (in opposition to the actual negative trend) by the end of the simulation, mostly decreasing the actual positive trend of permanent crops. About the other classes, they follow the trend, though at a lower rate than in the past.
Finally, about the ECS, in compliance with the same criteria, the new land-cover class of energy crops was introduced totaling about 40,000ha, equal to 25% of the eligible areas pointed out by Cervelli (Cervelli et al., 2016), by the end of the simulation.
In Dyna-Clue model, the allocation of different land-use classes at grid cell level is performed by an iterative process running until, in compliance with location-based conditions, the total amount of LUCs meets the demand of each scenario, in a combination of a top-down and a bottom-up approach (Verburg and Overmars, 2009; Murray Rust et al., 2014).
2.4. The Ecosystem Services Assessment
The ESs assessment within each scenario was developed by using InVEST software (a system for Integrated Valuation of Ecosystem Services and Tradeoffs), consisting in a set of models developed just to quantify the provisioning of ESs as a result of land cover and land management (Nelson et al., 2009). The InVEST framework was developed by the Natural Capital Project, a partnership between Standford University, The Nature Conservancy and the World Wildlife Fund, with the specific aim of promoting ESs as guide principles of decision making (Daily et al., 2009). Unlike the common monetary methods, generally assigning flat values to each land cover in relation to a specific ES, InVEST models take into account also the effect of landscape configuration (e.g., edge effect, fragmentation, distance to sources, etc.) on the provisioning of the ES (Verhagen et al., 2016). As a result of modelling, ESs can be expressed both in biophysical and monetary terms, in compliance with the type of ES and to the availability of data needed to run each model (Nelson et al., 2009).
The ESs investigated in the present paper were the sediment delivery ratio (SDR) and carbon storage and sequestration (CSS), each one of them was quantified for every scenario by running the devoted models.
2.4.1. The Erosion Risk Mitigation Ecosystem Service via the Sediment Delivery Ratio Model (InVEST Software)
The InVEST model dedicated to erosion is based on the Universal Soil Loss Equation (USLE) (Wishmeier and Smith, 1978), which is a widely acknowledged approach for estimating soil loss at watershed level. In compliance with this equation, the amount of soil loss [ton ha-1 yr-1] is given by the following formula:
USLE = R * K * LS * C * P
Where R is the rainfall erosivity, K is soil erodibility, LS is the slope length gradient factor, C is the cover management factor and P is the support practice factor. For a better understanding of these parameters please refer to Wishmeier and Smith (Wishmeier and Smith, 1978).
Not all the amount of soil eroded generally reaches the catchment outlet, basically depending on land morphology that affects shape and extent of sediment stream. So, part of the sediment removed from an upslope location is held in a lower one showing a certain retention effect. Hence the InVEST model estimates the sediment export [ton pixel-1 yr-1] as follows:
where SDRi is the sediment delivery ratio, intended to be the proportion of soil loss in location i actually reaching the catchment outlet.
Ei = USLEi x SDRi
Since we worked at a resolution of 100m the final unit of measurement results as ton ha-1 yr-1. SDR calculation is based on the concept of connectivity index illustrated by Borselli (Borselli et al., 2008) and it relies on a high-resolution DEM as a function of slopes.
The Table 4 shows the data needed to run the model for every scenario. While R, K and LS factors were considered to be constant over the time, human activity-dependent factors, such as land cover and management were weighted in compliance with the different contexts investigated. As not enough data about anti-erosion support practices were available, the P-factor was assumed to be equal to 1.
2.4.2. The C-Factor Deepening
In order to evaluate the impact on soil erosion of future LUCs driven by alternative strategies of land management, an estimation of the cover management factor (C-factor) within the Universal Soil Loss Equation (USLE) was carried out. C-factor is a parameter ranging between 0 and 1 which takes into account the influence of land cover and management on soil loss, with bare soil C-factor’s value of 1 (Wishmeier and Smith, 1978). Despite the wide literature assigning uniform C-factor values in compliance with land cover (Diodato et al., 2011; Drzewiecki et al., 2014, Panagos et al. 2015) or remote sensing techniques (Jong, 1994; van der Knijff et al., 2000; Karaburun, 2010), the present study attempted to consider the effect of different agricultural practices on arable lands, with special regard to conservative and no-tillage, as they are incentivized by CAP. The C-factor Land Use and Management model (LANDUM) (Panagos et al., 2015) was therefore used to estimate a C-factor for each scenario. In compliance with LANDUM, the C-factor for arable lands is calculated as follows:
where Ccrop is a constant depending on the crop type, while Cmanagement is a value depending on land management practices.
Carable = Ccrop * Cmanagement
Crop factor is calculated as a weighted average value based on the actual crop composition of arable lands in the region as follows:
where n is the crop type while S is its share at regional level.
Data about crop composition of arable land in the Campania region are available on the Italian Institute of Statistics web portal (ISTAT, 2016). Although crop rotation alters the pattern of arable lands quite quickly, crop composition can be considered stable in purely quantitative terms (Panagos et al., 2015), thus it was approximated through an analysis over a period of six years, from 2006 up to 2011, year for which the most up-to-date information was available. In such a way it was possible to calculate the current Ccrop, thought to stay the same up to 2030 in the TrS, while for the NTS and ECS, different coefficients were found in compliance with the supposed alterations in crop composition because of the alternative policies.
The C-factor values taken as a reference in the present study were those suggested by Panagos (Panagos et al., 2015).
Management factor is calculated as the result of different agricultural practices which affect soil loss as follows:
where Ctillage is related to tillage practices, Cresidues to the maintenance of crop residues on the field and Ccover to eventual cover cropping.
Cmanagement = Ctillage * Cresidues * Ccover
Tillage practices, which represent one of the main issues of the present study, can be classified into three different types: conventional, conservative and no-tillage (also known as zero tillage or sod seeding). Conventional tillage is meant as traditional preparation of soil for sowing by ploughing and harrowing; residues of previous crops are often harvested as byproducts. Conservative tillage is a type of land management which keeps a part of plant residues on the ground and, generally, it adopts a lower level of soil processing, for instance not inverting the soil layers (vertical tillage), or at least choosing a once-off ploughing. No-tillage consists in sowing directly into the ground without any mechanical soil processing, in which case weed control is obtained by herbicides or mulching. As they can improve soil structure and stability, conservative and no-tillage represent an important strategy to reduce soil loss (Unger et al., 1980; Holland, 2004; Koschke; 2013). Among those different kinds of land management, untilled soils are those showing the lowest rate of erosion, ceteris paribus. In compliance with this assumption, tillage factor is estimated by the following equation:
where S is the surface treated respectively by conventional, conservative and no-tillage.
Ctillage = 1 * %Sconventional + 0.35 * %Sconservative + 0.25 * %Snotill
Data about the share of tillage at European, national and regional level are available on the European Statistics Office web portal (Eurostat, 2013).
For TrS and ECS scenarios, the Ctillage coefficients were considered to stay equal to the current value, since no reliable forecast can be made regarding the future share of arable land treated by different tillage practice.
For the NTS scenario the achievement of 25% of tilled surfaces has been hypothesized. Specifically, the conservative and the no-tillage were equally treated (12,5%+12,5%).
Maintaining crop residues on fields and cover cropping, which consists in growing any kind of intermediate plantation with the specific aim of reducing soil loss during periods when land would be normally bare, can have a significant impact on soil protection (Unger et al., 1991; Dabney et al., 2001). As no data related to crop residues and cover crops are available at any scale the Cresidues and Ccover parameters were considered equal to 1.
The C-factor values for non-arable land were obtained from Diodato (Diodato et al., 2011) and Fagnano (Fagnano et al., 2015) studies (Table 5).
2.4.3. The Carbon Sequestration Ecosystem Service via Carbon Storage and Sequestration Model (InVEST Software)
Global warming seems to be deeply connected with the increasing atmospheric concentration of greenhouse gases, among which carbon dioxide (CO2) represents a serious concern, since a significant part of its emission is caused by human activities, in particular the combustion of fossil fuels and deforestation (Friedlingstein et al., 2010; Mardani et al., 2019; Adedoyin & Zakari, 2020). In the light of this carbon sequestration is probably the most acknowledged ES (Natural Capital Project, 2023). Photosynthetic activity of organisms removes CO2 from the atmosphere and stores it in biomass such as wood, which is one of the most important carbon stocks in terrestrial ecosystems; that’s why LUCs, especially as regards conversion of natural areas into agricultural or built-up land, play a key role in the carbon cycle (Foley et al., 2005). Living beings are not the only carbon stock, but a considerable amount of organic matter is stored in the form of undecomposed dead material, humus, peat and fossil, so much so that soil is actually the largest carbon stock of terrestrial ecosystems (Kayler et al., 2017).
The land management, especially as regards crop rotation, fertilization and tillage, has a deep impact on soil carbon stocks, by the way it should be noted that increasing soil organic content improves the stability of aggregates, helping even mitigation of erosion (Lal, 2004; Smith, 2004; Caride et al., 2012; Koschke et al., 2013).
InVest model for mapping carbon sequestration calculates the total amount of elementary carbon stored in each grid cell, in terms of Mg ha-1, as the sum of the four main carbon pools, that are the aboveground biomass, belowground biomass, dead organic matter and soil organic carbon. Carbon pools show different values foremost depending on land cover but also on land management. In principle, forests are those showing greater stocks in every pool. Also grasslands, generally show high levels of carbon storage, while among agricultural lands greater stocks of soil carbon can be found under a system of reduced tillage than conventional one (Smith, 2004), all other things being equal. Each land-use class was therefore assigned a value for every single carbon pool estimated in compliance with the protocol proposed by the Intergovernmental Panel on Climate Change (IPCC, 2006), which takes into consideration many different variables influencing carbon storage including main species, latitude, land management and, as regards agricultural surfaces, even input level and tillage practices. Table 6 shows carbon stocks of each land-cover type derived from IPCC reference values.
As a result of modelling, a map of carbon storage was carried out for each scenario. The amount of carbon sequestration can be calculated as the difference between carbon storage of baseline and those estimated for future scenarios.
3. Results
3.1. Regression Results and Model Validation
Coefficients derived from logit model linking land-cover distribution to its driving factors in the Dyna-CLUE framework are shown in Table 7. The stepwise procedure used for the regression analysis excluded only one variable not showing significant effect on landscape pattern: among the 15 considered variables, only the “distance to coast” variable seems not to have any influence on any land-cover type distribution, while all the others have shown significance at least to one class. The same Table shows values of ROC index for each one of the land-use class. High ROC values were found. The higher value (ROC = 0.974) is related to urban areas. The lower value (ROC = 0.748) was found for industrial areas pattern.
3.2. The Land-Use Changes Scenarios Building Results
The overall amount of changes in each scenario was estimated in compliance with its main driver, while their spatial configuration was simulated within the Dyna-CLUE framework. Results of modelling compared with the baseline of current state of land use is shown in the next sections.
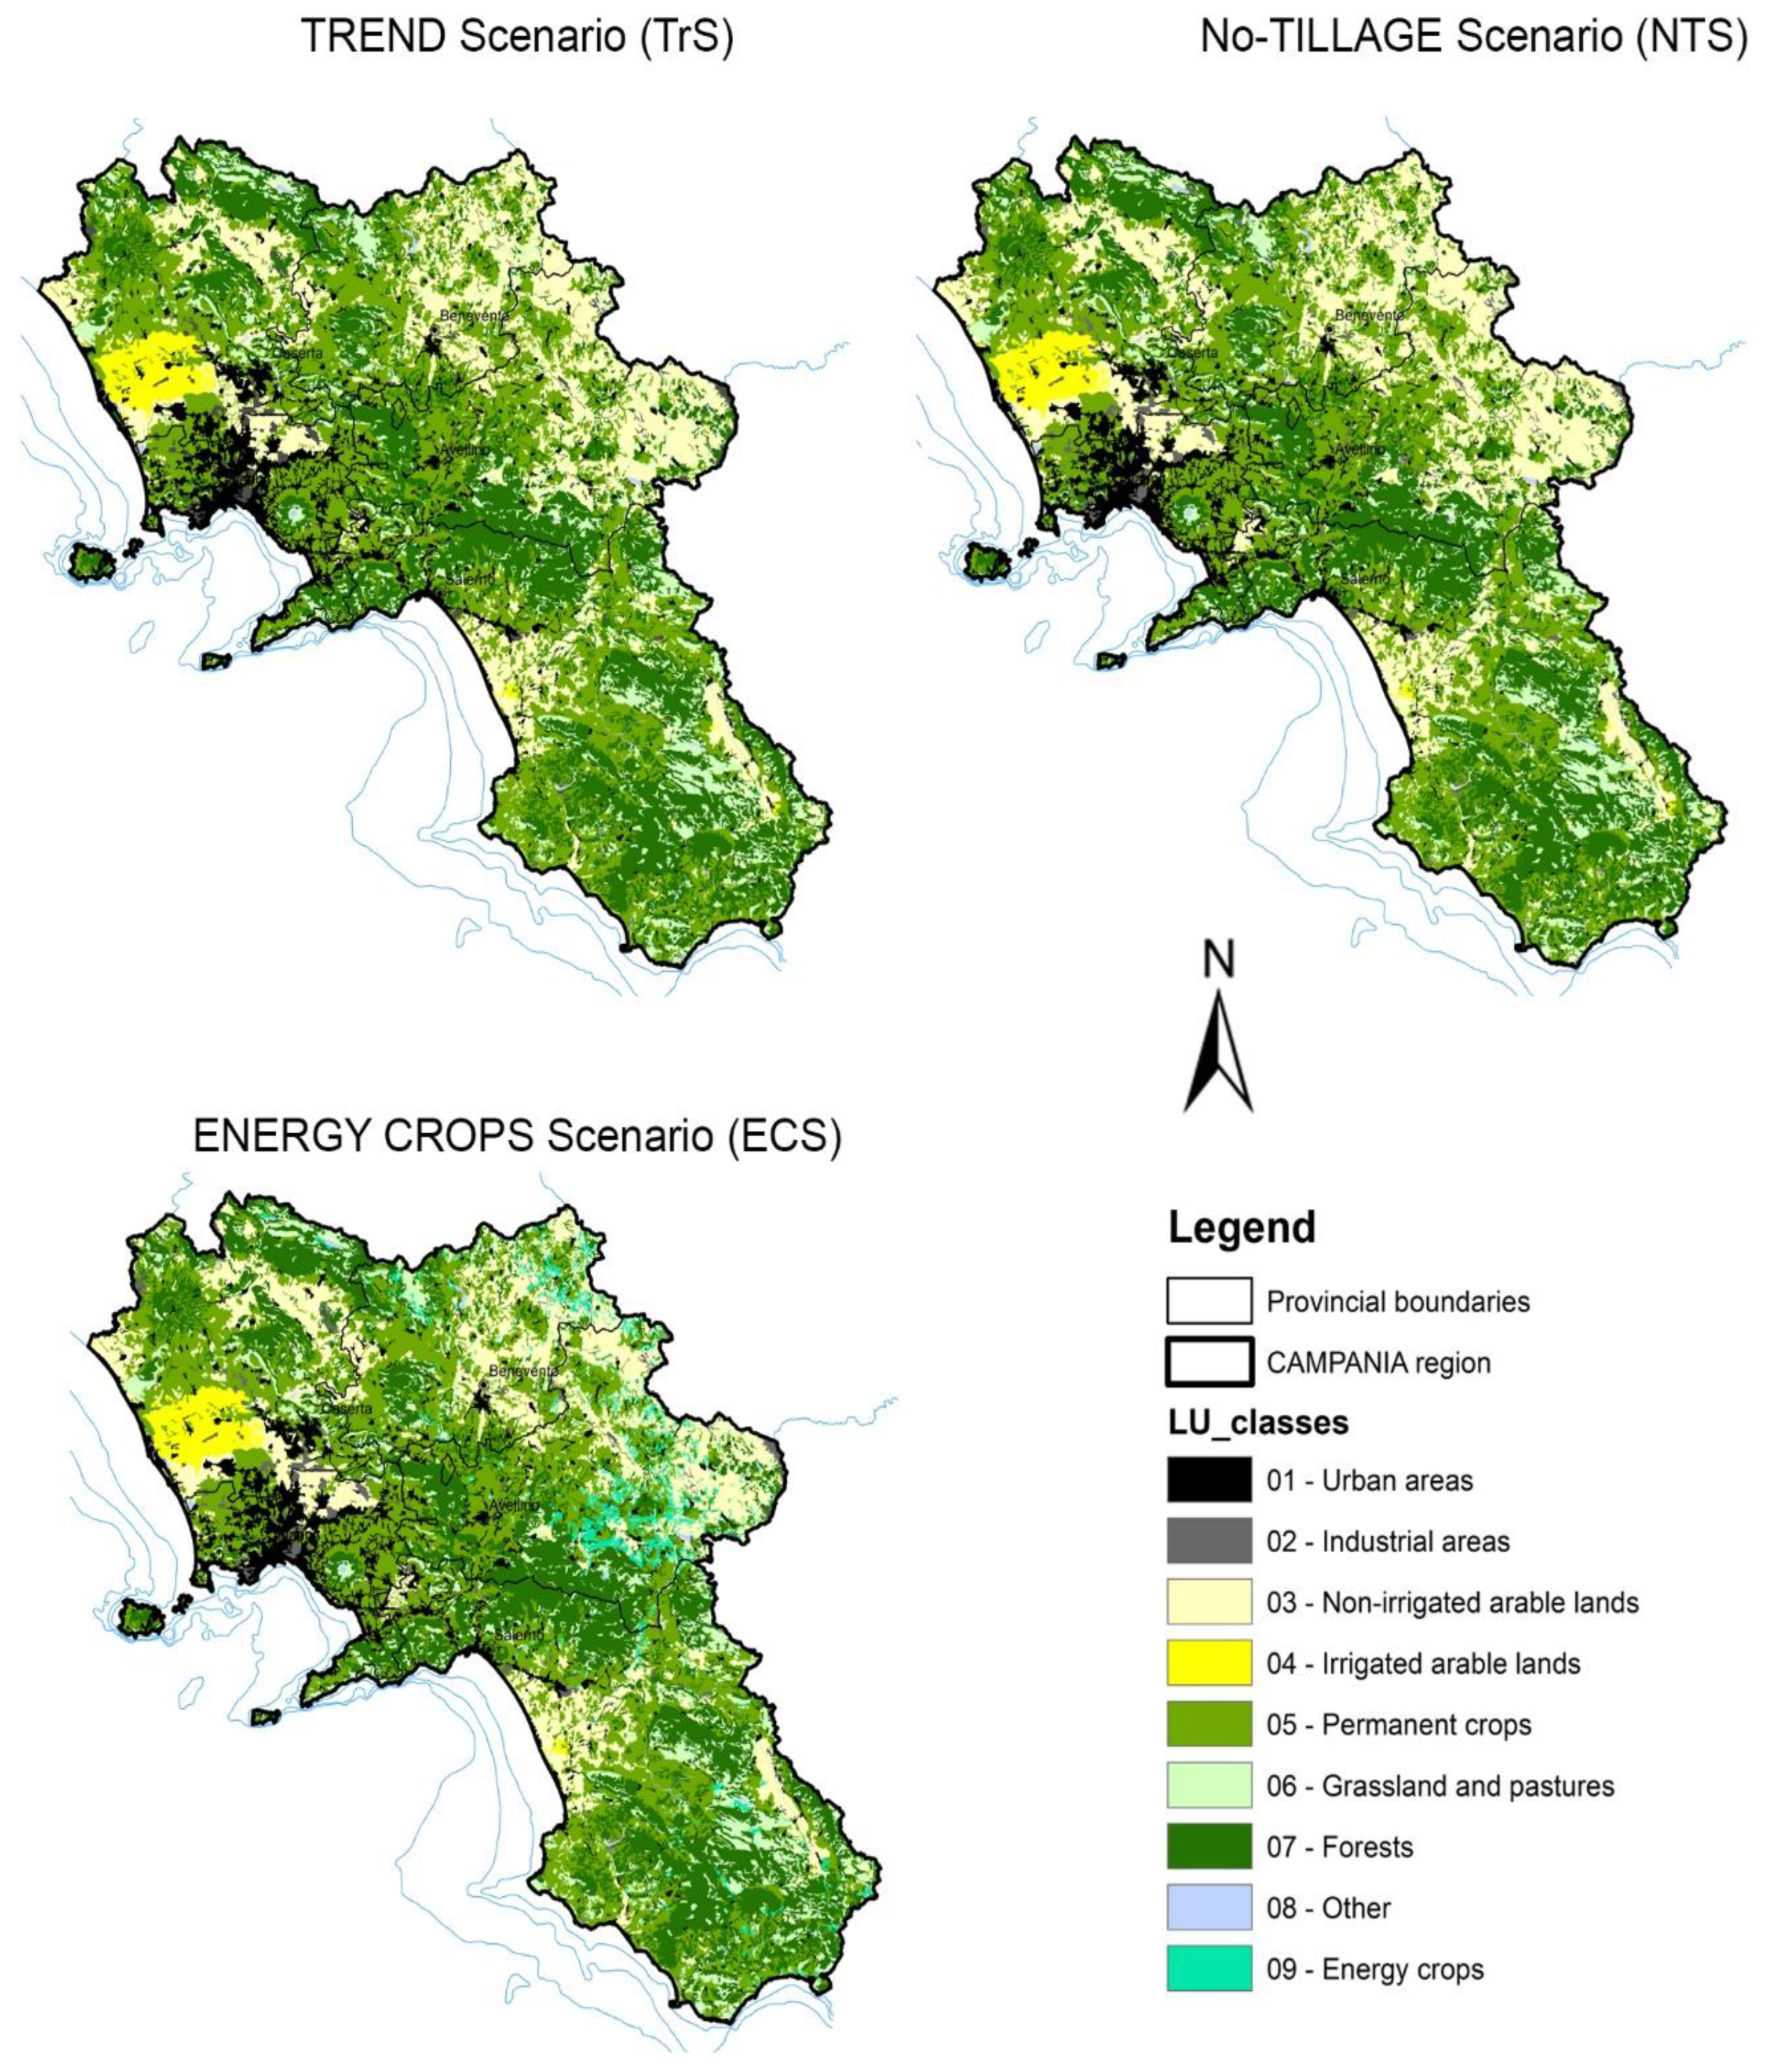
Figure 3.
Land-use changes scenarios to 2030.
3.2.1. Past Changes and Trend Scenario (TrS)
The TrS scenario was developed in compliance with the LUCs occurred in the reference period 2006-2018.
Concerning the past LUCs, the contingency matrix (Table 8) shows the net gain/loss of surfaces among the different LU/LC classes. Specifically, the table allows identifying both the net gain/loss of surfaces, which is the most significant components of the overall change, and shifting surfaces that had a lower impact on landscape arrangement, though they cannot be overlooked (for example the agricultural and natural areas).
The same Table shows values of ROC index for each one of the land-use class. High ROC values were found. The higher value (ROC = 0.974) is related to urban areas. The lower value (ROC = 0.748) was found for industrial areas pattern.
The urban sprawl can be considered the main driver of LUCs, especially regarding the increase of industrial areas (+58.3%), followed by that of urban ones (+13.2%), mostly at the expense of agricultural surfaces. Artificial surfaces tended to replace non-irrigated arable land and permanent crops, in most cases because of the expansion of existing settlements, which have a higher competitive strength for suburban locations.
Within the agricultural uses, non-irrigated arable lands are the only land-use type undergoing a significant net decrease (–4.7%), partly because of the mentioned urban pressure, but mainly because they were converted into permanent crops, typically more profitable in compliance with their higher level of capital investment. As a matter of fact, 14,718 ha of non-irrigated arable land were replaced by permanent crops, which increased up to 3% in the reference period, while no significant changes affected irrigated arable land which require specific environmental characteristics (water availability, such as in riverside flatlands). The ROC value associated with this land-use type is indeed the highest among the considered classes (0.989).
Similarly, the grasslands underwent a remarkable decline (–7.9%), mainly due to the replacement with non-irrigated arable land, permanent crops and to the natural transition into forest.
No large changes affected forests, at least in terms of net gains or losses (–0.6%), even if it should be noted a little tradeoff between them and other land uses, especially permanent crops and grasslands.
The pattern endorsed the conversion elasticity setting, which assigned with lower values to those land-cover types showing a higher propensity to reversible changes (Verburg et al., 2002; Verburg and Veldkamp, 2004, Shoyama and Yamagata, 2014).
Starting from the recognition of past LUCs, the Table 9 shows a projection of land-use transitions up to 2030, as resulted from simulation. The LUC pattern is quite similar to the past actual one, with urban areas expanding at the expense of agricultural lands. These last in turn tends to shift on grass-vegetated non-used land. Even within agricultural land it can be seen an analogous conversion of non-irrigated arable land into permanent crops.
There are only a few slight but evident differences between observed and modeled changes.
The first one is related to artificial surfaces, which were not allowed to be replaced by any other kind of land cover. In other words, urban expansion was set in order to be irreversible.
Another difference concerns the class of other land covers, which was set to stay the same for all the duration of the simulation, as no reliable forecast can be made on fortuitous events or illegal actions, which can evidently be the only reasonable drivers of change within the category.
The last difference regards the missing tradeoff between forest and other non-artificial land, and even this is the result of a precise choice aimed at minimizing erroneous conversions. Since the transition of shrubs into forest is not location-based but rather age-based, no changes into forest were allowed because the period of simulation was considered too short for resulting in any appreciable natural reforestation.
3.2.2. No-Tillage Scenario (NTS)
The Table 10 shows the results of modelling the NTS. This scenario is characterized by an expansion of agricultural land because of effective policies aimed at supporting no-tillage or minimum tillage practices. Unlike the TrS, non-irrigated arable land would undergo a significant increase (+2.1% by the end of the simulation), partly limiting the positive past trend of permanent crops. These last, in turn, to be still increasing, though with a lower rate than in the recent past (+1.3% by the end of the simulation).
Since this scenario is anyway developed within a trend-based context, the effect of urban sprawl is still evident with an overall increase of 12.5% and 55% respectively for urban and industrial areas, mainly at the expense of agricultural land.
Also, forests keep the same past trend with a little decline (-0.7% by the end of the simulation). Therefore, all the pressure of human activities would reverberate on grasslands, which would significantly decrease (-20.1% by the end of the simulation) mostly due to the expansion of non-irrigated arable land and permanent crops. In other words, even in this scenario, the less competitive agriculture, into the suburban locations, tends to shift on non-used land.
In line with trend, no important changes would affect irrigated arable land, whose high-specific sensibility to location characteristics makes it much more stable than other land covers. Even in this case, setting of allowed transition was kept as for the TrS (Table 9) considering the principles mentioned in section 3.2.1.
3.2.3. Energy Crops Scenario (ECS)
The Table 11 shows the results in compliance with the energy crops scenario. An overall expansion of agricultural land is determined by the introduction of energy crops for bioremediation of polluted areas as proposed by Cervelli’ (Cervelli et al., 2016) study. The ECS hypnotizes an increasing up to about 40000ha for energy crops, mostly competing with the non-irrigated arable lands and the grasslands, that are clearly the most lacking classes in terms of capital investment.
Even in this case, the scenario is developed within a trend-based context, so that urban sprawl is still an important driver of LUC, with an increase of urban and industrial fabric respectively of +12.1% and +54.9% by the end of the simulation, mostly replacing agricultural land, non-irrigated arable land (-13.8% by the end of the simulation).
The positive past trend of permanent crops is in this case reduced by the supposed affirmation of energy crops (+1.5% by the end of the simulation). Similarly, to the other two scenarios, no important change would affect irrigated arable land and forests would keep the same trend with a little decline (-0.8% by the end of the simulation).
Ultimately, even in this case, all the pressure of human activities would lead to a reduction of grasslands (-16.1% by the end of the simulation) because of a relocation of agriculture, commonly less competitive than secondary and tertiary sectors, but more than grass-vegetated non-used land.
3.3. The Ecosystem Services Assessment Results
The Figure 3 and Figure 4 show the provision of the studied ESs in the different modeled scenarios. Both for the Sediment Delivery Ratio service and for the Carbon Storage and Sequestration, the current state (LU 2018), shows higher values then the simulated scenarios by 2030. The future landscape development scenarios will probably result in a decline of environmental conditions.
In the Trend scenario, the pressures related to the LUC (with the urban increase and the agricultural pressure on grassland) will led to a general deterioration of ecosystem value, at least as regards the considered ESs. It is the worst scenario in terms of ESs assessment. About the SDR service, the artificial surfaces increasing, under condition of impervious rainfall, will determine an increase of rainfall runoff, intensifying the erosive potential of water flow for downstream locations (Yang & Zhang, 2011). A large proportion of urban soil surfaces are sealed, severing the pathway between the soil surface and groundwater. The soils’ contribution to flow regulation and water storage is limited, leading to increases in run-off quantity (Praskievicz & Chang, 2009; Jacobson, 2011; Rawlins, et al., 2015). Similarly, agricultural land is generally more susceptible to erosion than grassland, because the canopy of cultivated plants is generally lower than spontaneous vegetation, so that their cover effect is limited in most cases (Diodato et al. 2011). Moreover, tillage and other agricultural practices seasonally impose a certain amount of bare soil (Wishmeier and Smith, 1978). About the CSS service, the artificial land covers are those showing the lowest carbon stocks (IPCC, 2006 and 2007).
In the No-Tillage scenario, the results show a moderate decreasing of ES values only in terms of carbon storage and sequestration service: comparing to LU 2018, the scenario presents a slight reduction of CSS by 2030 (-4%), followed by trend scenario (-26.9%) and energy crops one (-34.5%).
In the Energy Crops scenario, the Sediment Delivery Ratio values are substantially comparable to that of baseline/current state LU 2018. The ECS would result less impactful as regards soil erosion, showing even an improvement by 2030 (-3.6%), followed by no tillage (+1.2%) and trend (+17.5%).
4. Discussions
Land use changes among trend recognition and scenarios building
Findings of present study depict regional dynamics substantially in line with what has been lately happening in Italy, and generally in Europe (Munafò and Marinosci, 2018).
In particular, the main driver of LUC is represented by urban sprawl, mostly replacing agricultural land, especially in suburban locations, because of the expansion of existing settlements. It is noteworthy that such a phenomenon is more intense in the valleys, where soils are normally more fertile and easily workable, and particularly in the Volturno plain, where it is located most of Naples metropolitan area.
In accordance with the marginal role which agricultural sector has in the economy (and GDP) of developed Countries (Kour et al., 2020; Velasco-Muñoz et al., 2021), also in Campania region the recognition of LUCs shows a trend clearly declining: less soil devoted to the agricultural uses, but with the high-income crops intensification.
A meaningful difference between the general tendency at national and European level and Campania’s regional dynamics is that, at least in the examined period, forest surface showed a slight contraction, while on a national and European scale the expansion of forests due to abandonment of agriculture, especially in marginal mountain areas, is a consolidated reality of last decades (Munafò and Marinosci, 2018). In this regard, it must be said that Campania has been the scene of several wildfires, being for years among the most affected Italian regions together with Sicily, Sardinia and Calabria, which hold by themselves almost the totality of fire events in the country (Silvestro et al., 2021; Cervelli et al., 2022).
To give a realistic interpretation of regional dynamics, the three scenarios proposed in this study are trend-based, therefore each of them keeps the same general tendency in terms of urban development at the detriment of agriculture, which in turn tends to shift on locations previously covered by grassland, though with differences linked to the hypothesized different policies. As a matter of fact, while TrS tends to concentrate LUCs in hotspots showing a more compact pattern mostly located in flatlands, in the NTS and ECS LUCs appear more disperse, affecting even hilly territories of Sannio and Irpinia in the eastern part of the region, which is more suited for extensive agriculture. In particular, LUCs in the ECS are clearly shifted to the East, as a consequence of the supposed affirmation of energy crops on arable lands (Figure 3).
In light of what mentioned above it is reliable to think that, beyond the peculiarity of different scenarios, driving forces of LUC will lead to further land take, unavoidably linked to a worsening of environmental conditions. In such a context, it is even more essential to pursue goals of sustainable development through active policies such as those investigated by the present study, aimed at compensating or, at least, mitigating negative environmental impacts of LUC.
The ES assessment as support to land-use planning and management
The LUC is the main driver affecting terrestrial ecosystems (MEA, 2005). The land-use planning and management are therefore strategic in ecosystem survival and, consequently, for human well-being. The ecosystem services approach allows monitoring the environment, mitigating and preventing the extreme events risk and implementing the environmental conditions. The present paper focuses on two specific ecosystem services, that are closely connected with the agro-forestry landscape management: the erosion risk mitigation and the carbon storage and sequestration.
Increasing soil organic matter, due for example to agricultural activities (no-tillage or energy crops) has significant positive implications at different levels, affecting the supporting, provisioning and regulating ESs: the soil organic matter can store a significant amount of carbon removing it from the atmosphere, but at the same time it can also reduce the soil erosion (Caride et al., 2012; Koschke et al. 2013).
The land management can make a difference both with a deep alteration of land-use or land-cover pattern and with the agronomic techniques and soil tillage forms. The present study deepens this aspect: changes in terms of land use (as well as ESs) within different scenarios are not outstanding, though still meaningful. The study focuses on the possible locations of undergoing LUC areas, the agronomic techniques possible inside them, and on the possible impact on environment and ESs provision.
The most evident concern emerging from this study is that in no case simulations show an improvement of the analyzed ESs by 2030. Although the study focuses on only two ESs, given the nature of LUCs affecting the region, related more on the forms of use and the cultivation practices, that on significant land use changes between distinctly different classes, it is reasonable to think that the scenarios, based on trend analysis, would result in a worsening of even many other environmental indicators.
The TrS is always the worst in terms of ESs value, and this suggests that any of the supposed policies would be better than no policy. The land-use planning has to build a vision for the territory, based on a wider comprehension of both regional and global dynamics.
About the other scenarios, the no-tillage one showed a better performance in relation to carbon storage rather than to SDR, while the energy crops scenario led to opposite results. This can be justified in compliance with the different kinds and rates of LUC hypothesized as a consequence of different land policies. As a matter of fact, despite reduced tillage is less impactful than conventional one in terms of soil erosion, the NTS supposes an increase of arable lands (which is quite unlikely in compliance with actual trend) and such situation would implicate the transformation of even untilled land, mostly grassland. Accordingly, benefits of conservative tillage would not compensate for the negative impact of the conversion of grassland into agricultural land. On the other hand, conservative tillage would determine a general increase of carbon stocks of all arable land, not only those of recent transformation, and this would evidently offset the loss of grassland, which is normally a higher carbon stock than any agricultural land.
About the energy crops scenario, the increase of devoted crops (mostly at the detriment of arable land, then of grassland) would have a positive impact on soil erosion. The canopy of energy crops, whose reference species was in this case A. donax, is indeed very high, moreover they generally require a very low soil tillage (substantially comparable to no-tillage), thus their C factor is much lower than any other agricultural land and just slightly higher than that of grassland (Table 6, section 2.3.1.1). The C factor itself is not sufficient to explain the lower SDR associated with ECS, as it is function of many other variables related with land morphology and climate (section 2.3.1). However, it is evident that, in this case, the combination of crop features and location characteristics of its most likely occurrence would determine higher protection from soil erosion. Similarly, as regards carbon storage, despite energy crops were considered as a significant carbon stock, the overall content of organic matter of this scenario is lower than the no-tillage one. The increase of carbon stock of arable lands in NTS would indeed regard all the arable land, and not only those of recent conversion, while the progress of agricultural land carbon storage in ECS would be driven only by the supposed expansion of energy crops, which evidently would not offset the loss of grassland in terms of stored carbon.
All this suggests that effectiveness of the examined policies is subordinated to the maintenance of the same state of land use, as the increase of agriculture at the detriment of natural grass-vegetated land would generally determine environmental worsen.
Considering the land management factor in the evaluation of ESs, or generally of environmental indicators, can lead to even substantial differences if compared with standard approaches relying on simple reference values. In other words, the consideration of land management can refine results of ESs mapping, so much so that it can reveal situations even in contrast with expectations based on a linear logic. Further refinements can be achieved by integrating the knowledge on tillage with other factors, such as inputs of agricultural production, rates of biomass removal from fields and forest management.
The used approach utility and the novelty
The presented methodology is however still far from a perfect fit of adopted models for the studied region. In particular, the model for evaluating carbon sequestration is basically based on a pre-determined amount of carbon stock associated with different land-cover types, as suggested by the “tier 1” methodology proposed by 2006 IPCC Guidelines for National Greenhouse Gas Inventory. Therefore, changes in carbon sequestration are detected only in case of LUC. All cells showing the same land cover during years of simulation seem not to have any effect in terms of carbon balance and this is a simplification of what happens. Carbon stocks are in facts yearly variable, even in absence of LUC, depending on factors often difficult to consider, such as climate conditions and age of species contributing to CO2 fixation, and depending on site-specific conditions. Better results can be performed by making a further subdivision of land-use classes in compliance with main vegetation species, elevation, plants’ age and forest management factors.
Another limitation of the presented methodology regards SDR model, which doesn’t take into account the P-factor within the soil loss equation (Wishmeier and Smith, 1978). For example, terracing by dry stone walls is a landscape trademark of some areas of the region, such as the Amalfi Coast and the islands, and it is an ancient technique which plays a deep role in reducing soil loss. A finer tuning of such models is hard to obtain at regional scale, mostly due to lack of data, however, even this is beyond the scope of the present paper.
Finally, about the trade-offs between different ESs, as can be seen in this study, both illustrated policies show positive effects, but each of them in relation to a different ES. The landscape planning process results very complex, having to consider different priorities, different social-economic and environmental components, different stakeholders, and people involved, different scale of interventions and of related effects, which sometimes far beyond the boundaries of the case study. For example, climate change mitigation is a very touchy topic from a global point of view, but it’s often less appealing to local communities, which are rather more sensitive to aspects whose effect is more evident and immediately measurable (Shoyama and Yamagata, 2014).
Therefore, into decision making, it becomes strategic not only to respond to the requests of local communities, like in the case study related to erosion mitigation, but considers even global perspectives, in order to implement an effective plan of regional development.
5. Conclusions
The present paper is framed in the field of integrating land-use modelling and ESs within decision-making processes. In particular, the work is focused on evaluating the effect of land use and land management on soil erosion and carbon storage capacity, in a context of three different scenarios developed under alternative policies.
Considering the complexity of studied ESs trade-offs, the present study is not aimed at the identification of a precise policy line, but rather to give a methodological contribution to the topic, although coming to important considerations about Campania’s regional dynamics. The proposed methodology wants to suggest an integrated approach to spatial analysis, combining land-use modelling with the analysis of ESs, to provide a wide view on the matter.
First, land-use modelling let to identify the undergoing LUCs areas so their eventual hot-spots: for example, to understand where a stronger competition between different land uses and different stakeholder’ interests might occur.
Secondly, a new land cover type was introduced as a landscape element, opening the possibility of evaluating even new crops and local economy development models.
Finally, in relation to agricultural uses, ESs were mapped considering aspects of land management, rather than relying on flat values associated with each land-cover type. In such a way it was possible to obtain a greater accuracy in the analysis of regional dynamics since results revealed aspects partially mismatching expectations.
Findings point out that a regional development in line with past trend will lead to further land degradation, aggravating an already troubling environmental and social situation. This underlines the necessity of a rational and forward-looking regional planning process. Particularly, the study confirms how expansion of built-up areas is the main driver of land degradation in the Campania region, whose soil consumption is one the highest among all Italian regions (Munafò, 2019). Thus, it seems right to highlight the importance of reducing urban sprawl by specific building plans aimed at achieving the goal of no net land take, such as urban renewal and re-naturalization of dismissed artificial surfaces. Moreover, the analysis of different scenarios points out that the studied measures for improving agroecosystems can bring the expected benefits only on the condition that they are not the driver of important LUCs and respecting the naturally grass-vegetated land, which has generally a higher ecosystem value. In other words, it is important that changes within crop pattern or agricultural practices don’t cause a deep alteration of landscape arrangement, therefore eventual subsidies should be paid only for surfaces already allocated to agricultural use.
From the local to global scale, any spatial policy should be based on a deep knowledge of lands and a complete comprehension of social, economic, and environmental issues.
Author Contributions
The authors contributed in: (EC) Conceptualization, Methodology, Software, Data curation, Writing- Original draft preparation, Funding acquisition; (PFR) Conceptualization, Methodology, Software, Data curation, Writing- Original draft preparation, (ESdP) Investigation; Data curation; (SP) Conceptualization, Methodology, Supervision, Funding acquisition, Writing- Original draft preparation. All authors have read and agreed to the published version of the manuscript.
Funding
“This research was funded by the Regione Campania Italy (Rural Development Program for 2014–2020 of Campania Region), under the following projects: “GATES” and “SEI CON il Vesuvio” (assigned to E. Cervelli).
Conflicts of Interest
The authors declare no conflict of interest. The funders had no role in the design of the study; in the collection, analyses, or interpretation of data; in the writing of the manuscript, or in the decision to publish the results.
References
- Adedoyin, F.F.; Zakari, A. Energy consumption, economic expansion, and CO2 emission in the UK: The role of economic policy uncertainty. Sci. Total. Environ. 2020, 738, 140014. [Google Scholar] [CrossRef] [PubMed]
- Esmail, B.A.; Cortinovis, C.; Wang, J.; Geneletti, D.; Albert, C. Mapping and assessing ecosystem services for sustainable policy and decision-making in Eritrea. AMBIO 2023, 52, 1022–1039. [Google Scholar] [CrossRef]
- Agarwal, C.; Green, G.M.; Grove, J.M.; Evans, T.P.; Schweik, C.M. A review and assessment of land-use change models: dynamics of space, time, and human choice. 2002, 297. [Google Scholar] [CrossRef]
- Albert, C.; Aronson, J.; Fürst, C.; Opdam, P. Integrating ecosystem services in landscape planning: requirements, approaches, and impacts. Landsc. Ecol. 2014, 29, 1277–1285. [Google Scholar] [CrossRef]
- Albert, C.; Galler, C.; Hermes, J.; Neuendorf, F.; von Haaren, C.; Lovett, A. Applying ecosystem services indicators in landscape planning and management: The ES-in-Planning framework. Ecol. Indic. 2016, 61, 100–113. [Google Scholar] [CrossRef]
- Amundson, R. The policy challenges to managing global soil resources. Geoderma 2020, 379. [Google Scholar] [CrossRef]
- Bórawski, P., Bełdycka-Bórawska, A., Szymańska, E. J., Jankowski, K. J., Dubis, B., & Dunn, J. W. (2019). Development of renewable energy sources market and biofuels in The Eur.
- opean Union. Journal of cleaner production, 228, 467-484.
- Borrelli, P.; Robinson, D.A.; Panagos, P.; Lugato, E.; Yang, J.E.; Alewell, C.; Wuepper, D.; Montanarella, L.; Ballabio, C. Land use and climate change impacts on global soil erosion by water (2015-2070). Proc. Natl. Acad. Sci. USA 2020, 117, 21994–22001. [Google Scholar] [CrossRef]
- Borselli, L.; Cassi, P.; Torri, D. Prolegomena to sediment and flow connectivity in the landscape: A GIS and field numerical assessment. CATENA 2008, 75, 268–277. [Google Scholar] [CrossRef]
- Caprioli, M.; Tarantino, E. Identification of land cover alterations in the Alta Murgia National Park (Italy) with VHR satellite imagery. Int. J. Sustain. Dev. Plan. 2006, 1, 261–270. [Google Scholar] [CrossRef]
- Caride, C.; Piñeiro, G.; Paruelo, J.M. How does agricultural management modify ecosystem services in the argentine Pampas? The effects on soil C dynamics. Agric. Ecosyst. Environ. 2012, 154, 23–33. [Google Scholar] [CrossRef]
- Carr, E. R., Wingard, P. M., Yorty, S. C., Thompson, M. C., Jensen, N. K., & Roberson, J. (2007). Applying DPSIR to sustainable development. International journal of sustainable development & world ecology, 14(6), 543-555.
- Cervelli, E.; Pindozzi, S.; Capolupo, A.; Okello, C.; Rigillo, M.; Boccia, L. Ecosystem services and bioremediation of polluted areas. Ecol. Eng. 2016, 87, 139–149. [Google Scholar] [CrossRef]
- Comino, E.; Bottero, M.; Pomarico, S.; Rosso, M. Exploring the environmental value of ecosystem services for a river basin through a spatial multicriteria analysis. Land Use Policy 2014, 36, 381–395. [Google Scholar] [CrossRef]
- Copernicus. European system for monitoring the Earth. Available at: <http://land.copernicus.eu/pan-european/corine-land-cover>. Anno di accesso?
- Costanza, R.; d’Arge, R.; de Groot, R.; Farber, S.; Grasso, M.; Hannon, B.; Limburg, K.; Naeem, S.; O’Neill, R.V.; Paruelo, J.; et al. The value of the world’s ecosystem services and natural capital. Nature 1997, 387, 253–260. [Google Scholar] [CrossRef]
- Costanza, R.; De Groot, R.; Braat, L.; Kubiszewski, I.; Fioramonti, L.; Sutton, P.; Farber, S.; Grasso, M. Twenty years of ecosystem services: How far have we come and how far do we still need to go? Ecosyst. Serv. 2017, 28, 1–16. [Google Scholar] [CrossRef]
- Costanza, R.; de Groot, R.; Sutton, P.; van der Ploeg, S.; Anderson, S.J.; Kubiszewski, I.; Farber, S.; Turner, R.K. Changes in the global value of ecosystem services. Glob. Environ. Chang. 2014, 26, 152–158. [Google Scholar] [CrossRef]
- Cremen, G.; Galasso, C.; McCloskey, J. Modelling and quantifying tomorrow's risks from natural hazards. Sci. Total. Environ. 2021, 817, 152552. [Google Scholar] [CrossRef]
- Dabney, S.M.; Delgado, J.A.; Reeves, D.W. Using winter cover crops to improve soil and water quality. Commun. Soil Sci. Plant Anal. 2001, 32, 1221–1250. [Google Scholar] [CrossRef]
- Daily, G.C.; Polasky, S.; Goldstein, J.; Kareiva, P.M.; A Mooney, H.; Pejchar, L.; Ricketts, T.H.; Salzman, J.; Shallenberger, R. Ecosystem services in decision making: time to deliver. Front. Ecol. Environ. 2009, 7, 21–28. [Google Scholar] [CrossRef]
- De Castro, P., Miglietta, P. P., & Vecchio, Y. (2020). The Common Agricultural Policy 2021–2027: a new history for European agriculture. Ital. Rev. Agric. Econ, 75(3), 5-12.
- De Groot, R.S.; Alkemade, R.; Braat, L.; Hein, L.; Willemen, L. Challenges in integrating the concept of ecosystem services and values in landscape planning, management and decision making. Ecol. Complex. 2010, 7, 260–272. [Google Scholar] [CrossRef]
- Diodato, N.; Fagnano, M.; Alberico, I. Geospatial and visual modeling for exploring sediment source areas across the Sele river landscape, Italy. Ital. J. Agron. 2011, 6, e14. [Google Scholar] [CrossRef]
- Drzewiecki, W., Wężyk, P., Pierzchalski, M., Szafrańska, B. (2014). Quantitative and qualitative assessment of soil erosion risk in Małopolska (Poland), supported by an Object-Based Analysis of high-resolution satellite images. Pure and Applied Geophysics, 171(6), 867-895.
- EC (1999). Towards Environmental Pressure Indicators for the EU, 1st Edn. Luxembourg: Office for Official Publications of the European Communities.
- EC (2011). Our life insurance, our natural capital: an EU biodiversity strategy to 2020.
- EC (2013). Green Infrastructure (GI) — Enhancing Europe’s Natural Capital. SWD(2013) 155 final.
- EC (2020a). EU Biodiversity Strategy for 2030. Bringing nature back into our lives. Brussels, 20.5.2020 COM(2020) 380 final.
- EC (2020b). An EU Strategy to harness the potential of offshore renewable energy for a climate neutral future. Brussels, 19.11.2020 COM(2020)741 final.
- EC. (2018). Proposal for a Regulation of the European Parliament and of the Council establishing rules on support for strategic plans to be drawn up by Member States under the Common Agricultural Policy (CAP Strategic Plans) and financed by the European Agricultural Guarantee Fund (EAGF) and by the European Agricultural Fund for Rural Development (EAFRD) and repealing Regulation (EU) No 1305/2013 of the European Parliament and of the Council and Regulation (EU) No 1307/2013 of the European Parliament and of the Council. Report, Brussels. Retrieved from https://bit.ly/2TYrVUz.
- EC. (2019). The European Green Deal – Communication from the Commission to the European Parliament, the European Council, the Council the European Economic and Social Committee and the Committee of the Regions. Report. 11.12.2019 COM(2019) 640 final, European Commission, Brussels. Retrieved from https://bit.ly/30Vk3EO.
- Eurostat (2013). Statistics Explained – Agri-environmental indicators (AEIs). Available at: <http://ec.europa.eu/eurostat/statistics-explained/index.php/Agri-environmental_indicator_-_tillage_practices>.
- Eurostat. Statistics Explained – Glossary. Available at: <http://ec.europa.eu/eurostat/statistics-explained/index.php/Glossary:Tillage_practices>. Anno di accesso?
- Fagnano, M.; Impagliazzo, A.; Mori, M.; Fiorentino, N. Agronomic and Environmental Impacts of Giant Reed (Arundo donax L.): Results from a Long-Term Field Experiment in Hilly Areas Subject to Soil Erosion. BioEnergy Res. 2014, 8, 415–422. [Google Scholar] [CrossRef]
- Finisdore, J.; Rhodes, C.; Haines-Young, R.; Maynard, S.; Wielgus, J.; Dvarskas, A.; Houdet, J.; Quétier, F.; Lamothe, K.A.; Ding, H.; et al. The 18 benefits of using ecosystem services classification systems. Ecosyst. Serv. 2020, 45, 101160. [Google Scholar] [CrossRef]
- Fisher, B.; Turner, R.K. Ecosystem services: Classification for valuation. Biol. Conserv. 2008, 141, 1167–1169. [Google Scholar] [CrossRef]
- Foley, J.A.; DeFries, R.; Asner, G.P.; Barford, C.; Bonan, G.; Carpenter, S.R.; Chapin, F.S.; Coe, M.T.; Daily, G.C.; Gibbs, H.K.; et al. Global consequences of land use. Science 2005, 309, 570–574. [Google Scholar] [CrossRef]
- Friedlingstein, P., Houghton, R. A., Marland, G., Hackler, J., Boden, T. A., Conway, T. J., ... Le Quéré, C. (2010). Update on CO2 emissions. Nature geoscience, 3(12), 811-812.
- Gallego, J. (2002). Fine scale profile of CORINE Land-cover classes with LUCAS data. European Commission (ed.): Building Agro Environmental Indicators. Focussing on the European area frame survey LUCAS, Vol. EUR Report, 20521.
- Guerra, C.A.; Maes, J.; Geijzendorffer, I.; Metzger, M.J. An assessment of soil erosion prevention by vegetation in Mediterranean Europe: Current trends of ecosystem service provision. Ecol. Indic. 2016, 60, 213–222. [Google Scholar] [CrossRef]
- Haines-Young, R., & Potschin, M. (2012). Common international classification of ecosystem services (CICES, Version 4.1). European Environment Agency, 33, 107.
- Häyhä, T.; Franzese, P.P. Ecosystem services assessment: A review under an ecological-economic and systems perspective. Ecol. Model. 2014, 289, 124–132. [Google Scholar] [CrossRef]
- Hellmann, F.; Verburg, P.H. Spatially explicit modelling of biofuel crops in Europe. Biomass- Bioenergy 2011, 35, 2411–2424. [Google Scholar] [CrossRef]
- Hermoso, V.; Carvalho, S.; Giakoumi, S.; Goldsborough, D.; Katsanevakis, S.; Leontiou, S.; Markantonatou, V.; Rumes, B.; Vogiatzakis, I.; Yates, K. The EU Biodiversity Strategy for 2030: Opportunities and challenges on the path towards biodiversity recovery. Environ. Sci. Policy 2021, 127, 263–271. [Google Scholar] [CrossRef]
- Hernández-Blanco, M., Costanza, R., Chen, H., DeGroot, D., Jarvis, D., Kubiszewski, I.,... & van ‘t Hoff, V. (2022). Ecosystem health, ecosystem services, and the well-being of humans and the rest of nature. Global change biology, 28(17), 5027-5040.
- Hersperger, A.M.; Bürgi, M.; Wende, W.; Bacău, S.; Grădinaru, S.R. Does landscape play a role in strategic spatial planning of European urban regions? Landsc. Urban Plan. 2019, 194, 103702. [Google Scholar] [CrossRef]
- Holland, J. The environmental consequences of adopting conservation tillage in Europe: reviewing the evidence. Agric. Ecosyst. Environ. 2004, 103, 1–25. [Google Scholar] [CrossRef]
- Ike, G.N.; Usman, O.; Alola, A.A.; Sarkodie, S.A. Environmental quality effects of income, energy prices and trade: The role of renewable energy consumption in G-7 countries. Sci. Total. Environ. 2020, 721, 137813. [Google Scholar] [CrossRef]
- IPCC. (2006) Intergovernmental Panel on Climate Change. IPCC Guidelines for National Greenhouse Gas Inventories – Volume 4: Agriculture, Forestry and Other Land Use.
- IPCC. (2007). Summary for Policymakers. In: Climate change 2007: the physical science basis. Contribution of working group I to the fourth assessment report of the intergovernmental panel on climate change (eds S. Solomon, D. Qin, M. Manning, Z. Chen, M. Marquis, K.B. Averyt, M. Tignor & H.L. Miller), pp. 1– 15. Cambridge University Press, Cambridge.
- ISTAT (2016).
- Jacobson, C.R. 2011. Identification and quantification of the hydrological impacts of imperviousness in urban catchments: a review. Journal of Environmental Management, 92, 1438– 1448.Johnston, R. J., & Wainger, L. A. (2015). Benefit transfer for ecosystem service valuation: an introduction to theory and methods. Benefit transfer of environmental and resource values: A guide for researchers and practitioners, 237-273.
- Jong, S. M. D. (1994). Applications of reflective remote sensing for land degradation studies in a Mediterranean environment. Koninklijk Nederlands Aardrijkskundig Genootschap. Faculteit Ruimtelijke Wetenschappen Universiteit Utrecht.
- Karaburun, A. (2010). Estimation of C factor for soil erosion modeling using NDVI in Buyukcekmece watershed. Ozean Journal of Applied Science, 3(1).
- Kayler, Z., Janowiak, M., & Swanston, C. (2017). Global Carbon. U.S. Department of Agriculture, Forest Service, Climate Change Resource Center. https://www.fs.usda.gov/ccrc/topics/global-carbon.
- Klein, A. M., Vaissiere, B. E., Cane, J. H., Steffan-Dewenter, I., Cunningham, S. A., Kremen, C., & Tscharntke, T. (2007). Importance of pollinators in changing landscapes for world crops. Proceedings of the Royal Society of London B: Biological Sciences, 274(1608), 303-313.
- Koschke, L.; Fürst, C.; Frank, S.; Makeschin, F. A multi-criteria approach for an integrated land-cover-based assessment of ecosystem services provision to support landscape planning. Ecol. Indic. 2012, 21, 54–66. [Google Scholar] [CrossRef]
- Koschke, L.; Fürst, C.; Lorenz, M.; Witt, A.; Frank, S.; Makeschin, F. The integration of crop rotation and tillage practices in the assessment of ecosystem services provision at the regional scale. Ecol. Indic. 2013, 32, 157–171. [Google Scholar] [CrossRef]
- Kour, V.P.; Arora, S. Recent Developments of the Internet of Things in Agriculture: A Survey. IEEE Access 2020, 8, 129924–129957. [Google Scholar] [CrossRef]
- Lal, R. Soil Carbon Sequestration Impacts on Global Climate Change and Food Security. Science 2004, 304, 1623–1627. [Google Scholar] [CrossRef]
- Lautenbach, S.; Kugel, C.; Lausch, A.; Seppelt, R. Analysis of historic changes in regional ecosystem service provisioning using land use data. Ecol. Indic. 2011, 11, 676–687. [Google Scholar] [CrossRef]
- Malczewski, J. GIS-based multicriteria decision analysis: a survey of the literature. Int. J. Geogr. Inf. Sci. 2006, 20, 703–726. [Google Scholar] [CrossRef]
- Malekmohammadi, B.; Jahanishakib, F. Vulnerability assessment of wetland landscape ecosystem services using driver-pressure-state-impact-response (DPSIR) model. Ecol. Indic. 2017, 82, 293–303. [Google Scholar] [CrossRef]
- Mardani, A.; Streimikiene, D.; Cavallaro, F.; Loganathan, N.; Khoshnoudi, M. Carbon dioxide (CO2) emissions and economic growth: A systematic review of two decades of research from 1995 to 2017. Sci. Total. Environ. 2018, 649, 31–49. [Google Scholar] [CrossRef]
- Marino, D.; Mazzocchi, G.; Pellegrino, D.; Barucci, V. Integrated Multi-Level Assessment of Ecosystem Services (ES): The Case of the Casal del Marmo Agricultural Park Area in Rome (Italy). Land 2022, 11, 2055. [Google Scholar] [CrossRef]
- MEA. Millennium Ecosystem Assessment (2005). Ecosystems and human well-being (Vol. 5, p. 563). Washington, DC:: Island press.
- Meyer, L. D., & Wischmeier, W. H. (1969). Mathematical simulation of the process of soil erosion by water. Transactions of the ASAE, 12(6), 754-0758.
- Montanarella, L.; Panagos, P. The relevance of sustainable soil management within the European Green Deal. Land Use Policy 2020, 100, 104950. [Google Scholar] [CrossRef]
- Montibeller, G.; Gummer, H.; Tumidei, D. Combining scenario planning and multi-criteria decision analysis in practice. J. Multi-Criteria Decis. Anal. 2006, 14, 5–20. [Google Scholar] [CrossRef]
- Munafò, M. 2019. Consumo di suolo, dina-miche territoriali e servizi ecosistemici. Edizione 2019. ISPRA, Report SNPA 08/19.
- Munafò, M., & Marinosci, I. (2018). Territorio. Processi e trasformazioni in Italia. ISPRA, Rapporti, 296, 2018.
- Murray-Rust, D.; Brown, C.; van Vliet, J.; Alam, S.; Robinson, D.; Verburg, P.; Rounsevell, M. Combining agent functional types, capitals and services to model land use dynamics. Environ. Model. Softw. 2014, 59, 187–201. [Google Scholar] [CrossRef]
- Natural Capital Project, 2023. InVEST 3.13.0. Stanford University, University of Minnesota, Chinese Academy of Sciences, The Nature Conservancy, World Wildlife Fund, Stockholm Resilience Centre and the Royal Swedish Academy of Sciences. https://naturalcapitalproject.stanford.edu/software/invest.
- Ndong, G.O.; Therond, O.; Cousin, I. Analysis of relationships between ecosystem services: A generic classification and review of the literature. Ecosyst. Serv. 2020, 43, 101120. [Google Scholar] [CrossRef]
- Nearing, M. A., Pruski, F. F., & O’neal, M. R. (2004). Expected climate change impacts on soil erosion rates: a review. Journal of soil and water conservation, 59(1), 43-50.
- Nelson, E., Mendoza, G., Regetz, J., Polasky, S., Tallis, H., Cameron, D. R., Chan, K. M. A., Daily, G. C., Goldstein, J., Kareiva, P. M., Lonsdorf, E., Naidoo, R., Ricketts, T. H., & Shaw, M. R. (2009). Modeling multiple ecosystem services, biodiversity conservation, commodity production, and tradeoffs at landscape scales. Frontiers in Ecology and the Environment, 7(1), 4-11.
- OECD (1993) OECD core set of indicators for environmental performance reviews. A synthesis report by the group on the State of the Environment. OECD, Paris. Available online: http://www.oecd.org/officialdocuments/publicdisplaydocumentpdf/?cote=OCDE/GD(93)179&docLanguage=En (accessed on 18 October 2018).
- Panagos, P.; Borrelli, P.; Meusburger, K.; Alewell, C.; Lugato, E.; Montanarella, L. Estimating the soil erosion cover-management factor at the European scale. Land Use Policy 2015, 48, 38–50. [Google Scholar] [CrossRef]
- Patrício, J.; Elliott, M.; Mazik, K.; Papadopoulou, K.-N.; Smith, C.J. DPSIR—Two Decades of Trying to Develop a Unifying Framework for Marine Environmental Management? Front. Mar. Sci. 2016, 3. [Google Scholar] [CrossRef]
- Pe'Er, G.; Bonn, A.; Bruelheide, H.; Dieker, P.; Eisenhauer, N.; Feindt, P.H.; Hagedorn, G.; Hansjürgens, B.; Herzon, I.; Lomba. ; et al. Action needed for the EU Common Agricultural Policy to address sustainability challenges. People Nat. 2020, 2, 305–316. [Google Scholar] [CrossRef] [PubMed]
- Petropoulos, G. P., & Islam, T. (Eds.). (2017). Remote Sensing of Hydrometeorological Hazards. CRC Press.
- Pimentel, D.; Kounang, N. Ecology of Soil Erosion in Ecosystems. Ecosystems 1998, 1, 416–426. [Google Scholar] [CrossRef]
- Pindozzi, S.; Cervelli, E.; Recchi, P.F.; Capolupo, A.; Boccia, L. Predicting land use change on a broad area: Dyna-CLUE model application to the Litorale Domizio-Agro Aversano (Campania, South Italy). J. Agric. Eng. 2017, 48, 27. [Google Scholar] [CrossRef]
- Pindozzi, S., Faugno, S., Cervelli, E., Capolupo, A., Sannino, M., & Boccia, L. (2013). Consequence of land use changes into energy crops in Campania region. JAE, 44(s1), 90.
- Pontius, R.; Schneider, L.C. Land-cover change model validation by an ROC method for the Ipswich watershed, Massachusetts, USA. Agric. Ecosyst. Environ. 2001, 85, 239–248. [Google Scholar] [CrossRef]
- Potschin, M.; Haines-Young, R. Defining and Measuring Ecosystem Services. Routledge handbook of ecosystem services 2016, 1, 25–44. [Google Scholar] [CrossRef]
- Praskievicz, S.; Chang, H. A review of hydrological modelling of basin-scale climate change and urban development impacts. Prog. Phys. Geogr. Earth Environ. 2009, 33, 650–671. [Google Scholar] [CrossRef]
- Primdahl, J. Agricultural Landscape Sustainability under Pressure: Policy Developments and Landscape Change. Landsc. Res. 2014, 39, 123–140. [Google Scholar] [CrossRef]
- Quaranta, M., Medrzycki, P., Porrini, C., Romagnoli, F., Celli, G., Maini, S., Longo, S., Mazzeo, G., Ricciardelli D’Albore, G., Palmieri, N., Comba, L., Piatti, C., Pinzauti, M., Felicioli, A., Ambroselli, S., Nardi, E., Niccolini, L., Piazza, M. G., Intoppa, F., Carini, A., Floris, I., Satta, A., Marletto, F., Manino, A., Patetta, A., Comoli, R., Porporato, M., Zandigiacomo, P., Cogoi, P., Barro, P. (2002, March). Il censimento dei pronubi selvatici in Italia, con particolare riferimento agli Imenotteri Apoidei. Proceedings of the final Congress AMA Project “Il Ruolo della Ricerca in Apicoltura”, Bologna, Italy, 333-344.
- Randelli, F.; Martellozzo, F. Is rural tourism-induced built-up growth a threat for the sustainability of rural areas? The case study of Tuscany. Land Use Policy 2019, 86, 387–398. [Google Scholar] [CrossRef]
- Rapport, D., and Friend, A. (1979). Towards a Comprehensive Framework for Environmental Statistics: A Stress-Response Approach. Statistics Canada Catalogue 11-510. Ottawa: Minister of Supply and Services Canada.
- Rawlins, B. G., Harris, J., Price, S., & Bartlett, M. (2015). A review of climate change impacts on urban soil functions with examples and policy insights from E ngland, UK. Soil use and management, 31, 46-61.
- Ren, Y.; Lü, Y.; Comber, A.; Fu, B.; Harris, P.; Wu, L. Spatially explicit simulation of land use/land cover changes: Current coverage and future prospects. Earth-Science Rev. 2019, 190, 398–415. [Google Scholar] [CrossRef]
- Richardson, L.; Loomis, J.; Kroeger, T.; Casey, F. The role of benefit transfer in ecosystem service valuation. Ecol. Econ. 2015, 115, 51–58. [Google Scholar] [CrossRef]
- Ricketts, T.H. Tropical Forest Fragments Enhance Pollinator Activity in Nearby Coffee Crops. Conserv. Biol. 2004, 18, 1262–1271. [Google Scholar] [CrossRef]
- Ricketts, T.H.; Williams, N.M.; Mayfield, M.M. Connectivity and ecosystem services: crop pollination in agricultural landscapes. 2006, 255–290. [Google Scholar] [CrossRef]
- Rinaldi, A. (2021). Biodiversity 2030: a road paved with good intentions: The new EU Commission’s biodiversity Strategy risks to remain an empty husk without proper implementation. EMBO reports, 22(6), e53130.
- Romano, G.; Sasso, P.D.; Liuzzi, G.T.; Gentile, F. Multi-criteria decision analysis for land suitability mapping in a rural area of Southern Italy. Land Use Policy 2015, 48, 131–143. [Google Scholar] [CrossRef]
- Ruiz-Mallén, I.; Heras, M. What Sustainability? Higher Education Institutions’ Pathways to Reach the Agenda 2030 Goals. Sustainability 2020, 12, 1290. [Google Scholar] [CrossRef]
- Shoyama, K.; Yamagata, Y. Predicting land-use change for biodiversity conservation and climate-change mitigation and its effect on ecosystem services in a watershed in Japan. Ecosyst. Serv. 2014, 8, 25–34. [Google Scholar] [CrossRef]
- Smith, D. D., Wischmeier, W. H. (1962). Rainfall erosion. Advances in agronomy, 14, 109-148.
- Smith, P. Carbon sequestration in croplands: the potential in Europe and the global context. Eur. J. Agron. 2004, 20, 229–236. [Google Scholar] [CrossRef]
- TEEB Foundations (2010). The Economics of Ecosystems and Biodiversity: Ecological and Economic Foundations. Earthscan, London and Washington (2010)s.
- TEEB Synthesis (2010). TEEB Synthesis. Mainstreaming the Economics of Nature: A Synthesis of the Approach, Conclusions and Recommendations of TEEB. Earthscan, London and Washington (2010).
- Tianhong, L. Wenkai, L, Zhenghan, Q. (2010). Variations in ecosystem service value in response to land use changes in Shenzhen. Ecol. Econ., 69 (2010), pp. 1427-1435.
- UN. 2015. United Nations. General Assembly. Resolution adopted on 25 September 2015. Transforming our World: The 2030 Agenda for Sustainable Development. Available online: http://www.un.org/ga/search/view_doc.asp?symbol=A/RES/70/1&Lang=E (accessed on 24 October 2018).
- Unger, P. W., & McCalla, T. M. (1980). Conservation tillage systems. In Advances in Agronomy (Vol. 33, pp. 1-58). Academic Press.
- Unger, P.; Stewart, B.; Parr, J.; Singh, R. Crop residue management and tillage methods for conserving soil and water in semi-arid regions. Soil Tillage Res. 1991, 20, 219–240. [Google Scholar] [CrossRef]
- van der Knijff, J. M., Jones, R. J. A., & Montanarella, L. (2000). Soil erosion risk assessment in Europe. European Soil Bureau, Joint Research Centre, Space Applications Institute.
- van Vliet, J.; Bregt, A.K.; Brown, D.G.; van Delden, H.; Heckbert, S.; Verburg, P.H. A review of current calibration and validation practices in land-change modeling. Environ. Model. Softw. 2016, 82, 174–182. [Google Scholar] [CrossRef]
- Velasco-Muñoz, J. F., Mendoza, J. M. F., Aznar-Sánchez, J. A., & Gallego-Schmid, A. (2021). Circular economy implementation in the agricultural sector: Definition, strategies and indicators. Resources, Conservation and Recycling, 170, 105618.
- Veldkamp, A.; Lambin, E.F. Predicting land-use change. Agric. Ecosyst. Environ. 2001, 85, 1–6. [Google Scholar] [CrossRef]
- Verburg, P.H.; Overmars, K.P. Combining top-down and bottom-up dynamics in land use modeling: exploring the future of abandoned farmlands in Europe with the Dyna-CLUE model. Landsc. Ecol. 2009, 24, 1167–1181. [Google Scholar] [CrossRef]
- Verburg, P.H.; Veldkamp, A. Projecting land use transitions at forest fringes in the Philippines at two spatial scales. Landsc. Ecol. 2004, 19, 77–98. [Google Scholar] [CrossRef]
- Verburg, P.H.; Alexander, P.; Evans, T.; Magliocca, N.R.; Malek, Z.; DA Rounsevell, M.; van Vliet, J. Beyond land cover change: towards a new generation of land use models. Curr. Opin. Environ. Sustain. 2019, 38, 77–85. [Google Scholar] [CrossRef]
- Verburg, P.H.; Soepboer, W.; Veldkamp, A.; Limpiada, R.; Espaldon, V.; Mastura, S.S.A. Modeling the Spatial Dynamics of Regional Land Use: The CLUE-S Model. Environ. Manag. 2002, 30, 391–405. [Google Scholar] [CrossRef]
- Verhagen, W.; Van Teeffelen, A.J.A.; Compagnucci, A.B.; Poggio, L.; Gimona, A.; Verburg, P.H. Effects of landscape configuration on mapping ecosystem service capacity: a review of evidence and a case study in Scotland. Landsc. Ecol. 2016, 31, 1457–1479. [Google Scholar] [CrossRef]
- von Haaren, C., Lovett, A. A., & Albert, C. (2019). Theories and Methods for Ecosystem Services Assessment in Landscape Planning. Landscape planning with ecosystem services: Theories and methods for application in Europe, 19-42.
- von Thenen, M.; Frederiksen, P.; Hansen, H.S.; Schiele, K.S. A structured indicator pool to operationalize expert-based ecosystem service assessments for marine spatial planning. Ocean Coast. Manag. 2020, 187. [Google Scholar] [CrossRef]
- Wischmeier, W. H., & Smith, D. D. (1978). Predicting rainfall erosion losses-A guide to conservation planning. USDA, Agricultural Handbook No. 537. Government Printing Office, Washington, DC, USA.
- Wotlolan, D.L.; Lowry, J.H.; Wales, N.A.; Glencross, K. Land suitability evaluation for multiple crop agroforestry planning using GIS and multi-criteria decision analysis: A case study in Fiji. Agrofor. Syst. 2021, 95, 1519–1532. [Google Scholar] [CrossRef]
- Wu, J. Landscape sustainability science (II): core questions and key approaches. Landsc. Ecol. 2021, 36, 2453–2485. [Google Scholar] [CrossRef]
- Xiong, M.; Sun, R.; Chen, L. A global comparison of soil erosion associated with land use and climate type. Geoderma 2019, 343, 31–39. [Google Scholar] [CrossRef]
- Xu, L.; Li, Z.; Song, H.; Yin, H. Land-Use Planning for Urban Sprawl Based on the CLUE-S Model: A Case Study of Guangzhou, China. Entropy 2013, 15, 3490–3506. [Google Scholar] [CrossRef]
- Yang, J.-L.; Zhang, G.-L. Water infiltration in urban soils and its effects on the quantity and quality of runoff. J. Soils Sediments 2011, 11, 751–761. [Google Scholar] [CrossRef]
- Zhang, P.; He, L.; Fan, X.; Huo, P.; Liu, Y.; Zhang, T.; Pan, Y.; Yu, Z. Ecosystem Service Value Assessment and Contribution Factor Analysis of Land Use Change in Miyun County, China. Sustainability 2015, 7, 7333–7356. [Google Scholar] [CrossRef]
- Zhou, B.-B.; Wu, J.; Anderies, J.M. Sustainable landscapes and landscape sustainability: A tale of two concepts. Landsc. Urban Plan. 2019, 189, 274–284. [Google Scholar] [CrossRef]
- Zhou, J.; Wu, J.; Gong, Y. Valuing wetland ecosystem services based on benefit transfer: A meta-analysis of China wetland studies. J. Clean. Prod. 2020, 276, 122988. [Google Scholar] [CrossRef]
Figure 1.
Study area. Campania region in southern Italy.
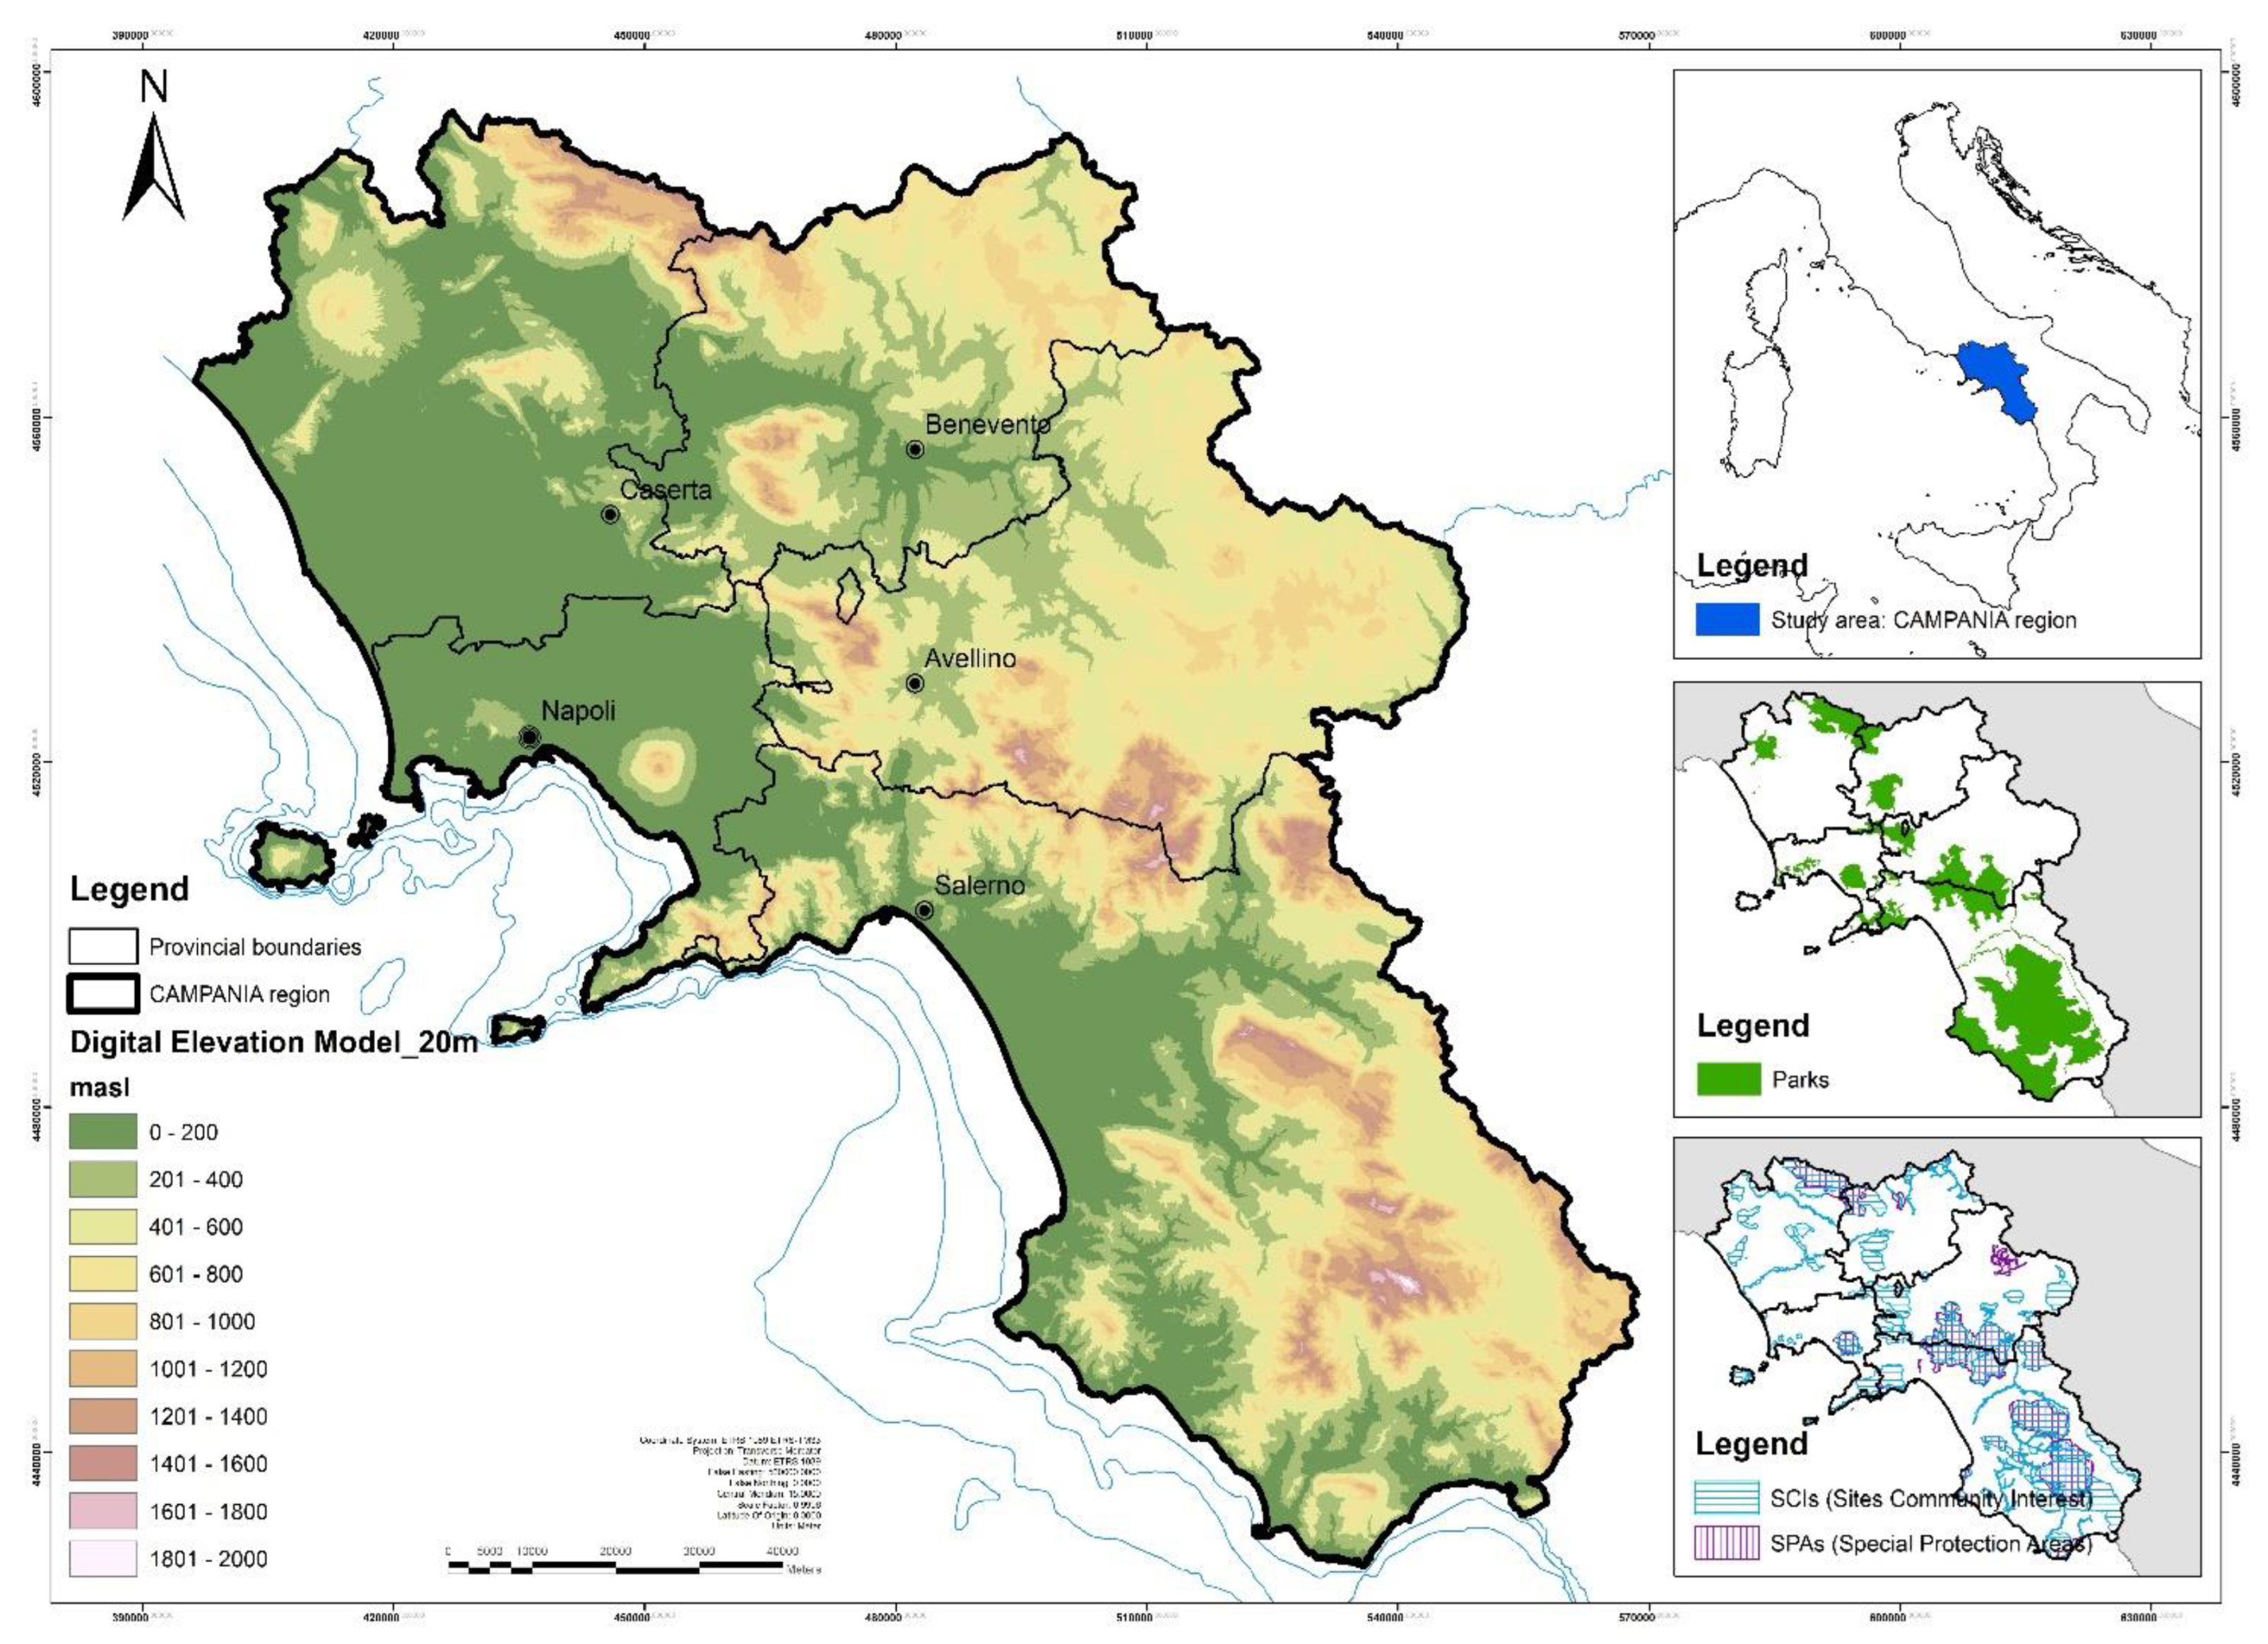
Figure 2.
The DPSIR model and case-study implications.
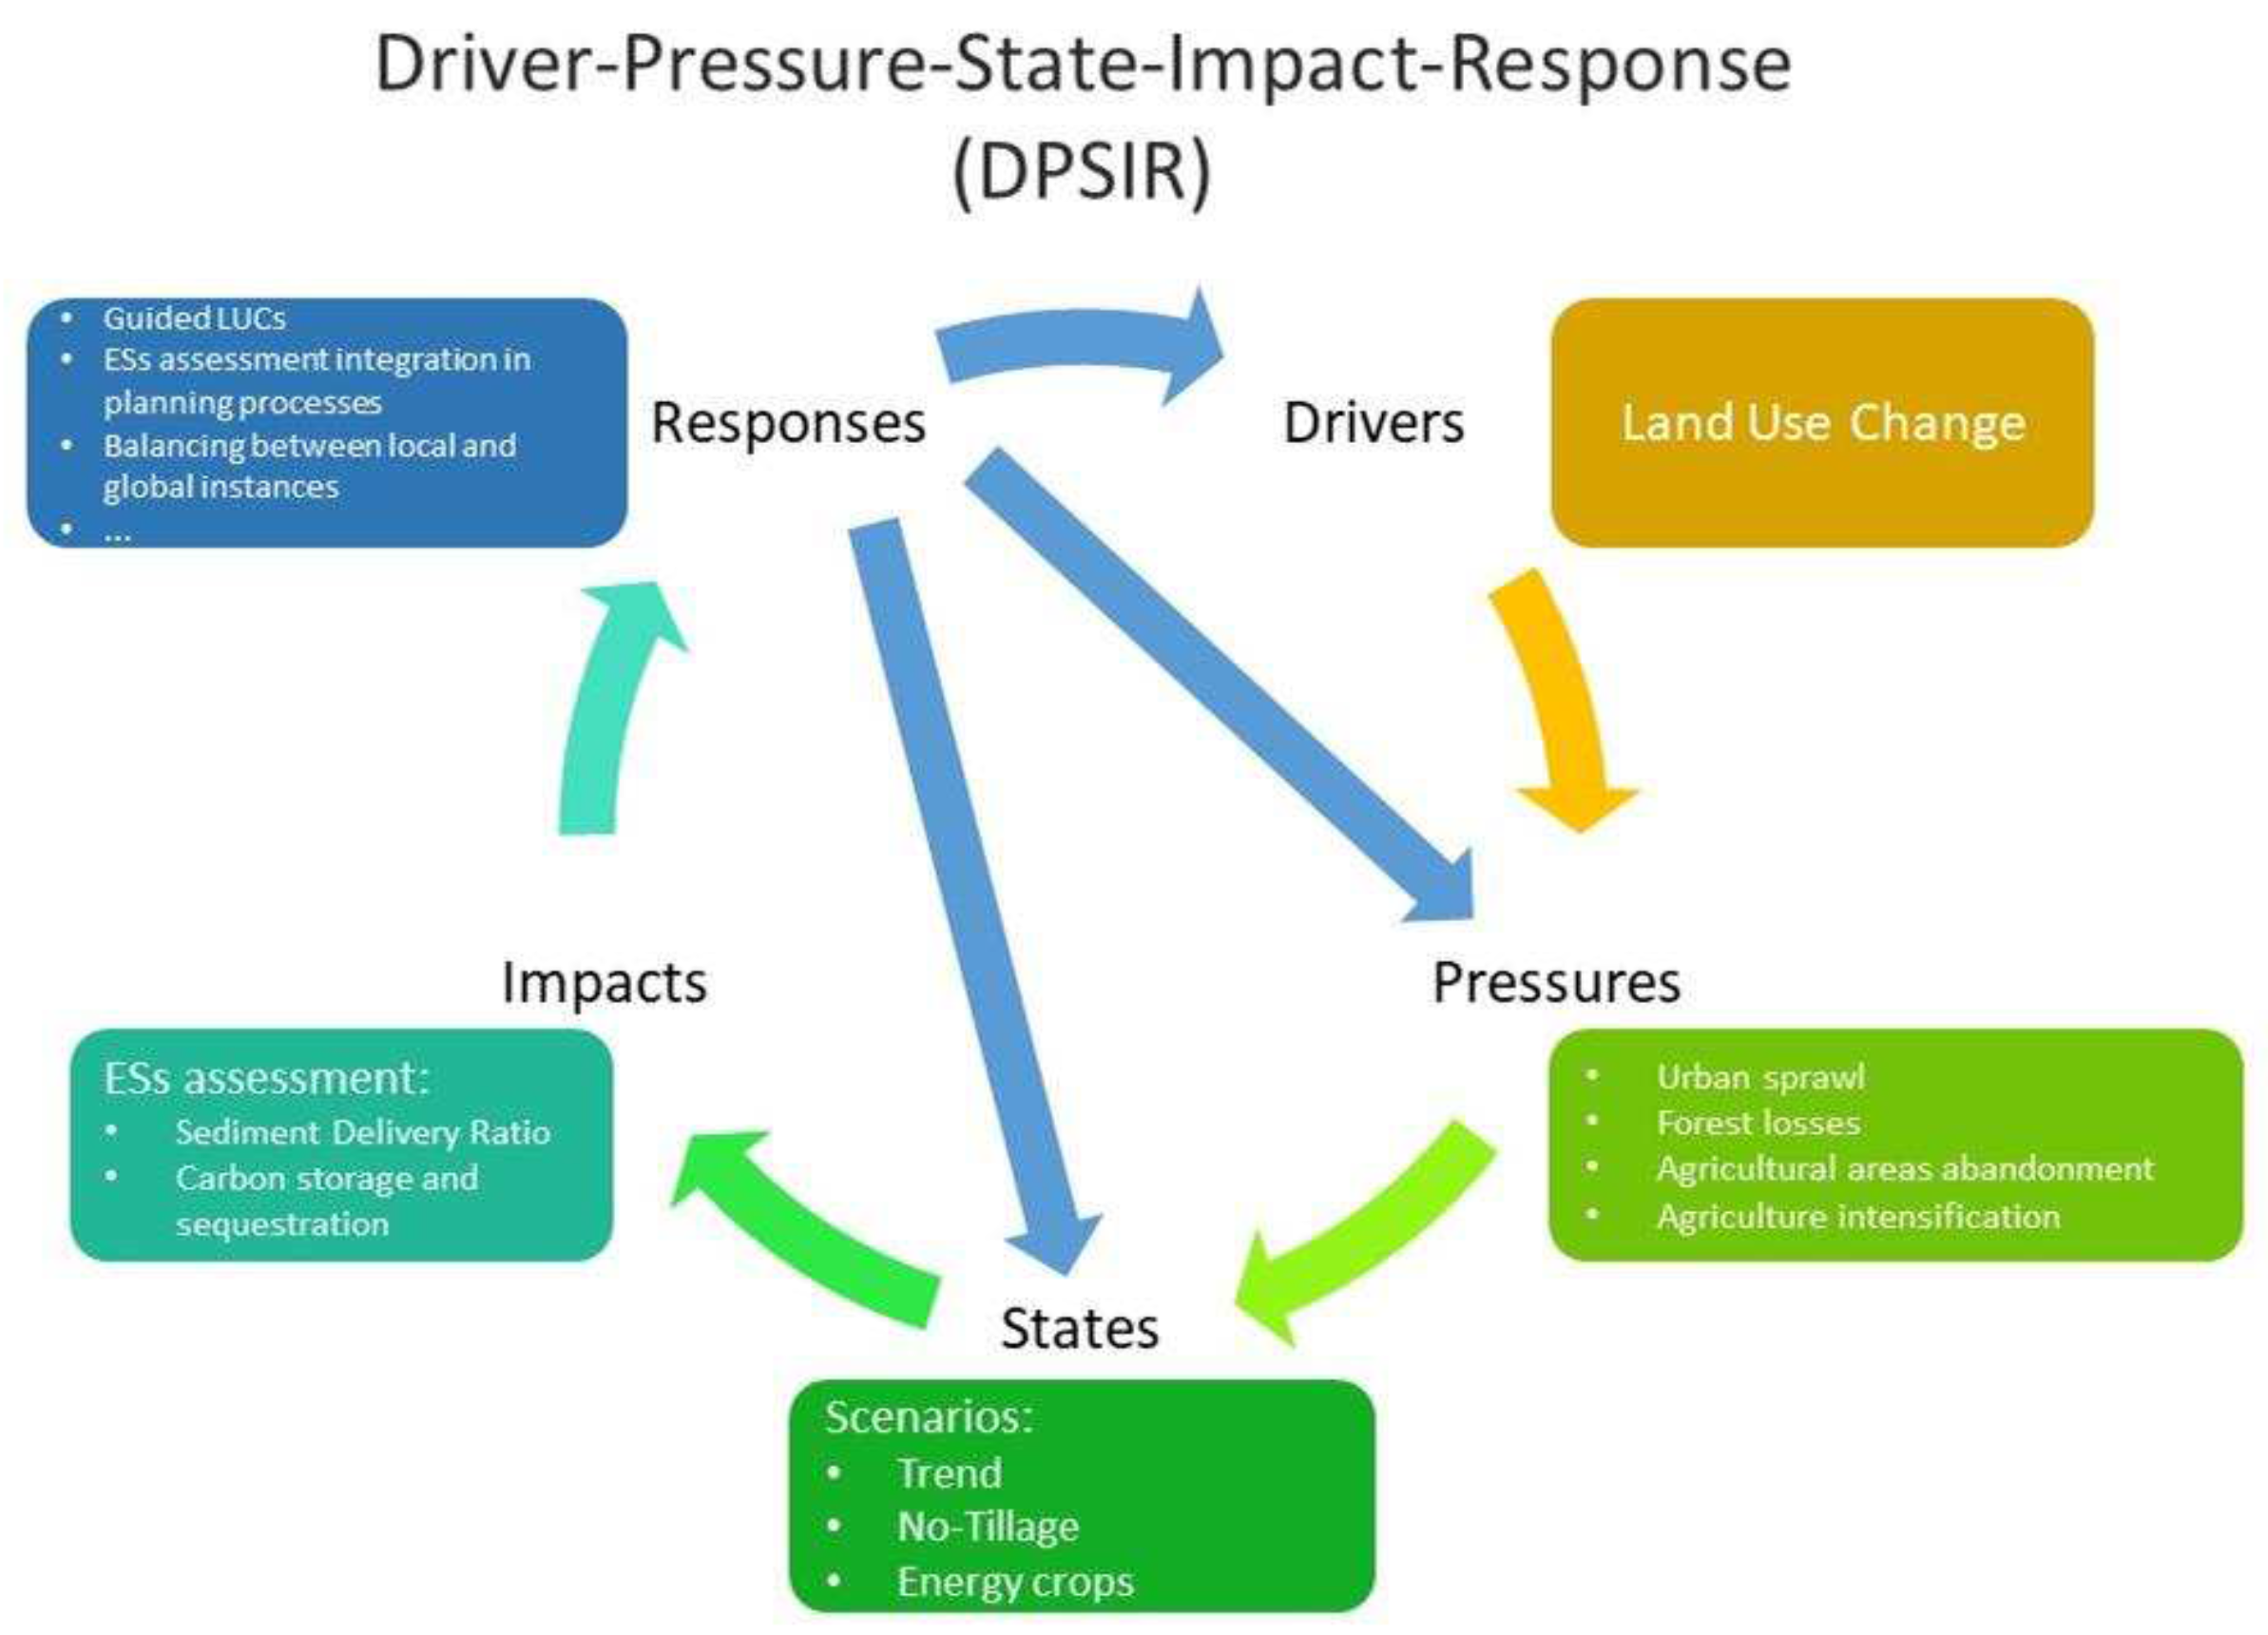
Figure 3.
The Sediment Delivery Ratio service assessment.
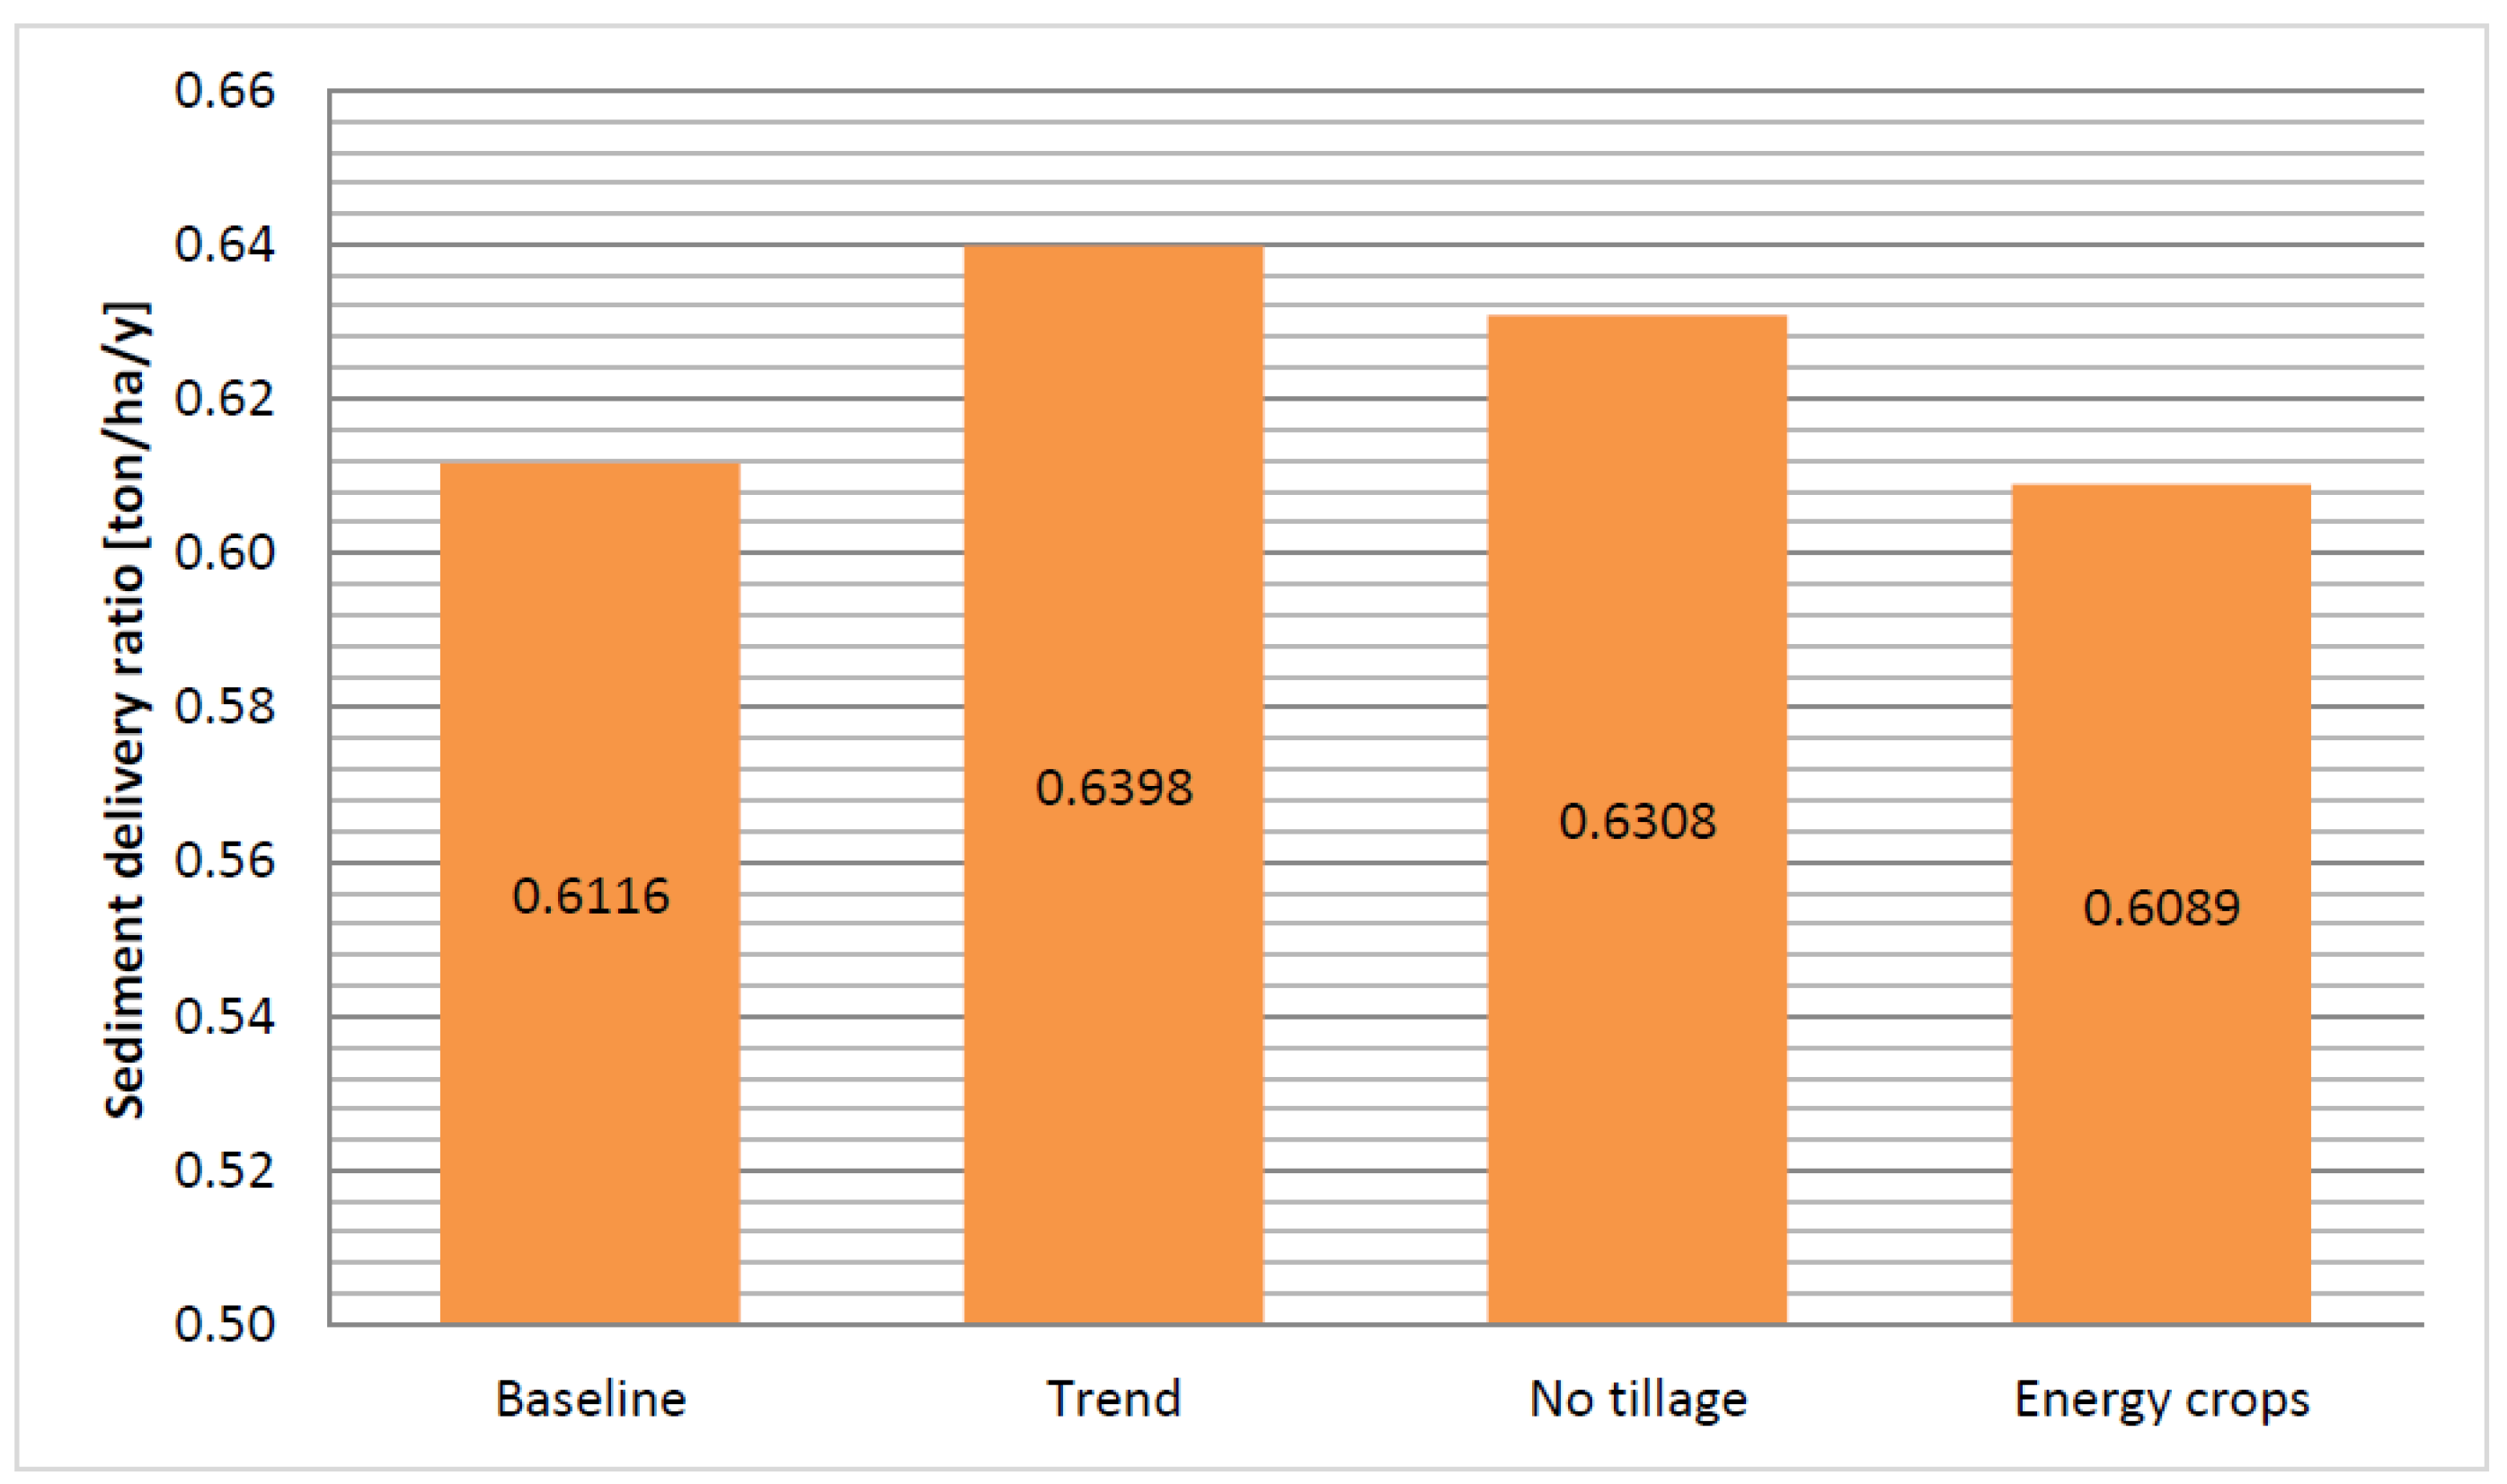
Figure 4.
The Carbon Storage and Sequestration service assessment.
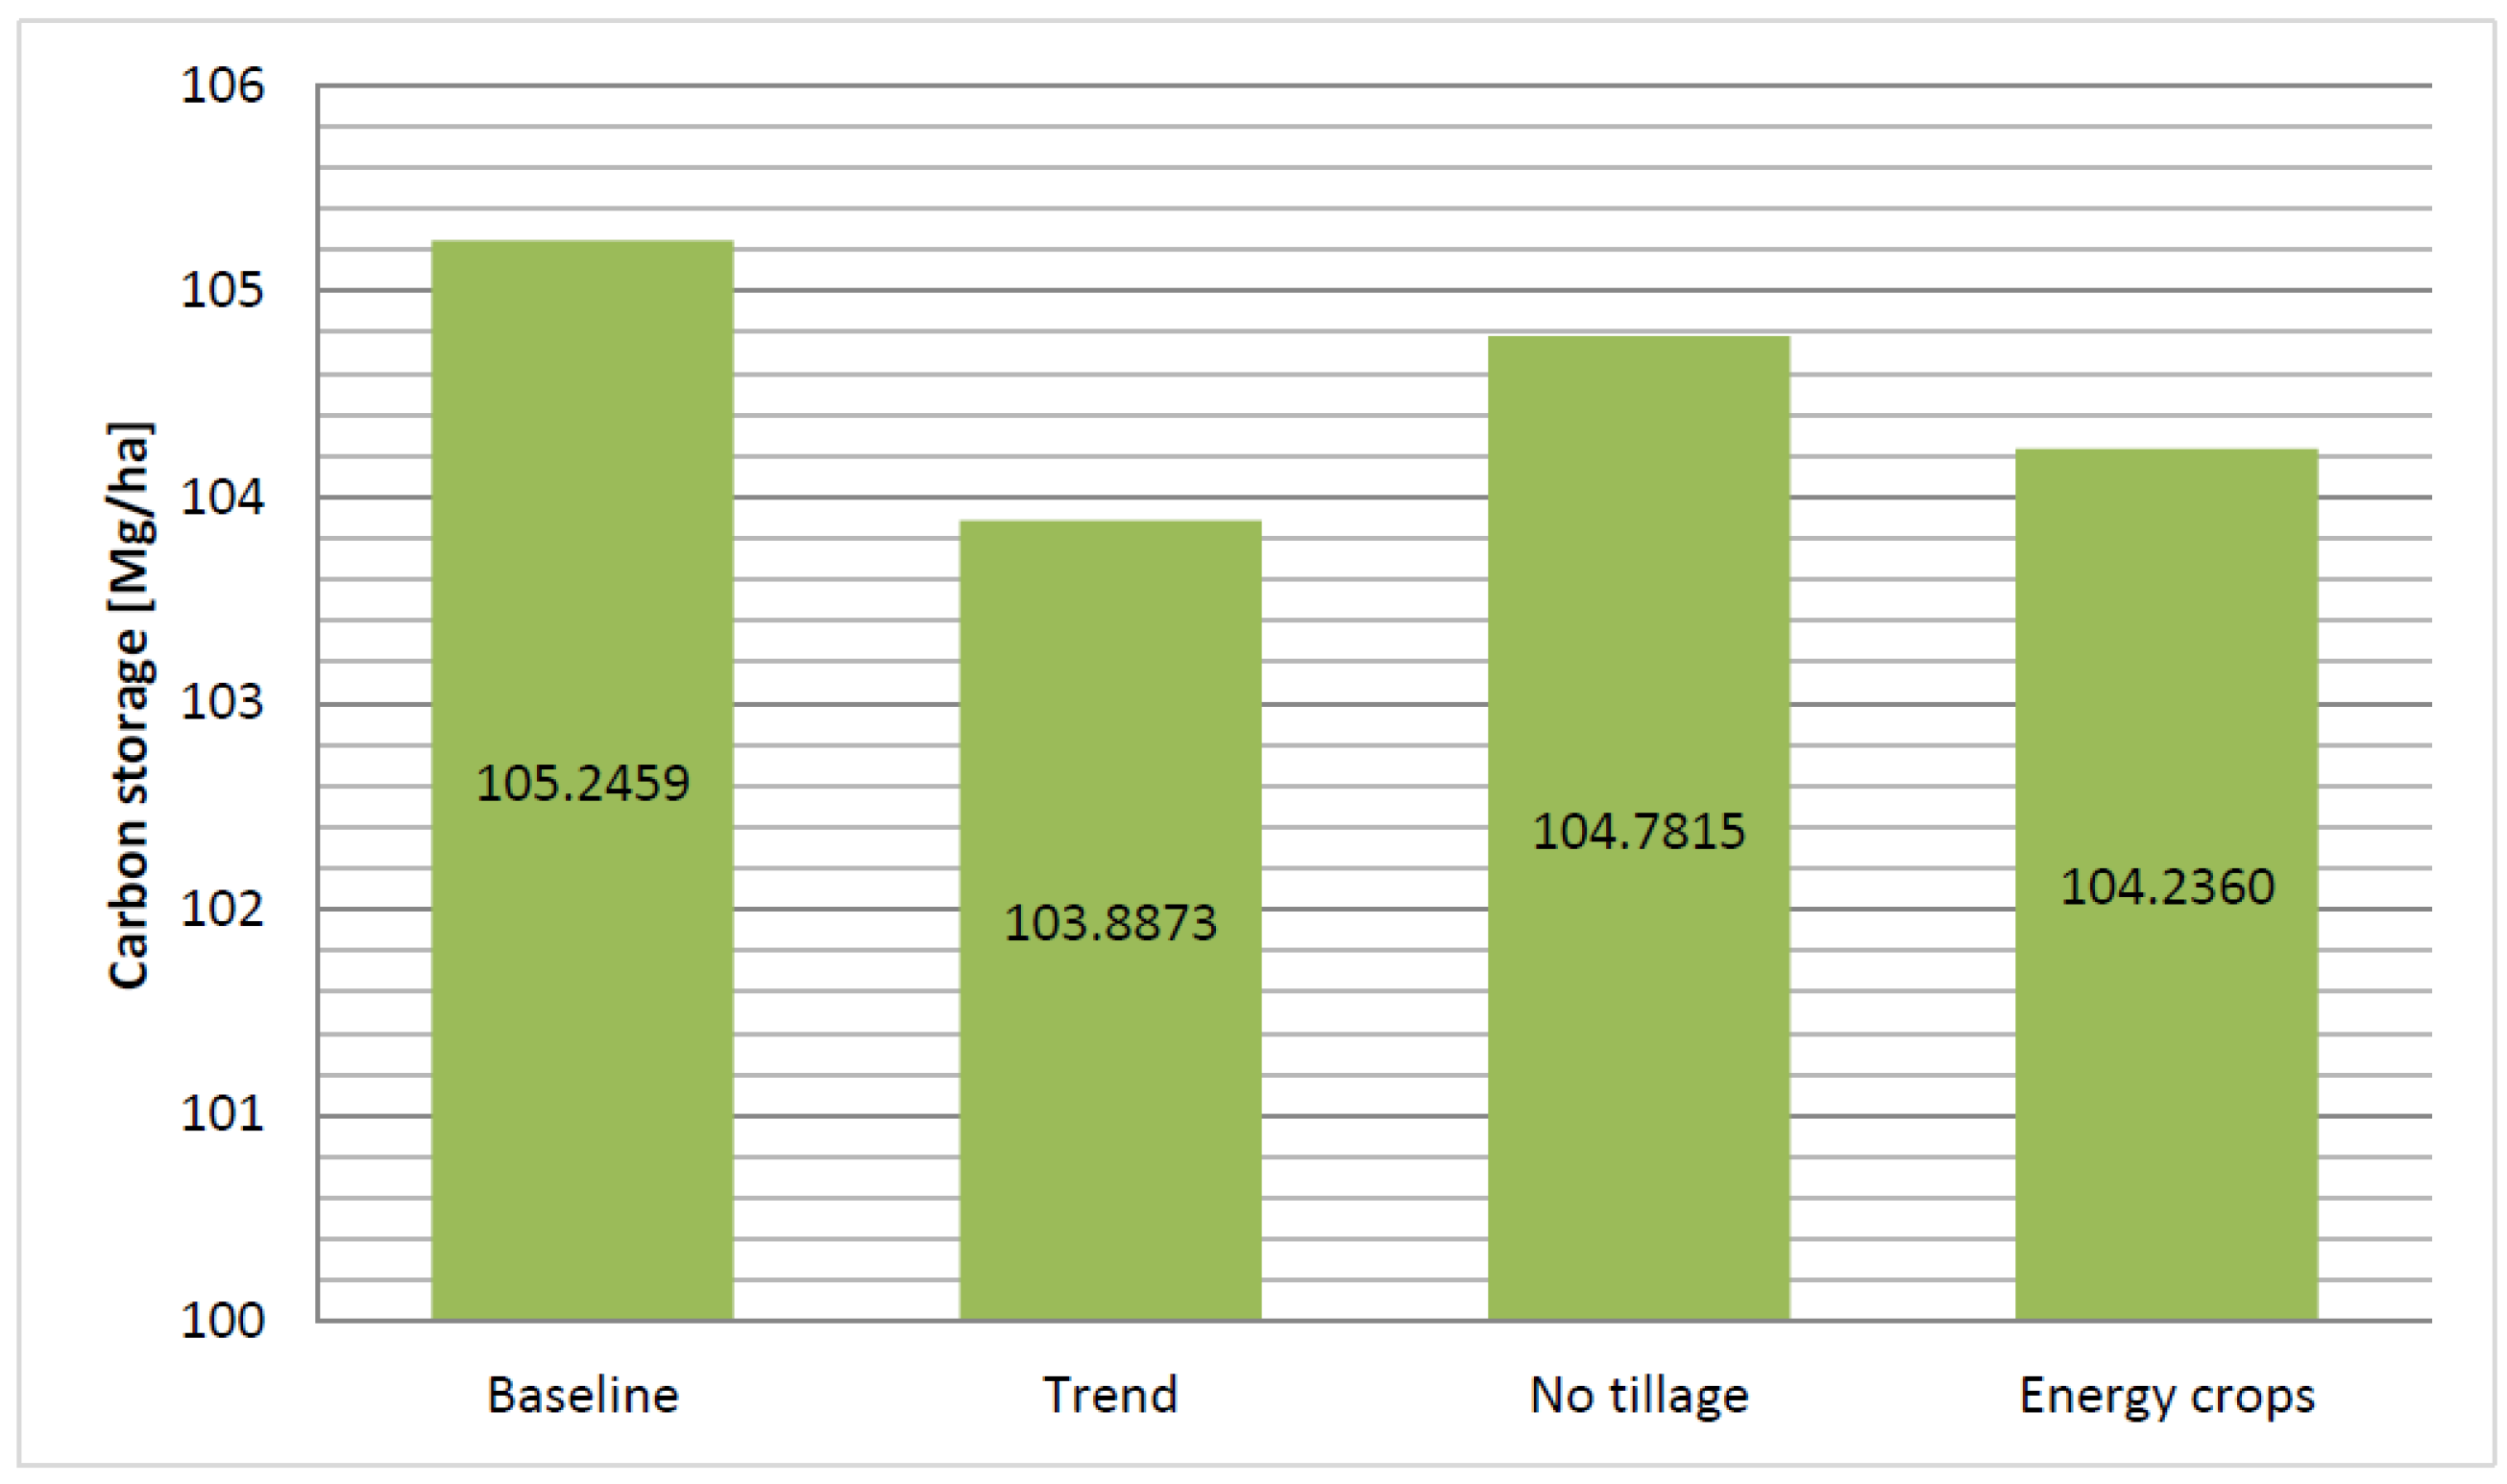

Table 1.
Land-use map classes, CLC classes correspondence and Conversion elasticity.
| Land Cover | Corresponding CLC Classes | Description | Conversion Elasticity |
|---|---|---|---|
| Urban areas | 1.1, 1.4 | Residential buildings, leisure facilities and non-agricultural vegetated areas. | 1 |
| Industrial areas and infrastructures | 1.2, 1.3 | Industrial and commercial buildings, transportation facilities, quarries and dumps. | 1 |
| Non-irrigated arable land | 2.1.1 | Non-irrigated arable land. | 0.2 |
| Irrigated arable land | 2.1.2 | Irrigated arable land. | 0.3 |
| Permanent crops | 2.2, 2.4 | Olive groves, vineyards, orchards, agroforestry crops, associated crops, protected crops and complex cultural patterns. | 0.5 |
| Grassland and pastures | 2.3, 3.2, 3.3.3, 3.3.4 | Predominantly grass-vegetated open spaces, possibly including sparse shrubs, trees or bare ground spots. | 0.1 |
| Forests | 3.1 | Forests. | 0.8 |
| Energy crops* | - | Crops for bioremediation of polluted soils experimented by ECOREMED project, not included in CLC classification. | 0.3 |
| Other land covers | 3.3.1, 3.3.2, 4, 5 | Beaches, bare ground, wetlands and water bodies. | 1 |
Table 2.
The conversion matrix representing the allowed changes between different land-cover types.
| Urban areas | Industrial areas and infrastructures | Non-irrigated arable land | Irrigated arable land | Permanent crops | Grassland and pastures | Forests | Energy crops* | Other land covers | |
|---|---|---|---|---|---|---|---|---|---|
| Urban areas | 1 | 0 | 0 | 0 | 0 | 0 | 0 | 0 | 0 |
| Industrial areas and infrastructures | 0 | 1 | 0 | 0 | 0 | 0 | 0 | 0 | 0 |
| Non-irrigated arable land | 1 | 1 | 1 | 1 | 1 | 1 | 0 | 1 | 0 |
| Irrigated arable land | 1 | 1 | 1 | 1 | 1 | 1 | 0 | 1 | 0 |
| Permanent crops | 1 | 1 | 1 | 1 | 1 | 1 | 0 | 1 | 0 |
| Grassland and pastures | 1 | 1 | 1 | 1 | 1 | 1 | 0 | 1 | 0 |
| Forests | 1 | 1 | 1 | 1 | 1 | 1 | 1 | 1 | 0 |
| Energy crops* | 1 | 1 | 1 | 1 | 1 | 1 | 0 | 1 | 0 |
| Other land covers | 0 | 0 | 0 | 0 | 0 | 0 | 0 | 0 | 1 |
Table 3.
Geophysical and anthropic factors used as independent variables of the regression analysis.
Table 3.
Geophysical and anthropic factors used as independent variables of the regression analysis.
| Sequence (as used in regression) | Factor (driving force) | Type of variable |
|---|---|---|
| 1 | Elevation | Continous |
| 2 | Slope | Continous |
| 3 | Aspect | Continous |
| 4 | Soil (Andosols) | Dummy |
| 5 | Soil (Cambisols) | Dummy |
| 6 | Soil (Luvisols) | Dummy |
| 7 | Soil (Calcisols) | Dummy |
| 8 | Soil (Vertisols) | Dummy |
| 9 | Distance to roads | Continous |
| 10 | Distance to settlements | Continous |
| 11 | Distance to streams | Continous |
| 12 | Distance to coast | Continous |
| 13 | Population density | Continous |
| 14 | Temperatures | Continous |
| 15 | Rainfall | Continous |
Table 4.
Sediment Delivery Ratio – Input data and calibration parameters.
| Input data | Type | Unit | Data Source |
|---|---|---|---|
| DEM | Raster map | m | DTM Digital Terrain Model 20m (https://data.europa.eu/data/datasets/m_amte-299fn3-eba41113-4141-4d46-9cdf-b0848deec44d?locale=it) |
| Rainfall erosivity index (R) | Raster maps | MJ⋅mm⋅ (ha⋅h⋅y)-1 | The R factor was calculated, starting from 128 pluviometric stations in Campania region, in compliance with Arnoldus equation and interpolated via the ArcGIS Kringing geostatistical analyst. |
| Soil erodibility (K) | Raster map | t⋅ha⋅h⋅ (ha⋅MJ⋅mm)-1 | The K factor was calculated in compliance with da Renard equation and interpolated via the ArcGIS Kringing geostatistical analyst tool. |
| Land use/land cover (LULC) | Raster map | Adimensional | The Land use maps were developed according the three scenarios via Dyna-CLUE model. |
| Watersheds | Polygon shapefile | Adimensional | The watersheds were obtained starting from the DTM, via Hydrology tollset - Convert to shapefile. |
| Biophysical table | CSV table | Adimensional | The USLE “C” factor (coverage management factor) was obtained starting from LANDUM model (section 2.3.1.1). The USLE “P” factor (support practice factor) was assumed to be equal to 1. |
| Threshold flow accumulation (TFA) | Number value | Adimensional | Derived from DTM via ArcGIS hydrology toolset. |
| kb and IC0 | Number value | Adimensional | The used values, derived from literature are kb=2 and IC0=0.5 (Sharp et al., 2020). |
| SDRmax | Number value | Adimensional | The used value, derived from literature is 0.8 (Vigiak et al., 2012). |
Table 5.
C-factor values for non-arable land.
| Land cover | Further detail | Literature C-factor |
|---|---|---|
| Urban areas | - | 0.00 |
| Industrial areas and infrastructures | - | 0.00 |
| Arable land | Autumn-winter cereals | 0.20 |
| Corn | 0.38 | |
| Legumes | 0.32 | |
| Potatoes | 0.34 | |
| Vegetables | 0.36 | |
| Oilseeds | 0.28 | |
| Fodder intercrops | 0.20 | |
| Meadow | 0.05 | |
| Fallow land | 0.50 | |
| Permanent crops | - | 0.30 |
| Grassland and pastures | - | 0.05 |
| Forests | - | 0.03 |
| Energy crops* | - | 0.04 |
| Other land covers | - | 0.00 |
* Value was obtained from the “A. donax” cover class (Fagnano et al., 2015).
Table 6.
Carbon stocks values for each land-cover type, derived from IPCC reference values.
| Land cover | C stock under 10% reduced tillage* [Mg/ha] | C stock under 25% reduced tillage** [Mg/ha] |
|---|---|---|
| Urban areas | 1.5 | 1.5 |
| Industrial areas and infrastructures | 8 | 8 |
| Non-irrigated arable land | 42 | 48 |
| Irrigated arable land | 42 | 42 |
| Permanent crops | 60 | 60 |
| Grassland and pastures | 86 | 86 |
| Forests | 243 | 243 |
| Energy crops | 62 | - |
| Other land covers | 0 | 0 |
Table 7.
Coefficients derived from logit model linking land-cover distribution to its driving factors in the Dyna-CLUE framework.
Table 7.
Coefficients derived from logit model linking land-cover distribution to its driving factors in the Dyna-CLUE framework.
| Variable | Urban areas | Industrial areas and infrastructures | Non-irrigated arable land | Irrigated arable land | Permanent crops | Grassland and pastures | Forests | Energy crops | Other land covers |
|---|---|---|---|---|---|---|---|---|---|
| Elevation | -0.001 | -0.004 | 0.001 | -0.006 | -0.001 | 0.002 | 0.001 | 0.004 | -0.002 |
| Slope | -0.031 | -0.096 | -0.175 | -1.360 | -0.011 | 0.039 | 0.079 | -0.056 | 0.022 |
| Aspect | n.s. | n.s. | n.s. | n.s. | n.s. | 0.001 | n.s. | n.s. | -0.003 |
| Soil (Andosols) | -0.322 | 0.932 | -0.581 | -0.941 | 1.569 | 0.479 | 0.223 | 1.762 | -2.308 |
| Soil (Cambisols) | n.s. | n.s. | -0.124 | 3.077 | 1.450 | 0.129 | -0.107 | 2.702 | -1.513 |
| Soil (Luvisols) | 0.115 | 0.578 | 0.160 | 0.576 | 1.469 | n.s. | -0.205 | 1.977 | -2.762 |
| Soil (Calcisols) | n.s. | n.s. | n.s. | n.s. | 1.841 | -0.457 | n.s. | 3.100 | -3.447 |
| Soil (Vertisols) | 0.222 | n.s. | 0.651 | n.s. | 0.959 | -0.662 | -0.471 | 3.546 | -3.633 |
| Distance to roads | -0.004 | n.s. | n.s. | n.s. | -0.001 | n.s. | n.s. | -0.001 | n.s. |
| Distance to settlements | -0.003 | 0.001 | n.s. | n.s. | n.s. | n.s. | n.s. | n.s. | n.s. |
| Distance to streams | n.s | n.s. | n.s. | n.s. | n.s. | n.s. | n.s. | n.s. | 0.001 |
| Distance to coast | n.s. | n.s. | n.s. | n.s. | n.s. | n.s. | n.s. | n.s. | n.s. |
| Population density | 722.533 | 96.455 | -1503.435 | -2214.155 | -997.370 | -1593.264 | -1612.075 | -954.241 | -760.251 |
| Temperatures | -0.258 | n.s. | 0.339 | n.s. | 0.209 | 0.279 | n.s. | 0.552 | n.s. |
| Rainfall | -0.001 | n.s. | -0.001 | -0.006 | n.s. | -0.001 | 0.001 | 0.001 | -0.001 |
| Constant (β0) | 6.909 | -6.101 | -5.519 | 2.825 | -5.480 | -7.256 | -4.172 | -15.732 | -1.904 |
| ROC* | 0.974 | 0.748 | 0.887 | 0.989 | 0.806 | 0.858 | 0.929 | 0.882 | 0.803 |
Table 8.
Past LUCs (2006-2018) - Contingency matrix of land-use transitions. On the rows the land cover classes composition in the year 2006, on the columns the composition of the land-cover classes in the year 2018. On the diagonal the unchanged surfaces.
Table 8.
Past LUCs (2006-2018) - Contingency matrix of land-use transitions. On the rows the land cover classes composition in the year 2006, on the columns the composition of the land-cover classes in the year 2018. On the diagonal the unchanged surfaces.
| Recognized LUC 2006/2018 | Urban areas | Industrial areas and infrastructures | Non-irrigated arable land | Irrigated arable land | Permanent crops | Grassland and pastures | Forests | Other land covers | TOTAL 2006 [ha] |
|---|---|---|---|---|---|---|---|---|---|
| Urban areas | 71129 | 400 | 167 | 41 | 1027 | 11 | 42 | 0 | 72817 |
| Industrial areas and infrastructures | 163 | 9221 | 62 | 0 | 161 | 58 | 4 | 283 | 9952 |
| Non-irrigated arable land | 1878 | 3319 | 281059 | 592 | 14718 | 718 | 257 | 172 | 302713 |
| Irrigated arable land | 242 | 127 | 19 | 24507 | 66 | 249 | 0 | 0 | 25210 |
| Permanent crops | 8202 | 1578 | 3517 | 114 | 393618 | 2163 | 2071 | 17 | 411280 |
| Grassland and pastures | 399 | 976 | 3335 | 100 | 9640 | 131381 | 4503 | 248 | 150582 |
| Forests | 428 | 109 | 414 | 0 | 4260 | 3758 | 374245 | 93 | 383307 |
| Other land covers | 7 | 26 | 0 | 0 | 85 | 391 | 0 | 6082 | 6591 |
| TOTAL 2018 [ha] | 82448 | 15756 | 288573 | 25354 | 423575 | 138729 | 381122 | 6895 | 1362452 |
| Net gain/loss [ha] | +9631 | +5804 | -14140 | +144 | +12295 | -11853 | -2185 | +304 | 0 |
| Net gain/loss [%] | +13.2263 | +58.3199 | -4.6710 | +0.5712 | +2.9894 | -7.8714 | -0.5700 | +4.6123 | / |
| Simple annual rate [%] | +1.1021 | +4.8599 | -0.3892 | +0.0476 | +0.2491 | -0.6559 | -0.0475 | +0.3843 | / |
Table 9.
Trend scenario-TrS (2018-2030) - Contingency matrix of land-use transitions. On the rows the land cover classes composition in the year 2018, on the columns the composition of the land-cover classes in the year 2030. On the diagonal the unchanged surfaces.
Table 9.
Trend scenario-TrS (2018-2030) - Contingency matrix of land-use transitions. On the rows the land cover classes composition in the year 2018, on the columns the composition of the land-cover classes in the year 2030. On the diagonal the unchanged surfaces.
| Simulated LUC 2018/2030 | Urban areas | Industrial areas and infrastructures | Non-irrigated arable land | Irrigated arable land | Permanent crops | Grassland and pastures | Forests | Other land covers | TOTAL 2018 [ha] |
|---|---|---|---|---|---|---|---|---|---|
| Urban areas | 82448 | 0 | 0 | 0 | 0 | 0 | 0 | 0 | 82448 |
| Industrial areas and infrastructures | 0 | 15756 | 0 | 0 | 0 | 0 | 0 | 0 | 15756 |
| Non-irrigated arable land | 9280 | 2877 | 262897 | 3078 | 9235 | 1206 | 0 | 0 | 288573 |
| Irrigated arable land | 382 | 190 | 1959 | 22427 | 396 | 0 | 0 | 0 | 25354 |
| Permanent crops | 960 | 63 | 3 | 0 | 422546 | 3 | 0 | 0 | 423575 |
| Grassland and pastures | 1841 | 4643 | 2021 | 499 | 10176 | 119549 | 0 | 0 | 138729 |
| Forests | 1481 | 955 | 231 | 4 | 0 | 0 | 378451 | 0 | 381122 |
| Other land covers | 0 | 0 | 0 | 0 | 0 | 0 | 0 | 6895 | 6895 |
| TOTAL 2030 [ha] | 96392 | 24484 | 267111 | 26008 | 442353 | 120758 | 378451 | 6895 | 1362452 |
| Net gain/loss [ha] | 13944 | 8728 | -21462 | 654 | 18778 | -17971 | -2671 | 0 | 0 |
| Net gain/loss [%] | +16.9124 | +55.3947 | -7.4372 | +2.5794 | +4.4332 | -12.9540 | -0.7008 | 0 | / |
| Simple annual rate [%] | +0.9395 | +3.0774 | -0.4131 | +0.1433 | +0.2462 | -0.7196 | -0.0389 | 0 | / |
Table 10.
No-tillage scenario-NTS (2018-2030) - Contingency matrix of land-use transitions. On the rows the land cover classes composition in the year 2018, on the columns the composition of the land-cover classes in the year 2030. On the diagonal the unchanged surfaces.
Table 10.
No-tillage scenario-NTS (2018-2030) - Contingency matrix of land-use transitions. On the rows the land cover classes composition in the year 2018, on the columns the composition of the land-cover classes in the year 2030. On the diagonal the unchanged surfaces.
| Simulated LUC 2018/2030 | Urban areas | Industrial areas and infrastructures | Non-irrigated arable land | Irrigated arable land | Permanent crops | Grassland and pastures | Forests | Other land covers | TOTAL 2018 [ha] |
|---|---|---|---|---|---|---|---|---|---|
| Urban areas | 82448 | 0 | 0 | 0 | 0 | 0 | 0 | 0 | 82448 |
| Industrial areas and infrastructures | 0 | 15756 | 0 | 0 | 0 | 0 | 0 | 0 | 15756 |
| Non-irrigated arable land | 4507 | 979 | 278256 | 2342 | 1281 | 1208 | 0 | 0 | 288573 |
| Irrigated arable land | 220 | 129 | 2113 | 22503 | 389 | 0 | 0 | 0 | 25354 |
| Permanent crops | 2453 | 74 | 13 | 90 | 420942 | 3 | 0 | 0 | 423575 |
| Grassland and pastures | 1651 | 6546 | 13877 | 509 | 6568 | 109578 | 0 | 0 | 138729 |
| Forests | 1487 | 942 | 295 | 57 | 0 | 0 | 378341 | 0 | 381122 |
| Other land covers | 0 | 0 | 0 | 0 | 0 | 0 | 0 | 6895 | 6895 |
| TOTAL 2030 [ha] | 92766 | 24426 | 294554 | 25501 | 429180 | 110789 | 378341 | 6895 | 1362452 |
| Net gain/loss [ha] | +10318 | +8670 | +5981 | +147 | +5605 | -27940 | -2781 | 0 | 0 |
| Net gain/loss [%] | +12.5145 | +55.0266 | +2.0726 | +0.5797 | +1.3232 | -20.1400 | -0.7296 | 0 | / |
| Simple annual rate [%] | +0.6952 | +3.0570 | +0.1151 | +0.0322 | +0.0735 | -1.1188 | -0.0405 | 0 | / |
Table 11.
Energy Crops scenario-ECS (2018-2030) - Contingency matrix of land-use transitions. On the rows the land cover classes composition in the year 2018, on the columns the composition of the land-cover classes in the year 2030. On the diagonal the unchanged surfaces.
Table 11.
Energy Crops scenario-ECS (2018-2030) - Contingency matrix of land-use transitions. On the rows the land cover classes composition in the year 2018, on the columns the composition of the land-cover classes in the year 2030. On the diagonal the unchanged surfaces.
| Simulated LUC 2018/2030 | Urban areas | Industrial areas and infrastructures | Non-irrigated arable land | Irrigated arable land | Permanent crops | Grassland and pastures | Forests | Other land covers | TOTAL 2018 [ha] |
|---|---|---|---|---|---|---|---|---|---|
| Urban areas | 82448 | 0 | 0 | 0 | 0 | 0 | 0 | 0 | 0 |
| Industrial areas and infrastructures | 0 | 15756 | 0 | 0 | 0 | 0 | 0 | 0 | 0 |
| Non-irrigated arable land | 7142 | 4134 | 245121 | 2954 | 2361 | 1253 | 0 | 0 | 25608 |
| Irrigated arable land | 299 | 334 | 1952 | 21994 | 392 | 0 | 0 | 0 | 383 |
| Permanent crops | 0 | 69 | 3 | 0 | 423500 | 3 | 0 | 0 | 0 |
| Grassland and pastures | 1309 | 3291 | 1586 | 495 | 3543 | 115155 | 0 | 0 | 13350 |
| Forests | 1261 | 822 | 214 | 47 | 73 | 3 | 378104 | 0 | 598 |
| Other land covers | 0 | 0 | 0 | 0 | 0 | 0 | 0 | 6895 | 0 |
| TOTAL 2030 [ha] | 0 | 0 | 0 | 0 | 0 | 0 | 0 | 0 | 0 |
| Net gain/loss [ha] | 92459 | 24406 | 248876 | 25490 | 429869 | 116414 | 378104 | 6895 | 39939 |
| Net gain/loss [%] | +10011 | +8650 | -39697 | +136 | +6294 | -22315 | -3018 | 0 | +39939 |
| Simple annual rate [%] | +12.1422 | +54.8997 | -13.7563 | +0.5364 | +1.4859 | -16.0853 | -0.7918 | 0 | / |
Disclaimer/Publisher’s Note: The statements, opinions and data contained in all publications are solely those of the individual author(s) and contributor(s) and not of MDPI and/or the editor(s). MDPI and/or the editor(s) disclaim responsibility for any injury to people or property resulting from any ideas, methods, instructions or products referred to in the content. |
© 2023 by the authors. Licensee MDPI, Basel, Switzerland. This article is an open access article distributed under the terms and conditions of the Creative Commons Attribution (CC BY) license (http://creativecommons.org/licenses/by/4.0/).
Copyright: This open access article is published under a Creative Commons CC BY 4.0 license, which permit the free download, distribution, and reuse, provided that the author and preprint are cited in any reuse.


