
Submitted:
14 July 2023
Posted:
17 July 2023
You are already at the latest version
Abstract
The functional and neurophysiological distinction between dorsal and ventral hippocampus affects also GABAergic inhibition. In line with his notion, ventral CA1 pyramidal cells displayed a more dynamic and effective response to inhibitory input compared to their dorsal counterparts. We posit that this difference is effected by the dorsal-ventral gradient of activin A, a member of the transforming growth factor-β family, which is increasingly recognized for its modulatory role in brain regions involved in cognitive functions and affective behavior. Lending credence to this hypothesis, we found that in slices from transgenic mice expressing a dominant-negative mutant of activin receptor IB (dnActRIB), inhibitory transmission was enhanced only in CA1 neurons of dorsal hippocampus, where basal activin A level is much higher than in ventral hippocampus. We next asked how a rise in endogenous activin A would affect GABAergic inhibition along the longitudinal axis of the hippocampus. We performed ex vivo recordings from wild type and dnActRIB mice after overnight exposure to an enriched environment (EE), which engenders a robust increase in activing A levels in both dorsal and ventral hippocampi. Compared to control mice from standard cages, the behaviorally induced surge in activin A produced a decline in ventral inhibition, an effect that was absent in slices from dnActRIB mice. Underscoring the essential role of activin in the EE-associated modulation of ventral inhibition, this effect was mimicked by acute application of recombinant activin A in control slices. In summary, both genetic and behavioral manipulations of activin receptor signaling affected the dorsal-ventral difference in synaptic inhibition, suggesting that activin A regulates the strength of GABAergic inhibition in a region-specific fashion.
Keywords:
Activin
; hippocampus
; CA1 pyramidal cell
; GABA tonus
; GABAA receptors
; inhibitory postsynaptic current
; environmental enrichment
1. Introduction
Activins belong to the transforming growth factor β (TGF-β) family. They act as multifunctional regulatory proteins in many organ systems including the brain (Werner and Alzheimer, 2006; Hedger et al., 2011). Activin A, a homodimer of two βA subunits, is the most abundant and relevant activin variant in the brain, with proven roles in neural development (Andreasson and Worley, 1995), neuroprotection (Tretter et al., 2000; Mukerji et al., 2009, Buchtha et al., 2018), and neural plasticity in regions involved in learning and memory (Müller et al., 2006; Hasegawa et al., 2014; Bloise et al., 2019; Dahlmanns et al., 2023). Activin A levels are strongly responsive to various forms of enhanced neuronal activity, ranging from brief stimulus trains that induce long-term potentiation of excitatory synapses (Andreasson and Worley, 1995; Inokuchi et al., 1996) to overnight exploration of an enriched environment (EE; Link et al., 2016a). Activin levels rise in a graded, stimulation-dependent fashion, such that, for example, overnight exposure to EE produces a moderate, but robust and distributed pattern of enhanced activin A in mouse hippocampus, whereas delivery of an electroconvulsive therapy (ECT)-like regimen engenders a tremendous surge of activin A that is restricted to the dentate gyrus (Link et al., 2016a). Putting the previous findings in a nutshell, activin A is likely to assume a dual role in the adult brain, acting as a "master molecule" that tunes the neural underpinnings of cognitive and affective processing under physiological conditions, while serving as a promising therapeutic target in various neuropsychiatric disorders (Dow et al., 2005; Ageta and Tsuchida, 2011; Krieglstein et al., 2011; Link et al., 2016b; Ganea et al., 2012; Bloise et al. 2019; Gergues et al., 2021; Mitra et al., 2022; Dahlmanns et al., 2023).
In addition to its well-characterized effects at glutamatergic synapses, activin signaling has a sizeable impact on the GABA system and related behavior (Zheng et al., 2009; Ageta and Tsuchida, 2011; Krieglstein et al., 2011). In hippocampal slices from transgenic mice with a dominant-negative mutant of activin receptor IB (dnActRIB) that disrupts activin signaling in forebrain neurons, we found significant changes in tonic and phasic GABAergic inhibition, in allosteric modulation of GABAA receptors by benzodiazepines and ethanol, and in GABAB receptor-mediated K+ current (Zheng et al., 2009; 2016; 2022). Furthermore, overexpression of activin or its functional antagonist follistatin produced opposite effects on anxiety-related behavior (Ageta et al., 2008).
So far, the mechanisms of activin signaling in cognitive function and affective behavior have been mainly studied in the dorsal part of the hippocampus (DH). However, for a comprehensive understanding of activin signaling, it is essential to elucidate its effects also in the ventral part of the hippocampus (VH), given that these two regions are endowed with distinct anatomical and functional features. Macroscopically, the rodent hippocampus presents as an elongated structure with a longitudinal axis extending in a C-shape fashion from dorsal-to-ventral, corresponding to posterior-to-anterior in humans (Strange et al., 2014). Accumulating evidence supports a functional segregation along the longitudinal axis, with DH preferentially associated with cognitive functions, in particular spatial information processing, and VH predominantly involved in emotional processing and affective behavior (Bannerman et al., 2004; Fanselow and Dong, 2010; Strange et al., 2014). In addition to their distinct cortical/subcortical connectivity, pyramidal cells from DH and VH differ in their basal electrophysiological properties, in their set of ion channels, and in their synaptic properties (Dougherty et al., 2012; Malik et al., 2016; Milior et al., 2016; Dubovyk and Manahan-Vaughan, 2018; Ordemann et al., 2019). In rodent models of epilepsy, DH and VH vary in the degree of seizure susceptibility (Toyoda et al., 2013; Buckmaster et al., 2022). Finally, at the molecular level, a strong dorsal-ventral asymmetry in transcription and epigenetic regulation was reported between dorsal and ventral dentate gyrus of adolescent mice, with the difference becoming even more pronounced after environmental enrichment (Zhang et al., 2018).
Considering the preferential involvement of VH in emotional responses as well as in epileptic seizures, we know surprisingly little about the specifics of GABAergic inhibition in this part of the hippocampus. Milior et al. (2016) found a higher frequency of miniature GABAergic events in ventral than in dorsal mouse CA1 pyramidal cells, which would agree with the earlier finding that the level of extracellular GABA is higher in VH than in DH (Hörtnagl et al., 1991). With respect to GABAA receptor density, DH prevails over VH, although receptor subtypes differ among both regions (Sotiriou et al., 2005; Lothmann et al., 2021).
In view of the incomplete knowledge on the ventral GABA system and its regulation by activin signaling, we undertook a comprehensive assessment of the tonic and phasic components of GABAAR-mediated inhibition in DH vs. VH, elucidated the contribution of basal activin signaling to region-specific differences in inhibition, and explored how a behaviorally induced rise in activin such as provided by environmental enrichment redistributes the weight of synaptic inhibition between DH and VH.
2. Results
2.1. Activin A levels exhibit dorsal-ventral gradient, which is strongly potentiated by enriched environment
We have previously shown that overnight exploration of an enriched environment (EE) strongly up-regulates expression of Inhba mRNA (which encodes activin βA subunit) in mouse hippocampus (Link et al., 2016a), leading to a subsequent surge in activin A, a dimeric protein composed of two βA subunits (Zheng et al., 2022; Dahlmanns et al., 2023). To determine whether EE boosts activin A levels differentially along their longitudinal axis, we trimmed hippocampi into three parts of about equal weight, namely dorsal hippocampus (DH, control: 8.93 ± 0.30 mg, n = 9; EE: 8.43 ± 0.24 mg, n = 8), middle hippocampus (MH, control: 10.68 ± 0.43 mg; EE: 10.44 ± 0.48 mg), and ventral hippocampus (VH, control: 10.34 ± 0.39 mg; EE: 9.96 ± 0.45 mg). As shown in Figure 1A, basal levels of activin A gradually declined from DH to VH [n = 9; DH, 2.99 ± 0.17 pg/mg; MH, 1.29 ± 0.10 pg/mg; VH, 0.84 ± 0.07 pg/mg; One-way AVOVA followed by Tukey’s post-hoc test: F(1,8) = 51.28, p =1.53e-8; DH vs MH p = 2.01e-7, DH vs VH p = 2.42e-9, MH vs VH p = 0.002]. Overnight EE strongly enhanced activin A in all three regions of the hippocampus [n = 8; DH-EE, 7.42 ± 0.20 pg/mg, p = 3.51e-11 vs DH-control; MH-EE, 4.20 ± 0.24 pg/mg, p = 8.35e-9 vs MH-control; VH-EE, 2.70 ± 0.21 pg/mg, p = 1.64e-7 vs VH-control; two-way AVOVA, F(1, 50) = 102.93 , p =9.86e-14]. Although the absolute protein level remained much lower ventrally (p = 2.06e-10, VH-EE vs DH-EE), the relative increase after EE (normalized to control) appeared higher in VH than in DH (3.21 fold vs. 2.48 fold). Hippocampi from dnActRIB mice did not differ in weight from those of wt mice (wt, n = 9, 30.38 ± 0.87 mg; dnActRIB, n = 11, 29.56 ± 1.14 mg, p = 0.592), nor did mutant hippocampi differ from their wt counterparts with respect to the extent of the dorsal-ventral gradient of activin A before and after EE (Figure 1B).
2.2. Loss of activin signaling enhances tonic GABA inhibition in DH > VH
Activation of GABAARs can exert two temporally and functionally distinct effects on neuronal excitability commonly referred to as phasic and tonic inhibition (Farrant and Nusser, 2005; Mody 2005). The phasic component results from the brief pulse of action potential-dependent or -independent GABA release and is mediated by synaptic GABAARs, whereas tonic inhibition is caused by low ambient GABA acting predominantly on extrasynaptic GABAARs. To accentuate the dorsal-ventral distinction in view of the gradual shift of activin A levels along the longitudinal axis, we used in the following only slices from either the dorsal or ventral pole of the hippocampus. First, we examined the extent of tonic inhibition in control mice (Figure 2), as indicated by the shift of holding current in the presence of the GABAAR antagonist picrotoxin (PTX, 100 µM; Figure 2A). Voltage-clamped CA1 pyramidal cells (Vh -70 mV) displayed a larger tonic current in VH (21.19 ± 2.00 pA, n = 16) than in DH (14.81 ± 1.45 pA, n = 11; p = 0.027, Figure 2B, left). Disruption of activin receptor signaling almost doubled tonic inhibition of dorsal CA1 neurons (dnActRIB-DH, n = 6, 24.33 ± 1.45 pA; p =7.32e-4 vs wt-DH), confirming an earlier finding in dorsal CA1, then made at room temperature and in the absence of low exogenous GABA (Zheng et al., 2009). As expected from the dorsal-ventral gradient of basal activin levels (Figure 1), loss of activin signaling barely changed tonic inhibition in ventral CA1 neurons (dnActRIB-VH, n = 12, 21.87 ± 2.50 pA, p = 0.830 vs wt-VH). As a consequence, the dorsal-ventral difference in GABA tone vanished (p = 0.285, Figure 2B, right).
Interestingly, overnight EE housing affected the strength of tonic inhibition only in ventral CA1 pyramidal cells (ventral wt-EE: n = 7, 14.27 ± 0.72 pA, p = 0.037 vs ventral wt-control; Figure 2C, left), but not in dorsal ones (dorsal wt-EE: n = 7, 13.25 ± 2.50 pA, p = 0.578 vs dorsal wt-control; Figure 2C, right). In slices from dnActRIB mice, preceding EE altered tonic inhibition neither in ventral nor in dorsal CA1 pyramidal cells (ventral dnActRIB-EE: n = 6, 23.72 ± 2.32 pA, p = 0.525 vs ventral dnActRIB-control; dorsal dnActRIB-EE: n = 6, 25.34 ± 4.73 pA, p = 0.764 vs dorsal dnActRIB-control; Figure 2C). Taken together, these data strongly suggest that the level of activin A regulates the strength of the GABA tone in a region-specific fashion.
2.3. Disruption of activin signaling facilitates phasic inhibition mainly in dorsal CA1 pyramidal cells.
We then compared phasic inhibition between CA1 neurons from DH and VH by monitoring spontaneously occurring inhibitory postsynaptic currents (spIPSC). These events did not display an appreciable bias towards one hippocampal region in CA1 cells from control mice (Figure 3). spIPSC frequencies were similar in dorsal and ventral regions (wt-VH, n = 63, 6.26 ± 0.38 Hz; wt-DH, n = 42, 5.77 ± 0.40 Hz; p = 0.350), as were their averaged peak amplitudes (wt-VH, 50.27 ± 1.63 pA; wt-DH, 49.35 ± 2.00 pA; p = 0.723). It is worth noting, though, that spIPSCs in ventral pyramidal cells had faster rise times (measured from 10-90% of peak: wt-VH, 0.48 ± 0.01 ms; wt-DH, 0.53 ± 0.01; p = 0.004), whereas decay tau did not differ (wt-VH, 8.72 ± 0.21 ms; wt-DH 8.26 ± 0.26 ms; p = 0.169) (Figure 3; Table 1).

Table 1.
Properties of spIPSCs in dorsal and ventral CA1 pyramidal cells.
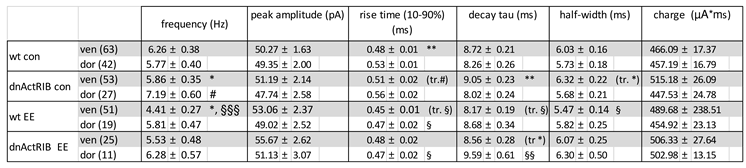
Data were expressed as mean ± SEM. Ventral values are displayed over gray background. Statistical significance, p < 0.05: * (dorsal vs. ventral); # (wt vs. dnActRIB); § (con vs. EE).
Table 2.
Kinetics of evoked IPSCs in dorsal and ventral CA1 pyramidal cells.
IPSCs were evoked by a 200 µA stimulus. Ventral values are displayed over gray background Statistical significance, p < 0.05: * (dorsal vs. ventral cells); # (wt vs. dnActRIB); § (con vs. EE).
Substantiating our earlier finding made at room temperature (Zheng et al., 2009), dnActRIB CA1 pyramidal from DH exhibited more spontaneous events than their wt counterparts (dnActRIB-DH, n = 27, 7.19 ± 0.60 Hz; p = 0.039 vs wt-DH; Figure 3C, top-left). However, such increase was not observed in the ventral region, where spIPSC frequency in dnActRIB pyramidal cells (dnActRIB-VH, n = 53, 5.86 ± 0.35 Hz) was not different from their wt counterparts (p = 0.439; Figure 3B top-left). The unilateral increase in spIPSC frequency in the dorsal part of mutant hippocampus attained significance (p = 0.044) and was associated with a slower decay of the synaptic events (p = 0.007) (Figure 3; Table 1). Peak amplitude of spIPSC was similar between wt and dnActRIB of ventral (dnActRIB-VH, n = 53, 51.19 ± 2.14 pA; p = 0.728 vs wt-VH) and dorsal regions (dnActRIB-DH, n = 27, 47.74 ± 2.58 pA; p = 0.620 vs wt-DH) (Figure 3B-C, top-right).
2.4. EE-induced activin signaling selectively attenuates phasic inhibition in ventral hippocampus.
After overnight EE housing of wt mice, spIPSCs frequency was significantly reduced in ventral CA1 pyramidal cells (wt-VH-EE: n = 51, 4.41 ± 0.27 Hz; p < 0.001 vs wt-VH; Figure 4A und B top-left), but not in dorsal pyramidal cells (wt-DH-EE, n = 19, 5.81 ± 0.47 Hz; p = 0.714 vs wt-DH; Figure 4C top-left, wt-bars). Peak amplitude of spIPSCs remained unchanged after EE (wt-VH-EE: 53.06 ± 2.37 pA, p = 0.320 vs wt-VH; wt-DH-EE: 49.02 ± 2.52 pA, p = 0.922 vs wt-DH; Figure 4B and C top-left, wt-bars). EE did not significantly alter ventral spIPSCs kinetics (rise time: wt-VH-EE, 0.45 ± 0.01 ms, p = 0.070, vs wt-VH, Figure 4B bottom-left, wt-bars; decay tau: wt-VH-EE, 8.17 ± 0.19 ms, p = 0.057, vs wt-VH, Figure 4B bottom-right wt-bars). In dorsal cells, EE reduced rise time (wt-DH-EE, n = 19, 0.47 ± 0.02 ms, p = 0.014 vs wt-DH, Figure 4C bottom-left, wt-bars), but did not change decay tau (wt-DH-EE, 8.67 ± 0.34 ms, p = 0.828 vs wt-DH, Figure 4C bottom-right, wt-bars).
We next asked whether the selective dampening of GABA inhibition in VH is causally linked to the strong increase in activin signaling during EE. If so, the effect should be abrogated in EE-exposed dnActRIB mice, and mimicked in VH slices from wt mice superfused with recombinant activin. EE failed indeed to affect spIPSC frequency in ventral CA1 pyramidal cells from mutant mice (dnActRIB-VH-EE, n = 25, 5.53 ± 0.48 Hz; p =0.587, vs dnActRIB-VH; Figure 4B top-left, dnActRIB-bars). As expected, EE did not alter spIPSC amplitude in ventral cells of dnActRIB mice (amplitude: dnActRIB-VH-EE: 55.67 ± 2.62 pA, p = 0.217 vs dnActRIB-VH, Figure 4.B top-right, dnActRIB-bars), nor did we observe a change of these parameters after EE in mutant DH (frequency: dnActRIB-DH-EE: n = 11, 6.28 ± 0.57 Hz, p = 0.378 vs dnActRIB-DH; amplitude: dnActRIB-DH-EE: 51.13 ± 3.07 Hz, p = 0.456 vs dnActRIB-DH; Figure 4C, top, dnActRIB-bars). As in the wt preparation, EE did not affect spIPSC kinetics in mutant VH (dnActRIB-VH-EE: rise time 0.48 ± 0.02 ms; decay tau: dnActRIB-VH-EE: 8.56 ± 0.28 ms, p = 2.11 vs dnActRIB-VH-control). Likewise, the reduction of rise time after EE was preserved in mutant DH (0.47 ± 0.02 ms, p = 0.018, Figure 4C, bottom left), whereas decay was slower than in DH from mutant mice in standard housing (dnActRIB-DH-EE: 9.56 ± 0.61 ms, p = 0.006 vs dnActRIB-DH-control) (Figure 4 B-C bottom-right).
To further tighten the link between EE, activin and phasic inhibition, we superfused hippocampal slices from wt mice with recombinant activin A (25 ng/ml). Administration of the factor reduced spIPSC frequency in VH pyramidal cells (Figure 5B, spIPSC bars) from 5.63 ± 0.728 Hz to 4.54 ± 0.62 Hz (n = 9, paired t-test, p = 0.018; Figure 5B, top-left). Activin A did not alter peak amplitude of spIPSC (wt-VH, 54.86 ± 4.02 pA; wt-VH-activin A: 56.38 ± 4.25 pA; n = 9; p = 0.538, paired t-test, Figure 5B top-right). Also, spIPSC kinetics remained unchanged (rise time: control 0.45 ± 0.04 ms; activin 0.45 ± 0.04 ms; p = 0.766, paired t-test; decay tau: control 9.554 ± 0.53 ms; activin: 9.71 ± 0.51, ms; p = 0.538, paired t-test, Fig.5B bottom). Unlike EE, recombinant activin A decreased spIPSC frequency in dorsal cells, too (Figure 5C, spIPSC bars, n = 9; control: 5.38 ± 0.54 Hz; activin: 5.00 ± 0.50 Hz; p = 0.034, paired t-test; Figure 5C top-left). Dorsal spIPSC amplitude and rise time did not change during activin perfusion, whereas decay tau was significantly prolonged (wt-DH, 7.48 ± 0.59 ms; activin: 7.91 ± 0.67 ms, p = 0.046). Although application of recombinant activin A reduced spIPSC frequency in both hippocampal parts, the relative effect seemed stronger in VH (17.64 ± 4.68%) than in DH (6.59 ± 2.82%, p = 0.060). In fact, we had to double the concentration of recombinant activin A (50 ng/ml) to obtain a reduction of dorsal spIPSC frequency similar to that seen in VH at half the concentration (n = 6; from 4.72 ± 0.99 Hz to 4.01 ± 0.91 Hz; p = 0.010, paired t-test; relative reduction: 14.83 ± 4.54 %). The notion of a VH>DH ratio in the sensitivity of GABAergic inhibition to a rise in activin level is in agreement with our above results from the EE paradigm, where only VH was affected. With all the necessary caveats, the slice experiments with the recombinant protein might be taken to extrapolate on the level of endogenous activin A in hippocampal tissue that is attained with EE.
To isolate the effects of activin at inhibitory synapses from putative actions of the protein on firing properties of GABA interneurons, we applied TTX (0.5 µM) to remove action potential-driven inhibitory events. Recombinant activin A (25 ng/ml) decreased the frequency of miniature IPSCs (mIPSCs, Figure 5A-C) in both dorsal (n = 7, from 4.32 ± 0.61 Hz to 3.38 ± 0.52 Hz, p = 0.006) and ventral pyramidal cells (n = 8, from 4.12 ± 0.88 Hz to 3.68 ± 0.81 Hz, p = 0.026; Figure 5B-C, top-left). Like spIPSCs, activin A did not alter averaged peak amplitude of mIPSCs (dorsal cells, from 43.42 ± 4.53 pA to 41.31 ± 4.11 pA, p = 0.202; ventral cells, from 45.49 ± 2.32 pA to 44.87 ± 2.28 pA, p = 0.685). Whereas rise time remained unchanged (dorsal cells, from 0.54 ± 0.02 ms to 0.56 ± 0.02 ms, p = 0.141; ventral cells, from 0.57 ± 0.02 ms to 0.57 ± 0.03 ms, p = 0.640), activin A slowed mIPSC decay in both dorsal and ventral cells (dorsal cells, decay tau from 6.99 ± 0.62 ms to 7.49 ± 0.62 ms, p = 0.007; ventral cells, from 7.31 ± 0.44 ms to 7.90 ± 0.62 ms, p = 0.042).
2.5. Properties of evoked IPSCs along longitudinal axis of hippocampus
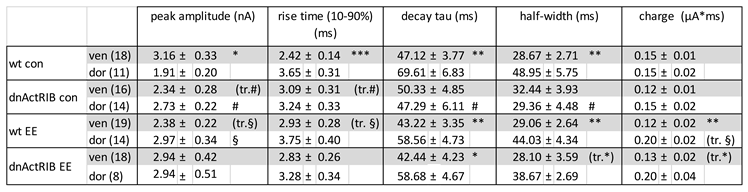
We next compared the properties of electrically evoked IPSCs (eIPSCs) between DH and VH, using a bipolar stimulating electrode placed in stratum radiatum next to CA1 pyramidal cell layer. Input-output (I-O) relationships were determined by plotting peak eIPSC amplitude as function of stimulus intensity (50-200 µA, duration of 0.1 ms). As depicted in Figure 6A, I-O curves for dorsal and ventral CA1 pyramidal cells from wt mice diverged with increasing stimulus intensity, yielding stronger synaptic responses in the latter. This data set was compared using a 2-way repeated measures ANOVA, where the within-subject factor is stimulation intensity and the between-subject factor the hippocampal region, resulted in a between-subject difference with F = 5.28 and p = 0.030 (Figure 6A). At highest stimulus intensity (200 µA), peak eIPSC amplitude in ventral pyramidal cells (n =18, 3.16 ± 0.33 nA) was significantly higher than in dorsal cells (n = 11, 1.91 ± 0.20 nA; p = 0.011). Dorsal and ventral eIPSCs also differed in their kinetics. When determined at 200 µA, ventral responses rose and decayed faster than dorsal ones (rise time: ventral 2.42 ± 0.14 ms; dorsal 3.65 ± 0.34 ms; p < 0.001; decay tau: ventral 47.12 ± 3.77 ms; dorsal 69.61 ± 6.83 ms, p = 0.006, Figure 6B). In terms of synaptic efficacy, the slower kinetics of dorsal eIPSCs made up for their lower peak amplitude, yielding very similar values of total charge transfer for dorsal and ventral responses (wt-VH: 0.15 ± 0.01 µA*ms; wt-DH: 0.15 ± 0.02 µA *ms, p = 0.903, Figure 6B). It follows that when eIPSCs of about equal peak amplitude (1.2 nA) were compared, synaptic charge transfer was significantly larger in dorsal than in ventral cells (wt-VH: 0.064 ± 0.006 µA *ms; wt-DH: 0.102 ± 0.010 µA*ms, p = 0.004, data not shown).
Upon repetitive stimulation, hippocampal eIPSCs exhibit typically a decline of subsequent responses, a phenomenon termed frequency-dependent depression. When we delivered stimulus trains of 15 pulses at 5 Hz, we found that frequency-dependent depression of eIPSCs differed significantly between dorsal and ventral CA1 pyramidal cells (Figure 6C). In this set of experiments, stimulus intensity was adjusted individually to elicit submaximal (60-80%) eIPSCs with peak amplitudes of 1.0 – 1.5 nA (1st IPSC: wt-VH, n = 19, 1.55 ± 0.14 nA; wt-DH, n = 11, 1.21 ± 0.11 nA; p = 0.100). eIPSC amplitudes were then normalized to that of first response. As depicted in Figure 6D, frequency-dependent depression was more pronounced in dorsal than ventral CA1 neurons (2-way repeated measures ANOVA, within-subject factor of stimulation number and between-subject factor of anatomical region, F = 14.48, p < 0.001).The ratio of second to first synaptic response, the so-called paired-pulse ratio, was 0.69 ± 0.04 in ventral cells (n = 19) and 0.53 ± 0.04 in dorsal cells (n = 11; p = 0.005), and the ratio at the end of train (fifteenth to first eIPSC) was 0.61± 0.04 in ventral cells (n = 19) and 0.45 ± 0.04 in dorsal cells (n = 11; p = 0.019). Again, total charge transfer during repetitive stimulation did not significantly vary between VH and DH, owing to the inverse coupling of kinetics and amplitude, as noted above for single eIPSCs (wt-VH, 0.58 ± 0.01 µA*ms, wt-DH, 0.54 ± 0.01 µA*ms, p = 0.747). The same was true when we calculated the relative charge transfer from the normalized responses of Figure 6D (wt-VH; 386.38 ± 28.52, wt-DH = 426.43 ± 31.14, p = 0.365, Figure 6E).
2.6. Activin signaling redistributes weight of eIPSCs between DH and VH
We next examined how activin signaling shapes eIPSCs in dorsal and ventral hippocampus. Genetic disruption of activin receptor signaling produced seemingly opposing effects on the I-O relationship in ventral vs. dorsal CA1 pyramidal cells (Figure 7A and B). In mutant VH, we observed an apparent downward shift of the I-O curve that remained, however, below the level of statistical significance (n = 16; 2-way repeated measures ANOVA, F = 3.09, p = 0.088; Figure 7A), whereas the I-O curve from mutant DH exhibited a robust upward shift (n = 14; 2-way ANOVA repeated measures, F= 4.59, p = 0.043; Figure 7B). When compared to the respective responses of their wt counterparts at maximum stimulus intensity (200 µA), eIPSC amplitudes in mutant ventral cells were not significantly different (2.34 ± 0.28 nA; p = 0.074 vs wt-VH), whereas mutant dorsal cells did show a significant increase (2.73 ± 0.22 nA; p = 0.014 vs wt-DH In ventral cells, eIPSC rise time tended to be slower in dnActRIB than in wt neurons (dnActRIB-VH: n = 16, 3.09 ± 0.31 ms, p = 0.051 vs wt-VH, Figure 7C), while decay tau remained in the same range (dnActRIB-VH: 50.33 ± 4.85 ms, p = 0.601 vs wt-VH, Figure 7D). Vice versa, in DH, decay tau was significantly faster in dnActRIB cells (47.29 ± 6.11, p = 0.029 vs wt-DH, Figure 7D), while rise time was unaltered (3.24 ± 0.33 ms, p = 0.398 vs wt-DH, Figure 7C). Interestingly, the marked dorsal-ventral difference in eIPSC kinetics of wt neurons was equalized in dnActRIB neurons (p = 0.740 dorsal-ventral comparison of rise time, p = 0.697 dorsal-ventral comparison of decay tau). With respect to frequency-dependent depression, loss of activin receptor signaling entailed a unilateral effect restricted to DH, where depression was significantly attenuated (Figure 7E,F; ventral dnActRIB cells, n = 11, 2-way repeated measures ANOVA, F = 0.03 p = 0.859; dorsal dnActRIB cells n = 8, 2-way repeated measures ANOVA, F = 12.42, p = 0.003). The relative charge transfer during the stimulus train was not affected by the mutation, neither in ventral (314.74 ± 30.22, p = 0.125 vs wt-VH) nor in dorsal hippocampus (374.85 ± 25.99, p = 0.245 vs wt-DH). In functional terms, it is interesting to note that the increase in eIPSC amplitude and the alleviation of frequency-dependent depression in dorsal CA1 pyramidal cells of dnActRIB mice do not translate into higher synaptic efficacy i.e. enhanced charge transfer, because, at the same time, eIPSC decay is significantly accelerated. A possible interpretation would be that activin signaling is predominantly tailored to regulate the temporal window of fast synchronized inhibitory events rather than their overall efficacy.
2.7. Activin signaling is critically involved in the effects of EE on eIPSCs
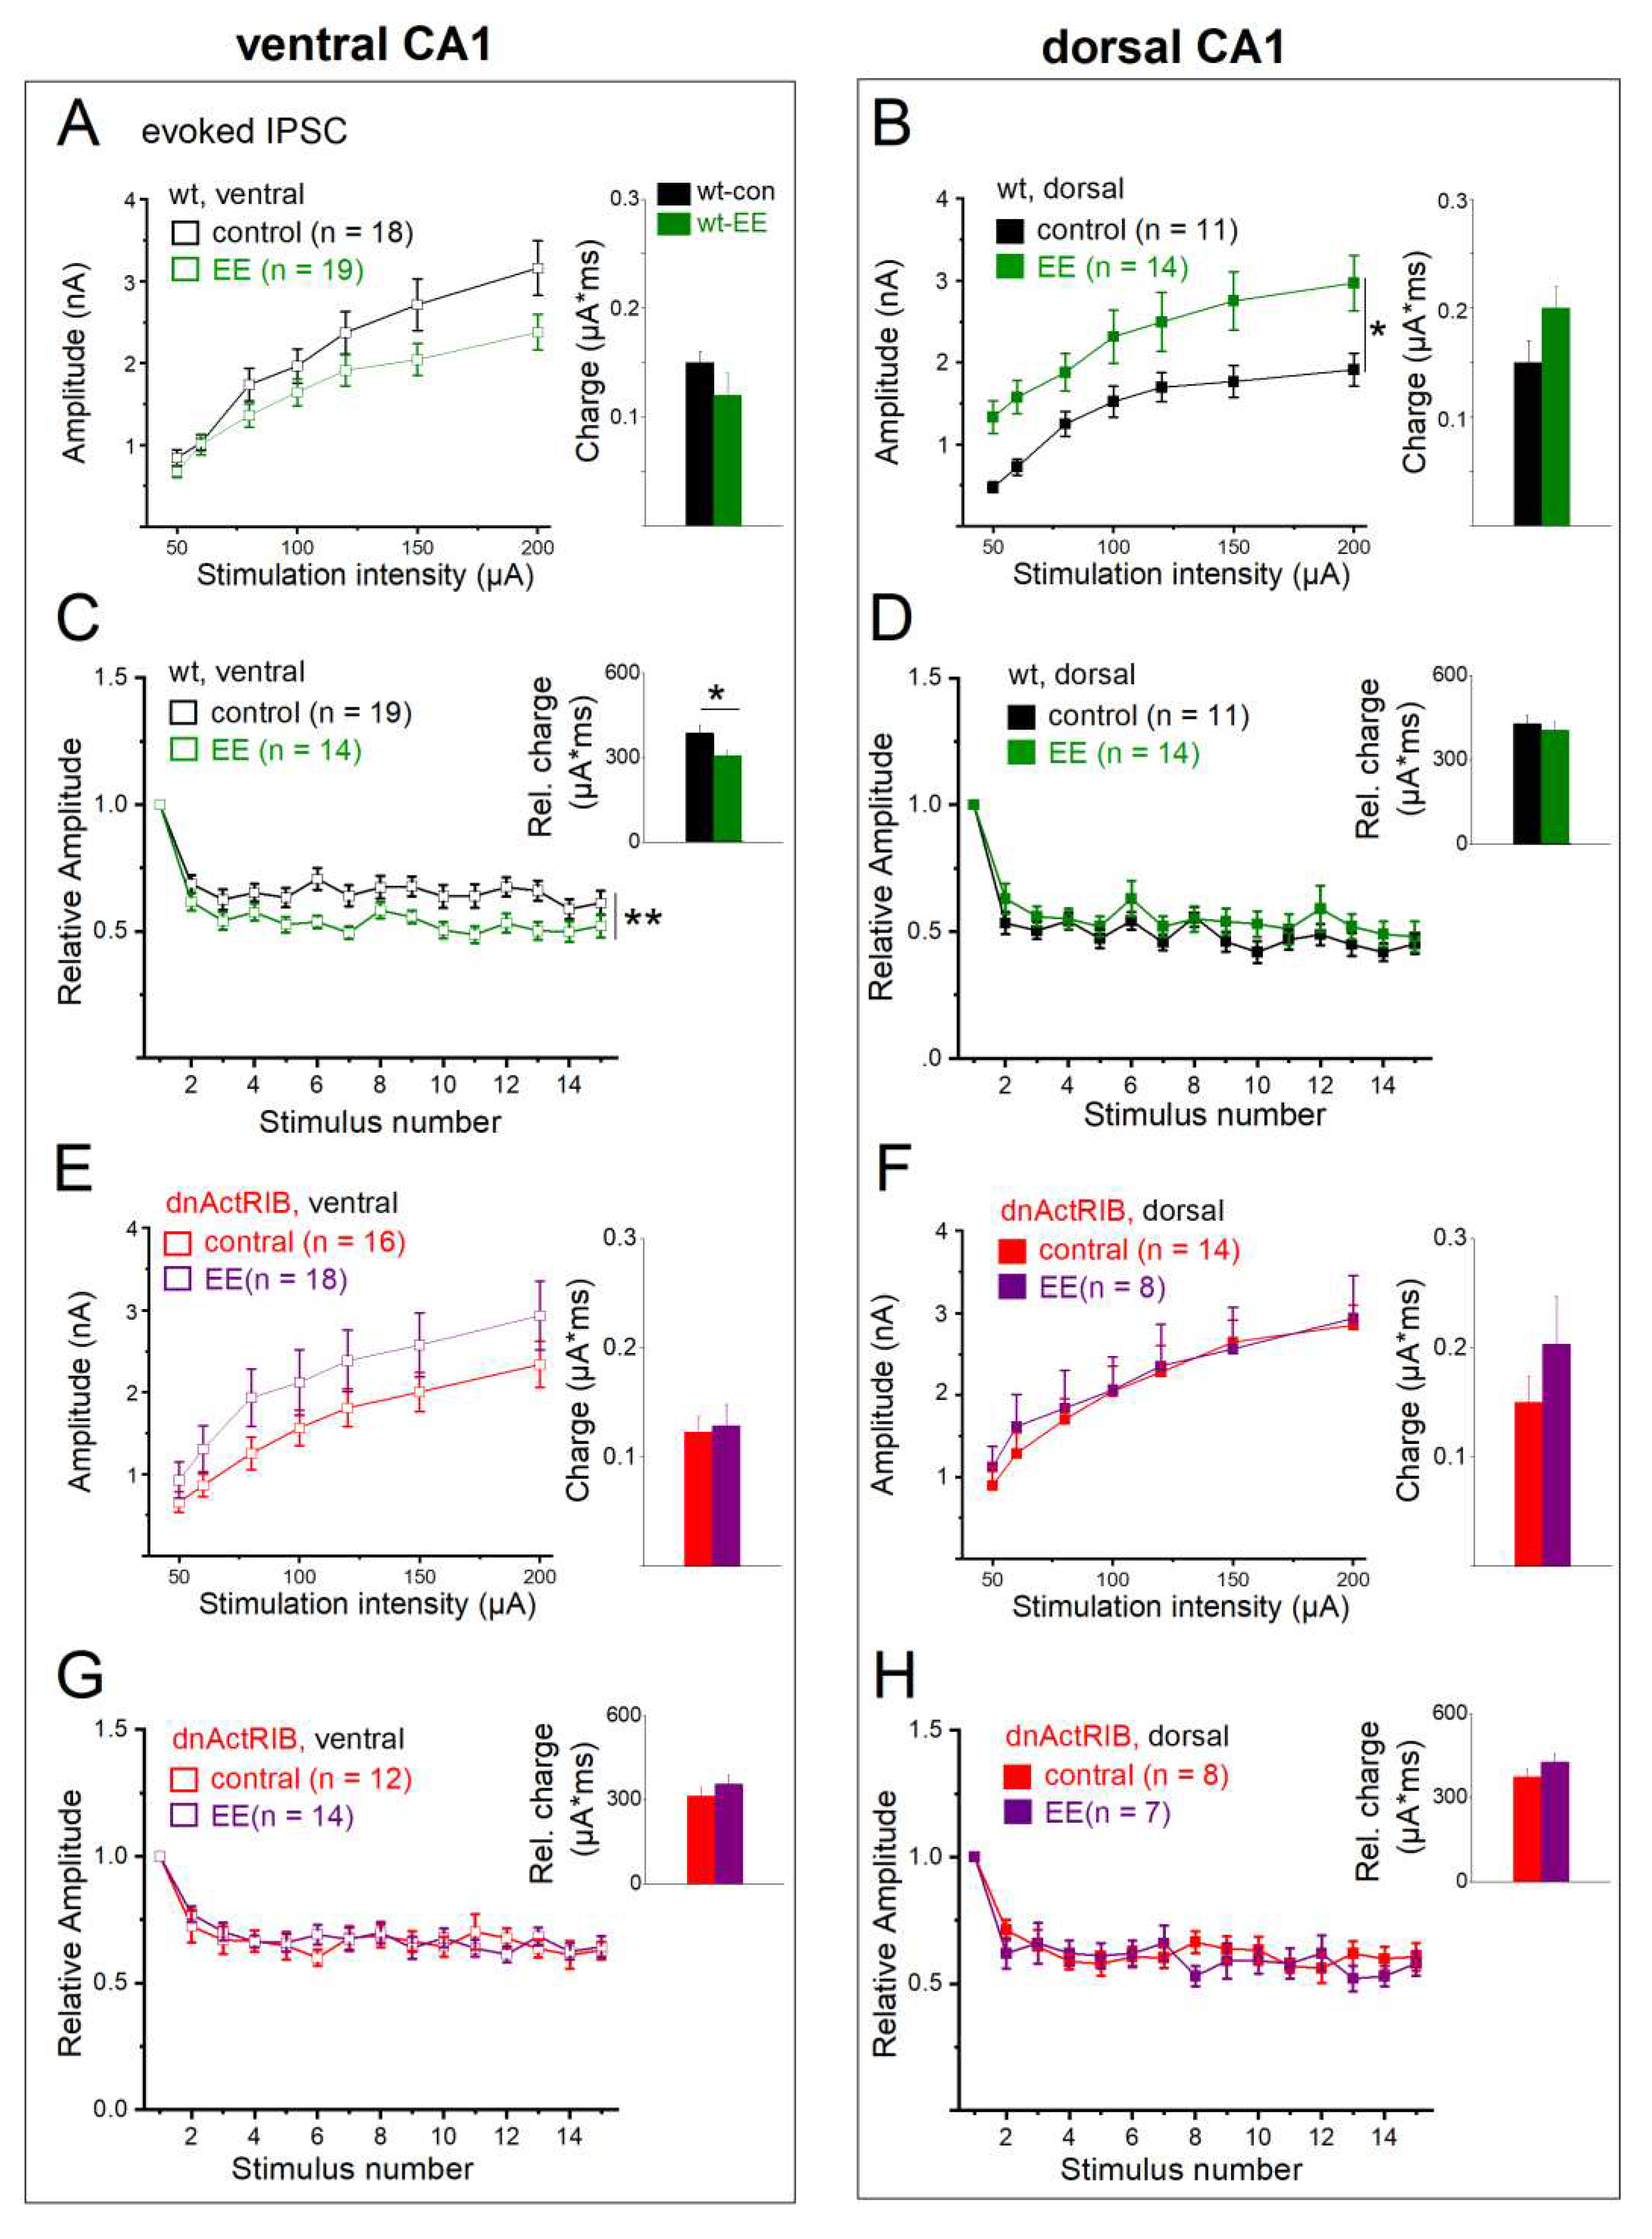
To complete our study, we asked how EE affects eIPSCs and examined the role of activin signaling therein. In ventral CA1 cells from wt mice, EE housing did not lead to a significant shift of control I-O curve (n = 19, 2-way repeated measures ANOVA, F = 2.69, p = 0.110, Figure 8A). By contrast, the I-O curve of dorsal CA1 cells exhibited a pronounced upward shift after EE (n = 14, 2-way repeated measures ANOVA, F = 6.56, p = 0.020, Figure 8B). As a consequence of its dorsal-only action, EE leveled out the imbalance in the I-O relationship between ventral and dorsal pyramidal cells that prevailed in the absence of behavioral stimulation (response to 200 µA intensity, wt-VH-EE: n = 19, 2.38 ± 0.22 nA, wt-DH-EE: n =14, 2.97 ± 0.34 nA, p = 0.134, Figure 8C, comparison not shown). The dorsal-ventral disparity of eIPSC rise time in control hippocampus was also equalized after EE (wt-VH-EE: n = 19, 2.93 ± 0.28 ms, wt-DH-EE: n =14, 3.75 ± 0.40 ms, p = 0.096), whereas the difference in decay tau between the two hippocampal regions persisted in the enrichment group (wt-VH-EE: n = 19, 43.22 ± 3.35 ms, wt-DH-EE: n =14, 58.56 ± 4.78 ms, p = 0.010). By selectively enhancing dorsal eIPSC amplitude without affecting its slow decay, EE introduced a bias in synaptic efficacy in favor of dorsal inhibition that was absent in hippocampi from mice in control housing. In numbers, the total charge transfer, which matched in control cells between DH and VH, increased after EE in dorsal cells to 0.20 ± 0.02 µA*ms (n = 14), which was significantly higher than in ventral cells after EE (0.12 ± 0.02 µA*ms, n = 19, p = 0.006, Figure 8A,B, comparison not shown).
Regarding the behavior of synaptic responses during repetitive electrical stimulation, EE promoted frequency-dependent depression in ventral neurons (n = 14; 2-way repeated measures ANOVA, F = 9.15, p = 0.005, Figure 8C), while this parameter remained unaffected by EE in dorsal cells (Figure 8D). When calculated exemplarily for the fifth stimulus in ventral recordings, the relative eIPSC amplitudes (normalized to first stimulus) amounted to 0.63 ± 0.15 (n = 19) before and to 0.52 ± 0.12 after EE (n = 14, p = 0.030). As a consequence of enhanced frequency depression in ventral hippocampus, significantly less charge was transferred during the train (wt-VH-EE: 306.28 ± 19.22 µA*ms, p = 0.034 vs wt-VH, Figure 8C). EE housing did not alter frequency depression in dorsal cells (n = 14, F = 1.08, p = 0.309; Figure 8D) nor did it affect normalized charge transfer (404.04 ± 30.93 µA*ms, p = 0.320 vs wt-DH, Figure 8D), which now became significantly compared to VH (p = 0.012, wt-VH-EE vs wt-DH-EE).
Finally, we probed eIPSC properties in hippocampi from dnActRIB mice with and without EE housing. Loss of activin signaling clearly abrogated the prominent effects of EE in wt cells, namely the upward shift of dorsal I-O relationship (Figure 8F; effect of EE on dorsal dnActRIB cells. n = 8, 2-way repeated measures ANOVA, F= 0.27, p = 0.608), and the enhanced frequency depression in VH (Figure 8G; effect of EE on ventral dnActRIB cells. n = 18, 2-way repeated measures ANOVA, F = 1.81, p = 0.188; relative charge transfer in ventral dnActRIB EE cells, 345.26 ± 30.05, p = 0.52 vs dnActRIB-con cells).
3. Discussion
3.1. Hippocampus exhibits regional differences in GABAergic inhibition.
In the present study, we systematically characterized and compared the various features of GABAAR-mediated inhibition of CA1 pyramidal cells from dorsal and ventral hippocampus of adult mice. Furthermore, we elucidated the role of activin signaling in shaping regional differences in inhibition.
CA1 pyramidal cells from the ventral hippocampus exhibited larger amplitudes of tonic GABA current than cells from the dorsal part. Given that the α5 subunit is a characteristic constituent of extrasynaptic GABAARs in CA1 pyramidal cells (Glykys et al., 2008), the stronger tonic current in ventral neurons is consistent with the higher density of α5 subunit in ventral compared to dorsal CA1 (Sotiriou et al., 2005). Interestingly, no such dorsal-ventral difference in tonic inhibition was observed in mouse dentate gyrus granule cells and in CA3 pyramidal cells (Netsyk et al., 2020).
While spIPSCs rose faster in ventral than in dorsal CA1 neurons, they did not exhibit significant regional differences with respect to frequency, amplitude and decay time constant. These findings disagree in part with earlier studies, which reported a higher frequency of miniature IPSCs in VH than DH (Milior et al., 2016), or observed equal frequencies, but larger amplitudes of spontaneous events in dorsal vs. ventral neurons (Maggio and Segal, 2009). The apparent discrepancies to our data might be explained on the grounds that the above mentioned studies were performed at room temperature (Milior et al., 2016) and/or on immature hippocampal neurons from a different species (2-3 weeks old rats) (Maggio and Segal, 2009).
Electrically evoked IPSCs had larger amplitudes in ventral than in dorsal CA1 neurons. However, eIPSCs did not differ between regions, if their inhibitory potency was described in terms of total charge transfer, because the ventral events displayed a significantly faster decay. In apparent contrast, Maggio and Segal (2009), recording from immature rat neurons (v.s.) reported a larger amplitude of evoked events in dorsal compared to ventral neurons, with no difference in kinetics. In another study on adult rat pyramidal cells, electrically evoked inhibitory postsynaptic potentials (rather than currents) were larger, but also broader in dorsal than in ventral neurons (Papatheodoropolus et al., 2002). From our results, we would propose that, owing to their larger peak amplitude in combination with faster decay kinetics, evoked events in mouse ventral CA1 pyramidal cells appear to be tuned to effectuate a more potent, but also temporally more confined window of phasic inhibition than in dorsal cells. Upon repetitive stimulation, dorsal neurons exhibited more pronounced frequency-dependent depression of eIPSCs than ventral ones, but, again, total charge transfer during stimulus trains was about equal between cells from DH and VH due to the slower decay kinetics in dorsal neurons.
Why does eIPSC deactivation appear to be slower in dorsal than in ventral neurons? Although DH and VH are endowed with distinct expression profiles of GABAAR subunits (Sotiriou et al., 2005), a differential subunit composition of GABAARs in dorsal and ventral pyramidal cells is unlikely to account for the altered decay kinetics of electrically evoked events, because spIPSCs did not exhibit an appreciable difference in current deactivation. The fact that both dorsal and ventral eIPSCs decayed with a considerably slower time course than spontaneous and miniature events, suggests two alternative explanations, which are not mutually exclusive. Firstly, electrical stimulation in dorsal CA1 stratum radiatum might elicit less synchronized transients of vesicular GABA release than in the ventral portion, possibly reflecting variations in the timing of interneuron recruitment and/or in the properties of the interneurons including the routing of their axonal projections to pyramidal cells. In any case, variations in the degree of synchrony of evoked GABA release would be expected to affect eIPSC peak amplitude and kinetics (Mody et al., 1994). Secondly, the amount of GABA released upon electrical stimulation might overload the capacity of glial and neural GABA transporters in a region-specific fashion, so that removal of the transmitter from the synaptic cleft is delayed in DH relative to VH. Importantly, the remaining GABA concentration not yet cleared from the extracellular space may attenuate the amplitude of subsequent synaptic responses during repetitive stimulation (Roepstorff and Lambert, 1994) due to accumulation of receptors in a slow desensitized state (Overstreet et al., 2000). The stronger frequency-dependent depression of eIPSCs that we observed in dorsal neurons lends support to the idea that GABA reuptake may be less efficient in DH compared to VH. This would be also consistent with the above notion that ventral uptake mechanisms should be stronger than dorsal ones to curtail tonic inhibition in ventral CA1.
3.2. Effect of activin in dorsal and ventral hippocampus
Whereas type I and type II activin receptors distribute widely across the hippocampus (Hasegawa et al., 2014), we report here that the basal level of activin A exhibits a pronounced dorsal-ventral gradient, with a fourfold decline from dorsal to ventral pole. As almost predicted by the low level of activin A in VH, genetic disruption of activin signaling did not affect any feature of tonic nor phasic inhibition in ventral neurons. By contrast, loss of activin signaling increased dorsal GABAergic tonic current, spIPSC frequency, enhanced the amplitude of dorsal eIPSCs while accelerating their decay, and reduced frequency-dependent depression of subsequent eIPSCs. Thus, significant dorsal-ventral differences in wt hippocampi were equalized in the mutant preparation. In other words, functional activin signaling contributes to the dorsal-ventral disparity of some essential properties of phasic inhibition.
EE is a potent behavioral strategy to enhance cognition, stabilize emotional imbalance and protect from mental disorders (Sale et al., 2014). At the neuronal level, EE has been shown to modulate cellular excitability, synaptic plasticity and network activity (Valero-Aracama et al., 2015; Ohline and Abraham, 2019; Dahlmanns et al., 2023). Because overnight EE exposure engenders a transient surge of activin A throughout all regions of the hippocampus (Figure 1), we used this behavioral paradigm in conjunction with dnActRIB mice to determine to what extent activin signaling is involved in the effects of EE on GABAAR-mediated inhibition. EE produced a prominent reduction of GABAergic tonic current and spIPSC frequency selectively in ventral CA1 neurons. Since these effects were absent in ventral hippocampi from dnActRIB mice and reproduced by recombinant activin A in ventral wt slices, the reduction in ventral spIPSC frequency can be best explained as a consequence of the EE-induced rise in activin A. In a similar vein, activin signaling appears to be responsible for the augmented frequency depression of ventral eIPSCs after EE, as this effect was abrogated in ventral neurons from dnActRIB mice exposed to EE. These findings strongly suggest that the EE-evoked surge in activin A serves to adjust the neurophysiological phenotype in response to a preceding behavioral experience. This is not to say that other genes whose transcription is also upregulated by EE do not play a role in this context. For example, brain-derived neurotrophic factor (Bdnf), which is also responsive to EE (Kuzumaki et al., 2011; Link et al., 2016a; Jaeger et al., 2018), has been shown to modulate hippocampal GABA function as well, leading to an increase in mIPSC frequency and an enhancement of eIPSC amplitude (Colino-Oliviera et al., 2016).
A transcriptional analysis performed 1 hr after a very brief period (15 min) of novel environment exposure identified 39 differentially expressed genes between CA1 neurons activated by this behavioral paradigm and those not activated (Jaeger et al., 2018). Among them was Bdnf, but not Inhba, the gene encoding the βA subunit of homodimeric activin A protein (βAβA). Regarding the unexpected lack of Inhba upregulation, one might suspect that the novel environment exposure of 15 min in that study was simply too short, compared to the 12 hr EE regimen in our study, to obtain a significant upregulation of Inhba expression. However, when the same transcriptional comparison was made between activated and non-activated dentate gyrus granule neurons, Inhba was at the very top of 749 differentially expressed genes, second only to Arc (Jaeger et al., 2018). Thus, the short exposure period alone is unlikely to account for the absent Inhba upregulation in activated CA1 neurons. Rather, the high baseline activity of CA1 neurons proved to be a mitigating factor on the overall transcriptional response to novelty exploration compared to the sparsely active dentate granule neurons, which exhibited a huge transcriptional response, once activated by novelty exposure (Jaeger et al., 2018). Since we have firmly established an appreciable upregulation of Inhba mRNA in CA1 (Link et al., 2016a), followed by a strong rise in activin A protein after 12 hours of EE (Figure 1), it seems likely that the spectrum of transcribed genes in CA1 becomes broader as mice are allowed more time to explore a novel and stimulating environment. Nevertheless, our previous in situ hybridization of hippocampal Inhba demonstrated that even after 12 hours of EE exposure, the striking discrepancy of mRNA signals between dentate gyrus and CA1 observed after very short novelty exploration (Jaeger et al., 2018), was not fully resolved, as there was still a considerable gradient in signal strength preserved, manifested as a decline along the canonical trisynaptic circuit of the hippocampus (Link et al., 2016a).
Thus, activin signaling in the hippocampus appears to be segregated in two spatial dimensions. In addition to the dorsal-ventral gradient along the longitudinal axis of the hippocampus, which was in the focus of the present study, the transverse axis exhibits a dentate gyrus-to-CA1 gradient. It is tempting to hypothesize that the area-specific expression of the activin system and its differential responsiveness to stimulating activity serves to adapt the cellular and molecular machinery in the various hippocampal regions to their particular needs in cognitive function and affective behavior.
4. Materials and Methods
4.1. Animals
Male and female adult mice with C57Bl/6J background (2.5-5 months old) and transgenic mice expressing a dominant negative mutant of activin receptor IB (dnActRIB) under the control of the CaMKIIα promoter (Müller et al., 2006) were used for experiments. Animals were housed under standard conditions. All procedures were conducted according to the guidelines of Animal Protection Law of Germany and the European Communities Council Directive of November (1986 /86/609/EEC), with approval of local government of Lower Franconia.
4.2. Enriched environment (EE)
EE exposure was performed as described previously (Link et al., 2016a). Briefly, pairs of mice were placed in large cages (60x38x18 cm), which were equipped with shelters, toys and tunnels for 12 hours from 8 pm to 8 am, during their dark phase.
4.3. Activin Enzyme-Linked Immunosorbent Assay (ELISA)
Mice were sacrificed under sevoflurane or isoflurane anesthesia, and brains were rapidly dissected out from control mice and mice after overnight EE housing. Dorsal, medial and ventral regions were cut from the isolated hippocampi, and mechanically broken down with a magnetic homogenizing ball for 30 s in lysis buffer containing 0.32 M sucrose, 5 mM Tris-HCl (pH 8.0) and protease inhibitor cocktail (Sigma-Aldrich, Steinheim, Germany), and homogenates were centrifuged at 13,000 x g at 4°C for 10 minutes (twice). Supernatants were collected and activin A levels were assayed by ELISA kit (R&D systems, via Bio-techne GmbH, Wiesbaden-Nordenstadt, Germany) according to manufacturer’s instructions.
4.4. Slice preparation and electrophysiological recordings
Horizontal hippocampal slices (350 µm thick) were prepared from mice anesthetized with sevoflurane or isoflurane. Brain slices were cut in ice-cold sucrose-based artificial cerebrospinal fluid (aCSF) containing (in mM) 75 sucrose, 87 NaCl, 3 KCl, 0.5 CaCl2, 7 MgCl2, 1.25 NaH2PO4, 25 NaHCO3 and 10 D-glucose. Slices were incubated in same solution for 10 min at 35 ºC and then in aCSF containing (in mM) 125 NaCl, 3 KCl, 1 CaCl2, 3 MgCl2, 1.25 NaH2PO4, 25 NaHCO3 and 10 D-glucose at room temperature for at least 2 h before being used. Individual slices were transferred to a submerged chamber perfused with standard aCSF with 1.5 mM MgCl2 and 2.5 mM CaCl2 at 30 ± 1 ºC. All the solutions were constantly gassed with 95% O2 - 5% CO2.
Whole-cell recordings of visualized CA1 pyramidal cells were performed with patch pipettes filled with (in mM) 130 CsCl, 3 MgCl2, 5 ethylene glycol tetraacetic acid (EGTA), 5 4-(2-hydroxyethyl)-1-piperazineethanesulfonic acid (HEPES), 2 Na2-ATP, 0.3 Na-GTP, 5 QX-314 (pH 7.30). Electrode resistance with internal solution ranged from 3 to 5 MΩ. In whole-cell voltage-clamp mode, series resistance was about 8-20 MΩ and compensated by 60-80%. All recordings were performed at -70 mV (after correction for liquid junction potential) and in the presence of kynurenic acid (2 mM) in the extracellular solution to block glutamatergic synaptic transmission. Signals were filtered at 2 kHz and sampled at 20 kHz using a Multiclamp 700B amplifier in conjunction with Digidata 1440A interface and pClamp10 software (Molecular Devices, Sunnyvale, CA).
GABAergic tonic inhibition was calculated from shift of holding current in response to GABAAR channel blocker picrotoxin (PTX, 100 µM), in the presence of low concentration of GABA (5 µM) to maintain constant level of ambient GABA in the slices (Glykys, et al., 2008). GABAergic phasic inhibition was investigated by monitoring the spontaneously occurring inhibitory postsynaptic currents (IPSCs), in the absence or presence of TTX (0.5 µM; to block action potentials) for spontaneous IPSCs (spIPSCs) and miniature IPSCs (mIPSCs), respectively. In some experiments, recombinant activin A (25 ng/ml; R &D system) was added to the perfusion solution for few minutes to monitor its acute effects on such phasic events. To obtain electrically evoked IPSCs (eIPSCs) in CA1 pyramidal cells, a concentric platinum bipolar electrode was placed in stratum radiatum close to the pyramidal cell layer. Constant current pulses were delivered at 0.1 ms width. Input-output relationships for eIPSCs in dorsal and ventral CA1 pyramidal cells were determined by plotting peak current amplitude as function of stimulus strength, ranging from 50 to 200 µA. Frequency-dependent depression of eIPSCs was gauged using trains of 15 stimuli at 5 Hz (inter-pulse interval of 200 ms), with stimulus intensity set to obtain 60-80% of maximal amplitude for first current response.
4.5. Data analysis
Data analysis was performed off-line with Clampfit (Molecular Devices). Spontaneous and evoked inhibitory events were analyzed as previously described (Zheng et al., 2009). Briefly, fast spontaneous events were identified using an automated detection algorithm over at least 1 min-long recordings. These events were then averaged to measure amplitude and kinetics including 10-90% rise time and decay time constant. Frequency-dependent depression of eIPSCs was determined by normalizing peak amplitude of subsequent responses to that of first response in train. Data were expressed as means ± SEM. Statistical comparisons of data were performed using 2-way repeated measures ANOVA or Student's t test as appropriate. Significance was assumed for p < 0.05.
Author Contributions
MJVA und FZ performed whole-cell recordings and data analysis. FZ carried out ELISA experiments. MJVA und FZ drafted the manuscript. CA supervised the project and revised the paper.
Acknowledgments
We thank Maria Schulte, Birgit Vogler, Iwona Izydorczyk and Annette Kuhn for technical assistance. This research was made possible through support for MJVA from the Bavarian Equal Opportunities Sponsorship – Realisierung von Frauen in Forschung und Lehre (FFL) – Promotion Equal Opportunities for Women in Research and Teaching. This work was in part supported by the German Research Council (DFG AL 294/10 to CA).
Conflicts of Interest Statement
The authors declare that the research was conducted in the absence of any commercial or financial relationships that could be construed as a potential conflict of interest.
Abbreviations
aCSF: artificial cerebrospinal fluid; dnActRIB, dominant-negative mutant of activin receptor 1B; DH, dorsal hippocampus; ELISA, Enzyme-linked Immunosorbent Assay; EE, enriched environment; IPSC; inhibitory postsynaptic current; PTX, picrotoxin; VH, ventral hippocampus, wt, wild-type.
References
- Ageta, H.; Murayama, A.; Migishima, R.; Kida, S.; Tsuchida, K.; Yokoyama, M.; Inokuchi, K. Activin in the Brain Modulates Anxiety-Related Behavior and Adult Neurogenesis. PLOS ONE 2008, 3, e1869–e1869. [CrossRef]
- Ageta, H.; Tsuchida, K. Multifunctional Roles of Activins in the Brain. 2011, 85, 185–206. [CrossRef]
- Andreasson, K.; Worley, P. Induction of β-A activin expression by synaptic activity and during neocortical development. Neuroscience 1995, 69, 781–796. [CrossRef]
- Bannerman, D.; Rawlins, J.; McHugh, S.; Deacon, R.; Yee, B.; Bast, T.; Zhang, W.-N.; Pothuizen, H.; Feldon, J. Regional dissociations within the hippocampus—memory and anxiety. Neurosci. Biobehav. Rev. 2004, 28, 273–283. [CrossRef]
- Bloise, E.; Ciarmela, P.; Cruz, C.D.; Luisi, S.; Petraglia, F.; Reis, F.M. Activin A in Mammalian Physiology. Physiol. Rev. 2019, 99, 739–780. [CrossRef]
- Buchthal, B.; Weiss, U.; Bading, H. Post-injury Nose-to-Brain Delivery of Activin A and SerpinB2 Reduces Brain Damage in a Mouse Stroke Model. Mol. Ther. 2018, 26, 2357–2365. [CrossRef]
- Buckmaster, P.S.; Reyes, B.; Kahn, T.; Wyeth, M. Ventral Hippocampal Formation Is the Primary Epileptogenic Zone in a Rat Model of Temporal Lobe Epilepsy. J. Neurosci. 2022, 42, 7482–7495. [CrossRef]
- Colino-Oliveira, M.; Rombo, D.M.; Dias, R.B.; Ribeiro, J.A.; Sebastião, A.M. BDNF-induced presynaptic facilitation of GABAergic transmission in the hippocampus of young adults is dependent of TrkB and adenosine A2A receptors. Purinergic Signal. 2016, 12, 283–294. [CrossRef]
- Dahlmanns, M.; Dahlmanns, J.K.; Schmidt, C.C.; Valero-Aracama, M.J.; Zheng, F.; Alzheimer, C. Environmental enrichment recruits activin A to recalibrate neural activity in mouse hippocampus. Cereb. Cortex 2023, 33, 663–675. [CrossRef]
- Dougherty, K.A.; Islam, T.; Johnston, D. Intrinsic excitability of CA1 pyramidal neurones from the rat dorsal and ventral hippocampus. J. Physiol. 2012, 590, 5707–5722. [CrossRef]
- Dow, A.L.; Russell, D.S.; Duman, R.S. Regulation of Activin mRNA and Smad2 Phosphorylation by Antidepressant Treatment in the Rat Brain: Effects in Behavioral Models. J. Neurosci. 2005, 25, 4908–4916. [CrossRef]
- Dubovyk, V.; Manahan-Vaughan, D. Less means more: The magnitude of synaptic plasticity along the hippocampal dorso-ventral axis is inversely related to the expression levels of plasticity-related neurotransmitter receptors. Hippocampus 2018, 28, 136–150. [CrossRef]
- Fanselow, M.S.; Dong, H.-W. Are the Dorsal and Ventral Hippocampus Functionally Distinct Structures?. Neuron 2010, 65, 7–19. [CrossRef]
- Farrant, M.; Nusser, Z. Variations on an inhibitory theme: phasic and tonic activation of GABAA receptors. Nat. Rev. Neurosci. 2005, 6, 215–229. [CrossRef]
- Ganea, K.; Menke, A.; Schmidt, M.V.; Lucae, S.; Rammes, G.; Liebl, C.; Harbich, D.; Sterlemann, V.; Storch, C.; Uhr, M.; et al. Convergent animal and human evidence suggests the activin/inhibin pathway to be involved in antidepressant response. Transl. Psychiatry 2012, 2, e177–e177. [CrossRef]
- Gergues, M.M.; Yohn, C.N.; Bharadia, A.; Levinstein, M.R.; Samuels, B.A. Dentate gyrus activin signaling mediates the antidepressant response. Transl. Psychiatry 2021, 11, 1–16. [CrossRef]
- Glykys, J.; Mann, E.O.; Mody, I. Which GABAAReceptor Subunits Are Necessary for Tonic Inhibition in the Hippocampus?. J. Neurosci. 2008, 28, 1421–1426. [CrossRef]
- Hasegawa, Y.; Mukai, H.; Asashima, M.; Hojo, Y.; Ikeda, M.; Komatsuzaki, Y.; Ooishi, Y.; Kawato, S. Acute modulation of synaptic plasticity of pyramidal neurons by activin in adult hippocampus. Front. Neural Circuits 2014, 8, 56. [CrossRef]
- Hedger, M.P.; Winnall, W.R.; Phillips, D.J.; de Kretser, D.M. The Regulation and Functions of Activin and Follistatin in Inflammation and Immunity. 2011, 85, 255–297. [CrossRef]
- Hörtnagl, H.; Berger, M.; Sperk, G.; Pifl, C. Regional heterogeneity in the distribution of neurotransmitter markers in the rat hippocampus. Neuroscience 1991, 45, 261–272. [CrossRef]
- Inokuchi, K.; Kato, A.; Hiraia, K.; Hishinuma, F.; Inoue, M.; Ozawa, F. Increase in activin βA mRNA in rat hippocampus during long-term potentiation. FEBS Lett. 1996, 382, 48–52. [CrossRef]
- Jaeger, B.N.; Linker, S.B.; Parylak, S.L.; Barron, J.J.; Gallina, I.S.; Saavedra, C.D.; Fitzpatrick, C.; Lim, C.K.; Schafer, S.T.; Lacar, B.; et al. A novel environment-evoked transcriptional signature predicts reactivity in single dentate granule neurons. Nat. Commun. 2018, 9, 1–15. [CrossRef]
- Krieglstein, K.; Zheng, F.; Unsicker, K.; Alzheimer, C. More than being protective: functional roles for TGF-β/activin signaling pathways at central synapses. Trends Neurosci. 2011, 34, 421–429. [CrossRef]
- Kuzumaki, N.; Ikegami, D.; Tamura, R.; Hareyama, N.; Imai, S.; Narita, M.; Torigoe, K.; Niikura, K.; Takeshima, H.; Ando, T.; et al. Hippocampal epigenetic modification at the brain-derived neurotrophic factor gene induced by an enriched environment. Hippocampus 2011, 21, 127–132,. [CrossRef]
- Link, A.S.; Kurinna, S.; Havlicek, S.; Lehnert, S.; Reichel, M.; Kornhuber, J.; Winner, B.; Huth, T.; Zheng, F.; Werner, S.; et al. Kdm6b and Pmepa1 as Targets of Bioelectrically and Behaviorally Induced Activin A Signaling. Mol. Neurobiol. 2016, 53, 4210–4225.
- Link, A.S.; Zheng, F.; Alzheimer, C. Activin Signaling in the Pathogenesis and Therapy of Neuropsychiatric Diseases. Front. Mol. Neurosci. 2016, 9, 32. [CrossRef]
- Lothmann, K.; Deitersen, J.; Zilles, K.; Amunts, K.; Herold, C. New boundaries and dissociation of the mouse hippocampus along the dorsal-ventral axis based on glutamatergic,GABAergicand catecholaminergic receptor densities. Hippocampus 2021, 31, 56–78. [CrossRef]
- Maggio, N.; Segal, M. Differential Corticosteroid Modulation of Inhibitory Synaptic Currents in the Dorsal and Ventral Hippocampus. J. Neurosci. 2009, 29, 2857–2866. [CrossRef]
- Malik, R.; Dougherty, K.A.; Parikh, K.; Byrne, C.; Johnston, D. Mapping the electrophysiological and morphological properties of CA1 pyramidal neurons along the longitudinal hippocampal axis. Hippocampus 2016, 26, 341–361. [CrossRef]
- Milior, G.; Di Castro, M.A.; Sciarria, L.P.; Garofalo, S.; Branchi, I.; Ragozzino, D.; Limatola, C.; Maggi, L. Electrophysiological Properties of CA1 Pyramidal Neurons along the Longitudinal Axis of the Mouse Hippocampus. Sci. Rep. 2016, 6, 38242. [CrossRef]
- Mitra, S.; Werner, C.; Dietz, D.M. Neuroadaptations and TGF-β signaling: emerging role in models of neuropsychiatric disorders. Mol. Psychiatry 2022, 27, 296–306. [CrossRef]
- Mody, I.; De Koninck, Y.; Otis, T.; Soltesz, I. Bridging the cleft at GABA synapses in the brain. Trends Neurosci. 1994, 17, 517–525. [CrossRef]
- Mody, I.; Bewick, G.S.; Reid, B.; Richardson, C.; Banks, R.W. Aspects of the homeostaic plasticity of GABAAreceptor-mediated inhibition. J. Physiol. 2005, 562, 37–46. [CrossRef]
- Mukerji, S.S.; Rainey, R.N.; Rhodes, J.L.; Hall, A.K. Delayed activin A administration attenuates tissue death after transient focal cerebral ischemia and is associated with decreased stress-responsive kinase activation. J. Neurochem. 2009, 111, 1138–1148. [CrossRef]
- Müller, M.R.; Zheng, F.; Werner, S.; Alzheimer, C. Transgenic Mice Expressing Dominant-negative Activin Receptor IB in Forebrain Neurons Reveal Novel Functions of Activin at Glutamatergic Synapses. J. Biol. Chem. 2006, 281, 29076–29084. [CrossRef]
- Netsyk, O.; Hammoud, H.; Korol, S.V.; Jin, Z.; Tafreshiha, A.S.; Birnir, B. Tonic GABA -activated synaptic and extrasynaptic currents in dentate gyrus granule cells and CA3 pyramidal neurons along the mouse hippocampal dorsoventral axis. Hippocampus 2020, 30, 1146–1157. [CrossRef]
- Ohline, S.; Abraham, W. Environmental enrichment effects on synaptic and cellular physiology of hippocampal neurons. Neuropharmacology 2019, 145, 3–12. [CrossRef]
- Ordemann, G.J.; Apgar, C.J.; Brager, D.H. D-type potassium channels normalize action potential firing between dorsal and ventral CA1 neurons of the mouse hippocampus. J. Neurophysiol. 2019, 121, 983–995. [CrossRef]
- Overstreet, L.S.; Jones, M.V.; Westbrook, G.L. Slow Desensitization Regulates the Availability of Synaptic GABAAReceptors. J. Neurosci. 2000, 20, 7914–7921. [CrossRef]
- Papatheodoropoulos, C.; Asprodini, E.; Nikita, I.; Koutsona, C.; Kostopoulos, G. Weaker synaptic inhibition in CA1 region of ventral compared to dorsal rat hippocampal slices. Brain Res. 2002, 948, 117–121. [CrossRef]
- Roepstorff, A.; Lambert, J.D.C.; Wu, Y.; Wang, H.-Y.; Lin, C.-C.; Lu, H.-C.; Cheng, S.-J.; Chen, C.-C.; Yang, H.-W.; Min, M.-Y.; et al. Factors contributing to the decay of the stimulus-evoked IPSC in rat hippocampal CA1 neurons. J. Neurophysiol. 1994, 72, 2911–2926. [CrossRef]
- Sale, A.; Berardi, N.; Maffei, L. Environment and Brain Plasticity: Towards an Endogenous Pharmacotherapy. Physiol. Rev. 2014, 94, 189–234. [CrossRef]
- Strange, B.A.; Witter, M.P.; Lein, E.S.; Moser, E.I. Functional organization of the hippocampal longitudinal axis. Nat. Rev. Neurosci. 2014, 15, 655–669. [CrossRef]
- Sotiriou, E.; Papatheodoropoulos, C.; Angelatou, F. Differential expression of γ-aminobutyric acid-A receptor subunits in rat dorsal and ventral hippocampus. J. Neurosci. Res. 2005, 82, 690–700. [CrossRef]
- Toyoda, I.; Bower, M.R.; Leyva, F.; Buckmaster, P.S. Early Activation of Ventral Hippocampus and Subiculum during Spontaneous Seizures in a Rat Model of Temporal Lobe Epilepsy. J. Neurosci. 2013, 33, 11100–11115. [CrossRef]
- Tretter, Y.P.; Hertel, M.; Munz, B.; Bruggencate, G.T.; Werner, S.; Alzheimer, C. Induction of activin A is essential for the neuroprotective action of basic fibroblast growth factor in vivo. Nat. Med. 2000, 6, 812–815. [CrossRef]
- Valero-Aracama, M.J.; Sauvage, M.M.; Yoshida, M. Environmental enrichment modulates intrinsic cellular excitability of hippocampal CA1 pyramidal cells in a housing duration and anatomical location-dependent manner. Behav. Brain Res. 2015, 292, 209–218. [CrossRef]
- Werner, S.; Alzheimer, C. Roles of activin in tissue repair, fibrosis, and inflammatory disease. Cytokine Growth Factor Rev. 2006, 17, 157–171. [CrossRef]
- Zhang, T.-Y.; Keown, C.L.; Wen, X.; Li, J.; Vousden, D.A.; Anacker, C.; Bhattacharyya, U.; Ryan, R.; Diorio, J.; O’toole, N.; et al. Environmental enrichment increases transcriptional and epigenetic differentiation between mouse dorsal and ventral dentate gyrus. Nat. Commun. 2018, 9, 298. [CrossRef]
- Zheng, F.; Adelsberger, H.; Müller, M.R.; Fritschy, J.-M.; Werner, S.; Alzheimer, C. Activin tunes GABAergic neurotransmission and modulates anxiety-like behavior. Mol. Psychiatry 2009, 14, 332–346. [CrossRef]
- Zheng, F.; Puppel, A.; E Huber, S.; Link, A.S.; Eulenburg, V.; van Brederode, J.F.; Müller, C.P.; Alzheimer, C. Activin Controls Ethanol Potentiation of Inhibitory Synaptic Transmission Through GABAA Receptors and Concomitant Behavioral Sedation. Neuropsychopharmacology 2016, 41, 2024–2033. [CrossRef]
- Zheng, F.; Valero-Aracama, M.J.; Schaefer, N.; Alzheimer, C. Activin A Reduces GIRK Current to Excite Dentate Gyrus Granule Cells. Front. Cell. Neurosci. 2022, 16, 920388. [CrossRef]
Figure 1.
Dorsal-ventral gradient of activin A before and after enriched environment (EE) exposure for 12 hours. Activin A level in dorsal, medial and ventral hippocampus (DH, MH and VH) from wild-type (wt; A) and dnActRIB (B) mice was determined by ELISA. *** p < 0.001.
Figure 1.
Dorsal-ventral gradient of activin A before and after enriched environment (EE) exposure for 12 hours. Activin A level in dorsal, medial and ventral hippocampus (DH, MH and VH) from wild-type (wt; A) and dnActRIB (B) mice was determined by ELISA. *** p < 0.001.
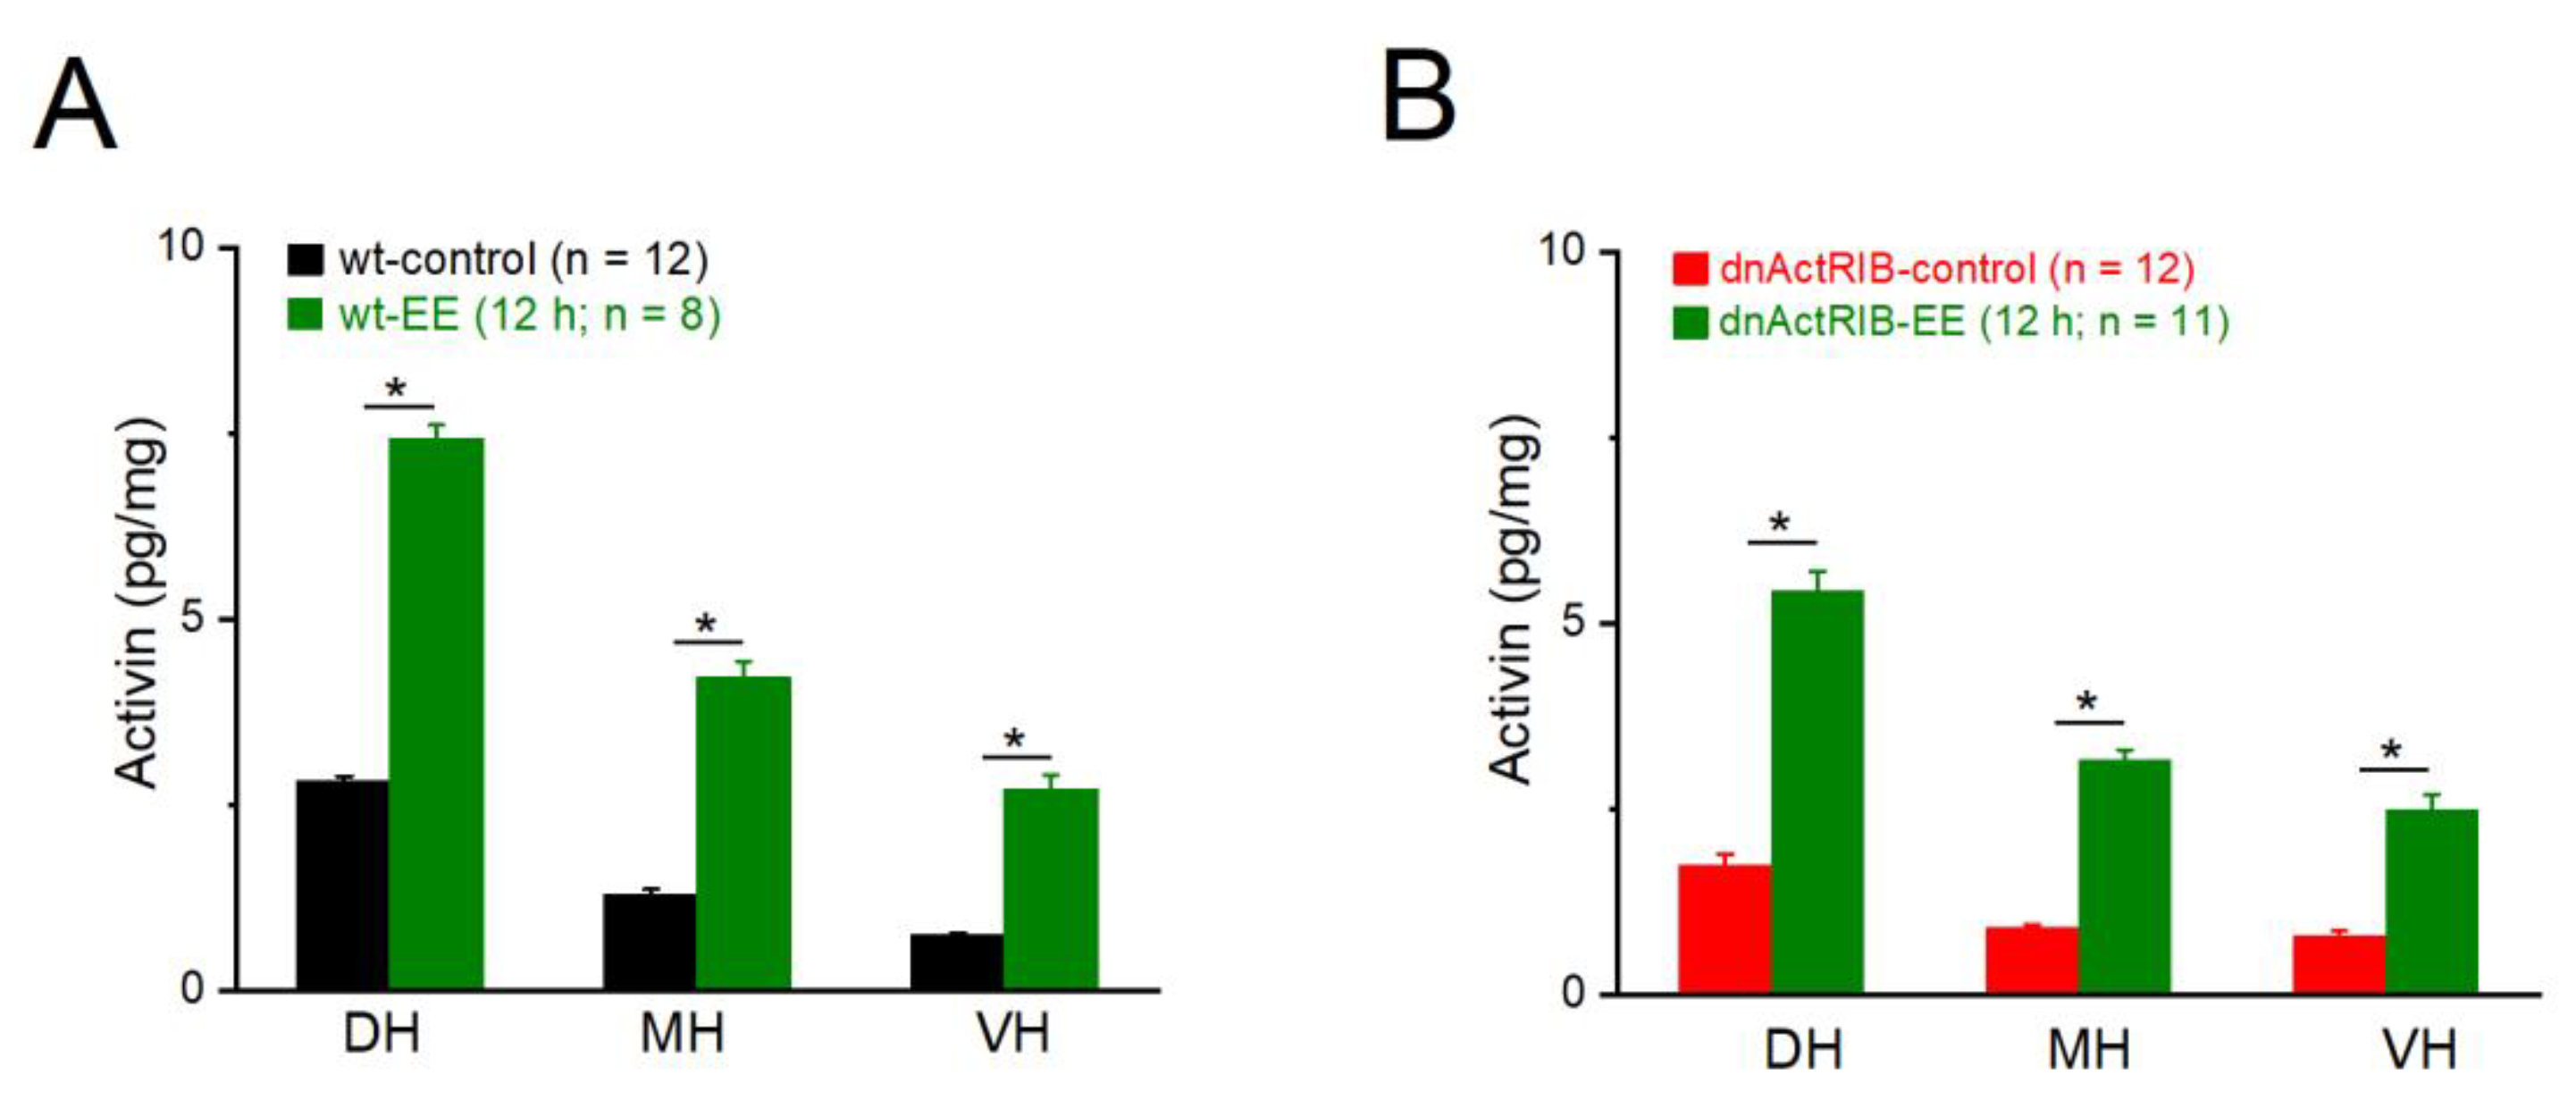
Figure 2.
GABAA receptor-mediated tonic inhibition in dorsal and ventral regions is differently modulated by activin signaling and EE. All recordings were performed in voltage-clamp mode (Vh -70 mV), with GABA (5 µM) and ionotropic glutamate receptor blocker kynurenic acid (KA, 2 mM) in bathing solution. (A) Representative traces of wt CA1 pyramidal cells without and with EE housing illustrate current shift in response to GABAAR blocker picrotoxin (PTX, 100 µM). Note that tonic current and spontaneous phasic events (partially truncated) are downward due to high Cl- concentration in pipette solution. (B) Comparison of changes in holding current in dorsal and ventral regions of wt mice (left) reveals significant larger PTX-sensitive current in ventral cells. Such dorsal-ventral difference in tonic inhibition was abrogated in dnActRIB slices, due to a selective enhancement dorsally. (C) EE housing reduced tonic inhibition only ventrally in wt mice. * p < 0.05.
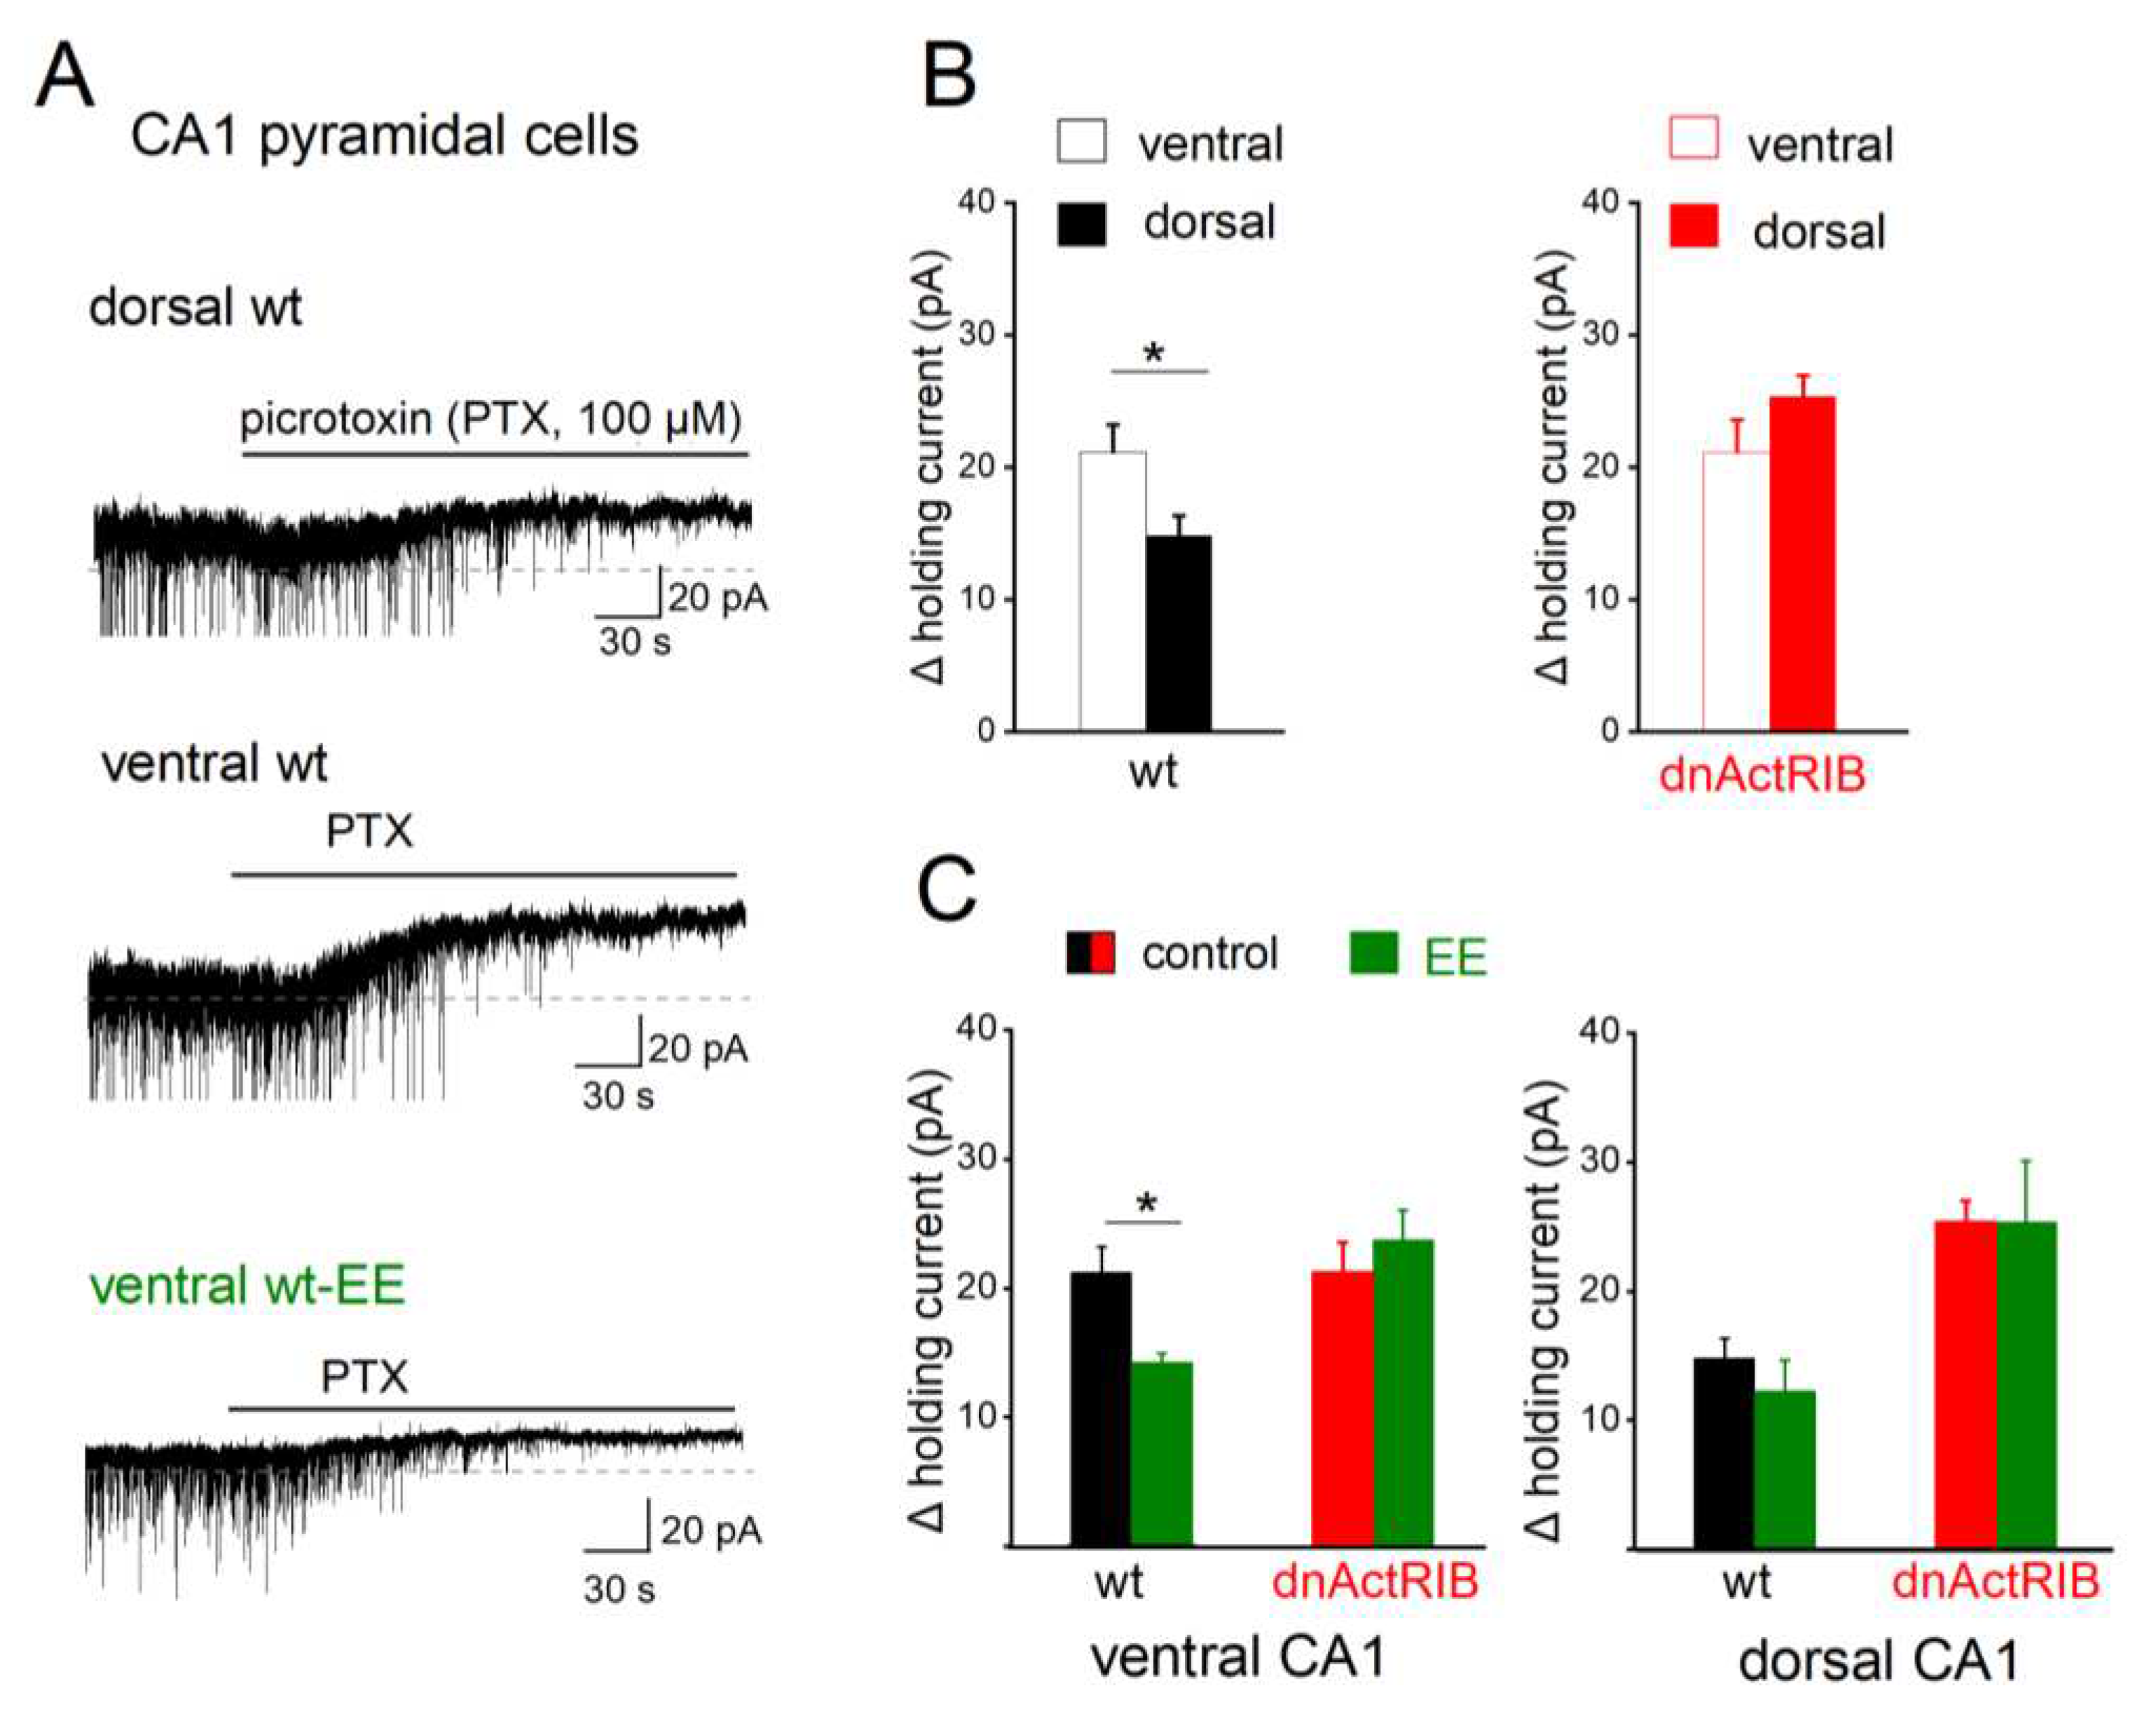
Figure 3.
Disruption of activin signaling enhances spIPSC frequency exclusively in dorsal CA1 pyramidal cells. (A) Typical current traces from ventral pyramidal cells of wt (black) and dnActRIB (red) animals show spIPSCs in the presence of KA. Superimposed traces on the right are like-colored averaged events from corresponding cells on the left. (B-C) Histograms summarize impact of activin signaling on spIPSCs in ventral (B) and dorsal (C) hippocampus, with respect to frequency (top-left), peak amplitude (top-right) and kinetics (10-90% rise time, bottom left; and decay tau, bottom right). Numbers in columns indicate sample size. * p < 0.05.
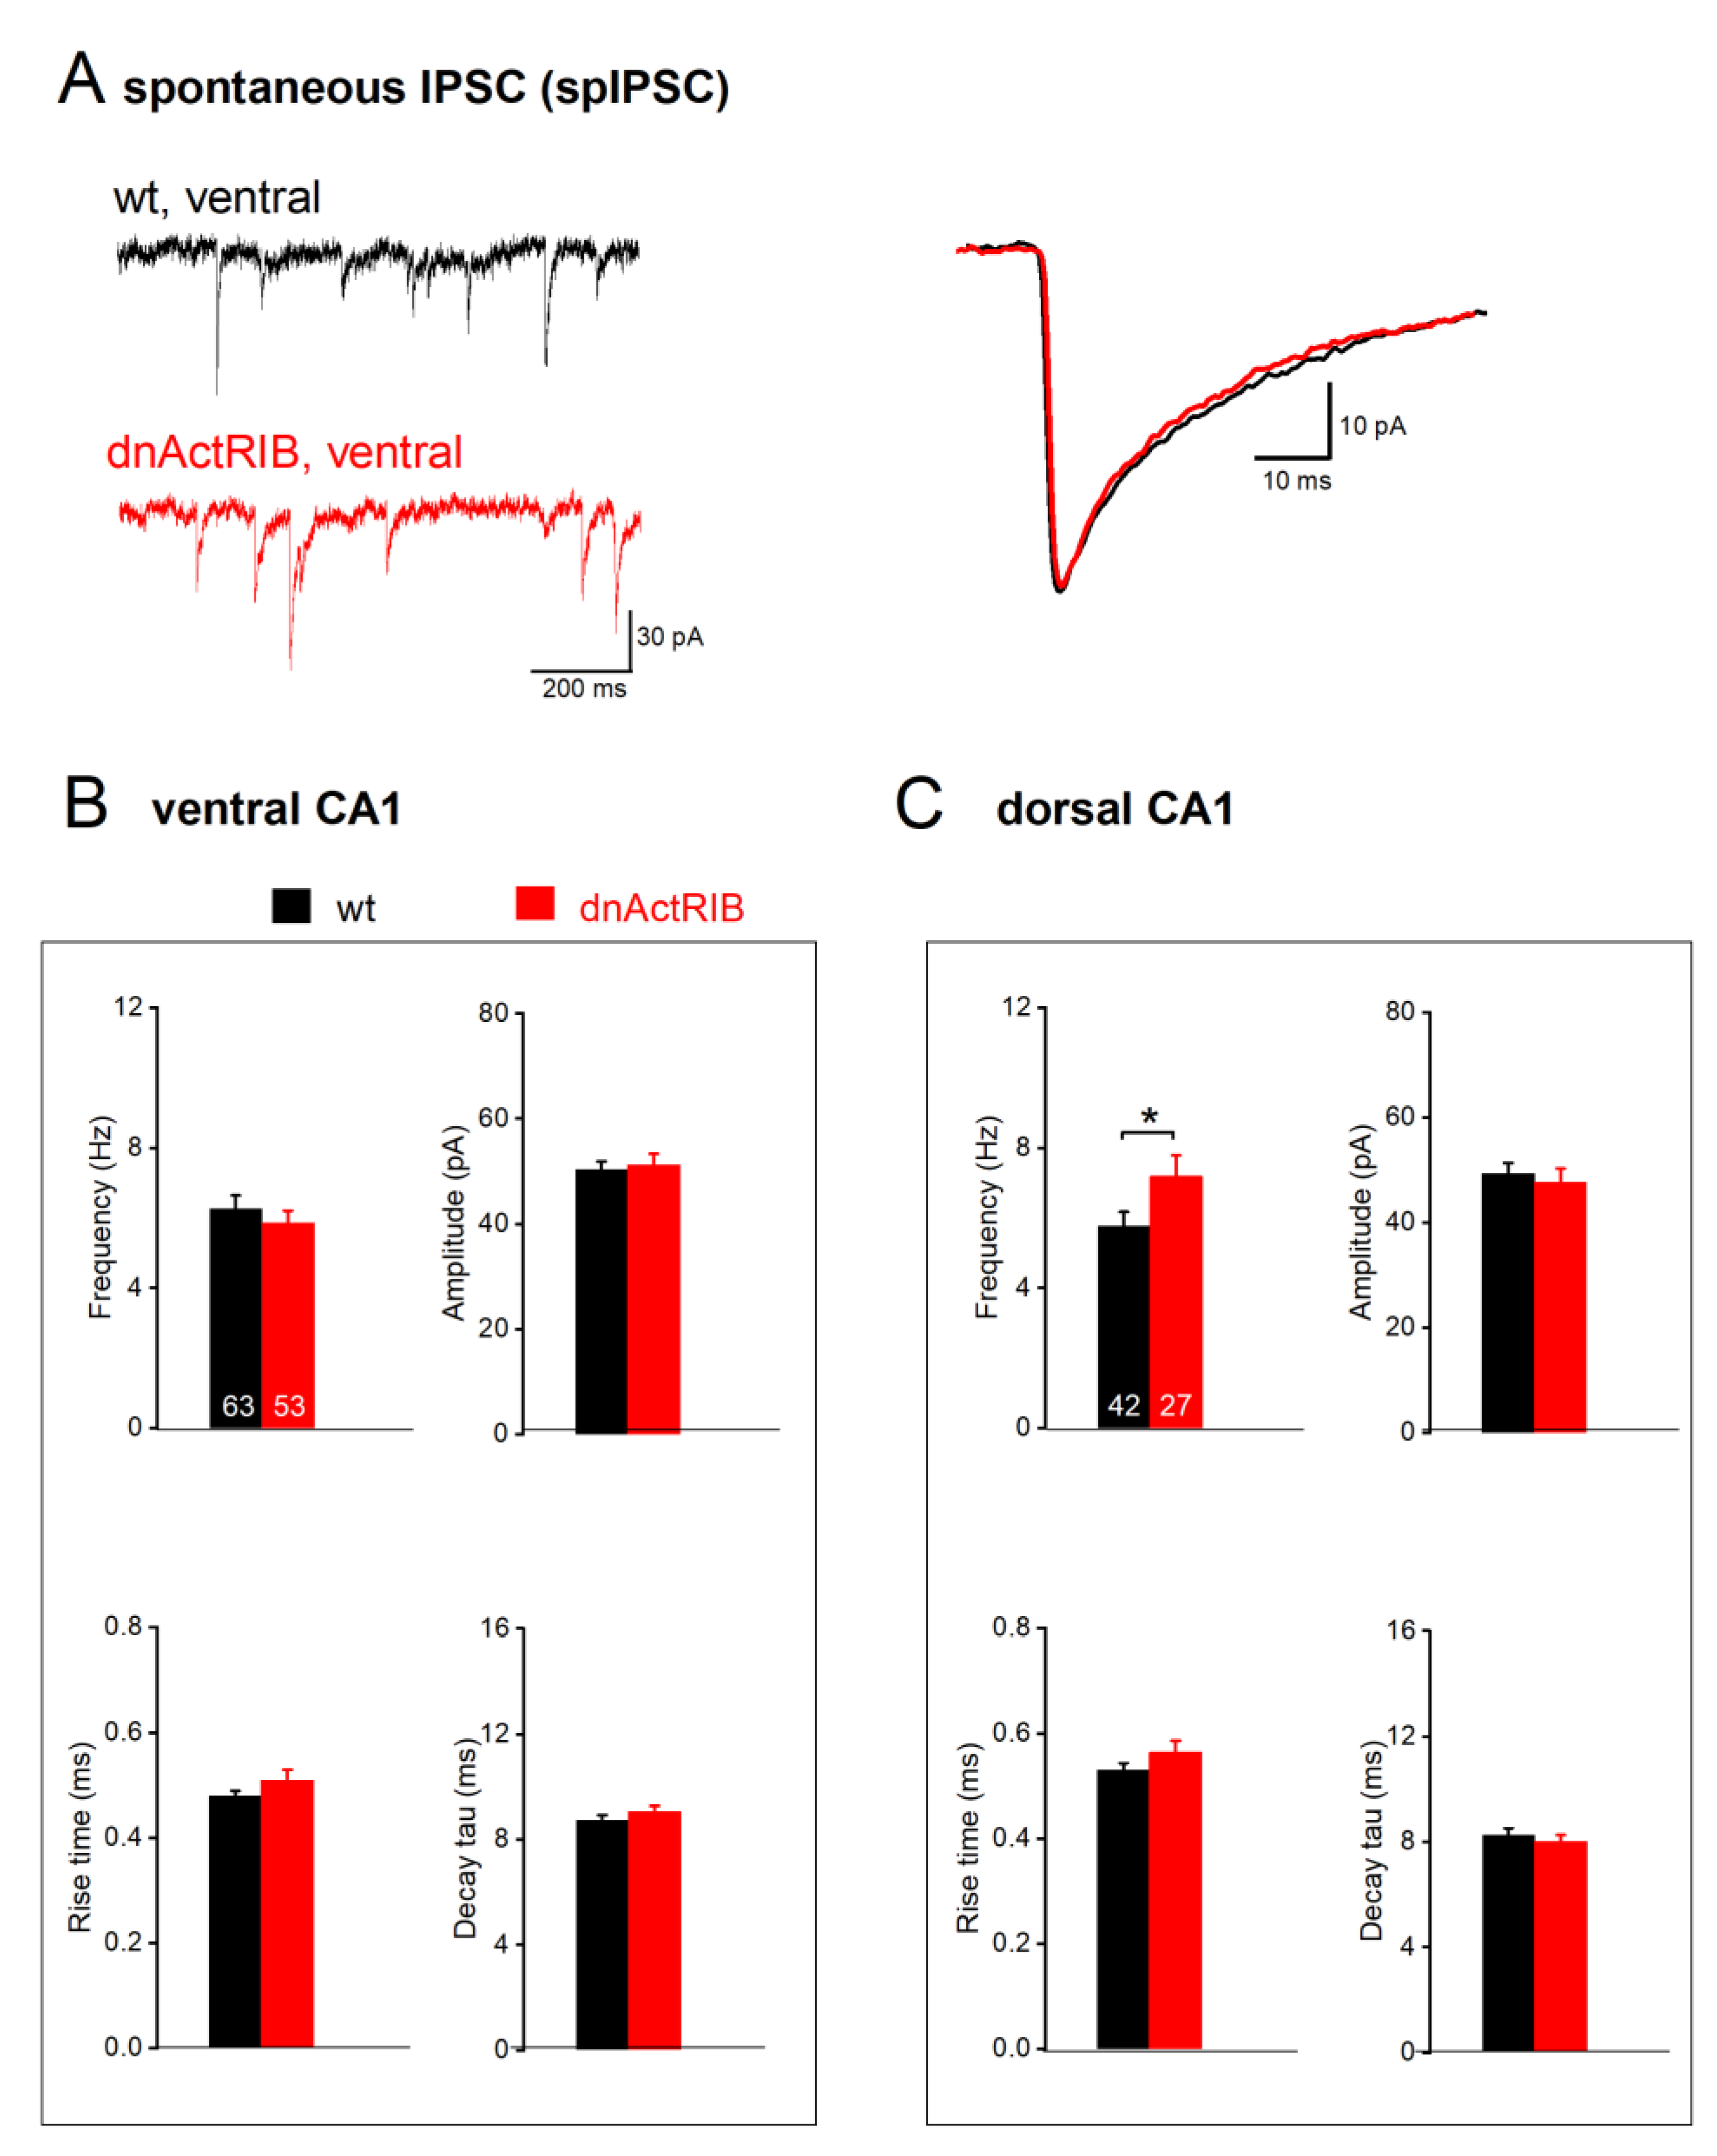
Figure 4.
EE-induced surge in activin A decreases spIPSC frequency in ventral CA1 pyramidal cells. (A) Representative current recordings from ventral CA1 neurons from a wt mouse before (black) and a wt mouse after 12h EE (green, left-hand side). Averaged spIPSCs from cells on the left were normalized to peak amplitude and superimposed to compare kinetics (right-hand side). (B-C) Histograms summarize impact of EE (green) on frequency (top left), amplitude (top right) and kinetics (bottom) in both wild type (black) and dnActRIB (red) mice in ventral (B) and dorsal (C) hippocampus. Numbers in columns indicate sample size. * p < 0.05, ** p < 0.01.
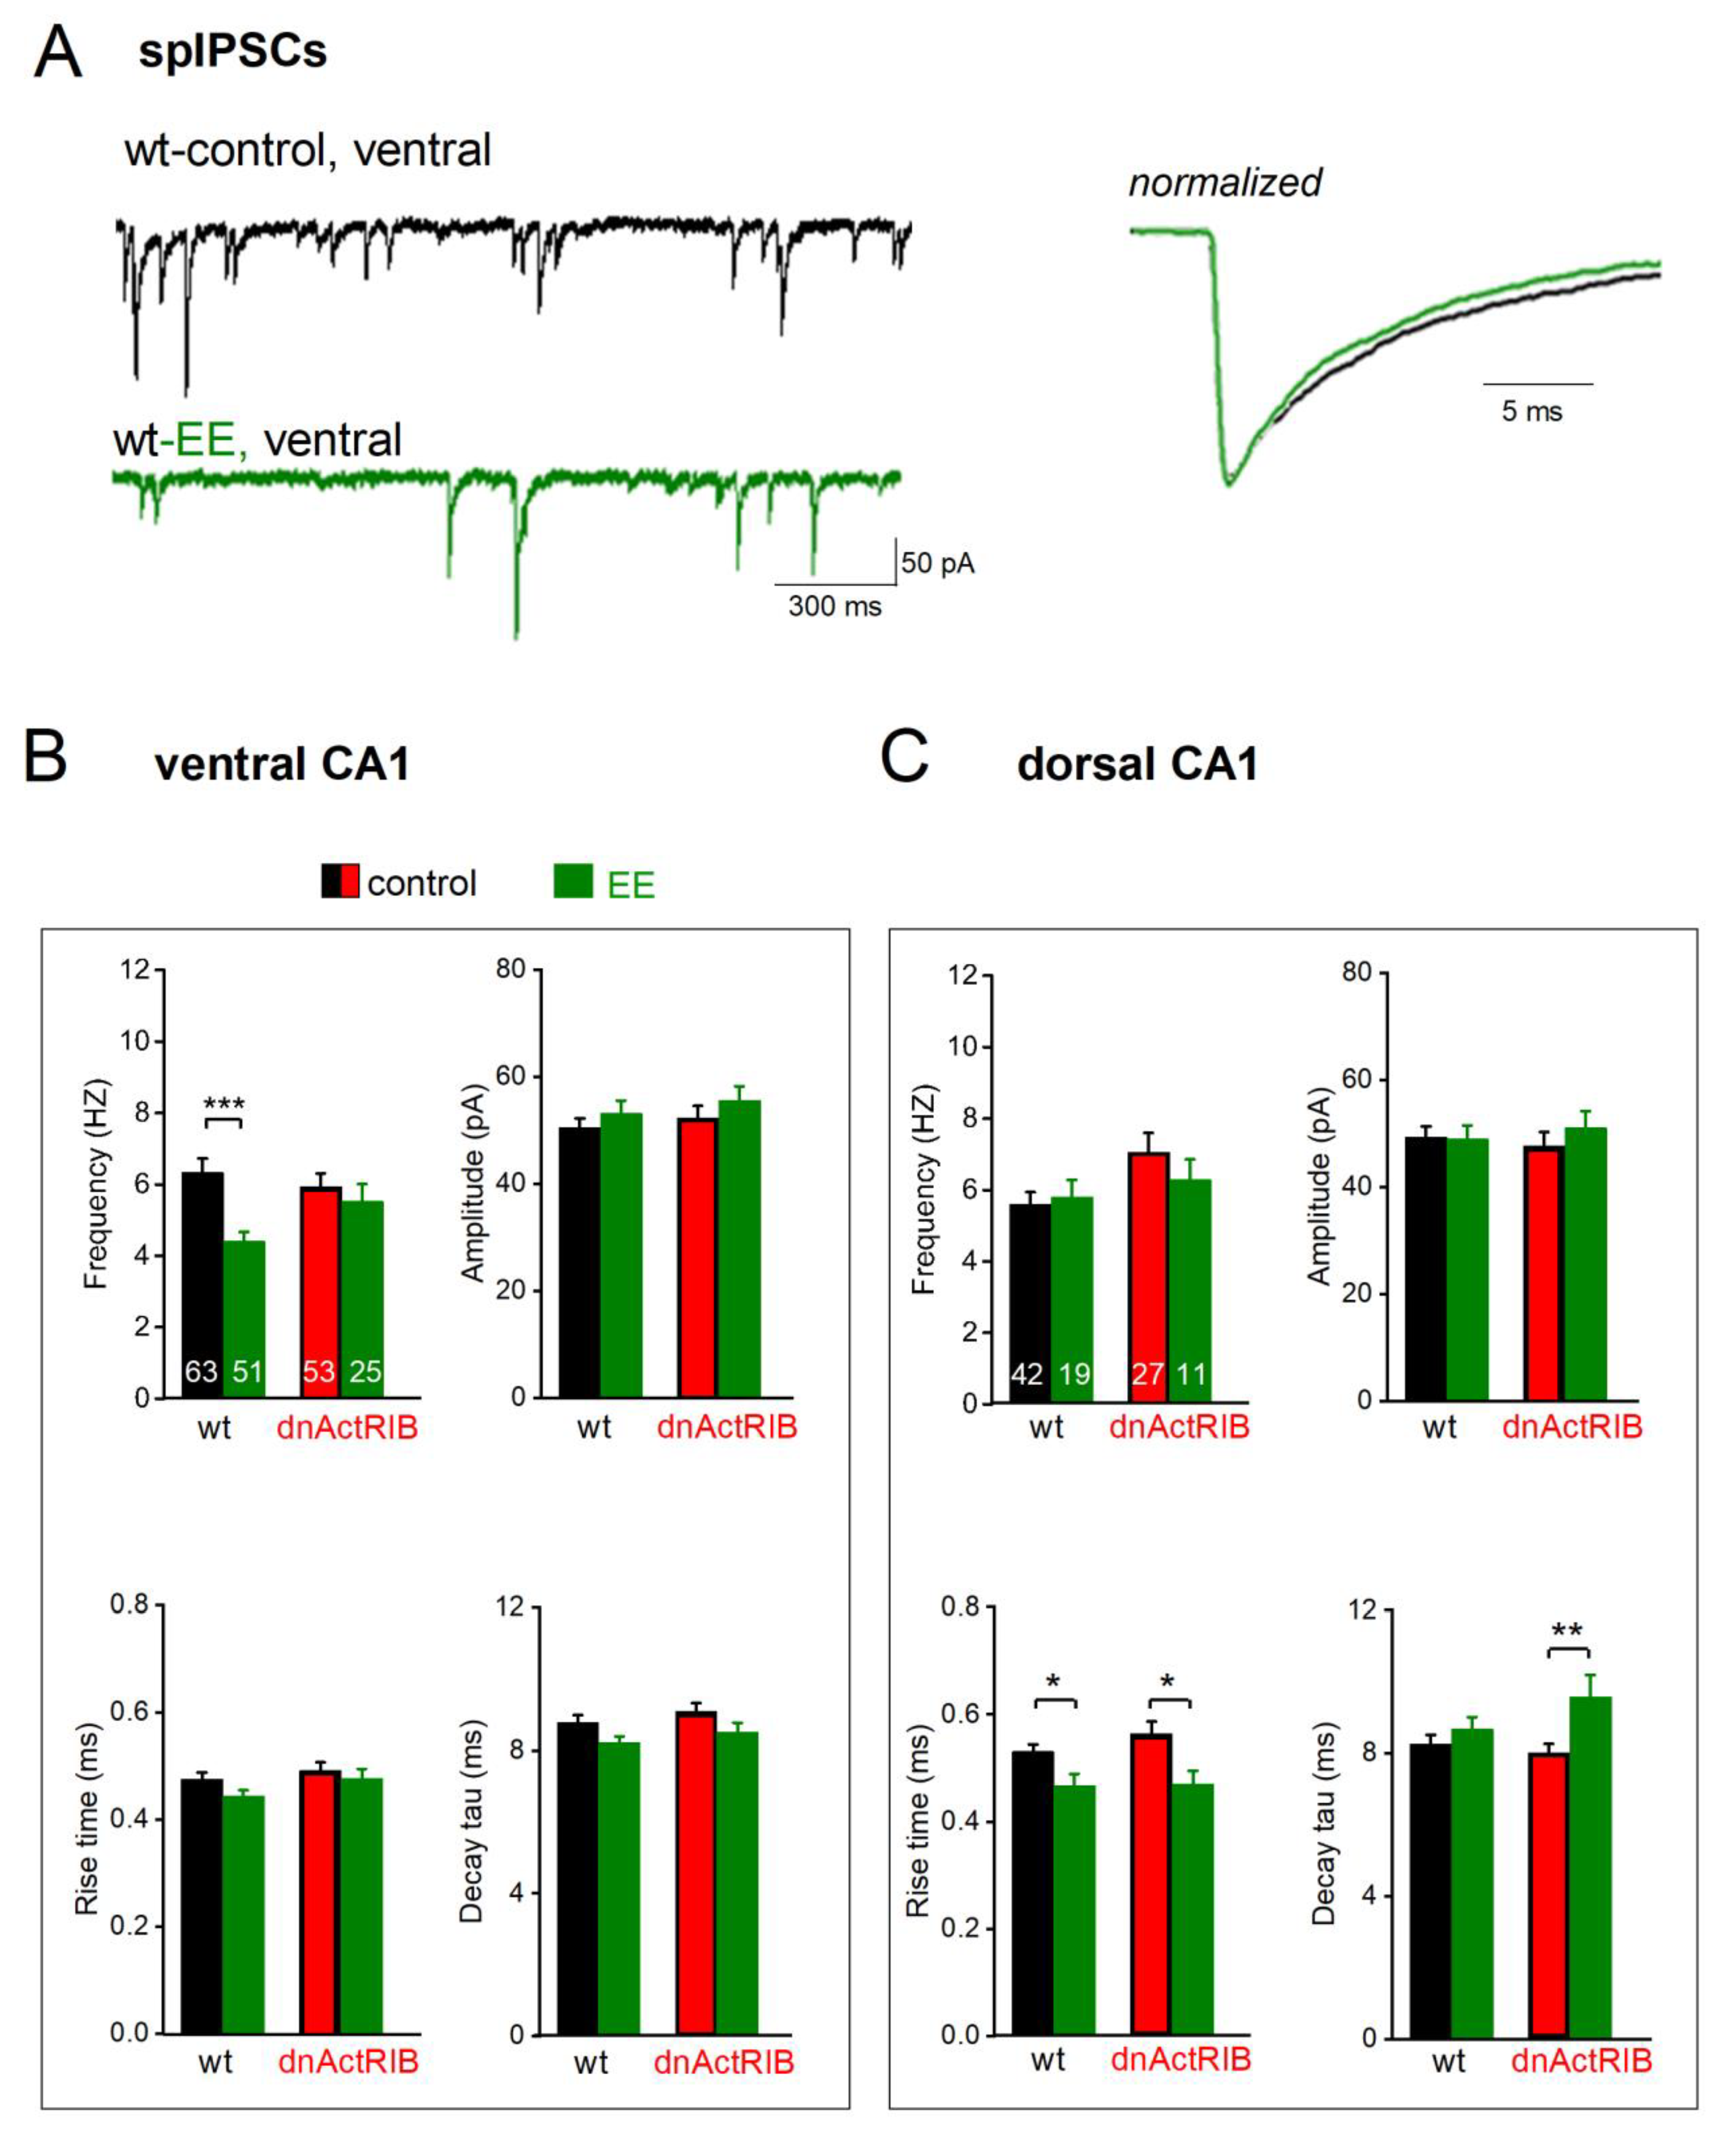
Figure 5.
Recombinant activin A reduces frequency of spontaneous and miniature IPSCs in dorsal and ventral CA1 pyramidal cells from wt mice. (A) Reversible inhibition by activin A (25 ng/ml, 5 min) of miniature events (in TTX) in ventral neuron (current traces on left). Superimposition of normalized mIPSCs waveforms before (black) and during maximal effect of activin application (blue, right). (B-C) Summary of activin effects on spIPSC (left) and mIPSCs properties (right), including frequency (top-left), averaged peak amplitude (top-right), rise time (bottom-left) and decay tau (bottom-right) in cells from both ventral (B) and dorsal (C) hippocampi. Single data points are displayed in gray, average in red. * p < 0.05; ** p < 0.01.
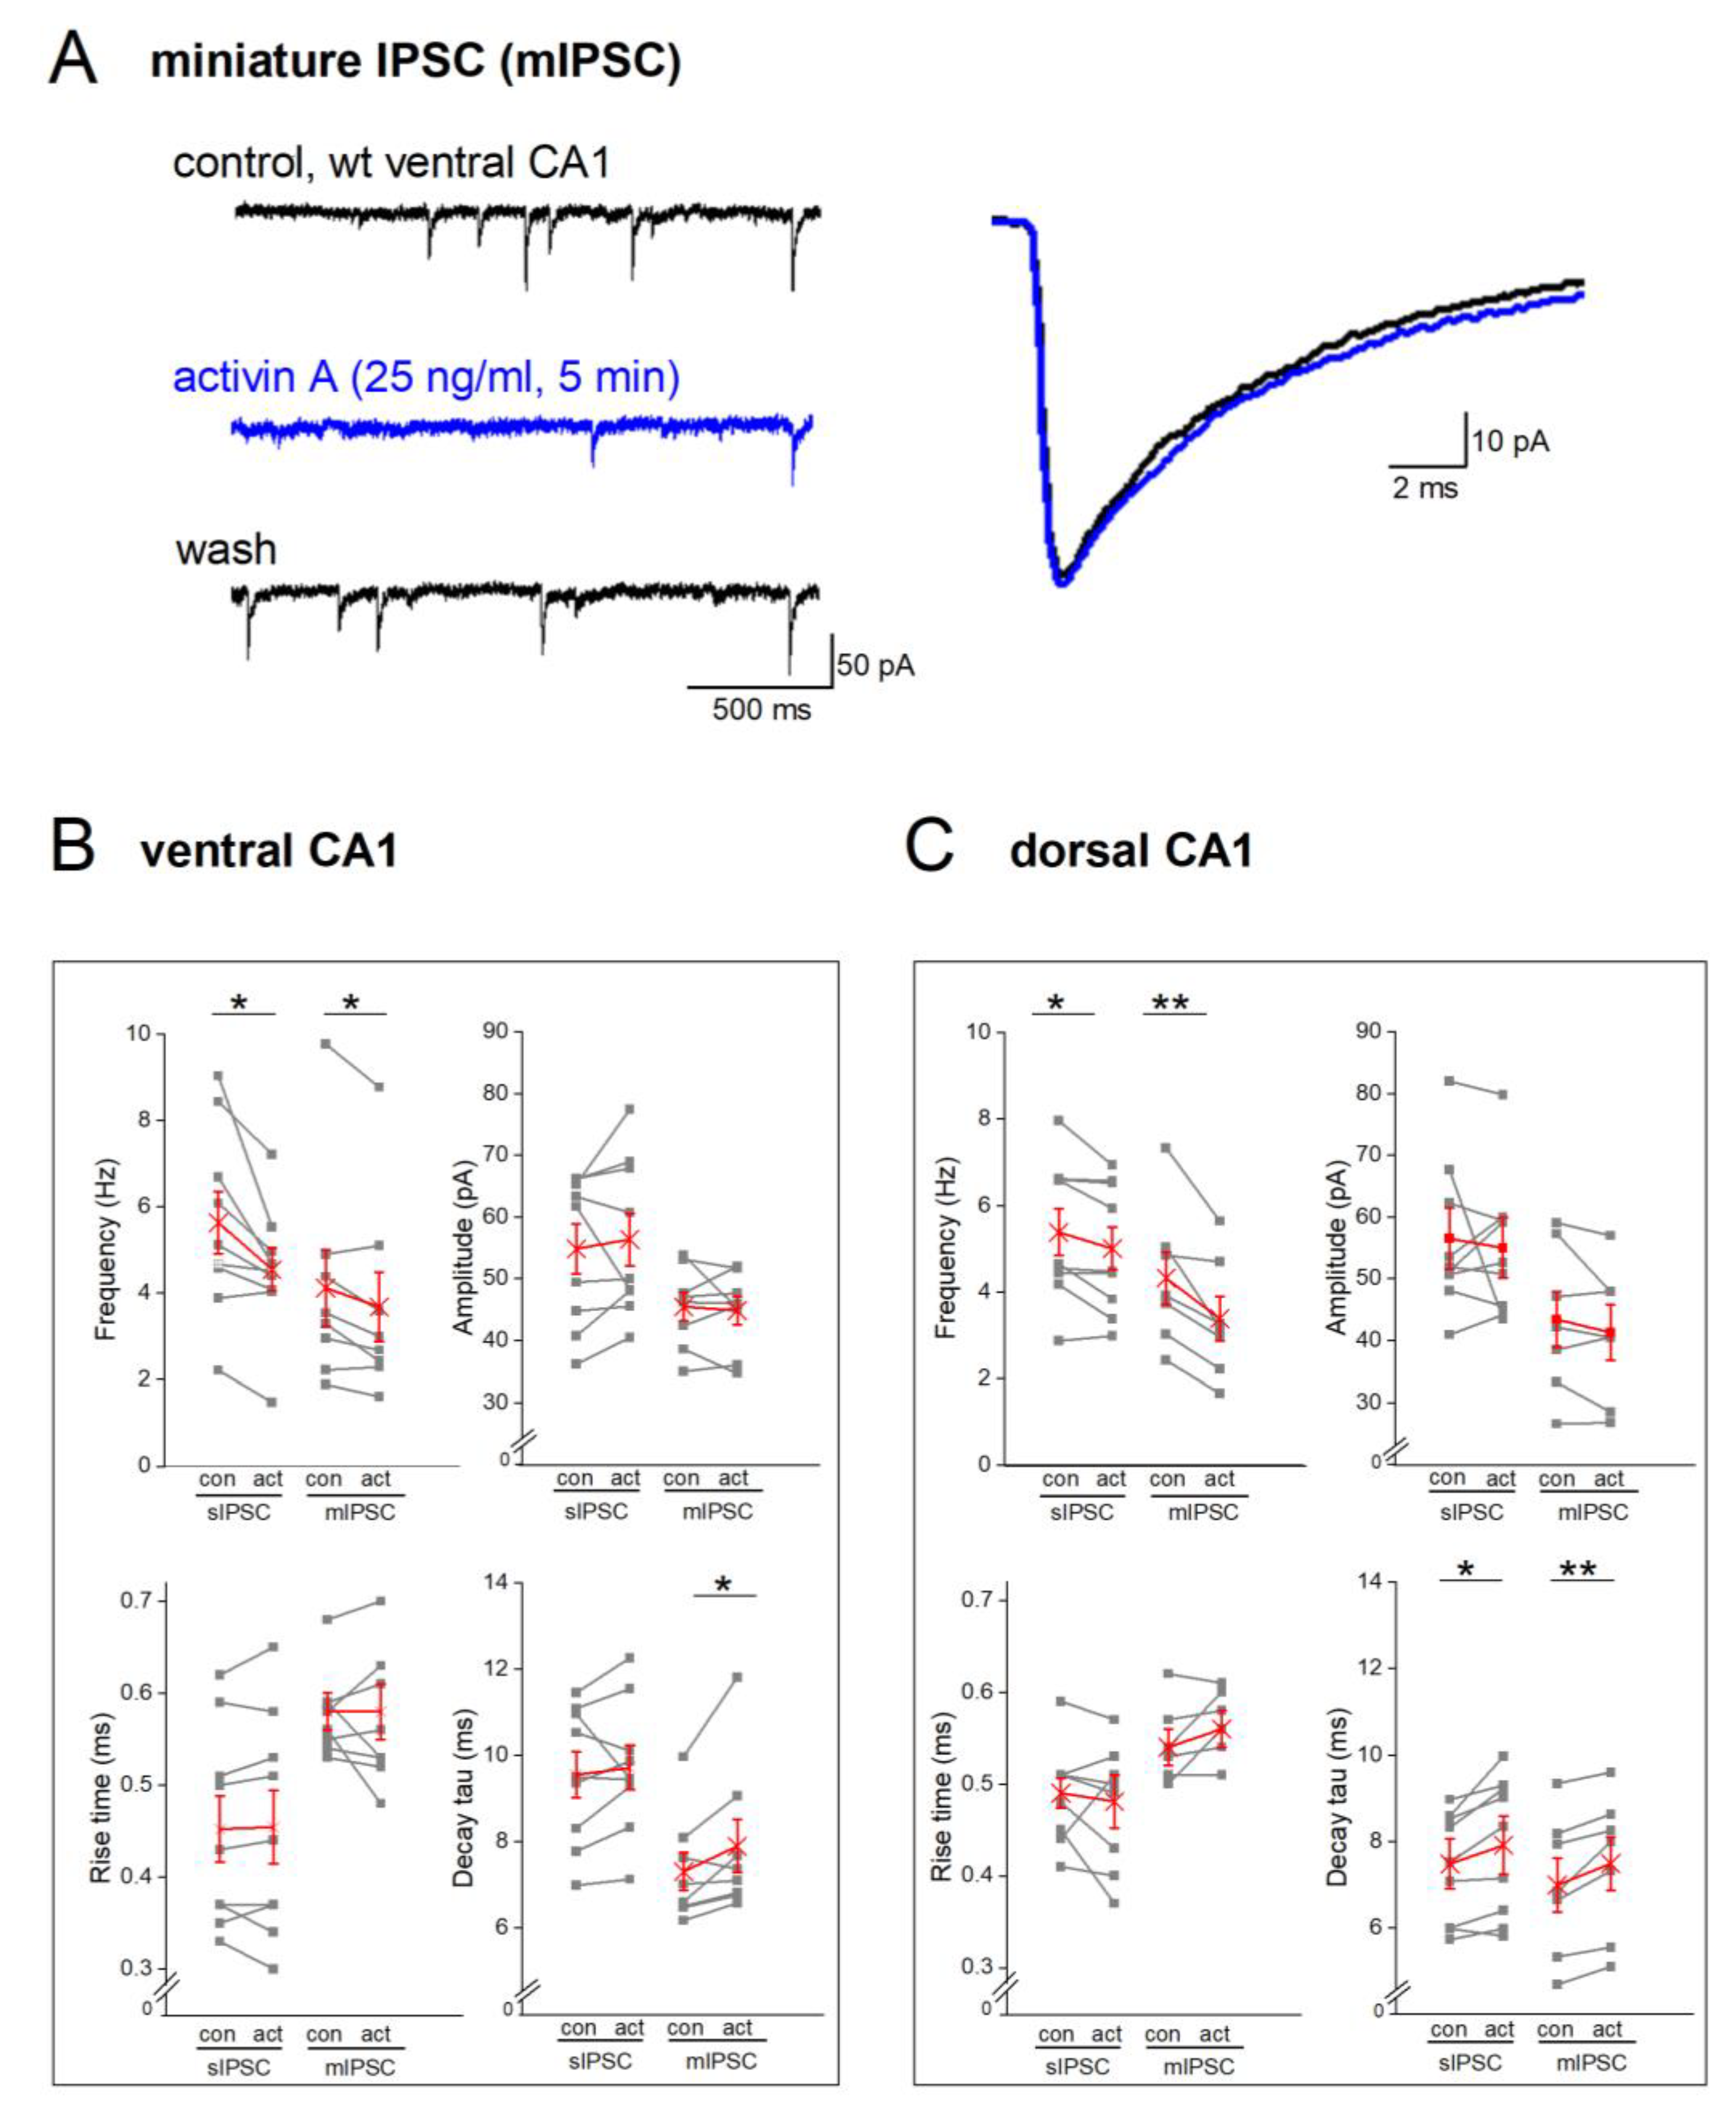
Figure 6.
Dorsal-ventral difference of electrically evoked IPSCs (eIPSCs). (A) Input-output curves depict eIPSC peak amplitude as function of stimulus intensity. Inset shows superimposed eIPSC response to a 200 µA stimulus in dorsal (black) and ventral CA1 cell (gray). (B) Histograms summarize eIPSC kinetics and charge transfer in response to 200 µA stimuli. (C-D) Stimulus trains (100 µA, 5 Hz) reveal stronger frequency-dependent depression of normalized eIPSCs in dorsal than ventral CA1 neurons (C), which is graphically summarized in D. (E) Histogram of total charge transfer during stimulus train. * p < 0.05, *** p < 0.001.
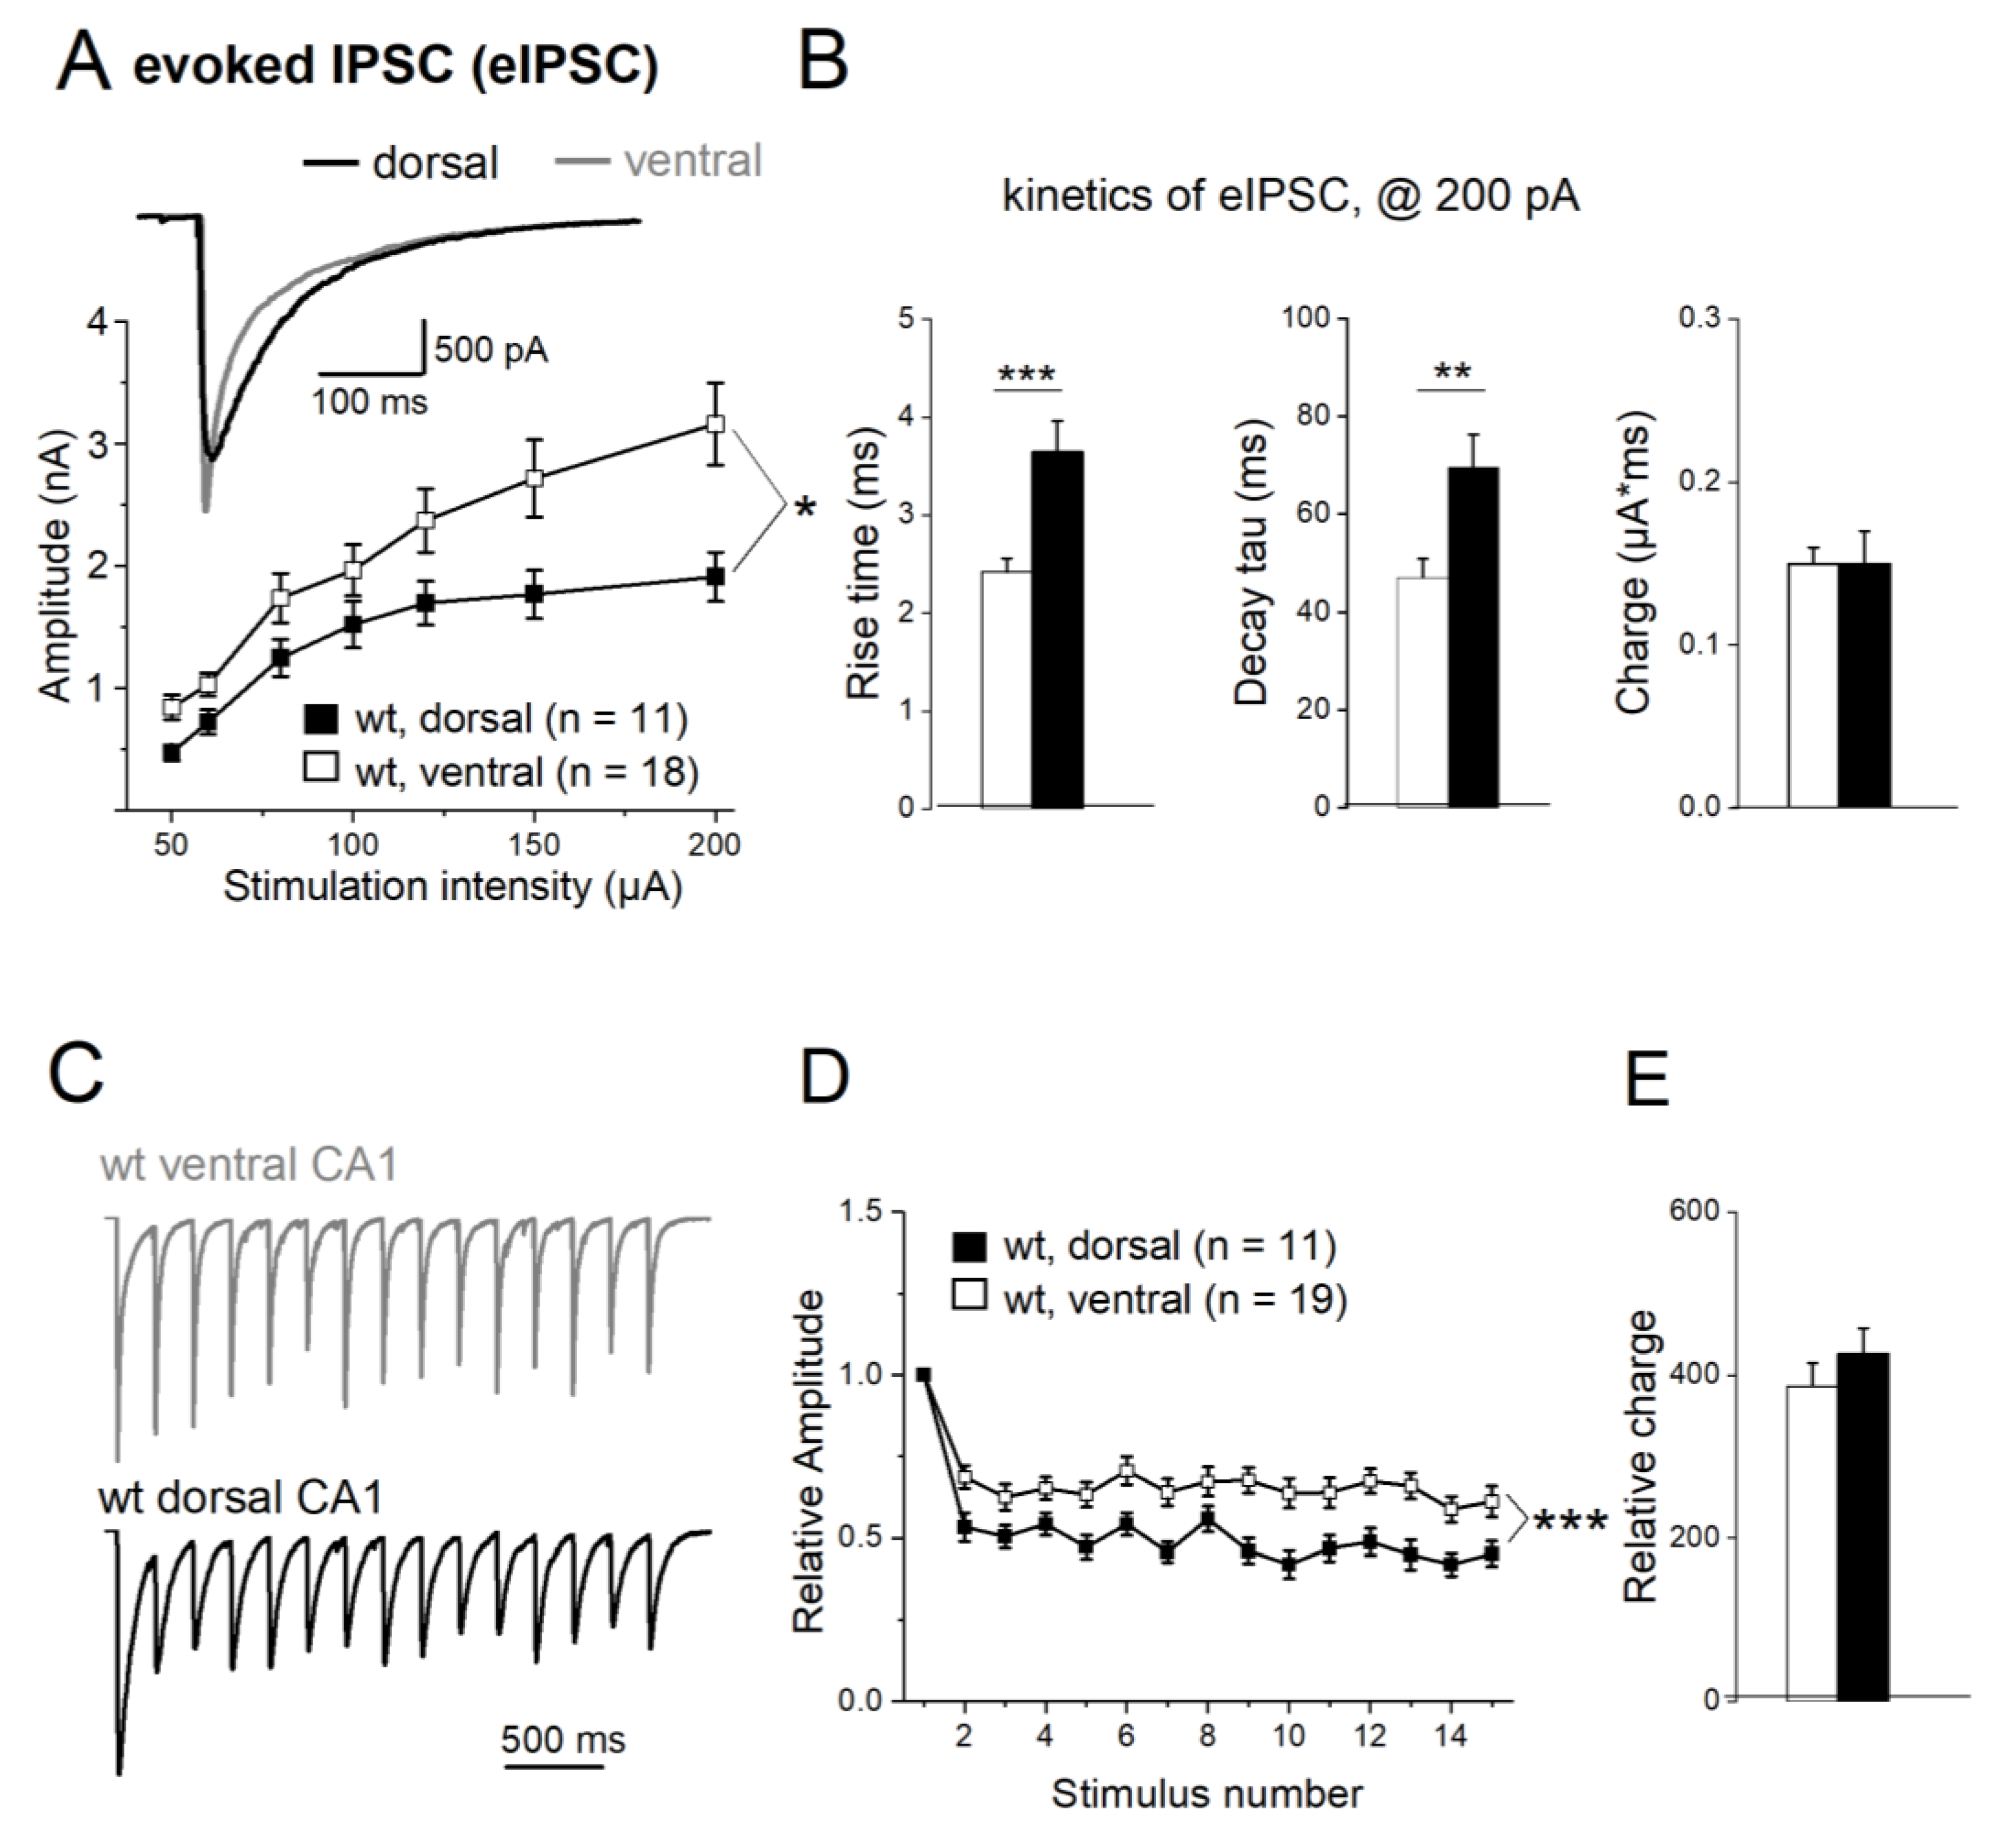
Figure 7.
Activin signaling-deprived CA1 neurons from dorsal hippocampus exhibit enhanced eIPSC response. (A-B) Input-output curves for eIPSCs in ventral (A) and dorsal (B) CA1 pyramidal cells from wt and dnActRIB mice, respectively. (C-D) Histograms summarize properties of eIPSC elicited at 200 µA in ventral (C) and dorsal hippocampus (D) from wt and mutant mice. (E-F) Mutant cells from dorsal, but not ventral hippocampus show attenuated frequency-dependent depression during train. Overall charge transfer was computed from normalized eIPSC waveforms (insets). * p < 0.05, ** p < 0.01.
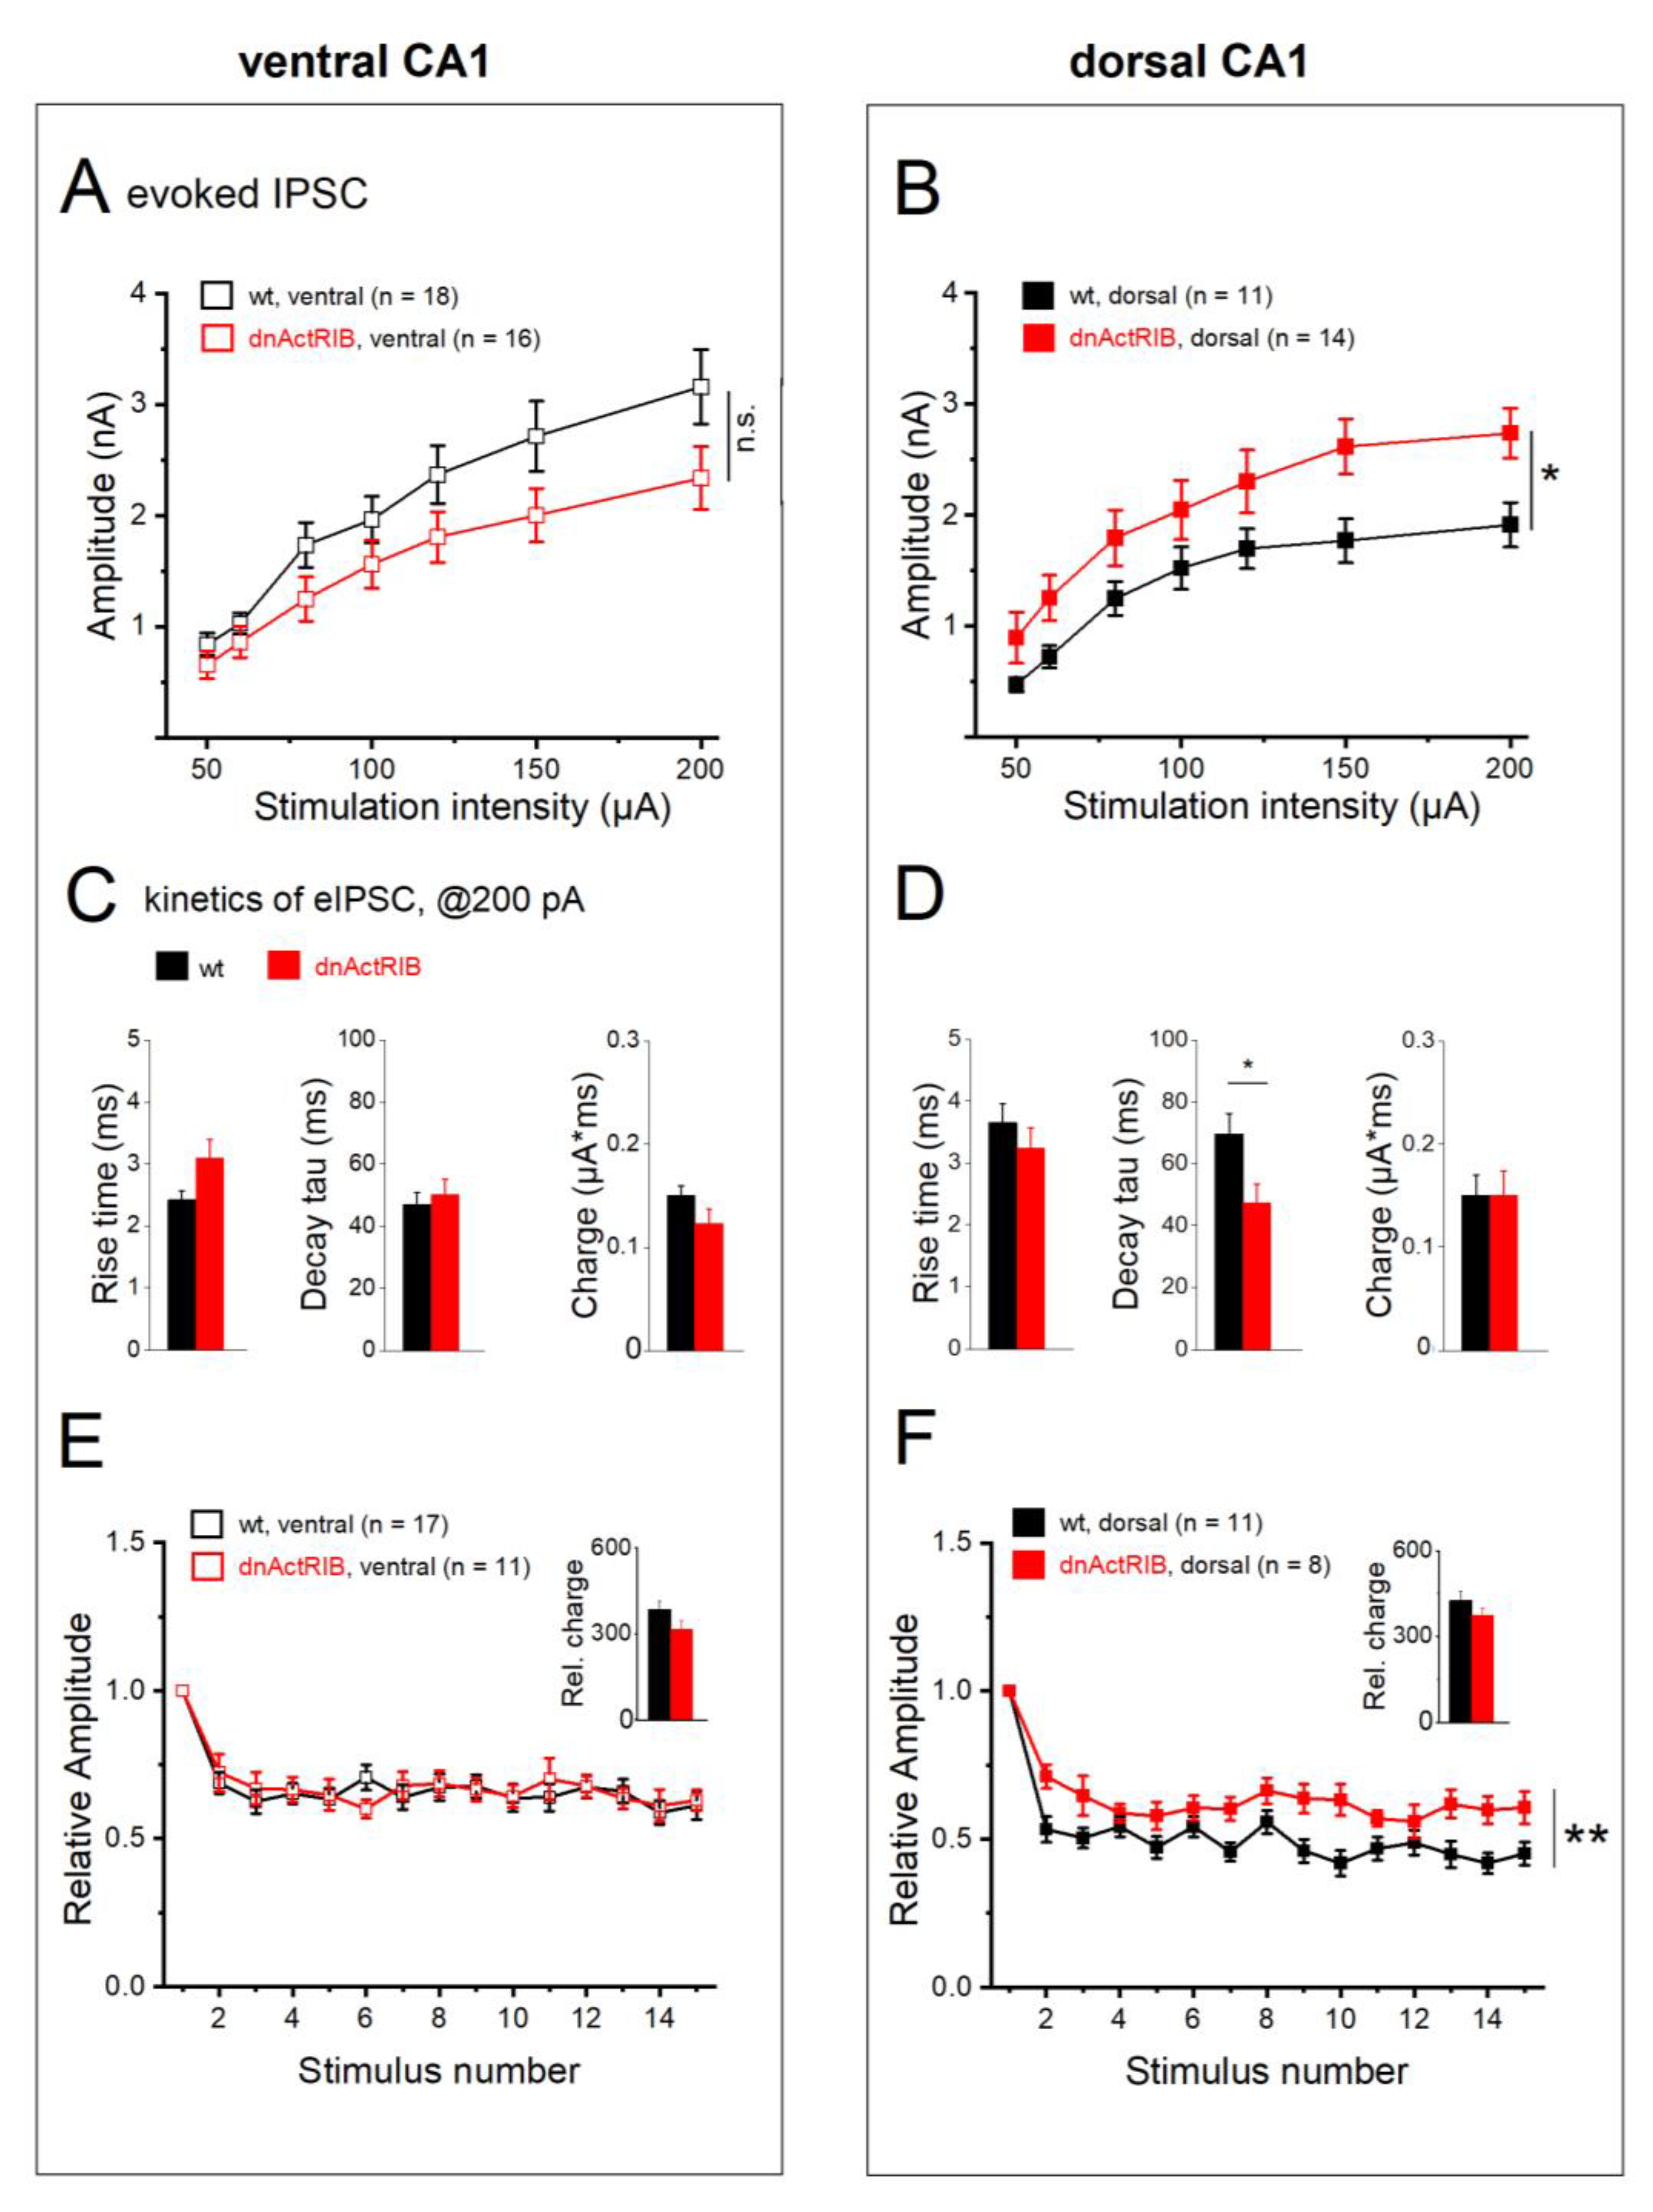
Figure 8.
Effects of EE on single and repetitive eIPSCs in wt and mutant CA1 neurons from dorsal and ventral hippocampus. (A-B) Input-output curves (left) and charge transfer for single eIPSCs at 200 µA stimulus strength (right) in ventral and dorsal CA1 neurons from control and EE-exposed wt mice. (C-D) EE enhanced frequency-dependent depression and reduced charge transfer (inset) in wt ventral CA1 cells (C), whereas their dorsal counterparts remained unaffected (D). (E-H) In dnActRIB hippocampi, the effects of EE on input-output relationship in dorsal hippocampus and frequency-dependent depression and charge transfer in ventral hippocampus were both abrogated. * p < 0.05, ** p < 0.01.
Disclaimer/Publisher’s Note: The statements, opinions and data contained in all publications are solely those of the individual author(s) and contributor(s) and not of MDPI and/or the editor(s). MDPI and/or the editor(s) disclaim responsibility for any injury to people or property resulting from any ideas, methods, instructions or products referred to in the content. |
© 2023 by the authors. Licensee MDPI, Basel, Switzerland. This article is an open access article distributed under the terms and conditions of the Creative Commons Attribution (CC BY) license (http://creativecommons.org/licenses/by/4.0/).
Copyright: This open access article is published under a Creative Commons CC BY 4.0 license, which permit the free download, distribution, and reuse, provided that the author and preprint are cited in any reuse.


