1. Introduction
The subventricular zone (SVZ) is one of the two principal neurogenic niches in the adult brain [
1,
2]. In rodents, neurons generated in the SVZ migrate to the olfactory bulb, where they differentiate into granule neurons and periglomerular neurons [
3]. Upon integration into the olfactory bulb's local circuitry, these neurons play a key role in olfaction and related behaviors [
4].
Neural stem cells (NSCs) can be quiescent or active, and these states are regulated by many factors including synaptic inputs from various brain regions [
5,
6]. For example, NSCs in the lateral ventricle (LV) are influenced by projections from the hypothalamus and cingulate cortex [
7]. Previous work showed that the anterior cingulate cortex (ACC), an area in the frontal cortex, projects to subependymal-neurons expressing choline acetyltransferase (ChAT
+) bordering the LV, and this ACC-subep-ChAT
+ circuit modulates the activity of quiescent LV NSCs through the activation of muscarinic M3 receptors [
8,
9]. M3 activation leads to intracellular calcium release from the endoplasmic reticulum, which initiates a signaling cascade that ultimately promotes proliferation in LV NSCs [
9]. This finding raises the question of how LV NSC proliferation may influence the ACC-subep-ChAT
+ circuit. In particular, can the NSCs produce a negative feedback signal that reduce circuit activation. One possible mechanism for such an influence is through gamma-aminobutyric acid (GABA)-mediated signaling, since subep-ChAT
+ neurons also express GABA
A receptors [
8]. To test hypothesis, we investigated the capacity of LV NSCs in the ventral SVZ to synthesize GABA and regulate its transport.
We first analyzed published RNA sequencing (RNA-seq) data from SVZ LV NSC cultures, including both control and carbachol-treated samples [
10]. The RNA-seq data identified high expression levels of monoamine oxidase B (MAOB) in LV NSCs. MAOB, an enzyme predominantly found in astrocytes, catalyzes the breakdown of putrescine to facilitate GABA synthesis [
11]. Furthermore, there is significant expression of LRRC8D, the largest isoform in the LRRC8 protein family. LRRC8D functions as a subunit of the volume-regulated anion channels (VRACs) [
13], which may play a role in transporting GABA [
12,
13]. Finally, we also found significant expressions of SLC6A1, the gene encoding the GABA transporter 1 (GAT-1). GAT-1 facilitates the reuptake of extracellular GABA into neurons and glia [
14]. These findings suggest a potential functional role for GABA in modulating the ACC-subep-ChAT⁺ circuit, which may in turn influence the activation and proliferation of LV NSCs
(Figure 1A).
We found that, in LV NSCs, MAOB expression is increased in response to ACC-subep-ChAT+ circuit activation. LRRC8D and SLC6A1 proteins are expressed in both quiescent and activated NSCs within the ventral SVZ. They appear to regulate the impact of ACC-subep-ChAT+ circuit stimulation on LV NSC proliferation.
2. Materials and Methods
2.1. Chemicals
The antibodies and compounds used in this study are as follows: BMP-4 Protein (Catalog #: 5020-BP, R&D Systems), Carbachol (Catalog #: 212385-M, Millipore Sigma), Compound 21 (DREADD Agonist 21 dihydrochloride, Catalog #: SML2392, Sigma-Aldrich), DCPIB (Catalog #: 1540, Tocris), and CI966 (Catalog #: 1296, Tocris).
2.2. Mice
All experiments were conducted in compliance with an approved protocol from the Institutional Animal Care and Use Committee at Duke University. Mice were group-housed under a 12-hour light/dark cycle (lights on at 7 a.m.), a controlled ambient temperature of 21°C, and 45% humidity. The following mouse lines were obtained from The Jackson Laboratory (JAX): C57BL/6J (Stock #000664) and Cr-Cre (Stock #010774). Both male and female mice, aged between postnatal day 35 (P35) and postnatal day 65 (P65), were included in the study.
2.3. Viruses
pAAV-hSyn-DIO-hM3D(Gαq)-mCherry was purchased from Addgene (Addgene, #44361).
2.4. Antibodies
The study utilized several primary and secondary antibodies to facilitate experimental investigations. Primary antibodies included Anti-Choline Acetyltransferase Antibody (Catalog #AB144P, Millipore Sigma), Mash1 antibodies from ThermoFisher Scientific (Catalog #14-5794-82) and Abcam (Catalog #ab211327), and EGRF (Catalog #AF231, R&D Systems). Additional primary antibodies used were GFAP Chicken Antibody (Catalog #GFAP, Aves Labs), γ-tubulin Monoclonal Antibody (4D11) (Catalog #MA1-850, ThermoFisher Scientific), GABA Polyclonal Antibody (Catalog #PA5-32241, ThermoFisher Scientific), Monoamine Oxidase B Polyclonal Antibody (Catalog #PA5-18442, ThermoFisher Scientific), LRRC8D Polyclonal Antibody (Catalog #11537-1-AP, Proteintech), and SLC6A1 Polyclonal Antibody (Catalog #PA5-85766, ThermoFisher Scientific).
For secondary antibodies, we used Alexa Fluor® 488 AffiniPure™ Donkey Anti-Rabbit IgG (H+L) (Catalog #711-545-152, Jackson ImmunoResearch) and Alexa Fluor® 594 AffiniPure™ Donkey Anti-Rabbit IgG (H+L) (Catalog #711-585-152, Jackson ImmunoResearch). Additional reagents included Alexa Fluor® 594 AffiniPure™ Donkey Anti-Goat IgG (H+L) (Catalog #705-585-003, Jackson ImmunoResearch), Alexa Fluor® 647 AffiniPure™ Donkey Anti-Goat IgG (H+L) (Catalog #705-605-147, Jackson ImmunoResearch), and Alexa Fluor® 488 AffiniPure™ Donkey Anti-Mouse IgG (H+L) (Catalog #715-545-150, Jackson ImmunoResearch). Secondary antibodies targeting chicken IgY (IgG) included Alexa Fluor® 488 AffiniPure™ Donkey Anti-Chicken IgY (H+L) (Catalog #703-545-155, Jackson ImmunoResearch) and Alexa Fluor® 647 AffiniPure™ Donkey Anti-Chicken IgY (H+L) (Catalog #703-605-155, Jackson ImmunoResearch). Finally, Alexa Fluor® 647 AffiniPure™ Donkey Anti-Mouse IgG (H+L) (Catalog #715-605-151, Jackson ImmunoResearch) was also utilized.
2.5. Stereotaxic Injections
Stereotaxic injections were conducted on deeply anesthetized mice secured in a stereotaxic frame (David Kopf Instruments) under isoflurane anesthesia. For in vivo chemogenetic activation of the ACC-subep-ChAT+ circuit, 300 nl of the viral vector pAAV-hSyn-DIO-hM3D(Gαq)-mCherry was injected into the ACC region of Cr-Cre (P30) mice. The injection was performed at the following coordinates relative to Bregma: anterior-posterior (AP) +0.8 mm, mediolateral (ML) ± 0.25 mm, dorsoventral (DV) −0.3 mm from the brain surface. Viral infusion was performed slowly for over 10 minutes using a Nanoject injector (Drummond Scientific) connected to a glass pipette. To ensure optimal viral distribution, the pipette was left in place for an additional 10-minute post-injection before being retracted.
Local inhibition of LRRC8D and SLC6A1 was achieved using DCPIB and CI966, respectively, using a micro-osmotic pump (Model 1003D, Alzet) for drug delivery. During the same surgical session, a cannula was implanted into the LV of Cr-Cre (P30) mice at the following coordinates: AP +0.8 mm, ML ± 0.65 mm, DV −2.1 mm from the brain surface. 300 nl of the pAAV-hSyn-DIO-hM3D(Gαq)-mCherry virus was injected into the ACC as previously described.
Cortical circuit activation was achieved via intraperitoneal administration of DREADD agonist C21 10 hours after connecting the osmotic pump, which facilitated drug perfusion. The osmotic pump delivered the drugs at a flow rate of 1 µl per hour for a duration of 12 hours, following the manufacturer's instructions. Experimental timelines and results are presented in Figures 5 and 7.
2.6. Immunofluorescence Staining and Imaging
Brain tissues were prepared for immunohistochemical (IHC) staining to investigate subep-ChAT+ neurons and cortical circuit modulations in chemogenetic in vivo experiments. At the conclusion of the experiments, mice were deeply anesthetized with isoflurane and transcardially perfused with phosphate-buffered saline (PBS), followed by 4% paraformaldehyde (PFA) in PBS. The brains were then carefully removed and post-fixed in 4% PFA at 4°C overnight.
For SVZ whole-mount preparations, the dissected tissues were incubated in a blocking solution consisting of 5% donkey serum and TBST for 100 minutes at room temperature. Subsequently, they were incubated overnight at room temperature in PBS containing 1% donkey serum and specific primary antibodies validated either in our prior publication [
8] or in vendor-provided references. Following primary antibody incubation, the tissues were washed in PBS and then treated with secondary antibodies, including Alexa-594 (1:1000, Life Technologies), Alexa-488 (1:1000, Life Technologies), or Alexa-647 (1:1000, Life Technologies), for two hours at room temperature. Afterward, the tissues were washed in PBS and counterstained with 4',6-diamidino-2-phenylindole (DAPI; Sigma-Aldrich). Finally, the samples were washed four times with TBST and mounted on slides using Fluoromount (Sigma), an aqueous mounting medium
Images were acquired using a Leica SP8 upright confocal microscope (Zeiss) equipped with 10×, 40×, and 63× objectives and controlled via Zen software (Zeiss). To visualize the ventricular-SVZ (V-SVZ) region within the SVZ niche, tile-scan imaging was used, and confocal stacks of 1.5 to 3 μm optical sections were captured to illustrate the monolayer of cells just beneath the ependymal layer. The V-SVZ layer is labeled in the images presented in this manuscript. Additionally, wider-field images encompassing both the ventral SVZ and SVZ regions were acquired using confocal stacks ranging from 8 to 11 μm in depth. These images depict the spatial arrangement of subep-ChAT+ neurons within the SVZ and the layer of LV NSCs, including quiescent LV NSCs, located beneath the ependymal layer in the V-SVZ region.
2.7. In Vivo Stimulation of Chemogenetic Circuits and Local Protein Inhibition in the SVZ
Following stereotaxic viral infusion as detailed in the "Stereotaxic Injections" section and the experimental design illustrated in Fig. 2A, C21 was prepared by dissolving in 0.9% saline and stored at -20°C until use. Intraperitoneal injections of C21 were administered at a dosage of 1 mg/kg. Chemogenetic circuit stimulation in vivo was initiated by intraperitoneal C21 injection, delivered 6 hours prior to the experiment's conclusion.
Simultaneous assessments of in vivo chemogenetic circuit stimulation and localized inhibition of LRCC8D and SLC6A1 proteins in the LVs were conducted (Figs. 5A, 5B, 7A, and 7B). In these experiments, the ventral SVZ was exposed to localized protein inhibition using DCPIB (5 µM) and CI966 (1.5 µM) via continuous infusion for 12 hours. Circuit activation was then initiated during the final 10 hours before the conclusion of the experiment.
For downstream analyses, SVZ wholemounts were dissected to examine the expressions of Mash1, GABA, MAOB, LRRC8D, and SLC6A1. Quantitative comparisons were made between the ipsilateral sides (receiving circuit activation or combined circuit activation and local protein inhibition) and the contralateral control sides. Specifically, the number of GABA+ Mash1+ NSCs/GABA+ NSCs, MAOB+ Mash1+ NSCs/MAOB+ NSCs, LRRC8D+ Mash1+ NSCs/LRRC8D+ NSCs, and SLC6A1+ Mash1+ NSCs/SLC6A1+ NSCs surrounding subep-ChAT+ neurons were analyzed. These comparisons provided insights into the spatial and functional effects of chemogenetic stimulation and protein inhibition on neural stem cell populations.
2.8. SVZ NSC Culture
SVZ NSC cultures were derived from SVZ wholemounts obtained from postnatal (P12) C57BL/6J mice as described previously [
9]. The dissected tissues were placed in DMEM/F-12 (DF) medium supplemented with 100 units/ml penicillin, 100 μg/ml streptomycin, and 250 ng/ml amphotericin B (abx). Following dissection, the pooled tissues were incubated in 0.005% trypsin at 37°C (pH 7.3) for 15 minutes.
After enzymatic digestion, the tissues were transferred to uncoated T75 plastic tissue-culture dishes and incubated overnight in N5 medium. The N5 medium consisted of DF supplemented with N2 supplements, 35 μg/ml bovine pituitary extract, abx, 5% fetal calf serum (FCS, HyClone), and 40 ng/ml each of epidermal growth factor (EGF) and basic fibroblast growth factor (bFGF). Unattached cells were collected, replated on uncoated plastic dishes, and cultured in N5 medium until they reached 90–100% confluency. The medium was refreshed every other day for 3–4 days during proliferation.
Freshly cultured cells were exclusively utilized for all experiments. To induce quiescence in LV NSCs, cells were exposed to 10 ng/ml BMP4 for 24 hours. Following quiescence induction, cells were treated under one of three conditions for an additional 24 hours: media only (control), media supplemented with carbachol (15 µM), or media containing carbachol (15 µM) combined with a selective protein inhibitor. At the conclusion of the treatment period, experiments were terminated by fixing the cells in 4% PFA. Subsequent immunostaining was performed to analyze and quantify cellular responses.
2.9. Quantification and Statistical Analysis
Statistical analyses were performed using GraphPad Prism software (version 8). Paired t-tests were used for both in vivo chemogenetic stimulation studies and in vitro SVZ NSC culture modulation experiments.
To quantify the proportions of GABA⁺-Mash1⁺ NSCs/GABA⁺ NSCs, MAOB⁺-Mash1⁺ NSCs/MAOB⁺ NSCs, LRCC8D⁺-Mash1⁺ NSCs/Mash1⁺ NSCs, and SLC6A1⁺-Mash1⁺ NSCs/SLC6A1⁺ NSCs, as well as the average intensities of GABA per GABA⁺ NSC, MAOB per MAOB⁺ NSC, and SLC6A1 per SLC6A1⁺ NSC in the V-SVZ, 50 μm × 50 μm square images were captured. Each image was centered on a subep-ChAT⁺ neuron to facilitate the analysis of NSC proliferation activity surrounding these neurons.
Biological replicates included five mice per experiment (N = 5), as specified in the figure legends. Paired t-tests were performed to compare the ipsilateral and contralateral sides of the brain within the same animal. The mean number of stained NSCs was calculated from five subep-ChAT⁺ neurons on both the ipsilateral and contralateral sides for each mouse.
Additionally, the quantification of SLC6A1⁺-EGFR⁺ NSCs, as well as the average intensities of GABA per EGFR⁺ NSC and SLC6A1 per EGFR⁺ NSC, was conducted using data from four independent SVZ NSC culture experiments (N = 4), as detailed in Figures 2 and 7. For each experiment, 2–3 wells were analyzed, and paired t-tests were used to assess statistical significance.
4. Discussion
Our previous work showed that the ACC-subep-ChAT
+ circuit can activate quiescent NSCs and promote proliferation via cholinergic signaling [
9]. In this study, we investigated whether LV NSCs can also send a negative feedback signal to regulate ACC-subep-ChAT
+ circuit and in turn affect proliferation of LV NSCs surrounding subep-ChAT
+ neurons. Previous work showed that subep-ChAT
+ neuron activity is inhibited by GABAergic signaling [
8]. Here we examined the role of GABA signaling in this network.
Our findings suggest that LV NSCs surrounding subep-ChAT
+ neurons can produce and potentially release GABA (
Figure 1). Since these GABA-producing LV NSCs is influenced by the ACC-subep-ChAT
+ circuit, GABA may play a role in regulating the subep-ChAT+ neurons and NSC activity, in response to circuit activation and cholinergic signaling (
Figure 2).
We investigated the potential of LV NSCs to synthesize GABA by examining whether MAOB, which is highly expressed in both quiescent and active states of LV NSCs, plays a role in GABA production. Our experiments demonstrated that the ACC-subep-ChAT
+ circuit modulates the activity of the MAOB protein in LV NSCs adjacent to subep-ChAT
+ neurons, suggesting a role linked to this circuit's activity (
Figure 3). Previous studies have identified the putrescine degradation pathway as a biosynthetic mechanism for GABA in astrocytes, with MAOB acting as a key enzyme in this process [
11,
15]. Given the glia-like properties of LV NSCs, it is possible that they also use similar mechanisms to produce GABA.
In addition, we also examined whether LV NSCs in the ventral SVZ domain express GABA-specific transporters capable of facilitating the extracellular transport of GABA. RNA-seq analysis of SVZ NSCs under carbachol treatment versus control conditions identified high expression of several LRRC8 subunits: Lrrc8d, Lrrc8a, Lrrc8c, and Lrrc8b. Of these, Lrrc8d level was reduced by carbachol treatment [
10]. LRRC8 subunits are components of VRACs, which are heteromers facilitating the transport of various neurotransmitters, including glutamate and GABA [
13]. LRRC8D mediates the transport of a broad range of organic compounds [
16]. Our
in vivo findings demonstrate that LV NSCs express the LRRC8D protein (
Figure 4). Selective inhibition of LRRC8D within the ventral SVZ resulted in a significant decrease in LV NSC proliferation driven by the activity of the ACC-subep-ChAT
+ circuit (
Figure 5).
We also investigated the capacity of LV NSCs to reuptake GABA from the extracellular space. RNA-seq analysis of SVZ NSCs revealed that both quiescent and active NSCs express the Slc6a1 gene [
10], which encodes GAT-1, a key transporter for GABA in the brain. Dysfunction or mutations in SLC6A1 have been linked to neurodevelopmental disorders, in which disrupted GABAergic signaling is associated with developmental delays, epilepsy, autism spectrum disorders, and motor dysfunction [
17].
We found that LV NSCs next to subep-ChAT+ neurons express SLC6A1 (GAT-1), which transports GABA from the extracellular to intracellular space. Inhibiting GAT-1 is therefore expected to increase GABA signaling in the extracellular space. Indeed, we found that pharmacological inhibition of GAT-1 with CI966 significantly reduced the impact of the ACC-subep-ChAT+ circuit on LV NSC proliferation. This finding demonstrates the functional significance of GABA transport in negative feedback signaling.
By demonstrating the direct role of LV NSCs in modulating subep-ChAT
+ activity and the reciprocal influence of the ACC-subep-ChAT
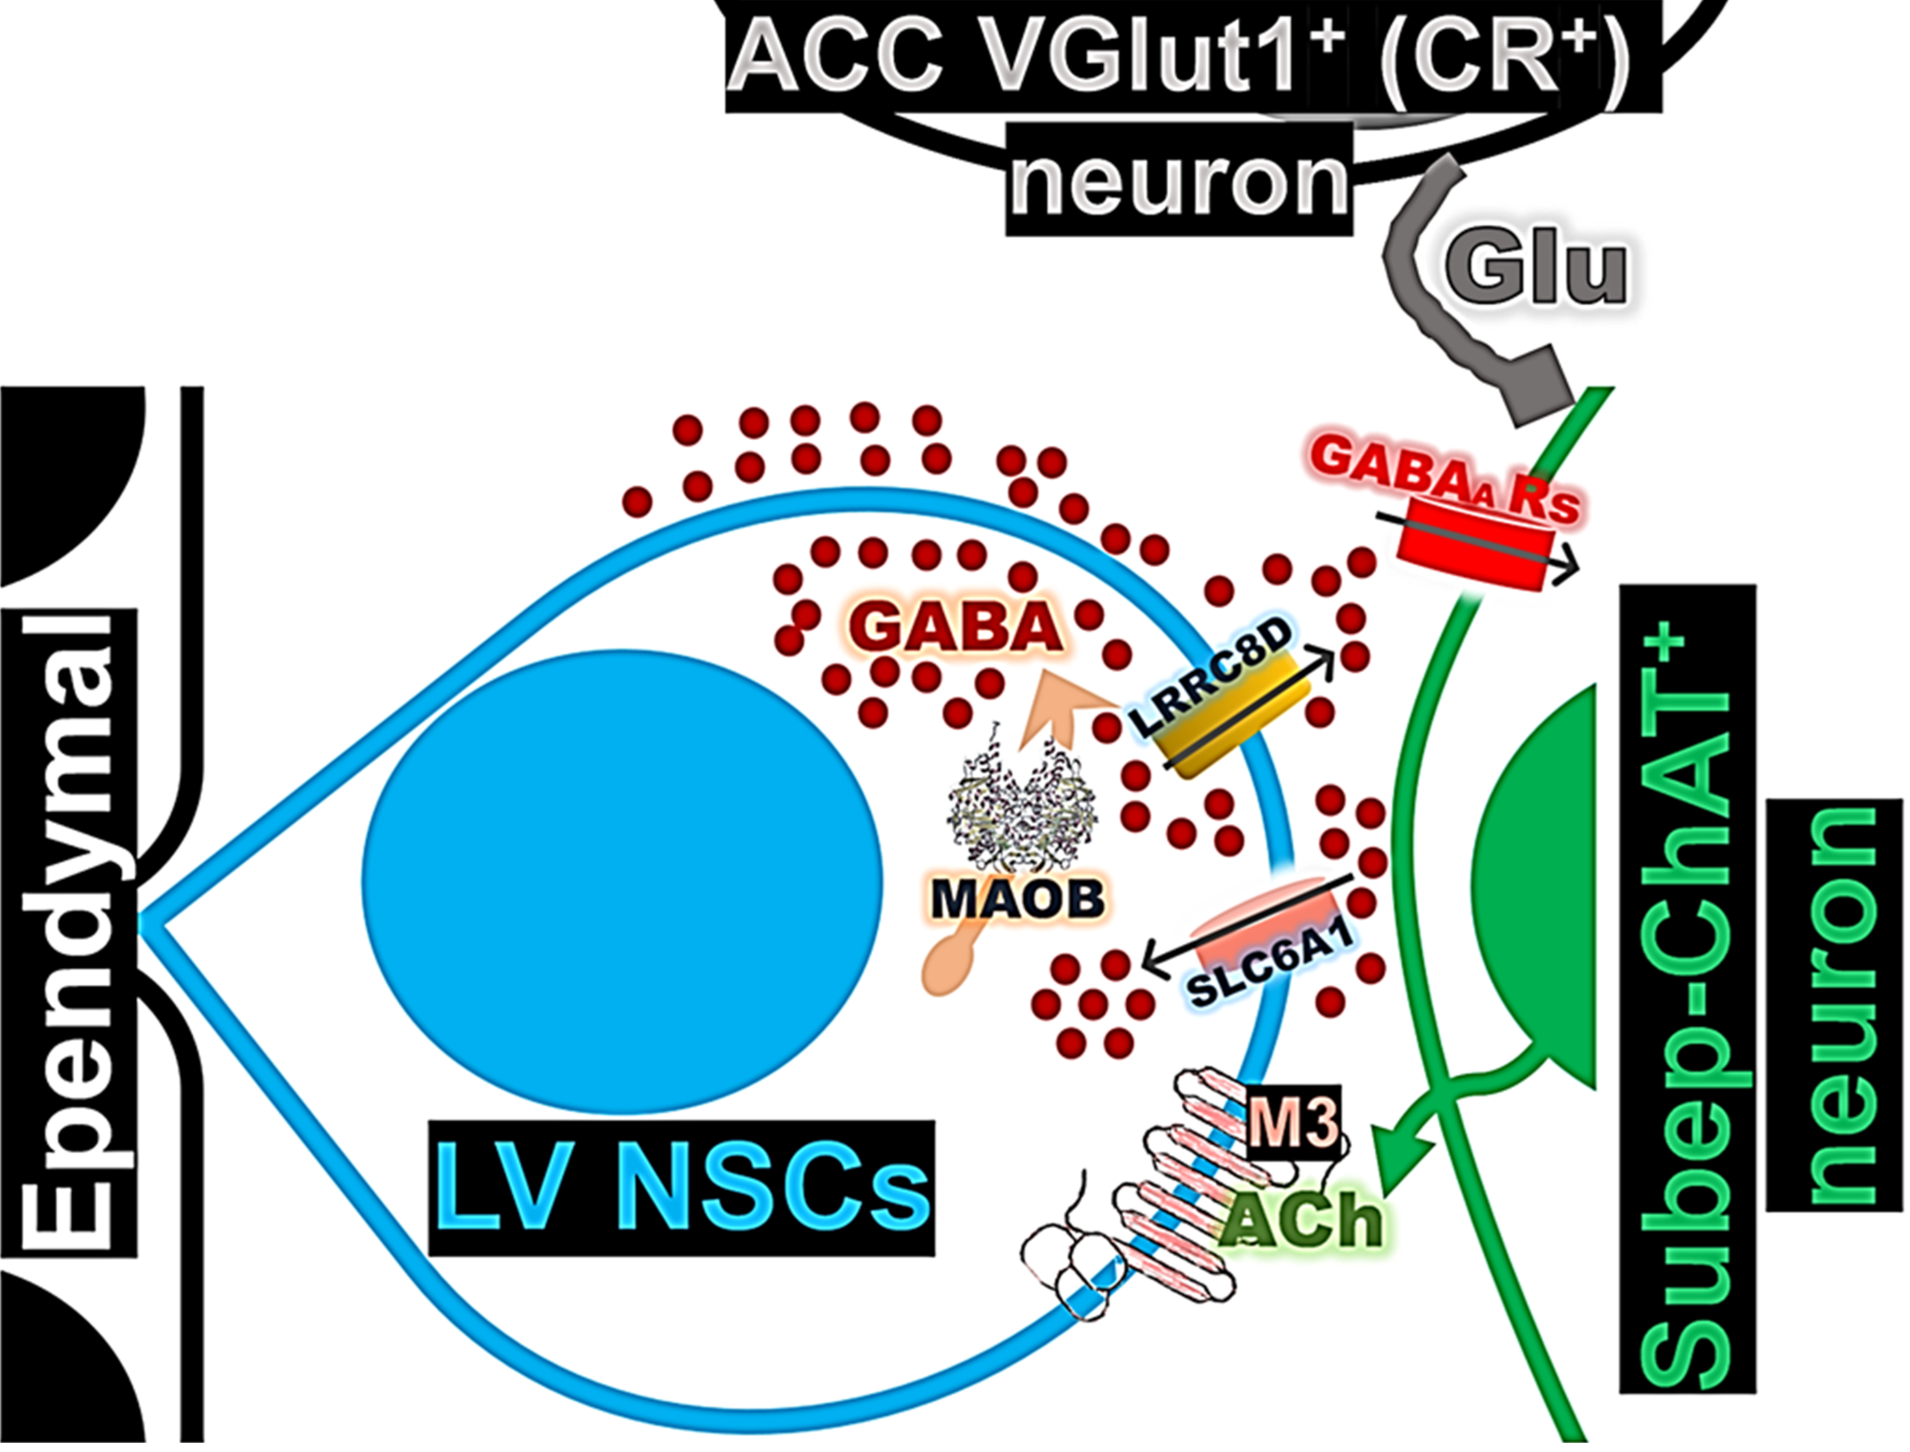
+ circuit on LV NSC function, our study highlights the importance of GABAergic signaling in maintaining the balance between neural circuit activity and stem cell proliferation in the ventral SVZ. Our results show a potential role of GABAergic signaling from NSCs as a negative feedback signal to regulate circuit activation stem cell dynamics within the ventral SVZ (
Figure 8).
Figure 1.
LV NSCs express GABA in the ventral subventricular zone, surrounding subep-ChAT⁺ neurons. A. Schematic representation of the cellular composition and organization of the ventral LV-SVZ, highlighting ependymal cells, LV NSCs, transit-amplifying cells, and LV NSCs. B. Immunofluorescence staining for GABA (gray), GFAP (green), and γ-tubulin (purple) in the ventral V-SVZ of P40 C57BL/6J mouse brain coronal sections. Yellow arrows indicate GABA⁺-GFAP⁺-γ-tubulin⁺ NSCs in the ventral V-SVZ, while purple arrows indicate apical γ-tubulin⁺ NSC endings in the ventral SVZ. Scale bar = 10 µm. Images are representative of three mice. C. Immunofluorescence staining for GABA (gray), ChAT (green), and γ-tubulin (purple) in the ventral V-SVZ adjacent to subep-ChAT⁺ neurons of P40 C57BL/6J mouse brain coronal sections. Yellow arrows indicate GABA⁺-γ-tubulin⁺ NSCs in the ventral V-SVZ, while purple arrows indicate apical γ-tubulin⁺ NSC endings in the ventral SVZ. Scale bar = 10 µm. Images are representative of three mice. D. Immunofluorescence staining for GABA (gray), ChAT (green), and GFAP (purple) in SVZ whole-mount preparations of C57BL/6J (P35) mice. Yellow arrows indicate GABA⁺-GFAP⁺ cells in the ventral V-SVZ surrounding subep-ChAT⁺ neurons. Scale bar = 10 µm. Images are representative of three mice.
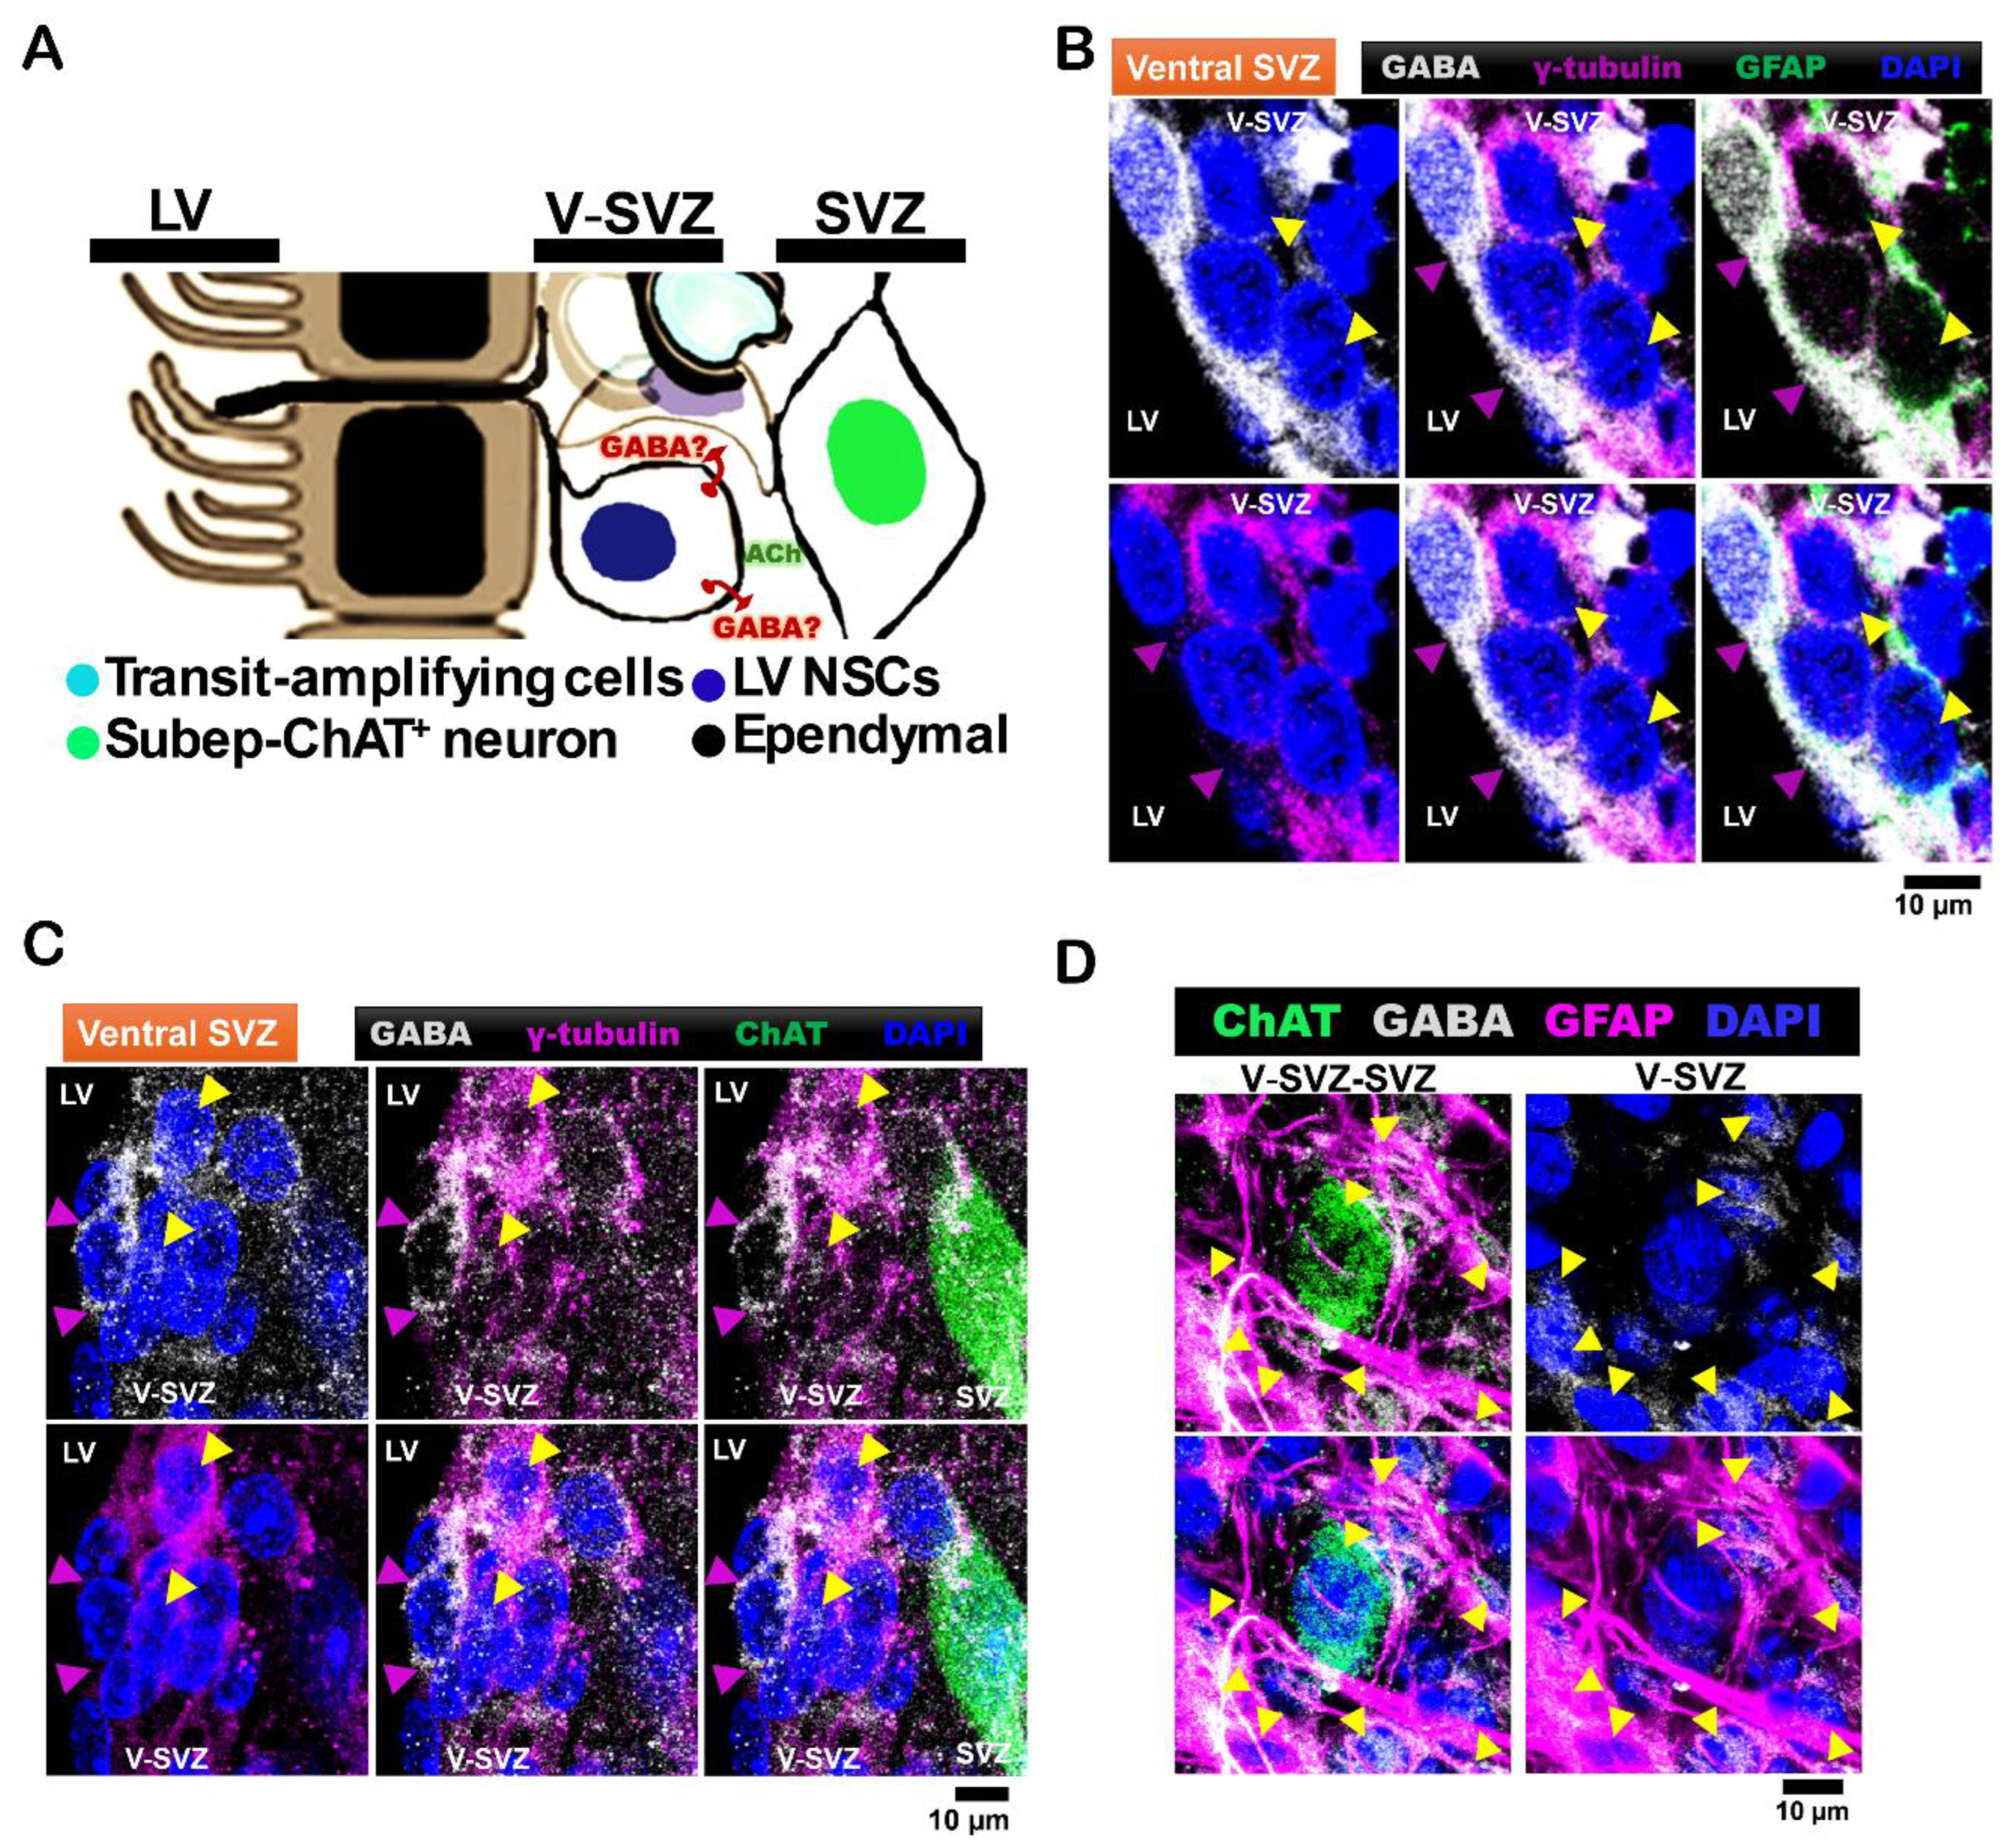
Figure 2.
Modulation of LV NSCs via ACC-Subep-ChAT+ Circuit In Vivo and Carbachol Treatment In Vitro Alters GABA Activity Regulation. A. Experimental design (upper) and schematic representation (lower) of in vivo chemogenetic activation for 10 hours using the pAAV-hSyn-DIO-hM3D(Gαq)-mCherry virus injected into the ACC. B. Immunofluorescence staining for GABA (gray), ChAT (green), and Mash1 (purple) in contralateral SVZ wholemounts (control, no chemogenetic activation of the ACC-subep-ChAT⁺ circuit) and ipsilateral SVZ wholemounts following chemogenetic circuit activation as described in (A). Yellow arrows indicate GABA⁺-Mash1⁺ NSCs, while red arrows indicate NSCs that are only GABA⁺. Scale bar = 10 μm. C. Quantification of GABA⁺-Mash1⁺ NSCs relative to GABA⁺ NSCs per subep-ChAT⁺ neuron in contralateral and ipsilateral SVZ wholemounts from (B). **P = 0.0020, t4 = 7.187, paired t-test. N = 5 CR-Cre mice. Each data point corresponds to the calculated mean percentage of GABA⁺-Mash1⁺ NSCs as a subset of the total GABA⁺ NSC population within a specified ROI. These ROIs were carefully delineated within the V-SVZ layer in proximity to subep-ChAT⁺ neurons (averaged from four subep-ChAT⁺ neurons per mouse). D. Quantification of GABA protein intensity relative to GABA⁺ NSCs per subep-ChAT⁺ neuron in SVZ wholemounts from (B). *P = 0.0158, t4 = 4.023, paired t-test. N = 5 CR-Cre mice. Each data point in the analysis represents the mean percentage of GABA protein intensity measured specifically within GABA⁺ NSCs located in a defined ROI. These ROIs were meticulously selected within the V-SVZ layer, focusing on areas immediately surrounding subep-ChAT⁺ neurons (averaged from four subep-ChAT⁺ neurons per mouse). E. Immunofluorescence staining for GABA (gray) and EGFR (green) in control or carbachol-treated (15 μM) SVZ NSC cultures collected after 24 hours in proliferation media. Scale bar = 50 μm. F. Quantification of GABA protein intensity relative to EGFR⁺ NSCs in control and carbachol-treated SVZ NSC cultures. *P = 0.0153, t₃ = 5.015, paired t-test. N = 4 independent SVZ NSC cultures per group. Each data point represents the average percentage of GABA protein intensity specifically within EGFR⁺ NSCs.
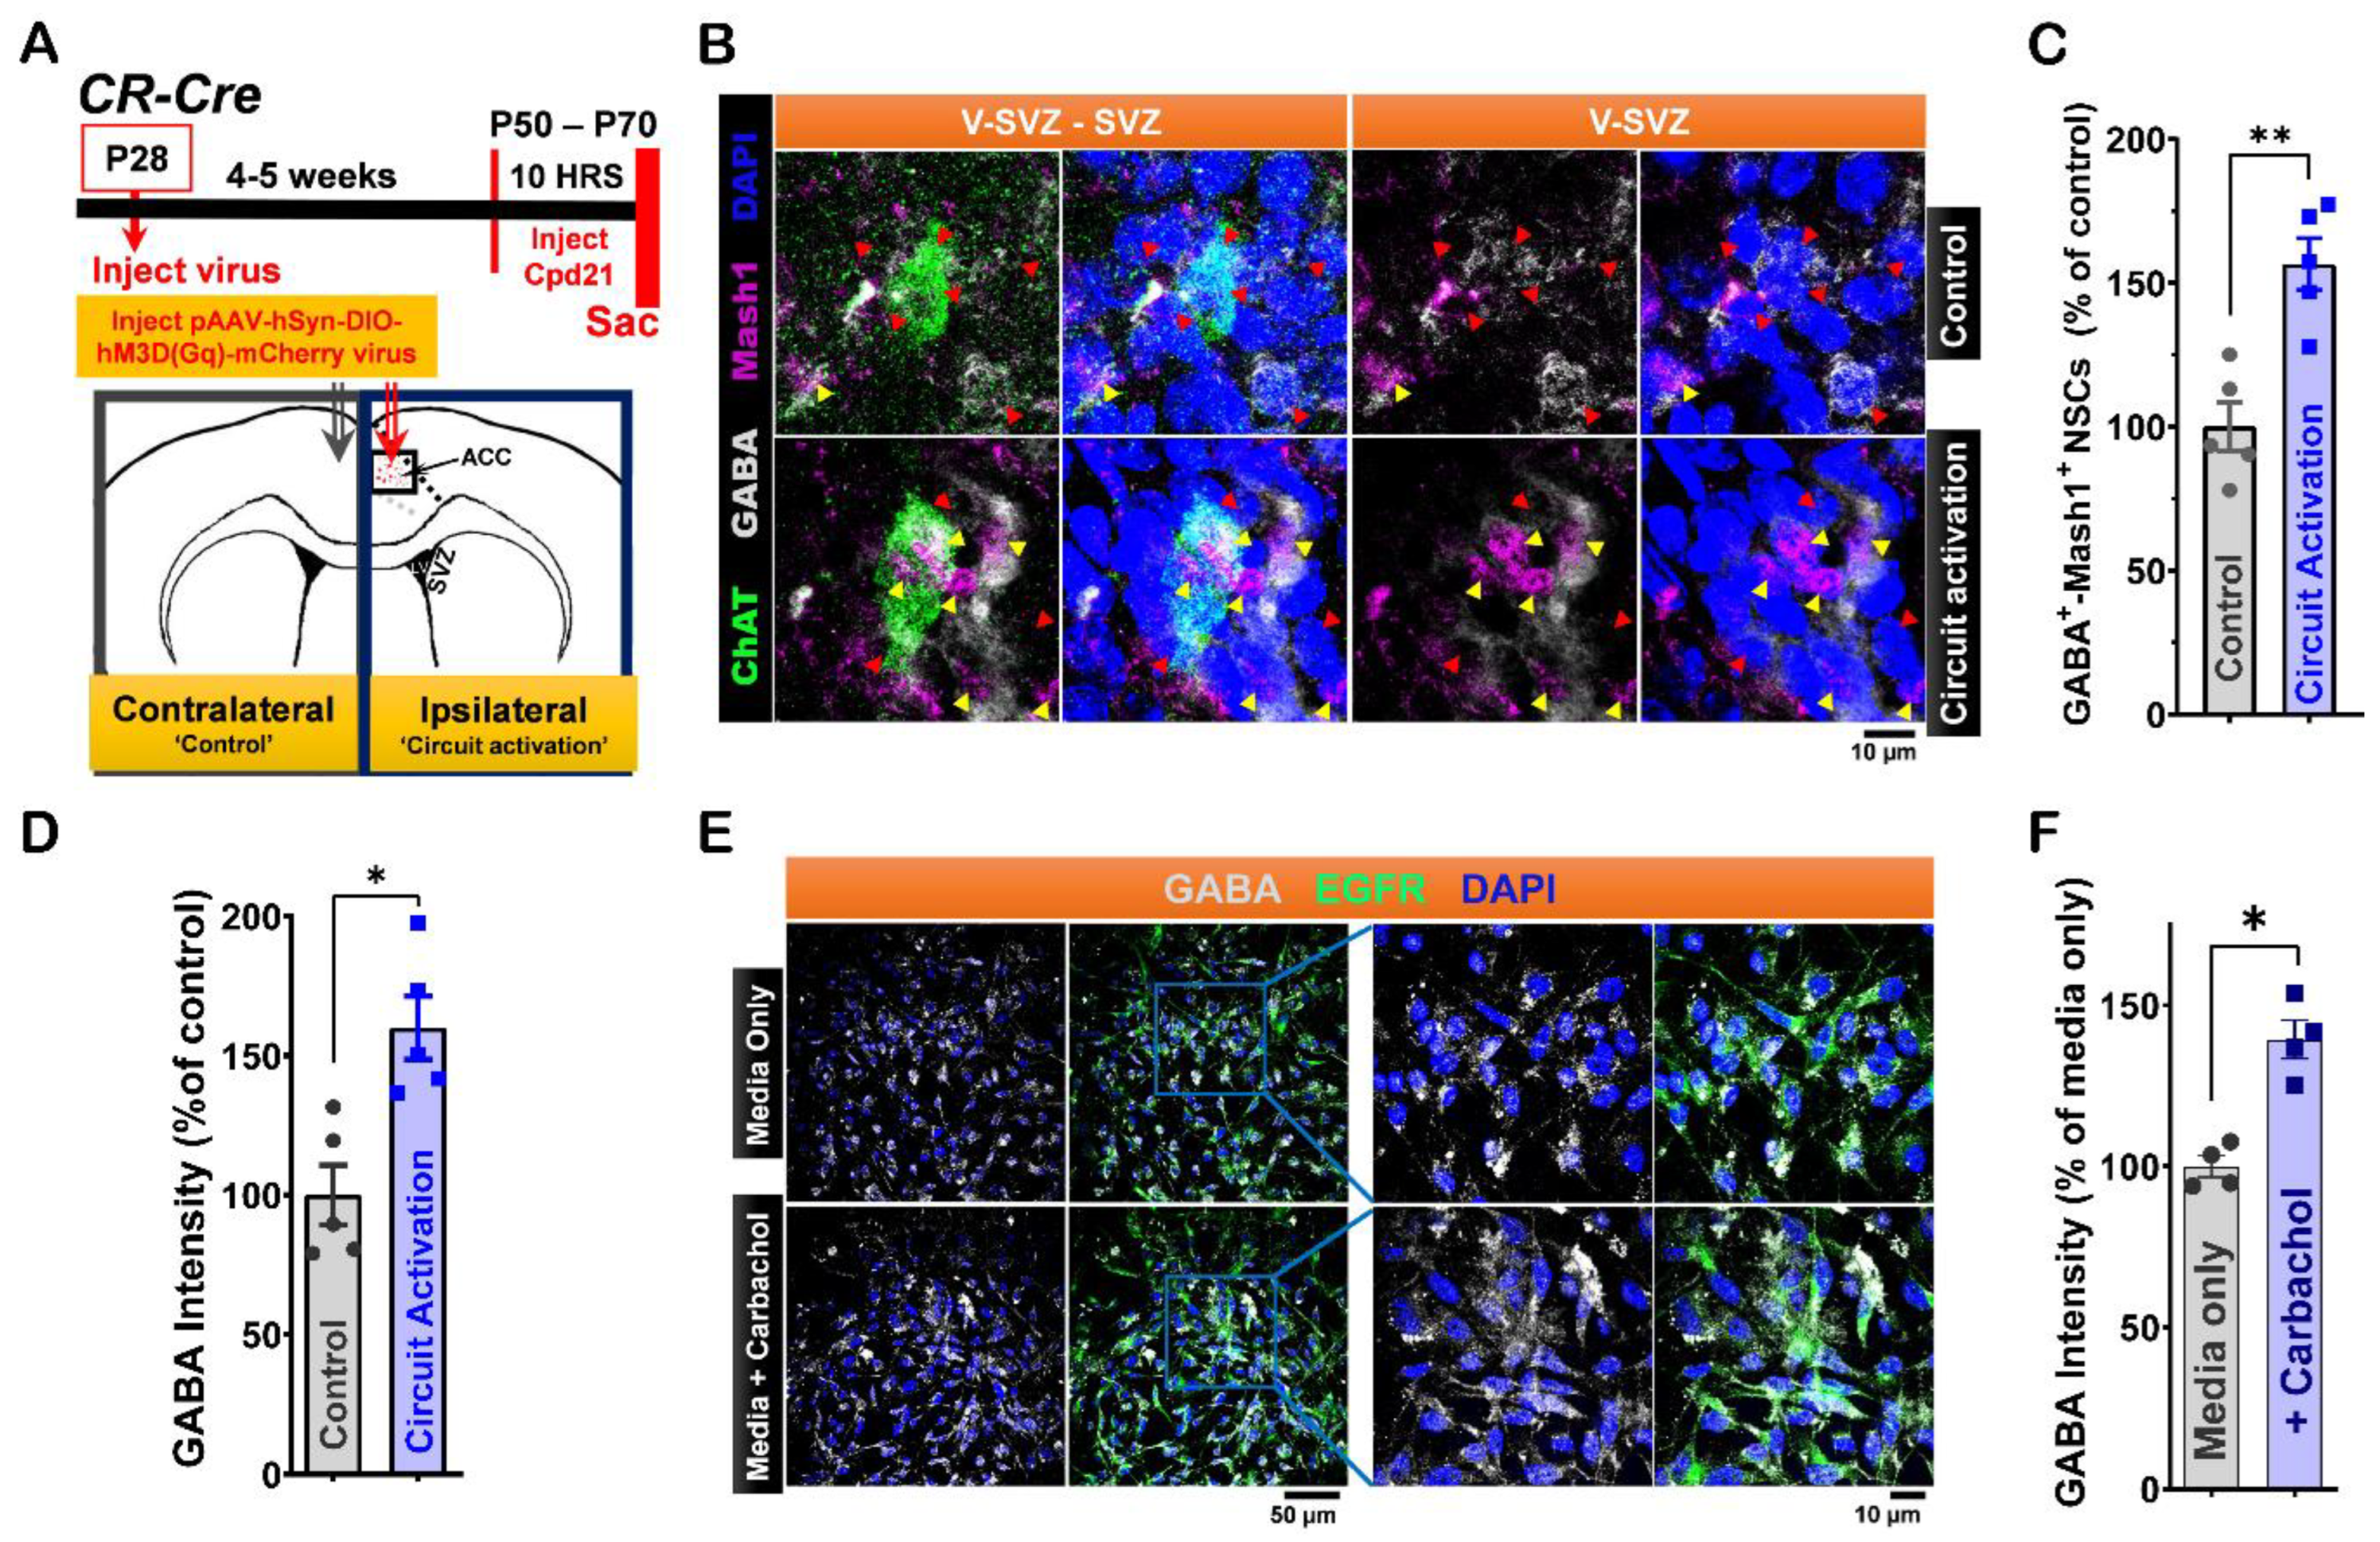
Figure 3.
Expression of monoamine oxidase B (MAOB) in LV NSCs and its modulation by in vivo ACC-subep-ChAT+ circuit activity. A. Immunofluorescence staining for MAOB (gray), GFAP (green), and γ-tubulin (purple) in coronal brain sections from P40 C57BL/6J mice, specifically in the ventral V-SVZ. Yellow arrows indicate MAOB+-GFAP+-γ-tubulin+ NSCs in the ventral V-SVZ, while purple arrow indicates apical γ-tubulin⁺ NSC endings in the ventral SVZ. Scale bar = 10 μm. Images are representative of three mice. B. Immunofluorescence staining for MAOB (gray), ChAT (green), and γ-tubulin (purple) in coronal brain sections of P40 C57BL/6J mice, showing the ventral V-SVZ adjacent to subep-ChAT+ neurons. Yellow arrows indicate MAOB+-γ-tubulin+ NSCs in the ventral V-SVZ, while purple arrow indicates apical γ-tubulin⁺ NSC endings in the ventral SVZ. Scale bar = 10 μm. Images are representative of three mice. C. Immunofluorescence staining for MAOB (gray), GFAP (green), and GABA (purple) in SVZ wholemounts of P35 C57BL/6J mice. Yellow arrows indicate GABA+-GFAP+ cells in the ventral V-SVZ surrounding subep-ChAT+ neurons. Scale bar = 10 μm. Images are representative of three mice. D. Immunofluorescence staining for MAOB (gray), ChAT (green), and GFAP (purple) in SVZ wholemounts of P35 C57BL/6J mice. Yellow arrows indicate MAOB+-GFAP+ cells in the ventral V-SVZ surrounding subep-ChAT+ neurons. Scale bar = 10 μm. Images are representative of three mice. E. Immunofluorescence staining for MAOB (gray), ChAT (green), and Mash1 (purple) in contralateral and ipsilateral SVZ wholemounts of P35 C57BL/6J mice. The contralateral SVZ serves as a control, with no chemogenetic activation of the ACC-subep-ChAT+ circuit, and the ipsilateral SVZ is shown following chemogenetic activation of the ACC-subep-ChAT+ circuit, as described in Fig. 2A. Yellow arrows indicate MAOB+-Mash1+ NSCs, while red arrows point to MAOB+ NSCs lacking Mash1 expression. Scale bar = 10 μm. F. Quantification of MAOB+-Mash1+ NSCs relative to all MAOB+ NSCs per subep-ChAT+ neuron in contralateral and ipsilateral SVZ wholemounts from (E). **P = 0.0030, t4 = 6.447, paired t-test. N = 5 CR-Cre mice. Each data point corresponds to the calculated mean percentage of MAOB⁺-Mash1⁺ NSCs as a subset of the total MAOB⁺ NSC population within a specified ROI. These ROIs were carefully delineated within the V-SVZ layer in proximity to subep-ChAT⁺ neurons (average from four subep-ChAT+ neurons per mouse). G. Quantification of MAOB protein intensity relative to MAOB+ NSCs, measured per subep-ChAT+ neuron in contralateral and ipsilateral SVZ wholemounts from (E). *P = 0.0426, t4 = 2.935, paired t-test. N = 5 CR-Cre mice. Each data point in the analysis represents the mean percentage of MAOB protein intensity measured specifically within MAOB⁺ NSCs located in a defined ROI. These ROIs were meticulously selected within the V-SVZ layer, focusing on areas immediately surrounding subep-ChAT⁺ neurons (average from four subep-ChAT+ neurons per mouse).
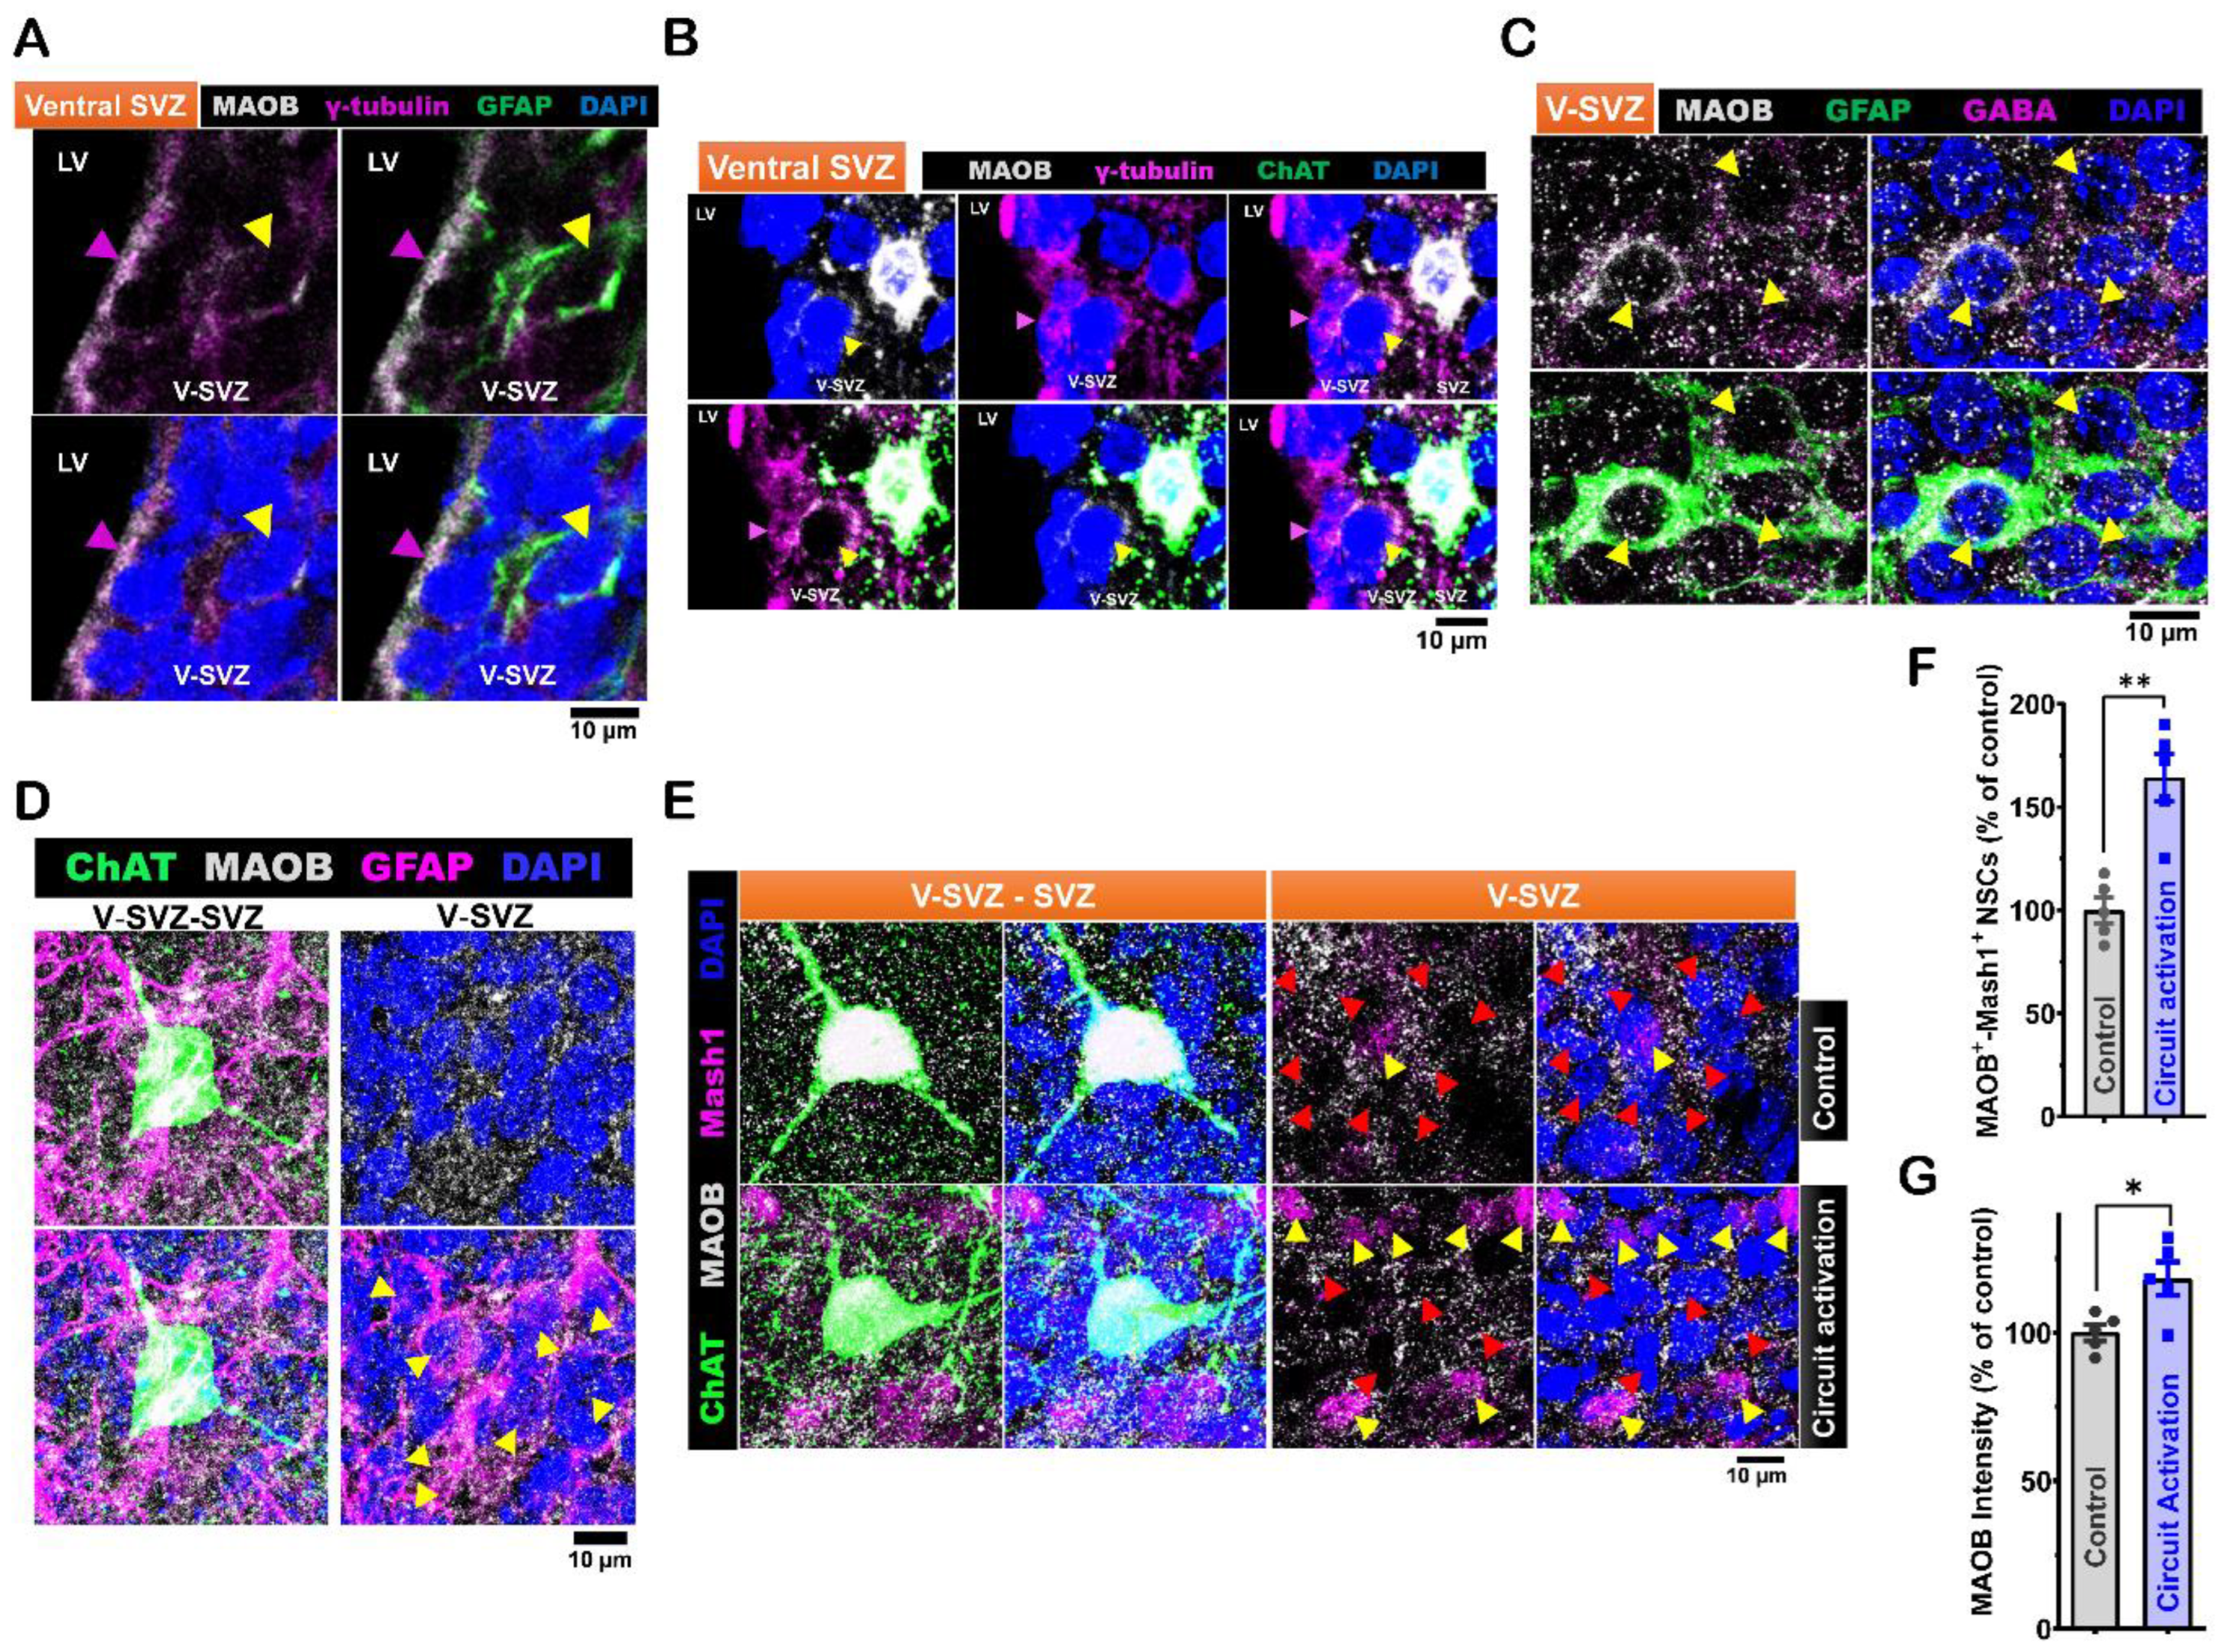
Figure 4.
LRRC8D expression in ventral LV NSCs modulates their activity in response to ACC-subep-ChAT⁺ circuit signaling.
A. Immunofluorescence staining for LRRC8D (gray), GFAP (green), and γ-tubulin (purple) in the ventral V-SVZ of P40 C57BL/6J mouse brain sections. Yellow arrows indicate LRRC8D⁺-GFAP⁺-γ-tubulin⁺ NSCs in the ventral V-SVZ. Purple arrows indicate apical endings of γ-tubulin⁺ NSCs in the ependymal layer. Scale bar = 10 μm. Images are representative of three mice.
B. Immunofluorescence staining for LRRC8D (gray), GFAP (green), and γ-tubulin (purple) in coronal brain sections of P40 C57BL/6J mice. Yellow arrows indicate LRRC8D⁺-GFAP⁺-γ-tubulin⁺ NSCs in the ventral V-SVZ, while purple arrows denote apical endings of γ-tubulin⁺ NSCs in the ventral SVZ. Scale bar = 10 μm. Images are representative of three mice.
C. Immunofluorescence staining for LRRC8D (gray), ChAT (green), and GFAP (purple) in SVZ wholemounts of P35 C57BL/6J mice. Yellow arrows indicate LRRC8D⁺-GFAP⁺ NSCs in the ventral V-SVZ surrounding subep-ChAT⁺ neurons. Scale bar = 10 μm. Images are representative of three mice.
D. Immunofluorescence staining for LRRC8D (gray), ChAT (green), and Mash1 (purple) in contralateral and ipsilateral SVZ wholemounts. Contralateral wholemounts serve as controls without chemogenetic activation of the ACC-subep-ChAT⁺ circuit, whereas ipsilateral wholemounts were analyzed following circuit activation, as described in
Figure 2A. Yellow arrows indicate LRRC8D⁺-Mash1⁺ NSCs, while red arrows denote LRRC8D⁺ NSCs lacking Mash1 expression. Scale bar = 10 μm.
E. Quantification of LRRC8D⁺-Mash1⁺ NSCs relative to all LRRC8D⁺ NSCs per subep-ChAT⁺ neuron in contralateral and ipsilateral SVZ wholemounts from panel (D). *P = 0.0376, t₄ = 3.062, paired t-test. N = 5 CR-Cre mice. Each data point corresponds to the calculated mean percentage of LRRC8D⁺-Mash1⁺ NSCs as a subset of the total LRRC8D⁺ NSC population within a specified ROI. These ROIs were carefully delineated within the V-SVZ layer in proximity to subep-ChAT⁺ neurons (average from four subep-ChAT⁺ neurons per mouse).
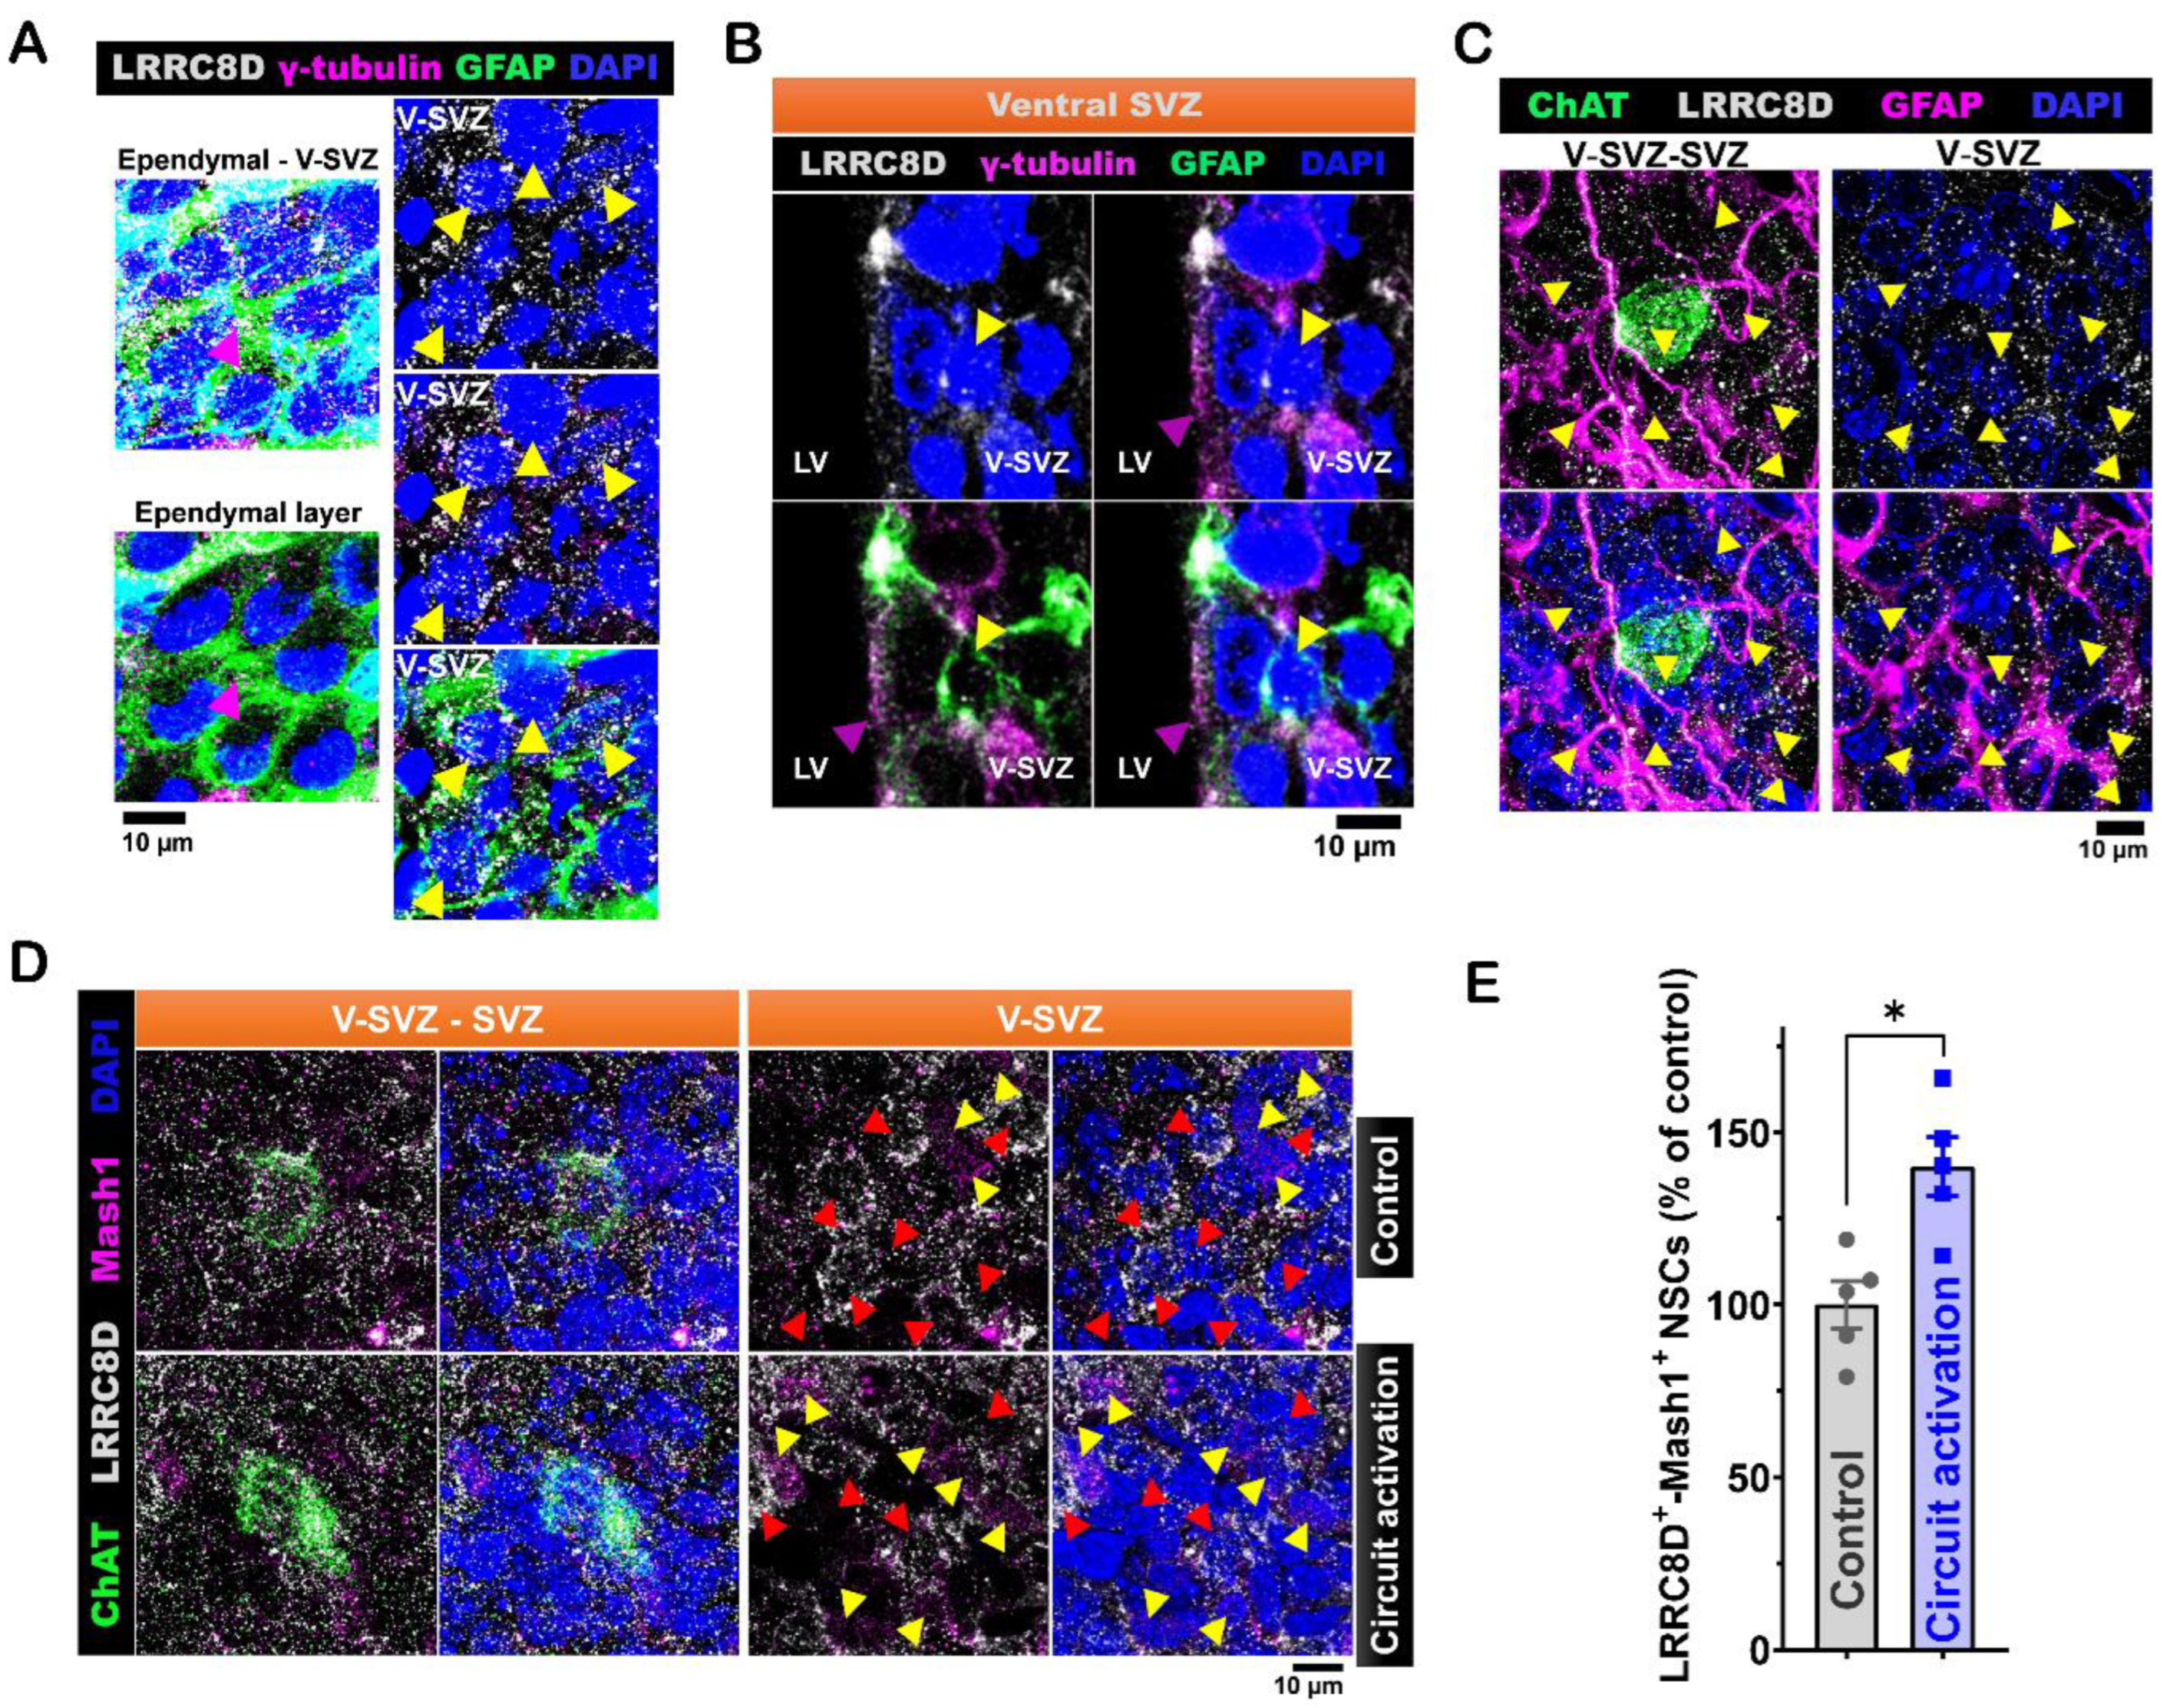
Figure 5.
LRRC8D protein modulation of ventral LV NSCs proliferation activity induced by in vivo ACC-subep-ChAT+ circuitry. A. Schematic representation (lower) and experimental design (upper) of in vivo chemogenetic activation for 10 hours following injection of the pAAV-hSyn-DIO-hM3D(Gq)-mCherry virus into the ACC region and cannula implantation for DCPIB infusion into the LV region of P28 CR-Cre mice. B. Immunofluorescence staining for LRRC8D (gray), ChAT (green), and Mash1 (purple) in contralateral SVZ wholemounts (control) and ipsilateral SVZ wholemounts after chemogenetic activation of the ACC-subep-ChAT⁺ circuit with DCPIB infusion, as illustrated in panel (F). Yellow arrows indicate LRRC8D⁺-Mash1⁺ NSCs, and red arrows denote LRRC8D⁺ NSCs lacking Mash1 expression. Scale bar = 10 μm. C. Quantification of LRRC8D⁺-Mash1⁺ NSCs relative to all LRRC8D⁺ NSCs per subep-ChAT⁺ neuron in contralateral and ipsilateral SVZ wholemounts from panel (G). *P = 0.0467, t₄ = 2.843, paired t-test. N = 5 CR-Cre mice. Each data point corresponds to the calculated mean percentage of LRRC8D⁺-Mash1⁺ NSCs as a subset of the total LRRC8D⁺ NSC population within a specified ROI. These ROIs were carefully delineated within the V-SVZ layer in proximity to subep-ChAT⁺ neurons (average from four subep-ChAT⁺ neurons per mouse).
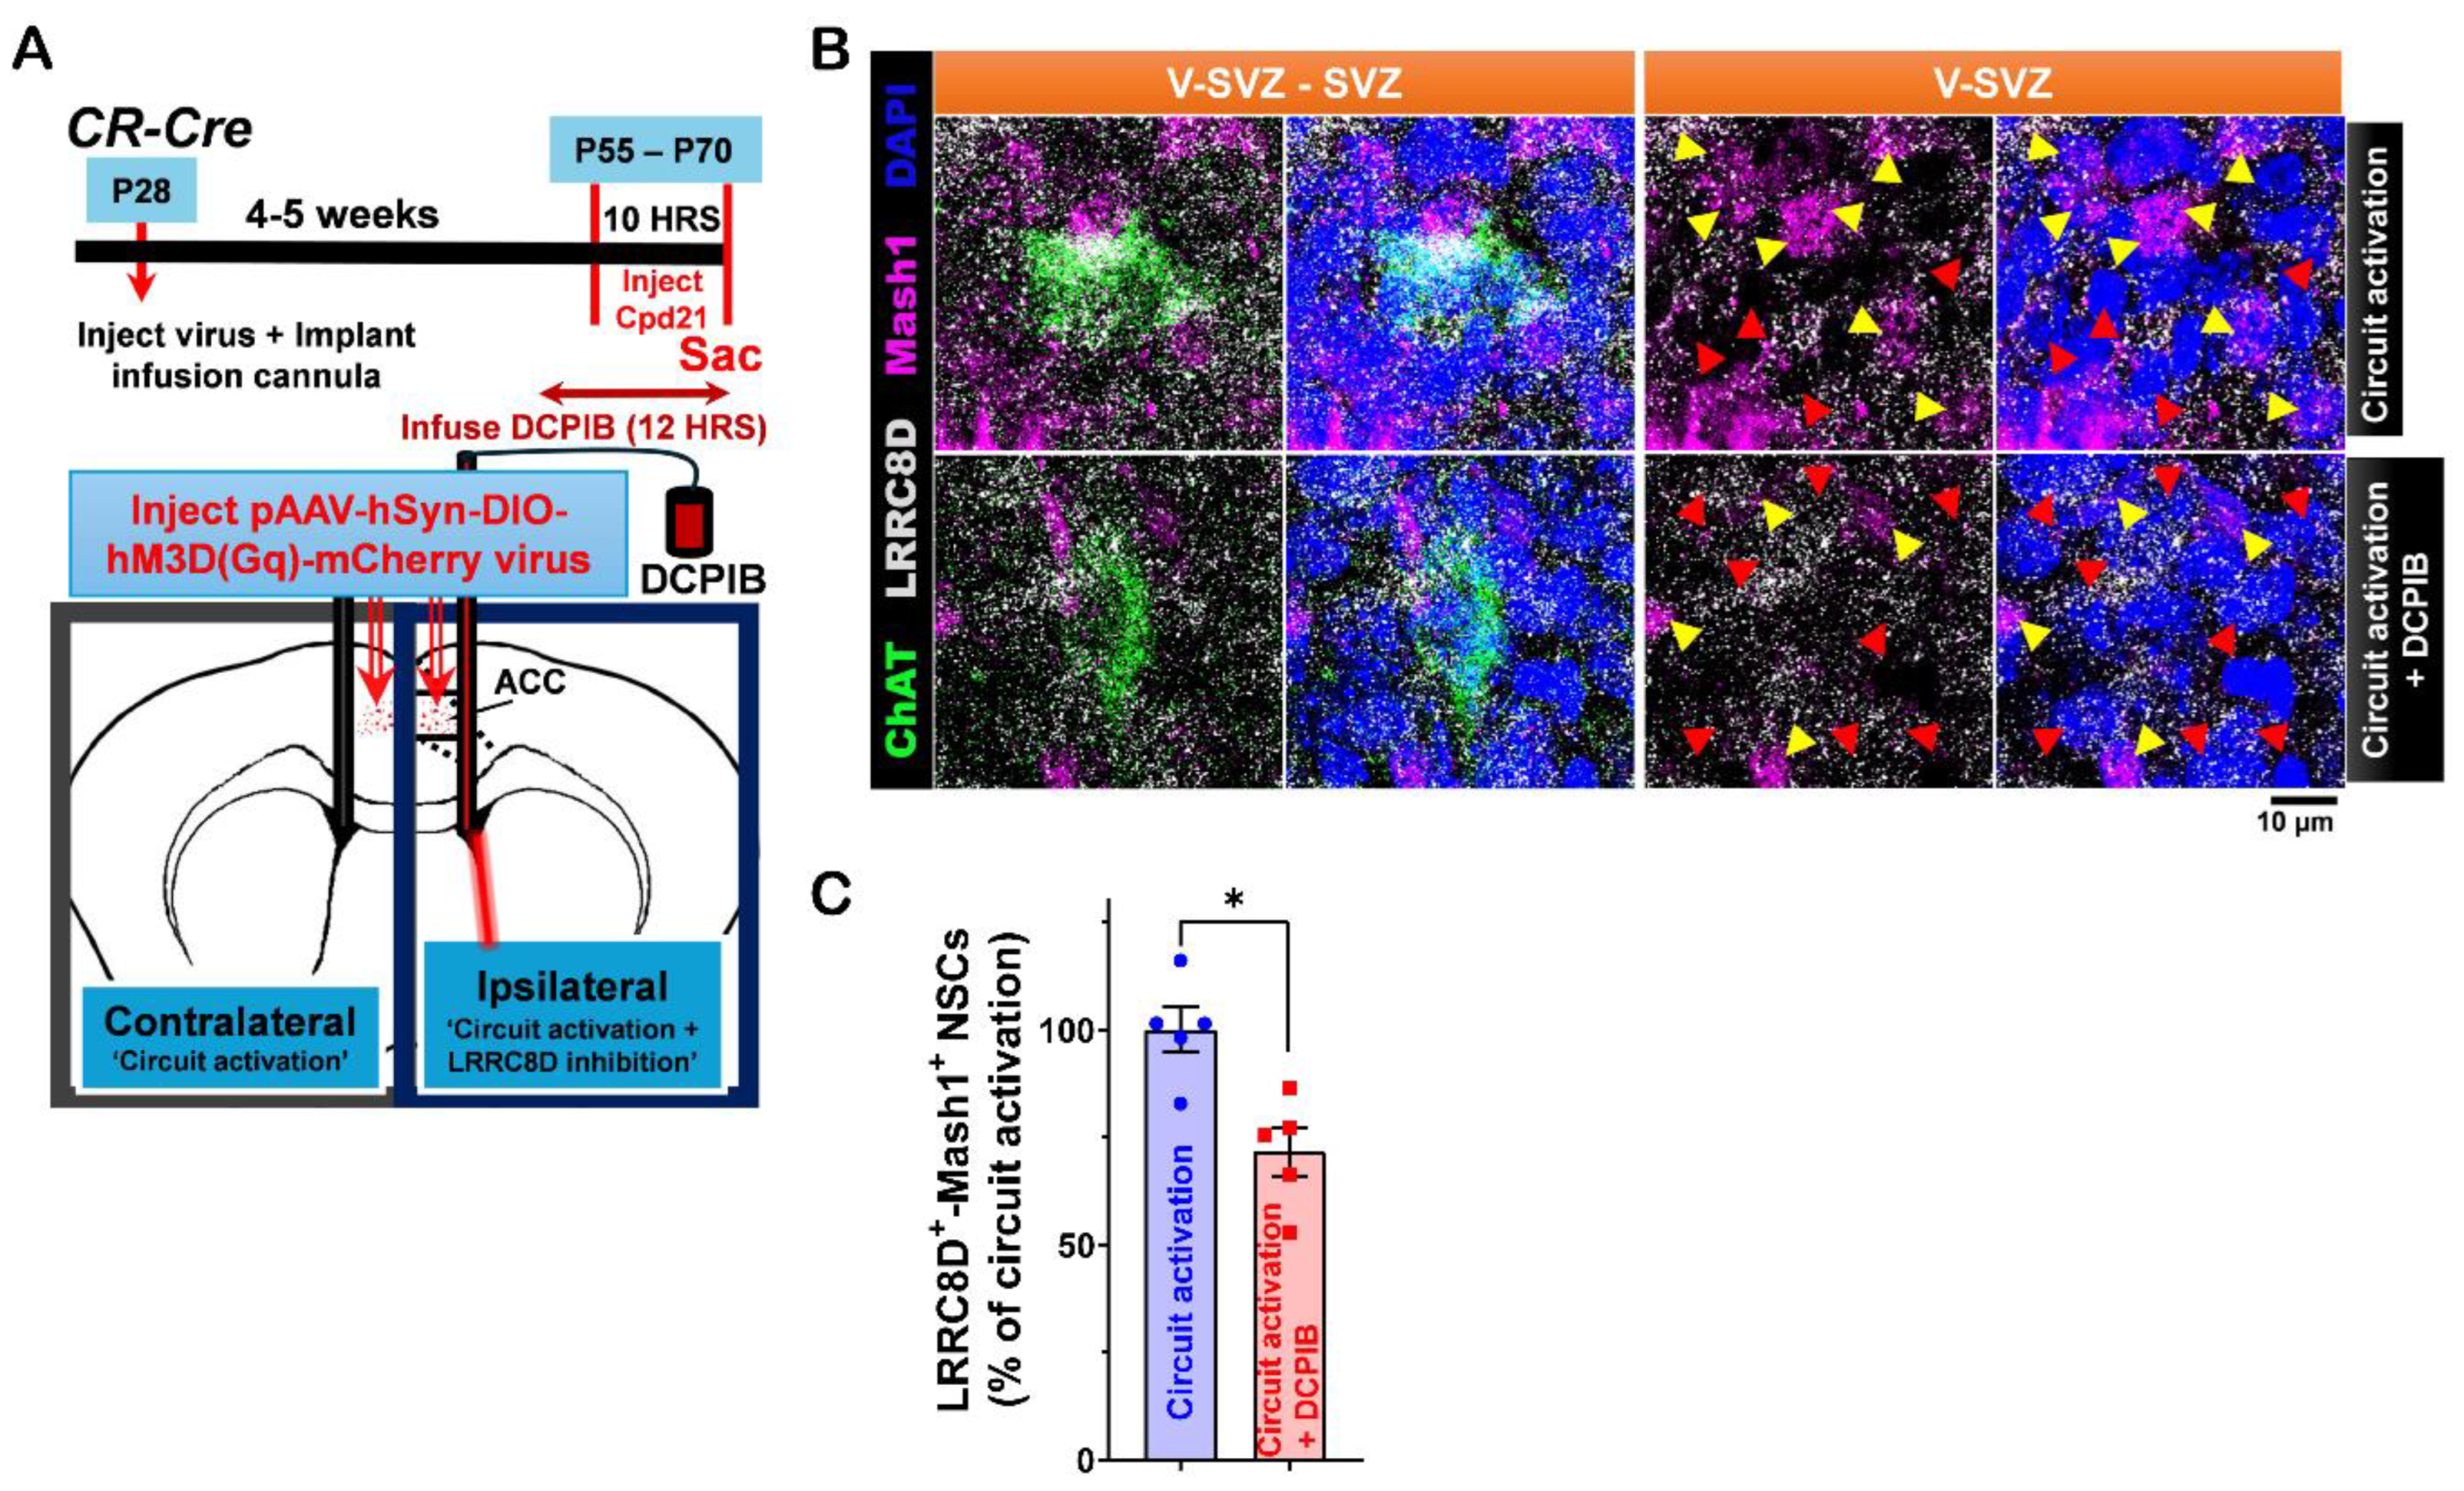
Figure 6.
Ventral LV NSCs express the SLC6A1 protein, and its activity is regulated by
in vitro carbachol treatment.
A. Immunofluorescence staining for SLC6A1 (gray), GFAP (green), and γ-tubulin (purple) in the ventral V-SVZ of P40 C57BL/6J mouse brain coronal sections. Yellow arrows indicate SLC6A1
+-GFAP
+-γ-tubulin+ NSCs in the ventral V-SVZ. Purple arrows indicate γ-tubulin
+ NSCs in the ventral SVZ. Scale bar = 10 μm. Images are representative of three mice.
B. Immunofluorescence staining for SLC6A1 (gray), ChAT (green), and γ-tubulin (purple) in the ventral V-SVZ adjacent to subep-ChAT+ neurons of P45 C57BL/6J mouse brain coronal sections. Yellow arrows indicate SLC6A1
+-γ-tubulin
+ NSCs in the ventral V-SVZ. Purple arrows indicate γ-tubulin+ NSCs in the ventral SVZ. Scale bar = 10 μm. Images are representative of three mice.
C. Immunofluorescence staining for SLC6A1 (gray), ChAT (green), and GFAP (purple) in SVZ wholemounts from C57BL/6J (P35) mice. Yellow arrows indicate SLC6A1+-GFAP+ cells in the ventral V-SVZ surrounding subep-ChAT+ neurons. Scale bar = 10 μm. Images are representative of three mice.
D. Immunofluorescence staining for SLC6A1 (gray), ChAT (green), and Mash1 (purple) in contralateral SVZ whole mounts without chemogenetic activation of the ACC-subep-ChAT+ circuit (control) and ipsilateral SVZ whole mounts after circuit activation (per
Figure 2A). Yellow arrows indicate SLC6A1+-Mash1+ NSCs, while red arrows indicate NSCs expressing only SLC6A1. Scale bar = 10 μm.
E. Quantification of SLC6A1
+-Mash1
+ NSCs/SLC6A1+ NSCs per subep-ChAT
+ neuron in contralateral and ipsilateral SVZ whole mounts from panel D. *P = 0.0216, t₄ = 3.657, paired t-test. N = 5 CR-Cre mice. Each data point corresponds to the calculated mean percentage of SLC6A1⁺-Mash1⁺ NSCs as a subset of the total SLC6A1⁺ NSC population within a specified ROI. These ROIs were carefully delineated within the V-SVZ layer in proximity to subep-ChAT⁺ neurons (averaged from four subep-ChAT+ neurons per mouse).
F. Quantification of SLC6A1 protein intensity/SLC6A1
+ NSCs per subep-ChAT
+ neuron in contralateral and ipsilateral SVZ wholemounts from panel B. P = ns, t4 = 2.356, paired t-test. N = 5 CR-Cre mice. Each data point in the analysis represents the mean percentage of SLC6A1 protein intensity measured specifically within SLC6A1⁺ NSCs located in a defined ROI. These ROIs were meticulously selected within the V-SVZ layer, focusing on areas immediately surrounding subep-ChAT⁺ neurons (averaged from four subep-ChAT+ neurons per mouse).
G. Immunofluorescence staining for SLC6A1 (gray) and EGFR (green) in SVZ NSC cultures treated with control media or carbachol (15 μM) for 24 hours in proliferation media. Scale bar, 50 μm.
H. Quantification of SLC6A1 protein intensity/EGFR+ NSCs in control and carbachol-treated SVZ NSC cultures. **P = 0.0061, t₃ = 6.943, paired t-test. N = 4 independent SVZ NSC cultures per group. Each data point represents the average percentage of SLC6A1 protein intensity specifically within EGFR⁺ NSCs.
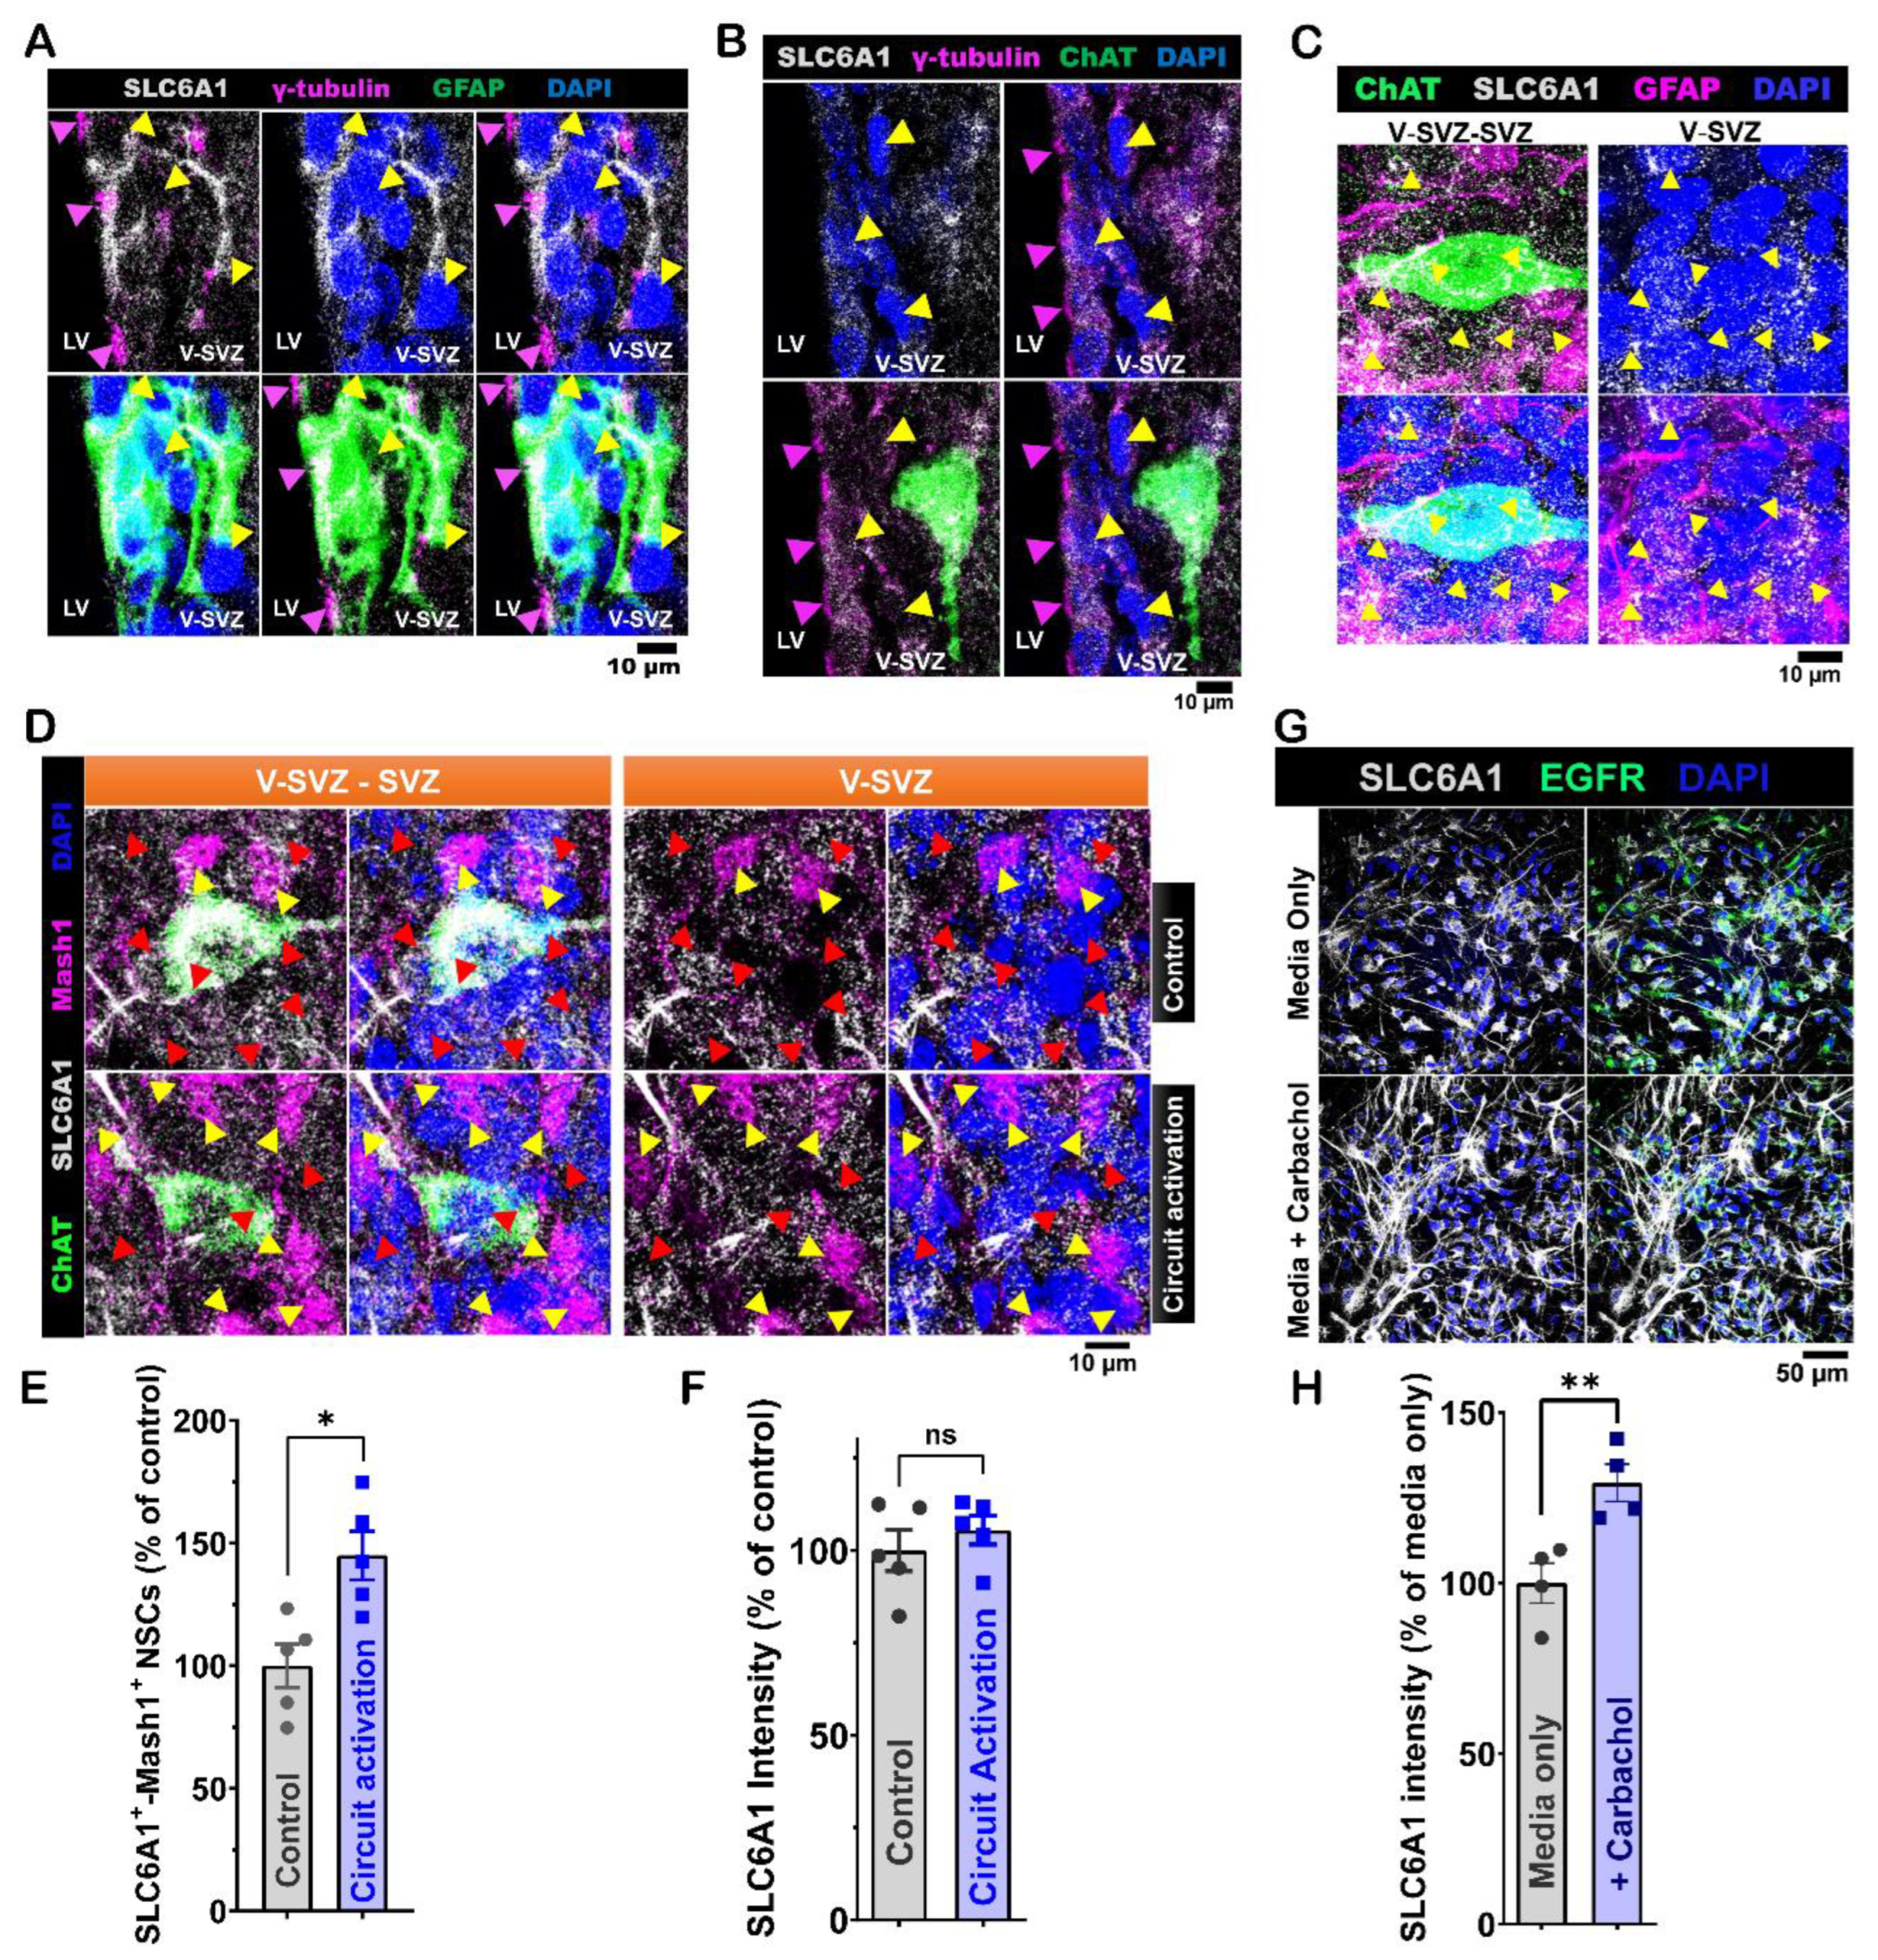
Figure 7.
SLC6A1 protein modulation of ventral LV NSCs proliferation activity induced by in vivo ACC-subep-ChAT+ circuitry and in vitro carbachol treatment. A. Schematic of the experimental design (upper) and a diagrammatic representation (lower) of in vivo chemogenetic activation. The procedure involved a 10-hour activation following the injection of the pAAV-hSyn-DIO-hM3D(Gq)-mCherry virus into the anterior cingulate cortex (ACC) and cannula implantation for CI966 infusion into the lateral ventricle (LV) of P28 CR-Cre mice. B. Immunofluorescence staining for SLC6A1 (gray), ChAT (green), and Mash1 (purple) in contralateral SVZ wholemounts after chemogenetic activation of the ACC-subep-ChAT+ circuit (control) and in ipsilateral SVZ wholemounts following circuit activation with CI966 infusion, as shown in panel A. Yellow arrows indicate SLC6A1+-Mash1+ neural stem cells (NSCs), and red arrows indicate SLC6A1+ NSCs. Scale bar = 10 μm. C. Quantification of SLC6A1+-Mash1+ NSCs relative to total SLC6A1+ NSCs per subep-ChAT+ neuron in contralateral and ipsilateral SVZ wholemounts (panel B). *P = 0.0395, t4 = 2.813, paired t-test. N = 5 CR-Cre mice. Each data point corresponds to the calculated mean percentage of SLC6A1⁺-Mash1⁺ NSCs as a subset of the total SLC6A1⁺ NSC population within a specified ROI. These ROIs were carefully delineated within the V-SVZ layer in proximity to subep-ChAT⁺ neurons (averaged across four subep-ChAT+ neurons per mouse). D. Quantification of SLC6A1 protein intensity relative to SLC6A1+ NSCs per subep-ChAT+ neuron in contralateral and ipsilateral SVZ wholemounts (panel B). *P = 0.0482, t4 = 4.023, paired t-test. N = 5 CR-Cre mice. Each data point in the analysis represents the mean percentage of SLC6A1 protein intensity measured specifically within SLC6A1⁺ NSCs located in a defined ROI. These ROIs were meticulously selected within the V-SVZ layer, focusing on areas immediately surrounding subep-ChAT⁺ neurons (averaged from four subep-ChAT+ neurons per mouse). E. Immunofluorescence staining for SLC6A1 (gray) and EGFR (green) in SVZ NSC cultures treated with carbachol (15 μM) or carbachol (15 μM) + CI966 (1.5 μM) after 24 hours in the proliferation media. Scale bar = 50 μm. F. Quantification of SLC6A1+-EGFR+ NSCs per well in SVZ NSC cultures treated with carbachol or carbachol + CI966. *P = 0.0452, t3 = 3.315, paired t-test. N = 4 independent SVZ NSC cultures per group. Each data point corresponds to the calculated mean percentage of SLC6A1+-EGFR+ NSCs. G. Quantification of SLC6A1 protein intensity per EGFR+ NSCs in carbachol-treated and carbachol + CI966-treated SVZ NSC cultures. *P = 0.0208, t3 = 4.474, paired t-test. N = 4 independent SVZ NSC cultures per group. Each data point represents the average percentage of SLC6A1 protein intensity specifically within EGFR⁺ NSCs.
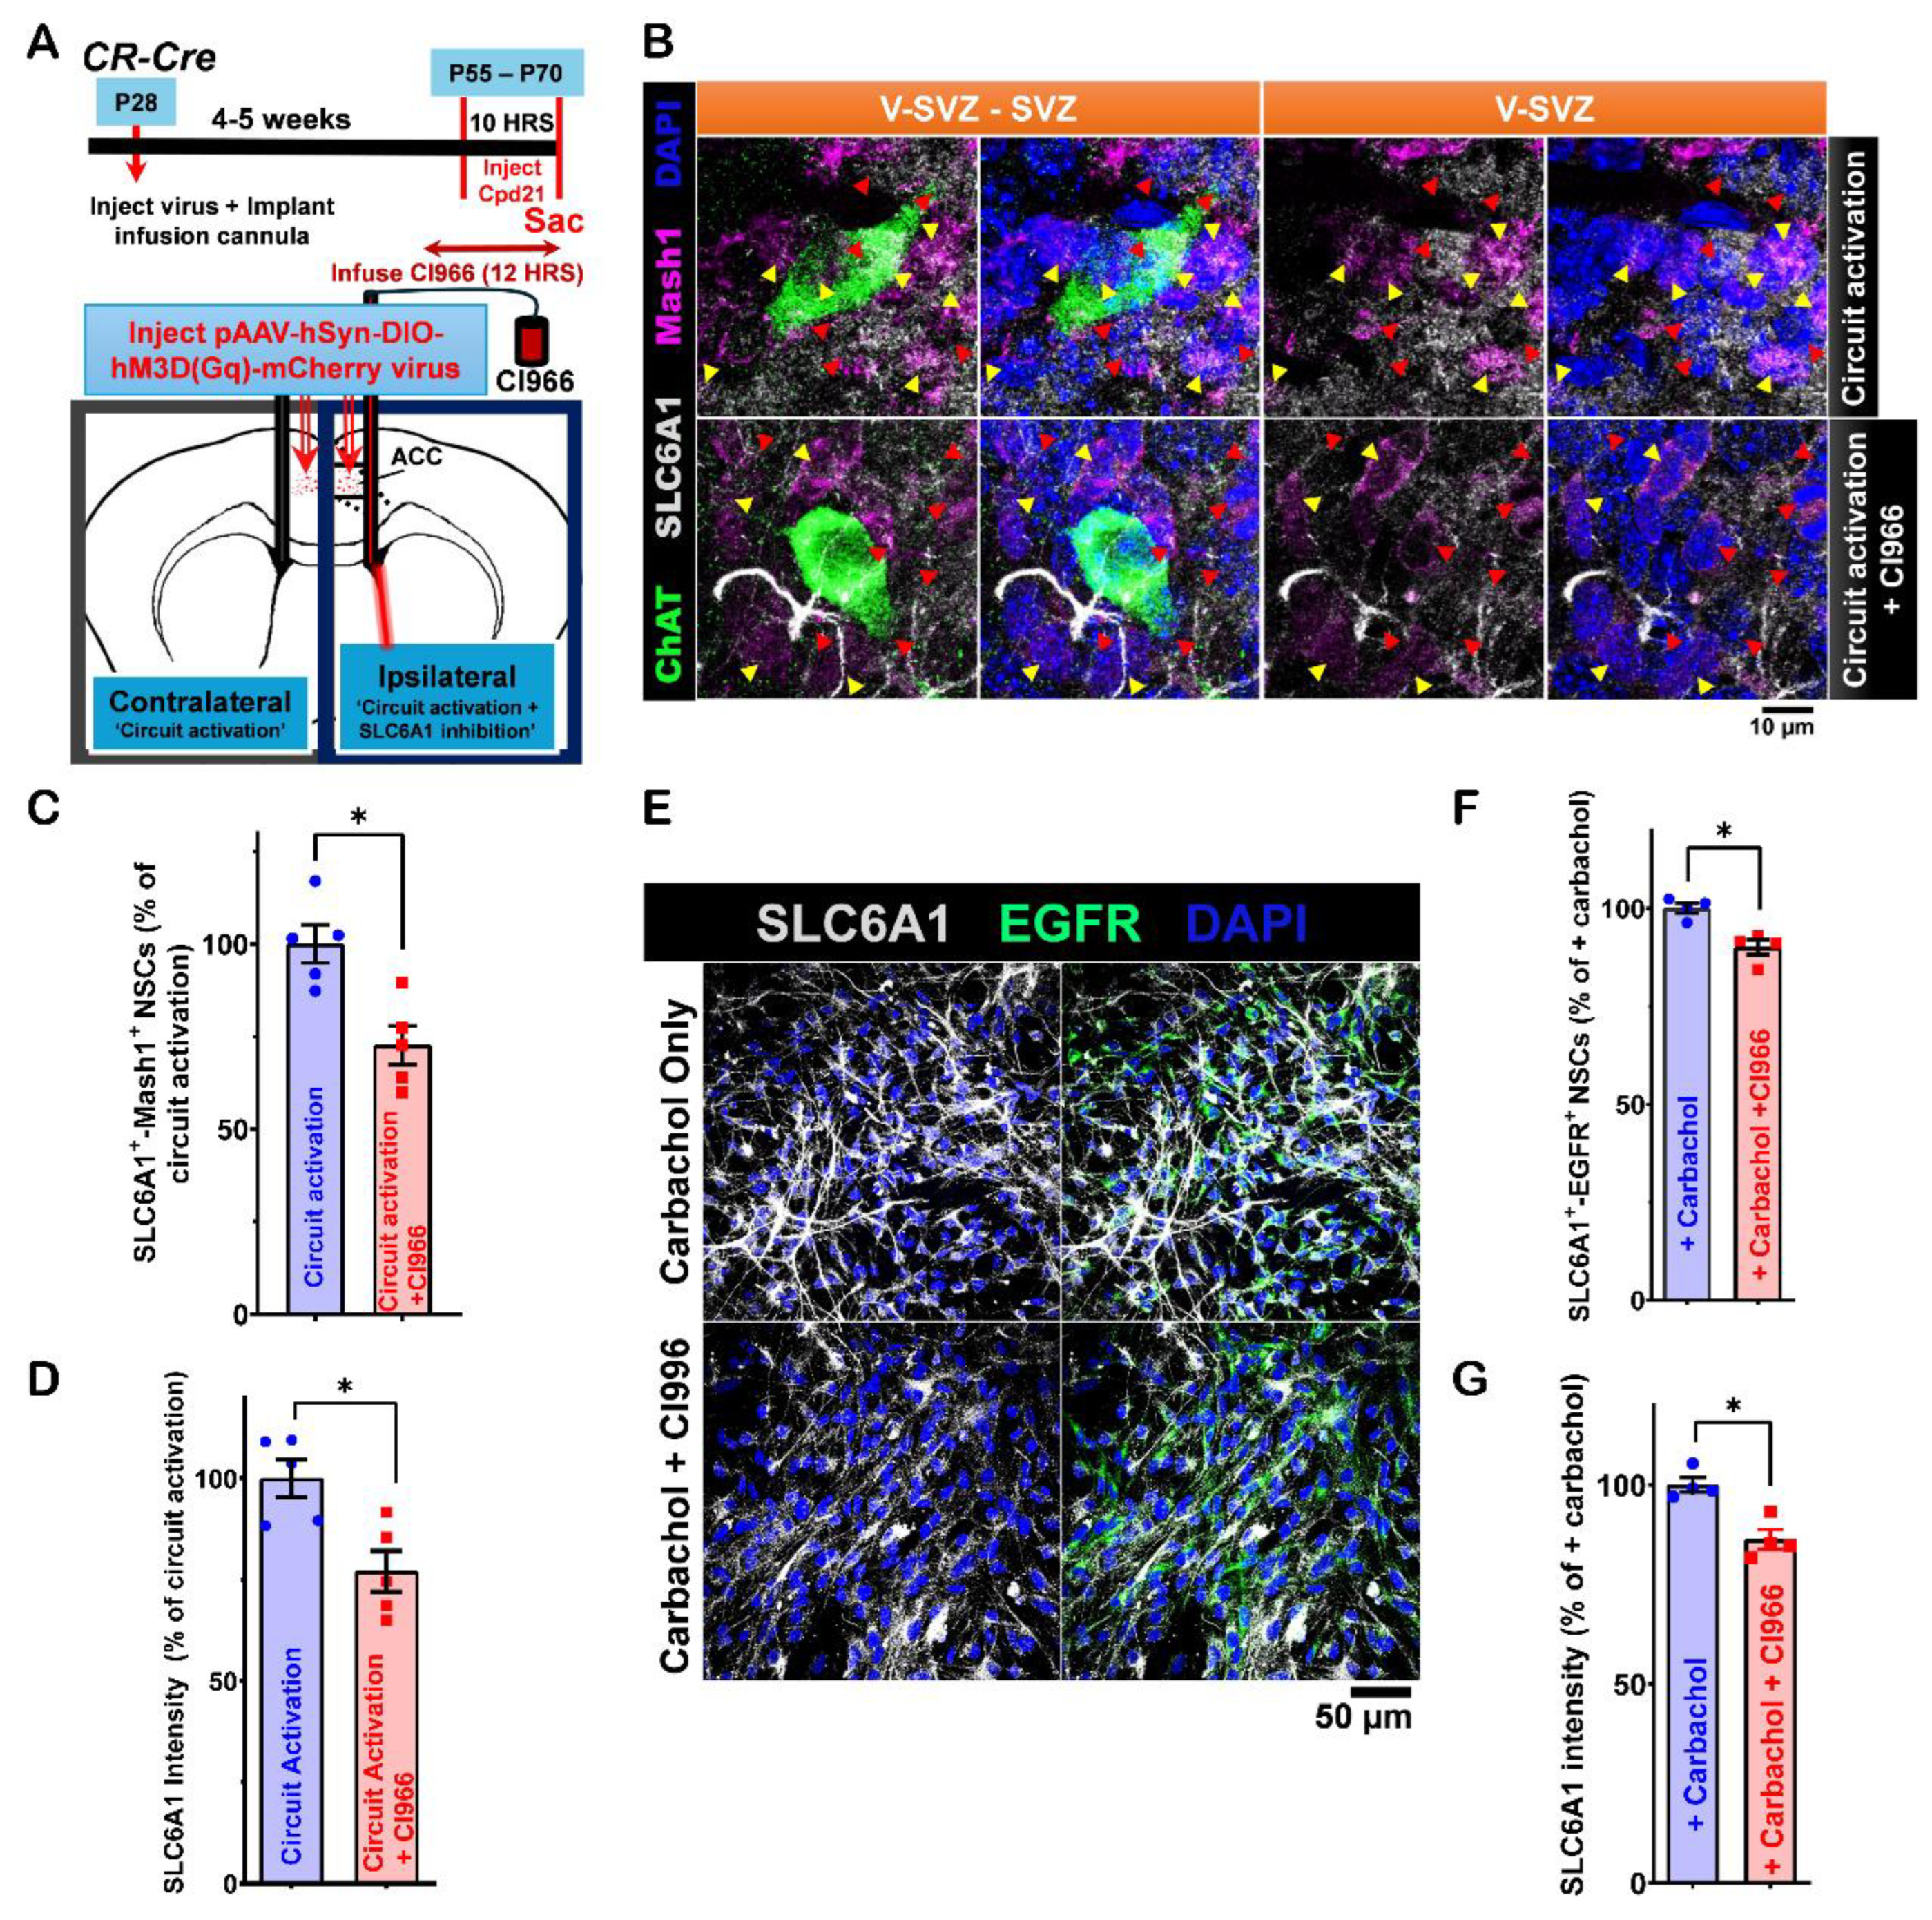
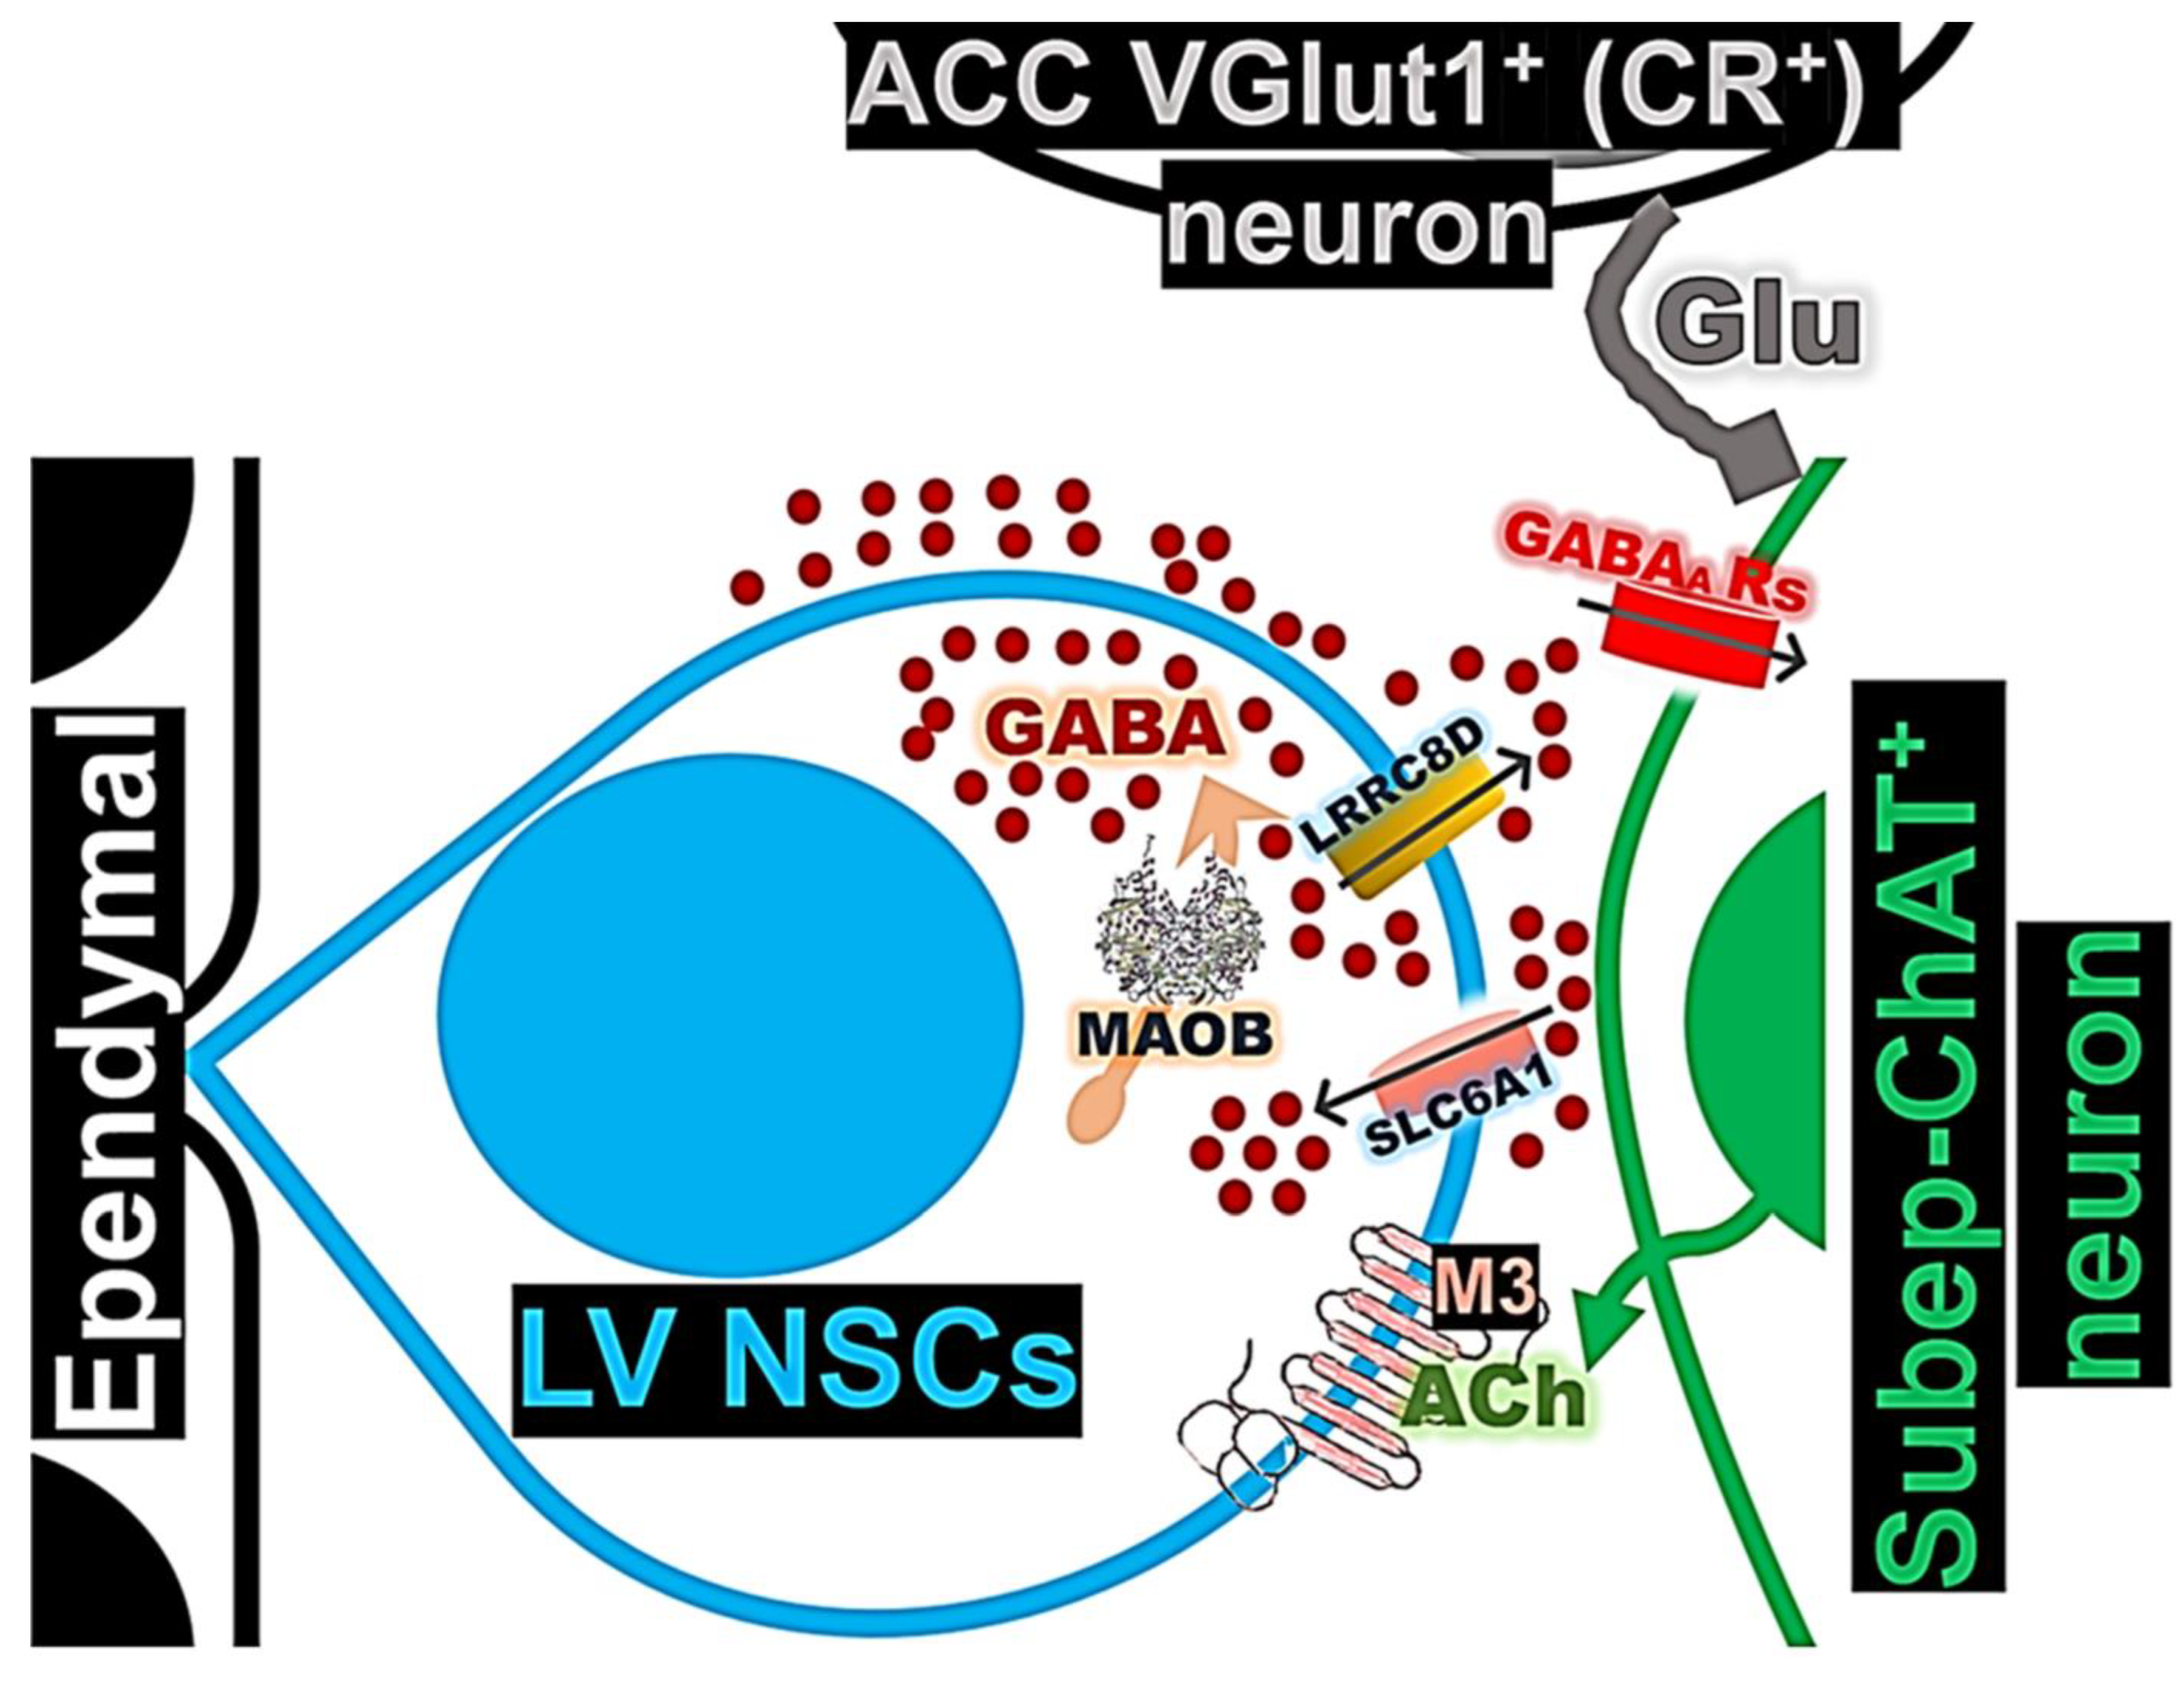
Figure 8.
A model depicts GABA signaling in the LV NSCs, highlighting their role in regulating ACC-subep-ChAT+ circuit activity and its influence on LV NSC proliferation.
Figure 8.
A model depicts GABA signaling in the LV NSCs, highlighting their role in regulating ACC-subep-ChAT+ circuit activity and its influence on LV NSC proliferation.